innovation on the shopfloor - institute for research on ... · system that drive innovation...
TRANSCRIPT
The Influence of Employment Practices on Manufacturing PerformanceIn the Semiconductor Industry
Forthcoming, Industrial Relations, Summer 2001
Melissa M. AppleyardThe Darden Graduate School of Business Administration
University of VirginiaP.O. Box 6550, Charlottesville, VA 22906-6550, USA
Tel: (804) 924-4030Fax: (804) 243-7681
e-mail: [email protected]
Clair BrownDepartment of Economics
University of California at BerkeleyCenter for Work, Technology, and Society, MC5555
Berkeley, CA 94720Tel: (510) 843-6227Fax: (510) 843-6280
e-mail: [email protected]
We are grateful to our colleagues in U.C. Berkeley's Competitive Semiconductor Manufacturing (CSM)Program for their input. In particular, we would like to thank Neil Berglund, Dave Bowen, Ben Campbell,Nile Hatch, Greg Linden, David Mowery, Greg Pinsonneault, Dan Rascher, and Linda Sattler. Threeanonymous reviewers also provided valuable suggestions. This research was supported by the Alfred P.Sloan Foundation, the Institute of Industrial Relations at U.C. Berkeley, and the Darden Foundation at theUniversity of Virginia. George Strauss was instrumental in expanding the Sloan Semiconductor Programat U.C. Berkeley to include human resources research, and we believe that this paper reflects George’svision concerning how social scientists could contribute to creating best practices in the semiconductorindustry. All errors remain the responsibility of the authors.

1
The Influence of Employment Practices on Manufacturing PerformanceIn the Semiconductor Industry
This paper analyzes the factors contributing to superior manufacturing performance in thesemiconductor industry. Through an analysis of firm-level data from the United States, Asia, and Europe,we explore the relationship between firm performance along quality and quantity dimensions and threecomponents of the employment system: skill development, employee participation in problem solving, andemployee collaboration. We find that manufacturing success is related to the introduction of newproduction technology and the involvement of all occupations in problem solving under the leadership ofengineers, who play a key (and growing) role in this high-tech industry. We find that the operators andtechnicians play a smaller role in creating high-performing semiconductor factories than has been foundin studies of more traditional factories, such as autos and steel.
Key Words: Problem solving, Teams, Employment system, Semiconductors, Human Resources
2
Through an analysis of both quantitative and qualitative firm-level data from Asia, Europe and the
United States, this paper demonstrates how semiconductor companies have structured their employment
system to solve the technically demanding problems that arise daily on the shop floor. Although the
employment system includes all aspects of the employment relationship, in this article we focus on a
subset of practices: skill development, employee participation in problem solving, and employee
collaboration. To adjust for the influence of technological change on performance, we analyze data that
span two generations of manufacturing equipment. This study asks to what extent employment practices
affect manufacturing performance in the technology-intensive semiconductor industry.
Two characteristics distinguish the semiconductor industry as a “high-tech” industry: labor costs
run less than 10% of annual manufacturing costs and expenditures on research and development
generally run more than 10% of sales. The semiconductor manufacturing environment also is quite
distinctive with strict specifications governing the manufacturing process flow. Semiconductor operations
rely on engineering talent to fine-tune production processes. Engineers guide the process of problem
solving and innovation, and they cooperate with technicians, and operators to a lesser extent, to monitor
and calibrate the equipment. The question of whether technicians and operators play a substantial role on
the shop floor in this technology-intensive industry, as has been found to be the case in less technology-
intensive industries such as automobiles and steel, has not been answered. In contrast to the findings in
studies on the automobile (MacDuffie, 1995) and steel (Ichniowski, et al., 1997) industries, our results
indicate that operators and technicians do not play a dominant role in determining manufacturing
performance in the semiconductor industry. Instead, engineers and technological change play critical
roles in this high-tech industry.
Our findings suggest that a semiconductor manufacturer’s need to solve problems quickly and
permanently requires that operators and technicians identify problems immediately and then work with
engineers to uncover root causes and implement lasting solutions. We believe that the findings from this
research have important implications for the evolution of employment practices as companies
increasingly adopt information technology (IT) and automation systems similar to those found in the
semiconductor industry.
3
This paper begins with a discussion of how the employment system affects manufacturing
performance in the semiconductor industry (Section I). In Section II we characterize the work environment
in a semiconductor fabrication facility (fab), and present specific examples of advanced problem solving
undertaken at fabs in Japan, Korea, and the United States. In Section III, using fieldwork and survey data
from twenty-three fabs, we analyze the relationship between fab performance and three major
components of the employment system—skill development, participation in problem solving by
occupation, and collaboration. Semiconductor fabs routinely provide training for their employees, and we
base our skill development variables on this company-provided training. To understand the role of each
occupation in problem solving and innovation on the shopfloor, we examine the participation of operators,
technicians and engineers in two primary problem-solving activities—equipment maintenance and
statistical process control (SPC). Because of the highly integrated production process, fabs generally
encourage collaboration both across occupations and across functions, and we examine how firms
structure group problem solving. The final section presents our conclusions.
I. The Relationship between Employment Systems and Manufacturing Performance
Past theoretical and empirical studies have developed frameworks for thinking about the interplay
between systems of HR practices and firm performance. Milgrom and Roberts (1995), Baker, Gibbons
and Murphy (1994), Holmstrom and Milgrom (1994), and Kandel and Lazear (1992) have emphasized the
importance of complementarities among the components of the work organization in affecting
organizational performance. These models reflect free-rider problems, imperfect information, agency
problems, multiple complex work tasks, and the interdependency of the component parts.
To further examine the importance of interdependencies, empirical studies of the steel and
automobile industries have linked complementary components of employments systems to performance.
A comprehensive study of steel finishing lines in the United States showed that groups of complementary
innovative work practices (incentive pay, teams, flexible job assignments, employment security, and
training) have large effects on productivity, while changes in individual work practices had little or no
effect on productivity (Ichniowski, et al., 1997). Arthur (1994) found that specific combinations of policies
and practices that created a system based on commitment (not control) predict higher productivity and
lower turnover for steel minimills. In automobile assembly plants, MacDuffie (1995) found that innovative
4
HR practices, which function as interrelated elements in an internally consistent HR system, positively
affect performance. High performance HR systems contribute most to assembly plant productivity and
quality when they are integrated with flexible production manufacturing systems.
Researchers also have used national surveys to study the relationship between HR systems and
firm performance. Huselid (1995) found that systems of high-performance work practices have an impact
on both intermediate employee outcomes (turnover and productivity or sales per employee) and short-
and long-run measures of corporate financial performance. Youndt, et al. (1996) found that the HR
system can substantially influence performance when aligned with appropriate manufacturing strategies.
They found that a human-capital-enhancement HR system was directly related to performance (employee
productivity, machine efficiency, and customer alignment) when the firm had a quality manufacturing
strategy. Other manufacturing strategies also moderated the HR-performance link. Examining the use of
technology in the manufacturing environment and its influence on the employment system, Brynjolfsson
and Hitt (1997) found that firms that use a decentralized work system have greater demand for
information technology and have greater output from their IT investment.
A few studies have looked specifically at the relationship between HR practices and qualitative and
quantitative measure of manufacturing performance in the semiconductor industry. These studies include
analyses of participative management practices and team structures. Sattler and Sohoni (1999), using
fab-level data from the Berkeley semiconductor industry program,1 found that participative management
practices have a significant positive correlation with manufacturing quality, but the positive correlation with
quantity measures was not significant. Sattler and Sohoni argue that quality (yield) problems can be
linked to specific causes, and electrical engineers can improve quality by diagnosing the problems. In
contrast, scheduling and product demand affect throughput and therefore the causes of problems
associated with output quantities cannot be traced to specific work activities. For a selected group of
employment system variables in our study, however, we found that the employment system is positively
associated with both quality and quantity measures.
Bailey (1998) examined a cognitive model of participation by comparing the productivity of
various types of teams in semiconductor fabs that use different employment practices.2 Contrary to
expectations, she found that continuous improvement teams had higher productivity measures than self-
5
directed work teams, even though the former had relatively more task and less team training, fewer
problem-solving or maintenance tasks, and lower levels of cross training than the latter.
Our study departs from the previous work in two ways. First this study incorporates all levels of
employees into the analysis. Second we examine detailed work practices and their interplay. Specifically
we study how manufacturing workers, including engineers, operators and technicians, engage in
problem-solving and training activities in order to understand empirically how the various components of
the employment system function together. This paper focuses on three important parts of the employment
system that drive innovation activities on the shopfloor:
• training for production workers that develops the skills used in their tasks (e.g., problem
solving and maintenance) and continuous education for engineers;
• the participation of the trained personnel in work activities that target efficient problem solving
and manufacturing improvements;
• collaboration that facilitates interaction and sharing of knowledge across all job categories.
We expected that world-class manufacturing performance in the semiconductor industry would depend on
these three components—training and skill development, participation in problem solving, and
collaboration.
II. Work and Technology in Semiconductor Fabs
Before turning to the methodology and findings of this study, we highlight the characteristics of
work and technology in the semiconductor industry. The success of a semiconductor process flow
depends critically on engineering talent—both of the design, development, and integration engineers who
craft the production process and of the manufacturing engineers who run the process in a high-volume
setting. Engineering expertise guides the complex problem-solving activities during the introduction of a
new process as well as continuous improvement projects for mature processes. Because of the technical
complexity associated with circuit design and the integration of process steps, operators and technicians
are constrained in their ability to solve technical problems without extensive training in engineering and
science.
Consequently, operators and technicians have limited involvement in new process development,
but they participate in solving both one-time and recurring problems with installed manufacturing

6
processes usually by operating in teams with engineers. Rapid and effective problem solving is a critical
activity for short-run competitiveness in the semiconductor industry where companies compete fiercely
not only on the basis of price but also quality, e.g., reliability of the semiconductor device. While most
pronounced in the engineering ranks, the challenge of encouraging creativity in problem solving while
maintaining control over the production process extends through all levels of the organization. Because of
the demanding technical requirements of semiconductor process flows, maintaining control over the
production flow receives considerable attention.
As in many manufacturing settings, precise specifications govern each process step and process
steps are grouped together into production modules. Unlike other production settings, however, the
allowable margin for error is extremely narrow. The circuitry on leading-edge semiconductor devices
cannot be seen with the naked eye. For example, process recipes contain processing rules calibrated in
nanometers (10-9 of a meter), so even a slight deviation from an equipment setting can ruin a whole
production lot. Furthermore, the semiconductor process flow does not proceed linearly. The wafers of
silicon upon which the circuitry is deposited loop through the factory making repeated trips through the
primary production modules. Managing these production loops demands sophisticated integration skills
during new process development to guarantee that later loops do not compromise the functional integrity
of the earlier layers of circuitry.3 Once in manufacturing, this complicated looping process requires
sophisticated scheduling systems.
The industry’s migration to new generations of manufacturing technology has influenced the scope
of responsibilities assumed by the three job categories. For example, when companies install equipment
that processes silicon wafers of a larger diameter in order to increase the number of semiconductor
devices per wafer, a number of the work activities become automated. In the transition from silicon wafers
measuring 6” in diameter to 8” wafers, work activities such as the movement of wafer lots between
process steps, data collection, data analysis (e.g., statistical process control), scheduling, and the entry of
production recipes into the equipment have been increasingly automated.4 As discussed below, our
sample of fabs comprises both 6” and 8” fabs, permitting us to take into account technological change.
The proliferation of computer-based production systems in the fab has changed the work activities
for each occupation. As computer systems have became more self-contained in terms of collecting and
7
analyzing data and then acting upon the information, the role of operators in statistical process control
has diminished. Similarly, operators now play a passive role in scheduling, replaced by systems that
adjust in real-time by incorporating more data than readily available to the operators—for example, from
customers or in-line manufacturing monitoring devices. In the 8” fabs, operators oversee the automated
information technology and control systems as well as monitor the equipment to make sure everything is
functioning properly.
The migration to 8” fabs has also modified the roles of technicians and engineers. The skills and
knowledge required of technicians to maintain the 8” equipment are similar to what is required for 6”
equipment maintenance, with the addition of more automated features and computer integration as
discussed above. In addition to performing scheduled maintenance activities, technicians often assist
engineers with tool installation, cleans, and troubleshooting. The need for engineering input, especially
regarding software, into the fabrication process has risen with the increased use of automation. Engineers
develop, implement, and monitor the automated manufacturing and IT systems, and this requires the
skills of software engineers as well as process and equipment engineers. In addition, the engineers have
more data readily available to them for SPC activities. In 8” fabs, it appears that the role of the engineer
has become increasingly central in the smooth running of the fab and in problem solving and innovation
activities, while much of the support role of the operators has been taken over by the computerized
systems.
Examples of Problem Solving.
To capture the nature of advanced problem solving and innovation on the shopfloor, we present
examples from Japan, Korea, and the United States. Teams of engineers and experienced technicians
shoulder much of the responsibility for advanced problem solving with only marginal input from operators,
whose main contribution may be monitoring the process, collecting data, and running basic statistical
analyses. While conducting our field research, we also observed lower-level problem solving by operators
and technicians addressing issues directly related to their jobs, such as routine maintenance for
technicians and material-handling and machine operation for operators. These activities were especially
useful in reducing equipment maintenance time, operator mistakes, and bottlenecks.
8
Example from Japan: In one company, the equipment maintenance department expects its
personnel to reach specific kaizen (improvement) goals, which tend to be “last year’s result plus alpha.”
The example here is from the department’s photolithography (photo) group, which set the goal of
improving the up-time on their machines from 93.5%, achieved the previous year, to 95%. Their
machines, called steppers, project the patterns for the circuitry onto the silicon wafers.5 To reach their
department’s improvement goal, teams in the photo equipment area identified and solved a number of
problems. One of the teams was composed of a senior engineer from the equipment maintenance
department and two maintenance technicians. The maintenance technicians at this fab are required to
have degrees from a technical high school.
This photo team analyzed the source of defects in the photo area and identified a primary cause.
They determined that defects were caused by faulty nozzles used to apply a developer solution onto the
exposed wafers.6 While the standard developer nozzles generally spray a uniform distribution of the
developer solution over the wafer surface, in this case, defect-causing bubbles formed. The group altered
the configuration of the developer nozzles, allowing them to reduce the force and aeration of the spray.
This modification eliminated the presence of bubbles and allowed for a 30% reduction in the consumption
of developer. The team constructed and implemented the modification independently from the equipment
supplier and believed that this modification distinguished their fab’s manufacturing performance from
other fabs using the same equipment. When asked if they showed this modification to the equipment
maker, the engineer group leader replied, “Hell no!,” as they wished to prevent the spread of this defect-
improving to their competitors via the supplier.
Example from South Korea: A Korean company in our sample conducts in-line monitoring of
machines and process parameters and closely monitors yields at the end of the production line. Statistical
analysis correlating yield losses with individual machines revealed a problem in the etch equipment area.
The etch machines, which remove unwanted material from the wafer’s surface, were found to be
underetching.7 For a previous production process, these machines had been used to perform a deep etch
(a trench etch) that resulted in hardware damage. Although long etches like the trench etch had been
discontinued, the machines had poor “endpoint detection,” i.e., the etch stops prematurely, and this led to
the underetching problem.

9
Two etch engineers formed the “yield improvement team” to analyze the etchers and collected
data from across production modules. On a weekly basis, they combined data from the Poly Etch
engineer, the Oxide Etch engineer, and one of the Metal Etch engineers to track the trend. Their short-
term solution was to add an inspection operation that measured the remaining oxide after etch. They
discussed the problem with the equipment vendor, who added a special operating instruction to the on-
line manufacturing execution system, but this did not help and the vendor gave up. As in the previous
example, the engineers were left to devise their own solution without assistance from the equipment
vendor. For the long term, they embarked on a new recipe involving a fixed-time etch to replace the end-
point based etch. They estimated that it would take about one month to finish the new recipe.
Example from the United States: At one U.S. fab, yield improvement procedures are split into three
cases: (1) reacting to a yield crises in which there are many wafers with low yields, indicating a major
equipment or process problem, (2) reacting to more than 5 wafers per production lot with substandard
yields, and (3) reacting to a yield deviation by a few wafers per lot or by an individual lot.
In case (1), when the device engineer who monitors yields observes that a crisis has occurred, he
or she instructs the operators to put all lots on hold. This will trigger the formation of a cross-functional
team that spans work areas and a meeting to discuss the crisis will be called. At the meeting, the device
engineer will report his/her findings, and the team will discuss potential root causes. Experiments and/or
lab analysis may be performed to prove identification of root cause. A containment plan will be devised
and implemented. The team will meet twice per day until the root cause is found.
One example of this procedure involved two steppers that were not fully printing. It turned out in
one of the steppers, the lamp intensity had fallen too low, and in the other, there was too much lens drift.
Both problems led to insufficient exposure. The device engineer figured it out by analyzing the run cards
to see the equipment commonalties. The crisis team changed the exposure energy to solve the problem.
It took about 10-11 days to solve this problem.
These examples demonstrate the integral role of engineers and experienced technicians in solving
problems on the shop floor. They also highlight the important relationship between equipment
performance and the integrity of the semiconductor production process. In the next section we broaden
10
the analysis to analyze how primary components of the employment system relate to fab-wide
performance measures.
III. Methodology and Data
The nature of semiconductor manufacturing with its reliance on engineering skills and increasing
automation provides a context in which to examine the influence of the employment system in a
technology-intensive industry. We analyze three primary facets of the employment system (training and
skill development, participation in problem-solving, and employee collaboration) to develop the
relationship between employment system and manufacturing performance. For all occupations, training is
a necessary but not sufficient condition for effective shopfloor problem solving and innovation. The
employment system distributes work activities (e.g., equipment maintenance and statistical process
control) across job categories to ensure constant attention to monitoring the production line and
troubleshooting problems. The highly integrated production process requires communication both across
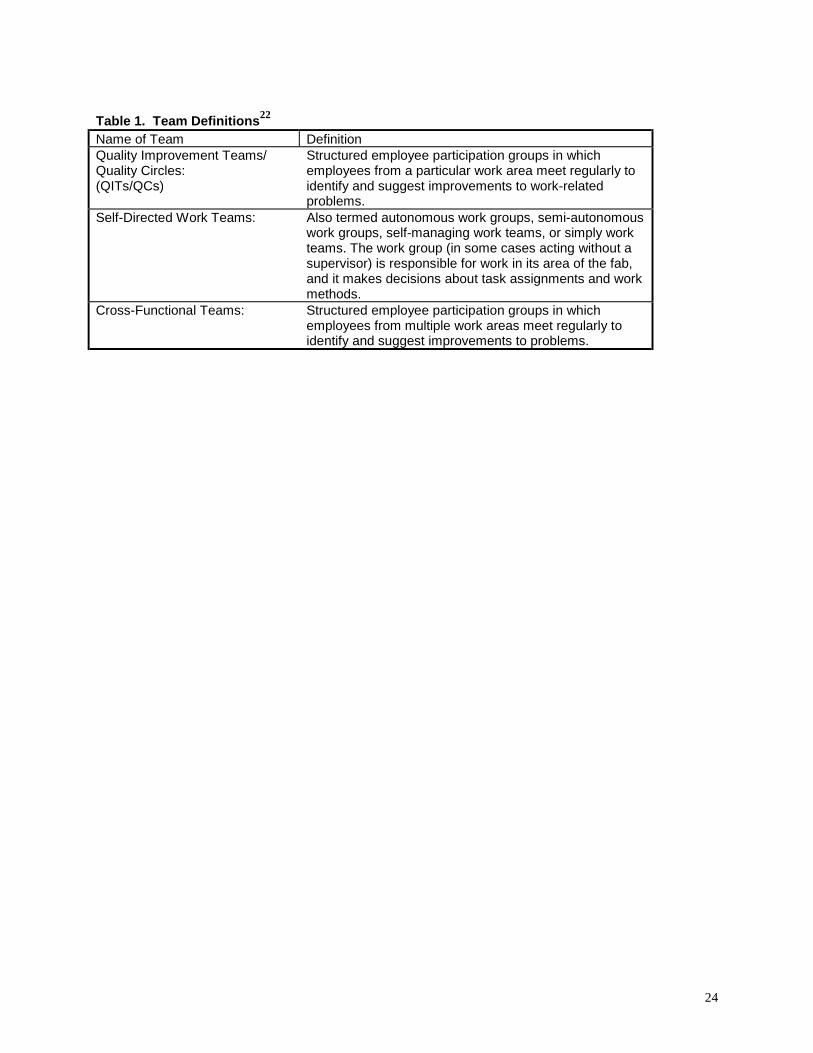
and within production modules, so fabs typically encourage a variety of team configurations. This study
considers the influence of three types of teams—Quality-Improvement Teams/Quality Circles, Self-
Directed Work Teams, and Cross-Functional Teams—on manufacturing performance (see Table 1).
Because teams can function in a variety of ways, the existence of teams is not sufficient to ensure that
they facilitate innovation. The composition of the teams and how they operate affect the sharing of
information and the interaction within job categories, across job categories, and across functional areas of
the fab.
Our data consist of fieldwork and survey data collected at semiconductor fabrication facilities
(fabs) between June 1993 through December 1994 and between December 1996 and December 1997 as
part of the Competitive Semiconductor Manufacturing program at U.C. Berkeley.8 We collected data from
sixteen fabs producing 6" wafers during the first period and from seven fabs producing 8" wafers during
the second period (see Table 2).9 We assign location of fabs based on their geographic location and not
their corporate headquarters. Teams of roughly eight researchers, including both economists and
engineers, visited each fab for two days and conducted extensive interviews with managers, engineers,
technicians, and operators as well as observed the manufacturing process. The site visits followed the
receipt of a detailed written survey of over two hundred pages completed by the fab management. The

11
bulk of the data collected on the employment system variables and manufacturing performance variables
came from the written survey. The site visits permitted verification of the data collected through the written
survey.
Below we examine training across occupations and the relationship between training and job
tasks. We then consider the integration of problem-solving activities into the job tasks of operators,
technicians, and engineers. In particular, we analyze the degree of involvement of the three occupations
in equipment maintenance and statistical process control (SPC). Finally we consider the nature of
collaboration on the shopfloor through teamwork.
Training and Skill Development. In this section, we consider how semiconductor companies develop the
skills required by both front line workers and engineers. The semiconductor industry provides high level of
training across all occupations (see Table 3). To remain competitive in the industry, semiconductor
companies routinely introduce new generations of their production processes, modify their production
equipment, and upgrade their automation and information systems. Manufacturing facilities rely on
training to assist workers with problem solving in this changing environment. Workers receive three to four
weeks of initial training on average. In our sample fabs during the first three years of work, operators
receive nearly eleven weeks of training per year on average, engineers receive roughly eleven weeks,
and technicians receive nearly 13 weeks of training per year.
Across the twenty-three fabs in our sample, we find that less training is done in the 8" fabs than in
the 6" fabs. The number of days spent in initial training declined substantially for technicians and slightly
for operators, and rose slightly for engineers. Training during the first three years declined across all three
occupations in 8" fabs compared to 6" fabs. The fall in technician training may be attributable to greater
educational attainment by applicants to the technician positions or greater reliance on vendor support by
fabs.
Compared to operators in traditional manufacturing jobs, the operators in the 6" wafer fabrication
plants oversee a highly technical process and often undertake relatively complex technical tasks.
Operators are involved in fairly high skilled procedures, including various types of SPC and equipment
maintenance activities. Many of the skilled job tasks of operators in the 6" fabs have been computerized
in the 8" fabs. In both types of fabs, most operators are involved in data collection and monitoring, but
12
operator involvement declines as the difficulty of the task increases. Fabs generally limit operator
involvement in problem solving to identifying the nature of the problem and notifying technicians or
engineers. In a few fabs, operators are involved in performing some routine maintenance. Overall,
operators perform tasks that require training and skill development. However, operators are limited in their
skill development and career growth, as well as wage growth, unless they become technicians, and this
has become even more pronounced in the 8" fabs.10
In both 6" and 8" fabs, technicians have attended a technical high school or a two-year technical
college, while the majority of engineers hold an undergraduate BS degree in engineering or science.
Operators are usually women with high school degrees and without any college. Vendor training on new
equipment is a critical part of technician training, and vendor engineers and technicians usually provide
on-site support when a new machine is installed and may service the equipment periodically. Technicians
working in the newer 8” fabs execute similar job tasks as in 6” fabs but face even more stringent
equipment calibration requirements to ensure processing uniformity across the larger wafers. Automation
systems in 8” fabs both in terms of material handling and in-line data collection add complexity to the
technician’s job when repairing equipment or optimizing the interfaces between production tools. The
work of engineers increases in complexity in 8" fabs compared to 6" fabs, as the engineers integrate the
data collection, production, and automation systems.
Overall the introduction of new production technologies increases skill demands on engineers,
reduces skill demands on operators, and demands similar skills from technicians although may require
greater assistance from vendor personnel.
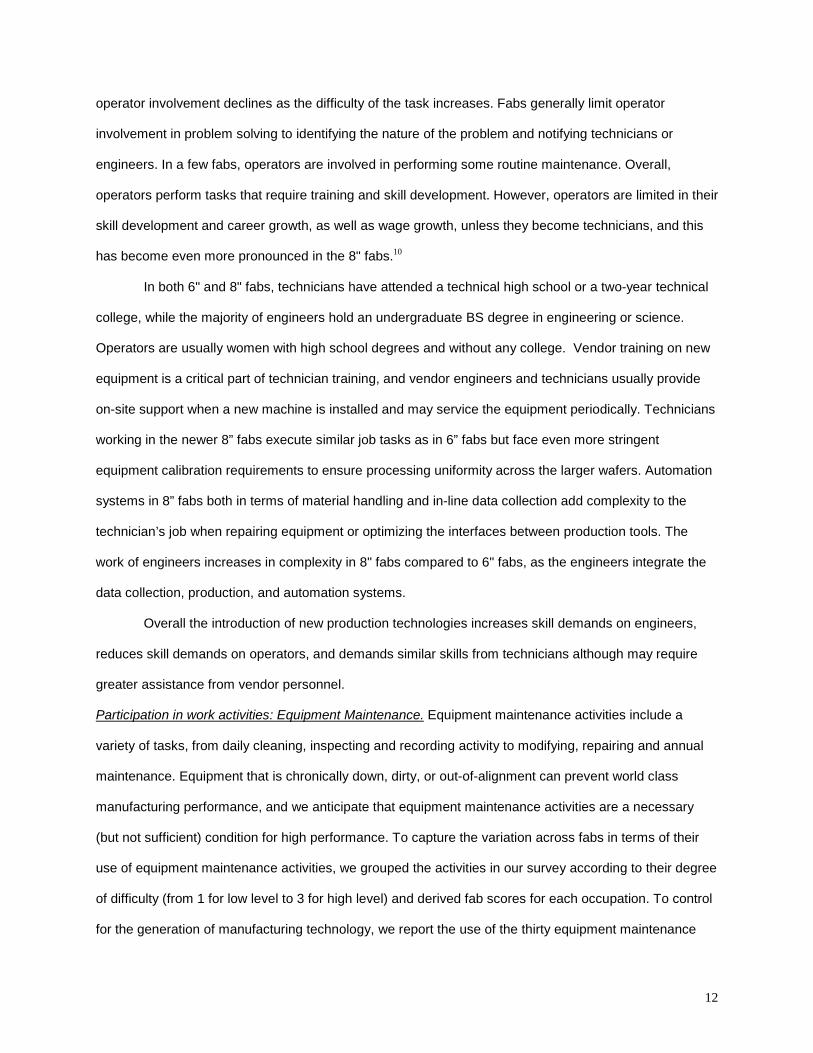
Participation in work activities: Equipment Maintenance. Equipment maintenance activities include a
variety of tasks, from daily cleaning, inspecting and recording activity to modifying, repairing and annual
maintenance. Equipment that is chronically down, dirty, or out-of-alignment can prevent world class
manufacturing performance, and we anticipate that equipment maintenance activities are a necessary
(but not sufficient) condition for high performance. To capture the variation across fabs in terms of their
use of equipment maintenance activities, we grouped the activities in our survey according to their degree
of difficulty (from 1 for low level to 3 for high level) and derived fab scores for each occupation. To control
for the generation of manufacturing technology, we report the use of the thirty equipment maintenance
13
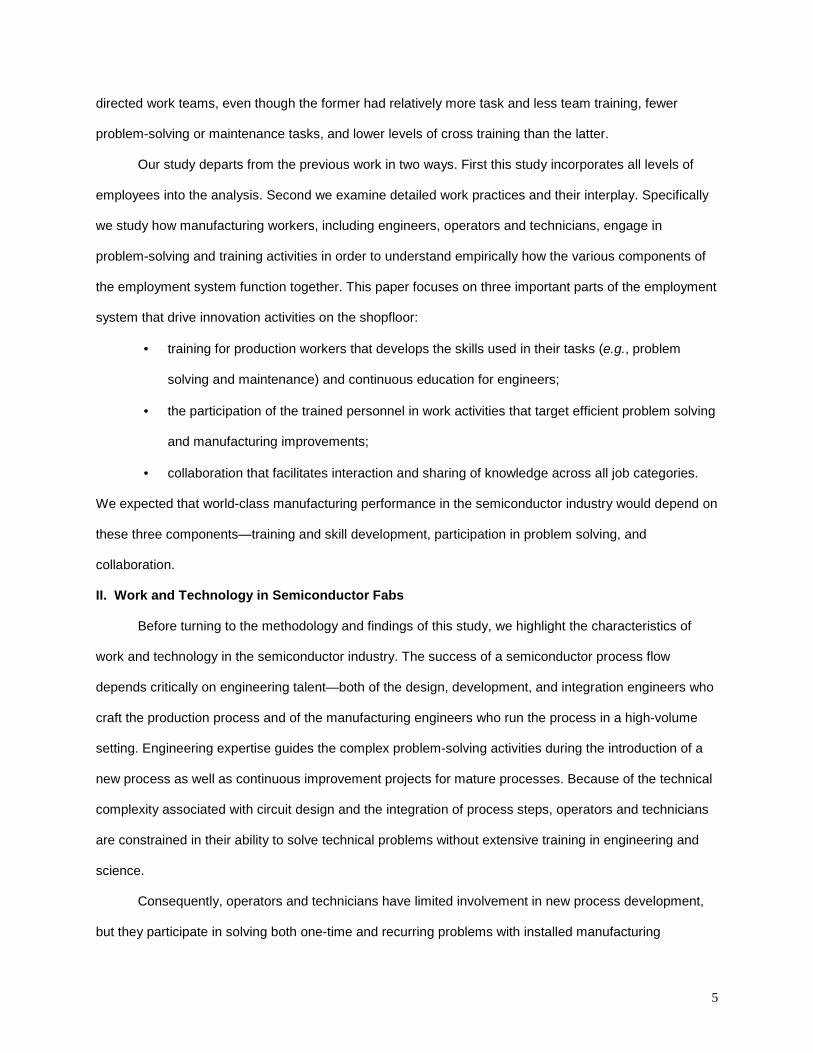
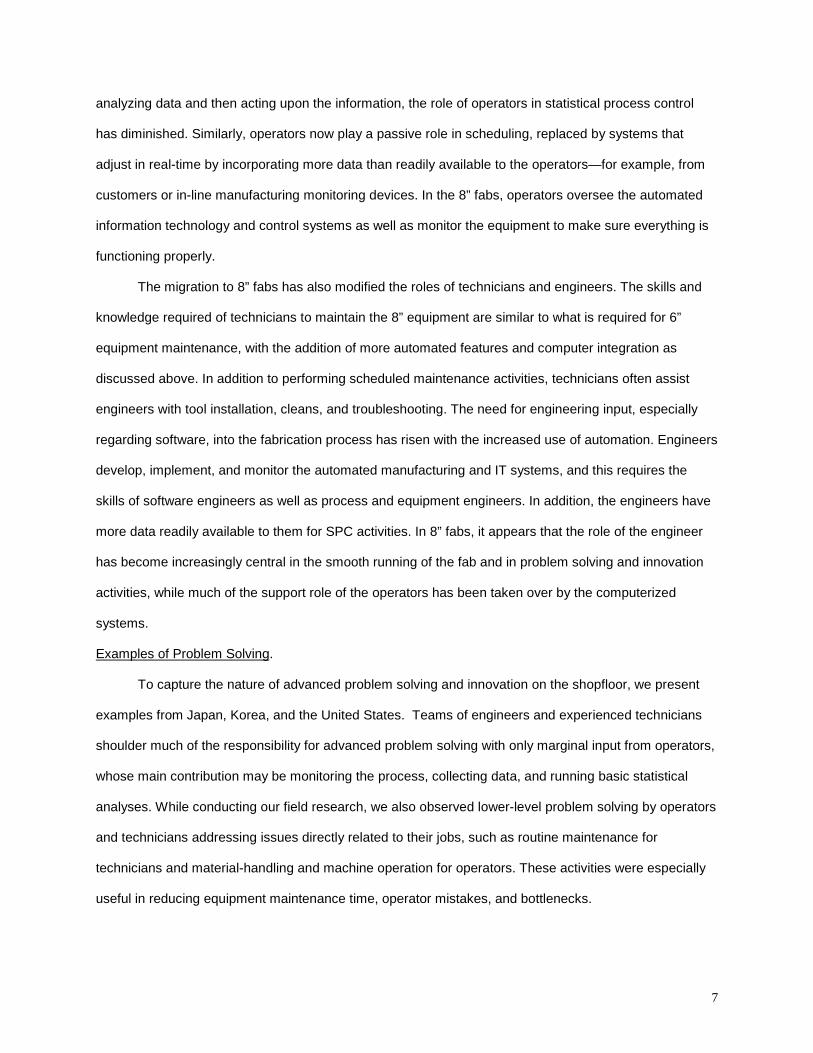
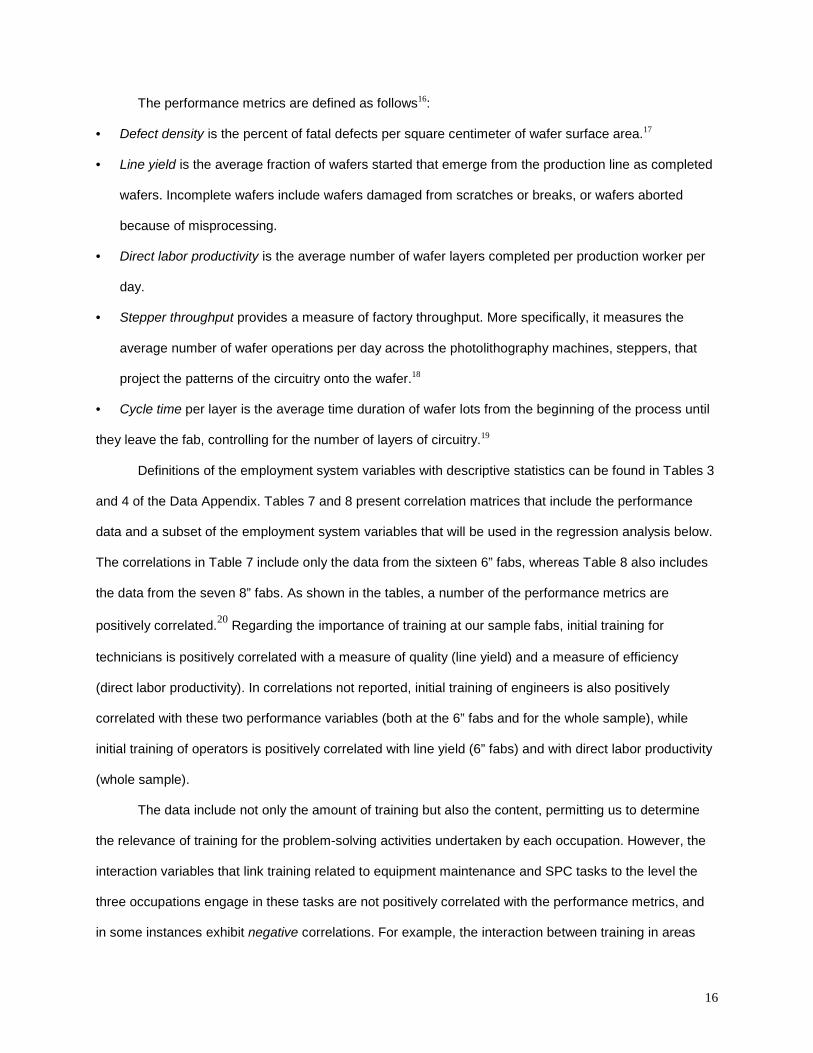
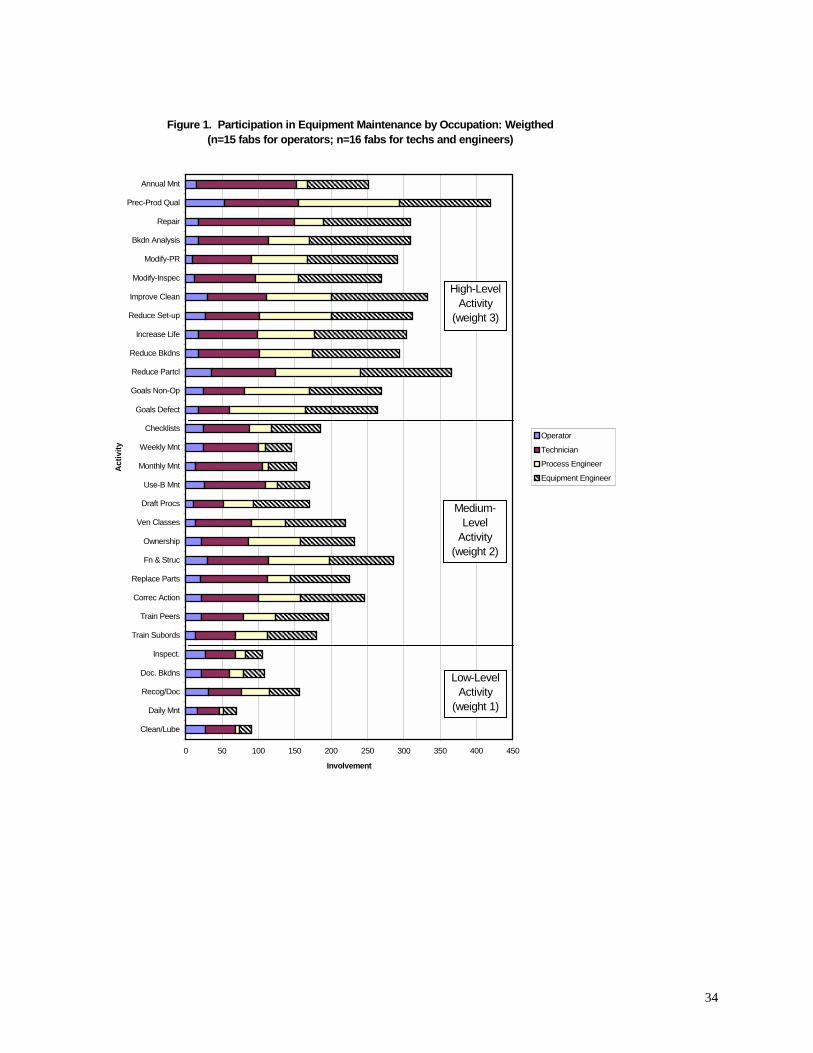
activities across the three occupations for the 6” fabs only (see Figure 1).11 Moving from examining the
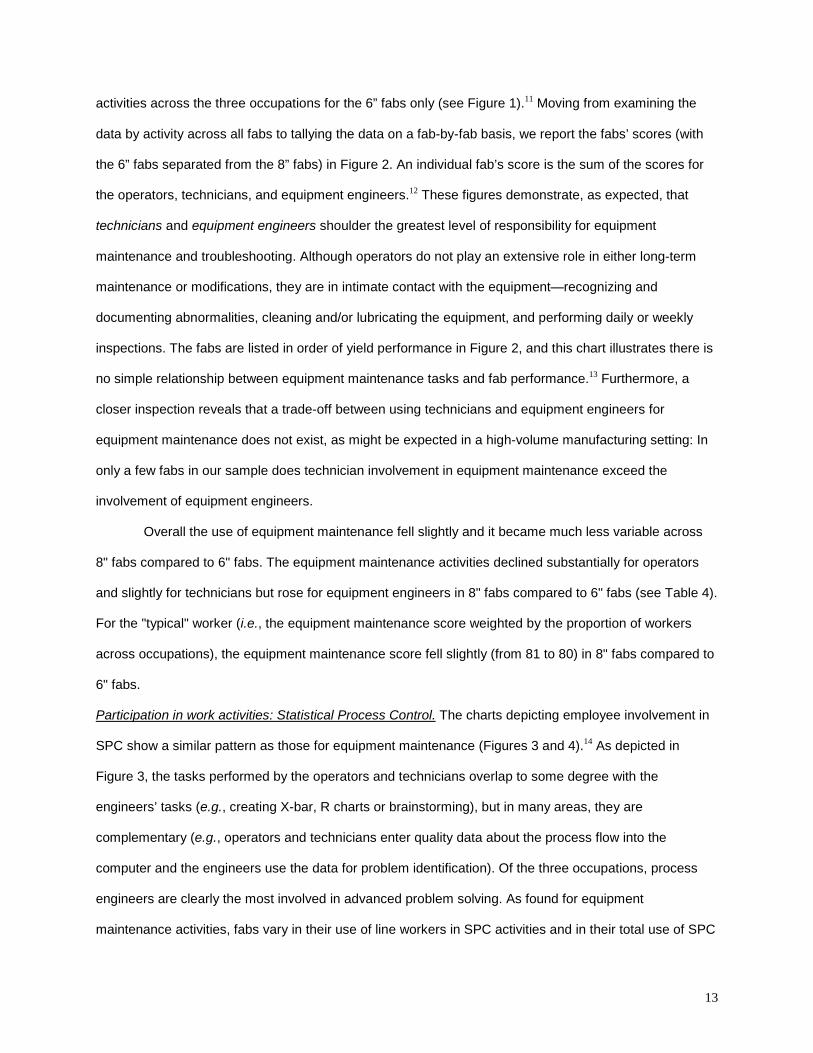
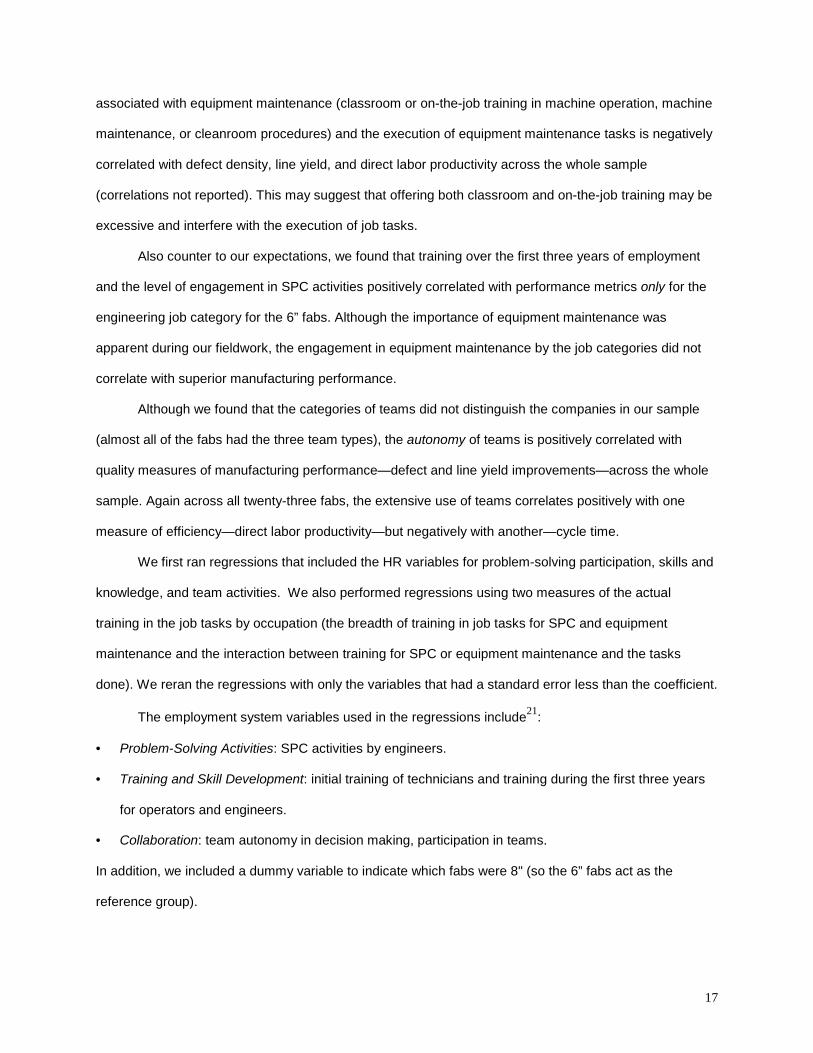
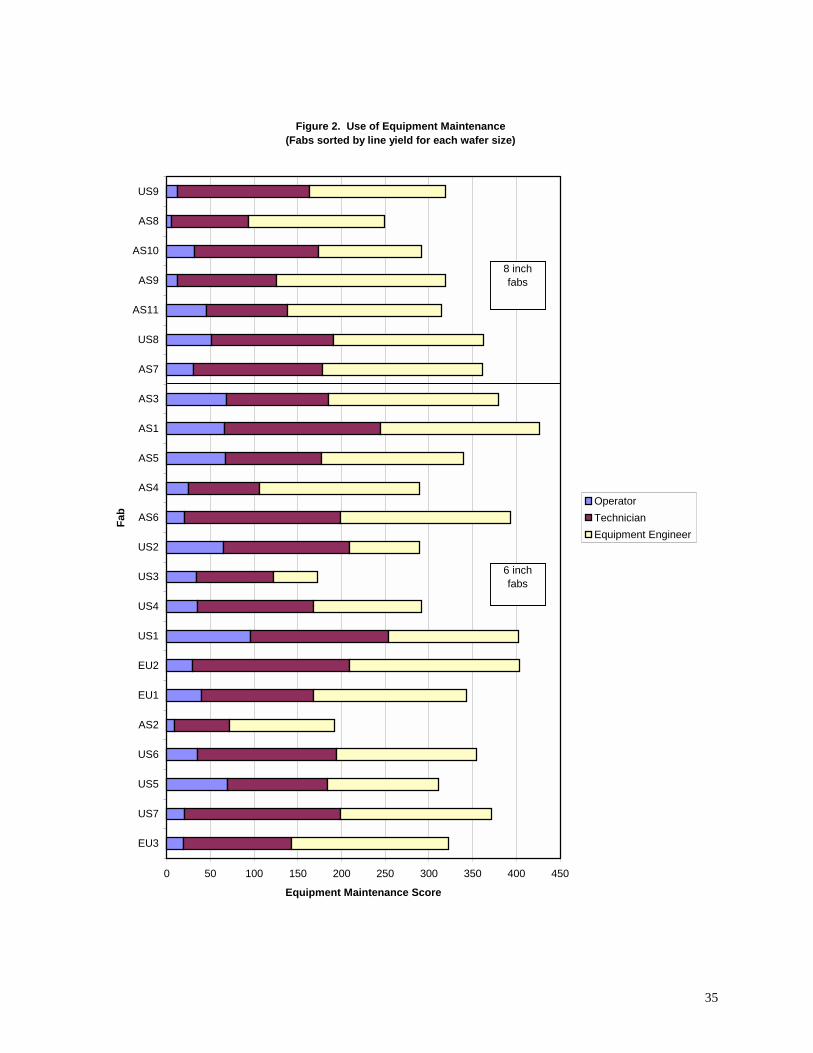
data by activity across all fabs to tallying the data on a fab-by-fab basis, we report the fabs’ scores (with
the 6” fabs separated from the 8” fabs) in Figure 2. An individual fab’s score is the sum of the scores for
the operators, technicians, and equipment engineers.12 These figures demonstrate, as expected, that
technicians and equipment engineers shoulder the greatest level of responsibility for equipment
maintenance and troubleshooting. Although operators do not play an extensive role in either long-term
maintenance or modifications, they are in intimate contact with the equipment—recognizing and
documenting abnormalities, cleaning and/or lubricating the equipment, and performing daily or weekly
inspections. The fabs are listed in order of yield performance in Figure 2, and this chart illustrates there is
no simple relationship between equipment maintenance tasks and fab performance.13 Furthermore, a
closer inspection reveals that a trade-off between using technicians and equipment engineers for
equipment maintenance does not exist, as might be expected in a high-volume manufacturing setting: In
only a few fabs in our sample does technician involvement in equipment maintenance exceed the
involvement of equipment engineers.
Overall the use of equipment maintenance fell slightly and it became much less variable across
8" fabs compared to 6" fabs. The equipment maintenance activities declined substantially for operators
and slightly for technicians but rose for equipment engineers in 8" fabs compared to 6" fabs (see Table 4).
For the "typical" worker (i.e., the equipment maintenance score weighted by the proportion of workers
across occupations), the equipment maintenance score fell slightly (from 81 to 80) in 8" fabs compared to
6" fabs.
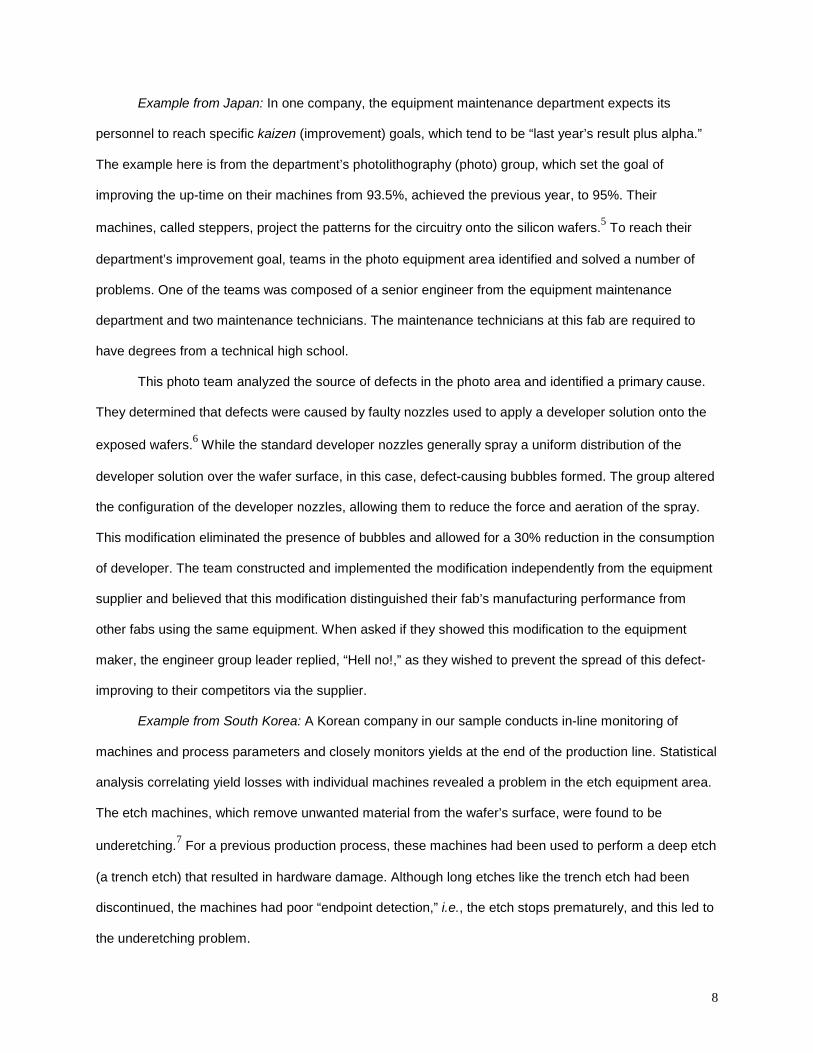
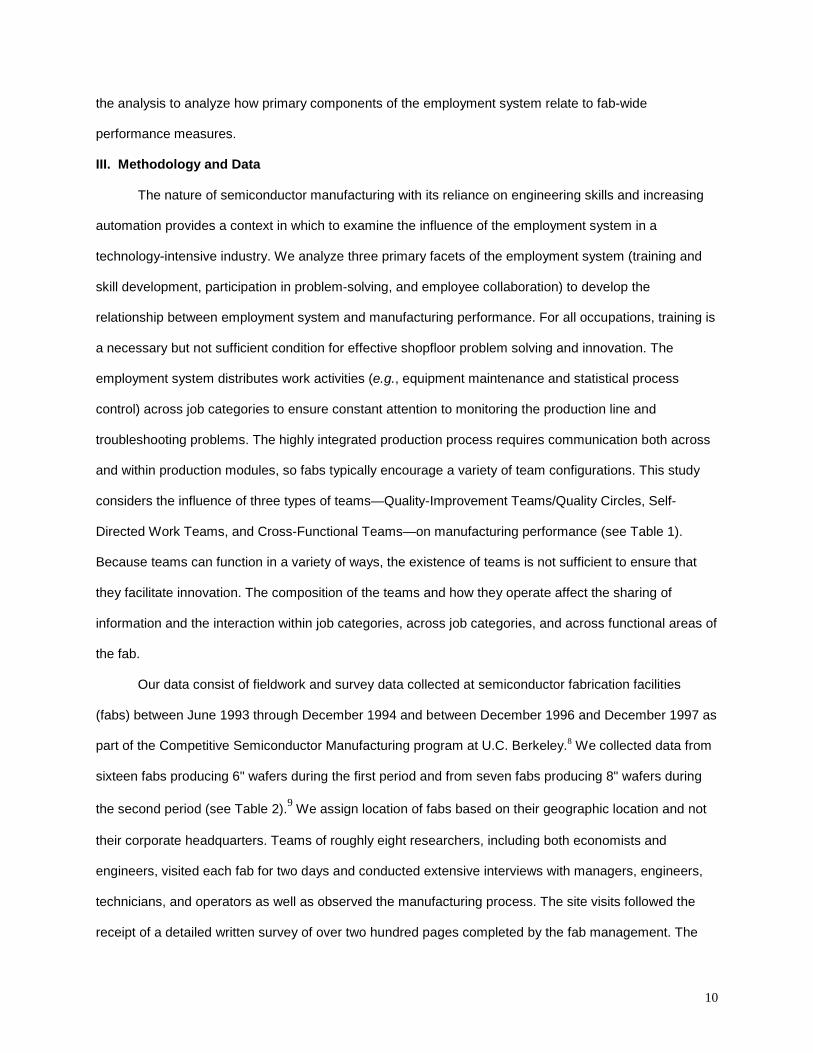
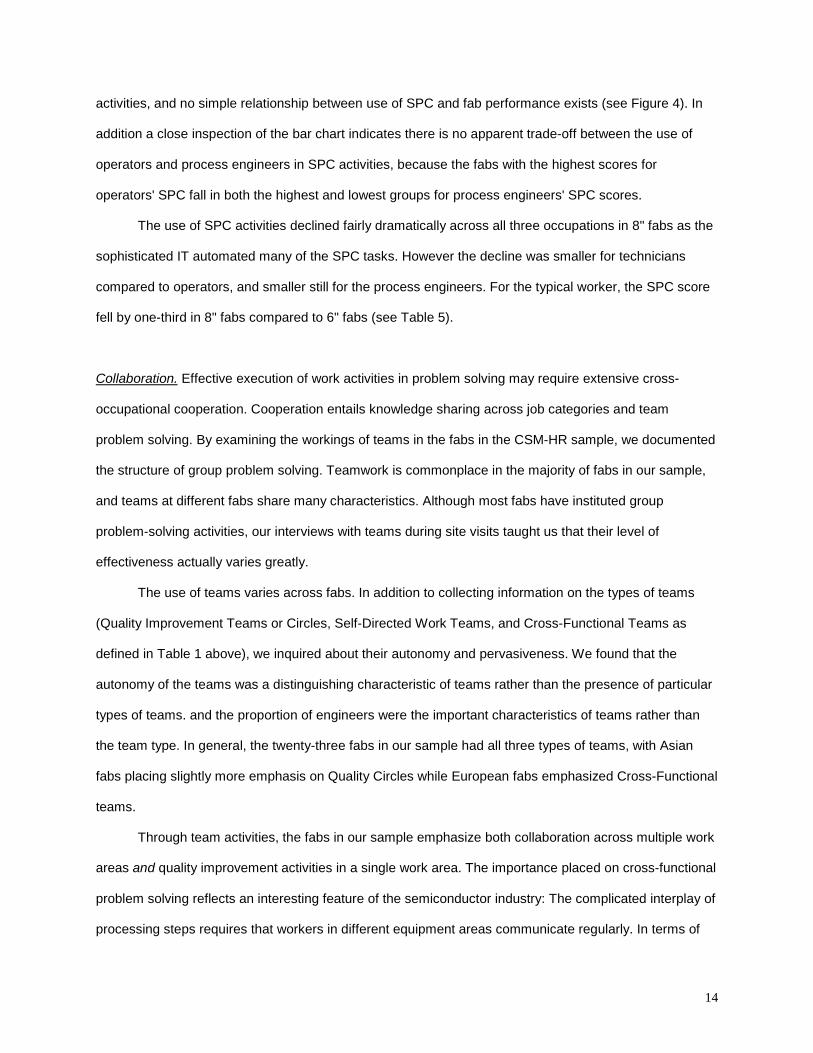
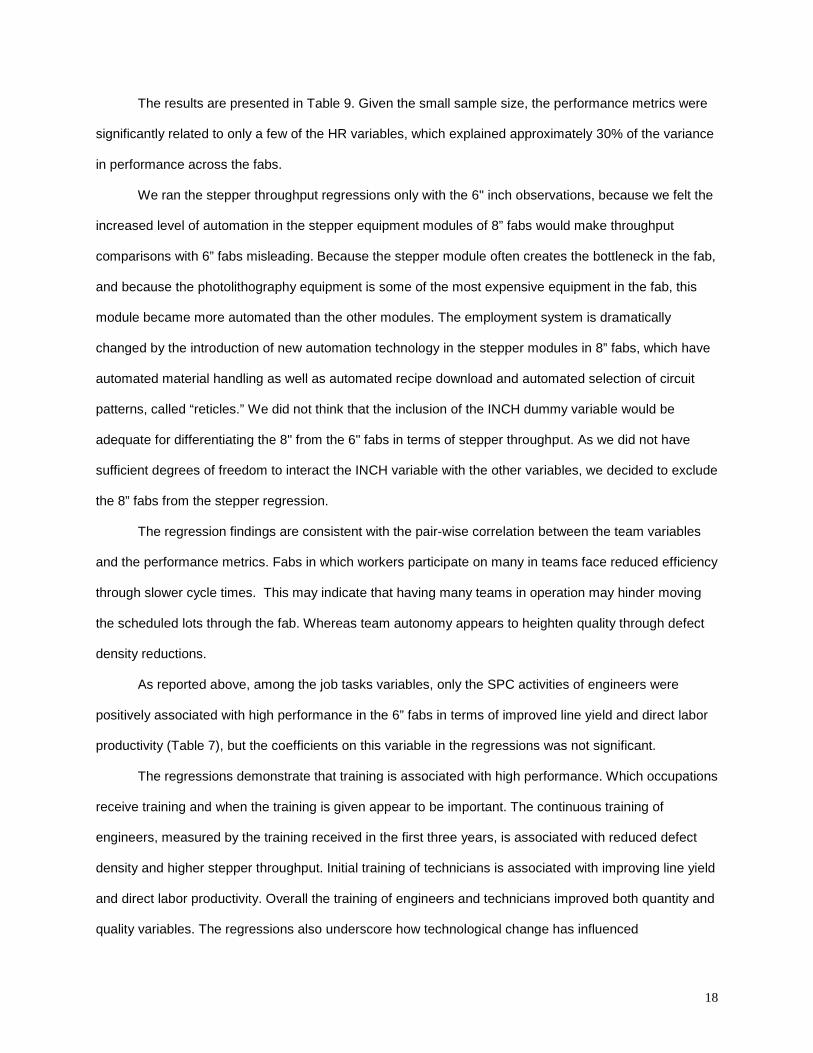
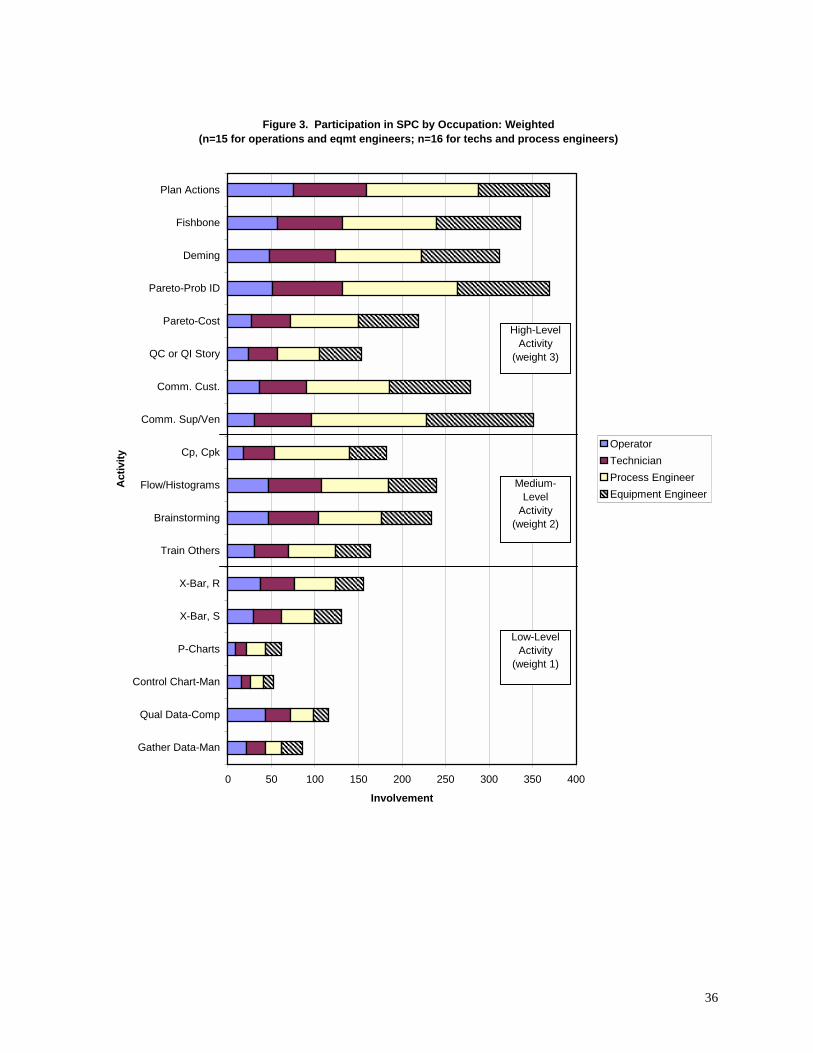
Participation in work activities: Statistical Process Control. The charts depicting employee involvement in
SPC show a similar pattern as those for equipment maintenance (Figures 3 and 4).14 As depicted in
Figure 3, the tasks performed by the operators and technicians overlap to some degree with the
engineers’ tasks (e.g., creating X-bar, R charts or brainstorming), but in many areas, they are
complementary (e.g., operators and technicians enter quality data about the process flow into the
computer and the engineers use the data for problem identification). Of the three occupations, process
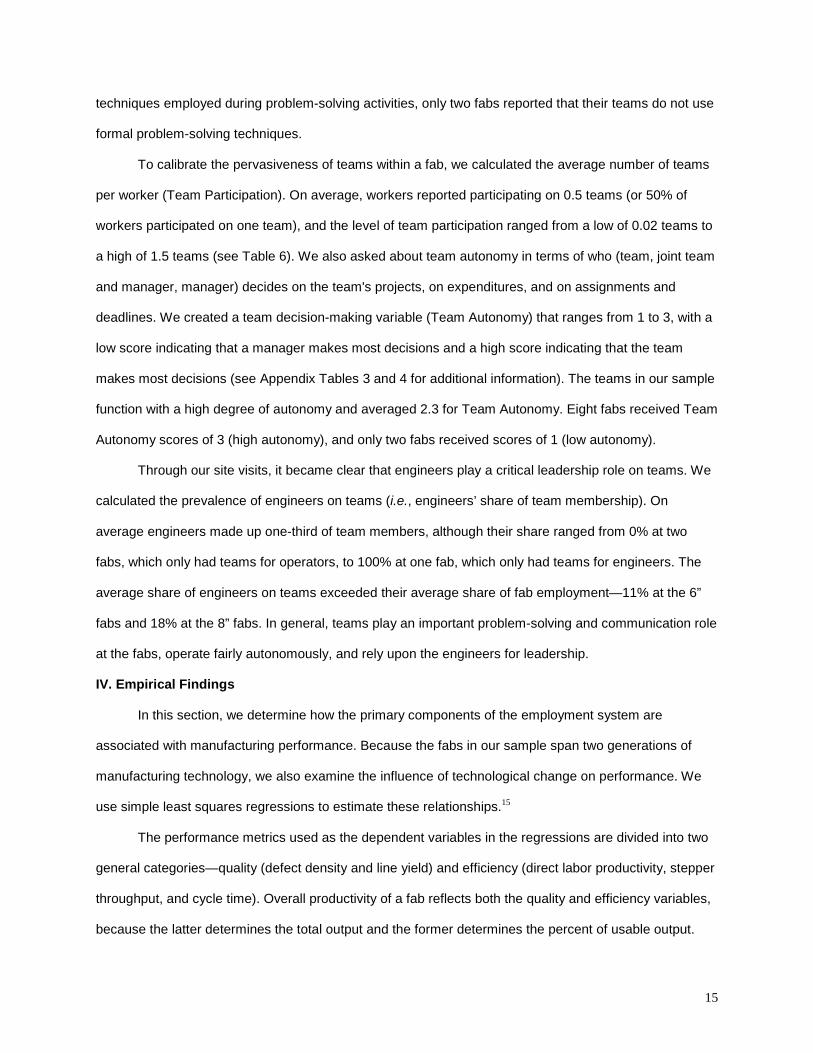
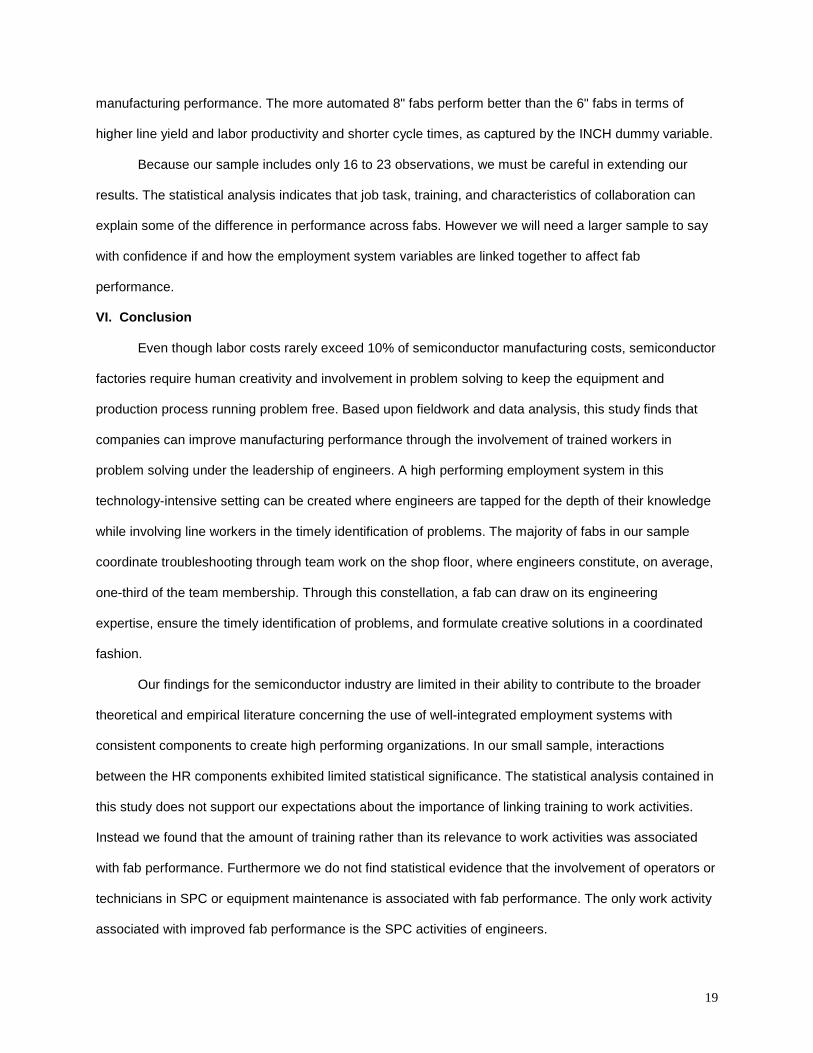
engineers are clearly the most involved in advanced problem solving. As found for equipment
maintenance activities, fabs vary in their use of line workers in SPC activities and in their total use of SPC
14
activities, and no simple relationship between use of SPC and fab performance exists (see Figure 4). In
addition a close inspection of the bar chart indicates there is no apparent trade-off between the use of
operators and process engineers in SPC activities, because the fabs with the highest scores for
operators' SPC fall in both the highest and lowest groups for process engineers' SPC scores.
The use of SPC activities declined fairly dramatically across all three occupations in 8" fabs as the
sophisticated IT automated many of the SPC tasks. However the decline was smaller for technicians
compared to operators, and smaller still for the process engineers. For the typical worker, the SPC score
fell by one-third in 8" fabs compared to 6" fabs (see Table 5).
Collaboration. Effective execution of work activities in problem solving may require extensive cross-
occupational cooperation. Cooperation entails knowledge sharing across job categories and team
problem solving. By examining the workings of teams in the fabs in the CSM-HR sample, we documented
the structure of group problem solving. Teamwork is commonplace in the majority of fabs in our sample,
and teams at different fabs share many characteristics. Although most fabs have instituted group
problem-solving activities, our interviews with teams during site visits taught us that their level of
effectiveness actually varies greatly.
The use of teams varies across fabs. In addition to collecting information on the types of teams
(Quality Improvement Teams or Circles, Self-Directed Work Teams, and Cross-Functional Teams as
defined in Table 1 above), we inquired about their autonomy and pervasiveness. We found that the
autonomy of the teams was a distinguishing characteristic of teams rather than the presence of particular
types of teams. and the proportion of engineers were the important characteristics of teams rather than
the team type. In general, the twenty-three fabs in our sample had all three types of teams, with Asian
fabs placing slightly more emphasis on Quality Circles while European fabs emphasized Cross-Functional
teams.
Through team activities, the fabs in our sample emphasize both collaboration across multiple work
areas and quality improvement activities in a single work area. The importance placed on cross-functional
problem solving reflects an interesting feature of the semiconductor industry: The complicated interplay of
processing steps requires that workers in different equipment areas communicate regularly. In terms of
15
techniques employed during problem-solving activities, only two fabs reported that their teams do not use
formal problem-solving techniques.
To calibrate the pervasiveness of teams within a fab, we calculated the average number of teams
per worker (Team Participation). On average, workers reported participating on 0.5 teams (or 50% of
workers participated on one team), and the level of team participation ranged from a low of 0.02 teams to
a high of 1.5 teams (see Table 6). We also asked about team autonomy in terms of who (team, joint team
and manager, manager) decides on the team's projects, on expenditures, and on assignments and
deadlines. We created a team decision-making variable (Team Autonomy) that ranges from 1 to 3, with a
low score indicating that a manager makes most decisions and a high score indicating that the team
makes most decisions (see Appendix Tables 3 and 4 for additional information). The teams in our sample
function with a high degree of autonomy and averaged 2.3 for Team Autonomy. Eight fabs received Team
Autonomy scores of 3 (high autonomy), and only two fabs received scores of 1 (low autonomy).
Through our site visits, it became clear that engineers play a critical leadership role on teams. We
calculated the prevalence of engineers on teams (i.e., engineers’ share of team membership). On
average engineers made up one-third of team members, although their share ranged from 0% at two
fabs, which only had teams for operators, to 100% at one fab, which only had teams for engineers. The
average share of engineers on teams exceeded their average share of fab employment—11% at the 6”
fabs and 18% at the 8” fabs. In general, teams play an important problem-solving and communication role
at the fabs, operate fairly autonomously, and rely upon the engineers for leadership.
IV. Empirical Findings
In this section, we determine how the primary components of the employment system are
associated with manufacturing performance. Because the fabs in our sample span two generations of
manufacturing technology, we also examine the influence of technological change on performance. We
use simple least squares regressions to estimate these relationships.15
The performance metrics used as the dependent variables in the regressions are divided into two
general categories—quality (defect density and line yield) and efficiency (direct labor productivity, stepper
throughput, and cycle time). Overall productivity of a fab reflects both the quality and efficiency variables,
because the latter determines the total output and the former determines the percent of usable output.
16
The performance metrics are defined as follows16:
• Defect density is the percent of fatal defects per square centimeter of wafer surface area.17
• Line yield is the average fraction of wafers started that emerge from the production line as completed
wafers. Incomplete wafers include wafers damaged from scratches or breaks, or wafers aborted
because of misprocessing.
• Direct labor productivity is the average number of wafer layers completed per production worker per
day.
• Stepper throughput provides a measure of factory throughput. More specifically, it measures the
average number of wafer operations per day across the photolithography machines, steppers, that
project the patterns of the circuitry onto the wafer.18
• Cycle time per layer is the average time duration of wafer lots from the beginning of the process until
they leave the fab, controlling for the number of layers of circuitry.19
Definitions of the employment system variables with descriptive statistics can be found in Tables 3
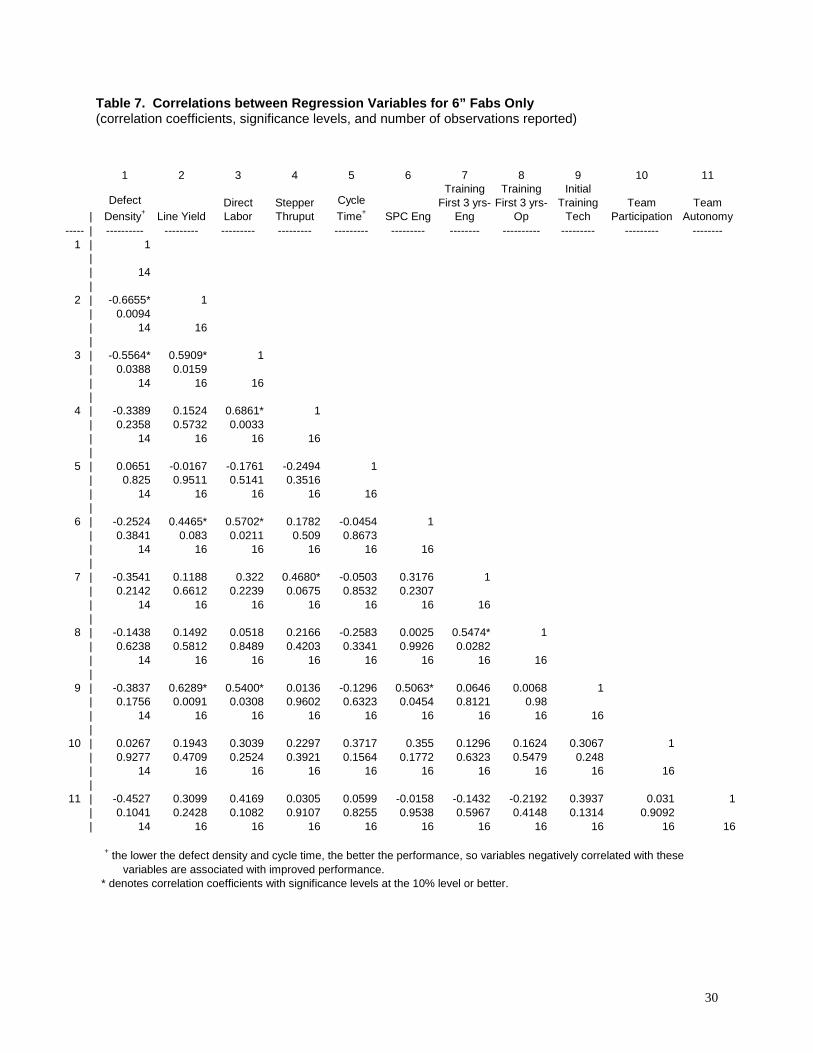
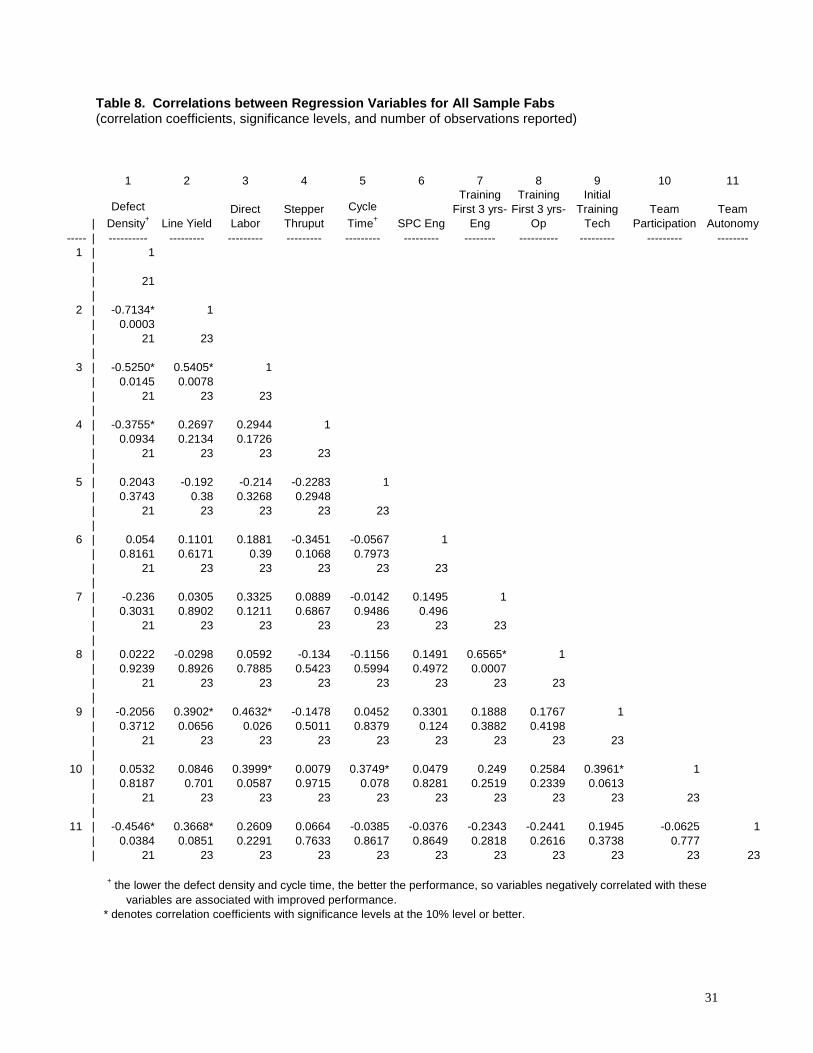
and 4 of the Data Appendix. Tables 7 and 8 present correlation matrices that include the performance
data and a subset of the employment system variables that will be used in the regression analysis below.
The correlations in Table 7 include only the data from the sixteen 6” fabs, whereas Table 8 also includes
the data from the seven 8” fabs. As shown in the tables, a number of the performance metrics are
positively correlated.20
Regarding the importance of training at our sample fabs, initial training for
technicians is positively correlated with a measure of quality (line yield) and a measure of efficiency
(direct labor productivity). In correlations not reported, initial training of engineers is also positively
correlated with these two performance variables (both at the 6” fabs and for the whole sample), while
initial training of operators is positively correlated with line yield (6” fabs) and with direct labor productivity
(whole sample).
The data include not only the amount of training but also the content, permitting us to determine
the relevance of training for the problem-solving activities undertaken by each occupation. However, the
interaction variables that link training related to equipment maintenance and SPC tasks to the level the
three occupations engage in these tasks are not positively correlated with the performance metrics, and
in some instances exhibit negative correlations. For example, the interaction between training in areas
17
associated with equipment maintenance (classroom or on-the-job training in machine operation, machine
maintenance, or cleanroom procedures) and the execution of equipment maintenance tasks is negatively
correlated with defect density, line yield, and direct labor productivity across the whole sample
(correlations not reported). This may suggest that offering both classroom and on-the-job training may be
excessive and interfere with the execution of job tasks.
Also counter to our expectations, we found that training over the first three years of employment
and the level of engagement in SPC activities positively correlated with performance metrics only for the
engineering job category for the 6” fabs. Although the importance of equipment maintenance was
apparent during our fieldwork, the engagement in equipment maintenance by the job categories did not
correlate with superior manufacturing performance.
Although we found that the categories of teams did not distinguish the companies in our sample
(almost all of the fabs had the three team types), the autonomy of teams is positively correlated with
quality measures of manufacturing performance—defect and line yield improvements—across the whole
sample. Again across all twenty-three fabs, the extensive use of teams correlates positively with one
measure of efficiency—direct labor productivity—but negatively with another—cycle time.
We first ran regressions that included the HR variables for problem-solving participation, skills and
knowledge, and team activities. We also performed regressions using two measures of the actual
training in the job tasks by occupation (the breadth of training in job tasks for SPC and equipment
maintenance and the interaction between training for SPC or equipment maintenance and the tasks
done). We reran the regressions with only the variables that had a standard error less than the coefficient.
The employment system variables used in the regressions include21
:
• Problem-Solving Activities: SPC activities by engineers.
• Training and Skill Development: initial training of technicians and training during the first three years
for operators and engineers.
• Collaboration: team autonomy in decision making, participation in teams.
In addition, we included a dummy variable to indicate which fabs were 8" (so the 6” fabs act as the
reference group).
18
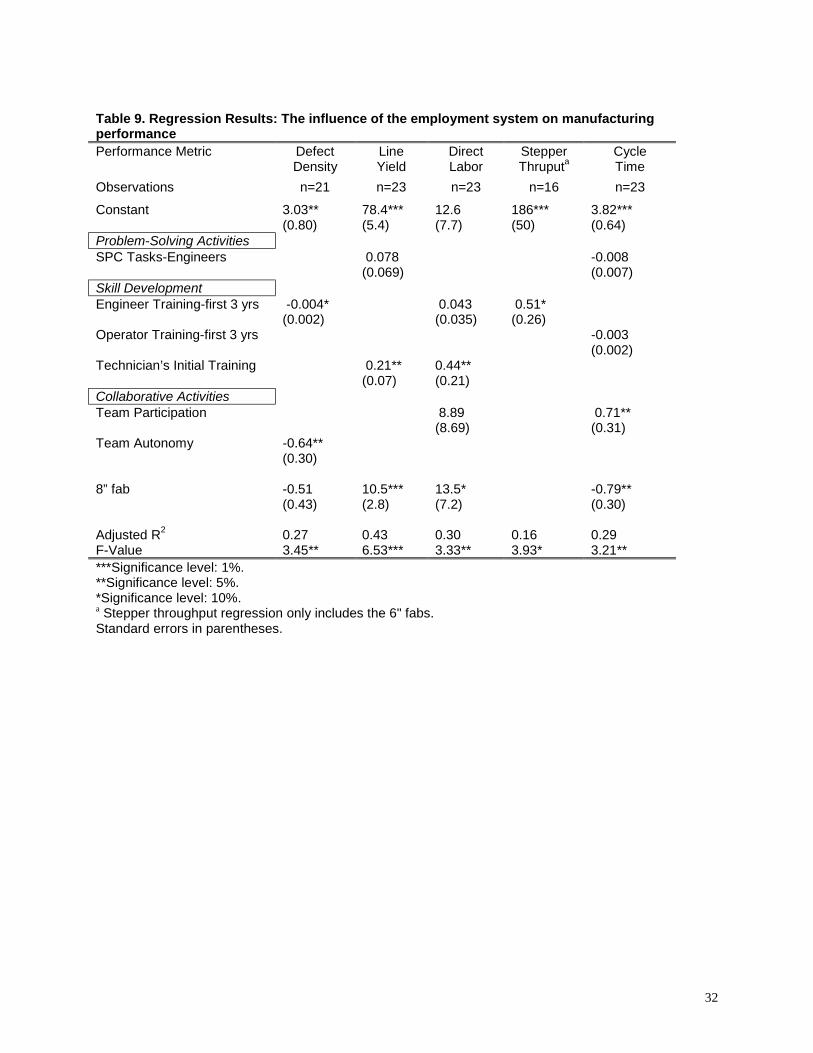
The results are presented in Table 9. Given the small sample size, the performance metrics were
significantly related to only a few of the HR variables, which explained approximately 30% of the variance
in performance across the fabs.
We ran the stepper throughput regressions only with the 6" inch observations, because we felt the
increased level of automation in the stepper equipment modules of 8” fabs would make throughput
comparisons with 6” fabs misleading. Because the stepper module often creates the bottleneck in the fab,
and because the photolithography equipment is some of the most expensive equipment in the fab, this
module became more automated than the other modules. The employment system is dramatically
changed by the introduction of new automation technology in the stepper modules in 8” fabs, which have
automated material handling as well as automated recipe download and automated selection of circuit
patterns, called “reticles.” We did not think that the inclusion of the INCH dummy variable would be
adequate for differentiating the 8" from the 6" fabs in terms of stepper throughput. As we did not have
sufficient degrees of freedom to interact the INCH variable with the other variables, we decided to exclude
the 8” fabs from the stepper regression.
The regression findings are consistent with the pair-wise correlation between the team variables
and the performance metrics. Fabs in which workers participate on many in teams face reduced efficiency
through slower cycle times. This may indicate that having many teams in operation may hinder moving
the scheduled lots through the fab. Whereas team autonomy appears to heighten quality through defect
density reductions.
As reported above, among the job tasks variables, only the SPC activities of engineers were
positively associated with high performance in the 6” fabs in terms of improved line yield and direct labor
productivity (Table 7), but the coefficients on this variable in the regressions was not significant.
The regressions demonstrate that training is associated with high performance. Which occupations
receive training and when the training is given appear to be important. The continuous training of
engineers, measured by the training received in the first three years, is associated with reduced defect
density and higher stepper throughput. Initial training of technicians is associated with improving line yield
and direct labor productivity. Overall the training of engineers and technicians improved both quantity and
quality variables. The regressions also underscore how technological change has influenced
19
manufacturing performance. The more automated 8" fabs perform better than the 6" fabs in terms of
higher line yield and labor productivity and shorter cycle times, as captured by the INCH dummy variable.
Because our sample includes only 16 to 23 observations, we must be careful in extending our
results. The statistical analysis indicates that job task, training, and characteristics of collaboration can
explain some of the difference in performance across fabs. However we will need a larger sample to say
with confidence if and how the employment system variables are linked together to affect fab
performance.
VI. Conclusion
Even though labor costs rarely exceed 10% of semiconductor manufacturing costs, semiconductor
factories require human creativity and involvement in problem solving to keep the equipment and
production process running problem free. Based upon fieldwork and data analysis, this study finds that
companies can improve manufacturing performance through the involvement of trained workers in
problem solving under the leadership of engineers. A high performing employment system in this
technology-intensive setting can be created where engineers are tapped for the depth of their knowledge
while involving line workers in the timely identification of problems. The majority of fabs in our sample
coordinate troubleshooting through team work on the shop floor, where engineers constitute, on average,
one-third of the team membership. Through this constellation, a fab can draw on its engineering
expertise, ensure the timely identification of problems, and formulate creative solutions in a coordinated
fashion.
Our findings for the semiconductor industry are limited in their ability to contribute to the broader
theoretical and empirical literature concerning the use of well-integrated employment systems with
consistent components to create high performing organizations. In our small sample, interactions
between the HR components exhibited limited statistical significance. The statistical analysis contained in
this study does not support our expectations about the importance of linking training to work activities.
Instead we found that the amount of training rather than its relevance to work activities was associated
with fab performance. Furthermore we do not find statistical evidence that the involvement of operators or
technicians in SPC or equipment maintenance is associated with fab performance. The only work activity
associated with improved fab performance is the SPC activities of engineers.
20
Overall the use of continuously-trained engineers with initially-trained technicians within well-
functioning teams appeared to be the hallmark of the employment system in high-performing fabs. In
particular, defect density is lower in fabs with autonomous teams and continuously-trained engineers. The
other quality metric, line yield, is higher in fabs where technicians receive more initial training. Similarly, a
measure of efficiency—direct labor productivity—is also positively associated with technicians receiving
initial training. Another measure of efficiency, stepper throughput, is higher in 6" fabs with continuously-
trained engineers. The final quantity metric, cycle time, appears adversely affected by the presence of
many teams. Technological change represented by next-generation production systems at the 8” fabs
was consistent with enhanced performance across our sample along both quality and quantity
dimensions.
Although our statistical results offer only weak links between manufacturing performance and the
employment system, our fieldwork observations, coupled with comparisons of the employment system
variables in 8" fabs compared to 6" fabs, highlight the importance of problem solving led by engineers in
this high-tech industry. Furthermore, the differences exhibited between the 6" and 8" fabs indicate that the
importance of engineers relative to direct labor in fab performance will grow with the increased use of
automation and information technology. Even though technician and operator knowledge and skills can
be useful in continuous improvement and problem-solving activities, engineers drive the fab’s operations
and guide the vast majority of improvement projects.
Our results are consistent with many of the lessons learned from Strauss about industrial
relations—particularly concerning the circumstances under which workers’ participation in management
leads to successful outcomes (e.g., Strauss and Rosenstein 1970; Strauss 1992). His own research led
Strauss to conclude that participation can improve product quality and productivity when a strong union is
present. In contrast to traditional manufacturing operations, unions play a diminished role in
semiconductor fabs especially in the United States where only a couple of fabs are unionized. This limits
direct labor’s representation in the decisions to restructure jobs and responsibilities as new technology is
introduced. With greater union representation, operators’ and technicians’ involvement in problem solving
might not have declined as rapidly with technological change as this research has shown. With
representation, the rise in the importance of engineers and the fall in the importance of operators and

21
technicians may not occur to the extent experienced in the semiconductor industry. The outlook for direct
labor with the spread of material handling systems and information technology to industries with greater
union presence will not be as bleak as suggested by the outcomes in the semiconductor industry.
22
References
Appleyard, Melissa M. 1996. “How Does Knowledge Flow? Inter-firm Patterns in theSemiconductor Industry.” Strategic Management Journal. 17:137-154.
Appleyard, Melissa M. and Clair Brown. 1999. "An International Investigation of CreativePerformance in the Semiconductor Industry", Center for Work, Technology, and Society Working Paper,U.C. Berkeley.
Appleyard, Melissa M., Nile W. Hatch, and David C. Mowery. 2000. “Managing the Developmentand Transfer of Process Technologies in the Semiconductor Manufacturing Industry.” In Giovanni Dosi,Richard R. Nelson, and Sidney G. Winter, eds., The Nature of Dynamics and Organizational Capabilities.London: Oxford University Press.
Arthur, Jeffrey B. 1994. “Effects of Human Resource Systems on Manufacturing Performance andTurnover.” Academy of Management Journal, 37(3):670-87.
Bailey, Diane E. 1998. “Comparison of Manufacturing Performance of Three Team Structures inSemiconductor Plants,” IEEE Transactions on Engineering Management 45(1):20-32.
Baker, George, Robert Gibbons, and Kevin J. Murphy. 1994. “Subjective Performance Measuresin Optimal Incentive Contracts.” Quarterly Journal of Economics, 108(8):1125-56.
Brown, Clair, ed. 1997. The Competitive Semiconductor Manufacturing Human ResourcesProject: Final Report (Phase I) (Report CSM-38). Berkeley, CA: Institute of Industrial Relations andEngineering System Research Center, December (http://socrates.berkeley.edu/~iir/worktech/csmfinal).
Brown, Clair, ed. 1996. The Competitive Semiconductor Manufacturing Human ResourcesProject: Second Interim Report (Report CSM-32). Berkeley, CA: Institute of Industrial Relations andEngineering System Research Center, September.
Brown, Clair and Ben Campbell. Forthcoming. "Technical Change, Wages, and Employment inSemiconductor Manufacturing". Industrial and Labor Relations.
Brynjolfsson, Erik and Lorin Hitt. 1997. “Information Technology and Organizational Design:Some Evidence from Micro Data,” Working paper, MIT.
Huselid, Mark A. 1995. “The Impact of Human Resource Management Practices on Turnover,Productivity, and Corporate Financial Performance.” Academy of Management Journal, 38(4):635-72.
Iansiti, Marco and Jonathan West. 1999. "From Physics to Function: An Empirical Study ofResearch and Development Performance in the Semiconductor Industry." Journal of Product Innovationand Management, 16:385-399.
Ichniowski, Casey, Kathryn Shaw, and Giovanni Prennushi. 1997. “The Effects of HumanResource Management Practices on Productivity: A Study of Steel Finishing Lines,” American EconomicReview, 87(3):291-313.
Kandel, Eugene and Edward Lazear. 1992. “Peer Pressure and Partnership.” Journal of PoliticalEconomy, 100(4):801-17.
Leachman, Robert C., ed. 1996. The Competitive Semiconductor Manufacturing Survey: ThirdReport on Results of the Main Phase (Report CSM-31). Berkeley, CA: Engineering System ResearchCenter, August.

23
Leachman, Robert C. and David A. Hodges. 1996. "Benchmarking SemiconductorManufacturing," IEEE Transactions on Semiconductor Manufacturing, Vol. 9 No 2, pp. 158-169, May.
Milgrom, Paul and John Roberts. 1995. “Complementarities and Fit: Strategy, Structure, andOrganizational Change in Manufacturing.” Journal of Accounting and Economics, 19(2-3):179-208.
Sattler, Linda and Vinay Sohoni. 1999. “Participative Management: An Empirical Study of theSemiconductor Manufacturing Industry,” IEEE Transactions on Engineering Management, 46(4),November;387-98.
Strauss, George. 1992. “Workers’ Participation in Management.” In Jean Hartley and GeoffreyStephenson, eds. Employment Relations: The Psychology of Influence and Control at Work. Oxford: BasilBlackwell. 1992, pp. 291-313.
Strauss, George and Eliezer Rosenstein. 1970. “Workers’ Participation: A Critical View.”Industrial Relations. 9: 197-214.
Youndt, Mark A., Scott A. Snell, James W. Dean Jr., and David P. Lepak. 1996. “HumanResource Management, Manufacturing Strategy, and Firm Performance.” Academy of ManagementJournal, 39(4):836-88.
24
Table 1. Team Definitions22
Name of Team DefinitionQuality Improvement Teams/Quality Circles:(QITs/QCs)
Structured employee participation groups in whichemployees from a particular work area meet regularly toidentify and suggest improvements to work-relatedproblems.
Self-Directed Work Teams: Also termed autonomous work groups, semi-autonomouswork groups, self-managing work teams, or simply workteams. The work group (in some cases acting without asupervisor) is responsible for work in its area of the fab,and it makes decisions about task assignments and workmethods.
Cross-Functional Teams: Structured employee participation groups in whichemployees from multiple work areas meet regularly toidentify and suggest improvements to problems.

25
Table 2. Sample Fabs
Location Number of 6” Fabs Number of 8” FabsNumber of Distinct
CompaniesAsia 6 5 7Europe 3 0 3United States 7 2 9

26
Table 3. Average Levels of Training across OccupationsInitial Training+
(mean days)6" 8"
Training first 3 years+
(mean days)6" 8"
Operators 20 15 172 136Technicians 18 8 204 151Engineers 18 18 172 158+ For each job category, Wilcoxon rank-sum tests did not find statistically significant differences across the6” and 8” fabs.

27
Table 4. Work Activities by Occupation and across Generations of Technology
Equipment Maintenance+
Operator Technician Equipment Engineer Typical Worker6" fab (mean) 44 134 153 818" fab (mean) 27 125 165 80+ For each job category, Wilcoxon rank-sum tests did not find statistically significant differences across the6” and 8” fabs.

28
Table 5. Work Activities by Occupation and across Generations of Technology
SPC Activities+
Operator*** Technician* Process Engineer* Typical Worker*6" fab (mean) 43 53 79 518" fab (mean) 20 36 62 35+ Wilcoxon rank-sum tests found that the populations across the 6” and 8” fabs are statistically different atthe following significance levels: ***1%, *10%.

29
Table 6. Characteristics of CollaborationMean S.D. Range
Team Participation (teams per worker) 0.49 0.42 0.02-1.5Team Autonomy (1 is low; 3 is high) 2.27 0.70 1-3Share of Engineers (%per team) 34.31 31.36 0-100
30
Table 7. Correlations between Regression Variables for 6” Fabs Only(correlation coefficients, significance levels, and number of observations reported)
1 2 3 4 5 6 7 8 9 10 11
|
Defect
Density+ Line YieldDirect Labor
Stepper Thruput
Cycle
Time+ SPC Eng
Training First 3 yrs-
Eng
Training First 3 yrs-
Op
Initial Training
TechTeam
ParticipationTeam
Autonomy----- | ---------- --------- --------- --------- --------- --------- -------- ---------- --------- --------- --------
1 | 1|| 14|
2 | -0.6655* 1| 0.0094| 14 16|
3 | -0.5564* 0.5909* 1| 0.0388 0.0159| 14 16 16|
4 | -0.3389 0.1524 0.6861* 1| 0.2358 0.5732 0.0033| 14 16 16 16|
5 | 0.0651 -0.0167 -0.1761 -0.2494 1| 0.825 0.9511 0.5141 0.3516| 14 16 16 16 16|
6 | -0.2524 0.4465* 0.5702* 0.1782 -0.0454 1| 0.3841 0.083 0.0211 0.509 0.8673| 14 16 16 16 16 16|
7 | -0.3541 0.1188 0.322 0.4680* -0.0503 0.3176 1| 0.2142 0.6612 0.2239 0.0675 0.8532 0.2307| 14 16 16 16 16 16 16|
8 | -0.1438 0.1492 0.0518 0.2166 -0.2583 0.0025 0.5474* 1| 0.6238 0.5812 0.8489 0.4203 0.3341 0.9926 0.0282| 14 16 16 16 16 16 16 16|
9 | -0.3837 0.6289* 0.5400* 0.0136 -0.1296 0.5063* 0.0646 0.0068 1| 0.1756 0.0091 0.0308 0.9602 0.6323 0.0454 0.8121 0.98| 14 16 16 16 16 16 16 16 16|
10 | 0.0267 0.1943 0.3039 0.2297 0.3717 0.355 0.1296 0.1624 0.3067 1| 0.9277 0.4709 0.2524 0.3921 0.1564 0.1772 0.6323 0.5479 0.248| 14 16 16 16 16 16 16 16 16 16|
11 | -0.4527 0.3099 0.4169 0.0305 0.0599 -0.0158 -0.1432 -0.2192 0.3937 0.031 1| 0.1041 0.2428 0.1082 0.9107 0.8255 0.9538 0.5967 0.4148 0.1314 0.9092| 14 16 16 16 16 16 16 16 16 16 16
+ the lower the defect density and cycle time, the better the performance, so variables negatively correlated with these variables are associated with improved performance. * denotes correlation coefficients with significance levels at the 10% level or better.
31
Table 8. Correlations between Regression Variables for All Sample Fabs(correlation coefficients, significance levels, and number of observations reported)
1 2 3 4 5 6 7 8 9 10 11
|
Defect
Density+ Line YieldDirect Labor
Stepper Thruput
Cycle
Time+ SPC Eng
Training First 3 yrs-
Eng
Training First 3 yrs-
Op
Initial Training
TechTeam
ParticipationTeam
Autonomy----- | ---------- --------- --------- --------- --------- --------- -------- ---------- --------- --------- --------
1 | 1|| 21|
2 | -0.7134* 1| 0.0003| 21 23|
3 | -0.5250* 0.5405* 1| 0.0145 0.0078| 21 23 23|
4 | -0.3755* 0.2697 0.2944 1| 0.0934 0.2134 0.1726| 21 23 23 23|
5 | 0.2043 -0.192 -0.214 -0.2283 1| 0.3743 0.38 0.3268 0.2948| 21 23 23 23 23|
6 | 0.054 0.1101 0.1881 -0.3451 -0.0567 1| 0.8161 0.6171 0.39 0.1068 0.7973| 21 23 23 23 23 23|
7 | -0.236 0.0305 0.3325 0.0889 -0.0142 0.1495 1| 0.3031 0.8902 0.1211 0.6867 0.9486 0.496| 21 23 23 23 23 23 23|
8 | 0.0222 -0.0298 0.0592 -0.134 -0.1156 0.1491 0.6565* 1| 0.9239 0.8926 0.7885 0.5423 0.5994 0.4972 0.0007| 21 23 23 23 23 23 23 23|
9 | -0.2056 0.3902* 0.4632* -0.1478 0.0452 0.3301 0.1888 0.1767 1| 0.3712 0.0656 0.026 0.5011 0.8379 0.124 0.3882 0.4198| 21 23 23 23 23 23 23 23 23|
10 | 0.0532 0.0846 0.3999* 0.0079 0.3749* 0.0479 0.249 0.2584 0.3961* 1| 0.8187 0.701 0.0587 0.9715 0.078 0.8281 0.2519 0.2339 0.0613| 21 23 23 23 23 23 23 23 23 23|
11 | -0.4546* 0.3668* 0.2609 0.0664 -0.0385 -0.0376 -0.2343 -0.2441 0.1945 -0.0625 1| 0.0384 0.0851 0.2291 0.7633 0.8617 0.8649 0.2818 0.2616 0.3738 0.777| 21 23 23 23 23 23 23 23 23 23 23
+ the lower the defect density and cycle time, the better the performance, so variables negatively correlated with these variables are associated with improved performance. * denotes correlation coefficients with significance levels at the 10% level or better.
32
Table 9. Regression Results: The influence of the employment system on manufacturingperformancePerformance Metric Defect
DensityLineYield
DirectLabor
StepperThruputa
CycleTime
Observations n=21 n=23 n=23 n=16 n=23
Constant 3.03**(0.80)
78.4***(5.4)
12.6(7.7)
186***(50)
3.82***(0.64)
Problem-Solving ActivitiesSPC Tasks-Engineers 0.078
(0.069)-0.008(0.007)
Skill DevelopmentEngineer Training-first 3 yrs -0.004*
(0.002) 0.043(0.035)
0.51*(0.26)
Operator Training-first 3 yrs -0.003(0.002)
Technician’s Initial Training 0.21**(0.07)
0.44**(0.21)
Collaborative ActivitiesTeam Participation 8.89
(8.69) 0.71**(0.31)
Team Autonomy -0.64**(0.30)
8” fab -0.51(0.43)
10.5***(2.8)
13.5*(7.2)
-0.79**(0.30)
Adjusted R2 0.27 0.43 0.30 0.16 0.29F-Value 3.45** 6.53*** 3.33** 3.93* 3.21*****Significance level: 1%.**Significance level: 5%.*Significance level: 10%.a Stepper throughput regression only includes the 6" fabs.Standard errors in parentheses.

33
34
��������������
�����������������������
������������������������
��������������
����������������������������������������
������������������������������������������������
����������������������������������������������������
������������������������������������������������������
���������������������������������������������������
����������������������������������������������������
����������������������������
���������������������������������������������
����������������������������������������������������������������
������������������������������������������������������������
��������������������������������������������������������������������������
��������������������������������������������������������������������������������
��������������������������������������������������������������������
��������������������������������������������������������������������������
������������������������������������������������������������������������
����������������������������������������������������������������������������������
��������������������������������������������������������������������������
�������������������������
Figure 1. Participation in Equipment Maintenance by Occupation: Weigthed(n=15 fabs for operators; n=16 fabs for techs and engineers)
0 50 100 150 200 250 300 350 400 450
Clean/Lube
Daily Mnt
Recog/Doc
Doc. Bkdns
Inspect.
Train Subords
Train Peers
Correc Action
Replace Parts
Fn & Struc
Ownership
Ven Classes
Draft Procs
Use-B Mnt
Monthly Mnt
Weekly Mnt
Checklists
Goals Defect
Goals Non-Op
Reduce Partcl
Reduce Bkdns
Increase Life
Reduce Set-up
Improve Clean
Modify-Inspec
Modify-PR
Bkdn Analysis
Repair
Prec-Prod Qual
Annual Mnt
Act
ivit
y
Involvement
Operator
Technician
Process Engineer����Equipment Engineer
Low-LevelActivity
(weight 1)
Medium-Level
Activity(weight 2)
High-LevelActivity
(weight 3)
35
Figure 2. Use of Equipment Maintenance(Fabs sorted by line yield for each wafer size)
0 50 100 150 200 250 300 350 400 450
EU3
US7
US5
US6
AS2
EU1
EU2
US1
US4
US3
US2
AS6
AS4
AS5
AS1
AS3
AS7
US8
AS11
AS9
AS10
AS8
US9
Fab
Equipment Maintenance Score
Operator
Technician
Equipment Engineer
8 inch fabs
6 inch fabs
36
����������������������
������������������
����������������
����������������������
��������������
������������������������������
������������������������������������
��������������������������������������������
������������������������������������������������
��������������������������������
������������������������������������������������������������������������������������������
���������������������������������
������������������������������������
������������������������������������������������
��������������������������������������������������������������������������������
����������������������������������������������������������������
������������������������������������������������������������������������
����������������������������������������������������������������
Figure 3. Participation in SPC by Occupation: Weighted(n=15 for operations and eqmt engineers; n=16 for techs and process engineers)
0 50 100 150 200 250 300 350 400
Gather Data-Man
Qual Data-Comp
Control Chart-Man
P-Charts
X-Bar, S
X-Bar, R
Train Others
Brainstorming
Flow/Histograms
Cp, Cpk
Comm. Sup/Ven
Comm. Cust.
QC or QI Story
Pareto-Cost
Pareto-Prob ID
Deming
Fishbone
Plan Actions
Act
ivit
y
Involvement
Operator
Technician
Process Engineer������Equipment Engineer
Medium-Level
Activity(weight 2)
High-LevelActivity
(weight 3)
Low-LevelActivity
(weight 1)

37
Figure 4. Use of Statistical Process Control(Fabs sorted by line yield for each wafer size)
0 50 100 150 200 250 300
EU3
US7
US5
US6
AS2
EU1
EU2
US1
US4
US3
US2
AS6
AS4
AS5
AS1
AS3
AS7
US8
AS11
AS9
AS10
AS8
US9
Fab
SPC Score
Operator
Technician
Process Engineer
8 inch fabs
6 inch fabs
38
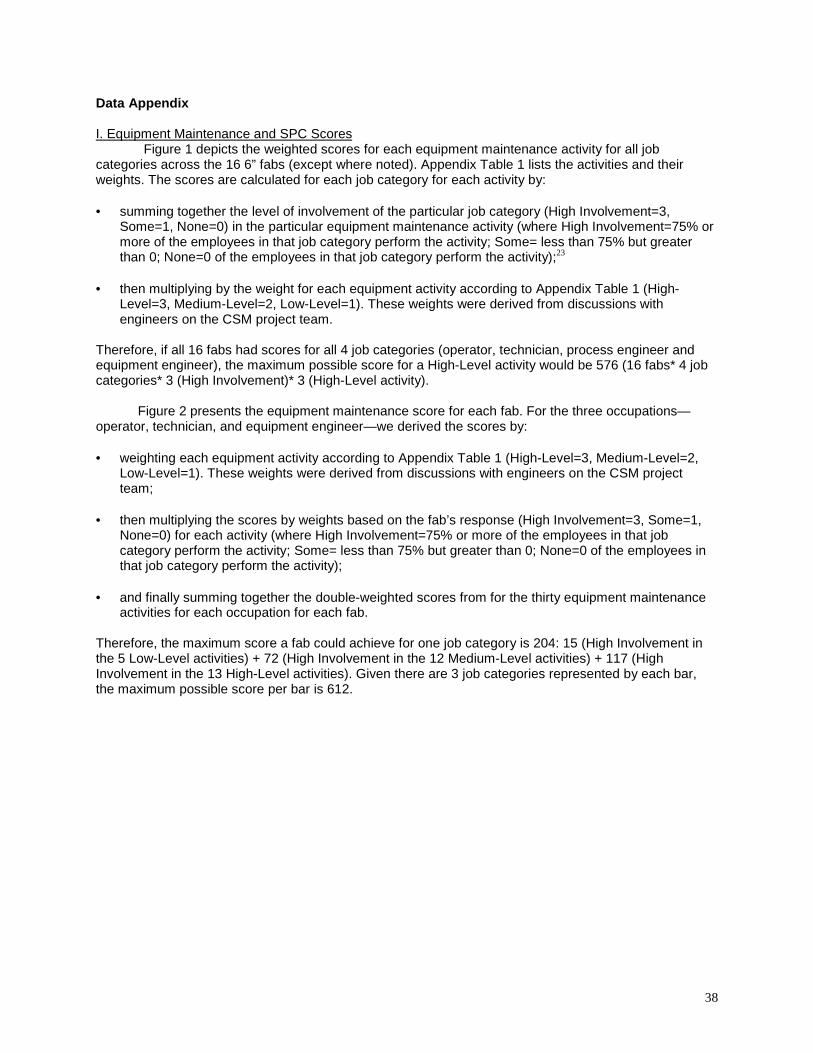
Data Appendix
I. Equipment Maintenance and SPC ScoresFigure 1 depicts the weighted scores for each equipment maintenance activity for all job
categories across the 16 6” fabs (except where noted). Appendix Table 1 lists the activities and theirweights. The scores are calculated for each job category for each activity by:
• summing together the level of involvement of the particular job category (High Involvement=3,Some=1, None=0) in the particular equipment maintenance activity (where High Involvement=75% ormore of the employees in that job category perform the activity; Some= less than 75% but greaterthan 0; None=0 of the employees in that job category perform the activity);23
• then multiplying by the weight for each equipment activity according to Appendix Table 1 (High-Level=3, Medium-Level=2, Low-Level=1). These weights were derived from discussions withengineers on the CSM project team.
Therefore, if all 16 fabs had scores for all 4 job categories (operator, technician, process engineer andequipment engineer), the maximum possible score for a High-Level activity would be 576 (16 fabs* 4 jobcategories* 3 (High Involvement)* 3 (High-Level activity).
Figure 2 presents the equipment maintenance score for each fab. For the three occupations—operator, technician, and equipment engineer—we derived the scores by:
• weighting each equipment activity according to Appendix Table 1 (High-Level=3, Medium-Level=2,Low-Level=1). These weights were derived from discussions with engineers on the CSM projectteam;
• then multiplying the scores by weights based on the fab’s response (High Involvement=3, Some=1,
None=0) for each activity (where High Involvement=75% or more of the employees in that jobcategory perform the activity; Some= less than 75% but greater than 0; None=0 of the employees inthat job category perform the activity);
• and finally summing together the double-weighted scores from for the thirty equipment maintenance
activities for each occupation for each fab. Therefore, the maximum score a fab could achieve for one job category is 204: 15 (High Involvement inthe 5 Low-Level activities) + 72 (High Involvement in the 12 Medium-Level activities) + 117 (HighInvolvement in the 13 High-Level activities). Given there are 3 job categories represented by each bar,the maximum possible score per bar is 612.
39
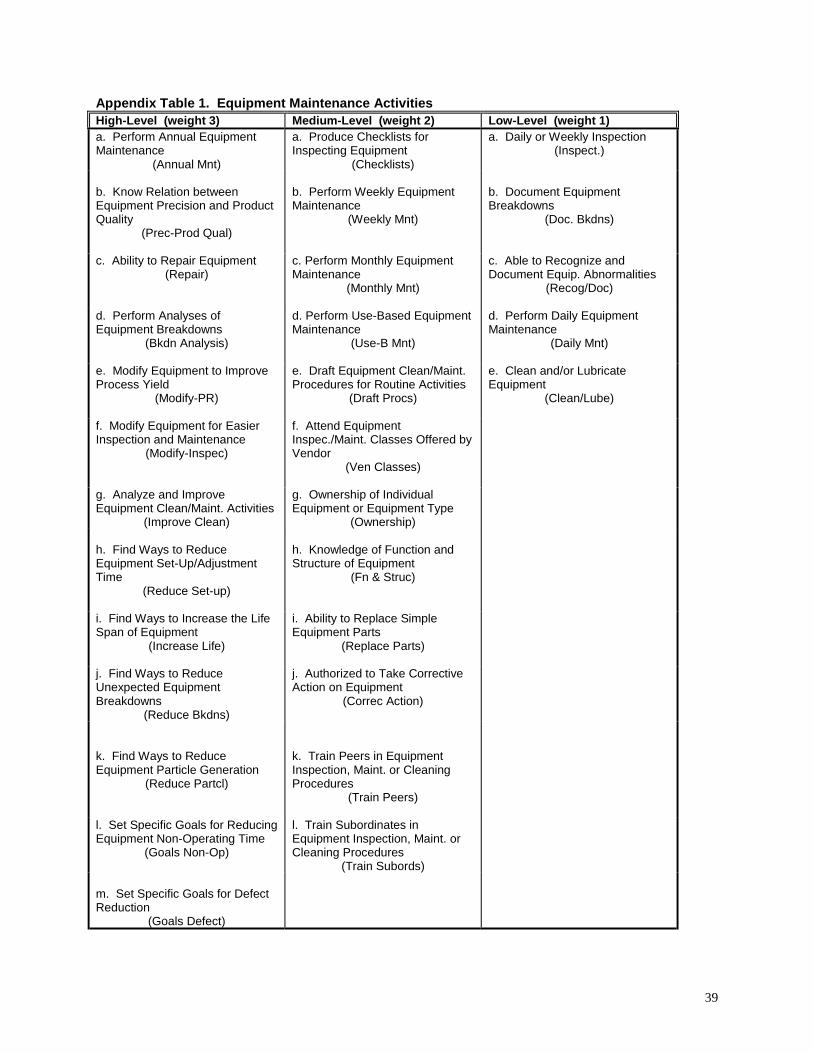
Appendix Table 1. Equipment Maintenance ActivitiesHigh-Level (weight 3) Medium-Level (weight 2) Low-Level (weight 1)a. Perform Annual EquipmentMaintenance
(Annual Mnt)
a. Produce Checklists forInspecting Equipment
(Checklists)
a. Daily or Weekly Inspection(Inspect.)
b. Know Relation betweenEquipment Precision and ProductQuality
(Prec-Prod Qual)
b. Perform Weekly EquipmentMaintenance
(Weekly Mnt)
b. Document EquipmentBreakdowns
(Doc. Bkdns)
c. Ability to Repair Equipment(Repair)
c. Perform Monthly EquipmentMaintenance
(Monthly Mnt)
c. Able to Recognize andDocument Equip. Abnormalities
(Recog/Doc)
d. Perform Analyses ofEquipment Breakdowns
(Bkdn Analysis)
d. Perform Use-Based EquipmentMaintenance
(Use-B Mnt)
d. Perform Daily EquipmentMaintenance
(Daily Mnt)
e. Modify Equipment to ImproveProcess Yield
(Modify-PR)
e. Draft Equipment Clean/Maint.Procedures for Routine Activities
(Draft Procs)
e. Clean and/or LubricateEquipment
(Clean/Lube)
f. Modify Equipment for EasierInspection and Maintenance
(Modify-Inspec)
f. Attend EquipmentInspec./Maint. Classes Offered byVendor
(Ven Classes)
g. Analyze and ImproveEquipment Clean/Maint. Activities
(Improve Clean)
g. Ownership of IndividualEquipment or Equipment Type
(Ownership)
h. Find Ways to ReduceEquipment Set-Up/AdjustmentTime
(Reduce Set-up)
h. Knowledge of Function andStructure of Equipment
(Fn & Struc)
i. Find Ways to Increase the LifeSpan of Equipment
(Increase Life)
i. Ability to Replace SimpleEquipment Parts
(Replace Parts)
j. Find Ways to ReduceUnexpected EquipmentBreakdowns
(Reduce Bkdns)
j. Authorized to Take CorrectiveAction on Equipment
(Correc Action)
k. Find Ways to ReduceEquipment Particle Generation
(Reduce Partcl)
k. Train Peers in EquipmentInspection, Maint. or CleaningProcedures
(Train Peers)
l. Set Specific Goals for ReducingEquipment Non-Operating Time
(Goals Non-Op)
l. Train Subordinates inEquipment Inspection, Maint. orCleaning Procedures
(Train Subords)
m. Set Specific Goals for DefectReduction
(Goals Defect)
40
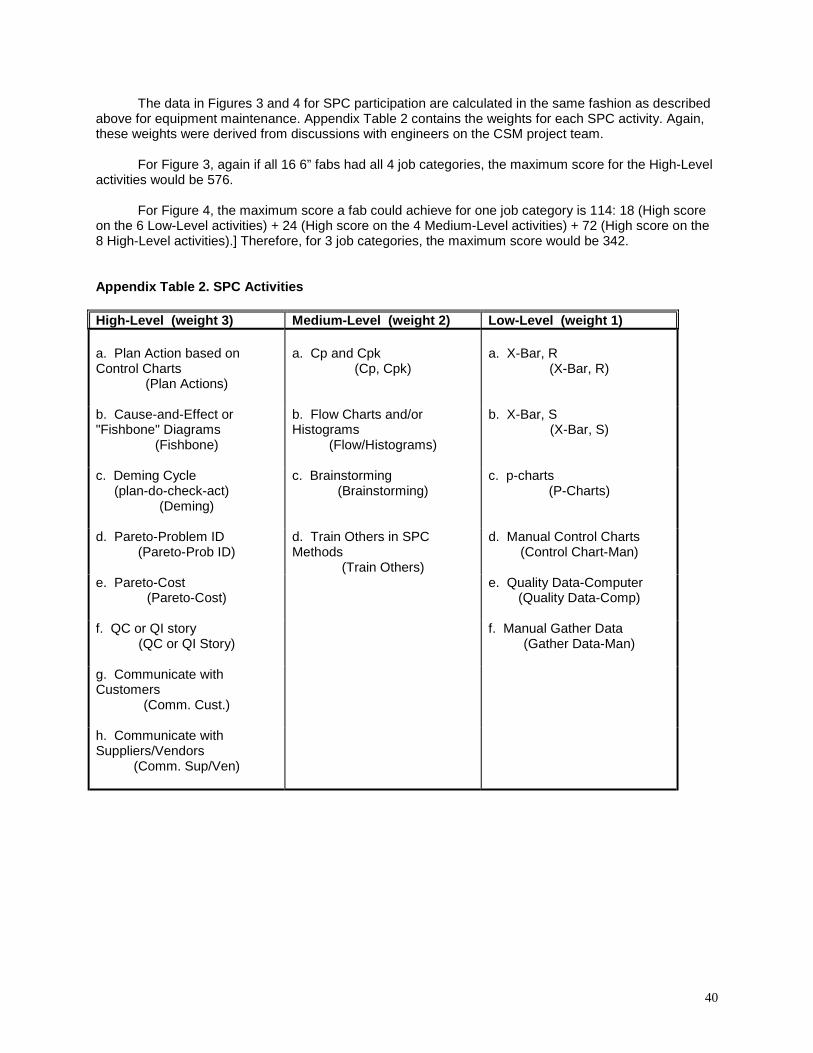
The data in Figures 3 and 4 for SPC participation are calculated in the same fashion as describedabove for equipment maintenance. Appendix Table 2 contains the weights for each SPC activity. Again,these weights were derived from discussions with engineers on the CSM project team.
For Figure 3, again if all 16 6” fabs had all 4 job categories, the maximum score for the High-Levelactivities would be 576.
For Figure 4, the maximum score a fab could achieve for one job category is 114: 18 (High scoreon the 6 Low-Level activities) + 24 (High score on the 4 Medium-Level activities) + 72 (High score on the8 High-Level activities).] Therefore, for 3 job categories, the maximum score would be 342.
Appendix Table 2. SPC Activities
High-Level (weight 3) Medium-Level (weight 2) Low-Level (weight 1)
a. Plan Action based onControl Charts
(Plan Actions)
a. Cp and Cpk(Cp, Cpk)
a. X-Bar, R(X-Bar, R)
b. Cause-and-Effect or"Fishbone" Diagrams
(Fishbone)
b. Flow Charts and/orHistograms
(Flow/Histograms)
b. X-Bar, S(X-Bar, S)
c. Deming Cycle (plan-do-check-act)
(Deming)
c. Brainstorming(Brainstorming)
c. p-charts(P-Charts)
d. Pareto-Problem ID(Pareto-Prob ID)
d. Train Others in SPCMethods
(Train Others)
d. Manual Control Charts(Control Chart-Man)
e. Pareto-Cost(Pareto-Cost)
e. Quality Data-Computer(Quality Data-Comp)
f. QC or QI story(QC or QI Story)
f. Manual Gather Data(Gather Data-Man)
g. Communicate withCustomers
(Comm. Cust.)
h. Communicate withSuppliers/Vendors
(Comm. Sup/Ven)
41
Appendix Table 3. Employment Systems Variables Statistical Process Control: Operators: as calculated above. Statistical Process Control: Technicians: as calculated above. Statistical Process Control: Engineers: as calculated above. Equipment Maintenance: Operators: as calculated above. Equipment Maintenance: Technicians: as calculated above. Equipment Maintenance: Engineers: as calculated above. SPC-Typical Worker: (the SPC score x number of workers for each occupation)/(total workers) Equip Maint-Typical Worker: (the equip maint score x number of workers for each occupation)/(total workers) Number of Engineers Per Team: average % engineers on all teams Teams per Worker: (total team membership)/(total workers) Autonomous Team Decision Making: (1 is manager decides projects and authorizes expenditures; 3 is team
makes these decisions) Initial Training Days: Operators Initial Training Days: Technicians Initial Training Days: Engineers Training Days in First 3 Years: Operators Training Days in First 3 Years: Technicians Training Days in First 3 Years: Engineers Breadth of Training in SPC: Operators (Number of types of SPC courses given) Breadth of Training in SPC: Technicians Breadth of Training in SPC: Engineers Breadth of Training in Equip. Maint.: Operators (Number of types of Equip Maint courses given) Breadth of Training in Equip. Maint.: Technicians Breadth of Training in Equip. Maint.: Engineers Interaction between Training & Job Tasks: Operator, SPC: (SPC score for operators)x(No. of SPC courses
given to operators)/(max. possible courses for operators in SPC) Interaction between Training & Job Tasks Technician, SPC: (SPC score for techs)x(No. of SPC courses
given to techs)/(max. possible courses for techs in SPC) Interaction between Training & Job Tasks: Engineer, SPC: (SPC score for engs)x(No. of SPC courses given
to engs)/(max. possible courses for engs in SPC) Interaction between Training & Job Tasks: Operator, Equip. Maint: (Equip maint score for operators)x(No. of
courses given to operators)/(max. possible courses for operators in Equip Maint) Interaction between Training & Job Tasks: Tech., Equip. Maint: (Equip maint score for techs)x(No. of Equip
maint courses given to techs)/(max. possible courses for techs in Equip maint) Interaction between Training & Job Tasks: Engineer, Equip. Maint: (Equip maint score for engs)x(No. of
Equip maint courses given to engs)/(max. possible courses for engs in Equip maint)
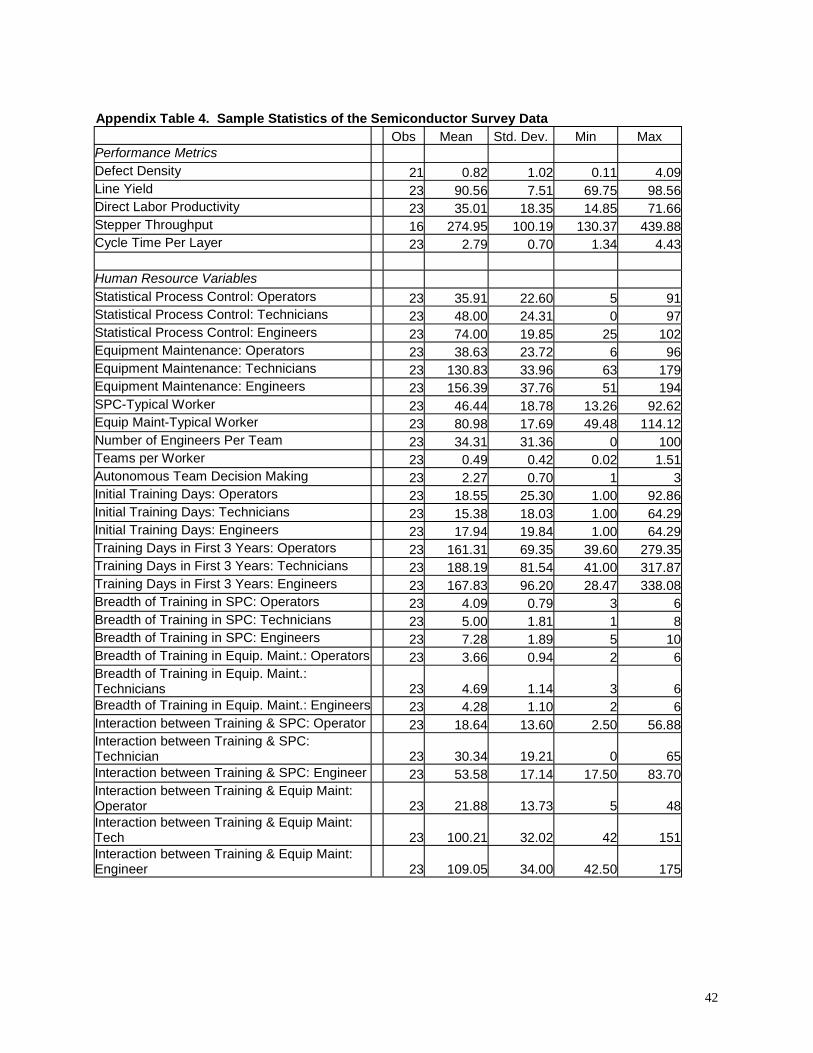
42
Appendix Table 4. Sample Statistics of the Semiconductor Survey DataObs Mean Std. Dev. Min Max
Performance Metrics Defect Density 21 0.82 1.02 0.11 4.09 Line Yield 23 90.56 7.51 69.75 98.56 Direct Labor Productivity 23 35.01 18.35 14.85 71.66 Stepper Throughput 16 274.95 100.19 130.37 439.88 Cycle Time Per Layer 23 2.79 0.70 1.34 4.43 Human Resource Variables Statistical Process Control: Operators 23 35.91 22.60 5 91 Statistical Process Control: Technicians 23 48.00 24.31 0 97 Statistical Process Control: Engineers 23 74.00 19.85 25 102 Equipment Maintenance: Operators 23 38.63 23.72 6 96 Equipment Maintenance: Technicians 23 130.83 33.96 63 179 Equipment Maintenance: Engineers 23 156.39 37.76 51 194 SPC-Typical Worker 23 46.44 18.78 13.26 92.62 Equip Maint-Typical Worker 23 80.98 17.69 49.48 114.12 Number of Engineers Per Team 23 34.31 31.36 0 100 Teams per Worker 23 0.49 0.42 0.02 1.51 Autonomous Team Decision Making 23 2.27 0.70 1 3 Initial Training Days: Operators 23 18.55 25.30 1.00 92.86 Initial Training Days: Technicians 23 15.38 18.03 1.00 64.29 Initial Training Days: Engineers 23 17.94 19.84 1.00 64.29 Training Days in First 3 Years: Operators 23 161.31 69.35 39.60 279.35 Training Days in First 3 Years: Technicians 23 188.19 81.54 41.00 317.87 Training Days in First 3 Years: Engineers 23 167.83 96.20 28.47 338.08 Breadth of Training in SPC: Operators 23 4.09 0.79 3 6 Breadth of Training in SPC: Technicians 23 5.00 1.81 1 8 Breadth of Training in SPC: Engineers 23 7.28 1.89 5 10Breadth of Training in Equip. Maint.: Operators 23 3.66 0.94 2 6 Breadth of Training in Equip. Maint.:Technicians 23 4.69 1.14 3 6Breadth of Training in Equip. Maint.: Engineers 23 4.28 1.10 2 6Interaction between Training & SPC: Operator 23 18.64 13.60 2.50 56.88 Interaction between Training & SPC:Technician 23 30.34 19.21 0 65Interaction between Training & SPC: Engineer 23 53.58 17.14 17.50 83.70 Interaction between Training & Equip Maint:Operator 23 21.88 13.73 5 48 Interaction between Training & Equip Maint:Tech 23 100.21 32.02 42 151 Interaction between Training & Equip Maint:Engineer 23 109.05 34.00 42.50 175
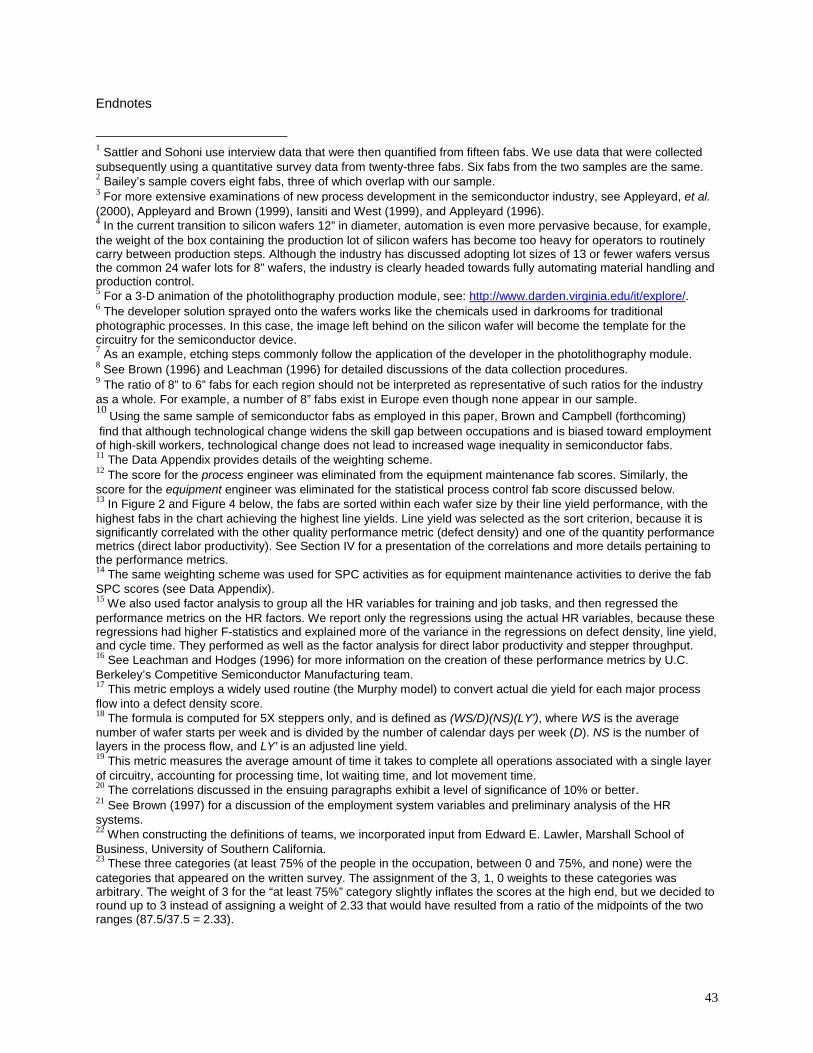
43
Endnotes
1 Sattler and Sohoni use interview data that were then quantified from fifteen fabs. We use data that were collectedsubsequently using a quantitative survey data from twenty-three fabs. Six fabs from the two samples are the same.2 Bailey’s sample covers eight fabs, three of which overlap with our sample.3 For more extensive examinations of new process development in the semiconductor industry, see Appleyard, et al.(2000), Appleyard and Brown (1999), Iansiti and West (1999), and Appleyard (1996).4 In the current transition to silicon wafers 12” in diameter, automation is even more pervasive because, for example,the weight of the box containing the production lot of silicon wafers has become too heavy for operators to routinelycarry between production steps. Although the industry has discussed adopting lot sizes of 13 or fewer wafers versusthe common 24 wafer lots for 8” wafers, the industry is clearly headed towards fully automating material handling andproduction control.5 For a 3-D animation of the photolithography production module, see: http://www.darden.virginia.edu/it/explore/.6 The developer solution sprayed onto the wafers works like the chemicals used in darkrooms for traditionalphotographic processes. In this case, the image left behind on the silicon wafer will become the template for thecircuitry for the semiconductor device.7 As an example, etching steps commonly follow the application of the developer in the photolithography module.8 See Brown (1996) and Leachman (1996) for detailed discussions of the data collection procedures.9 The ratio of 8” to 6” fabs for each region should not be interpreted as representative of such ratios for the industryas a whole. For example, a number of 8” fabs exist in Europe even though none appear in our sample.10
Using the same sample of semiconductor fabs as employed in this paper, Brown and Campbell (forthcoming) find that although technological change widens the skill gap between occupations and is biased toward employmentof high-skill workers, technological change does not lead to increased wage inequality in semiconductor fabs.11 The Data Appendix provides details of the weighting scheme.12 The score for the process engineer was eliminated from the equipment maintenance fab scores. Similarly, thescore for the equipment engineer was eliminated for the statistical process control fab score discussed below.13 In Figure 2 and Figure 4 below, the fabs are sorted within each wafer size by their line yield performance, with thehighest fabs in the chart achieving the highest line yields. Line yield was selected as the sort criterion, because it issignificantly correlated with the other quality performance metric (defect density) and one of the quantity performancemetrics (direct labor productivity). See Section IV for a presentation of the correlations and more details pertaining tothe performance metrics.14 The same weighting scheme was used for SPC activities as for equipment maintenance activities to derive the fabSPC scores (see Data Appendix).15 We also used factor analysis to group all the HR variables for training and job tasks, and then regressed theperformance metrics on the HR factors. We report only the regressions using the actual HR variables, because theseregressions had higher F-statistics and explained more of the variance in the regressions on defect density, line yield,and cycle time. They performed as well as the factor analysis for direct labor productivity and stepper throughput.16 See Leachman and Hodges (1996) for more information on the creation of these performance metrics by U.C.Berkeley’s Competitive Semiconductor Manufacturing team.17 This metric employs a widely used routine (the Murphy model) to convert actual die yield for each major processflow into a defect density score.18 The formula is computed for 5X steppers only, and is defined as (WS/D)(NS)(LY'), where WS is the averagenumber of wafer starts per week and is divided by the number of calendar days per week (D). NS is the number oflayers in the process flow, and LY' is an adjusted line yield.19 This metric measures the average amount of time it takes to complete all operations associated with a single layerof circuitry, accounting for processing time, lot waiting time, and lot movement time.20 The correlations discussed in the ensuing paragraphs exhibit a level of significance of 10% or better.21 See Brown (1997) for a discussion of the employment system variables and preliminary analysis of the HRsystems.22 When constructing the definitions of teams, we incorporated input from Edward E. Lawler, Marshall School ofBusiness, University of Southern California.23 These three categories (at least 75% of the people in the occupation, between 0 and 75%, and none) were thecategories that appeared on the written survey. The assignment of the 3, 1, 0 weights to these categories wasarbitrary. The weight of 3 for the “at least 75%” category slightly inflates the scores at the high end, but we decided toround up to 3 instead of assigning a weight of 2.33 that would have resulted from a ratio of the midpoints of the tworanges (87.5/37.5 = 2.33).