institutional change and the efficacy of monetary policy · institutional change and the efficacy...
TRANSCRIPT
BARRY BOSWORTH Brookings Institution
Institutional Change and the Efficacy of Monetary Policy
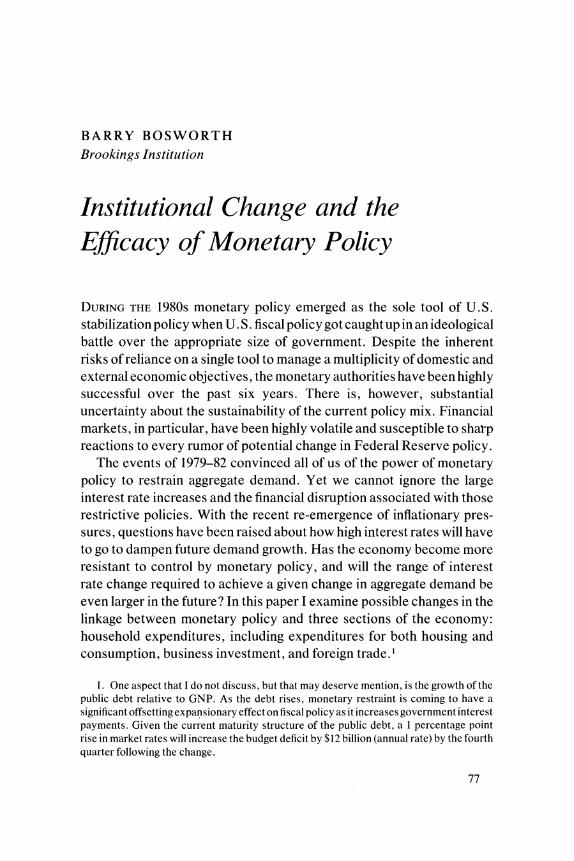
DURING THE 1980s monetary policy emerged as the sole tool of U.S. stabilization policy when U. S. fiscal policy got caught up in an ideological battle over the appropriate size of government. Despite the inherent risks of reliance on a single tool to manage a multiplicity of domestic and external economic objectives, the monetary authorities have been highly successful over the past six years. There is, however, substantial uncertainty about the sustainability of the current policy mix. Financial markets, in particular, have been highly volatile and susceptible to sharp reactions to every rumor of potential change in Federal Reserve policy.
The events of 1979-82 convinced all of us of the power of monetary policy to restrain aggregate demand. Yet we cannot ignore the large interest rate increases and the financial disruption associated with those restrictive policies. With the recent re-emergence of inflationary pres- sures, questions have been raised about how high interest rates will have to go to dampen future demand growth. Has the economy become more resistant to control by monetary policy, and will the range of interest rate change required to achieve a given change in aggregate demand be even larger in the future? In this paper I examine possible changes in the linkage between monetary policy and three sections of the economy: household expenditures, including expenditures for both housing and consumption, business investment, and foreign trade. I
1. One aspect that I do not discuss, but that may deserve mention, is the growth of the public debt relative to GNP. As the debt rises, monetary restraint is coming to have a significant offsetting expansionary effect on fiscal policy as it increases government interest payments. Given the current maturity structure of the public debt, a 1 percentage point rise in market rates will increase the budget deficit by $12 billion (annual rate) by the fourth quarter following the change.
77

78 Brookings Papers on Economic Activity, 1:1989
History is replete with examples of how markets change to soften the consequences of external disturbances and evade the objectives of regulators. Is it not likely that markets would also develop a defense against interest rate fluctuations? Housing finance, for example, has undergone a whole series of institutional reforms and systemic changes aimed at reducing the vulnerability of the industry to fluctuations in market interest rates. Among the changes are deposit rate deregulation, adjustable rate mortgages, and the growth of the market for mortgage- backed securities. Many analysts argue that these reforms have largely eliminated the quantity rationing of mortgage loans, believed to account for the heavy, short-term concentration of monetary restraint on housing in the past. In other areas, however, the evidence seems more mixed. The sharp reduction in marginal tax rates and restrictions on interest deductions should increase the sensitivity of consumers to interest rate changes. And the continual growth in reliance on debt finance by business hardly seems consistent with adoption of a more defensive financial strategy.
Finally, while it may be reasonable to argue that domestic changes have reduced the impact of monetary policy, the emergence of an active international capital market, with the potential for monetary policy to affect net trade flows through induced changes in exchange rates, would seem to be a contrary development of overwhelming importance. One need only go back to economic textbooks of the 1970s, with their minimal attention to the possibility of monetary policy influencing demand through exchange rates, to appreciate the change in the economic profession's perspective on the linkage between interest rates and aggregate demand. However, the emergence of trade flows as a big element in the linkage raises new issues about the strategy for conducting monetary policy. First, it is the differential between U.S. and foreign interest rates, rather than their level, that is most relevant for exchange rate determination. Thus, it becomes crucial to take account of the potential reaction in foreign financial markets to a change in U.S. policy. Second, econometric efforts to trace the linkages between changes in exchange rates, trade prices, and trade flows suggest that the adjustment process is subject to extremely long lags. Thus, the ability to influence trade flows is of limited value for short-run stabilization policy, and there may be an increased risk of over- or undershooting by the monetary policymakers.
Because the United States has not been subjected recently to severe

Barry Bosworth 79
monetary restraint, the analysis that follows is quite speculative and often indirect. Because of their reliance on historical relationships, existing econometric models are ill suited to the issues that I wish to examine. Quite apart from the inability of historically estimated models to capture developments during the 1980s that might change the effect of monetary policy, the models have never agreed on the quantitative importance of monetary policy, including the net aggregate demand effect of a change in monetary policy.2
Household Sector
Three institutional developments of the past decade have affected the response of households to interest rate changes. First, the growth of a large market for mortgage-backed securities and the removal of regula- tions placing a ceiling on deposit rates of the mortgage-lending institu- tions have largely eliminated quantity rationing in the home financing market. In past decades home buyers were often forced out of the housing market by the denial of credit. Today increased competition on the lender side means that price-interest rates-plays a larger role in balancing demand and supply. The inflow of funds into saving institutions no longer limits significantly the supply of mortgage funds since mortgage lenders can now repackage the mortgages for sale into an active diver- sified market for mortgage-backed securities.
Second, the growing use of adjustable rate mortgages, which now account for nearly half of newly issued home mortgage loans, has dampened the impact of interest rates on housing demand. Even though the expected life of adjustable rate mortgages is less than that of fixed rate mortgages, the ARM share of the outstanding stock of home mortgages has grown to about 25 percent, or $500 billion. This estimate includes $75-80 billion of home equity loans, nearly all of which have adjustable rates.3
2. Bryant, Holtham, and Hooper (1988, pp. 76-79); and Adams and Klein (1989). The latter study produced estimates of the slope of the IS curve for eight models of the U.S. economy that differed after four quarters by a factor of three.
3. These quantitative estimates are taken from Goodman, Luckett, and Wilcox (1988). ARMs are known to represent 40 percent of the mortgage assets of thrift institutions surveyed by the Federal Home Loan Bank Board, and they are increasingly common for mortgage-backed securities (mortgage pools), with outstanding issues of about $50 billion.

80 Brookings Papers on Economic Activity, 1:1989
In the past, some of the impact of monetary policy on the housing market may have resulted from the willingness of homebuyers to postpone their purchases until mortgage rates were lower. If so, that effect would be dampened now that homebuyers can act independently of their perception that current rates are temporarily too high by getting an adjustable rate mortgage without delaying the actual purchase of a house. In effect, homeowners now have the same option open to corporations of switching between long- and short-term credit without changing the timing of their actual purchase when they believe interest rates are abnormally high.4 In addition, whereas homebuyers may prefer a fixed rate, they will switch to an adjustable rate loan, particularly if it has an initial discount, as a way of continuing to qualify for a loan during a period of high interest rates.
Although the development of adjustable rate mortgages may cushion the impact of monetary policy on the housing market, the potential for interest cost increases on existing mortgages may heighten the effect of monetary policy on other expenditures of households. Borrowers with adjustable rate loans might be expected to hold a larger cushion of financial assets against the risk of a potential increase in their mortgage payments.5 The biggest potential impact, however, would result from the effects of liquidity constraints on borrowers. If young households, who are net debtors, are constrained in their ability to take on new debt, increases in interest rates may have a highly asymmetric effect on the expenditures of debtor and creditor households. An increase in interest costs would force credit-constrained households to reduce their cash expenditures on other items more than the expenditures of older creditor households are increased by the rise in interest income.
It is important, however, not to exaggerate the extent to which the
4. Many economists would argue that changes in long-term interest rates are, in fact, a random walk, but that does not prevent individual borrowers from thinking otherwise. Corporate short-term financing is strongly procyclical with respect to interest rate fluctuations. Households can be observed to do the same, although that behavior may reflect a response to the criteria for qualifying for long-term mortgages.
5. Mortgage loans with provisions for negative amortization-keeping constant the monthly payments while lengthening the repayment period as rates rise-remain uncom- mon. ARMs linked to the cost of funds index do adjust rates monthly so that there will be negative amortization if rates rise during a year. The loans are recomputed annually, however, to amortize the loan fully over its remaining term. Even within the year, the loans will be recomputed if the amount of negative amortization exceeds a threshold.
Barry Bosworth 81
interest rates on these loans are adjustable in response to changing market rates. While the rate on over 90 percent of ARMs is adjustable within 12 months, three-quarters of the loans limit the increase to no more than the equivalent of 2 percentage points a year, and 98 percent of the loans limit the increase over the life of the mortgage to 5 to 6 percentage points. In addition, these mortgages are issued with sizable initial rate discounts that averaged as high as 325 basis points in the fourth quarter of 1988-thus, the adjustment of the rate on a new mortgage is largely independent of market rate changes for the first two years. The one-year Treasury rate is the most commonly used base rate, but many loans are tied to an index of the average cost of funds for savings and loans that fluctuates less than the Treasury rate. Given the current stock of ARMs of $500 billion, the upper limit of change in interest payments would seem to be $10 billion after one year and $20 billion after two years. Even if mortgage holders reduced their other expenditures by the full amount and there was no change in outlays of the recipients of interest income, the impact would represent only 0.6 percent of total consumption. Thus, while these loans do provide lenders with some protection against a secular rise of market interest rates, the potential for large cyclical increases in the monthly mortgage payments of borrowers is still limited.
The third source of change is the 1986 revision of the income tax code that eliminated the deductibility of consumer interest payments and further reduced marginal income tax rates, lowering the value of the mortgage interest deduction. Both of these tax changes should have increased consumers' response to interest rate variations. While it is true that the consumer interest provision can be avoided by homeowners if they are willing to use home equity lines of credit as a substitute for installment debt, such practices have been limited to date.6 However, the tax deductibility of consumer interest will not be completely elimi- nated until 1991, and the home equity loan may require time to achieve acceptability.
The interest component of personal income is shown in table 1. Its
6. At the end of 1987 the stock of installment debt totaled $624 billion, compared with less than $100 billion in home equity loans, and many of the home equity loans appear to be a substitute for home improvement loans. A simple statistical correlation between changes in automotive credit loans and automobile purchases, for example, suggests that there has been no significant shift in this relationship since 1986.

82 Brookings Paper-s on Economic Activity, 1:1989
Table 1. Interest Income of Persons in the National Income and Product Accounts, Selected Years, 1960-87
Percent of personal income
Item 1960 1970 1980 1987
National accounts basis Personal interest income 6.1 8.3 12.0 13.9 Consumer interest payments 1.7 2.0 2.1 2.4
Net income 4.4 6.3 9.9 11.5
Cash flow basis Interest incomea 3.8 5.5 7.7 8.3 Interest paymentsb 3.4 4.0 5.5 6.7
Net income 0.4 1.5 2.2 1.6
Addenda Nonmonetary interest incomec 2.3 2.8 4.3 5.7 Mortgage interest payments (owner-occupied)d 1.7 2.0 3.4 4.3
Source: Survey of Clurrent Blusiniess (July 1988), tables 8.8, 8.9; and prior issues. a. Monetary interest receipts. b. Monetary consumer interest payments plus mortgage interest payments. c. Includes interest paid to private pension and life insurance plus services furnished without payment by financial
institutions, line 48 of table 8.8 of the national accounts. d. Lines 90 and 97 of table 8.9 of the national accounts.
share of total income, as computed in the national accounts, steadily increased from 6.1 percent in 1960 to 13.9 percent in 1987 (line 1). Consumer interest payments (mainly installment debt), treated in the national accounts as a separate item on the expenditure side, has increased from 1.7 percent to 2.4 percent of personal income (line 2). Thus, the household sector appears in the national accounts to be a large net recipient of interest income (line 3).
However, two important qualifications influence the actual cash flow of households. First, much of the interest income actually accrues to pension funds and life insurance accounts owned by households and is not immediately available for discretionary spending. The national accounts also include in interest income an imputation for the implicit interest that consumers earn on deposit-type accounts but receive in the form of reduced service charges. As shown in line 7 of table 1, these two components represented 41 percent of total interest income in 1987 (5.7/13.9).
Second, homeownership is treated as abusiness activity in the national accounts. Consumption expenditures include an imputation for the rent on owner-occupied housing; and after deductions for depreciation,
Barry Bosworth 83
mortgage interest, and property taxes, the residual income of the homeowner is added to personal income. Net rental income of home- owners is currently a negative number in the national accounts. Thus, mortgage interest payments are included in the expenses of the business sector rather than of households.
If we restructure the household accounts to exclude interest income not received as a cash receipt by households and include mortgage interest as a cash flow expense, the net interest income position of households is substantially reduced (line 6). The return on the remaining financial assets, however, is more sensitive to market interest rates than are interest rates paid on mortgage and consumer debt. One study found that a 100 basis-point increase in one-year Treasury yields was associated with a 25 basis-point increase in the return on interest-bearing assets of the household sector within one year, and 40 basis points within two years.7 Thus, the net interest income of households increases during periods of rising market interest rates.
Interest rate increases also generate capital losses for holders of long- term financial claims. However, the household sector is a net debtor in the long-term market. Long-term bonds are held largely by financial institutions, whereas households have 70 percent of their financial assets in deposit accounts, and home mortgage liabilities slightly exceed the value of all their credit market instruments. Thus, major financial capital gains or losses are mainly associated with any induced changes in the value of corporate stocks.
Many of the structural changes identified above were initiated before the 1979-81 round of monetary restraint; given the time it takes for such changes to spread through the system and come to maturity, however, it is reasonable to think that they will be far more important next time. Adjustable rate mortgages, in particular, were still uncommon in the early 1980s. While these changes are likely to have altered the channels through which monetary policy operates, the absence of significant monetary restraint in the United States over the past six years makes it impossible to reach any conclusion on the quantitative importance of those changes.
The approach taken in the following section is to look at the experience of Canada, which has had adjustable rate mortgage systems for many
7. Goodman, Luckett, and Wilcox (1988).

84 Brookings Papers on Economic Activity, 1:1989
years and which does not allow the deduction of interest expenses (mortgage and consumer credit) in the computation of income taxes. Canada would seem particularly well suited for a comparison with the United States because the two countries have had a similar history of economic fluctuations and monetary interest rates.
The Canadian Experience
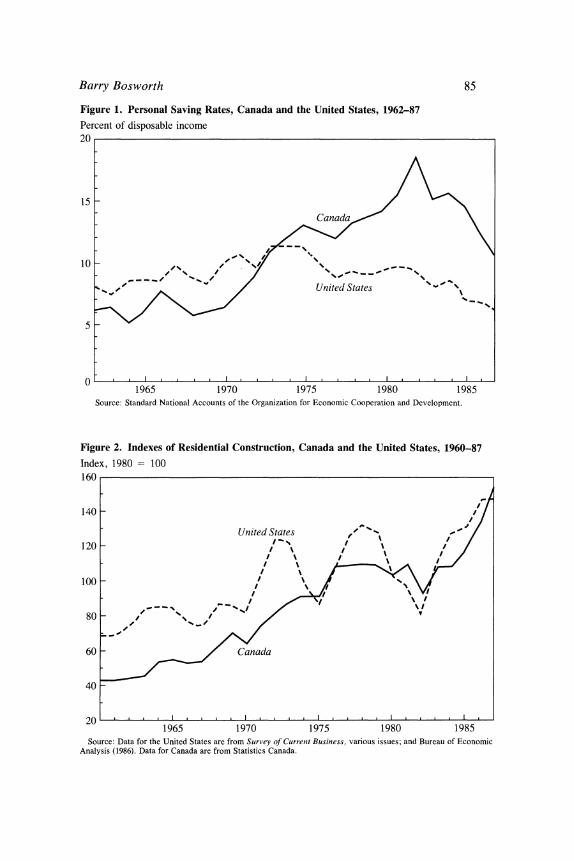
Despite the many obvious similarities between the economic choices faced by U.S. and Canadian households, the historical patterns of the personal saving rates in the two countries scarcely seem to represent the behavior of the same species (see figure 1). After several decades of running in parallel, the two saving rates began to diverge in the late 1960s when the Canadian saving rate soared upward. It rose again in the early 1980s, but has reversed and fallen sharply in the past five years. Meanwhile, the U.S. saving rate has exhibited greater stability at a lower level, with some tendency to decline since the mid-1970s. It is also evident, in figure 2, that residential construction in Canada has not been subject to the large fluctuations that are so characteristic of the United States.
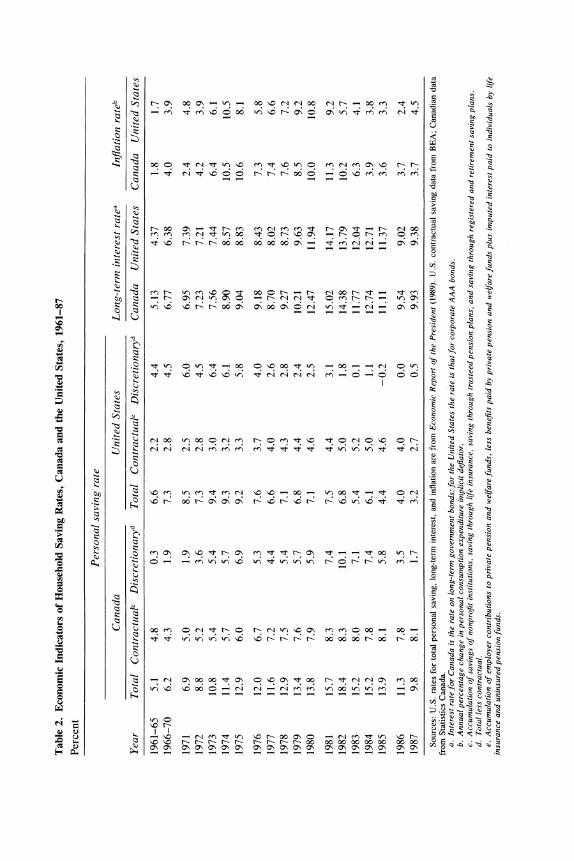
The similarity of interest rate movements and inflation in Canada and the United States is shown in table 2. In fact, given the lack of a tax deduction for interest expenses in Canada, Canadian households actually were faced with a larger swing in effective after-tax interest rates than were U.S. households. The rate of inflation of consumer prices was also somewhat higher in Canada than in the United States during the 1970s and early 1980s, but the two rates have converged in recent years. While mortgage interest rates are not shown in the table, they have fluctuated in tandem with other interest rates, with the rate in Canada averaging 1.5 percentage points above the U.S. rate.
Much of the difference in saving behavior is commonly attributed to differences in the tax treatment of saving-particularly the availability of generous tax exemptions in Canada for Investment Retirement Accounts following the overhaul of the tax system in the early 1970s.8 For both countries, however, it is possible to distinguish between contractual (private pension and retirement accounts) and discretionary saving. While contractual saving has increased in importance in both
8. A recent example is Carroll and Summers (1987).
Barry Bosworth 85
Figure 1. Personal Saving Rates, Canada and the United States, 1962-87
Percent of disposable income 20
10 | \ / < i / / ~~~~~~United States '
15
10
1965 1970 1975 1980 1985 Source: Standard National Accounts of the Organization for Economic Cooperation and Development.
Figure 2. Indexes of Residential Construction, Canada and the United States, 1960-87
Index, 1980 = 100 160
140 /
United States -%
120 -
100
60
60 - Canada
40 -
20 . l j 1965 1970 1975 1980 1985
Source: Data for the United States are from Survey of Currenit Business, various issues; and Bureau of Economic Analysis (1986). Data for Canada are from Statistics Canada.
sX l U l >: x o - Tz - y wO (N c\q x (^>] - - vo mP l c v t~~~~~~~~~~~~~~~~~~~~~~~~~~~~~~~~~C' .% e t e ? o oo m ? b oE o oE m t e e N t c t U~~~~~~~~~~~~~~~~~~~~~~~~~~~~~~~~~~~~~~C'
.o S ? U i~~~~~~~~~~~~~~~~~~~~~~~~~~~~~~~~~~~~~r ~~~~~~~~ 6 V 6V 4 t t~ 'o' w q E S >~~~~~~~~~~~~~~~~~~~~~~~~~~~~~~~~~~~~~r
s U oo o t N t m ? e t ? m o e N e oE ? b b u * t~~~~~~~~~~~~~~~~~~~~~~~~~~~~~~~~~~~~~~C' U t N t ? O O b b b 00 0 O ? e e e e r > tk~~~~~~~~~~~~~~~~~~~~~~~~~~~~~~~~~~~~~~~~~~~~~~~~~~~~~~~~~-,:
CsC t .
kr C) e Nt 00 "t O) C) ? 8bO e<'
X .% t ? b b b oo oo oo oo oo cr t e N N cn oe c 2 W~~~~~~~~t .t S z > <M R~~~~~~~~~~~~~~~~~~~~~~~~~~~~~~~~~~~~~~~~~~Z
g D o .t X~~~~~~~~~~~~~~~~~~~~~~~~~~~~~0 X~~~~~~~ 4 CN 4 4 gV~
> e b m e ? O t 00 0 b b N 00 b t t e 00 Q > X~~~~~~~~~~~~~~~~~~~~~~~~~~~~Z F 04 U b 08 N m 08 0 b N N t O e b b m 08 CN < t >~~~~~~~~~~~~~~~~~~~~~~~~~~~~~~~~~~~~~~~~~~~~~~~~~.t
l O t m ? ? b b 00 08 08 00 08 0 N m t N Ch 08 q o U v~~~~~~~~~~~~0
C n X i ~~~~~~~~~~~~~~~~~~~~~~~~~~~~~~~~~~~to* U: L X k ^ t~~~~~~~~~~~~~~~~~~~~~~~~~~~~~~~~~~~~~~~~~~~~~~~~~Z Q U < R ~~~~~~~~~~~~~~~~~~~~~~~~~~~~~~~~~to X
Ct .0 t m O m t o0 O ? oo t m 00 N O m Y < >~~~~~~~~~~~7 . = w X t t ? t ? ? m t N N N N e O o o o b , e t~~~~~~~~~~_ & .
; U R S < O t~~~~~~~~~~~~~~~~~ = ~ ~~~~~ 4 VU o~ VU V< 6 - 6r- 6r
em~~ ~~~~~~~~~~~~~~~~~~~~~~~~~~~~~~~~~~~~~~ m U o 1, -- X U *<d a-t ~~~~~~~~~~~~~~~~~~~~~~~~~~~~~~~~~~~~~~~~~~~~~~~~~~~~~~Et
Q 04 U ? e m e t e N ? ? 00 m 00 t t O N A tS Q
em .t F-oZ ? b oo b 08 oe oe b ? b ? b b ? m ? t t e rC 4 X 00 >~~~~~~~~~~~~~~~~~~~~q
=~~~~~~~~~~~~~~~~~~~~~~~ Q QSo
*5~ ~ ~ ~~~~~~~~~C CN CN CN CN .?- N Nc, l
Barry Bosworth 87
countries (see table 2) and by a larger amount in Canada, it is evident that the large swings in the Canadian saving rate are reflected in the more discretionary component. In an evaluation of the potential role of monetary policy, cyclical fluctuations are of more interest than the secular trend. From this perspective the notable feature of the Canadian tax system is the lack of a tax deduction for mortgage and consumer interest, a factor that might increase the marginal sensitivity of debt- financed expenditures to the interest rate.
The emphasis on adjustable rate mortgages began in Canada in the 1960s; by the beginning of this decade the dominant system was one in which the repayment of mortgage principal is amortized over twenty- five years, but the term of the loan contract varies between one and five years. Thus, borrowers can obtain a fixed rate for a maximum of five years, and there is no limit on the potential rate increase they may face upon renewal. During the early 1980s, when mortgage rates rose as high as 20 percent, borrowers did actively move toward shorter maturities in anticipation of future interest rate declines. Many got caught in an upward spiral of higher payments as they rolled over their loans for one- year periods only to be faced with even higher rates in subsequent years.
Thus, a major difference between the two countries is that in Canada changes in the new mortgage rate will translate relatively quickly into a higher effective rate on the outstanding stock of mortgages. Although Canada does not collect data on the stock of mortgages and interest payments for owner-occupied housing, the effective rate on all mortgages is, as expected, much more responsive to current market rates than it is in the United States. A statistical regression using annual data for the period after 1975, representing an era of a mature adjustable rate system, implies that nearly half of any change in the market rate will be reflected in the yield on the outstanding mortgage stock within two years. In contrast, a similar regression in the United States over the period 1960- 85, when adjustable rate mortgages were a small portion of the total stock, suggests a response of only about 15 percent.
CANADIAN HOUSING DEMAND. Our first expectation that a system of adjustable rate mortgage financing should reduce fluctuations in housing demand does seem borne out by the Canadian experience. As shown in figure 2, the year-to-year fluctuations in residential construction are substantially smaller in Canada than they are in the United States, and particularly so in tight money episodes such as 1974-75 and 1980-

88 Brookings Papers on Economic Activity, 1:1989
82. For example, residential construction in real terms in the United States fell 38 percent between 1979 and 1982. The equivalent decline in Canada was 16 percent-less than half, despite very similar movements in market interest rates. The standard deviation in the share of GNP devoted to residential construction was 0.43 in Canada during 1970-87, compared with 0.75 in the United States.9
Furthermore, the reduced fluctuation does appear to reflect a lower sensitivity to interest changes in Canada. Table 3 presents some regres- sions that relate the share of GNP devoted to residential construction to the differential between the short- and long-term interest rates and the level of the short rate. The interest rate differential is used to capture both the effects of financial disintermediation and the tendency of potential homebuyers to postpone purchases during relatively high interest rate periods. Both interest rate terms are significantly negative for the United States, and the coefficients appear to be stable across various subperiods. However, the interest rate coefficients for Canada are about half those of the United States, and if we exclude the early part of the data period, the coefficients on the interest rate differential become slightly positive and insignificant. This decline in the influence of the term structure of interest rates is precisely the effect that should emerge from an adjustable rate system.
The equation used for the United States also predicts a significant decline in construction activity in 1987-88; that the decline did not occur provides some weak evidence that the housing market has become more immune to interest rate changes. Certainly it is true that financial disintermediation-the outflow of deposit funds during high interest rate episodes-no longer seems to have any implication for housing demand. Insured savings and loans experienced a net outflow of new deposits in both 1987 and 1988, and the growth of deposits was less than the interest credited to existing accounts, yet overall mortgage lending and residen- tial construction continued at a rapid pace.
CANADIAN SAVING BEHAVIOR. The historical pattern of change in the Canadian saving rate, shown in figure 1, is certainly suggestive of a marked sensitivity of other expenditures-consumption-to changes in interest rates, something that is difficult to detect in the U.S. data. The saving rate, for example, rose sharply in both 1974-75 and 1981-82 when
9. The data for both countries display no evidence of a secular trend during 1970-87.

Barry Bosworth 89
Table 3. Comparative Interest Sensitivity of Canadian and U.S. Housing Demand, Selected Periods, 1965-87a
Canada United States
Independent variable 1965-87 1972-87 1965-87 1972-87
(IRIGNP)_ lb 0.52 0.29 0.50 0.34 (2.6) (1. 1) (4.9) (2.3)
(RS - RL)-IC -0.15 . . . -0.27 -0.24 (1.9) (5.1) (3.4)
RS-I 0.00 -0.08 -0.08 -0.12 (0.0) (2.6) (2.9) (2.4)
Constant 2.76 5.14 2.54 3.65 (2.1) (3.1) (4.1) (3.1)
Summary statistic Rj2 0.42 0.57 0.80 0.91 Standard error 0.38 0.35 0.34 0.26
Source: Author's calculations. Underlying U.S. data from Survey of Current Business, various issues, and BEA (1986). Canadian data from Statistics Canada.
a. The dependent variable is residential investment percentage share of GNP (constant prices). Numbers in parentheses are t-statistics.
b. Dependent variable lagged one pefiod. c. RS = three-month Treasury bill rate. RL = long-term bond rate (see table 2, note a).
interest rates surged. If Canadians were simply more responsive to the improved rate of return on saving, we would expect the saving rate to be most closely related to the real rate of interest. On the other hand, if some households are liquidity constrained and worry about the cash flow problems of meeting higher mortgage interest costs, their saving should be more responsive to nominal interest rate changes.'0 Thus, Canada should provide an opportunity to test the hypothesis that liquidity constraints are important by examining the relative influence of nominal and real interest rates.
The asymmetric tax treatment of interest income and interest expenses in Canada creates an additional reason for being concerned with nominal interest rates. In the United States before 1981 the income tax applied to net capital income, and individuals were allowed to deduct interest expenses. Canada, on the other hand, taxes gross capital income, and the absence of interest deductions imposes a large tax penalty on debt-financed expenditures that is a rising function of the nominal interest rate. In most cases it is not an important distinction for wealthy
10. Hendry and von Unger-Sternburg (1981).
0)
I o r- e0 e-. -r- -r- - ONONclclF
Y O N . . . . 0 0 oooUs
O % N I o. -v 00 d_ c l_ m O_ N O_ N O_ t 00 0 c
0 O. . O. O 0 o )
00
I E~ cl 1 - - r0 r-0
ON 4 _ _ ,, o .0
o 00 0 0 .
=~~~~.- Q.- O Om-Oe. l.-. OO Cl. 't0 0
'.. o- oe 0- 60oo-
X q I I < 0
._ U N b m 00 0 e 08 ? m 08 08 N Q = - 0 Q Q S E O
I -l e' 0 )Th00 t o r- -@Q.
0 B . : . . . . : E E E a Q Od 0~ or--- 00- 0
00~~~~~~~~~~~~~~~~~~ 04
Q ~ ~~ Ott- m 00 -- 00 0 :0 o. d .
E~~~ ~~ ~~~~~~~~~~~~~~~~~~~~~~~~~~~~~~~~~~~~~~~~~~~~~~~ C's :-;E 0 V
0) 1 0 .
0 0 0)r
0 Cl0r-~~~~~~~~~~~ 00(1(1 0) ~~~~~~~~~~~~~r 0
N-. ~ ~ ~ ~ ~ ~ ~ ~ ~ 0~~~~~0) 0. 101 ~
Barry Bosworth 91
individuals, who can sell financial assets to finance the purchase of a home, for example, but it is significant for middle-income individuals. 1I1
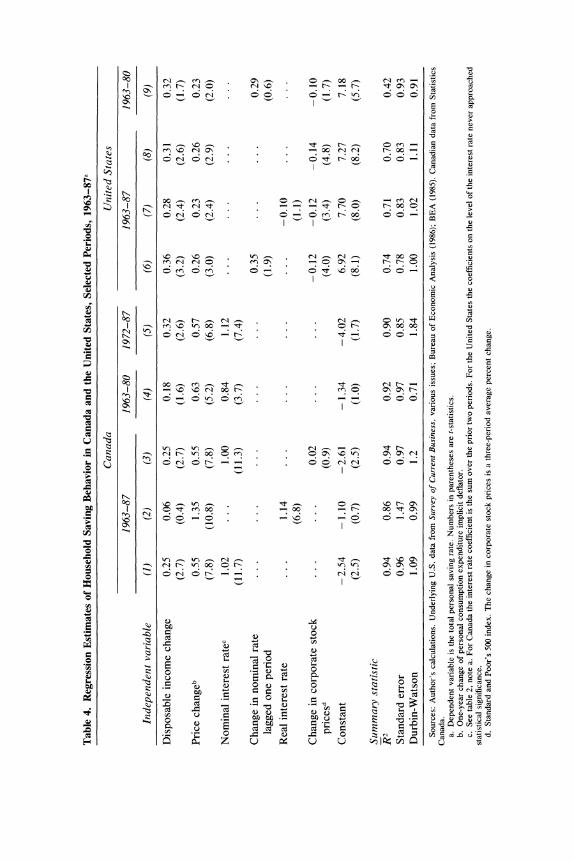
A simple illustration of the potential importance of these factors is provided by estimating a regression that relates the saving rate to changes in disposable income, the rate of interest, and the rate of consumer price inflation. The change in income is included to adjust for the pronounced difference between the short- and long-run marginal propensities to consume. The rate of price inflation is included to reflect three separate influences on saving. First, it is justified as an element in the concept of a real rate of interest, leading to the expectation of a coefficient opposite in sign to that on the nominal interest rate. Second, the national accounts do not adjust interest income for the inflation component that simply compensates recipients for the decline in the real value of their financial assets. Thus, saving, as an addition to real wealth, is reported at an artificially high level during periods of high inflation. This factor leads to an expectation of a positive coefficient on the inflation rate. Third, if households are influenced by liquidity constraints (cash flow), we should expect their behavior to be dominated by variations in nominal interest rates rather than a real rate that is adjusted for inflation.
Some alternative equations are reported in table 4. I experimented with both long- and short-term interest rates, and because the differences were trivial, only those equations with a long-term rate are reported. I also used both a centered moving average of the consumer price deflator to represent inflation and the one-year change. Again the differences were minor, and the one-year change is used for the reported equation. The real rate of interest is simply the nominal rate minus the rate of inflation with no adjustment for tax rates. With respect to lags I searched over the interval of zero to two periods and chose a one-period lag, the simplest form consistent with minimizing the standard error. 12
The basic result for Canada is shown in the first column. There is a highly significant positive correlation with the nominal interest rate in the prior two years, although there is no evidence of any effect in the first period. Second, the saving rate is positively correlated with infla- tion-not the negative effect that would be expected if the real rate was
11. Neither country includes the implicit income from home ownership or durable goods in the definition of taxable income.
12. All of the equations show weak evidence of autocorrelation in the residuals, but a correction has little influence on the reported coefficients.

92 Brookings Papers on Economic Activity, 1:1989
the major determinant of saving. This result is confirmed in column 2, where the use of a real interest rate results in a substantial increase in the standard error and an increase in the positive coefficient on the inflation rate. In addition, the results are largely unaffected by excluding data for the 1980s (see column 4) or the period before 1972, when retirement accounts become important in Canada (column 5).13
Comparable equations for the United States are shown in columns 6 through 8. There was no evidence of a significant correlation of saving with the level of either the nominal or real rate of interest. Instead, fluctuations in stock market prices appear to play a prominent role; and, if they are included, there is some weak evidence that the prior period's change in the nominal interest rate is positively correlated with saving. As shown in column 9, however, this result is not at all robust with respect to changes in the period of estimation. In no case was it possible to obtain a significant positive coefficient for the real interest rate in the United States. Furthermore, the change in neither the American nor the Canadian stock market prices appears to have any significant effect on the Canadian saving rate.)4
Some further evidence of the different factors motivating Canadian and U.S. saving behavior is provided by examining the allocation of saving between tangible assets, financial assets, and financial liabilities. As shown in figure 3, the large increase in Canadian saving during 1978- 82 was reflected in a sharp decline in the accumulation of financial liabilities rather than an increase in tangible or financial assets. This is consistent with the view that the combination of tax penalties on interest payments and a greater exposure to interest rate fluctuations stimulates efforts to reduce debt during periods of rising interest rates. If it were taxes alone, the change in financial liabilities would be expected to be a lower ratio to disposable income than it is in the United States over the
13. The retirement accounts do seem to have significantly affected the level of the saving rate, shifting the constant term; but the marginal coefficient on the interest rate was unaffected. After 1972 the share of income devoted to Registered Retirement Saving Plans is largely free of trend.
14. The importance of stock market fluctuations in the United States does suggest a possible indirect role for interest rates in altering consumption since higher interest rates do reduce stock prices. However, fluctuations in the stock market reflect changes in both the expected value of the future income stream and changes in the discount rate used to convert that income stream to a current market value. It is not at all clear that changes in market value due solely to changes in the discount rate should alter current consumption.
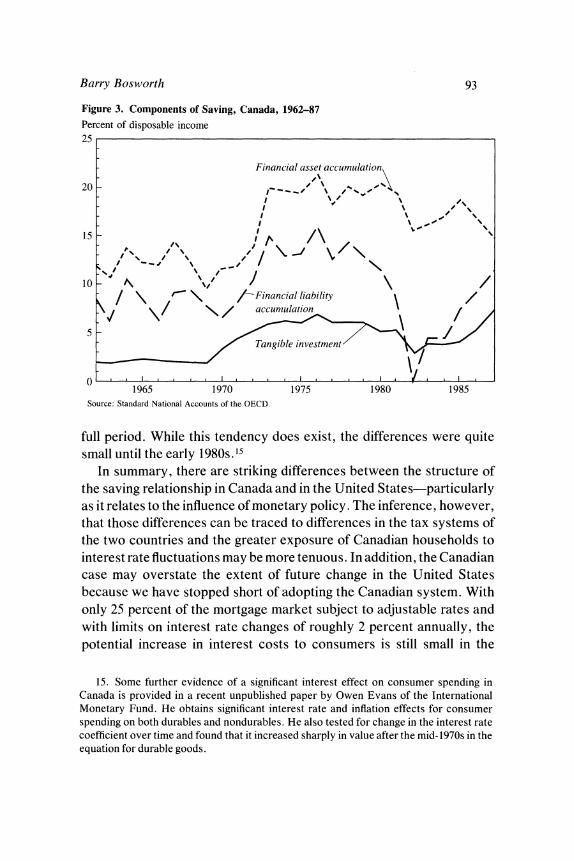
Barry Bosworth 93
Figure 3. Components of Saving, Canada, 1962-87
Percent of disposable income 25
Financial asset accumulation
20
0 I 0 / s__@/ \\\ / \ /
; / \ \
/~~~~~Financial liability /
s k / \/ \ / I ' 4/ \
15
FTangiale investmen
/ 1965 1970 1975 1980 1985
Source: Standard National Accounts of the OECD.
full period. While this tendency does exist, the differences were quite small until the early 1980s. 15
In summary, there are striking differences between the structure of the saving relationship in Canada and in the United States-particularly as it relates to the influence of monetary policy. The inference, however, that those differences can be traced to differences in the tax systems of the two countries and the greater exposure of Canadian households to interest rate fluctuations may be more tenuous. In addition, the Canadian case may overstate the extent of future change in the United States because we have stopped short of adopting the Canadian system. With only 25 percent of the mortgage market subject to adjustable rates and with limits on interest rate changes of roughly 2 percent annually, the potential increase in interest costs to consumers is still small in the
15. Some further evidence of a significant interest effect on consumer spending in Canada is provided in a recent unpublished paper by Owen Evans of the International Monetary Fund. He obtains significant interest rate and inflation effects for consumer spending on both durables and nondurables. He also tested for change in the interest rate coefficient over time and found that it increased sharply in value after the mid-1970s in the equation for durable goods.
94 Brookings Papers on Economic Activity, 1:1989
aggregate-$10-15 billion. A restrictive monetary policy, sustained over several years, could affect severely those individual households with adjustable rate mortgages, but the aggregate implications are limited. 16
Given that ARMs are about 50 percent of the market for new mortgages, their importance will grow in the future.
Business Investment
Many econometric models incorporate a strong linkage between interest rates and business investment. While the lags are longer than for housing investment, the response of business investment is critical to the evaluation of the impact of monetary policy in the second and subsequent years following a policy change. The econometric studies, however, have never been able to achieve a consensus on the importance of financing costs in investment behavior despite a voluminous literature on that subject. Before 1980 much of the disagreement over the influence of monetary factors on investment could be traced to the lack of sufficient variation in real rates of interest against which to test the alternative hypotheses. Although nominal interest rates varied over time, the different methods of adjusting them for inflation expectations and the measurement of the cost of capital were sufficiently ambiguous to render the tests inconclusive.
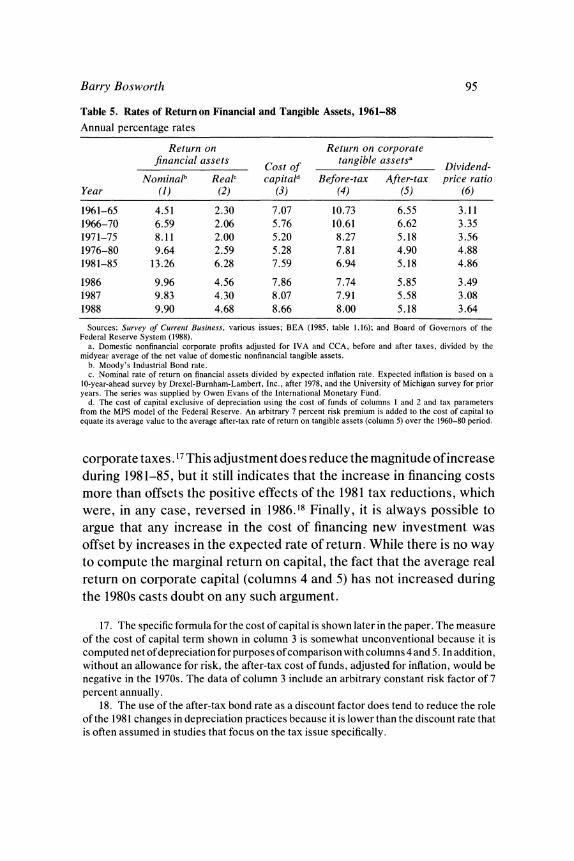
That situation might have been expected to change in the 1980s, with real interest rates extremely high by anyone's measure. Table 5, column 1, shows historical trends in nominal bond rates; column 2 shows a measure of the real rate that incorporates the results of a survey of investors' long-term inflation expectations. Column 3 adjusts for the effects of changes in the tax law by imbedding the real interest rate in a standard cost of capital formulation that takes explicit account of
16. Originally, I intended to include Great Britain, which also relies on adjustable rate mortgages. However, for much of the relevant period Great Britain allowed the building societies to act as a monopoly in the setting of rates and severely limited competition from other institutions. The result was that mortgage rates were set with a heavy emphasis on the interests of existing borrowers and there was extensive quantity rationing in the new loan market. Thus, Great Britain did not represent an example of an open competitive market for home finance.
Barry Bosworth 95
Table 5. Rates of Return on Financial and Tangible Assets, 1961-88 Annual percentage rates
Return on Return on corporate financial assets Cost of tangible assetsa Dividend-
Nominalb Realc capitald Before-tax After-tax price ratio Year (1) (2) (3) (4) (5) (6)
1961-65 4.51 2.30 7.07 10.73 6.55 3.11 1966-70 6.59 2.06 5.76 10.61 6.62 3.35 1971-75 8.11 2.00 5.20 8.27 5.18 3.56 1976-80 9.64 2.59 5.28 7.81 4.90 4.88 1981-85 13.26 6.28 7.59 6.94 5.18 4.86
1986 9.96 4.56 7.86 7.74 5.85 3.49 1987 9.83 4.30 8.07 7.91 5.58 3.08 1988 9.90 4.68 8.66 8.00 5.18 3.64
Sources: Survey of Current Business, various issues; BEA (1985, table 1.16); and Board of Governors of the Federal Reserve System (1988).
a. Domestic nonfinancial corporate profits adjusted for IVA and CCA, before and after taxes, divided by the midyear average of the net value of domestic nonfinancial tangible assets.
b. Moody's Industrial Bond rate. c. Nominal rate of return on financial assets divided by expected inflation rate. Expected inflation is based on a
10-year-ahead survey by Drexel-Burnham-Lambert, Inc., after 1978, and the University of Michigan survey for prior years. The series was supplied by Owen Evans of the International Monetary Fund.
d. The cost of capital exclusive of depreciation using the cost of funds of columns I and 2 and tax parameters from the MPS model of the Federal Reserve. An arbitrary 7 percent risk premium is added to the cost of capital to equate its average value to the average after-tax rate of return on tangible assets (column 5) over the 1960-80 period.
corporate taxes. 17 This adjustment does reduce the magnitude of increase during 1981-85, but it still indicates that the increase in financing costs more than offsets the positive effects of the 1981 tax reductions, which were, in any case, reversed in 1986.18 Finally, it is always possible to argue that any increase in the cost of financing new investment was offset by increases in the expected rate of return. While there is no way to compute the marginal return on capital, the fact that the average real return on corporate capital (columns 4 and 5) has not increased during the 1980s casts doubt on any such argument.
17. The specific formula for the cost of capital is shown later in the paper. The measure of the cost of capital term shown in column 3 is somewhat unconventional because it is computed net of depreciation for purposes of comparison with columns 4 and 5. In addition, without an allowance for risk, the after-tax cost of funds, adjusted for inflation, would be negative in the 1970s. The data of column 3 include an arbitrary constant risk factor of 7 percent annually.
18. The use of the after-tax bond rate as a discount factor does tend to reduce the role of the 1981 changes in depreciation practices because it is lower than the discount rate that is often assumed in studies that focus on the tax issue specifically.
96 Brookings Papers on Economic Activity, 1:1989
Clearly, there has been a large reduction in the margin between the rates of return on physical and financial assets. The real cost of debt finance increased by 2 to 4 percentage points in the 1980s with no evidence of an offsetting increase in the return on tangible capital. Thus, it might be argued that the 1980s have provided a strong test of the hypothesis that variations in financing costs can alter investment in a major way. But nothing is ever that simple. Events of the 1980s seem to have so divided economists that they no longer agree even on whether investment demand has been strong or weak. Supporters of the admin- istration are often quoted as pointing to an investment boom after the 1981 tax changes, while other economists argue that investment has been declining as a share of national income. Agreement on the effects of changes in the tax law and the cost of funds is next to impossible without agreement on the direction of change in the variable they are supposed to affect.
The disagreement over recent trends in investment centers on the use of two alternative measures of investment performance: gross and net investment. The share of gross domestic product devoted to gross business investment (1982 prices) was 12.3 percent in 1988, well above the level of the 1970s, while the net investment rate (gross investment less depreciation) fell to a level less than half that of the late 1970s (see the top panel of figure 4). This dramatic divergence between two highly acceptable measures of investment results from the growth of expendi- tures on office computers and the way that those expenditures are adjusted for price changes in the national accounts. In constant 1982 prices all of the growth in business investment between 1979 and 1988 is more than accounted for by increased expenditures for office computing equipment-the total of all other forms of investment is below the level of 1979 in absolute amount. Nominal outlays on office equipment have grown substantially, from $14.5 billion in 1979 to $40 billion in 1988, but in constant 1982 prices the increase has been eightfold because the relative price of computers as measured by the fixed weight index has fallen to only 15 percent of its 1979 value. Thus, even if nominal outlays had remained a constant share of GDP, the constant dollar share would have increased by a factor of six.
The rapid fall in computer prices reflects in large part their rapid rate of obsolescence in the face of technical change-thus depreciation charges have grown apace. As a result, net additions to the capital stock

Barry Bosworth 97
Figure 4. Trends in Business Investment, United States, 1960-88 Percent 14
Gross and net nonresidential investment
12 G ross investment as percent of GDP (1982 dollars)
10
Gross investment as percent of GDP 8 -
6 Net investment as percent of NDP (1982 dollars)
4
2 -Net investment as percent of NDP
1965 1970 1975 1980 1985
Percent 10
Components of business investment (1982 prices)
8 Total equipment ,, ,^
6 - ,S' Excluding office computing
2 L ~~~~~~~~Excluding miningXX 2
1965 1970 1975 1980 1985 Source: Siurvey of Currenit Business, various issues; and BEA (1986).

98 Brookings Papers on Economic Activity, 1:1989
are affected much less by the divergence of relative prices, and it matters little whether the investment rate is measured in current or constant prices. 19
The importance of outlays on office equipment is highlighted explicitly in the lower panel of figure 4.20 Expenditures on producers' durable equipment other than office equipment have fallen dramatically in the 1980s. The interpretation of trends in investment during the 1980s is further complicated by the sharp upsurge of oil well drilling after 1979 and its collapse in 1986. Adjusted for both of these factors, the rate of accumulation of other forms of capital has declined rather steadily throughout the 1980s, a pattern more in accord with the argument that, despite a reduction in taxes, high real interest rates have crowded out some domestic investment.21
The treatment of computers also complicates the interpretation of change during the 1980s in the basic determinants of investment as they are commonly measured in the empirical studies. Many econometric models rely on the concept of the cost of capital to measure the effects of changes in interest rates, taxes, and relative prices; and they use that measure to specify an optimal capital-output ratio, V. Investment is then modeled as adjusting gradually to changes in V and expected future output, Q*. A general theoretical model of this type would be:
K*= V.Q*,
V = -, and c
c = -(d + i - p)
19. The overstatement of computers in the constant dollar estimates will continue to grow as we move away from the base year of 1982 for the fixed-weight indexes. Fixed weights do not work well when there are major changes in relative prices combined with large changes in relative quantities, precisely the situation for computers. One solution would be to change the weights more frequently and link series with different base weights to form a continuous series, but such a measure is hard for the uninitiated to understand because the total is no longer the sum of its components.
20. It is worth noting that the 1981 tax changes did not change the treatment of office computers.
21. The shift toward computers can be viewed as a continuation of a longer-term trend toward shorter-lived capital. That trend implies that indexes of gross investment are becoming increasingly inaccurate proxies for measuring the rate of capital accumulation. On the other hand, the Bureau of Labor Statistics adjusts for changes in service lives in
Barry Bosworth 99
where
Pk = the price of capital, Pq = the price of output,
d = the rate of depreciation, i = the nominal after-tax cost of funds,
p = the expected change in Pk, and
t = a complex term that takes account of all changes in the tax treatment of investment.
In empirical formulations, some compromises are made with this theoretical model. Surprisingly, these formulations imply a large increase in the optimal capital-output ratio, V, during the 1980s despite the rise in the real interest rate. The MPS model of the Federal Reserve, for example, obtains an increase of 12 percent in the desired stock of equipment between 1979 and 1988. That increase can be traced directly to a large decline in the relative price of capital as measured in the national accounts. The implicit price deflator for producers' durable equipment, which incorporates computers, has fallen 20 percent relative to the output price index since 1979-an implied increase in the optimal stock of capital that is about three times larger than the increase associated with the 1981 reductions in business taxes.
The empirical formulations, however, ignore the associated rise in the depreciation rate, d, implied by the shorter service life of computers; and they typically use the expected increase in output prices rather than the price of capital to compute the real rate of interest, i - p. Yet, from the perspective of a purchaser of capital it is the expected change in capital goods prices, not the general rate of inflation, that is relevant. Currently, the treatment of computers in the national accounts reduces the rate of price increase for overall business equipment by 1-2 percent annually; thus, the appropriate measure of the real interest rate would be correspondingly higher than that shown in table 5. The combination of an increased rate of depreciation and a lower expected rate of price change would have offset much of the increase in V that resulted from the change in relative prices.
computing its measures of multifactor productivity in U. S. industry: a shift toward shorter- lived capital raises an index of capital services relative to an index of the capital stock itself.
100 Brookings Papers on Economic Activity, 1:1989
Furthermore there is little agreement on how to measure the cost of funds, i. One approach is to assume that firms equalize the cost of using different sources of funds at the margin and to employ the after-tax cost of borrowing plus a risk premium to approximate changes in the cost of funds. If the risk premium is assumed to be relatively constant over time, the real cost of funds, i - p, has increased in line with the measure shown in column 3 of table 5 because the decline in price inflation has not been fully reflected in lower nominal interest rates. On the other hand, many econometric studies of investment use a weighted average of bond rates and the dividend-price ratio, shown in column 6 of table 5, to measure the cost of funds, and argue that the decline in the latter has offset much of the increase in real interest rates. The MPS model of the Federal Reserve, for example, currently assigns a weight of 90 percent to the dividend-price ratio, leaving little room for a direct effect of interest rates on investment.
In summary, the 1980s have done far less than one might expect to resolve the debate over the effect of monetary policy on investment. However, while the treatment of computer investment in the national accounts raises complex issues for measuring productivity growth, the expansion of such outlays in the 1980s is rather meaningless for stabili- zation policy. The increase in the volume of investment absorbed very little employment-it was due to huge increases in the productivity of the computer industry-and, when converted back to current dollars, it generated very little income. Outlays on office computing equipment totaled only $40 billion in 1988. If we set aside the share of output devoted to computers, investment did decline substantially on both a net and gross basis, despite the benefits of a long expansion of total demand. That outcome seems consistent with the view that high real interest rates do crowd out some domestic investment, although the magnitude may be less than some of the high estimates of the 1970s.22
It is sometimes argued that the growth of corporate debt in recent
22. Models that do incorporate a major role for the cost of capital commonly do so within a formulation that also implies very long lags. The model used by Data Resources, Inc., and the MPS model of the Federal Reserve both include a strong effect of changes in the cost of capital in investment decisions, an elasticity of substitution of unity; but the mean lag exceeds three years. This is not critical for the debate over tax policy where the focus is on the long run, but the lags do severely limit the usefulness of the link to investment for stabilization policy.

Barry Bosworth 101
years has increased the vulnerability of corporations to a sharp rise in market interest rates and that business investment will thus be more sensitive to monetary policy in the future. An earlier study in the Brookings Papers did conclude that there has been some increase in the ratio of corporate debt to assets in recent years and that the ratio of cash flow to interest payments-interest coverage-has deteriorated during the 1980s, particularly for firms at the extreme end of the distribution of firms ranked by reliance on debt.23 However, it is not evident that the increased debt has reached the point at which it has major implications for aggregate investment behavior. The decline in the coverage ratio is a reflection of a long-term trend that was far more dramatic in earlier decades: for nonfinancial corporations the ratio of gross cash flow net of taxes and dividends to net interest payments stood at 12.3 in 1959, 5.6 in 1969, 5.2 in 1979, and 4.0 in 1988. In addition, 60 percent of the debt is in long-term instruments for which the cost is only marginally affected by short-run changes in market interest rates: and nonfinancial corpo- rations have actually increased the ratio of liquid assets to short-term debt in the 1980s. The greater reliance on junk bond financing may raise the risk of bankruptcy for firms at the extreme end of the distribution, but there is no strong argument for assuming that it will greatly alter the response of investment to monetary policy in the future. This seems particularly true in light of the limited evidence that financial structure has a major role in the investment decision.
Foreign Trade
The expansion of international capital markets during the past decade has greatly increased the potential importance of exchange rates as a channel through which monetary policy affects the economy. Yet the inability to anticipate the quantitative magnitude of that linkage in the early 1980s is also a vivid example of the uncertainties that must surround any estimate of the future effects of policy.
In recent years a great deal of research has been undertaken to quantify the linkages between monetary policy and the trade balance. That research has emphasized three elements: the response of the
23. Bernanke and Campbell (1988).

102 Brookings Papers on Economic Activity, 1:1989
exchange rate to changes in interest rates, the response of trade prices to changes in the exchange rate, and the response of exports and imports to changes in prices. Researchers agree that differences between interest rates at home and abroad have a strong impact on the exchange rate, but the complexity of dealing with expectations and the response of the monetary authorities in other countries makes it difficult to reach any consensus on the size of the impact. Estimates of the change in the exchange rate that would follow from a widening of the differential on long-term bonds are in the range of 5-15 percent.24
A greater degree of consensus has emerged with respect to the response of trade and trade prices to changes in exchange rates. Esti- mates of the price elasticity of goods imports and exports have been consistently in the range of unity, and those estimates seem stable over time. Some disagreement remains about the precise size of the change in trade prices that will follow from a change in the exchange rate. Significantly, all the studies agree that the lags in the response of trade are very long, extending over several years, and that there is little or no response in the first few quarters. In fact several studies find a perverse effect on the nominal trade balance for several quarters after an exchange rate change. On the whole, they conclude that the biggest surprise in the 1980s was in the failure to anticipate the size of change in the real exchange rate itself, rather than in the response of trade to that change.
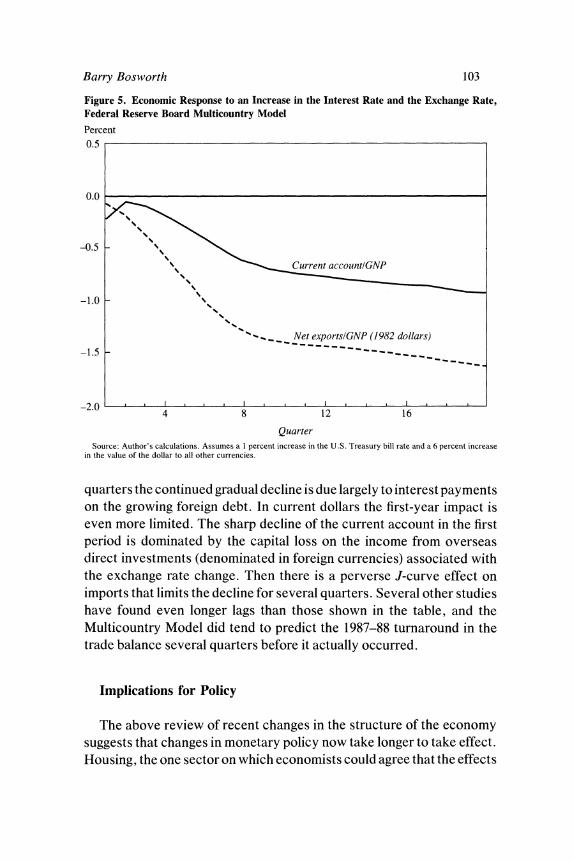
An illustration of the structure of the lagged response of the real trade balance and the current account to a 1 percentage point change in the U. S. Treasury bill rate and an associated 6 percent change in the exchange rate is shown in figure 5 by quarters following the change for the trade sector of the Federal Reserve's Multicountry Model.25 This is purposely a partial-equilibrium simulation that is intended to focus on the lag between a policy change and its impact on the general economy. It excludes the induced effect on domestic incomes and prices, and the potential feedback from the rest of the world. For comparison purposes, the impact of a change in fiscal policy, ignoring the decision lag, is felt within one period.
As can be seen, it requires about eight quarters for a change in the real exchange rate to fully affect trade prices and quantities. After eight
24. The basic model is outlined in Sachs (1988, pp. 655-59); but the limited amount of historical data has resulted in widely varying estimates of the precise magnitude of the response. For an example of the diversity, see Bryant, Holtham, and Hooper (1988).
25. The basic model is outlined in Helkie and Hooper (1988).
Barry Bosworth 103
Figure 5. Economic Response to an Increase in the Interest Rate and the Exchange Rate, Federal Reserve Board Multicountry Model
Percent 0.5
0.0
-0.5
Current account/GNP
-1.0
"^_ Net exportsIGNP (1982 dollars) -1.5
-2.0 . . l 4 8 12 16
Quarter Source: Author's calculations. Assumes a I percent increase in the U.S. Treasury bill rate and a 6 percent increase
in the value of the dollar to all other currencies.
quarters the continued gradual decline is due largely to interest payments on the growing foreign debt. In current dollars the first-year impact is even more limited. The sharp decline of the current account in the first period is dominated by the capital loss on the income from overseas direct investments (denominated in foreign currencies) associated with the exchange rate change. Then there is a perverse J-curve effect on imports that limits the decline for several quarters. Several other studies have found even longer lags than those shown in the table, and the Multicountry Model did tend to predict the 1987-88 turnaround in the trade balance several quarters before it actually occurred.
Implications for Policy
The above review of recent changes in the structure of the economy suggests that changes in monetary policy now take longer to take effect. Housing, the one sector on which economists could agree that the effects

104 Brookings Papers on Economic Activity, 1:1989
of monetary policy were immediate and strong, is now somewhat less affected by interest rates. The offsetting increase in the effect of monetary policy in the trade sector is small in the short run and takes place over a number of years. The effect on consumer spending, however, may be greater.
More important, existing quantitative estimates of the potential im- pact of monetary policy are themselves highly uncertain, and the recent systemic changes make their dependability as a guide for the future that much more questionable. Predicting the future from past responses to episodes of monetary restraint may never be prudent: over the past few decades each new episode has confounded much of the established view and kept the profession busy for several years explaining the new surprise. But the problem would seem to be particularly severe this time because the institutional change is so profound.26
How should policy respond to these changes? One view, espoused by Milton Friedman, is that because the lags are long and variable, the best policy is one that makes no effort to adjust to current economic conditions.27 Many other economists, however, hold to the hope that an activist policy that responds to the current and expected state of the economy could do better. Should a lengthening of the lags alter the balance of this debate or the approach to the policy decision that a member of the activist school would urge the monetary authorities to adopt?
First, the issue of active as against passive policies should be distin- guished from an associated debate about policy rules as against discre- tion, which has dominated much of the discussion. For an activist policy, one that responds to current economic conditions, there can be activist rules: one example is automatic stabilizers, such as unemployment insurance. The debate over rules as against discretion is more concerned with the effect of policy on economic agents' expectations. And perhaps there is some consensus that if we knew the structure of the economy sufficiently well to derive an optimal policy and if we were confident that
26. Existing estimates would be highly uncertain even without introducing the issue of systemic change. One need only read the previously referenced articles comparing the structure of the various econometric models to be struck by the enormous diversity of the policy multipliers. Over the past decade the tendency has been for these models to diverge rather than converge toward a common view of the efficacy of monetary policy.
27. Friedman (1959).

Barry Bosworth 105
the structure would not change, it would be better to formulate the policy in terms of a rule rather than relying on discretion.28
A point of departure for the issue of activist policy is provided by a set of old but insightful articles by A. W. Phillips.29 He distinguished three forms of stabilization policy: proportionate, integral, and derivative stabilizers. With a proportionate stabilizer the policy response is pro- portionate to the departure of the target (for example, GNP) from its desired value in the current period; an integral stabilizer responds to the cumulative sum of past departures; and a derivative stabilizer responds to its rate of change. Phillips argued that an optimal policy mix requires all three because, while a proportionate stabilizer will reduce the gap between the actual and desired outcomes, an integral stabilizer is required to close the gap completely, and a derivative stabilizer is required to reduce the tendency of the first two to introduce oscillations. In his 1957 article Phillips concluded that lags in the policy response greatly complicate the choice of an optimal combination of the policies; but, in general, the existence of lags called for a more cautious policy that reduced the role of the proportionate and integral policy responses and increased that of derivative stabilizers.
This formulation still has relevance to today's debate over the appropriate response to renewed threats of inflation. The administration often displays a proportionate policy response by being content to wait for inflation to re-emerge before supporting a shift of policy. The Federal Reserve, like a derivative stabilizer, is more concerned about the direction of change and what it perceives as evidence of accelerating inflation. A concern with rates of change is evident in Federal Reserve behavior that is sometimes described as "leaning against the wind."
Another important distinction is between the concept of a distributed lag response to a policy change and a delayed response. The existence of delay is a very serious problem for policymakers because they may be simply powerless to respond in a timely fashion to disturbances as they develop, and by attempting to respond they may be induced to overreact, in the mistaken notion that past actions had no effect. One need only imagine driving an automobile that responded to turns of the steering wheel only after a long delay to understand the increased
28. Kydland and Prescott (1977). A summary of the subsequent literature is provided in Fischer (1988).
29. Phillips (1954 and 1957).

106 Brookings Papers on Economic Activity, 1:1989
complexity of the control problem. As Phillips reported, once one introduces a delay, even reliance on derivative stabilizers can fail to prevent the system from oscillating into instability. In economic policy the concept of an "inside lag"- the time between a disturbance and enactment of a policy change-is an example of delay; and, in the case of fiscal policy, it is probably sufficient to rule out the use of such policy changes except in unusually severe disturbances.
The existence of a distributed lag response, taken by itself, would seem to be a less serious problem. As long as the policymaker is free to vary the control variable in each period, a disturbance that arises out of past changes in policy is largely indistinguishable from any other. Lags in the policy response raise problems similar to those encountered in any system in which the endogenous process being controlled incorpo- rates a lag process. The main concerns raised by lags are the potential for increased volatility of the control variable and the increased risk of introducing oscillations.
In practice, the concepts of delay and distributed-lag responses are often confused because an increased lag is thought of as implying a reduced response of the economy to policy change in the current period. It is perhaps clearer to say that we should be concerned with the shape of the lag over time and not just its average length. The policymaker could attempt to overcome some of the problems of a delayed or weak initial effect by finding some way to forecast changes in the target variable or by finding a reliable early indicator of its changes. These two approaches are not quite equivalent. By definition, the early indicator may provide information about future disturbances, but it can provide no information about the future effects of current policy change. On the other hand, econometric models may have some value in quantifying the future effects of today's policy, but they have been less successful in forecasting the disturbances themselves. Hence policymakers have relied on a combination of intermediate indicators and the projections of econometric models.
Extensions of Phillips's analysis by William Brainard, J. Phillip Cooper, and Stanley Fischer suggest that an emphasis on derivative stabilizers may be less useful in a stochastic situation where the lags are variable.30 Basically, the introduction of a stochastic element raises the
30. Brainard (1967); Fischer and Cooper (1973). See also Cooper and Fischer (1972a and 1972b). The first article by Fischer and Cooper provides a summary of prior research.
Barry Bosworth 107
risk of false signals for a policy that focuses on the rate of change. It creates an argument for a less aggressive use of stabilization policy- one is forced to accept larger departures of the target variable from its desired level. Cooper and Fisher developed a model of a certain world in which long lags were stabilizing and suggestive of a more active stabilization policy, but the lengthening of the policy lag reduced the efficiency of stabilization policy in a stochastic version of the model. The result of analysis such as that of Fischer and Cooper tends to be highly model-specific, but the analysis is interesting in arguing that the problem of uncertainty about the lag structure is more important than the length of the lag itself.3'
The problem of lags does take on greater significance if variability in the control variable (that is, money supply or interest rates) is a serious concern. A small initial response implies that the change in the control variable required to achieve a given change in the target becomes large. If the control variable itself, or a closely associated variable, is an important element in private decisionmaking, its increased variability may reduce the efficiency of the system.32
In the present context it is the reduced impact of monetary policy on the housing market that should be of primary interest. In the past a tightening of monetary policy was reflected within a few quarters in a lower level of housing starts, and many econometric models imply that the peak effect is reached early in the second year. It was the decline of housing production that accounted for the overwhelming proportion of monetary restraint in 1979-81; other elements of demand declined, but primarily through the induced multiplier process lowering output and income. A lower interest elasticity of housing implies a more steeply sloped IS curve, a larger aggregate demand response to real disturbances, and a reduced ability to control fluctuations except at the cost of a wider range of fluctuation in interest rates.
The effects of the increased role of the international sector are more ambivalent. First, the greater potential for the exchange rate to move in tandem with the interest rate increases the stability of the basic system over an intermediate period. Domestic anti-inflation policy is also
31. Their analysis is restricted to a first-order difference equation representation of the basic system being controlled. They do not explore the control of a system that is itself subject to oscillation and potential instability. The model becomes second-order only through the introduction of a derivative stabilizer in the policy reaction function.
32. Holbrook (1972); Chow (1973).

108 Brookings Paper-s on Economic Activity, 1:1989
enhanced because a restrictive domestic monetary policy will induce a fall in import prices. On the other hand, the gain in the terms of trade will hold up domestic real incomes and reduce the domestic demand effects of the policy change. The dominant effect, however, will be the change in the impact on trade flows, and there the basic problem is that the lags are so long as to limit its usefulness for short-run stabilization policy.
The combination of a reduced housing demand impact and an in- creased impact on trade has resulted in a situation in which the lag structure of the response to monetary policy is almost certainly weaker initially and even more "humped-back" in subsequent periods. At a minimum, it suggests a reduced ability of the Federal Reserve to engage in "fine-tuning" because of the questionable value of responding to short-term wiggles in demand with a policy that will not have its real effect for two or three years-especially in view of the uncertainty attached to those lagged effects.
However, the Federal Reserve would deny that it is engaged in a policy of fine-tuning despite what might appear to be excessive attention to every little wiggle in the economic indicators. Nor is the inability to engage in fine-tuning particularly important to society-we worry about the big cycles, not the little ones. Rather, in the absence of a policy that can have an immediate impact, the Federal Reserve feels that it cannot afford to wait for problems, such as accelerating inflation, to emerge, but must instead act in anticipation of them. The danger is twofold. The urgency of acting quickly increases the potential for forecast errors, and the uncertainty over the policy lags means that the Federal Reserve never knows when "enough is enough." Its usual practice is to adjust policy and then wait to see what happens, but the longer the lags, the less it learns about the response to its own actions by waiting.
The Federal Reserve could respond to this new environment by simply waiting, as the administration appears to be suggesting, for the evidence of inflation or some other disturbance to become more evident, and then respond, if necessary, with a stronger dose of policy. The main argument against such an approach is that it suggests the need for wider future fluctuations in interest rates, and some would argue that interest rate instability should be avoided.33
33. Inflation is not the best example because there is a separate argument that by acting early, before increased inflation becomes imbedded in wage negotiations, the cost of reversing it would be less.

Barry Bosworth 109
It is not evident, however, that interest rate variability has a high cost in today's financial markets. Both savers and investors have a greatly expanded range of financial inst-iirnents through which they can ensure against interest rate risk. The basic objective is to induce individual economic agents to voluntarily substitute expenditures tomorrow for expenditures today. An increase in interest rate variability implies that those who agree to do so are being rewarded more than in the past. In the housing market, for example, we would normally believe that interest rate rationing of mortgages is preferable to the old system of quantity rationing. The old argument that interest rate extremes were to be avoided because the burden fell so heavily on a narrow sector, housing, would also seem to be of reduced importance today. The emergence of increased interest rate variability was a necessaty counterpart of a desire to broaden the impact of monetary policy change and eliminate quantity rationing.
A new issue is the tendency of the exchange rate to be affected by interest rate changes. Thus, increased interest rate variability also implies increased variability in the real exchange rate. One evident difference is that the markets that provide insurance against exchange rate risk are less developed than the corresponding markets for interest rate risk, and increased variability of exchange rates may reduce the volume of international trade. However, on the basis of the statistical research to date, it is difficult to show that the negative effect on trade is substantial or that the welfare losses would be large if some reduction in trade did occur.34
An additional argument, similar to that made against the concentration of previous restraint on housing, is that exchange rate increases fall heavily on export industries that are often at the edge of new technology, and they may fall behind in a heavily competitive world market. How- ever, it is not clear that the costs of disruption are any greater for industries that trade internationally than for those that operate in the domestic market.
Paul Krugman has argued that exchange rate variability may create inertia in the response of trade to exchange rates because the fixed costs associated with trade will lead firms to discount short-run changes.35 On the other hand, if the item being traded is itself a durable good, there
34. A survey of the literature is provided in International Monetary Fund (1984). 35. Krugman (1989).
110 Brookings Papers on Economic Activity, 1:1989
may be an increased response because of the opportunity for capital gain or loss. Furthermore, the impact on trade would seem to be transitory. Exchange rate variability will lead producers to diversify their production base across currency areas. Once that process is complete, it is not clear that the marginal response of shifts in production will be appreciably lower.
The greater problem would seem to be that we are simply not used to thinking of exchange rate changes as a principal element of the monetary policy linkage, and changes in exchange rates still carry psychological connotations about national strength. Interest rate changes lead to a redistribution within the country of winners and losers. In contrast, changes in exchange rates are perceived as altering the relationship with other countries. There are, however, important domestic distributional effects: as consumers we like high exchange rates, while as individual producers of tradables we like the competitive benefit of low exchange rates.
Finally, Federal Reserve policies to raise interest rates may be constrained by fears of financial crisis. This too is not a new argument. In past decades the Federal Reserve worried about financial disinter- mediation. Today, the concerns are bankruptcies of highly leveraged firms, further losses by savings and loans, and the costs to less-developed debtor nations. It may be, however, that the constraints are more important today, and that vulnerability of the financial system is an important reason for worrying about the reduced short-run impact of policy.
Many of these concerns would seem much less immediate were it not for the loss of fiscal policy as an instrument of adjustment. The loss of fiscal policy has forced monetary policy to the extremes of historical experience, as it is being used to correct for a secular imbalance between saving and investment rather than as a cyclical stabilizer. The worry about interest rate fluctuations is that they are around the peak of past experience, raising fears of bankruptcy. Similarly, the concern with exchange rate variations is not with the short-run changes that can be hedged in financial markets, but with large deviations that persist over many years and have substantial effects on the industrial structure of the economy. In other words, much of the concern can be traced to the fact that monetary adjustment has become the only tool of economic policy.
Comments and Discussion
Alan S. Blinder: Barry Bosworth has set himself an ambitious task: to ruminate and speculate on a question about which we do not yet have enough data to make an informed econometric guess. My first reaction was to admire his courage more than his judgment. My second reaction was that his positions on most issues were quite reasonable. My third reaction is due right now and, I guess, is supposed to be more critical than that.
In thinking about whether and how recent changes in the financial system may have affected the impact of monetary policy on the U.S. economy, two rather different questions come to mind. First, have the deregulation and internationalization of the American financial markets reduced the impact of market interest rates on spending? And, second, have these same phenomena reduced the leverage the Federal Reserve has over U.S. domestic interest rates? Because Bosworth deals only with the first question, I'll start there. But I think the second question also merits attention, perhaps more than the first, so I'll finish there.
Many of us here get calls from journalists asking about the likely effects of higher interest rates on the economy. I generally answer these queries by rounding up the usual suspects: housing, consumer durables, and business fixed investment-in that order. Bosworth focuses on housing, business fixed investment, and trade flows-in that order.
So my first criticism is that spending on consumer durables-mainly automobiles-should appear in Bosworth's rogues' gallery. This com- ponent of aggregate demand is roughly twice as large as spending on residential construction and somewhat larger than that on producer durables. It is also volatile, and there has long been substantial evidence that it is sensitive to interest rates. So it seems, at least potentially, a serious omission.
111

112 Brookings Papers on Economic Activity, 1:1989
The question is whether recent changes in the financial system have changed the sensitivity of spending on consumer durables to monetary policy. As one example, rationing may now be less important than it used to be. As another, I have the casual impression that concessional financing provided by automobile manufacturers has become more common in recent years. Is this true? If so, does it weaken the link between auto loan rates and market interest rates? Or is the concessional financing just a disguised price reduction that consumers can-and do- cash out? Depending on the answers to these and other questions, the automobile market today may or may not be less sensitive to Federal Reserve policy than it once was. It is even possible that the growth of concessional financing was a reaction to the greater volatility of interest rates. I don't know the answers, but it seems that Bosworth should at least be asking the questions.
Housing tops both my list of suspects and Bosworth's. The idea here is that innovations like variable rate mortgages and the end of disinter- mediation may have partially insulated the housing market from tight money because there is less quantity rationing and because consumers can now practice intertemporal substitution in the mortgage market without doing the same in the housing market. Bosworth had the ingenious idea of trying to "test" this hypothesis by comparing the United States and Canada, on the grounds that Canada has for years had more floating rate housing finance than the United States has even today. He finds that the share of residential construction in GNP is indeed more interest sensitive in the United States than in Canada.
The strength of this finding (table 3) depends on whether we are talking about a general rise in interest rates or a tilting of the term structure. Focusing on the 1972-87 period, Bosworth estimates that a 100 basis point rise in short rates (with long rates held constant) reduced the share of housing in GNP 36 basis points after one year in the United States but only 8 basis points in Canada. However, if we ask instead what happened when short and long rates rose together, the answers are that a 100 basis point rise in interest rates reduced the housing share 12 basis points in the United States and by the same 8 basis points in Canada-a trivial difference. This suggests, both to Bosworth and to me, that disinterme- diation and temporary postponements accounted for the greater interest sensitivity in the United States during this period. There is just one problem about the postponements. If interest rates on home mortgages
Barry Bosworth 113
follow approximate random walks, then consumers have no reason to postpone taking out fixed rate mortgages when rates rise because today's mortgage rate is the best estimate of tomorrow's. Some evidence that this is not the case would bolster Bosworth's argument.
One final point on housing. It seems to me that Bosworth's arguments suggest that not only the number of new houses but also the prices of houses should have been made less volatile by financial innovations because these changes should have stabilized demand. Is there evidence that this is true, or that housing prices are less volatile in Canada?
Moving down the list, I come next to business fixed investment. Here Bosworth does not seek evidence on changes in interest elasticity, presumably because he sees no reason to suspect any. His main question is what the 1980s have taught us about the interest elasticity question. My own reading of the pre-1980s econometric evidence is that you had to torture the data pretty hard to make it yield a sizable sensitivity to the cost of capital. This seems to be Bosworth's view as well. Is the experience of the 1980s consistent with this view?
Before answering this question, we need to get straight what actually happened to the left-hand and right-hand variables. Barry calculates that the higher real interest rates of the 1980s overwhelmed the business tax cuts, leading to the rise in the cost of capital shown in table 5. Thus, believers in price elasticity should have expected the investment share of GNP to fall, not rise. What actually happened depends on whether you include or exclude computers. Bosworth is inclined to exclude them, in which case the investment share fell. All in all, I find this a reasonable interpretation of the data.
Last on Bosworth's list is foreign trade. The big surprise of the 1980s was that fiscal deficits and tight money crowded out net exports rather than investment. This should change forevermore the way we think about the effects of fiscal and monetary policy in the United States. Bosworth suggests that we should revise our estimate of the timing of monetary impacts more than our estimate of their ultimate strength, because the link from exchange rates to trade flows is a slow one. And that, in turn, makes monetary policy a less useful tool for short-run stabilization.
I find these reasonable positions. But when I think about globalization, my mind quickly wanders to the capital account-where it encounters something of a puzzle. As we all know, the central bank of a small open
114 Brookings Papers on Economic Activity, 1:1989
economy with perfect international capital mobility has no control over domestic interest rates. Well, the U.S. economy is hardly small, and capital mobility may be imperfect. Nonetheless, if international capital mobility has increased dramatically, then it seems the Federal Reserve should have less control over U.S. interest rates than it used to. Yet the Federal Reserve apparently jacked up U.S. interest rates tremendously in 1979-81, pushed them down steadily from 1982 to 1986, and raised them sharply in the past year. How could all this have happened if the Federal Reserve was pushing against an integrated world financial market?
There seem to be two quite different answers. One is that the brave new world is not as different from the cowardly old world as is popularly assumed. Despite rapid telecommunications and the rise of multinational business, assets denominated in different currencies may remain highly imperfect substitutes to portfolio holders. If so, U. S. and foreign interest rates live lives of their own, and the Federal Reserve still has much leverage over the former.
The second possibility is that capital mobility forces the U.S. nominal interest rate for any particular maturity to approximate the foreign interest rate plus the expected depreciation of the dollar over the relevant time horizon. The Federal Reserve can therefore move U.S. interest rates relative to foreign ones only by changing the expected depreciation of the dollar. This seems more plausible for short rates than for long rates. For example, a tightening of credit that raises U.S. short rates can attract capital inflows, appreciate the dollar, and thereby set up expec- tations of subsequent depreciation. But I find it hard to believe that such operations can strongly affect, say, the expected exchange rate 10 or 20 years from now. If I am right, and if it is long rates rather than short rates that matter most for economic activity, then the Federal Reserve should indeed have less leverage over the economy than it used to.
It would be interesting to know which story is more true. Short of that, it would be interesting to know what Bosworth thinks about the issue.
David Romer: This thought-provoking paper starts from the observa- tion that the financial and monetary environment in the United States has changed greatly in recent years. The paper then asks three questions about how these changes may have altered the role of monetary policy.

Barry Bosworth 115
First, are larger shifts in monetary policy-specifically, larger move- ments in interest rates-now needed to bring about a given change in aggregate demand? Second, have the channels through which monetary policy affects the economy changed? And third, is it more difficult than before to control the economy using monetary policy; in other words, have the lags and uncertainty in the impact of monetary policy increased?
To summarize quickly both the paper and my own comments, Barry Bosworth's answers to these three questions are yes, yes, and yes, while my answers are yes, yes, and maybe.
I should point out that these questions are inherently difficult to answer. They concern how various changes in the structure of the economy may have altered other relationships. Thus, pending the completion of the new classical research program of estimating relation- ships that are invariant to changes in policy rules and in institutions, we cannot answer the questions by examining past relationships. Instead, what one has to do, and what Bosworth does do, is to examine a variety of suggestive and qualitative evidence.
Bosworth's first question is whether larger interest rate swings are now needed to achieve a given movement in aggregate demand. The answer to this question is surely yes. A simple example makes the point. In the first major episode of tight monetary policy in the postwar period, which took place in 1947-48 and preceded the recession of 1948-49, the commercial paper rate rose about 60 basis points. In the 1979-80 episode of tight policy preceding the 1981-82 recession, the rise was about 700 basis points. '
Bosworth suggests what seems to be the most plausible explanation for this change. Over the postwar period, we have moved increasingly from a reliance on interest rate ceilings and quantity rationing of credit in times of tight monetary policy toward the use of high interest rates to discourage borrowing. Disintermediation, for example, is no longer an important element of the monetary transmission mechanism. Thus, it is hardly surprising that we see larger interest rate swings now than in the past.
1. The changes are computed using monthly averages of the six-month commercial paper rate. In the 1947-48 episode, the low and high of the commercial paper rate occur in August 1947 and October 1948, respectively. In the 1979-80 episode, they occur in April 1979 and March 1980, respectively.
116 Brookings Papers on Economic Activity, 1:1989
Although I agree with Bosworth that larger interest rate swings are needed to alter aggregate demand, I am skeptical, for two reasons, of his contention that adjustable rate mortgages help explain why. First, I think that Bosworth is quite persuasive in arguing that adjustable rate mortgages are less different from fixed rate mortgages than one might be tempted to think. Interest rates are usually adjusted only annually; both the annual change and the change over the life of the mortgage are usually capped; and initial discounts very often make the interest rate changes over the first few years of the mortgage largely independent of market interest rates.
Second, it is hard to see how a shift even to mortgages with fully flexible rates would matter greatly. The expectations theory of the term structure, which provides a good first approximation to the data, tells us that a rise in rates on fixed rate mortgages relative to those on adjustable rate mortgages, for example, would simply reflect expectations of future increases in short-term rates and would therefore not provide a reason to switch from one type of mortgage to the other. In addition, since interest rate movements are in practice highly persistent, rates on the two types of mortgages tend to move relatively closely with one another. Thus, I doubt that the kind of weighing of the comparative attractiveness of the two types of mortgages that Bosworth discusses is likely to be important in the impact of monetary policy.2 Finally, as Bosworth argues, the effect on spending of the redistribution caused by changes in interest rates under adjustable rate mortgages is likely to be quantitatively small and to be dominated by the effects on spending of changes in interest payments on government debt.
About Bosworth's second question I will be brief. The question is whether the channels through which monetary policy has its effects have changed. The answer is clearly yes. Let me give just two examples. First, the decline of disintermediation has very likely reduced the impact of monetary policy on housing. Second, the greater role of foreign trade has increased the importance of the impact of monetary policy on import- competing and export industries.
2. As Bosworth suggests, initial discounts may enable homebuyers to qualify more easily for adjustable rate than for fixed rate mortgages. Thus, there may be a move toward flexible rate mortgages when interest rates rise. But the rise in rates still prevents some households-namely, those who previously were just able to qualify for adjustable rate mortgages-from obtaining mortgages.

Barry Bosworth 117
Bosworth's third question is whether the Federal Reserve's ability to control the economy has diminished. Bosworth's answer is that it has. As I suggested at the outset, I am unsure.
As Bosworth emphasizes, there are really two questions here, namely whether uncertainty in the effects of policy has increased and whether the lags have increased. I will discuss each in turn.
There are two reasons that I am skeptical that the uncertainty of monetary policy's effects has increased. First, the transmission mecha- nism does not appear to have been any more direct or straightforward in the traditional regulatory and rationing environment than it is in the current interest rate-oriented setting. Trying to estimate how a given policy shift in the old regime might affect the economy might have required guessing how certain restrictions on consumer credit would affect total borrowing and spending, or how rapidly funds might flow out of savings institutions bound by interest rate ceilings. These do not strike me as inherently easier to estimate than the responsiveness of borrowing and spending to increases in interest rates.
Second, it is tempting but usually wrong to think that recent economic changes are uniquely rapid or profound. The financial and monetary system has been changing continuously since World War II. The shift away from rationing and toward a reliance on interest rates, for example, has been an ongoing process. In a paper written for this journal almost 10 years ago, Albert Wojnilower argued that each postwar "credit crunch" had been qualitatively different from all that had come before, and indeed that after each episode the Federal Reserve had taken steps to prevent a recurrence of that particular kind of crunch.3 I cannot think of a time when estimating the impact of monetary policy would have been easy.
There are also two reasons for my skepticism that monetary policy now takes longer to work. The first is that, with the exception of direct, quantitative credit controls, which have never been a central element of monetary policy, the steps in the transmission mechanism are broadly similar now to what they have been throughout the postwar period. The first step is from interest rate changes to changes in lending and borrowing. Today this step is directly from interest rates to borrowing; traditionally it might have been from interest rate differentials to the
3. Wojnilower (1980).

118 Brookings Papers on Economic Activity, 1:1989
availability of funds to institutions facing interest rate ceilings. From there, the changes in lending and borrowing must affect spending and then production. Based on this description, I do not see any obvious reason to believe that the process will occur less rapidly today than it did two or three decades ago.
Second, the lags in the impact of monetary policy have always been quite long. The DRI model, which I think of as embodying the traditional wisdom, suggests that the maximum impact of the change in policy occurs with a lag of about 8 to 10 quarters.4 This is not very different from the lag that Bosworth believes characterizes the effects of monetary policy today. In other words, I think that Bosworth may have jumped from the correct conclusion that current lags are long to the shakier conclusion that the lags have lengthened.
I do not mean to argue strongly that the Federal Reserve's ability to control the economy has not diminished. As I said at the outset, my answer to Bosworth's third question is maybe, not no. But I think that one can make nearly as good a case that the uncertainty and lags have decreased as one can for the opposite position.
Finally, at times Bosworth is not clear about what comparison he is attempting to make. His goal seems to be to address the question of how the role and impact of monetary policy may have changed since the early 1980s, but at times he compares the present environment not with that of 1980 but with that of the 1950s or 1960s. I must say that I am doubtful that there have been dramatic changes within this decade. As I have emphasized, the evolution of the monetary and financial system has been a lengthy process. The same is true of the other changes that Bosworth focuses on, such as the increased openness of the economy and the greater degree of international capital mobility. And, despite the credit controls of 1980, rationing does not appear to have been a central part of the monetary restraint of 1979-82.
What message should we draw from all this concerning the conduct of monetary policy? The lesson I draw is that conducting monetary policy has always been difficult. The environment has been changing continually, the lags have always been long, and the uncertainty has always been great. Thus, I would conclude that monetary policy should be conducted the way it always has been-using a mix of formal models,
4. Dornbusch and Fischer (1987, p. 436).

Barry Bosworth 119
rules of thumb, shrewd observation, instinct, guesswork, and prayer. In sum, the message that I draw is that being a central banker is a tough job, but not that it is a tougher job than it was before.
General Discussion
Panelists suggested a number of additional ways in which the monetary transmission mechanism may have changed in recent years. Olivier Blanchard suggested that bankruptcies may become an important part of the transmission mechanism during any future monetary contraction, as the rise in corporate leverage has increased the risks of bankruptcy for many firms. Robert Litan added that not only does the increased probability of bankruptcy increase the size and uncertainty of the economy's response to high interest rates, but those increases are likely to be anticipated, adversely affecting investors' views of future risks to investment. Catherine Mann noted that a study of the effects of financial innovation sponsored by the Bank for International Settlements sug- gested that the risk of interest rate variability is borne more by banks than by nonfinancial firms. This makes banks more prone to bankruptcy and may restrain the stabilization activity of central banks.
Joseph Stiglitz thought the emphasis on nominal interest rates in the transmission mechanism unjustified. He noted that real rates, not nom- inal rates, affect real activity and that nominal rate changes are likely to be at least partially offset by changes in the rate of inflation. Further, he believed there are persuasive theoretical reasons, supported by some empirical evidence, why credit markets should not be regarded as auction markets in which prices provide all the relevant information about scarcity. Rather, credit constraints and credit rationing are an important part of the monetary mechanism. Charles Schultze, however, argued that the securitization of the credit markets over the past 15 years has, if anything, decreased the importance of credit rationing in the one sector where it had been considered most important.
Gregory Mankiw suggested two reasons why monetary policy might operate through the nominal rather than the real rate. First, the mortgage a household can obtain depends on monthly payments relative to income, and monthly payments are essentially nominal interest payments. Sec- ond, existing home owners are "locked in" when interest rates increase

120 Brookings Papers on Economic Activity, 1:1989
because most mortgages are not assumable. Hence, the demand for housing will be affected by the nominal rate, even if the real rate is constant. Robert Hall believed that another reason nominal rates appear empirically significant is that inflation itself is invariably the sign of bad news. When inflation is subtracted from interest rates to obtain a real rate rather than being considered separately, valuable information is lost.
Christopher Sims noted that the best predictor of real activity six months ahead is the spread between the commercial paper rate and Treasury bill rate. This suggests that a negative correlation between interest rates and output may be due to changes in business risk, not generated by changes in monetary policy.
John Shoven was dissatisfied with Bosworth's specification of the cost of capital. The link between interest rates and investment, he said, should include a risk premium. Not only does a risk premium explain why rates on financial assets appear much lower than the rates required by firms, but the premium may well vary overtime. Shoven also criticized the dividend-price ratio as a measure of the cost of equity funds. Because economists cannot explain why firms pay dividends in the first place, it seems unwise to use them as a key ingredient in the determination of investment. He believed earnings-price ratio is a better measure, partic- ularly if accounting earnings are adjusted to an economically more meaningful measure. Martin Baily observed that as the U.S. economy has become more open, the investment decisions of large companies have come to involve allocations across countries. This global perspec- tive makes domestic investment even more responsive to monetary policy and makes the exchange rate one of the channels by which policy affects investment. Baily also noted that an analysis of the effectiveness of monetary policy that is limited to the IS curve, as is Bosworth's, might be misleading. The deregulation of deposit rates has made the LM curve steeper and, on those grounds, made monetary policy more effective.
George von Furstenberg noted that the relationship between interest rates and exchange rates depends crucially on the regime governing exchange rate management and the source of shocks. In a world in which countries try to stabilize exchange rates with respect to exchange rate shocks by adjusting their monetary policies, interest rate instability may correspond to exchange rate stability. Interest rate increases may
Barry Bosworth 121
actually be correlated with depreciation as countries counteract ex- change rate shocks by rate increases. Hence, greater interest rate variability may correspond to greater efforts to stabilize the exchange rate, benefiting, not deterring, trade.
William Branson observed that the estimated effect of a change in the exchange rate on net exports is two to three times the usual estimates. Peter Hooper explained that the effect has increased over time with the scale of U.S. trade and that the estimates Bosworth presents, in contrast to most studies, take into account the effect of an endogenous change in interest rates, which has a bigger impact on net investment income payments now because of the growing U.S. net external debt.
Charles Holt thought Bosworth's theory of policy discussion over- stated the ease with which policymakers could stabilize the economy in the presence of long lags. He argued that adding "derivative" control to offset increased lags in response created its own problems in the form of increased variability of the control variables and that policymakers would have to respond more slowly and less strongly to disturbances of the economy. Therefore, Bosworth's conclusion that the lags have increased and become more variable implies that the Federal Reserve's ability to control the economy has decreased. William Nordhaus, agree- ing with Holt's general conclusion, suggested that the length of the lag structure per se was of secondary importance and cited earlier work by Brainard showing that uncertainty about the response of the economy to monetary policy was the crucial element in performance. Longer lags are likely to reduce policy effectiveness because they are almost surely associated with increased uncertainty about the economy's response to policy.
William Poole wished that Bosworth had addressed the issue of the changing relation between inflation expectations and interest rates. He observed that nominal and real interest rates were positively correlated for the periods before 1968 and in the 1980s, whereas they were negatively correlated between 1968 and 1980. The nature of the lags of response of real activity to changes in interest rates depends, according to Poole, on people's perceptions of how changes in nominal rates affect real rates and whether these changes are permanent or not. George Perry did not believe that the change in the relationship between interest rates and real activity was a puzzle, noting that fiscal policy and external shocks were quite different during the subperiods. James Duesenberry agreed,
122 Brookings Papers on Economic Activity, 1:1989
noting that at times, for example 1966, monetary and fiscal policy were working in opposite directions. At such times monetary policy will look ineffective unless one takes into account the impact of fiscal policy.
James Tobin wondered how Bosworth's conclusion that monetary policy is less effective than it used to be can be reconciled with the observation that in recent years the U.S. economy has enjoyed a successful recovery, managed, like the preceding recessions, by the Federal Reserve. Although fiscal policy was stimulative during this period, it was not adjusted year to year in response to economic events. In Tobin's view, the Federal Reserve deserves most of the credit. Given overexpansionary fiscal policy, the Federal Reserve had to keep a foot on the brake, but they kept it on in a variable degree, smoothing out the pace of recovery and avoiding a hard landing.

Barry Bosworth 123
References
Adams, F. Gerald, and Lawrence R. Klein. 1989. "Performance of Quarterly Econometric Models of the United States: A New Round of Model Comparisons." University of Pennsylvania Department of Economics (January 31).
Bernanke, Ben S., and John Y. Campbell. 1988. "Is There a Corporate Debt Crisis?" BPEA, 1:1988, 83-125.
Board of Governors of the Federal Reserve System. 1988. Balance Sheets for the U.S. Economy, 1948-87. Washington (October).
Brainard, William. 1967. "Uncertainty and the Effectiveness of Policy." American Economic Review, Papers and Proceedings 57: 411-25.
Bryant, Ralph, Gerald Holtham, and Peter Hooper. 1988. "Consensus and Diversity in the Model Simulations." In Empirical Macroeconomics for Interdependent Economies, edited by Ralph Bryant and others. Washington: Brookings.
Bureau of Economic Analysis. 1985. Business Statistics, 1984. Washington: Department of Commerce.
. 1986. National Income and Product Accounts, 1929-82: Statistical Tables. Washington: Department of Commerce.
. Various years. Survey of Current Business. Washington: Department of Commerce.
Carroll, Chris, and Lawrence H. Summers. 1987. "Why Have Private Savings Rates in the United States and Canada Diverged?" Journal of Monetary Economics 20: 249-79.
Chow, Gregory C. 1973. "Problems of Economic Policy from the Viewpoint of Optimal Control." American Economic Review 63: 825-37.
Cooper, J. Phillip, and Stanley Fischer. 1972a. "Simulations of Monetary Rules in the FRB-MIT-Penn Model." Journal of Money, Credit and Banking 4: 384-96.
. 1972b. "Stabilization Policy and Lags: Summary and Extension." Annals of Economic and Social Measurement 1: 407-18.
Dornbusch, Rudiger, and Stanley Fischer. 1987. Macroeconomics, 4th edition. New York: McGraw-Hill.
Economic Report of the President. 1989 (January). Fischer, Stanley. 1988. "Rules Versus Discretion in Monetary Policy."
Working Paper 2518. Cambridge, Mass.: National Bureau of Economic Research (February).
Fischer, Stanley, and J. Phillip Cooper. 1973. "Stabilization Policy and Lags." Journal of Political Economy 81: 847-77.
Friedman, Milton. 1959. A Program for Monetary Stability. Bronx, N.Y.: Fordham University Press.

124 Brookings Papers on Economic Activity, 1:1989
Goodman, John L., Jr., Charles A. Luckett, and David W. Wilcox. 1988. "Interest Rates and Household Cash Flow." Washington: Division of Research and Statistics, Board of Governors of the Federal Reserve System (December).
Helkie, William L., and Peter Hooper. 1988. "An Empirical Analysis of the External Deficit, 1980-86." In External Deficits and the Dollar: The Pit and The Pendulum, edited by Ralph C. Bryant, Gerald Holtham, and Peter Hooper. Washington: Brookings.
Hendry, David F., and Thomas von Unger-Sternburg. 1981. "Liquidity and Inflation Effects on Consumers' Expenditure." In Essays in the Theory and Measurement of Consumer Behavior, edited by Angus Deaton. Cam- bridge: Cambridge University Press.
Holbrook, Robert S. 1972. "Optimal Economic Policy and the Problem of Instrument Instability." American Economic Review 62: 57-65.
International Monetary Fund. 1984. "Exchange Rate Variability and World Trade." Occasional Paper 28. Washington (July).
Kydland, Finn E., and Edward C. Prescott. 1977. "Rules Rather Than Discretion: The Inconsistency of Optimal Plans." Journal of Political Economy 85: 473-91.
Krugman, Paul R. 1989. Exchange-Rate Instability. Cambridge, Mass.: MIT Press.
Phillips, A. W. 1954. "Stabilization Policy in a Closed Economy." Economic Journal 64: 290-323.
. 1957. "Stabilization Policy and the Time-Forms of Lagged Responses." Economic Journal 67: 265-77.
Sachs, Jeffrey D. 1988. "Global Adjustments to a Shrinking U.S. Trade Deficit." BPEA, 2:1988, 639-67.
Survey of Current Business. See Bureau of Economic Analysis. Wojnilower, Albert M. "The Central Role of Credit Crunches in Recent
Financial History," BPEA, 2:1980, 277-326.