international journal of innovative research in science ... non-linear.pdf · international journal...
TRANSCRIPT

ISSN: 2319-8753
International Journal of Innovative Research in Science, Engineering and Technology Vol. 2, Issue 6, June 2013
Copyright to IJIRSET www.ijirset.com 2530
NON-LINEAR TRANSIENT AND
STRUCTURAL ANALYSIS OF ROTOR
ASSEMBLY OF A MICRO GAS TURBINE
Mohammed Faheem1, Arun.L.R
2
P.G. Scholar, Department of Mechanical Engineering,TOCE, Bangalore, Karnataka, India¹
Assistant Professor, Department of Mechanical Engineering,TOCE, Bangalore, Karnataka, India²
Abstract:Miniaturization of gas turbines is not straightforward and is not simply the scaling down of large gas turbines.
The small dimensions have implications on the efficiency of the components due to the increased viscous friction. Also
limits in fabrication accuracy cause additional flow losses. For a 120sec typical accel-decel mission, non-linear
transient thermal & structural analyses were performed. It is important to note that this mission resembles true test
conditions of gas turbine engines. An axisymmetric model was considered for analysis and mass approximations were
carried out using real constants. Heat transfer coefficients are calculated using appropriate correlations and transient
thermal scenario of system was captured. Structural analysis was performed at several time points in the mission cycle
with all thermal & structural loads. Stress & temperature history of component was examined & fatigue life calculation
was performed for all critical locations of the component. It is observed that component can run for a minimum 100000
cycles. Also, clearance calculation was performed for rotor & stator parts in system and observed that current method
of assembly was safe. Regarding bearing design, at higher shaft speeds (up to 100000rpm); stainless steel ball bearings
cannot withstand the stresses. So, ceramic ball bearings are used as the best feasible solution for the given temperature
& pressures.
Keywords:Micro Gas Turbine, Autodesk Inventor Professional, Ansys V13, FE Analysis, Fatigue Life.
1. INTRODUCTION
Micro turbines are becoming widespread for distributed power and co-generation (Combined heat and power)
applications. They are one of the most promising technologies for powering hybrid electric vehicles. They range from
hand held units producing less than a kilowatt, to commercial sized systems that produce tens or hundreds of kilowatts.
Electronic power switching technology eliminates the need for the generator to be synchronized with the power grid.
This allows the generator to be integrated with the turbine shaft, and to double as the starter motor. They accept most
commercial fuels, such as gasoline, natural gas, propane, diesel, and kerosene as well as renewable fuels such as E85,
biodiesel and biogas. The machines generally rotate over 50,000 rpm. The bearing selection (oil or air) is dependent on
usage. A single shaft micro turbine with high rotating speeds of 90,000 to 120,000 revolutions per minute is the more
common design, as it is simpler and less expensive to build.
1.1 Overall aim and Specific Objectives:
The overall aim of the present work is to carry out Transient Thermal and Structural analysis (Centrifugal Stress
analysis, fatigue life of shaft and also to justify the clearance between rotating components of rotor assembly of a micro
gas turbine. The problem is intendable by continuum thermal – structural analysis method. Even though the assembly is
available for testing, experimental investigation will be expensive and time consuming.
In the present paper, ANSYS software is employed.

ISSN: 2319-8753
International Journal of Innovative Research in Science, Engineering and Technology Vol. 2, Issue 6, June 2013
Copyright to IJIRSET www.ijirset.com 2531
Figure.1.1 Flow chart showing procedure of analysis.
2. Literature Review
J.C Bruno and A Coronas [1] summarizes that the use of micro gas turbine (MGT) for onsite small scale energy
production offers a great opportunity for primary energy saving and reduction of pollutant and greenhouse gas
emissions. These benefits mainly come from the possibility to locally recover waste heat from exhaust gas especially
for air conditioning thermally activated technologies and also for their capability to use low heating value gases such
digester gas.
P.A. Pilavachi [2] stated that micro-turbines offer a number of potential advantages compared to other technologies for
small-scale power generation, particularly for distributed power generation, there is an uncertainty about their market
potential but they could be used for power generation in the industrial, commercial and residential sectors.
Nageshwara Rao Muktinutalapati[3] suggests ceramic material for micro gas turbine components in his paper Materials
for Gas Turbines – An Overview: he says thatIncrease in turbine inlet temperatures, beyond what is possible with super
alloys, can be conceived if ceramic materials can be used in place of super alloys in gas turbine engine. Turbines would
then operate at higher temperatures, yielding higher power with smaller engine sizes.
R.A. Van den Braembussche[4]stated thatGood micro gas turbines are not miniaturized copies of large ones. The very
high rotational speed that is needed to obtain the enthalpy and pressure changes prescribed by the gas turbine cycle, is
the major mechanical problem.
Mehdi Tofighi Naeem,[5] mentioned in his journal FailureAnalysisofGasTurbineBlades, that blade failures can be
caused by a number ofmechanismsunder the turbine operating conditions of high rotational speedatelevatedtemperatures.
Mohammed Javed Hyder [6] mentioned in his paper Stress Distribution of the Gas Turbine Blade that, Many kinds of
stresses do come into play when it comes to turbo machinery especially turbine where the temperature changes have
also become vital. The important stresses in the designing of gas turbine include Thermal stresses, Centrifugal stresses
and Creep phenomena.
R Christmann [7] conclude that frequent causes of failure on the compressor wheel are fatigue fractures, whereby a
distinction can be made between Low-Cycle Fatigue (LCF) und High-Cycle Fatigue (HCF) as regards the tolerable
number of cycles and the damage effects occurring. The LCF range is characterized by the dominant occurrence of
plastic strain.
Siddarth.A, S.R.Shankapal and S.Ramamurthy[8]analyzed Radial turbine rotor of a micro gas turbine rotating at
1,00,000 rpm.They says there are many rotating components in a micro gas turbine. Among them the radial turbine
rotor is a critical component since it is subjected to high centrifugal loads and temperatures. Radial turbine rotor is
analyzed for different loads such as inertial and thermal loads and cyclic symmetry boundary conditions. The analysis
indicated that the centrifugal stresses developed in the rotor were exceeding the yield limit.
J Peirs, TWaumans, PVleugels [9]concluded thatminiaturization of gas turbines is not straightforward and is not simply
the scaling down of large gas turbines. The small dimensions have implications on the efficiency of the components
due to the increased viscous friction. Also limits in fabrication accuracy cause additional flow losses. K. Shoghi , M.
Becker , T. Dicker , D. Metz , C. Oberste-Brandenburg [10]presents the theory and the method of determining the
Design Calculations Geometric ModellingImporting in
AnsysSimplification of 3D to
2D GeometryMeshing
Thermal Analysis
Creating Thermal Database
Applying Thermal
Boundary Conditions
SolutionStructural Analysis
Creating Structural Database
Applying Structural BCs and Mapping Temperatures from
Thermal AnalysisSolution Post Processing Results Interpretation

ISSN: 2319-8753
International Journal of Innovative Research in Science, Engineering and Technology Vol. 2, Issue 6, June 2013
Copyright to IJIRSET www.ijirset.com 2532
required torque and angle values applied to the nut on the rotor part of the turbocharger to provide sufficient clamping
force during the operation.
3. Calculations
3.1 Detailed Values of the process;
3.1.1 Inlet to the Compressor
Inlet air = 25°
Pressure = 1.013 bar
Density = 1.169kg/m³
Enthalpy = Δh=0
3.1.2 Outlet of the compressor
Temperature = 360K =87°c
Pressure = 2Bar
Density = 1.935 kg/m³
Enthalpy = 65.3KJ/kg
3.1.3 Combustion Chamber
Temperature = 973k =700°c
Pressure = 1.92bar
Density = 0.69 kg/m³
Enthalpy = 166KJ/kg
3.1.3 Exhaust Gases
Temperature = 843K = 570°C
Pressure = 1.013bar
Density = 0.42Kg/m³
Enthalpy = 166KJ/kg
Speed = 300M/s (1.080 km/h)
3.2 Engine Thrust.
F = Cm × m
F = 218m
s× 0.18
kg
s
F = 39 N
3.3 Centrifugal load on rotor wheel.
F =m × Um²
rm

ISSN: 2319-8753
International Journal of Innovative Research in Science, Engineering and Technology Vol. 2, Issue 6, June 2013
Copyright to IJIRSET www.ijirset.com 2533
F = Centrifugal force in newton
Um = Average peripheral speed in m/s
Rm = dm / 2, average radius in m
m = blade mass in kg
F = 1780 N
3.4 Critical rotational speed.
w = 3 × E × I
m × I + C × l²
l= Bearing Spacing
d= Material Thickness
ρ= Material Density, 7800 kg/m³
Wheel = 21597 c/s 1
w²=
1
wcompressor²
+1
wTurbine²
+ 1
wShaft²
1
w²=
1
38046²+
1
33760²+
1
21597²
W=16406.679 cycles/sec
Critical Speed = 156683.78Rpm
Designed Rpm = 1, 00,000
4. Modeling
Figure.4.1 2D representation of Rotor Assembly Figure. 4.2, 3D model of Rotor Assembly.
4.1 Materials selected for rotor assembly components
Sl No Component Name Material
1 Compressor Al - 6061
2 Compressor Casing EN-8
3 Shaft En-24
4 Nozzle Guide Vane Inconel-718
5 Turbine Inconel-718
Table 4.1 Materials selected for Rotor Assembly Components
5. Analysis 5.1 Procedural Steps for Thermal Analysis.
1. Geometry cleanup
2. Data cleanup of boundary conditions i.e., scaling of flow vs. time data for one blade.
3. The geometry is divided into thermal zones.
4. The parasolid geometry is imported to ANSYS and the geometry is meshed in the valid meshing criterion. Surf152

ISSN: 2319-8753
International Journal of Innovative Research in Science, Engineering and Technology Vol. 2, Issue 6, June 2013
Copyright to IJIRSET www.ijirset.com 2534
elements have created for all thermal zones.
5. The heat transfer coefficients are calculated for all thermal zones transiently using appropriate correlations.
6. Input files are created with time vs HTC & time vs temperature tables for transient analysis in ANSYS.
7. A BC file is created for solution run. This contains all commands to apply HTCs & bulk temperatures and solution
logic to run non-linear transient simulation. Writing of this command snippet will reduce human effort for other
iterations.
8. Performing of non-linear transient thermal analysis.
9. Post processing of these results.
5.2 Geometric Details
An axisymmetric model is considered for the analysis.
All non-axi features(like blades of compressor and turbine) are simulated based on real constants using “plane
with thickness” option.
Calculation of thickness is given below in table 5.1.
Figure 5.1 Axisymmetric model considered for the analysis.
Figure 5.2 Finite Element Model which is Finely Meshed in ANSYS
5.3 Elements used for analysis.
5.3.1 Plane55 Element5.3.2SURF151 Element: 5.3.3 SURF152 Element:
PLANE55 can be used as a plane element or as an axisymmetric ring element with a 2-D thermal conduction capability
SURF151 may be used for various load and surface effect applications. It may be overlaid onto a face of any 2-D
thermal solid element (like plane55).
SURF152 will be used for various load and surface effect applications like convection & radiation loads.
5.4 Engine parameters:
Out of many engine parameters, temperature, pressure, mass flow rate at the outlet of each component & shaft
speed (N1) are considered as primary variables.
Below are the corresponding variables with respect to time.
ISSN: 2319-8753
International Journal of Innovative Research in Science, Engineering and Technology Vol. 2, Issue 6, June 2013
Copyright to IJIRSET www.ijirset.com 2535
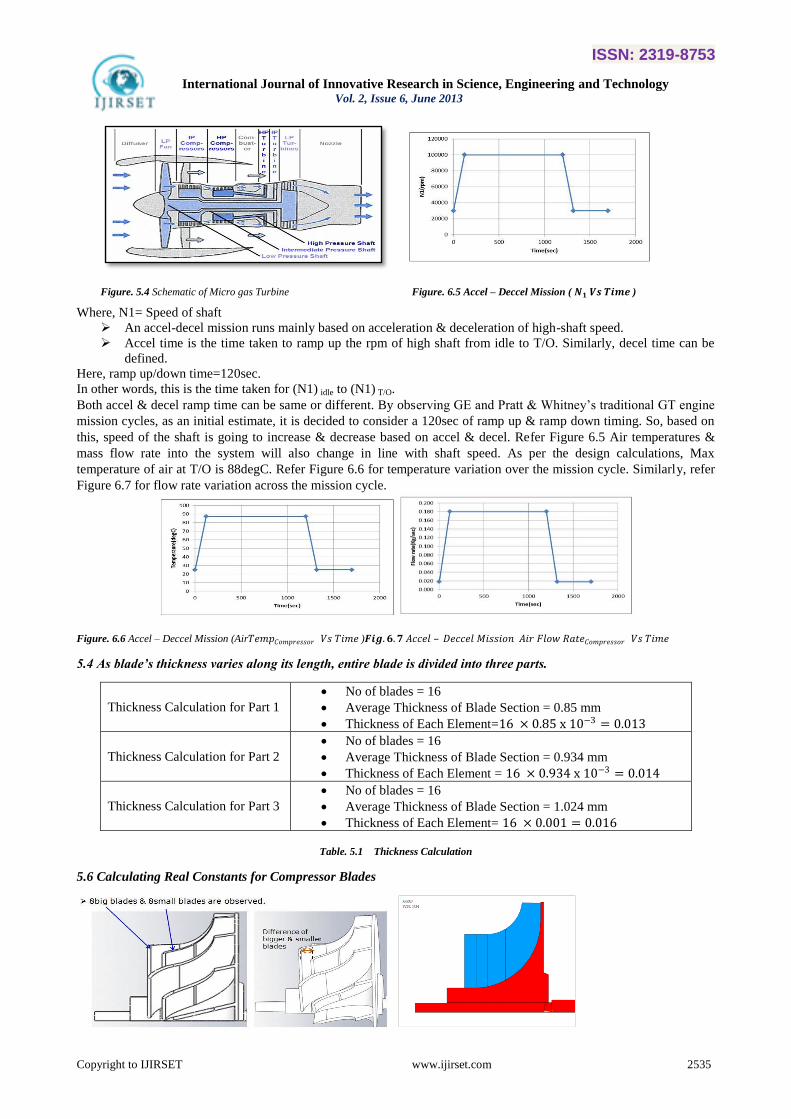
Figure. 5.4 Schematic of Micro gas Turbine Figure. 6.5 Accel – Deccel Mission ( 𝑵𝟏 𝑽𝒔 𝑻𝒊𝒎𝒆 )
Where, N1= Speed of shaft
An accel-decel mission runs mainly based on acceleration & deceleration of high-shaft speed.
Accel time is the time taken to ramp up the rpm of high shaft from idle to T/O. Similarly, decel time can be
defined.
Here, ramp up/down time=120sec.
In other words, this is the time taken for (N1) idle to (N1) T/O.
Both accel & decel ramp time can be same or different. By observing GE and Pratt & Whitney’s traditional GT engine
mission cycles, as an initial estimate, it is decided to consider a 120sec of ramp up & ramp down timing. So, based on
this, speed of the shaft is going to increase & decrease based on accel & decel. Refer Figure 6.5 Air temperatures &
mass flow rate into the system will also change in line with shaft speed. As per the design calculations, Max
temperature of air at T/O is 88degC. Refer Figure 6.6 for temperature variation over the mission cycle. Similarly, refer
Figure 6.7 for flow rate variation across the mission cycle.
Figure. 6.6 Accel – Deccel Mission (Air𝑇𝑒𝑚𝑝𝐶𝑜𝑚𝑝𝑟𝑒𝑠𝑠𝑜𝑟 𝑉𝑠 𝑇𝑖𝑚𝑒 )𝑭𝒊𝒈. 𝟔.𝟕 𝐴𝑐𝑐𝑒𝑙 – 𝐷𝑒𝑐𝑐𝑒𝑙 𝑀𝑖𝑠𝑠𝑖𝑜𝑛 𝐴𝑖𝑟 𝐹𝑙𝑜𝑤 𝑅𝑎𝑡𝑒𝐶𝑜𝑚𝑝𝑟𝑒𝑠𝑠𝑜𝑟 𝑉𝑠 𝑇𝑖𝑚𝑒
5.4 As blade’s thickness varies along its length, entire blade is divided into three parts.
Thickness Calculation for Part 1
No of blades = 16
Average Thickness of Blade Section = 0.85 mm
Thickness of Each Element=16 × 0.85 x 10−3 = 0.013
Thickness Calculation for Part 2
No of blades = 16
Average Thickness of Blade Section = 0.934 mm
Thickness of Each Element = 16 × 0.934 x 10−3 = 0.014
Thickness Calculation for Part 3
No of blades = 16
Average Thickness of Blade Section = 1.024 mm
Thickness of Each Element= 16 × 0.001 = 0.016
Table. 5.1 Thickness Calculation
5.6 Calculating Real Constants for Compressor Blades

ISSN: 2319-8753
International Journal of Innovative Research in Science, Engineering and Technology Vol. 2, Issue 6, June 2013
Copyright to IJIRSET www.ijirset.com 2536
Figure.6.8 An equivalent area of blades is taken in axisymmetric plane. Figure.6.9 Element shape in Ansys.
While creating the geometry of blades in 2D axisymmetric plane, it is systematically divided into multiple parts (areas)
for increasing the accuracy. Using multiple areas, variable thickness can be input to system which can capture the
actual variable thickness blades.
5.8 Thickness calculation for small blade of compressor.
No of blades=8
Average thickness of blades section=1mm
Thickness of each element=8*0.001=0.008
Good discipline is followed in creation of real constants & its values.
A macro is written to create real set name equal to its element number.
Thickness is given at 1st location of real set.
No of blades & each blade thickness are provided at 9th
& 10th
location of real set for future reference.
5.9 Calculating Real Constants for Compressor Blades:
As blade’s thickness varies along its length, entire blade is divided into three parts. Below table gives the corresponding
thickness calculation. After assigning all required real constants for compressor blades, effect of these real constants
can be visualized by using element shape options (/eshape). Figure 6.10 for the comparison of element shape on and off.
By this, it can be understood that varying thickness blades were captured in a very accurate manner. Similar
methodology is used for modelling turbine blades also.
5.10 Element Shape in ANSYS after Assigning Real Constants for turbine.
Turbine Blades 2. Approximation of Turbine Blade 1. Without element shape-> /eshape, 0 2. With element shape-> /eshape, 1/23
Figure. 6.10 Blade’s element shape with on & off
In case of turbine blades, to capture its thickness effectively, turbine blade is divided into 6 areas. So, six thicknesses
are calculated & fed in the form of real constants. This calculational procedure is similar to of compressor blades.
Figure 6.10 shows the blade’s element shape with on & off. It can observe that bladed thickness is captured in a right
manner.
Element’s shape can be visualized based on its thickness.
Variable thickness in compressor blades can be visualized.
A total of 23 turbine blades were observed. Figure-6.9.1 shows the variable blade thickness in solid works.
To consider the variable thickness, in ANSYS, total blade area is modeled as 5 areas with variable blade
thickness.
Figure 6.10.1 & 6.10.2 shows the turbine blade geometry with “element shape” off & on.
Same macro mentioned above is used to assign real constants.
5.12 Definition of Thermal Zones in Compressor
Zone Correlation Description
1 Flat Plate OD of the shaft
2 Rdisk LE of compressor
3 Flat Plate Compressor slot
4 Flat Plate Compressor slot
5 Rdisk Compressor slot
6 Flat Plate OD of compressor
7 General Ambient

ISSN: 2319-8753
International Journal of Innovative Research in Science, Engineering and Technology Vol. 2, Issue 6, June 2013
Copyright to IJIRSET www.ijirset.com 2537
8 Flat Plate ID of casing
9 Flat Plate ID of casing
10 Rdisk Cuter ID of casing
11 Flat Plate ID of casing
103 Flat Plate Zone for compressor blade
203 Flat Plate Zone for compressor blade
104 Flat Plate Zone for compressor blade
105 Flat Plate Zone for compressor blade
Table 5.2 Thermal Zones based on Geometry
Given geometry is divided into several thermal zones based on geometry, flow variation:
5.13 Visualization of Convection on Zone 3, 4, 5 & Zone 103, 104,105,106:
Figure.6.12 Visualization of Convection zone in Compressor
Always HTCs of surf152 zones (z103-106) will be applied with scaled HTCs of surf151 zones (zone3, 4&5).
This scale factor is based on no of blades.
6. RESULTS AND DISCUSSIONS
6.1 Thermal Analysis Results:
By running a non-linear transient thermal analysis for the given mission cycle, thermal scenario of components at
different time points can be obtained. Below are the temperature contours at several time points. It is clearly visible that
during ramp up (Accel), heating phenomenon of compressor & turbine can be observed. Effect of increased air
temperature in T/O will last for another 350sec, which backs up the fact that metal will take sufficient time to heat up.
Similarly, in decel, lag b/w air & metal temperature can be observed. This detailed analysis predicts temperature
scenario which can be used for structural analysis & in further fatigue calculation.
Figure.6.13 Variation of Temp along Time sec.
6.2 Structural Analysis.
6.2.1 Modelling of Structural Database.
Time = 0sec Time = 100sec Time = 200sec Time = 500sec
Time = 1000sec Time = 1500sec

ISSN: 2319-8753
International Journal of Innovative Research in Science, Engineering and Technology Vol. 2, Issue 6, June 2013
Copyright to IJIRSET www.ijirset.com 2538
Figure.6.14 Plot Showing Young’s Modulus vs. TEMP Figure6.14 Plot Showing Temp vs. Coefficient of Thermal Expansion
6.2.2 Creation of Structural data base.
For generating structural database, current thermal db. can be used. Using the option "ETCHG" shown in Figure. 6.15,
a thermal database can be converted to structural database. This option will convert all thermal elements to
corresponding structural elements. It is important and mandatory to modify the key options for all the elements based
on their behavior (axisymmetric/non-axisymmetric).
Current thermal model will be converted to equivalent structural model & can be used for structural analysis
Figure 6.15 Element type switching from thermal to structural
6.2.3 Structural mass approximation
Based on the axisymmetric & non-axisymmetric features, structural mass will be approximated. As thicknesses & real
constants were calculated & assigned in thermal analysis, this step is no longer required. All features are approximated
in a right manner.
6.2.4 Structural constraints
To avoid rigid body motion in the component, model has been constrained. Axial direction is constrained for a single
node in shaft, compressor & turbine casings.
Figure.6.16 Structural Constraints in Axial Direction
6.2.5 Preparation of Load Case files for structural run
To run structural analysis at multiple time points, a macro is written to generate “*.s” files. All structural loads
(pressure, angular velocity for rotating loads) were applied using this macro. Also, all thermal loads (from thermal
analysis) were applied using “ldread” command. These thermal loads will be applied as body forces in the model.
6.2.6 Von-Mises stress at different time points:
0.00E+00
5.00E+10
1.00E+11
1.50E+11
2.00E+11
2.50E+11
0 100 200 300 400 500 600 700
Yo
un
gs M
od
ulu
s, E
in P
a
Temperature in °C
Young's Modulus vs TempINCONEL - 718 EN-24
0.00E+00
5.00E-06
1.00E-05
1.50E-05
2.00E-05
2.50E-05
3.00E-05
3.50E-05
4.00E-05
0 100 200 300 400 500 600 700
Co
effi
cien
t o
f Th
erm
al E
xpan
sio
n
Tempearture in °C
Temp Vs Coefficient of thermal ExpansionINCONEL - 718 EN-24 EN-8 Al-6061
ISSN: 2319-8753
International Journal of Innovative Research in Science, Engineering and Technology Vol. 2, Issue 6, June 2013
Copyright to IJIRSET www.ijirset.com 2539
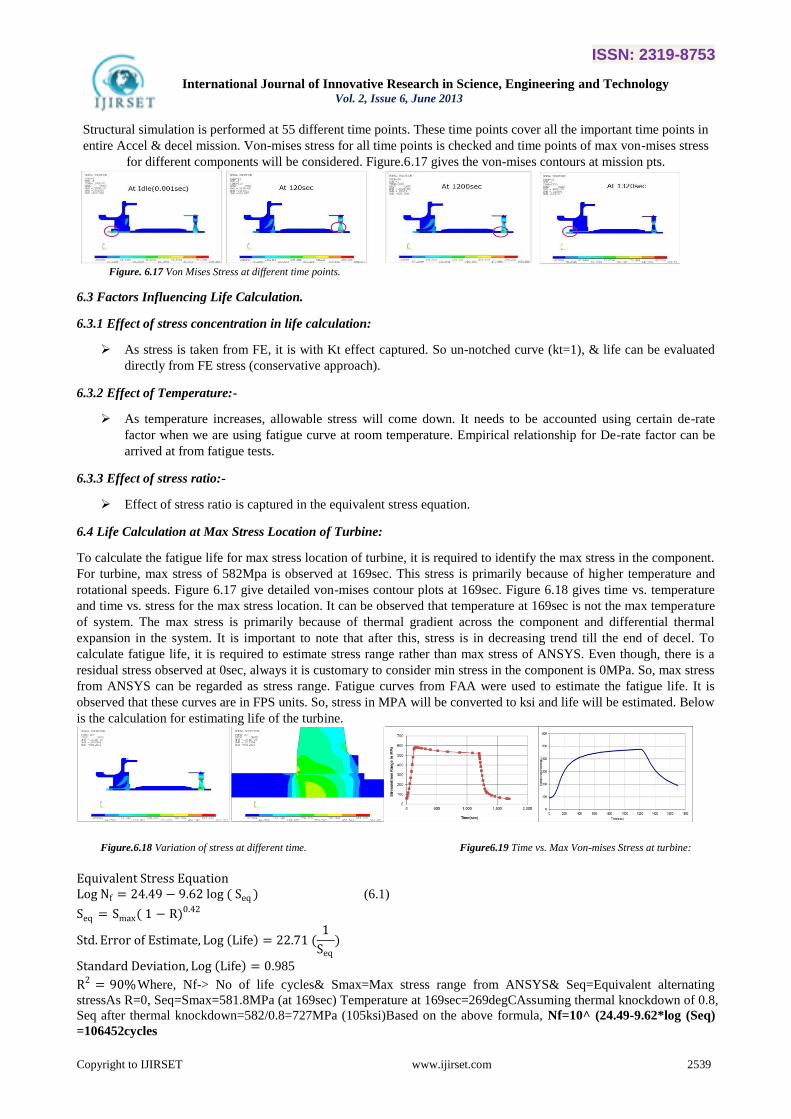
Structural simulation is performed at 55 different time points. These time points cover all the important time points in
entire Accel & decel mission. Von-mises stress for all time points is checked and time points of max von-mises stress
for different components will be considered. Figure.6.17 gives the von-mises contours at mission pts.
Figure. 6.17 Von Mises Stress at different time points.
6.3 Factors Influencing Life Calculation.
6.3.1 Effect of stress concentration in life calculation:
As stress is taken from FE, it is with Kt effect captured. So un-notched curve (kt=1), & life can be evaluated
directly from FE stress (conservative approach).
6.3.2 Effect of Temperature:-
As temperature increases, allowable stress will come down. It needs to be accounted using certain de-rate
factor when we are using fatigue curve at room temperature. Empirical relationship for De-rate factor can be
arrived at from fatigue tests.
6.3.3 Effect of stress ratio:-
Effect of stress ratio is captured in the equivalent stress equation.
6.4 Life Calculation at Max Stress Location of Turbine:
To calculate the fatigue life for max stress location of turbine, it is required to identify the max stress in the component.
For turbine, max stress of 582Mpa is observed at 169sec. This stress is primarily because of higher temperature and
rotational speeds. Figure 6.17 give detailed von-mises contour plots at 169sec. Figure 6.18 gives time vs. temperature
and time vs. stress for the max stress location. It can be observed that temperature at 169sec is not the max temperature
of system. The max stress is primarily because of thermal gradient across the component and differential thermal
expansion in the system. It is important to note that after this, stress is in decreasing trend till the end of decel. To
calculate fatigue life, it is required to estimate stress range rather than max stress of ANSYS. Even though, there is a
residual stress observed at 0sec, always it is customary to consider min stress in the component is 0MPa. So, max stress
from ANSYS can be regarded as stress range. Fatigue curves from FAA were used to estimate the fatigue life. It is
observed that these curves are in FPS units. So, stress in MPA will be converted to ksi and life will be estimated. Below
is the calculation for estimating life of the turbine.
Figure.6.18 Variation of stress at different time. Figure6.19 Time vs. Max Von-mises Stress at turbine:
Equivalent Stress Equation
Log Nf = 24.49 − 9.62 log ( Seq ) (6.1)
Seq = Smax( 1 − R)0.42
Std. Error of Estimate, Log Life = 22.71 (1
Seq
)
Standard Deviation, Log Life = 0.985
R2 = 90%Where, Nf-> No of life cycles& Smax=Max stress range from ANSYS& Seq=Equivalent alternating
stressAs R=0, Seq=Smax=581.8MPa (at 169sec) Temperature at 169sec=269degCAssuming thermal knockdown of 0.8,
Seq after thermal knockdown=582/0.8=727MPa (105ksi)Based on the above formula, Nf=10^ (24.49-9.62*log (Seq)
=106452cycles

ISSN: 2319-8753
International Journal of Innovative Research in Science, Engineering and Technology Vol. 2, Issue 6, June 2013
Copyright to IJIRSET www.ijirset.com 2540
6.5 Life Calculation at max stress location of Turbine.
The procedure for calculating fatigue life remains same for compressor too. But S-N curve will change based on the
material property. Max stress in compressor is observed at 1200sec. Figure 6.20 gives Temp vs. von-mises stress
contour. Max stress in compressor is primarily because of higher rotational speed only. Effect of thermal gradient is
less compared to the effect of speed. Max stress range in the component can be considered to 320MPa.Using eq 6.2 &
Figure 6.20, fatigue life can be estimated.
As max stress after temperature correction is less than 60ksi, it can be regarded as infinite life (>107 cycles).Refer
below calculational steps.
Max stress at 1200sec=320Mpa
Figure.6.20 Time vs. Max Von-mises Stress at compressor: Figure.6.21 Variation of stress at different time.
𝑬𝒒𝒖𝒊𝒗𝒂𝒍𝒆𝒏𝒕 𝑺𝒕𝒓𝒆𝒔𝒔 𝑬𝒒𝒖𝒂𝒕𝒊𝒐𝒏:
Log Nf = 22.36 − 9.98 log ( Seq − 60.0) (6.2)Seq = Smax( 1 − R)0.66
Std. Error of Estimate, Log Life = 0.24Standard Deviation, Log Life = 1.08
R2 = 95% Where, Nf No of life cycles
Smax Max stress range from ANSYS
Seq Equivalent alternating stress
As R=0, Seq=Smax=320MPa Temperature at 1200sec=89degC Assuming thermal knockdown of 0.8,
Seq after thermal knockdown=320/0.8=400MPa (58ksi) As Seq (58ksi) <60ksi,
It can be considered as NF>107& can be regarded as Infinite life.
6.6 Life Calculation at other critical locations-At shaft ID & other fillets.
After estimating life at max stress locations, it is required to calculate life for critical locations as shown in Figure.6.21
which gives the stress history of three locations. With similar method discussed above, fatigue life is estimated and is
given below.
Figure.6.22 Stress history of three locations.
With similar calculation method,
Life at shaft ID = 1e8 cycles
Life at fillet1 = 1.02e8 cycles
Life at fillet2 = 3.90e7 cycles
6.7 Clearance Calculation for Compressor & Turbine:
It is required to check the clearance between rotor & stator parts during entire mission cycle. During Accel-decel
mission, if clearance is too low, there is a chance of collision b/w stator & rotor parts. If clearance is too high,
performance loss will occur. So, it is required to maintain optimal clearance. The major important parameters which
control clearance is temperature & rotor speed. Figure.6.23 gives the clearance in case of compressor. During Accel,
due to increase in speed, clearance will decrease and this decrease is counter acted by the thermal expansion of stator.

ISSN: 2319-8753
International Journal of Innovative Research in Science, Engineering and Technology Vol. 2, Issue 6, June 2013
Copyright to IJIRSET www.ijirset.com 2541
In decel, similar phenomenon will occur in reverse manner. In overall, the trend of curve given in Figure 6.23 is
sensible. Similar explanation applies to turbine as well. Refer Figure.6.24 for the clearance of turbine.
A Macro is written to calculate the clearance in turbine and compressor. Below are the clearance curves for both
compressor and turbines.
Figure. 6.23 Compressor Clearance with respect to time. Figure. 6.24Turbine Clearance with respect to time
CONCLUSION
Mass approximations were carried out using real constants.
Heat transfer coefficients are calculated using appropriate correlations.
Non-linear transient thermal analysis is carried out for the 120sec Accel-decel mission.
Structural analysis is carried out for 55 transient time points.
Fatigue life calculation is performed at several locations in the assembly.
Critical locations like fillets in turbine & turbine shaft are come under the “infinite life” category because
stress at this location is less than 60ksi.
All clearances are within the tolerance & any rotor will not touch corresponding stator component.
Maximum estimated fatigue life at the turbine is
1, 06,234 cycles.
Maximum Von mises Stress at 1200 sec is 320Mpa in compressor.
Maximum Vonmises stress at the turbine part is 581Mpa at 169 sec.
With respect to figure 6.21 fatigue life at 3 locations has been calculated, Life at shaft ID will be 1e8 cycles,
Life at fillet 1will be 1.02e8 cycles Life at fillet2 will be 3.90e7 cycles
REFERENCES
[1] J.C Bruno, A.Coronas, “Distributed Generation of Energy using Micro Gas Turbines, Polygeneration Systems and Fuel
Flexibility” ,CREVER –Rovira I Virgili University, Autovia de Salou, S/n 43006 Tarragona Spain.
[2] P.A. Pilavachi , “Mini- and Micro-gas turbines for combined heat and power” , Research Directorate-General, European Commission,
200 Rue de la Loi, 1049 Brussels, Belgium, Received 15 March 2002;Accepted 25 August 2002.
[3] Nageswara Rao Muktinutalapati (2011). “Materials for Gas Turbines – An Overview, Advances in Gas Turbine Technology”, Dr. Ernesto
Benini (Ed.), ISBN: 978-953-307-611-9, InTech,
[4] R.A. Van den Braembussche, “Micro Gas Turbines – A Short Survey of Design Problems”,von Kármán Institute for Fluid
Dynamics,Waterloose steenweg, 72,B-1640, Rhode-St-Genèse, BELGIUM
[5] Mehdi Tofighi Naeem, Seyed Ali Jazayeri, Nesa Rezamahdi, “Failure Analysis of Gas Turbine Blades”,K. N. Toosi University of
Technology,Paper 120, ENG 108
[6] Mohammed Javed Hyder And Hafiz Laiq-ur-Rahman, “Stress Distribution of the Gas Turbine Blade”, Code 12, FEMS 2012, Department
of Mechanical Engineering UET Taxila
[7] R.Christmann, F.Langler, M.Habermehl, P.M. Fonts, L.Fontvieille, P.Moulin, “Low-cycle faigue of turbo charger compressor wheels-
online prediction and life time extension”. BorgWarner Turbo Systems Engineering GmbH, Germany. Renault SA, France French
Institute of Petroleum, France, paper 10.1243/17547164c0012010020 (2010)
[8] Siddarth.A (MSc Engg Student) S.R.Shankapal (Director, MSRSAS) and S.Ramamurthy (Scientist – F, Nal Bangalore), “Structural
Analysis and Optimization of a radial turbine rotor for micro gas turbine”. SASTECH Journal, MSRSAS, Vol. IV, No.2 October 2005
[9] Jan Peirs, Dominiek Reynaerts, Filip Verplaetsen, “A Microturbine for Electric Power”, Generation Department of Mechanical
Engineering, Katholieke Universitiet Leuven, Celestijnenlaan 300B, Leuven 3001,Belgium., Sensors and Actuators A 113 (2004) 86-93

ISSN: 2319-8753
International Journal of Innovative Research in Science, Engineering and Technology Vol. 2, Issue 6, June 2013
Copyright to IJIRSET www.ijirset.com 2542
[10] K.shoghi, M.Becker, T.Ducker, D.Metz, C.Obertse, “Compressor wheel retention”, BorgWarner Turbo Systems Ltd., United Kingdom, -
Brandenburg, BorgWarner Turbo Systems Engineering GmbH, Germany.
[11] Heat & mass transfer by Kreith 1999, page no 296,313,521-522; page no356
[12] Fundamentals of Heat and Mass Transfer by Incropera & dewitt page no 433-455
[13] Heat & mass transfer by Ozisik (page no 255,363)
[14] ANSYS13.0 help
[15] “Introduction to Finite Elements in Engineering “by D. Belagondu &.R.Chandrupatla, Page: 375-382,3rd edition, Pearson Education.
[16] “The Finite Element Method in Engineering “by S.S.Rao, page: 43-57 & 210-215, 3rd edition, Butterworth-Heinemann Publishers.
[17] FAA - Metallic Materials Properties Development and Standardization.
[18] ASME BPVC SEC II Part Material properties
[19] Fatigue and Fracture, ASM DATA HAND BOOK, Vol.19, ASM INTERNATIONAL
[20] Metal Fatigue in Engineering, Second Edition, by Ralph. I. Stephans, Ali Fatemi, Robert R.Stephans and Henry O Fuchs, Wiley Inter
Science, Page 59-120