interpretation of microseismic effects from response to ... · interpretation of microseismic...
TRANSCRIPT
Interpretation of microseismic effects from response to large coal mine blasts
C. H. Dowding1 & J. E. Meissner2 1Northwestern University, Evanston, USA 2University of Illinois, Urbana, USA
Abstract
Response of a residential structure to ground motions generated by large, surface coal mine blasts can provide information regarding the cracking severity of microseismic events. Microseismic events produced by small earthquakes, mine-collapse and reservoir induced seismicity, etc. can lead to concern on the part of those who feel the ground motion. These concerns can be addressed by reference to low frequency blast generated ground motions that have not caused cracking. This paper presents measured response of a structure to motions producing peak particle velocities of 10 to 19 mm/s and ground displacements of 0.3 mm at 5 to 15 Hz, which can be employed to interpret microseismic phenomena of any sort. Measured responses include velocity responses of the superstructure and midwall as well as vibratory response of existing cracks in walls. Response spectra of these blast generated motions are compared to those generated by moment magnitude five midcontinent earthquakes to determine the relative impact. The structure was inspected for crack extension after each blast and none were found Keywords: response spectrum, cracking, earthquakes, blasting, mining, micrometer, crack, response, humidity, temperature, climate, microseismic.
1 Response to large surface coal mine blast induced ground motions
This article presents structural and crack response of a test house to unusually high amplitude, low frequency ground motions from surface coal mining. These measurements provide a comparison between excitation and structure response velocities and dynamic and long term micrometer crack response. Comparison of these mine-blast induced excitation ground motions with those produced by a
Earthquake Resistant Engineering Structures VIII 309
www.witpress.com, ISSN 1743-3509 (on-line) WIT Transactions on The Built Environment, Vol 120, © 2011 WIT Press
doi:10.2495/ERES110 126
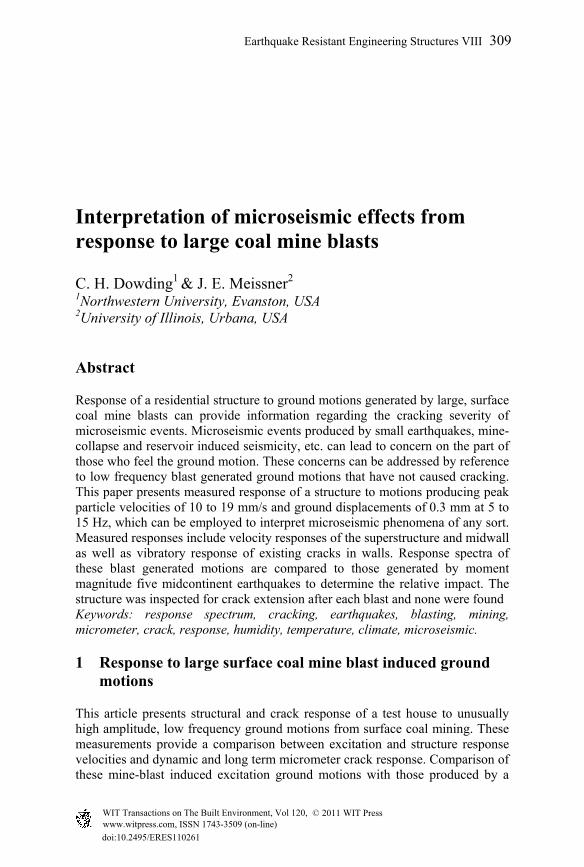
small, moment magnitude five, mid-continent earthquake at the same structure allows an assessment of the potential for cosmetic cracking by small earthquakes and other microseismic activity such as that induced by mine collapse or construction of large reservoirs. Walls of the house were thoroughly inspected for cracking before and after each blast. The walls were divided into inspection grids, which were visually inspected by the same person in the same fashion in each instance over a period of some 6 months. No new cracks or extensions, not even cosmetic, were observed through the 02 April blast when observation of crack response ceased. (Dowding and Lucole [1]). The test house was located near a surface coal mine in central Indiana, which involved large-scale cast blasting. The walls, interior and exterior, were constructed with a standard wood stud frame and were covered with gypsum drywall board on the interior and aluminum siding and a half-height brick wall on the exterior. Locations of instruments to measure velocity and crack response in the test house are shown in Figures 1 and 2.
Figure 1: Photograph of test house and plan view showing instrument locations.
310 Earthquake Resistant Engineering Structures VIII
www.witpress.com, ISSN 1743-3509 (on-line) WIT Transactions on The Built Environment, Vol 120, © 2011 WIT Press
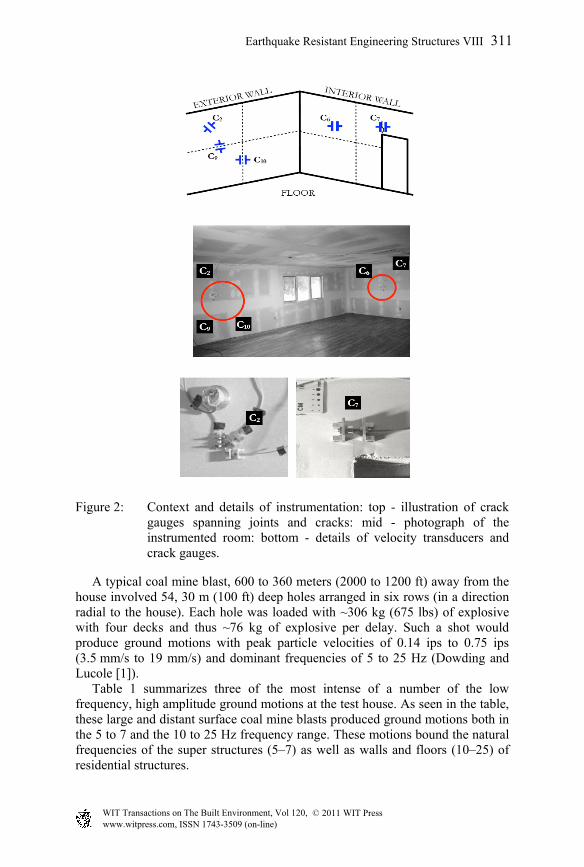
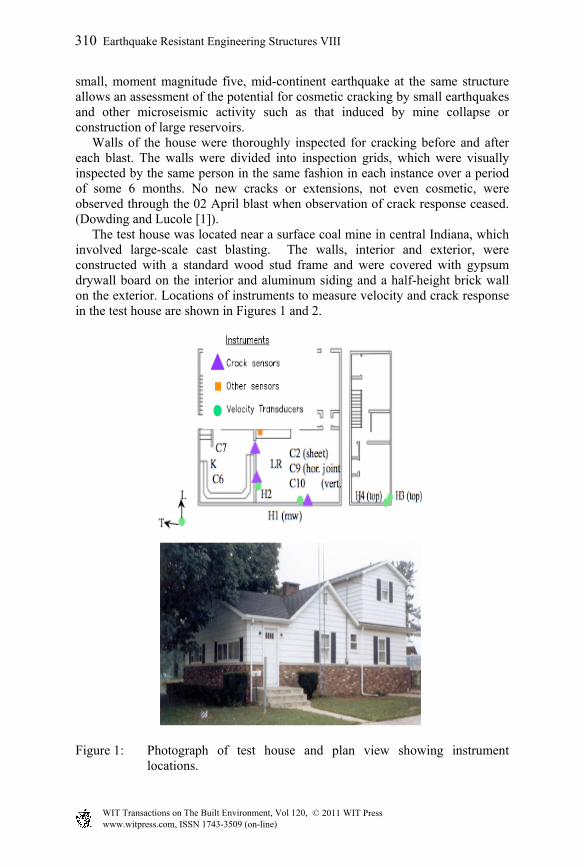
Figure 2: Context and details of instrumentation: top - illustration of crack gauges spanning joints and cracks: mid - photograph of the instrumented room: bottom - details of velocity transducers and crack gauges.
A typical coal mine blast, 600 to 360 meters (2000 to 1200 ft) away from the house involved 54, 30 m (100 ft) deep holes arranged in six rows (in a direction radial to the house). Each hole was loaded with ~306 kg (675 lbs) of explosive with four decks and thus ~76 kg of explosive per delay. Such a shot would produce ground motions with peak particle velocities of 0.14 ips to 0.75 ips (3.5 mm/s to 19 mm/s) and dominant frequencies of 5 to 25 Hz (Dowding and Lucole [1]). Table 1 summarizes three of the most intense of a number of the low frequency, high amplitude ground motions at the test house. As seen in the table, these large and distant surface coal mine blasts produced ground motions both in the 5 to 7 and the 10 to 25 Hz frequency range. These motions bound the natural frequencies of the super structures (5–7) as well as walls and floors (10–25) of residential structures.
Earthquake Resistant Engineering Structures VIII 311
www.witpress.com, ISSN 1743-3509 (on-line) WIT Transactions on The Built Environment, Vol 120, © 2011 WIT Press

Table 1: Summary of excitation and response of test house.
Date Time Frequency (Hz) Peak Velocity (mm/s) Amplification Crack Response (µm)L T V L T V H1 H2 H3 H4 Wall Struct C7 C9 C10
1-Jan 9:03 21 21 25 19.3 10.4 10.9 72.3 18.2 16 17.9 323-Feb 14:47 28 9 36 10.4 6.6 8.1 25.3 15.4 10.3 8.3 4.23 2.78 1.8 0.7 1.82-Apr 14:40 6 9 5 10.2 5.1 7.0 23.6 11.6 24.2 24.9 3.56 2.84 6.4 0.4 3.4
2 Test house and instrumentation
More than a dozen dynamic crack deformation, velocity, and air-blast transducers were continuously monitored by computer to record ground motion and environmentally induced wall and crack deformation. As shown in Figure 1, crack and wall deformation gauges were concentrated in the first floor living room C6, C7, C9 and C10. Ground motions (L, T, and V) particle velocities and air blast overpressure were measured outside at the northwest (upper left in Figure 1) corner nearest the mining. Out of plane, or horizontal, wall motions (H1 and H2) were recorded at mid height and mid span of exterior (H1) and at interior (H2) first-story walls and at an upper corner of the second story (H3 and H4).· Thus H1 and H2 measure wall response, while H3 and H4 measure superstructure response. Context (top) and details (bottom) of the instrument installation are shown in Figure 2. Instrumented dry wall joints are located in the living room as shown in the upper drawing by dashed lines and center photograph by the white plaster coating over the paper taped joints. Horizontal and vertical un-cracked dry wall joints are C9 and C10. Un-cracked locations near the centers of the drywall sheets are C2 and C6. Drywall joint crack, C7, shown in the bottom right most photograph, is at the doorway (adjacent to C6) between the living room and the kitchen. This crack is not fully extended, and did not extend during the observation period. Out-of-plane, mid-wall motions were measured with Geospace HS1 LT velocity transducers with a flat response between 3 and 250 Hz shown in the bottom left photograph. Ground motions were measured with same velocity transducers. Micrometer deformation gauges, which measure distance between the sensor and target, allow recording of both static and dynamic opening and closing of cracks because of their long-term stability. Thus long-term phenomena such as change in crack width in response to daily, weekly, or seasonal changes in weather related temperature and humidity, as well as foundation response to changes in the water table can be measured by the same gauge that records the dynamic response to vibrations. A close-up view of one of these gauges, C7, is shown in the bottom right of Figure 2. This inductance deformation gauge measures the proximity of the aluminum target to the magnetic field induced by the sensor. These industrial-grade sensors, manufactured by Kaman, have a resolution of 0.0001 mm (0.004 mil or 0.000004 in.). In the configuration shown they can sense strains as small as 7 micro in/in (μmm/mm.) between bases spaced 15 mm (0.6 in) apart (Kaman [2]). LVDTs can be employed as well (Dowding [3]).
312 Earthquake Resistant Engineering Structures VIII
www.witpress.com, ISSN 1743-3509 (on-line) WIT Transactions on The Built Environment, Vol 120, © 2011 WIT Press
3 Time histories of coal mine blasting ground motions
Figure 3 presents time histories of ground motion (L, V, T) in upper third, wall (H1 and H2) and superstructure (H3 and H4) velocity response in the middle third, and crack C7 and the most active wallboard joint (C10) in the lower third.
Figure 3: Time histories of blast induced ground motion, structural response, and cracked (C7) and un-cracked drywall joint response (C10). Low frequency excitation shows joint response follows the motion of the upper story. 2/23/87 on the left and 4/2/87 on the right. (1 ips = 25.4 mm/s, 1 µ-in = 0.025 µm).
These excitation and response motions are those associated with blasts on 23 Feb and 2 April that had low dominant frequencies of horizontal ground motion and greatest super structure response (H3 and H4). Peak particle velocities were 10 mm/s in the longitudinal direction. Times of the peak values are encircled in the figures.
Ground Velocity Crack
0.40
0 ip
s
0.20
0 ip
s
0.27
4 ip
s
134
�-in
.
L
T
V
C10
C7
254
�-in
.
H1
H2
H3
H4
JointStructural Velocity
0.92
9 ip
s
0.45
6 ip
s
0.95
4 ip
s
0.98
3 ip
s
0.41
3 ip
s
0.26
1 ip
s 0.
319
i
0.99
6 ip
s
0.60
8 ip
s
0.40
6 ip
s
0.32
6 ip
s
72 �
-in.
71 �
-in.
Earthquake Resistant Engineering Structures VIII 313
www.witpress.com, ISSN 1743-3509 (on-line) WIT Transactions on The Built Environment, Vol 120, © 2011 WIT Press
These time histories show that the higher frequency components are most effective in exciting the higher natural frequency walls (H1 and H2) and the lower frequency ground motions are most influential in exciting the super structure (H3, H4). As shown in Table 1, the dynamic crack responses are roughly proportional to the peak particle velocity of the ground motions. The vertical drywall joint (C10) responds the most and is more responsive than the horizontal joint (C9). However, its response is still smaller than that for the cracked joint (C7).
4 Moment magnitude five earthquakes at the test house
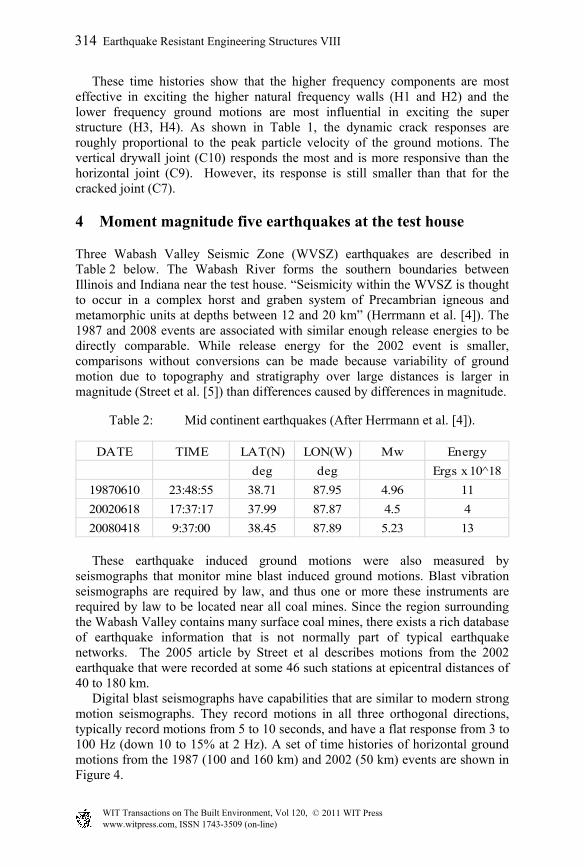
Three Wabash Valley Seismic Zone (WVSZ) earthquakes are described in Table 2 below. The Wabash River forms the southern boundaries between Illinois and Indiana near the test house. “Seismicity within the WVSZ is thought to occur in a complex horst and graben system of Precambrian igneous and metamorphic units at depths between 12 and 20 km” (Herrmann et al. [4]). The 1987 and 2008 events are associated with similar enough release energies to be directly comparable. While release energy for the 2002 event is smaller, comparisons without conversions can be made because variability of ground motion due to topography and stratigraphy over large distances is larger in magnitude (Street et al. [5]) than differences caused by differences in magnitude.
Table 2: Mid continent earthquakes (After Herrmann et al. [4]).
DATE TIME LAT(N) LON(W) Mw Energy
deg deg Ergs x 10^18
19870610 23:48:55 38.71 87.95 4.96 11
20020618 17:37:17 37.99 87.87 4.5 4
20080418 9:37:00 38.45 87.89 5.23 13 These earthquake induced ground motions were also measured by seismographs that monitor mine blast induced ground motions. Blast vibration seismographs are required by law, and thus one or more these instruments are required by law to be located near all coal mines. Since the region surrounding the Wabash Valley contains many surface coal mines, there exists a rich database of earthquake information that is not normally part of typical earthquake networks. The 2005 article by Street et al describes motions from the 2002 earthquake that were recorded at some 46 such stations at epicentral distances of 40 to 180 km. Digital blast seismographs have capabilities that are similar to modern strong motion seismographs. They record motions in all three orthogonal directions, typically record motions from 5 to 10 seconds, and have a flat response from 3 to 100 Hz (down 10 to 15% at 2 Hz). A set of time histories of horizontal ground motions from the 1987 (100 and 160 km) and 2002 (50 km) events are shown in Figure 4.
314 Earthquake Resistant Engineering Structures VIII
www.witpress.com, ISSN 1743-3509 (on-line) WIT Transactions on The Built Environment, Vol 120, © 2011 WIT Press

Figure 4: Comparison of moment magnitude 5 motions at distances of 50 to 160 km shows declining amplitude and frequency.
This article introduces structural responses to ground motions from the 1987, Mw 4.96 earthquake that were measured by blast seismographs at Blanford, Indiana and Greenville, Kentucky some 100 and 160 km from the epicenter. These motions were recorded in 2 second segments interspersed with periods of non-recording while the machine stored data. Peak horizontal ground velocities (PHV) measured at these two locations are compared with those measured with strong motion instruments from the equally energetic 2008 event in Figure 5. Peaks recorded with blast seismographs are at the high end of the frequency range of motions measured with strong motion seismographs. Horizontal particle velocities larger than 0.25 and 0.20 cm/s lasted some 10 seconds at the closer and further distances respectively for the 1987 event.
Figure 5: Comparison of peak particle (ground) velocity for 1987, Mw =4.96 event (large Δs) with that for 2008 (Mw = 5.23). From Herrmann et al. [4].
Blanford, IN
Greenville, KY
Earthquake Resistant Engineering Structures VIII 315
www.witpress.com, ISSN 1743-3509 (on-line) WIT Transactions on The Built Environment, Vol 120, © 2011 WIT Press
5 Comparison of mid-continent earthquake and large coal mine blast induced ground motions
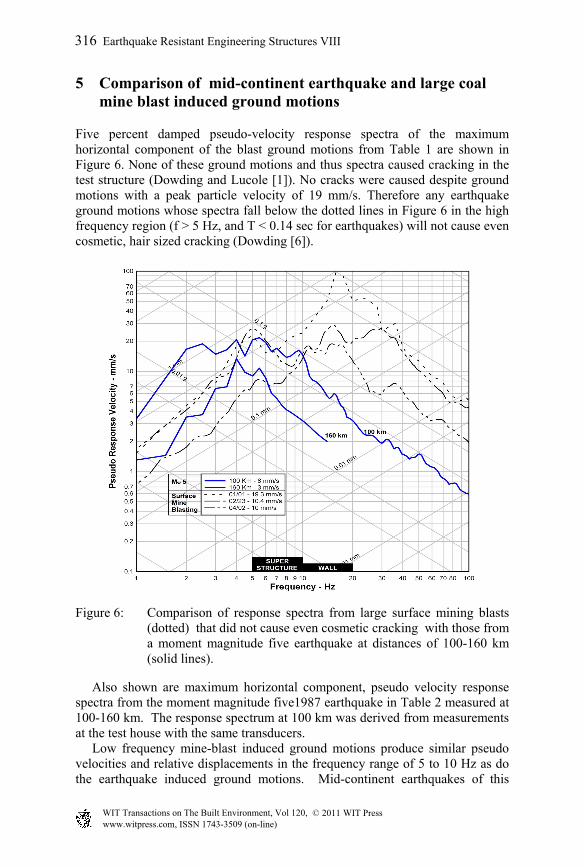
Five percent damped pseudo-velocity response spectra of the maximum horizontal component of the blast ground motions from Table 1 are shown in Figure 6. None of these ground motions and thus spectra caused cracking in the test structure (Dowding and Lucole [1]). No cracks were caused despite ground motions with a peak particle velocity of 19 mm/s. Therefore any earthquake ground motions whose spectra fall below the dotted lines in Figure 6 in the high frequency region (f > 5 Hz, and T < 0.14 sec for earthquakes) will not cause even cosmetic, hair sized cracking (Dowding [6]).
Figure 6: Comparison of response spectra from large surface mining blasts (dotted) that did not cause even cosmetic cracking with those from a moment magnitude five earthquake at distances of 100-160 km (solid lines).
Also shown are maximum horizontal component, pseudo velocity response spectra from the moment magnitude five1987 earthquake in Table 2 measured at 100-160 km. The response spectrum at 100 km was derived from measurements at the test house with the same transducers. Low frequency mine-blast induced ground motions produce similar pseudo velocities and relative displacements in the frequency range of 5 to 10 Hz as do the earthquake induced ground motions. Mid-continent earthquakes of this
316 Earthquake Resistant Engineering Structures VIII
www.witpress.com, ISSN 1743-3509 (on-line) WIT Transactions on The Built Environment, Vol 120, © 2011 WIT Press
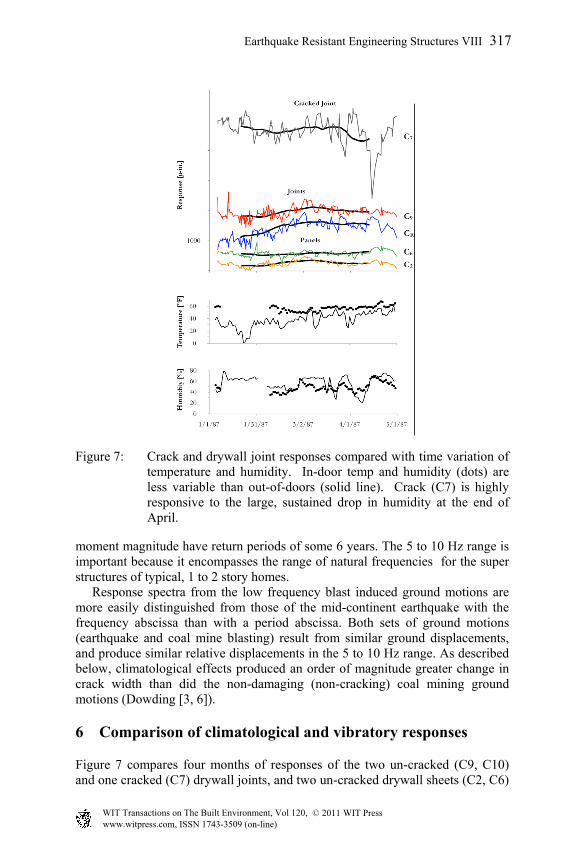
Figure 7: Crack and drywall joint responses compared with time variation of temperature and humidity. In-door temp and humidity (dots) are less variable than out-of-doors (solid line). Crack (C7) is highly responsive to the large, sustained drop in humidity at the end of April.
moment magnitude have return periods of some 6 years. The 5 to 10 Hz range is important because it encompasses the range of natural frequencies for the super structures of typical, 1 to 2 story homes. Response spectra from the low frequency blast induced ground motions are more easily distinguished from those of the mid-continent earthquake with the frequency abscissa than with a period abscissa. Both sets of ground motions (earthquake and coal mine blasting) result from similar ground displacements, and produce similar relative displacements in the 5 to 10 Hz range. As described below, climatological effects produced an order of magnitude greater change in crack width than did the non-damaging (non-cracking) coal mining ground motions (Dowding [3, 6]).
6 Comparison of climatological and vibratory responses
Figure 7 compares four months of responses of the two un-cracked (C9, C10) and one cracked (C7) drywall joints, and two un-cracked drywall sheets (C2, C6)
Earthquake Resistant Engineering Structures VIII 317
www.witpress.com, ISSN 1743-3509 (on-line) WIT Transactions on The Built Environment, Vol 120, © 2011 WIT Press

to temperature and humidity-induced, climatological effects. Variation in temperature and humidity inside and out is presented on the bottom. Joint, crack and sheet responses are plotted to the same scale at the top for comparison. Responses to other longer-term environmental effects such as changes in the ground water table and frost heave at this structure are described in Dowding [6]. Crack responses in Figure 7 are also compared to those of some 30 others in 20 some other structures in Dowding [3]. Responses at the center of drywall sheets (C2, C6) are small. Positions such as these are regularly used to measure the null response. The null response describes the response of the crack gauge metal and un-cracked mounting material to changes in temperature and humidity. Comparison to the crack response (C7) shows that dry wall sheet response is so small as to be inconsequential compared to the crack response. It is also small compared to the response of the un-cracked paper tape joints. Responses to long-term climatological effects of the un-cracked, literally paper-thin, plaster covered (and thus weak) drywall joints (C9, C10) are less than 1/10th that of the cracked drywall joint (C7). Significant changes in exterior humidity, marked with circles, seem to drive the largest long-term crack response. The large response of cracks to changes in temperature and humidity has been observed in residential structures constructed with wood frames as in the United Sttes and with and cement block as in Europe (Dowding [3]). Even for high peak particle velocities (10 to 19 mm/s) and a mix of low (4 to 8 Hz) and higher frequency (9 to 28) excitation motions, climatological response is greater than vibratory response for both un-cracked wall weaknesses (drywall joints) and cracks as shown by the bar chart comparisons in Figure 8. The ratio of dynamic crack response to climatological response is small even for low frequency excitation events. This ratio is 1/10 for typical weather events and even smaller for extreme humidity events such as in April as described in Dowding [3,6].
Figure 8: Bar chart comparison of crack/joint/ sheet response induced by weather and dynamic motion.
318 Earthquake Resistant Engineering Structures VIII
www.witpress.com, ISSN 1743-3509 (on-line) WIT Transactions on The Built Environment, Vol 120, © 2011 WIT Press
7 Discussion
Evaluation of ground motions from microseismic events should be based upon considerations of amplitude, dominant frequency, and number of significant pulses at the structures of concern. Such considerations are included in time histories of the ground motion that allows the calculation of response spectra as compared in this paper. As shown in this paper, residential structures are naturally resistant to low level ground motions. Not even cosmetic cracks are produced or extended by ground motions described in this paper. Other studies by the US Bureau of Mines addressed response of weak wall coverings of residential structures to low frequency blast induced ground motions (Siskind et al. [7]). They should not be overlooked when assessing the importance of human activity induced microseismic events. Typical changes in humidity and temperature produce far more crack and drywall joint response than typical ground motions. This observation sheds light on the absence of observations of cracking at particle velocities below 12 mm/s (Dowding [3, 6]). At some time in the past climatologically induced distortion has already opened cracks further than at present and typical vibrations do not induce sufficient distortion to exceed this historical state.
8 Conclusions
Ground motions from high intensity, low excitation frequency surface coal mine blasting and distant Mw 5 earthquakes were found to be similar. This similarity allows mining experience to be employed in the assessment of effects from similar microseismic events and small earthquakes when the peak ground motions are similar. Comparison of these events is best made with pseudo velocity response spectra, the details of which are best observed by description with frequency rather than period. Structural and crack response to these surface coal mine blast and microseismic events (when response spectra are similar), can be summarized as follows:
1) Dynamic crack responses are an order of magnitude smaller than those induced by changes in temperature and humidity from a passing weather front
2) Cracks respond more than weak un-cracked joints to both ground motions and climatological effects
3) Ground motions that exceed 12 mm/s and reached 19 mm/s did not extend a highly responsive crack nor did they produce new cracks in the weak paper-plaster joints between wallboards.
Acknowledgements
The authors are indebted to all those who have contributed to this project. The Indiana test house was owned by Peabody Coal Co., without whose cooperation decades ago this project would not have been possible. Instruments were
Earthquake Resistant Engineering Structures VIII 319
www.witpress.com, ISSN 1743-3509 (on-line) WIT Transactions on The Built Environment, Vol 120, © 2011 WIT Press
installed by Digital Vibration Incorporated. We are also grateful for the financial support of the Infrastructure Technology Institute at Northwestern University through its block grant from the U.S. Department of Transportation to develop and deploy new instrumentation to construct and maintain the transportation infrastructure.
References
[1] Dowding, C.H. and Lucole, S.W. Comparison of Environmental and Blast Response. Digital Vibration Report for Peabody Coal Company. 1988. www.iti.northwestern.edu/acm/publications.htm
[2] Kaman Precision Products. Kaman High Performance Non-Contact Position Sensors. 2011. www.kamansensors.com.
[3] Dowding, C.H. Micrometer Crack Response to Vibration and Weather. International Society of Explosive Engineers. Cleveland, OH, USA. 2008.
[4] Herrmann, R.B, Wither, M, Benz, H. The April 18, 2008 Illinois Earthquake, An ANSS Monitoring Success. Seismological Research Letters. V 79. No. 6. Nov/Dec. 2008.
[5] Street, R., Weigand, J., Woolery, E.W., Hart, P. Ground-motion Parameters of the Southwestern Indiana Earthquake of 18 June 2002 and the Disparity between the Observed and Predicted Values. Seismological Research Letters. V 76. No. 4. July/Aug. 2005.
[6] Dowding, C.H. Construction Vibrations. 3rd Ed. Prentice Hall, Saddle River, NJ, USA. 1996.
[7] Siskind, D.E., Stagg, M.S., Kopp, J.W., and Dowding, C.H. Structure Response and Damage Produced by Ground Vibrations from Surface Blasting. Report of Investigations 8507. US Bureau of Mines. Washington, D.C. 1980.
320 Earthquake Resistant Engineering Structures VIII
www.witpress.com, ISSN 1743-3509 (on-line) WIT Transactions on The Built Environment, Vol 120, © 2011 WIT Press