intertemporal income shifting around a large tax cut: the
TRANSCRIPT
Arbeitskreis Quantitative Steuerlehre Quantitative Research in Taxation – Discussion Papers
Laura Dobbins, Sebastian Eichfelder, Frank Hechtner, Jochen Hundsdoerfer
Intertemporal Income Shifting
Around a Large Tax Cut:
The Case of Depreciations
arqus Discussion Paper No. 229
September 2018
www.arqus.info
ISSN 1861-8944
1
Intertemporal Income Shifting Around a Large Tax Cut:
The Case of Depreciations
Laura Dobbins, Sebastian Eichfelder, Frank Hechtner, Jochen Hundsdoerfer1 2
Abstract
A corporate tax rate cut provides an incentive for corporations to shift taxable income from years
before the tax rate cut to post-reform years. Our study analyzes whether depreciations and write-
offs are used to achieve intertemporal income shifting. Using a panel of German manufacturing
firms, we test in a difference-in-differences setting whether firms reacted to the announced 2008
corporate tax rate cut of 10 percentage points by accumulating depreciation expenses in the pre-
reform year. Our results suggest that depreciation expenses in 2007 are on average about 2.5%
higher than in the other observation years. Our analysis also sheds light on heterogeneity in
intertemporal income shifting across firms. We provide evidence for a weaker reaction of loss
firms resulting from a lower tax incentive. By contrast, we find stronger intertemporal income
shifting of large firms and especially firms with a relatively high share of new investments in the
capital stock. While the first result is consistent with a higher cost-efficiency of tax planning of
large firms, the second finding suggests that investments in the current year provide more
discretion for (tax-induced) earnings management.
Keywords
Tax planning; Intertemporal income shifting; Tax avoidance opportunity; Depreciations;
Write-offs
JEL Classifications
H25 M41
1 Laura Dobbins, Freie Universität Berlin, Garystr. 21, 14195 Berlin
Prof. Dr. Sebastian Eichfelder, Otto-von-Guericke Universität Magdeburg, Universitätsplatz 2, 39106
Magdeburg
Prof. Dr. Frank Hechtner, Freie Universität Berlin, Garystr. 21, 14195 Berlin
Prof. Dr. Jochen Hundsdoerfer (Author of correspondence), Freie Universität Berlin, Garystr. 21, 14195
Berlin, and NoCeT, e-mail: [email protected]. 2 We thank two anonymous reviewers, Martin Simmler, and the participants of the joint seminar of the
tax departments of the Universität zu Köln and the Freie Universität Berlin for their helpful comments.
We are also grateful for the support provided by the RDC of the Federal Statistical Office and the
Statistical Offices of the Länder for the provision of the data (AFiD panel of the manufacturing and
mining industries, 1995 – 2008) and additional statistical support. Laura Dobbins gratefully
acknowledges financial support by PricewaterhouseCoopers.

2
Intertemporal Income shifting around a Large Tax Cut:
The Case of Depreciations and Write-Offs
1. Introduction
The accounting literature provides robust evidence that foreseeable changes in corporate
income tax rates lead to strategies of intertemporal shifting of taxable income (in the
following intertemporal income shifting) of firms to save tax payments. Scholes et al.
(1992) exploit a large corporate income tax cut through the U.S. Tax Reform Act (TRA)
1986 and find that firms shift profits from high-tax years to low-tax years. Existing studies
in this field (e.g., Boynton et al. 1992; Manzon 1992; Scholes et al. 1992; Guenther 1994,
Maydew 1997; Sundvik 2017) rely on financial accounting data and therefore address the
question if tax incentives of firms result in tax-induced earnings management strategies
respectively conforming tax planning that also affect the financial accounts. However,
these studies are not able to identify non-conforming tax avoidance strategies that might
shift taxable income without affecting book income.
In our paper, we analyze a large tax cut in the German corporate income tax rate. As part
of the German Business Tax Reform 2008 (in the following BTR 2008), the German
parliament decided a reduction of the German corporate income tax rate from 25% to
15%. Considering further changes of the German BTR 2008, this lead to a reduction of
the marginal tax rate of German corporations between 7.8 to 10.2 percentage points from
2007 to 2008 and created a strong incentive to shift taxable income from the year 2007 to
the following periods like 2008 and 2009. Shifting €1 of taxable income resulted in a
permanent tax saving of about €0.08 to €0.10. The reform passed the German legislation
process in July 2007. Thus, there was sufficient time for German investors to anticipate
the tax rate cut and to adjust tax avoidance strategies.
We focus on the question if and to what extent the BTR 2008 affected the accumulation
in depreciations for tax accounting purposes in the year 2007. In spite of detailed
regulations in the German income tax code and the depreciation tables (German: AfA-
tabellen) of the German fiscal administration regarding amortization periods and
depreciation methods, depreciations are a business expense that may provide discretion
for intertemporal income shifting. As we have access to a business survey encompassing
information on tax accounting depreciations, we are not only able to identify conforming
tax avoidance strategies, but also to account for non-conforming tax avoidance resulting
in different depreciations in the tax and financial accounts. In addition, we focus on
3
depreciations and write-offs as one channel if intertemporal income shifting and address
the heterogeneity of shifting across different firm types.
Using a difference-in-differences identification strategy with partnerships and sole
proprietorships as control group, we find robust and significant empirical evidence for an
abnormal increase of about 2.5% in depreciation expenses in the year 2007. While this
outcome might be a lower-bound estimate,3 it nevertheless suggests that, even in case of
a strong intertemporal shifting incentive resulting from the BTR 2008, the impact of
intertemporal income shifting on aggregate depreciations in 2007 was not excessively
high. This might be due to limited shifting opportunities.
Analyzing heterogeneity in shifting activity across firms we can show that (1) loss firms
are less active in intertemporal shifting of income via depreciations; (2) large firms with
a presumably higher cost-efficiency of tax planning are more active in intertemporal
income shifiting; (3) there is a very high abnormal increase of about 26.2% in depreciation
volume in 2007 for firms with a high ratio of new investments in their capital stock. The
third finding confirms the expectation that shifting opportunity via depreciations is much
higher for new investments compared to investments of earliers years, where amortization
periods and depreciation schedules have already been set. We do not find empirical
support that shifting activity is significantly related to the excessive use of debt finance
(as measure for financial reporting costs, see Guenther 1994). In part, this might be due
to the fact that we also consider non-conforming tax avoidance strategies and not only
conforming tax-induxed earnings management with high financial reporting costs.
Our heterogeneity tests also provide an explanation for the relatively small aggregate
estimated effect on depreciation volume in 2007. Thus, relevant shifting opportunity was
only available for depreciations on new investments, while opportunities for additional
depreciations and write-offs on the older investments seem to have been very small. In
addition, not all firms had incentives for intertemporal shifting of income (loss firms) and
costs of tax planning reduce the incentive for the accumulation of depreciation expenses
in 2007.
3 We cannot fully rule out that some of the non-corporate firms in our control group also had an incentive
to shift income from 2007 to 2008. This is for two reasons. First, changes in the local business tax and
the personal income tax rate on business earnings generated heterogenous tax incentives for that group
of firms, which might add “white noise” to our regression results. Second, corporations may act as
partners of partnerships and influence their tax avoidance strategy. However, that should only affect the
policy of partnerships in case of large holdings of corporate partners. Due to data limitations, we are not
able to identify the owners and parent firms of the businesses in our sample.

4
We contribute to the literature in several ways. First, while the existing literature on tax-
induced earnings management and intertemporal income shifting is almost exclusively
focused on the U.S. (an exception is Sundvik 2017 analzing intertemporal income shifting
in Sweden), we provide significant evidence that such activities are also relevant for
German and European corporations. This is relevant, as the opportunities for
intertemporal income shifting via depreciations and write-offs depend on tax-system
charactistics and should therefore largely differ between countries. Thus, the external
validity of U.S. evidence should be debatable and quantitative estimates cannot be simply
extrapolated to other countries.
Second and different from existing research, we provide evidence for conforming and
non-conforming strategies of intertemporal income shifting since we rely on tax
accounting information. However, the estimated impact of the large tax rate cut on
aggregate depreciation volume seems to be relatively small. While our evidence should
be taken as a lower bound estimate, our findings nevertheless suggest that shifting
opportunity might be limited in case of depreciation expenses, and here especially in case
of depreciations and write-offs for old investments. That should also hold nowadays, as
current German tax law does not allow any more for the declining balance sheet method.
A further implication of that finding is that worries about negative consequences of the
very high book-tax conformity in Germany in 20074 on the informativeness of German
GAAP (e.g., Evers et al. 2016) might be not that relevant for average depreciations and
write-offs. Even if we might underestimate the true impact of BTR 2008 on depreciation
volumes, it seems unlikely that the very high tax cut of BTR 2008 excessively affected
average depreciation volume in the financial accounts. However, our findings also
suggest that the loss of informativeness might be higher for certain types of firms
(especially for firms with large current investments). Note that our calculations rely on
tax accounting information and consider both conforming and non-conforming tax
avoidance strategies. Therefore, the impact on the financial accounts should have been
smaller than the estimated effect on the tax accounts.
Finally, we extend the existing literature on the heterogeneity of shifting activities.
Previous studies suggest stronger intertemporal income shifting of tax-aggressive firms
(Lopez et al. 1998; Andries et al. 2017), less shifting of firms with low marginal tax rates
4 In 2009, the German legislator reduced the degree of book-tax conformity in the German tax code by
the introduction of the so-called Balance Sheet Modernisation Act (German:
Bilanzrechtsmodernisierungsgesetz).

5
and shifting incentives (Boynton et al. 1992; Manzon 1992), less intertemporal income
shifting of firms with high financial reporting costs (Guenther 1994; Cloyd et al. 1996;
Kosi and Valentincic 2013) and more intertemporal shifting of private firms with
typically lower financial reporting costs than public firms (Burgstahler 2006; Lin et al.
2014).
While the literature provides evidence that intertemporal income shifting is related to
marginal tax rates (Boynton et al. 1992; Manzon 1992), we are not aware of evidence for
loss firms. We extend the existing literature and can show that loss firms are less active
in intertemporal income shifting compared to profitable firms. Second and more
innovative, we are the first to address the issue of shifting opportunity and to show
empirically that firms with presumably higher shifting opportunities (measured by a high
share of current investments in their capital stocks) react stronger to shifting incentives.
While this finding may be partially due to the existence of the declining balance method
in the German tax rules in 2007, such rules might also be relevant for other tax systems.
Furthermore, by showing that large firms are more active in intertemporal shifing of
income, we contribute to the literature on the relationship of firm size and tax avoidance
(e.g. Zimmerman, 1983; Rego 2003; Richardson and Lanis 2007). Our finding suggests
that large firms are more cost-efficient and therefore more active in tax avoidance
practices than small firms.
The paper is organized as follows. Section 2 describes the institutional background. We
develop our hypotheses in Section 3, and describe the empirical identification strategy
and our data in Section 4. We discuss our empirical findings and the robustness tests in
Section 5. Section 6 concludes.
2. The German business tax reform 2008
We investigate intertemporal income shifting of corporations by analyzing depreciations
for tax purposes before the German BTR 2008. The German tax system for corporations
encompasses two main taxes on income: the corporate income tax including a so-called
solidarity tax surcharge of 5.5% on the corporate income tax payment and the German
local business tax. The local business tax has a basic rate of 3.5%, which is multiplied
with a local tax multiplier of typically 2 to 4.9 in the observation period, 5 resulting in
local business tax rates of 7.00% to 17.15%.
5 There also existed higher local business tax multipliers for some small municipalities. For example,
Dierfeld had and still has a multiplier of 9 in 2008.

6
The BTR 2008 introduced major changes in German taxation of companies, including a
reduction of the corporate income tax rate from 25% to 15% and adjustments of the
German local business tax being relevant for corporations but also for partnerships and
individual business taxpayers. Including the solidarity tax surcharge, the reform reduced
the effective corporate income tax rate from 26.38% to 15.83% (25% respectively 15%
multiplied by 1.055). In addition, BTR 2008 reduced the basic local business tax rate from
5% to 3.5% and abolished the tax deductibility of the local business tax from taxable
profit.6 In the year 2008, local business tax rates typically ranged from 7.00% (local
business tax multiplier of 2) to 17.15% (local business tax multiplier of 4.9). Accounting
for the higher basic rate of 5% and the tax deductibility of the local business tax from its
own tax base, historical tax rates before 2008 were slightly higher (9.09% for a tax
multiplier of 2 and 19.68% for a local business tax multiplier of 4.9). The local business
tax base is a modified firm profit. The most important modification is the nondeductibility
of a fraction of interests, leases, and rents paid (before 2008 only nondeductibility of a
fraction of interests for long-term debt). To avoid double taxation, there are also
exemptions for distributed profits and dividends.
The main objective of the BTR 2008 was to enhance Germany’s attractiveness for
business investment. Allover, the BTR 2008 resulted in a reduction of the aggregate
business tax rate for corporations (corporate income tax including solidarity tax surcharge
and the local business tax) on corporate income. If we assume a local business tax
multiplier of 4, the aggregate tax rate was reduced by 8.8 percentage points from 39.3%
to 29.8%. Due to the abolishment of the deductibility of the local business tax, the overall
reduction of the tax burden depended on the local business tax multiplier with a higher
reduction for small tax multipliers. However, corresponding differences were relatively
small (10.2 percentage points reduction for a tax multiplier of 2 and 7.8 percentage points
for a tax multiplier of 4.9).
While the reform as itself did not change standard rates of the personal income tax,7 the
BTR 2008 also affected the aggregate tax burden of partnerships and sole proprietorships.
A main reason were the changes regarding the German local business tax. In contrast to
6 Before 2008, the German local business tax payments therefore reduced the tax base of the (corporate
and/or personal) income tax and its own tax base. 7 BTR 2008 introduced reduced personal income tax rates for nondistributed business earnings (German:
Thesaurierungsbegünstigung) and capital earnings (German: Abgeltungsteuer). The details of these
special tax rate regimes go beyond the scope of our analysis. The reduced personal income tax rate for
nondistributed business earnings typically results in consequential tax payments in future periods and
is therefore regarded as non-benefitial for most partnerships and sole proprietorships.

7
German corporations, individual taxpayers can credit local business tax payments against
their personal income tax (local business tax credit). As the BTR 2008 abolished the
deductibility of the German local business tax from taxable profit, BTR 2008 also
increased and adjusted the local business tax credit. Additional tax incentives for
individual business taxpayers resulted from the introduction of a higher personal income
tax rate of 45% for taxpayers with a personal income above 250,000 € (so-called
“Reichensteuer”) in 2007. On the one hand, this tax reform might have generated an
incentive for some individual taxpayers and partnerships to accumulate depreciations in
2007 and thereafter as maximum marginal tax rates increased. On the other hand, Section
32c of the German income tax code effectively delayed the introduction of the 45% tax
rate for German taxpayers with business income by one year. As a result, there should
also have been an incentive for some German individual taxpayers and partnerships to
accumulate business expenses and depreciations in 2008 and thereafter.
Combining the effects of lower local business taxes and potentially higher personal
income tax rates for individual business taxpayers from 2007 to 2008, we calculated
effective tax rates for different combinations of incomes and local business tax multipliers
and find a high variation of tax incentives for individual taxpayers and partnerships. Thus,
while the marginal tax rate on business income decreased from 2007 to 2008 for some
individual taxpayers by zero to about five percentage points (taxpayers with low personal
income and high tax multipliers), it increased for other taxpayers to a similar extent
(taypayers with high personal income exceeding 250,000 € and low tax multipliers).
Concluding, the BTR 2008 strongly reduced the combined tax rate of German
corporations but generated heterogeneous tax effects for German individual business
taxpayers and partnerships.
To offset revenue losses from lower tax rates, the BTR 2008 further encompassed a
number tax law changes broadening the German income tax base for businesses. These
included an extension of the German thin-capitalization tax rules and an adaption of non-
deductible business expenses for the German local business tax (e.g., part of the leasing
expenses). Most relevant for our analysis, BTR 2008 abolished the declining-balance
method for tax accounting purposes that allowed degressive depreciations with a
maximum rate of 25% for movable assets like machines and cars before 2008. In addition,
one of the reform's main goals was to reduce the incentives of multinational companies
to shift profits abroad. Along with the tax rate cut, the reform introduced stricter transfer
8
pricing regulations broadening the corporate tax base. These rules should not be relevant
for our analysis and are therefore not discussed in detail.
3. Theory and hypotheses
3.1 Intertemporal income shifting
Our study analyzes whether corporations accumulate depreciation expenses in the year
before a corporate tax cut to shift taxable profits to post-reform years. The rationale is
simple: We assume that a corporation tries to minimize its tax burden across years. If the
corporation anticipates a change in the applicable tax rate, it is favorable to subject taxable
profits to the lower rate. In case of the German BTR 2008, there was an economically
significant reduction of the aggregate business tax rate for corporations in the years after
2007 ranging from 7.8 percentage points to 10.2 percentage points. As the reform had
been announced during the year 2007, this created a strong incentive to shift earnings
from corporations to the following years (e.g. by delaying sales contracts) and to bring
forward business expenses from 2008 to 2007.
We expect that corporations had a strong incentive to accumulate depreciations in 2007.
However, such a behavior is only feasible if firms have at least some discretion in their
depreciation methods for tax accounting. German tax accounting regulations for
depreciations are relatively strict and set clear legal constraints. For example, the straight-
line method is regarded as standard method, depreciation tables (German: AfA-Tabellen)
of the German fiscal administration define amortization periods for a myriad of assets and
industries, amortization periods for buildings are defined by the German income tax code,
and tax-relevant write-offs (German: Teilwertabschreibung) are only possible in case of
an enduring reduction of the asset value.
Nevertheless, German tax accounting regulations for depreciations and write-offs also
provide discretion for intertemporal income shifting. For example, taxpayers may deviate
from amortization periods in depreciation tables, if they can prove a more accelerated loss
of asset value (e.g., cars with a very high road performance). In case of movable fixed
assets, businesses could choose the declining-balance method instead of the straight-line
method until the year 2007 for new assets. In case of movable assets with an asset value
below 410 € (without VAT), firms could decide for an immediate write-off in the
acquisition year. Furthermore, there exist special depreciation regimes like a bonus
depreciation for SME firms and accelerated depreciation schemes for historical buildings
and buildings in redevelopment areas. Regarding write-offs and amortizations, the

9
German income tax code requires a long-term reduction in asset value (measured in
market prices). However, in practice there is discretion about “true” asset values as well
as about the question if a reduction in asset values will be “long-term”.
An interesting feature of the German tax accounting regulations especially before the
German balance sheet reform 2009 (German: Bilanzrechtsmodernisierungsgesetz 2009)
is a high degree of book-tax conformity. Thus, in principle German tax depreciations
should be in line with book depreciations. However, in practice there was a wide range
for differences of tax and book depreciations even before the balance sheet reform 2009.
Most relevant, businesses have free choice to define their amortization periods and
depreciation methods in their financial accounts as long as they can be justified by rational
commercial assessment. By contrast, there exist strict regulations for amortization periods
and depreciation methods in the tax accounts as aforementioned. Regarding write-offs,
the German GAAP demand a write-off for current assets in case of any reduction of asset
value, while the German tax accounting rules only allow for a write-of in case of an
enduring loss in asset value. In addition, immediate write-offs for small-value assets in
the tax accounts did not have to be considered in the financial accounts.
Concluding, we expect a strong incentive of the German BTR 2008 for German
corporations to accumulate tax depreciations in the year 2007 and sufficient opportunity
to do so. In spite of a generally high degree of book-tax-conformity in 2007, there was
also room for non-conforming tax avoidance strategies that accelerated tax depreciations
without affecting book income. Thus, while acculmulated tax depreciations might have
been related to financial reporting costs resulting from a tax-driven reduction of book
income in 2007, this should not be the case under all circumstances. We expect
abnormally high depreciation expenses in 2007 for corporate taxpayers.
H1: Corporations accumulate tax depreciations in 2007 resulting in abnormally high
depreciations during that year.
3.2 Heterogeneity in tax avoidance incentives
The incentives of intertemporal income shifting are heterogeneous across firms.
Following the literature, we focus on two aspects. First, findings of Manzon (1992),
Scholes et al. (1992) and Maydew (1997) suggest that loss firms have a smaller incentive
to accumulate business expenses for intertemporal income shifing. The rational of that
consideration is simple. It is only advantageous for a company to accumulate tax-
deductible depreciation expenses in one year if this reduces taxable profits and avoids tax
10
payments. For corporations without positive taxable profits in the year prior to the tax
rate cut, there is no incentive to reduce tax payments through higher depreciations
(Manzon 1992). Thus, accumulating depreciations will not help much to save tax
payments for loss firms. As we do not have access to detailed data on tax loss
carryforwards, we focus on corporations with current ongoing losses and hypothesize:
H2a: Corporations with current losses accumulate less tax depreciations in 2007 than
corporations with current profits.
Incentives for intertemporal income shifting may also be heterogeneous for different
leverage levels. Profits may act as a signal to creditors of companies with high third-party
loans. Considering that reported net income and taxable income of German firms were
closely related due to book-tax conformity in 2007, shifting income away from 2007 into
future periods may also have affected book income resulting in financial reporting costs
for high-leverage companies, for example if such a strategy led to a violation of
covenants. Following Guenther (1994), we expect that leverage reduces the willingness
to engage in intertemporal income shifting. Due to data limitations, we proxy high-
leverage firms as firms with abnormally high interest expenses.
H2b: Corporations with abnormally high interest expenses accumulate tax depreciations
in 2007 to a smaller degree.
3.3 Heterogeneity in income shifting opportunity and shifting costs
We further address the heterogeneity of intertemporal shifting opportunity considering
depreciations on new investments in 2007 compared to depreciations on old investments
from earlier years. In case of old investments, taxpayers already specified amortization
periods and depreciation methods in earlier years. Thus, to accelerate depreciations, the
taypayer has to provide arguments for changes in amortization periods and depreciation
methods, which is typically hard to justify in practice. In addition, taxpayers may argue
in favor of a long-term reduction in asset value and write off the asset value of old
investments. However, resulting from the jurisdiction of the German Fiscal Supreme
Court (German: Bundesfinanzhof), such opportunities are clearly limited. In case of
depreciable fixed assets, the fair value test of the German Fiscal Supreme Court requires
an effective reduction in book value of about 50% (e.g., Bundesfinanzhof 2006). In case
of hidden reserves resulting from an increase in asset prices (e.g., buildings), the required
reduction in asset values would have been even higher.

11
By contrast, German tax law provided more opportunity to accumulate depreciations for
investments in new assets, as amortization periods and depreciation methods had not
already been pre-determined in earlier periods. Considering movable fixed assets until
2007, taxpayers could choose the declining balance method, which typically accelerated
depreciations. In addition, there was an opportunity of a full write-off for movable assets
with a low aquisiation cost for each single asset (below 410 € excluding VAT), and
special depreciation schemes for investments of small and medium firms and investments
in historical buildings and buildings in redevelopment areas. Considering these aspects,
we expect a higher opportunity to accumulate depreciation expense for firms with a
relatively high share of new investments in their capital stock. We hypothesize:
H3a: Corporations with a high ratio of new investments to their capital stock accumulate
tax depreciations in 2007 to a higher degree.
We further address the relationship of firm size and intertemporal income shifting.
Existing research on the relationship of firm size and tax avoidance practices has provided
contradictory evidence (Zimmerman 1983; Rego 2003; Richardson and Lanis 2007).
Corresponding to the political-cost hypothesis (Zimmerman 1983), large firms have
higher political costs of aggressive tax avoidance strategies, which may include aspects
like audit risks, lobbyism, and reputational costs of aggressive tax planning. However, as
documented by research on tax compliance and planning costs (Eichfelder and
Vaillancourt 2014), there exist enormous economies of scale in tax compliance and tax
planning processes. Thus, large firms are more cost-effective in promoting tax avoidance
practices, as the marginal costs of tax planning decrease in the volume of such activities.
In line with that argument, Rego (2003) and Richardson and Lanis (2007) find a positive
relationship between measures of tax avoidance and firm size. In addition, Knittel (2007)
finds low take-up rates of small U.S. companies (with high compliance costs) for the 2002
and the 2004 U.S. bonus depreciation. Eichfelder and Schneider (2014) provide further
evidence that large German firms with relatively low tax compliance costs reacted to a
stronger degree on investment tax incentives of a German bonus depreciation program
for the reconstruction of Eastern Germany in the 1990s.
Overall, the literature provides strong evidence for the planning-cost hypothesis, while
the political cost hypothesis should be most relevant for a comparison of very large firms
to other large firms (thus, both with low marginal planning costs). Our data set primarily
consists of private companies of the German industrial sector with a relatively small size
(minimum size of 20 employees). Therefore, we expect that the planning-cost hypothesis

12
is more relevant in our case and hypothesize a negative relationship of business size
(measured by turnover) and the accumulation of depreciation expenses in 2007.
H3b: Large corporations accumulate tax depreciations in 2007 to a higher degree.
4. Empirical strategy and data
4.1 Identification strategy
We rely on a difference-in-differences identification strategy, comparing depreciation
expenses of German corporations with German partnerships and sole proprietorships
around the corporate tax cut in 2008. The tax cut in the German corporate income tax
from 25% to 15% was only relevant for German corporations. In sum with further changes
of the German local business tax, BTR 2008 reduced the aggregate burden of German
corporations by about 7.8 to 10.2 percentage points. By contrast, individual partners of
German partnerships and sole prorietorships remained unaffected by the reduction of the
German corporate income tax rate and therefore faced a much smaller and more
heterogenous incentive for intertemporal income shifting from 2007 to 2008, depending
on their personal income tax rate and the local business tax rate (see also Section 2).
Therefore, we regard partnerships and sole proprietorships as an appropriate control
group to identify the strong economic incentive for intertemporal income shifting
resulting from the reduction of the German corporate income tax rate by the end of 2007.
We estimate the following regression equation to test our hypothesis H1:
𝐷𝑒𝑝𝑟𝑖,𝑡 = 𝛼0 + β1 𝐶𝑜𝑟𝑝𝑖 × 2007𝑡 + β2 𝐶𝑎𝑝𝑖𝑡𝑎𝑙 𝑆𝑡𝑜𝑐𝑘𝑖,𝑡−1
+ β3 𝐼𝑛𝑣𝑒𝑠𝑡𝑚𝑒𝑛𝑡𝑖,𝑡 + γ 𝐶𝑜𝑛𝑡𝑟𝑜𝑙𝑠𝑖,𝑡 + 𝐹𝑖𝑟𝑚𝑖 + 𝑌𝑒𝑎𝑟𝑡 + 𝜖𝑖,𝑡
(1)
The dependent variable is the logarithm of depreciations for tax purposes 𝐷𝑒𝑝𝑟𝑖,𝑡 of firm
𝑖 in year 𝑡. The independent variable of interest is the interaction term between 𝐶𝑜𝑟𝑝𝑖 and
2007. The dummy variable 𝐶𝑜𝑟𝑝𝑖 has a value of one if a firm is a corporation and zero
otherwise. The dummy variable 2007𝑡 has a value of one for the year 2007 before the tax
rate cut (2007 = 1 if 𝑡 = 2007). Using the interaction term, we measure how the
temporal difference in depreciation expenses between 2007 and the other sample years of
corporations relates to the temporal difference of depreciatons of partnerships and larger
sole proprietorships with a minimum of 20 employees. We expect an abnormal increase
in the depreciations of corporations in 2007 captured by 𝐶𝑜𝑟𝑝𝑖 × 2007𝑡.
Depreciations largely depend on the book value of fixed assets, which depends on
investment activities and depreciations in earlier periods. We account for that by
13
including a measure for the beginning-of-the-year capital stock CapitalStocki,t-1,
acknowledging that companies with higher depreciable fixed assets have higher
depreciation expenses. We provide a detailed explanation on the calculation of
CapitalStocki,t-1 in Section 4.2. In addition, current investments also have a positive
impact on depreciations. We include the logarithm of current net investments
(Investmenti,t). We define net investments as gross investments minus disinvestments in
fixed assets and add one to avoid undefined logarithmic values. By including
Investmenti,t, we control for potential changes in the investment activities of firms (e.g., a
shifting of investments between both periods) that could result from the BTR 2008. Thus,
we ensure that our findings result from intertemporal income shifting and not from
intertemporal shifting of investments.
We add a number of control variables including the marginal business tax rate of firm i
Tax Ratei,t, the ratio of Ebitda (earnings before interest, tax, depreciation and
amortization) to turnover of i Ebitda per Turnoveri,t, the number of German
establishments of an entity Plantsi,t, and the logarithm of interest expense Interesti,t. To
account for potential income shifting in the year 2008, we further add an interaction term
𝐶𝑜𝑟𝑝𝑖 × 2008𝑡, which corresponds to 𝐶𝑜𝑟𝑝𝑖 × 2007𝑡, but accounts for the year 2008.
We further add year fixed effects that control for general shocks and trends like the
business cycle. Firm fixed effects Firmi account for time-invariant firm-specific
characteristics (e.g, the influence of the legal form of the company, which does not change
during the observation period). Thus, the variable 𝐶𝑜𝑟𝑝𝑖 does not have to be included in
the regression separately. Time-invariant industry effects are also absorbed by Firmi.
A benefit of our difference-in-differences strategy is that it implicitly accounts for other
regulations of the BTR 2008 reform package affecting both the treatment group and the
control group (e.g., changes in the local business tax, abolishment of the declining balance
method for movable fixed assets, introduction of stricter thin-capitalization rules). In
addition, it also accounts for major economic trends and shocks (e.g. the financial crisis
2007/2008) affecting both groups. In robustness checks, we further use propensity score
weighting to make our control group more similar to our treatment group. Corresponding
regression results are almost identical to our baseline regressions.
We should mention that our identification strategy also has a number of weak points.
First, due to changes in personal income tax rates and local business tax rates, tax
incentives for partnerships and sole proprietorships may also have changed during the
years 2007 and 2008, though to a much lesser degree than for corporations. While

14
corresponding tax incentive changes for partnerships and sole proprietorships were
heterogenous, corresponding effects should typically be “white noise” and affect the error
term. Second, our data lacks of information about proprietors of the analyzed businesses.
As a result, partnerships could also have corporations as partners with similar incentives
for intertemporal income shifting as the corporations in our treatment group. In these
cases the “corporate partners” of a partnership could influence the tax avoidance strategy
of the partnership with the target of shifting income from 2007 to 2008. Concluding, we
cannot rule out that incentives for intertemporal income shifting also affected partnership
entitites that we are using as a control group. Therefore, our quantative estimates on the
impact of the tax cut on depreciations should be interpreted with due caution.
In further tests, we analyze the heterogeneity of tax effects within the treatment group.
We focus on depreciations of German corporations in the year 2007 considering four
aspects: (a) loss corporations, (b) high-leverage corporations, (c) high-investment
corporations, and (d) large corporations. In all these tests, we generally use only the
remaining corporations as baseline/control groups and do not include partnerships. Thus,
the baseline groups of our heterogeneity tests differ from each other as well as from the
control group of our main specification (partnerships and sole proprietorships). Apart
from the tested properties, the group of interest and the baseline group in our
heterogeneity tests face the same tax incentives resulting from BTR 2008, which allows
us an identification of the impact of heterogeneity properties (e.g., high leverage). Note
that the heterogeneity properties can vary over time, which allows us to keep all
observations of corporations in our sample.8 We estimate the following regression
equation (2) for out tests on H2a to H3b:
𝐷𝑒𝑝𝑟𝑖,𝑡 = 𝛼0 + β1 𝐻𝑖,𝑡 × 2007𝑡 + β2 𝐻𝑖,𝑡 + β3 𝐶𝑎𝑝𝑖𝑡𝑎𝑙 𝑆𝑡𝑜𝑐𝑘𝑖,𝑡−1
β4 𝐼𝑛𝑣𝑒𝑠𝑡𝑚𝑒𝑛𝑡𝑖,𝑡 + γ 𝐶𝑜𝑛𝑡𝑟𝑜𝑙𝑠𝑖,𝑡 + 𝛼𝑖 + 𝛼𝑡 + 𝜖𝑖,𝑡
(2)
𝐻𝑖,𝑡 is a dummy variable for a certain heterogeneity property, which is calculated for each
year separately.Thus, 𝐻𝑖,𝑡 is not captured by our firm fixed effects. For our tests on H2a,
𝐻𝑖,𝑡 takes a value of one in case of a loss in the current year (Lossi,t, e.i. a negative sum of
sales revenue plus goods on own account minus production costs and other cost
categories). Testing H2b, 𝐻𝑖,𝑡 represents a dummy variable for firms with high interest
expenses (High Interesti,t). High Interesti,t has a value of one if the interest-to-sales-ratio
8 In a classical difference-in-difference approach, we would focus on the value of 𝐻𝑖,𝑡 in 2007. In this
case, we would lose all observations of corporations without survey information in 2007.
15
of firm i in year t lies in the the upper quartile of the interest-to-sales ratios over all
corporations. Testing H3a, 𝐻𝑖,𝑡 represents a dummy with a value of one for firms with
high gross investments in the current year (High Investmenti,t). High Investmenti,t is equal
to one if the investment-to-capital ratio (investment in movable fixed assets) of firm i in
year t lies in the the upper quartile. Testing H3b, 𝐻𝑖,𝑡 stands for a dummy with a value of
one if the average turnover over the current year t and the last year t–1 of firm i falls in
the upper quartile (High Sizei,t).
Controlling for 𝐻𝑖,𝑡, we identify reactions of heterogenous firm types by the interaction
term 𝐻𝑖,𝑡 × 2007𝑡. Again, we further account for 𝐶𝑎𝑝𝑖𝑡𝑎𝑙 𝑆𝑡𝑜𝑐𝑘𝑖,𝑡−1, 𝐼𝑛𝑣𝑒𝑠𝑡𝑚𝑒𝑛𝑡𝑖,𝑡, the
other 𝐶𝑜𝑛𝑡𝑟𝑜𝑙𝑠𝑖,𝑡, and firm and year fixed effects. We provide a detailed documentation
of all regression variables in Table 1.
[Table 1 about here]
4.2 Data
We rely on data from the AFiD panel for the manufacturing and mining industries9
(German: Amtliche Firmendaten in Deutschland im Verarbeitenden Gewerbe, Bergbau
und Gewinnung von Steinen und Erden) representing about one quarter of the gross value
added of the German economy (Destatis, 2015). As depreciable fixed assets are an
important factor in these industries, we have an optimal data source for analyzing
depreciation effects. While we have access on data from 1995 to 2008, we only rely on
data from 2003 to 2008 to avoid statistical problems that would be related to the German
tax reforms of the years 1999 to 2002. The AFiD panel comprises several mandatory
business surveys conducted by the German Federal Statistical Office (German:
Statistisches Bundesamt) that can be accessed by remote-data processing. A more detailed
documentation of the data is provided by Malchin and Voshage (2009).
We use information from two surveys of AFiD. (1) The Cost Structure Survey (German:
Kostenstrukturerhebung) provides information on sales revenue, earnings and a detailed
9 Data source: “RDC of the Federal Statistical Office and the Statistical Offices of the Länder, AFiD
panel for the manufacturing and mining industries, 1995-2008”; see also
http://www.forschungsdatenzentrum.de/bestand/afid-panel_industriebetriebe/index.asp. Original titles
of the detailed statistics (in German language) are: AFiD-Panel Industrieunternehmen, (information on
the firm level) consisting of the Kostenstrukturerhebung im Bereich Verarbeitendes Gewerbe, Bergbau
und Gewinnung von Steinen und Erden (Cost Structure Survey) and AFiD-Panel Industriebetriebe
(information on the establishment level), consisting of the Jahresergebnisse des Monatsberichtes für
Betriebe im Verarbeitenden Gewerbe, Bergbau und Gewinnung von Steinen und Erden (Monthly
Report), and the Betriebsdatensätze der Investitionserhebung im Verarbeitenden Gewerbe, Bergbau
und Gewinnung von Steinen und Erden (Investment Survey on the permanent establishment level). We
hereafter refer to these surveys as AFid panel for the manufacturing and mining industries.

16
list of business expenses (including depreciations for tax purposes) on the level of the
single firm entity (unsolidated data). Thus, the information of the Cost Structure Survey
is similar to the profit assessment in the annual accounts and provides information on loss
firms. Apart from a few positions, the Cost Structure Survey does not provide balance
sheet information on capital stock or the accumulated value of provisions. (2) The
Investment Survey (German: Investitionserhebung) gives detailed information on
investments in different asset types (e.g., land, buildings, and movable fixed assets) on
the establishment level. We aggregate that information on the level of the single entity
firm. While the Investment Survey consists of an almost full sample of German plants in
the manufacturing and mining industries with at least 20 employees, the Cost Structure
Survey is based on a 50% random sample. Thus, our analysis is based on unconsolidated
data of a 50% sample of all firms with at least 20 employees in the manufacturing and
mining sector.
For our analysis, AFiD has a number of major benefits. First, while the existing literature
is limited to depreciations in financial accounts (e.g. Boynton et al. 1992; Scholes et al.
1992; Guenther 1994; Lopez et al. 1998; Maydew 1997, Andries et al. 2017; Sundvik
2017), AFiD provides information on depreciations for tax accounting purposes. In spite
of the relatively high level of book-tax conformity in Germany in 2007, there were major
differences between depreciation regulations for financial accounting and tax accounting.
Most relevant, amortization periods and legitimate depreciation methods are clearly
defined for each asset type in the German income tax code and the depreciation tables of
the German fiscal administration, while German GAAP only require that amortization
periods and depreciation methods fit well with the expectations of an educated and
rational businessman. Thus, there is much more leeway in financial accounting and the
question arises if the standards of tax accounting leave firms sufficient opportunity for
intertemporal income shifting. Second, AFiD provides detailed information on
investments in real estate fixed assets and movable fixed assets that can be used for our
tests on H3a and H3b. An third benefit stems from the high coverage of the AFiD data
considering a 50% sample of all firms in the manufacturing and mining sector with at
least 20 employees. As the surveys are mandatory, missing or incomplete information is
a minor issue. Thus, AFiD gives a comprehensive picture not only for public firms but
also for small and medium-sized firms.
A disadvantage of the data is that it does not provide information on firm ownership or
holding structures. Thus, we obtain data for one entity but not for subsidiaries, parent
17
companies or owners of that entity. Therefore, we are not able to distinguish partnerships
with solely individual partners from partnerships with corporate partners. Further, the
data are restricted to the manufacturing mining sector, and they provide information only
on gross investment but not on the capital stock.
We extract information on depreciation expenses for tax purposes from the cost structure
survey. As the depreciations are, according to our expectations, strongly skewed, we use
the natural logarithm of depreciations for tax purposes 𝐷𝑒𝑝𝑟𝑖,𝑡 as the dependent variable.
Average depreciations and write-offs for the full sample amount to €2.73m between 2003
and 2008. The values for the arithmetic average and the median confirm a strongly left-
skewed distribution of depreciations.
As documented by Equations (1) and (2), we control for the value of depreciable fixed
assets by including the natural logarithm of the beginning-of-the-year capital stock in the
regression (CapitalStocki,t-1). While AFiD includes detailed information on depreciations
and investments in fixed assets, it does not provide the book value of the capital stock.
Following Eichfelder and Schneider (2014), we calculate the capital stock by using the
time series of depreciations and investments on the firm level since the year 1995 in two
steps. 1) As a start value, we gross up the depreciation expenses of each year resulting
from buildings and equipment. We assume that the average amortization period for
movable fixed assets is seven years (Devereux et al. 2009), while the average amortization
period for buildings is 35.66 years in 2008.10 We allocate depreciations to equipment and
buildings using information from the Investment Survey on the average composition of
investments among different firm types and industries and assuming a constant
investment activity of firms. For example, if 20% of investments are building
investments, we assume that 20% of the capital stock consist of buildings. Then we
extrapolate the current value of the capital stock by multiplying depreciations from
equipment and buildings with half of the corresponding amortization periods (7 years for
equipment and 35.66 years for buildings). In doing so, we implicitly assume that on
average half of depreciations has already been used in earlier periods (= half of the
amortization period) has already been passed on average for the sum of fixed assets. As
we intend to calculate the capital stock at the beginning of the year, we subtract half of
the current year's investments, assuming that investments are linearly distributed over the
10 This amortization period is a weighted average of periods for different types of business buildings
(including buildings with amortization periods of 25 years, 33 years, 40 years and 50 years). We also
account for the fact that amortization periods for certain types of buildings changed over time.
Eichfelder and Schneider (2014) provide a more detailed explanation.

18
entire year and are depreciated on a pro-rata-temporis basis. 2) We use the start value of
step 1) as well as information on depreciation and investments over the whole time series
to calculate book values of capital stocks at the beginning of each period. Starting in 1996,
we define the book value of the capital stock at the beginning of t as the start value of the
capital stock in t–1 plus investments t–1 and minus depreciations in t–1. Thus, we use the
path-dependency of capital stocks and our time series information to calculate accurate
book values of capital stocks. As our final sample exclusively relies on the years 2003 to
2008, this approach should ensure a high quality of our calculated book values of capital
stocks. We further consider in our regressions the logarithm of current years investments
(Investmenti,t), which is gross investments in fixed assets minus desinvestments in fixed
assets (plus one to avoid undefined logarithmic values).
We observe an average capital stock of €26.73m for the full sample between 2003 and
2008. The average capital stock for corporations is €31.58m, compared to €18.03m for
partnerships and sole proprietorships. Comparing arithmetic average and median suggests
a left-skewed distribution. Therefore, we use the natural logarithm of the capital stock as
a control variable.
[Insert Table 2 about here]
Table 2 reports descriptive statistics for our dependent variable and our main explanatory
variables for the aggregate sample (panel A), corporations (panel B) and partnerships and
sole proprietorships (panel C). Similar to the capital stock, average depreciations are
higher for corporations than for partnerships and sole proprietorships (€3.30m compared
to €1.71m). The same holds for Ebitda (€11.00m to 5.55m), turnover (€115.73m to
€51.15m), and interest expense (€0.97m to €0.48m), while the average number of plants
does not differ significantly between both groups. Overall, the average size of the
corporations in our sample significantly exceeds the average size of the partnerships and
sole proprietorships. However, this is not necessarily a problem for our identification
strategy as time-invariant differences among firms are captured by firm-fixed effects and
other control variables.
Differences in the calculated business tax rates of both groups mainly result from the
assumptions of our calculation approach. We generally assume that individual taxpayers
(including partnerships and their partners) fall under the German tax system for individual
taxpayers (personal income tax including solidarity tax surcharge plus local business tax
including a local business tax credit) and consider in these cases the maximum personal
income tax rate of the respective year. By contrast, the business tax rate of corporate
19
taxpayers only considers the tax burden on accumulated profits (corporate income tax
including solidarity tax surcharge plus local business tax) but not the tax burden on profit
distributions, which depends on the type of shareholder (e.g., individual shareholder,
corporate shareholder). Our calculations cleary reveal a strong reduction of TaxRate for
the corporation subsample. The limited increase in TaxRate for the subsample of
partnerships and sole proprietorships is mainly a consequence of the increase in the
maximum marginal income tax rate from 42% to 45% from 2007 to 2008, which we
generally assume for calculated business tax rates for partnerships and sole
proprietorships. However, as our data does not provide sufficient information to account
for variation in personal income tax rates among individual taxpayers, this should be
interpreted with caution.
Overall, our panel consists of 85,666 firm-year observations, with 55.297 observations
from corporations and 30.369 observations from partnerships and single entity firms.
Therefore, approximately two thirds of firms are incorporated. While this ratio is quite
constant over the period 2003 to 2007, we observe a slightly higher number of
corporations in 2008.
5. Results
5.1 Intertemporal income shifting
We estimate Equation (1) to test our first hypothesis and present results in Table 3. In
Column (1), we regress depreciations on the interaction of 𝐶𝑜𝑟𝑝 and the dummy variable
for the year 2007 with CapitalStock and Investment as controls. Column (2) additionally
includes the interaction of 𝐶𝑜𝑟𝑝 and the dummy variable for the year 2008, Column (3)
the business tax rate TaxRate and Columns (4) to (6) additional regression controls Ebitda
per turnover, Interest, and Plants. In all regressions, we account for firm and year fixed
effects. As documented by adjusted R squared, the firm and year fixed effects, the
interaction term of Corp and 2007, CapitalStock, and Investment explain by far most
variation in the data. In fact, these parameters alone account for 95.4% of the variation in
the dependent variable, while adding further variables only adds additional 0.2% of
explanatory power as measured by adjusted R squared.
[Insert Table 3 about here]
The estimated coefficient of the interaction term 𝐶𝑜𝑟𝑝 × 2007 is positive, significant
(𝑝 < 0.01) and quantatively robust over all specifications. The size of the estimated

20
coefficient ranges just slightly from 0.0237 in Column (3) to 0.0265 in Column (5). Due
to the logarithmic specification of the dependent variable, our results are to be interpreted
as semi-elasticities. Thus, we have to recalculate estimated dummy variable coefficients
to obtain the impact on depreciations. As shown by Kennedy (1981), the percentage
change can be approximated by ˆ ˆ1exp 12i iVar , with the estimated regression
coefficient ˆi and the variance ˆ
iVar resulting in an estimated change from 2.4% to
2.7%, and 2.5% if we consider all regression controls as in Column (6). Regarding
Column (6) as best estimate and supporting H1, BTR 2008 increased depreciations by
2.5% in 2007.
Coefficients for 𝐶𝑜𝑟𝑝 × 2008 are never significantly different from zero. In 2008,
corporations do not have a tax incentive for an accumulation of depreciation expenses.
As the tax rate remained stable thereafter, there is also no clear tax incentive to reduce
depreciations. As expected, coefficients of 𝐶𝑎𝑝𝑖𝑡𝑎𝑙 𝑆𝑡𝑜𝑐𝑘 and Investment are positive
and significant (𝑝 < 0.01). Thus, depreciations increase in the book values of depreciable
capital stocks and investments. We find positive coefficients for Ebitda per turnover,
Interest, and Plants, suggesting that high-yield firms, high-debt firms and firms with
multiple plants have on average higher depreciation expenses. For TaxRate, we find no
significant regression coefficient. This might result from low variation or measurement
error in this (calculated) control variable.
We can put the size of our effect into perspective of the federal corporate income tax
statistics in 2010. The overall taxable income for corporations in 2010 amounts to
€169.7bn. Statistics of the Deutsche Bundesbank on representative balance sheet
information of German firms (Deutsche Bundesbank, 2014, Sheet 1) report for the
average German corporation in 2010 a depreciation-to-revenues ratio of 2.9%, a net
profit-to-revenues ratio of 3.0%, and an income taxes-to-revenues ratio of 0.9% (adding
up to a taxable income-to-revenues ratio of 3.9%). Thus, our estimated value of 2.5%
would translate into an amount of shifted income of approximately €3.1bn (= 2.5% ∙
€169.7𝑏𝑛
3.9%∙ 2.9%). Consequently, the corporate income tax revenue around the tax cut could
be reduced by up to 0.8% of the 2010 corporate income tax if income is shifted to a period
with a 10 percentage points lower tax rate (=€3.1𝑏𝑛∙10%
€169.7𝑏𝑛
3.9%∙0.9%
).
One obvious issue of a DiD approach is whether the pre-treatment common trends
assumption holds. We document the common trend visually. We chose an approach based
21
on Autor (2003) and Pischke (2007). It is comparable to introducing pseudo reforms. But
instead of measuring the effect of one pseudo reform per regression, we measure the
conditional difference between corporations and the control group for every year in a
single regression:
𝐷𝑒𝑝𝑟𝑖,𝑡 = 𝛼0 + 𝛃𝟏 𝐶𝑜𝑟𝑝𝑖 × 2004𝑡 + 𝛃𝟐 𝐶𝑜𝑟𝑝𝑖 × 2005𝑡 + 𝛃𝟑 𝐶𝑜𝑟𝑝𝑖 × 2006𝑡
+ β4 𝐶𝑜𝑟𝑝𝑖 × 2007𝑡 + β5 𝐶𝑜𝑟𝑝𝑖 × 2008𝑡
+ β6 𝐶𝑎𝑝𝑖𝑡𝑎𝑙 𝑆𝑡𝑜𝑐𝑘𝑖,𝑡 + γ 𝐶𝑜𝑛𝑡𝑟𝑜𝑙𝑠𝑖,𝑡 + 𝛼𝑖 + 𝛼𝑡 + 𝜖𝑖,𝑡
(3)
In this setting, the common trend assumption is consistent with the difference in our
dependent variable (1, 2, 3) not being significant in the pre treatment periods. The
resulting graph is:
[Insert Figure 1 about here]
The difference in the conditional dependent variable is not significant on the 5% level in
the years 2004-2006. There may be an announcement effect in 2006 that would be
consistent with our story (but biases against our results for 2007), but this effect is not
significant on the 5% level. All in all, we conclude that the common trend assumption is
justified in our setting.
5.2 Heterogeneity in the depreciation activity of corporations
For our heterogeneity tests, we rely on Equation (2). We refer to the heterogeneity of
corporations with certain characteristics compared to all other corporations. Thus, while
firms in the treatment and control group are corporations affected by BTR 2008, our
identification strategy focuses on the four addressed heterogeneity items. We document
results in Table 4.
[Insert Table 4 about here]
In Column (1), we test heterogeneity regarding loss firms. Adjusting for the Kennedy
(1981) formula, we find significantly lower depreciation volumes of 9.8% of firms with
a loss in 2007 (negative coefficient of -0.103 of 𝐿𝑜𝑠𝑠 × 2007). Thus, corporations with
smaller tax incentives reacted to a much smaller degree to the BTR 2008. As the
coefficient for 𝐻𝑖𝑔ℎ𝐷𝑒𝑏𝑡 × 2007 in Column (2) is not significant, we cannot provide
valid evidence for H2b suggesting a weaker reaction of firms with high interest expenses
and likewise high financial reporting costs. In part, this might be due to the fact that we
do not only observe conforming tax-induced earnings management (as in Guenther,
1994), but also non-conforming tax avoidance. In line with H3a, the regression coefficient

22
of 𝐻𝑖𝑔ℎ𝐼𝑛𝑣𝑒𝑠𝑡𝑚𝑒𝑛𝑡 × 2007 in Column (3) suggests that firms with a high investment
activity in 2007 had a very high abnormal increase in depreciation volume of about 25.6%
compared to other corporations without abnormally high investments in 2007. Note that
this finding is not driven by the mechanical relationship of current investments and
depreciations as our regression model controls for the volume of current investments as
well as for the dummy variable 𝐻𝑖𝑔ℎ𝐼𝑛𝑣𝑒𝑠𝑡𝑚𝑒𝑛𝑡. Our findings suggest that new
investments provide much more opportunity for intertemporal income shifting via
depreciations. The main reason is that firms choose amortization periods and depreciation
methods in the first year of depreciation. In 2007, firms had the opportunity to select the
declining belance method for movable assets as well as a full write-off for long-term
assets with a low asset value. In addition, in spite of the depreciation tables used for tax
purposes, firms may argue in favor of shorter amortization periods, could depreciate
movable assets with respect to their economic use (e.g., cars with a high road
performance) and could also consider special depreciation regimes for tax purposes (e.g.,
for historical buildings). Fourth, we find evidence supporting the hypothesis that large
firms are more active in intertemporal income shifting, as they are more cost-efficient in
tax planning (planning-cost hypothesis H3b). Compared to other corporations, large
corporations accumulate about 6.1% higher depreciation expenses. Again we control for
purely mechanical effects by our regression controls (e.g., CapitalStock, Investment).
Overall, our heterogeneity tests provide statistically significant and economically strong
evidence for the hypotheses H2a, H3a, and H3b. That holds especially for the higher
opportunity of new investments in fixed assets to provide discretion of depreciation
activity. By contrast, we are not able to confirm the findings of Guenther (1994)
suggesting a weaker reaction of high-debt firms on intertemporal income shifting around
a large tax cut.
5.3 Robustness tests
Finally, we address the robustness of our findings. We concentrate on our main
specifications in Section 5.1 considering three issues: (1) length of the observation period,
(2) analysis of pseudo tax reforms, and (3) the use of propensity-score weighting to make
treatment group and control group more similar to each other.
The observation period from 2003 to 2008 covers predominantly years prior to the
financial crisis. However, we might capture the beginning of the crisis in Germany in the
year 2008. While the difference-in-differences approach principally eliminates influences
of the business cycle, there nevertheless might be divergent effects on the treatment and
23
control group. As a robustness check, we limit the observation period to the years 2003
until 2007, rerun our baseline best estimate from Table 3, Column (6) and display results
in Table 5, Column (1). The estimated coefficient of the variable of interest, the
interaction term between the dummy 𝐶𝑜𝑟𝑝 and the year dummy for 2007, is still
significantly positive and the size of the estimated effect of about 2.5% (see Kennedy
1981) is (without rounding almost) identical to our baseline best estimate (2.5%). Thus,
our finding is robust regarding a shorter observation period.
[Insert Table 5 about here]
According to our hypotheses, 2007 is the only year in the observation period that provides
a tax incentive to accumulate depreciation expenses and therefore shift profits to the
following periods with a lower tax rate for corporations. We conduct a robustness test
establishing pseudo-tax cuts to confirm that our approach does not ignore other effects
that may cause a similar accumulation of depreciation expenses in the other years. We
rerun our baseline specification from Table 3, Column (6), for every interaction term of
𝐶𝑜𝑟𝑝 and the years from 2003 until 2008 (except 2007) to analyze if there is a significant
difference in depreciation expenses between corporations and non-corporate firms
compared to the rest of the observation period in any year.
Table 5, Columns (2) to (6), displays the results. The estimated coefficients of the
interaction terms imitating pseudo-tax reforms are not significant in any specification.
That is, depreciation expenses of corporations only abnormally increase in 2007, but in
no other year. We are thus confident that the effect on depreciations is due to the tax
incentive for intertemporal income shifting resulting from the BTR 2008, since other
effects that influence expenses should also occur in other observation years.
As a third robustness test, we use propensity score weighting to make the treatment group
and the control group more similar to each other. Propensity score weighting is a
statistical method to generate pre-matched samples without throwing away or losing
observations. Therefore, it accounts for the fact that our treatment group in the baseline
sample is larger than our control group (55,297 compared to 30,369 observations).
Different from next-neighbour matching, propensity score weighting in principle
accounts for all observation units, but overweights (underweights) firms of the control
group that are more (less) similar to the treatment group (for more detail see Guo and
Fraser 2015, 239–254). Therefore, propensity score weighting is largely analogous to
Kernel matching estimators that also keep all matched observations but consider different
weights (Caliendo and Kopeinig 2008).
24
In technical terms, our approach is as follows. We perform a logit regression with
treatment status as dependent variable and average values over the years 2003 to 2005
(pre-treatment period) of the following matching characteristics as explanatory variables:
legal form, industry, number of domestic establishments, turnover, wage payments, gross
investments in fixed assets, and costs of goods sold. Using the results of this regression,
we calculate propensity scores and take the inverse of the propensity scores as inverse
probability weights (see also inverse probability of treatment weights, Guo and Fraser
2015, 242–245). Thus, we drop observations of firms that are not included in our sample
during the relevant matching period (2003 throughout 2005), as we are not able to
calculate matching weights for these firms. This includes foundations in later periods as
well as sampling changes over time.
Finally, we perform a weighted ordinary least squares regression (OLS) regression as
documented by Equation (1) using the inverse probabilities as regression weights. Apart
from weighting, the regression approach corresponds to Table 3 and Table 6 documents
the results. The regression coefficient of the interaction term 𝐶𝑜𝑟𝑝 × 2007 is positive and
significantly different from zero in all specifications. Compared to our baseline
specification (Table 3) and our best estimate (2.5%), we find a somewhat smaller increase
of depreciation expenses in 2007 of about 2.1%. Concluding, our findings are fairly robust
with regard to the selected control group and do hold if we make our control group more
comparable to our treatment group via propensity score weighting.
[Insert Table 6 about here]
6. Conclusion
In our paper, we analyze if and to what extent German corporations reacted to a large cut
of the corporate income tax as part of the German BTR 2008 by interemporal income
shifting via depreciations and write-offs. The tax rate reduction provided a strong
incentive to accumulate depreciation expenses in the pre-reform high-tax year 2007. We
use a difference-in-differences approach to identify abnormal depreciation expenses of
corporations with partnerships and sole proprietorships as control group. Using tax
accounting data from an official survey raised by the German Federal Statistical Office
for the German manufacturing and mining industries, we find that corporations increased
depreciation expenses in 2007 by about 2.5%, which translates into lower corporate tax
revenues of approximately 0.8%. The results are qualitatively and quantitatively robust
to a battery of tests and cross checks. One explanation for the relatively moderate effect

25
of BTR 2008 on depreciations in 2007 is that firms should also be active in intertemporal
income shifting in other periods with the general target of accelerating depreciation
expenses. Thus, we are only able to identify the additional effect resulting from the tax
rate incentive of the BTR 2008. In addition, due to the strict tax regulations on
depreciation, there might be a limited ability of firms to additionally accelerate
depreciations in 2007 in order to benefit from the BTR 2008.
We further analyze whether incentives for intertemporal income shifting are
heterogeneous across corporations. We find that loss firms with smaller shifting
incentives are less active in intertemporal income shifting. For high-interest firms with
presumably high financial reporting costs, we find a negative regression coefficient,
which is statistically not significant. Thus, while our findings are consistent with
Guenther (1994), we cannot provide significant evidence. We find a stronger
accumulation of depreciation expenses in 2007 for large firms with a likewise higher cost-
efficiency of tax planning, and especially for firms with high volumes of new investments.
The last finding suggests that especially new investments provide opportunity for
intertemporal income shifting via depreciations as amortization periods and depreciation
methods are not determined yet. By contrast, it seems to be extremely hard for firms to
adjust amortization periods and depreciation methods (including write-offs) for
investments of earlier periods.
The partnerships and sole proprietorships in our control group may also face
(heterogenous) incentives for earnings management and intertemporal income shifting.
Such heterogeneity might bring in white noise in the regression equation. In addition, our
data does not provide information on shareholders, parent companies and partners of our
sample firms. Thus, we cannot rule out the opportunity that some partners of the
partnerships in our control group were corporations and therefore faced similar shifting
incentives than the firms in our treatment group. Considering both aspects, our regression
estimates for 𝐶𝑜𝑟𝑝 × 2007𝑖,𝑡 might be regarded as a lower bound estimate for overall
shifting activity and only identifies additional shifting resulting from the drop in the
German corporate income tax rate from 25% to 15%. Nevertheless, considering the
heterogeneity of tax incentives for partnerships and the small number of corporate
partners, it seems unlikely that the true impact of BTR 2008 excessively exceeds our best
estimate of about 2.5%.
A potential limitation is our focus on German businesses in the manufacturing and mining
industries with at least 20 employees. Thus, it may be debatable to what extent of our
26
findings hold for other countries, industries and very small firms. Considering bonus
depreciations for small firms in the German income tax code (Section 7g), it seems likely
that very small German firms have more discretion in depreciation policies and therefore
reacted more strongly to the incentives of the BTR 2008.
Finally, one might discuss the comparability of our treatment group and our control group.
However, considering the robustness of our findings in the tests with matched samples,
we regard that as a minor issue. Overall, our results provide robust evidence that firms
react to a tax incentive for intertemporal income shifting by adjusting their depreciations
and write-offs. As suggested by our heterogeneity tests, such firm reactions are widely
restricted by a lack of discretion in depreciations and write-offs, shifting incentives (e.g.,
loss firms), and the tax planning costs and risks of intertemporal shifting of income.
References
Andries, Kathleen, Cools, Martine, Van Uytbergen, Steve (2017): To shift or not to shift?
Intertemporal income shifting as a response to the introduction of the risk capital
allowance in Belgium. European Accounting Review, forthcoming.
Autor, David H. (2003): Outsourcing at Will: The Contribution of Unjust Dismissal
Doctrine to the Growth of Employment Outsourcing. Journal of Labor Economics
21: 1–42.
Ball, Ray, Shivakumar, Lakshmanan (2005): Earnings quality in UK private firms:
comparative loss recognition timeliness. Journal of Accounting and Economics 39:
83–128.
Boynton, Charles E., Dobbins, Paul S., Plesko, George A. (1992): Earnings management
and the corporate alternative minimum tax. Journal of Accounting Research 30
(Supplement): 131–153.
Bundesfinanzhof (2006), Court decision I R 22/05v from March 14, 2006.
Betriebsberater 61: 1737.
Burgstahler, David C., Hail, Luzi, Leuz, Christian (2006): The importance of reporting
incentives: Earnings management in European private and public firms. The
Accounting Review 81: 983–1016.
Calegari, Michael J. (2000): The effect of tax accounting rules on capital structure and
discretionary accruals. Journal of Accounting and Economics 30: 1–31.

27
Caliendo, Marco, Kopeinig, Sabine (2008): Some practical guidance for the
implementation of propensity score matching. Journal of Economic Surveys 22: 31–
72.
Cloyd, C. Bryan, Pratt, Jamie, Stock, Toby (1996): The use of financial accounting choice
to support aggressive tax positions: Public and private firms. Journal of Accounting
Research 34: 23–43.
Dammon, Robert M., Senbet, Lemma W. (1988): The effect of taxes and depreciation on
corporate investment and financial leverage. Journal of Finance 43: 357–373.
Destatis (2015), National Accounts: Gross value added by industries,
https://www.destatis.de/EN/FactsFigures/NationalEconomyEnvironment/National
Accounts/DomesticProduct/Tables/GrossValueAddedIndustries_BWS.html, last
updated: 25.8.2015, retrieved: 23.9.2015.
Deutsche Bundesbank (2014), Verhältniskennzahlen aus Jahresabschlüssen deutscher
Unternehmen von 2010 bis 2011: Statistische Sonderveröffentlichung 6, Frankfurt
a.M.
Devereux, Michael P., Elschner, Christina, Endres, Dieter, Spengel, Christoph (2009):
Effective tax levels using the Devereux/Griffith method, Project for the EU
Commission TAXUD/2008/CC/09, ZEW, Mannheim/Oxford.
Eichfelder, Sebastian, Schneider, Kerstin (2014): Tax incentives and business investment:
Evidence from German bonus depreciation, CESifo Working Paper 4805, CESifo,
Munich.
Eichfelder, Sebastian, Vaillancourt, François (2014): Tax compliance costs: A review of
cost burdens and cost structures. Hacienda Pública Española / Review of Public
Economics 210: 111–148.
Evers, Maria, T., Meier, Ina, Nicolay, Katharina (2016): Book-tax conformity and
reporting behavior: A quasi-experiment, Discussion Paper 16-008, ZEW,
Mannheim.
Guenther, David A. (1994): Earnings management in response to corporate tax rate
changes: Evidence from the 1986 Tax Reform Act. The Accounting Review 69:
230–243.
Guo, Shenyang, Fraser, Mark W. (2015): Propensity score analysis: Statistical methods
and applications, 2nd Ed., Sage Publishing, Thousand Oaks et al.
28
Kennedy, Peter (1981): Estimation with correctly interpreted dummy variables in semi-
logarithmic equations. American Economic Review 71: 801.
Knittel, Matthew (2007): Corporate response to accelerated tax deprecation: Bonus
deprecations to tax years 2002 to 2004. OTA Working Paper 98, U.S. Department
of the Treasury, Washington D.C.
Kosi, Urska, Valentincic, Aljosa (2013): Write-offs and profitability in private firms:
Disentangling the impact of tax-minimisation incentives. European Accounting
Review 22, 117–150.
Lin, Kenny Z., Mills, Lillian F., Zhang, Fang (2014): Public versus private firm responses
to the tax rate reduction in China. Journal of the American Taxation Association
36: 137–163.
Lopez, Thomas J., Regier, Philip R., Lee, Tanya (1998): Identifying tax-induced earnings
management around TRA 86 as a function of prior tax-aggressive behavior. Journal
of the American Taxation Association 20: 37–56.
Malchin, Anja, Voshage, Ramona (2009): Official firm data for Germany. Schmollers
Jahrbuch/Journal of Applied Social Sciences 129: 501–513.
Manzon Jr., Gil B. (1992): Earnings management of firms subject to the alternative
minimum tax. Journal of the American Taxation Association 14: 88–111.
Maydew, Edward L. (1997): Tax-induced earnings management by firms with net
operating losses. Journal of Accounting Research 35: 83–96.
Pischke, Jörn-Steffen (2007): Empirical Methods in Applied Economics. Manuscript.
Rego, Sonja (2003): Tax avoidance activities of U.S. multinational corporations.
Contemporary Accounting Research 20: 805–833.
Richardson, Grant, Lanis, Roman (2007): Determinants of the variability in corporate
effective tax rates and tax reform: Evidence from Australia. Journal of Accounting
and Public Policy 26: 689–704.
Scholes, Myron S., Wilson, G. Peter, Wolfson, Mark A. (1992), Firms’ responses to
anticipated reductions in tax rates: The Tax Reform Act of 1986. Journal of
Accounting Research 30 (Supplement): 161–185.
Sundvik, Dennis (2017): Earnings management around Swedish corporate income tax
reforms. International Journal of Accounting, Auditing and Performance
Evaluation, forthcoming.

29
Watrin, Christoph, Pott, Christiane, Ullmann, Robert (2012): The effects of book-tax
conformity and tax accounting incentives on financial accounting: evidence from
public and private limited companies in Germany. International Journal of
Accounting, Auditing and Performance Evaluation 8: 274–302.
Zimmerman, Jerold L. (1983): Taxes and firm size. Journal of Accounting and Economics
5: 119–149.

30
Tables
Table 1: Definiton of regression variables
Variable Definition
Depri,t Logarithm of tax-deductible depreciations of tangible fixed assets of
company i in year t.
CapitalStocki,t-1 Logarithm of the book value of capital stock of company i at the
beginning of the year. For a detailed explanation of the calculation of
CapitalStocki,t-1 see
Investmenti,t Logarithm of gross investments in fixed assets minus disinvestments in
fixed assets of company i in year t, + 1 (in order to allow ln(Investmenti,t)
for Investmenti,t = 0)
TaxRatei,t Total marginal business tax rate of company i in year t including
corporate income tax (corporations), personal income tax (partnerships
and sole proprietorships), local business tax, and solidarity tax surcharge.
For partnerships and sole proprietorships, we also consider the local
business tax credit.
Ebitda per Turnoveri,t Earnings before interest, tax, depreciation and amortization, scaled by
Turnover (including variation of half-finished and finished products) of
company i for year t.
Interesti,t Logarithm of interest on borrowed capital of company i in year t.
Plantsi,t Number of domestic establishments of company i in year t.
Corpi Dummy variable which equals 1 if the company i is incorporated.
2003t,…,2008t Dummy variable for the respective years 2003 to 2008.
Hi,t Lossi,t Dummy variable which equals 1 if a firm’s Ebitda in year t is zero or
negative.
HighDebti,t Dummy variable which equals 1 if the ratio of interest per turnover of
company i in year t falls in the upper quartile.
HighInvestmenti,t Dummy variable which equals 1 if the ratio of investments in movable
fixed assets per capital stock of company i in year t falls in the upper
quartile.
HighSizei,t Dummy variable which equals 1 if the average turnover for two periodes
(current and last year) of company i in year t falls in the upper quartile.

31
Table 2: Descriptive Statistics
Panel A: full sample
Variable N Mean Std. Dev. Median first
percentile
99th
percentile
Depr (1000 euro) 85,666 2,734 33,584 324 4 31,897
CapitalStock (1000 euro) 85,666 23,635 198,678 3,410 40 292,773
Investment 85,666 2,786 31,278 237 0 34,440
TaxRate 84,036 0.4012 0.0613 0.3899 0.2668 0.5189
Ebitda (1000 euro) 85,666 8,702 149,115 977 -7,545 98,852
Interest (1000 euro) 85,666 792 11,612 74 0 8,423
Plants 85,666 1.38 2.29 1.00 1.00 7.00
Turnover (1000 euro) 85,666 91.163 975,758 13,651 1,002 1,024,573
Panel B: subsample for corporations
Depr (1000 euro) 55,297 3,278 41,292 312 4 39,734
CapitalStock (1000 euro) 55,297 27,849 242,831 3,233 33 360,968
Investment 55,297 3,348 38,318 232 0 40,023
TaxRate 54,100 0.3636 0.0396 0.3761 0.2632 0.4119
TaxRate2007 8,513 0.3795 0.0128 0.3779 0.3542 0.4063
TaxRate2008 10,615 0.2889 0.0172 0.2863 0.2562 0.3228
Ebitda (1000 euro) 55,297 10,386 180,174 897 -9,343 121,006
Interest (1000 euro) 55,297 959 14,301 65 0 9,845
Plants 55,297 1.40 2.55 1.00 1.00 7.00
Turnover (1000 euro) 55,297 112,925 1,208,360 13,401 1,075 1,291.587
Panel C: subsample for partnerships and sole proprietorships
Depr (1000 euro) 30,369 1,743 8,688 349 7 20,432
CapitalStock (1000 euro) 30,369 15,960 62,341 3,729 61 192,726
Investment 30,369 1,765 9,202 243 0 22,865
TaxRate 29,936 0.4691 0.0234 0.4676 0.4332 0.5239
TaxRate2007 4,731 0.4509 0.0111 0.4488 0.4307 0.4722
TaxRate2008 5,095 0.4741 0.0091 0.4687 0.4674 0.4989
Ebitda (1000 euro) 30,369 5,635 59,988 1,120 -4,641 67,616
Interest (1000 euro) 30,369 490 2,794 92 0 6,312
Plants 30,369 1.36 1.71 1.00 1.00 6.00
Turnover (1000 euro) 30,369 51,538 157,002 14,201 914 629.633
This table reports summary statistics for our variables of main interest. It shows the average values of the
variables from 2003 to 2008 as well as the tax rates for the years 2007 and 2008 separately. Due to the fact that
we use confidential data, we are not allowed to report minimum or maximum values. Therefore, we report the
first and the 99th percentile as approximated values for minimum and maximum. All values are price-adjusted
with the price index for industrial production (base year 2005). Panel A encompasses the whole sample, whereas
panel B refers to corporations (treatment group) and Panel C to partnerships and sole proprietorships (control
group).

32
Table 3: Shifting of Depreciation Expenses around the 2008 Corporate Tax Cut
Variable (1) (2) (3) (4) (5) (6)
Corp×2007 0.0259*** 0.0258** 0.0237** 0.0265*** 0.0265*** 0.0245**
(0.00929) (0.00963) (0.00946) (0.00925) (0.00958) (0.00941)
Corp×2008 -0.000136 -0.000774 -0.000363 -0.00185
(0.0140) (0.0243) (0.0138) (0.0240)
CapitalStock 0.374*** 0.374*** 0.375*** 0.367*** 0.367*** 0.367***
(0.0282) (0.0282) (0.0294) (0.0277) (0.0277) (0.0289)
Investment 0.0179*** 0.0179*** 0.0184*** 0.0173*** 0.0173*** 0.0177***
(0.00115) (0.00115) (0.00117) (0.00114) (0.00114) (0.00116)
TaxRate 0.0188 0.0105
(0.184) (0.181)
Ebitda per Turnover 0.318*** 0.318*** 0.357***
(0.0401) (0.0401) (0.0385)
Interest 0.0166*** 0.0166*** 0.0165***
(0.00165) (0.00165) (0.00170)
Plants 0.0270*** 0.0270*** 0.0281***
(0.00704) (0.00704) (0.00787)
Firm FE Yes Yes Yes Yes Yes Yes
Year FE Yes Yes Yes Yes Yes Yes
Sample Full Full Full Full Full Full
Observations 85,666 85,666 84,036 85,666 85,666 84,036
Within R2 0.0958 0.0958 0.0960 0.105 0.105 0.106
Adjusted R2 0.954 0.954 0.955 0.955 0.955 0.956
Dependent variable is the natural logarithm of depreciation expenses (depr). Corp×2007 and Corp×2008 refer to
the interaction („×”) of the respective variables. We control for the natural logarithm of the capital stock in all
specifications. The variables are defined in Table 1. All results are based on the full sample. Estimations are
performed by ordinary least squares (OLS) and include firm and year fixed effects (FE). Heteroscedasticity-robust
standard errors, which have been clustered at the firm level, are documented in parentheses. ***, **, and * refer to
significant results on the 1%, 5%, and 10% level. Within R2 is obtained by the Stata command xtreg, whereas we
used the areg command for calculating the adjusted R2.
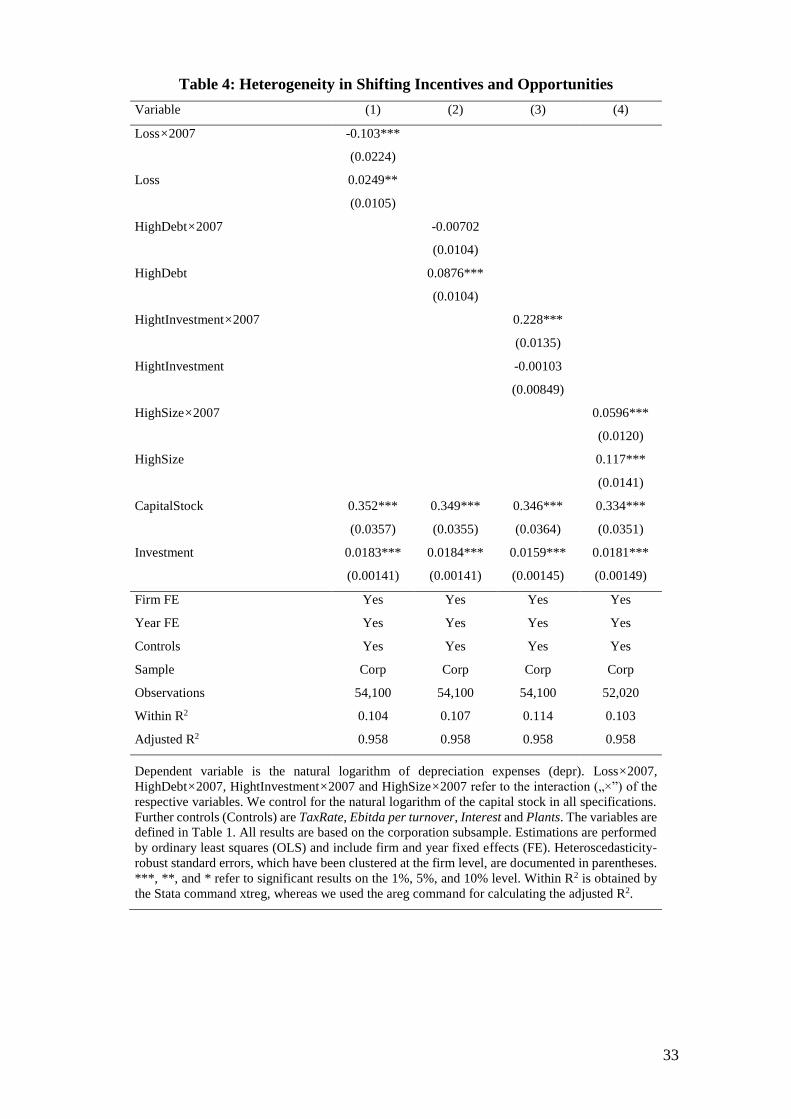
33
Table 4: Heterogeneity in Shifting Incentives and Opportunities
Variable (1) (2) (3) (4)
Loss×2007 -0.103***
(0.0224)
Loss 0.0249**
(0.0105)
HighDebt×2007 -0.00702
(0.0104)
HighDebt 0.0876***
(0.0104)
HightInvestment×2007 0.228***
(0.0135)
HightInvestment -0.00103
(0.00849)
HighSize×2007 0.0596***
(0.0120)
HighSize 0.117***
(0.0141)
CapitalStock 0.352*** 0.349*** 0.346*** 0.334***
(0.0357) (0.0355) (0.0364) (0.0351)
Investment 0.0183*** 0.0184*** 0.0159*** 0.0181***
(0.00141) (0.00141) (0.00145) (0.00149)
Firm FE Yes Yes Yes Yes
Year FE Yes Yes Yes Yes
Controls Yes Yes Yes Yes
Sample Corp Corp Corp Corp
Observations 54,100 54,100 54,100 52,020
Within R2 0.104 0.107 0.114 0.103
Adjusted R2 0.958 0.958 0.958 0.958
Dependent variable is the natural logarithm of depreciation expenses (depr). Loss×2007,
HighDebt×2007, HightInvestment×2007 and HighSize×2007 refer to the interaction („×”) of the
respective variables. We control for the natural logarithm of the capital stock in all specifications.
Further controls (Controls) are TaxRate, Ebitda per turnover, Interest and Plants. The variables are
defined in Table 1. All results are based on the corporation subsample. Estimations are performed
by ordinary least squares (OLS) and include firm and year fixed effects (FE). Heteroscedasticity-
robust standard errors, which have been clustered at the firm level, are documented in parentheses.
***, **, and * refer to significant results on the 1%, 5%, and 10% level. Within R2 is obtained by
the Stata command xtreg, whereas we used the areg command for calculating the adjusted R2.

34
Table 5: Robustness Tests: Limitation of Observation Period,
Pseudo-Tax Cut Analysis
Variable (1) (2) (3) (4) (5) (6)
Corp×2003 -0.00630
(0.00898)
Corp×2004 -0.00762
(0.00702)
Corp×2005 -0.00465
(0.00715)
Corp×2006 0.00113
(0.00662)
Corp×2007 0.0250***
(0.00956)
Corp×2008 0.000856
(0.0242)
CapitalStock 0.368*** 0.367*** 0.367*** 0.367*** 0.367*** 0.367***
(0.0331) (0.0289) (0.0289) (0.0289) (0.0289) (0.0289)
Investment 0.0162*** 0.0177*** 0.0177*** 0.0177*** 0.0177*** 0.0177***
(0.00114) (0.00116) (0.00116) (0.00116) (0.00116) (0.00116)
Firm FE Yes Yes Yes Yes Yes Yes
Year FE Yes Yes Yes Yes Yes Yes
Controls Yes Yes Yes Yes Yes Yes
Sample Without
2008 Full Full Full Full Full
Observations 68,326 84,036 84,036 84,036 84,036 84,036
Within R2 0.0984 0.105 0.105 0.105 0.105 0.105
Adjusted R2 0.957 0.956 0.956 0.956 0.956 0.956
Dependent variable is the natural logarithm of depreciation expenses (depr). Corp×2003 through Corp×2008
refer to the interaction („×”) of the respective variables. We control for the natural logarithm of the capital stock
in all specifications. Further controls (Controls) are TaxRate, Ebitda per turnover, Interest and Plants. The
variables are defined in Table 1. All results are based on the full sample. Estimations are performed by ordinary
least squares (OLS) and include firm and year fixed effects (FE). Heteroscedasticity-robust standard errors,
which have been clustered at the firm level, are documented in parentheses. ***, **, and * refer to significant
results on the 1%, 5%, and 10% level. Within R2 is obtained by the Stata command xtreg, whereas we used the
areg command for calculating the adjusted R2.
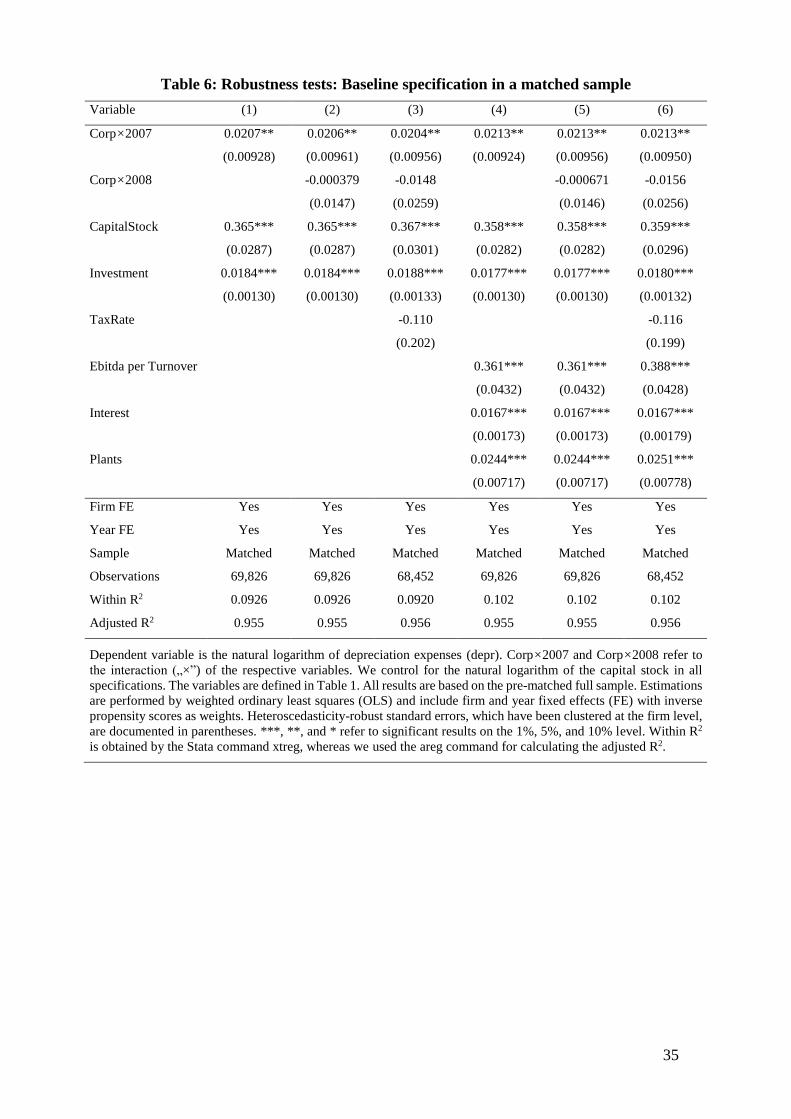
35
Table 6: Robustness tests: Baseline specification in a matched sample
Variable (1) (2) (3) (4) (5) (6)
Corp×2007 0.0207** 0.0206** 0.0204** 0.0213** 0.0213** 0.0213**
(0.00928) (0.00961) (0.00956) (0.00924) (0.00956) (0.00950)
Corp×2008 -0.000379 -0.0148 -0.000671 -0.0156
(0.0147) (0.0259) (0.0146) (0.0256)
CapitalStock 0.365*** 0.365*** 0.367*** 0.358*** 0.358*** 0.359***
(0.0287) (0.0287) (0.0301) (0.0282) (0.0282) (0.0296)
Investment 0.0184*** 0.0184*** 0.0188*** 0.0177*** 0.0177*** 0.0180***
(0.00130) (0.00130) (0.00133) (0.00130) (0.00130) (0.00132)
TaxRate -0.110 -0.116
(0.202) (0.199)
Ebitda per Turnover 0.361*** 0.361*** 0.388***
(0.0432) (0.0432) (0.0428)
Interest 0.0167*** 0.0167*** 0.0167***
(0.00173) (0.00173) (0.00179)
Plants 0.0244*** 0.0244*** 0.0251***
(0.00717) (0.00717) (0.00778)
Firm FE Yes Yes Yes Yes Yes Yes
Year FE Yes Yes Yes Yes Yes Yes
Sample Matched Matched Matched Matched Matched Matched
Observations 69,826 69,826 68,452 69,826 69,826 68,452
Within R2 0.0926 0.0926 0.0920 0.102 0.102 0.102
Adjusted R2 0.955 0.955 0.956 0.955 0.955 0.956
Dependent variable is the natural logarithm of depreciation expenses (depr). Corp×2007 and Corp×2008 refer to
the interaction („×”) of the respective variables. We control for the natural logarithm of the capital stock in all
specifications. The variables are defined in Table 1. All results are based on the pre-matched full sample. Estimations
are performed by weighted ordinary least squares (OLS) and include firm and year fixed effects (FE) with inverse
propensity scores as weights. Heteroscedasticity-robust standard errors, which have been clustered at the firm level,
are documented in parentheses. ***, **, and * refer to significant results on the 1%, 5%, and 10% level. Within R2
is obtained by the Stata command xtreg, whereas we used the areg command for calculating the adjusted R2.

36
Figure 1: Visual Test of the Common Trend Assumption
-0,02
-0,01
0
0,01
0,02
0,03
0,04
0,05
0,06
0,07
2004 2005 2006 2007 2008
mea
n d
iffe
ren
ce in
ln(d
epre
ciat
ion
)
Test of Common Trend
95% CI mean of difference
Impressum: Arbeitskreis Quantitative Steuerlehre, arqus, e.V. Vorstand: Prof. Dr. Ralf Maiterth (Vorsitzender), Prof. Dr. Kay Blaufus, Prof. Dr. Dr. Andreas Löffler Sitz des Vereins: Berlin Herausgeber: Kay Blaufus, Jochen Hundsdoerfer, Martin Jacob, Dirk Kiesewetter, Rolf J. König, Lutz Kruschwitz, Andreas Löffler, Ralf Maiterth, Heiko Müller, Jens Müller, Rainer Niemann, Deborah Schanz, Sebastian Schanz, Caren Sureth-Sloane, Corinna Treisch Kontaktadresse: Prof. Dr. Caren Sureth-Sloane, Universität Paderborn, Fakultät für Wirtschaftswissenschaften, Warburger Str. 100, 33098 Paderborn, www.arqus.info, Email: [email protected]
ISSN 1861-8944