introduction to collection assessmentpeople.ucalgary.ca/~hclarke/arlis/introduction to...
TRANSCRIPT
INTRODUCTION TO COLLECTION ASSESSMENTARLIS WORKSHOP MAY XX, 2006
Presented by: Helen Clarke and Heather D’Amour
Collections ServicesUniversity of Calgary Library
1

2
PLANNING FOR DATA COLLECTION AND ASSESSMENT
WHAT ARE THE BASIC SKILLS YOU NEED?
Basic Skill Set
Effective analysis and communication in collection assessment relies on a basic set of numeric and software skills
1. NumeracyIn this workshop only the most basic descriptive statistics are used.
Percentage calculations
Calculate Averages
2. Excel
Importing and Exporting delimited files
Sorting data in worksheets,
Formatting data for presentation, including chart making
Pivot Tables
3. Word Processing
Inserting tables and charts
3
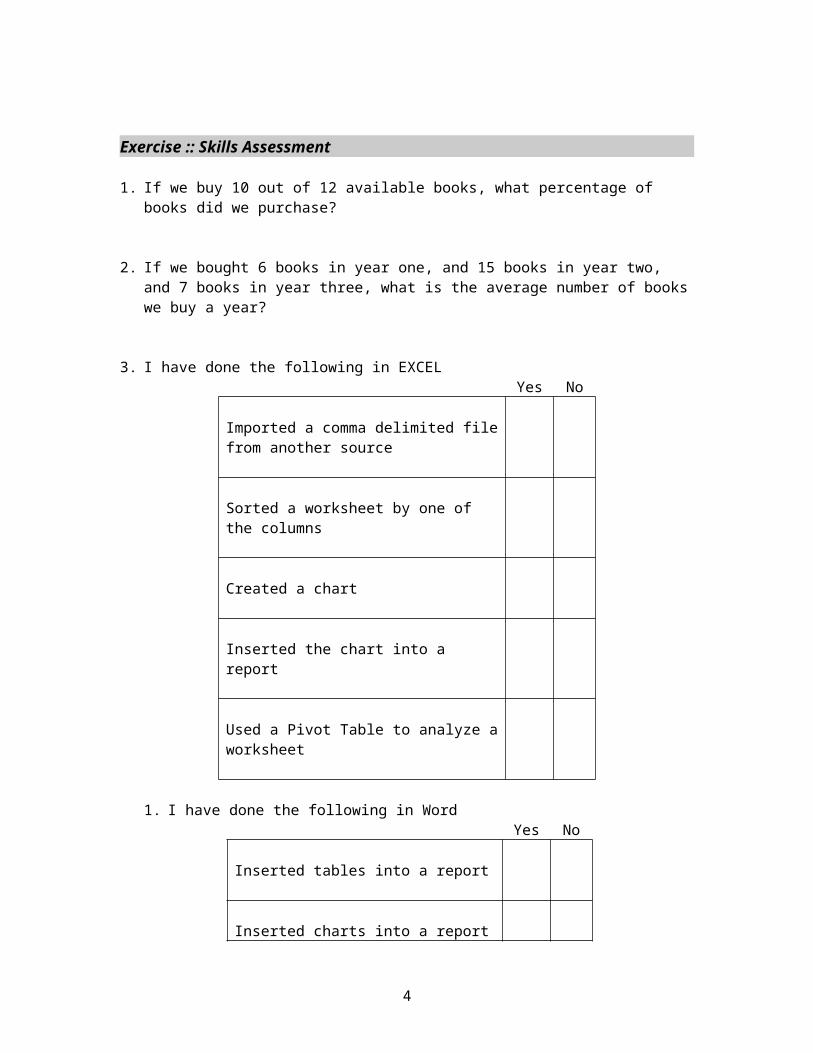
Exercise :: Skills Assessment
1. If we buy 10 out of 12 available books, what percentage of books did we purchase?
2. If we bought 6 books in year one, and 15 books in year two, and 7 books in year three, what is the average number of books we buy a year?
3. I have done the following in EXCELYes No
Imported a comma delimited file from another source
Sorted a worksheet by one of the columns
Created a chart
Inserted the chart into a report
Used a Pivot Table to analyze a worksheet
1. I have done the following in WordYes No
Inserted tables into a report
Inserted charts into a report
If you get less then 75 % correct, then take some courses, read a book, or HIRE A STUDENT!
4
COLLECTION ASSESSMENT PARAMETERS
1. Collection Goals
Purpose of the collection?
Levels of programs or types of activities supported?
Conspectus collection level indicators
Developed by RLG, then WLN, now operates under OCLC
Describes the characteristics of collections that support differing levels of academic programs and activities.
Range from Minimal to Comprehensive in increasing levels of intensity
2. Collection Size
Measuring the size of a collection is a short cut to assessing how well the collection meets its goals.
Rationale for this is that the larger the collection, the more likely it is to hold rarer more specialized titles.
3. Growth
Is the collection growing at a rate that will maintain it at the desired level?
5
Exercise :: Collection Depth Indicators
Match the conspectus collection category with the description
Answers: a/a : d/b : e/c : c/d : b/e
Questions for Review
What is important to my users—images, monographs, periodicals, historic materials?
What about shared collections (for example central repositories) should I include these?
Readings and Websites
Collection Depth Indicatorshttp://www.columbia.edu/cu/lweb/services/colldev/collection-depth.html
6
a) Minimal
b) Basic Information
c) Study or Instructional Support
d) Research
e) Comprehensive
a) Periodicals directly dealing with this topic and in-depth electronic information resources are not collected
b) a very extensive collection of general and specialized periodicals
c) exhaustive collections of published materials
d) an extensive collection of general periodicals and a limited collection of representative specialized periodicals
e) a limited collection of representative general periodicals

BREAKING THE COLLECTION INTO PARTS
Define limits to the parts of the collection you will review the way you will segment the parts you are reviewing
Three possible approaches:
1. Classification Systems
Conspectus is the best known and the basis for the WorldCat Collection Assessment Software (WCAS).
The Conspectus breaks LC, NLM, and Dewey systems into a hierarchal subject listing.
2. Externally produced subject lists
For example, Ulrich’s assigns subject headings to journals
3. Ad Hoc
Use keywords or metadata (for example format) to define a subset that can be compared among different collections
In the workshop we will look at all three approaches.
.
7
Exercise :: Breaking a Collection into Parts for Comparison
Name one advantage and one drawback for each approach.
Classification Systems
Externally produced subject lists
Ad Hoc
Readings and WebsitesOCLC guide to Conspectus subjectshttp://www.oclc.org/collectionanalysis/support/conspectus.xls
Note this covers the Division and Category levels. The subject level is embedded in the WCAS tool and is not available without a subscription.
8
CHOOSING A BENCHMARK: IDENTIFYING THE GAP
1. Benchmarks are other collections that serve as baselines for assessing the target collection. Benchmarks are used Because collection strength is a relative measure.
For example, we can’t say that having “5 books per student” or spending $1,000 guarantees a strong collection.
Because we still need to quantify any “gap” into numbers of books or dollars, in order to know how to proceed with collection development. Comparison collections are needed as a basis for defining the “gap”.
2. Types of benchmark collections Peer
Serves a population with similar goals
Aspirationalrepresents your aspirations, in terms of reputation and population served
ComprehensiveThe most complete coverage available, represents an ideal collection
3. Cautions Multiple collections
Using a single collection as a benchmark is unadvisable. There is no guarantee that any one collection is a good comparison.
Using multiple collections means that any idiosyncrasies in one collection are more likely to be identified.
Check CollectionHaving one massive collection that can be used to check findings against is a wise move. Again, this makes certain that results are artifacts of some share idiosyncrasy among the benchmark collections.
EXERCISE :: CHOOSING BENCHMARKS
9

Think of three institutions that would fit in each category
Peer
Aspirational
Comprehensive
Questions to Ask about Benchmarks
1. Do they offer the same level and type of program as are the target of the assessment?
2. Is their data well represented in the source you will use?
3. Do you share the same classification/cataloguing systems; are they used in a similar fashion?
4. How accessible is their data?
10
WORLDCAT COLLECTION ANALYSIS SYSTEM (WCAS)
WHAT IS WCAS?
WCAS is a way of doing collection analysis based on holdings recorded in WorldCat.
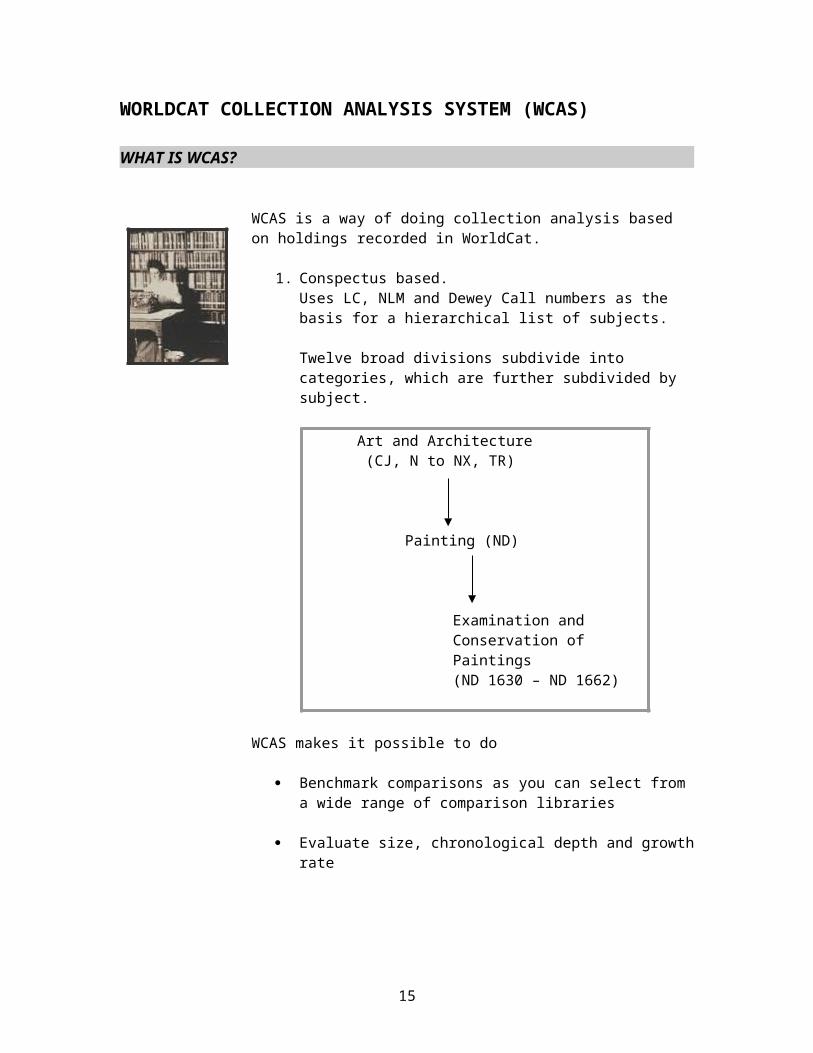
1. Conspectus based.Uses LC, NLM and Dewey Call numbers as the basis for a hierarchical list of subjects.
Twelve broad divisions subdivide into categories, which are further subdivided by subject.
Art and Architecture (CJ, N to NX, TR)
Painting (ND)
Examination and Conservation of Paintings (ND 1630 – ND 1662)
WCAS makes it possible to do
Benchmark comparisons as you can select from a wide range of comparison libraries
Evaluate size, chronological depth and growth rate
EXERCISE :: IS WCAS FOR YOU?
11
1. Is your collection represented in WorldCat?
2. WorldCat is best for books—you’ll need to look for other ways to assess images, periodicals, or electronic resources.
3. Is the subscription worthwhile for the amount of assessment you do? Alternatives include consortia licenses or having the larger institution subscribe.
a) Will your organization accept this type of assessment? May need to start smaller before people will invest in WCAS.
Reading
WorldCat Collection Analysis User Guidehttp://www.oclc.org/support/documentation/collectionanalysis/using/default.htm
Section 1: Introduction to the WorldCat Collection Analysis Service
12
CHOOSING A BENCHMARK
1. Find out if the target institution(s) are well represented in WorldCat
Compare holdings in institution’s catalogue against those in WorldCat
Contact the target institutions to discuss
Consider creating a master list for comparison. This should be a combination of holdings of three or more very large institutions. This provides a continuing baseline you can apply in all assessments to check for anomalies.
2. Single Institution Comparison
If you want to do a comparison or against a single institution, you’ll need to use the permission form provided by WCAS
3. Setting up the Benchmarks
Use the administrative interface for FirstSearch. NOT the regular firstsearch login.
It will take 7 days for the benchmark collection to be available in WCAS. So plan ahead!!
WCAS will soon make pre-set comparison collection available.
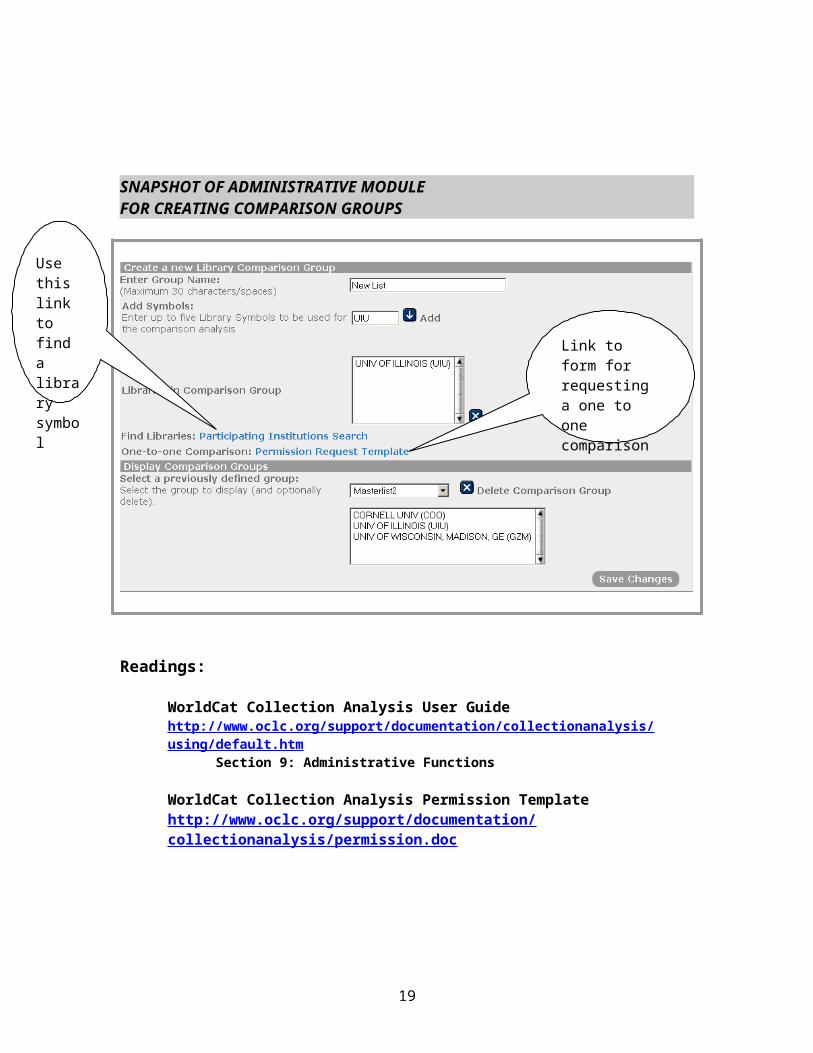
SNAPSHOT OF ADMINISTRATIVE MODULE FOR CREATING COMPARISON GROUPS
13
Use this link to find a library symbol
Readings:
WorldCat Collection Analysis User Guidehttp://www.oclc.org/support/documentation/collectionanalysis/using/default.htm
Section 9: Administrative Functions
WorldCat Collection Analysis Permission Templatehttp://www.oclc.org/support/documentation/collectionanalysis/permission.doc
MAPPING THE TOPIC
14
Link to form for requesting a one to one comparison
Will need to know which conspectus categories (call numbers) are of interest.
There will rarely be a clear cut correspondence between the topic being assessed and the conspectus categories.
Identifying key categories can be done by working from sample searches to call number distributions (see example on facing page)
15

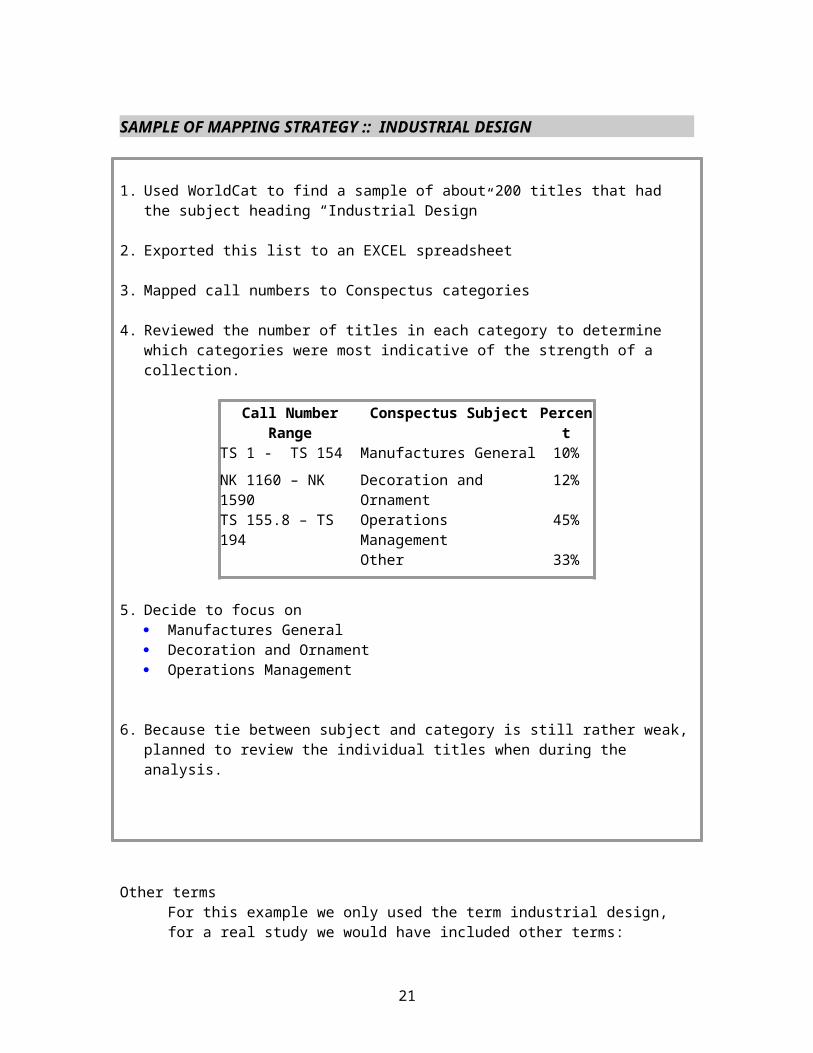
SAMPLE OF MAPPING STRATEGY :: INDUSTRIAL DESIGN
1. Used WorldCat to find a sample of about 200 titles that had the subject heading “Industrial Design”
2. Exported this list to an EXCEL spreadsheet
3. Mapped call numbers to Conspectus categories
4. Reviewed the number of titles in each category to determine which categories were most indicative of the strength of a collection.
Call Number Range
Conspectus Subject Percent
TS 1 - TS 154 Manufactures General 10%
NK 1160 – NK 1590
Decoration and Ornament
12%
TS 155.8 – TS 194 Operations Management
45%
Other 33%
5. Decide to focus on Manufactures General Decoration and Ornament Operations Management
6. Because tie between subject and category is still rather weak, planned to review the individual titles when during the analysis.
Other termsFor this example we only used the term industrial design, for a real study we would have included other terms:
ErgonomicsDesign – Psychological Aspects
16

SIZE COMPARISON
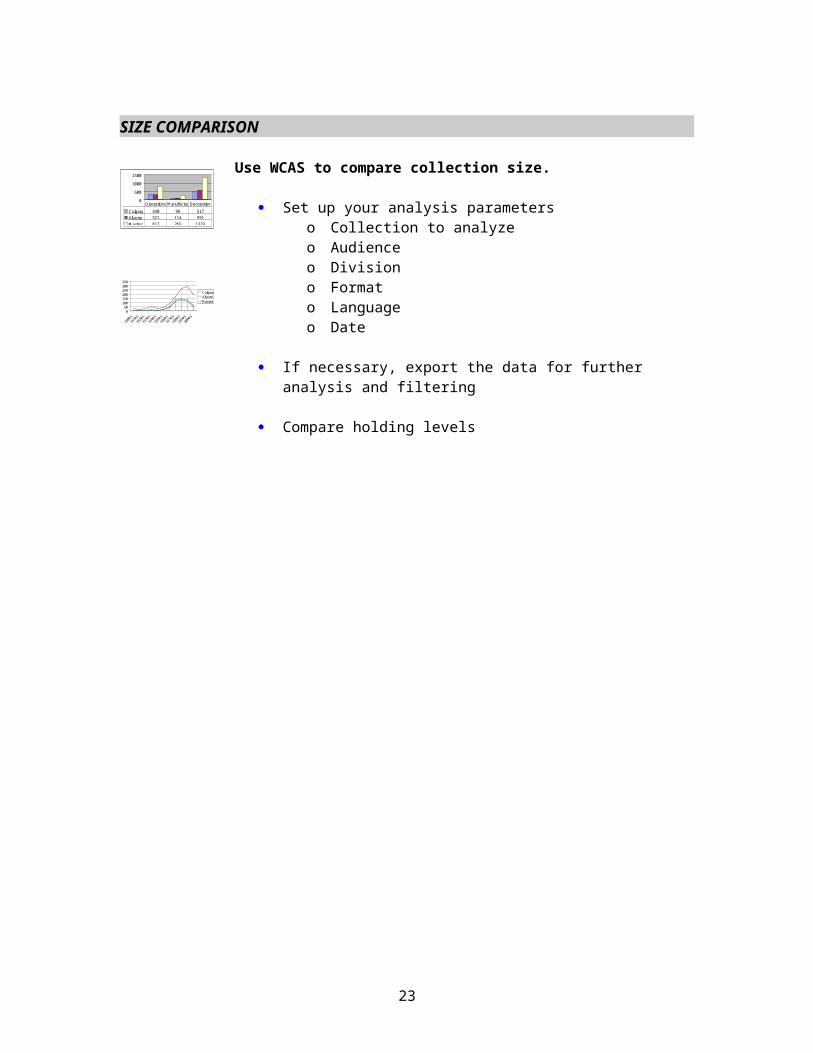
Use WCAS to compare collection size.
Set up your analysis parameterso Collection to analyzeo Audienceo Divisiono Formato Languageo Date
If necessary, export the data for further analysis and filtering
Compare holding levels
17
0
500
1000
1500
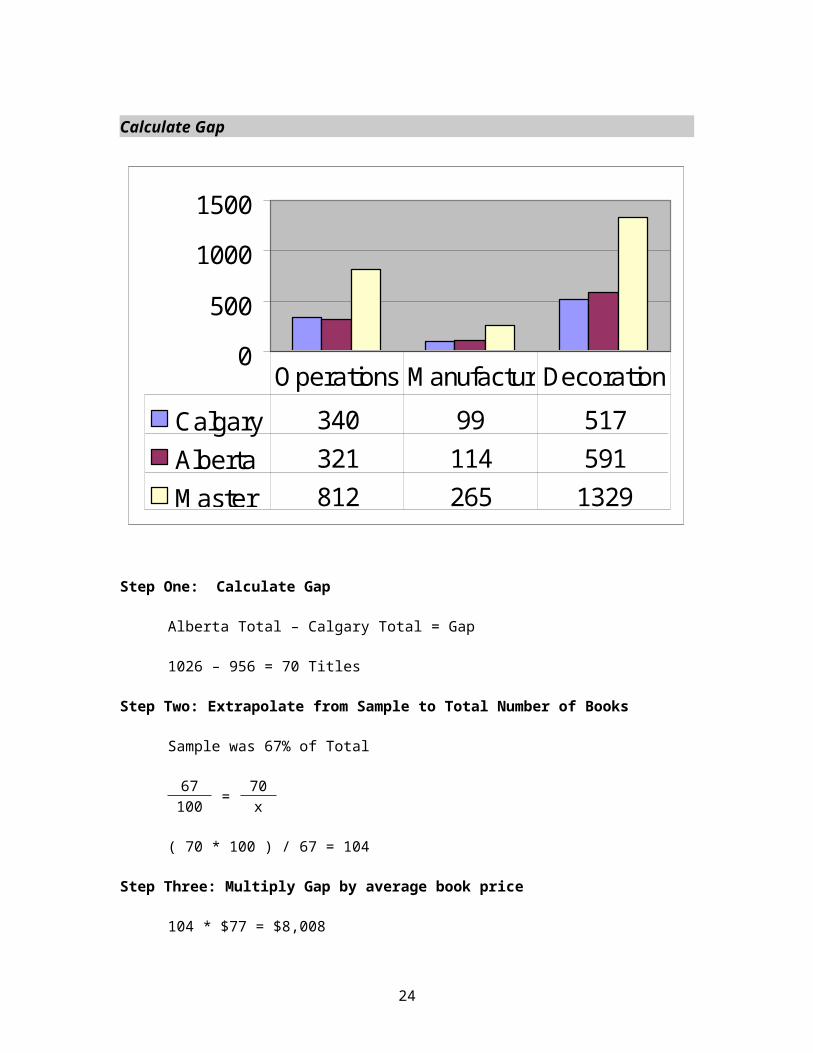
Calgary 340 99 517Alberta 321 114 591Master 812 265 1329
Operations Manufactur Decoration
050
100150200250300350
1900
's
1910
's
1920
's
1930
's
1940
's
1950
's
1960
's
1970
's
1980
's
1990
's
2000
's
CalgaryAlbertaMaster
Calculate Gap
Step One: Calculate Gap
Alberta Total – Calgary Total = Gap
1026 – 956 = 70 Titles
Step Two: Extrapolate from Sample to Total Number of Books
Sample was 67% of Total
67 = 70100 x
( 70 * 100 ) / 67 = 104
Step Three: Multiply Gap by average book price
104 * $77 = $8,008
18
0
500
1000
1500
Calgary 340 99 517Alberta 321 114 591Master 812 265 1329
Operations Manufactur Decoration
Growth Rate
Every subject area has its own publication pattern. To examine current growth rate look at the most recent data
WCAS can be used to compare acquisition rates among collections. To some extent this may be a reflection of the respective budgets. Is there a consistent gap?Do other collections start to show a growth your own does not?
Don’t use the most recent year, or even two years, as this number is too easily skewed by the different rates at which libraries add new titles to their catalogues.
Again, if needed, titles can be exported and further analyzed to focus on core area of interest.
Determine what information you want to analyze and or present in relation to your growth rate. Reflect back on your reasons for the collection assessment. MaintainGrow? Peer, aspirational, % of titles published
Search vendor databases and apply criteria used in the WCAS and subject it to the same analysis.
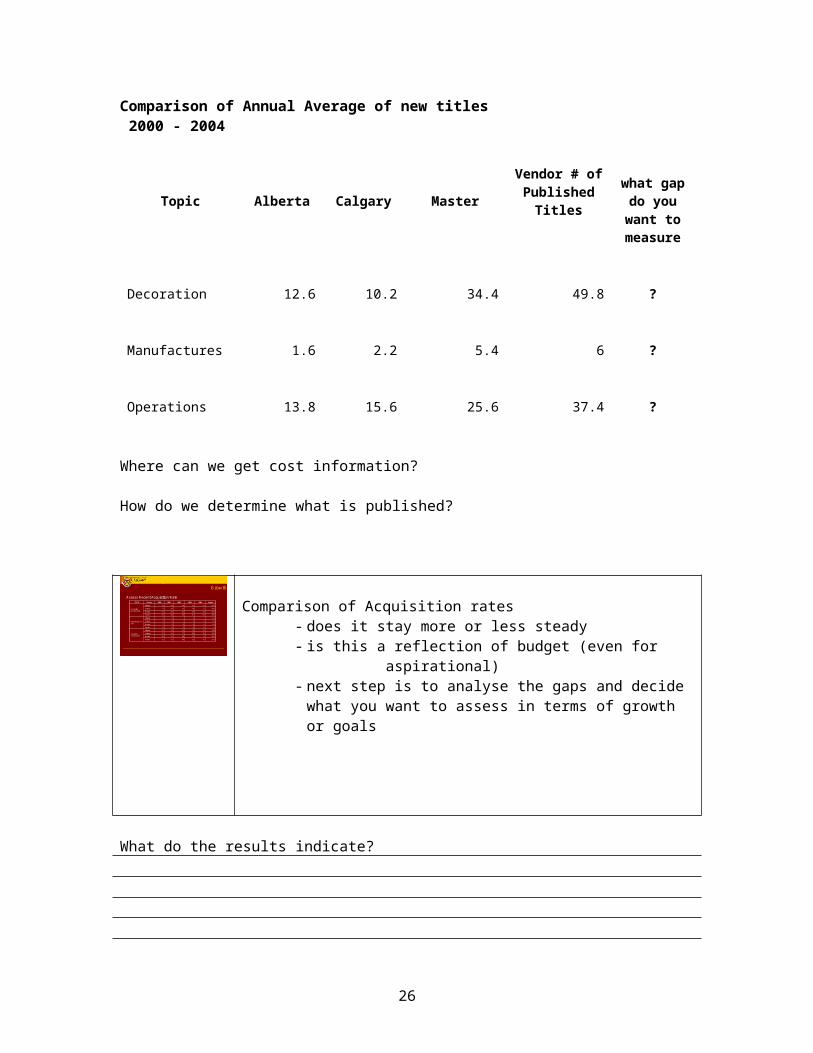
Comparison of Annual Average of new titles 2000 - 2004
Topic Alberta Calgary MasterVendor # of Published
Titleswhat gap do you want to
measure
Decoration 12.6 10.2 34.4 49.8 ?
19
Manufactures 1.6 2.2 5.4 6 ?
Operations 13.8 15.6 25.6 37.4 ?
Where can we get cost information?
How do we determine what is published?
Growth
Assess Recent Acquisition Rate
37.44133453731Vendor
25.6827303132Master
15.61220171613Calgary
13.81311141417Alberta
Operations TS155.8_194
664596Vendor
5.444937Master
2.223123Calgary
1.6143Alberta
Manufacture TS1-154
49.86251494839Vendor
34.44437312931Master
10.291013109Calgary
12.61311141411Alberta
Decoration NK1160-1590
Avg/yr20042003200220012000SourceTOPIC Comparison of Acquisition rates- does it stay more or less steady- is this a reflection of budget (even for aspirational)- next step is to analyse the gaps and decide what
you want to assess in terms of growth or goals
What do the results indicate?
20
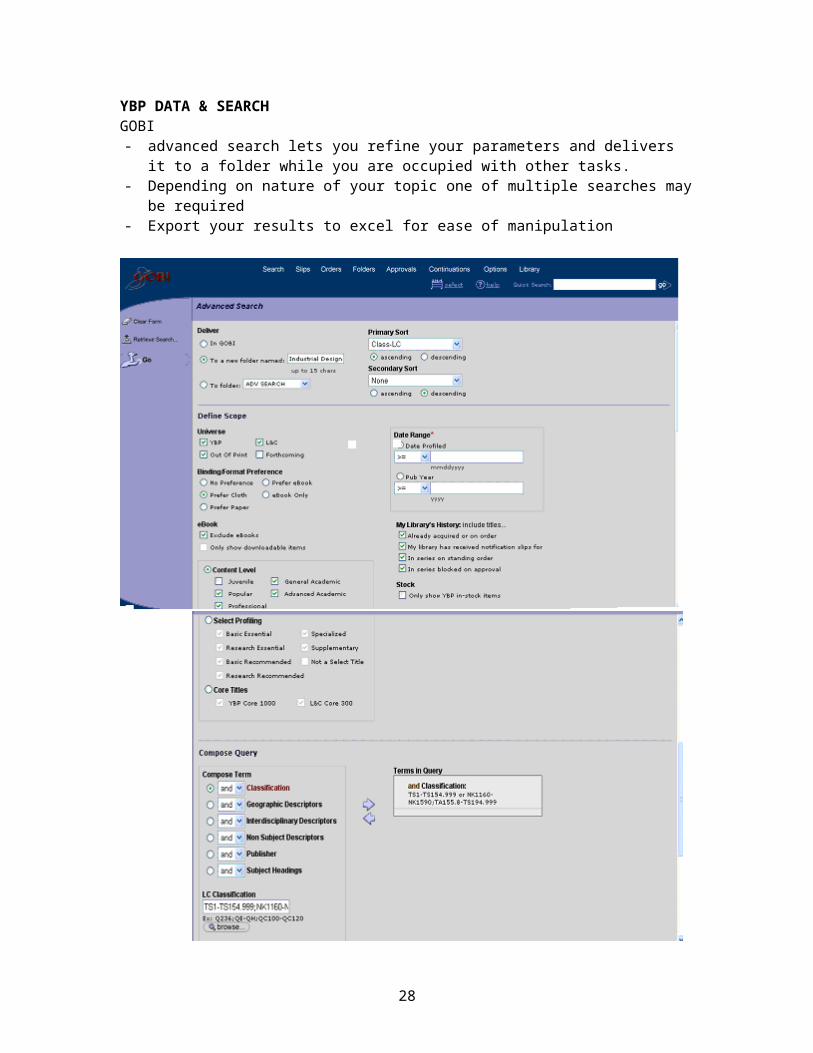
YBP DATA & SEARCHGOBI- advanced search lets you refine your parameters and delivers it to a
folder while you are occupied with other tasks.- Depending on nature of your topic one of multiple searches may be
required- Export your results to excel for ease of manipulation
21

Experiment with searching in vendor databases and exporting the data
What vendors do you want to search?
Which vendor databases provide easily exportable data?
Import the data into excel-use pivot tables-try out the charts
22
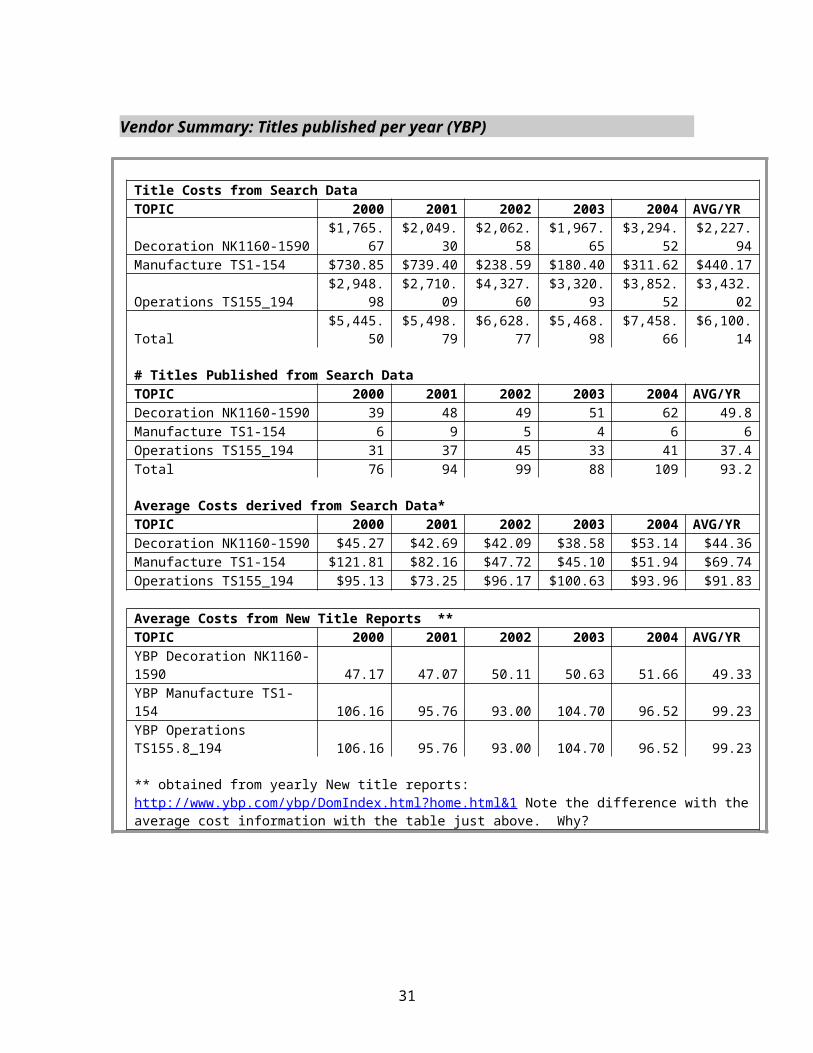
Vendor Summary: Titles published per year (YBP)
Title Costs from Search DataTOPIC 2000 2001 2002 2003 2004 AVG/YRDecoration NK1160-1590 $1,765.67 $2,049.30 $2,062.58 $1,967.65 $3,294.52 $2,227.94Manufacture TS1-154 $730.85 $739.40 $238.59 $180.40 $311.62 $440.17Operations TS155_194 $2,948.98 $2,710.09 $4,327.60 $3,320.93 $3,852.52 $3,432.02Total $5,445.50 $5,498.79 $6,628.77 $5,468.98 $7,458.66 $6,100.14 # Titles Published from Search DataTOPIC 2000 2001 2002 2003 2004 AVG/YRDecoration NK1160-1590 39 48 49 51 62 49.8Manufacture TS1-154 6 9 5 4 6 6Operations TS155_194 31 37 45 33 41 37.4Total 76 94 99 88 109 93.2 Average Costs derived from Search Data*TOPIC 2000 2001 2002 2003 2004 AVG/YRDecoration NK1160-1590 $45.27 $42.69 $42.09 $38.58 $53.14 $44.36Manufacture TS1-154 $121.81 $82.16 $47.72 $45.10 $51.94 $69.74Operations TS155_194 $95.13 $73.25 $96.17 $100.63 $93.96 $91.83
Average Costs from New Title Reports **TOPIC 2000 2001 2002 2003 2004 AVG/YRYBP Decoration NK1160-1590 47.17 47.07 50.11 50.63 51.66 49.33YBP Manufacture TS1-154 106.16 95.76 93.00 104.70 96.52 99.23YBP Operations TS155.8_194 106.16 95.76 93.00 104.70 96.52 99.23 ** obtained from yearly New title reports: http://www.ybp.com/ybp/DomIndex.html?home.html&1 Note the difference with the average cost information with the table just above. Why?
23
Growth: set your goal
• Calculate the gap (peer, aspirational, % titles published• # of titles• $ to fill gap
Total $ to reach goal = $ 4205.65
$2,783.40$446.54$1,272.71$ to reach Goal
$99.23$99.23$49.33Avg Book Cost
28.054.525.8Goal = 75% of published titles
41.71%36.67%29.65%% Calgary purchases
37.4634.4Vendor Titles Published
15.62.210.2Calgary Titles Purchased
Operations TS155.8 -195Manufacture TS1-155Decoration NK1160-1591
What are the sources of financial data/ average cost information?
How do I want to use financial data in my assessment?
What do the results indicate?
24
ULRICHSWEB SERIALS ANALYSIS SYSTEM (SAS)Serials Assessment: Challenges
Obtaining Accurate Data Comprehensive lists
Growth in digital packages means that many libraries have difficulty producing comprehensive lists of current journal holdings.
As well, even if a list is present, adding a single package can dramatically change the individual libraries holdings overnight.
Breaking lists into parts by topicWe used to have fund numbers to guide us, but now most journals are digital and are purchased from central funds.
We ask Serials Solutions (who supply our marc records) to add LC numbers, but many are still unclassified.
Extracting DataMany libraries don’t have well developed systems for extracting serials lists as delimited files.
Finding BenchmarksOther institutions face the same challenges, so knowing how accurate the benchmark’s holdings are is difficult.
Self Assessment :: How well documented is my serials collection?
25
Where would I get a comprehensive list of serials holdings for my library?
Could I extract this list as a delimited file?
How would I break the list into parts?
Are there any institutions that I could get similar data from?
What is the Serials Assessment System (SAS)?
Uses the Ulrichs database of serials and ISSN matching to
26

provide comparative reports.
Local lists of ISSN’s can be uploaded to the SAS and compared to
Publisher lists Aggregator lists Ulrichs Universe Ulrichs Core Peer Comparison
For this workshop we are focusing on the Peer Comparison reports.
The peers are a set of twelve 4 year academic institutions (unnamed) categorized by Carnegie Classification and annual FTE.
FTE up to 2,999 FTE 3,000- 9,999 FTE 10,000 – 19,999 FTE 20,000 +
Peer comparisons are done on active subscriptions only.
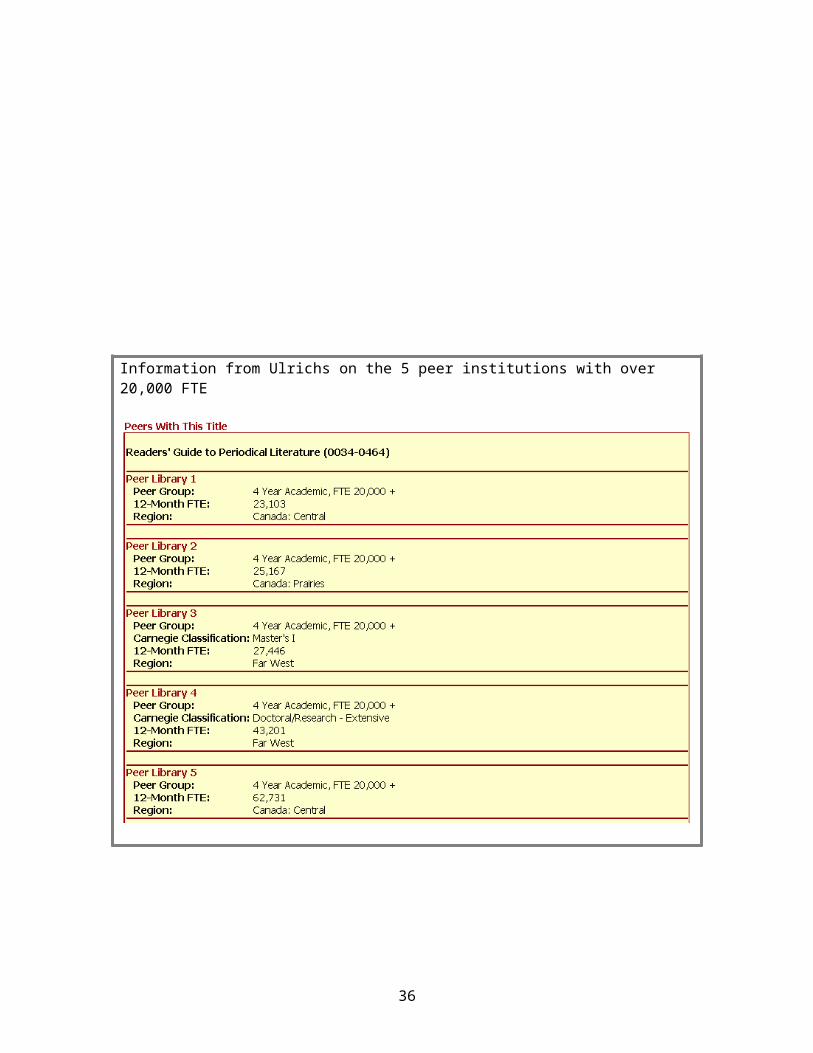
Information from Ulrichs on the 5 peer institutions with over 20,000 FTE
27
Creating a sample list for comparison
1. Create a sample list using a standard Ulrichsweb search.
28

The sample list is used as the basis of comparing the holdings of the target institution against the peer libraries.
Abstracting and Indexing Service Keyword Subject Call number
Can limit by active (need to do this for the peer comparison to
work) scholarly language peer reviewed
2. Save the search results to a “list”.
3. Export the list to Excel for later uploading to the SAS.
4. Adjust the downloaded list so that the ISSN’s are the first column, remove the header row. Save as a .txt format file.
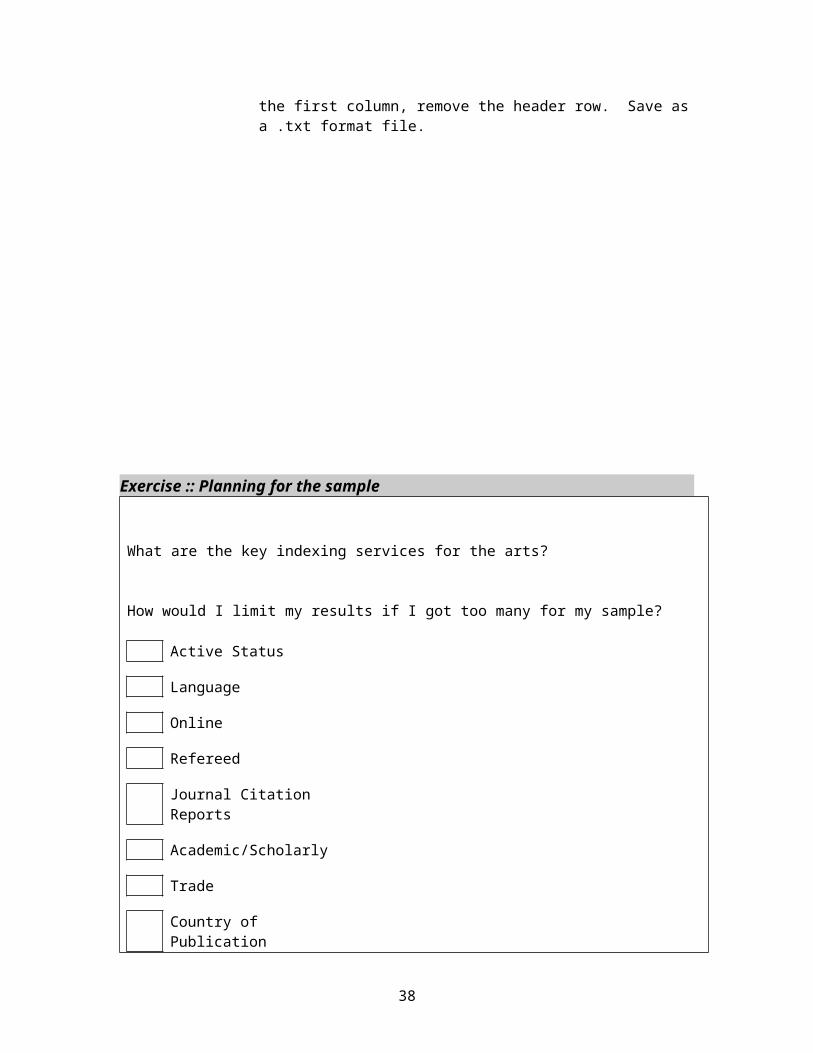
Exercise :: Planning for the sample
What are the key indexing services for the arts?
How would I limit my results if I got too many for my sample?
Active Status
29
Language
Online
Refereed
Journal Citation Reports
Academic/Scholarly
Trade
Country of Publication
Using the peer comparison reports
1. Upload the .txt file into Ulrichs Serials Analysis System using the “Create/Modify Reports” option.
2. Select “Your Library Reports” in the “Select Statistics to view section”. The select “Compared to a Peer Group”.
3. Download
Your Library Titles Matching Peer Groups Titles Unique to Your Library
30
05
10152025
None 1 2 3 4 5 6 7 9
Number of Libraries
Num
ber o
f Titl
es
CalgaryPeers
4. Merge the two files in Excel.
5. Add information regarding local holdings and formats.
Exercise :: Looking at the Data
31
Do our holdings appear strong?
Does the literature appear to be well structured?
What does the distribution of print vs online indicate?
BRIEF TESTS….A VARIATION ON HOWARD WHITE
Howard White’s Work
32
05
10152025
None 1 2 3 4 5 6 7 9
Number of Libraries
Num
ber o
f Titl
es
CalgaryPeers
Online 62 %
Print 38%
In his book, Brief Tests of Collection Strength: a methodology for all types of libraries, White outlined several key observations about the nature of collections.
These will sound familiar to you as these observations have become part of our mainstream understanding of collections.
1. Distribution of holdingsFor any subject area, only a few titles are held by many libraries, many titles are held by only a few libraries.
This is commonly called a “long tail” distribution (also known as a Zipf distribution).
2. Frequency of holdings reflects nature of material
From his analysis of this pattern White concluded that the titles that are commonly held represent the “core”, or basic works, and the titles that are less frequently held represent specialized or advanced material.
3. Library holdings of rarer material indicates collection strength
White hypothesized that a short list of titles (no more than 40) in a subject area, that ranged from frequently held core to less frequently held specialized would be a sufficient sample for determining collection strength.
White went on to create sample lists and test this idea, finding that it was a good means of predicting strength.
Exercise :: What types of material are in your collection?
33
Using WorldCat for Brief Tests
White’s methodology was to pre-select 40 titles in a subject area based on the advice of literature experts and then checking the number of libraries holding an item in Worldcat.
Several tests of 40 titles could be used to probe different aspects of a broad subject. Creating these tests is a time consuming project, and issues of “cheating” and bias in selecting the titles are a problem.
34
Rare CommonBooks prior to 1900
Limited EditionsNon-English
Small print runs (catalogues)
Non-local small print runsMajor Artists BiographiesMinor Artist Biographies
When White developed his methodology, web-based easy searching of Worldcat was not possible. To avoid concerns about bias, cheating, or the need for expertise when creating checklists, Collections Services suggests a different approach. It involves picking titles from lists ranked by library holding. These lists that can be created in Worldcat.
Creating a title list in WorldCat
35
1. Create a list of suitable titles in WorldcatSearch Worldcat using a keyword(s) that represents the subject or a sub-topic in the discipline. Limit this list by number of libraries holding.
Divide the number of titles by 4. For example, 539 titles divided by 4 is about 135 titles in each category.
Now break the list of titles by library holdings into 4 sections as neatly as possible. (See figure)
View the titles in each section by clicking on the check boxes and then selecting the Search button.
2. Go back to results and sort by number of libraries held
3. Pick 20 titles from each of the four sections200 – 1999 libraries75 – 199 libraries25 – 74 libraries5 – 24 libraries
4. Check the titles against your library’s holdings and the benchmarks.
Analysis
The sample worksheet shows how basic scores can be tabulated. Some possible questions to ask yourself when looking at these scores are:
36
1-135
136-270
271-405
406-539
In stitution 1 2 3 4 5 6 7 8 9 10 11 12 13 14 15 16 17 18 19 20
Sco re Calgary 7/20
Wilfred Laurier 8/20 Toronto 17/20
In stitution 1 2 3 4 5 6 7 8 9 10 11 12 13 14 15 16 17 18 19 20
Sco re Calgary 3/ 20
Wilfred Laurier 5/20 Toronto 14/ 20
In stitution 1 2 3 4 5 6 7 8 9 10 11 12 13 14 15 16 17 18 19 20
Sco re Calgary 4/ 20
Wilfred Laurier 3/ 20 Toronto 9/20
In stitution 1 2 3 4 5 6 7 8 9 10 11 12 13 14 15 16 17 18 19 20
Sco re Calgary 4/ 20
Wilfred Laurier 2/ 20 Toronto 6/ 20
Subject : Peacekeeping Tot a l Hits: 539 Sear ch Ter m(s): peacekeeping Limit at ions/Ex cl usions: G.P.O. and Govt. Print. Off,. And general accounting office. -2000 . English. 5 or more libraries.
Comment s: Eval uat or : Busy Bee Dat e: Any time
BASIC
TEACHING
ADVANCED
RES EARCH
o Is the pattern consistent with scores decreasing with difficulty?
o What is the degree of difference in scores? Is one library twice as good, or only marginally better?
Looking at the actual sample titles and the results will help discern other patterns.
o Is there a type of publisher or document consistently not held?
o Is the pattern of holdings consistent across institutions?
For example, in the peacekeeping test it was consistently less likely that the libraries would hold small press or institute publications. Collection building would need to focus on these sources.
37
TOPIC Source 2000 2001 2002 2003 2004 Avg/yrDecoration NK1160-1590
Alberta 11 14 14 11 13 10Calgary 9 10 13 10 9 8.4Master 31 29 31 37 44 25.6
Manufacture TS1-154
Alberta 3 4 1 1.6Calgary 3 2 1 3 2 1.8Master 7 3 9 4 4 4.6
Operations TS155.8_194
Alberta 17 14 14 11 13 11.2Calgary 13 16 17 20 12 13.2Master 32 31 30 27 8 24
NK1160-NK1590; TS1-TS154; TS155.8-TS194
38