introduction -...
TRANSCRIPT

Aqueductal cerebrospinal fluid pulsatility in healthy individuals is affected by impaired cerebral venous outflow
Clive B. Beggs, PhD 1, Christopher Magnano, MS, 2, Simon J. Shepherd, PhD 1, Karen Marr, RVT, RDMS 2, Vesela Valnarov, MD 2, David Hojnacki, MD 3, Niels
Bergsland, MS 2, Pavel Belov 2, Steven Grisafi, BS 2, Michael G. Dwyer, MS 1, Ellen Carl, PhD 1, Bianca Weinstock-Guttman, MD 3, Robert Zivadinov, MD, PhD 2,3
1 Medical Biophysics Laboratory, University of Bradford, Bradford, UK;2 Buffalo Neuroimaging Analysis Center, University at Buffalo, Buffalo, NY, USA;
3 Jacobs MS Comprehensive and Research Center, University at Buffalo, Buffalo, NY, USA
Corresponding Author: Clive B. Beggs, PhD
Prof Clive BeggsCentre for Infection Control and BiophysicsSchool of Engineering, Design & TechnologyUniversity of BradfordBradfordWest YorkshireBD7 1DPUnited Kingdom
email: [email protected], Tel: +44(0)1274 233679, Fax: +44(0)1274 234124
Running title: CCSVI in healthy individuals
Abstract count: 188, Word count (text, appendix, references & tables): 5199, Number of Tables: 3, Number of Figures: 5, Number of references: 53.
Potential Conflicts of InterestClive B. Beggs, Christopher Magnano, Simon J. Shepherd, Karen Marr, Vesela Valnarov, Niels Bergsland, Pavel Belov, Steven Grisafi, Michael G. Dwyer and Ellen Carl have nothing to disclose. Bianca Weinstock-Guttman received personal compensation for consulting, speaking, and serving on a scientific advisory board for Biogen Idec, Teva Neuroscience, and EMD Serono. Dr. Weinstock-Guttman also received financial support for research activities from NMSS, NIH, ITN, Teva Neuroscience, Biogen Idec, EMD Serono, and Aspreva. David Hojnacki has received speaker honoraria and consultant fees from Biogen Idec, Teva Pharmaceutical Industries Ltd., EMD Serono, Pfizer Inc, and Novartis. Robert Zivadinov received personal compensation from Teva Pharmaceuticals, Biogen Idec, EMD Serono and Genzyme for speaking and consultant fees. Dr. Zivadinov received financial support for research activities from Biogen Idec, Teva Pharmaceuticals, Genzyme and Novartis.
Grant Support
This work has been supported in part by grants from the Annette Funicello Research Fund for Neurological Diseases and Jacquemin Family Foundation.

Aqueductal cerebrospinal fluid pulsatility in healthy individuals is affected by impaired cerebral venous outflow
Abstract
Purpose: To investigate cerebrospinal fluid (CSF) dynamics in the aqueduct
of Sylvius (AoS) in chronic cerebrospinal venous insufficiency (CCSVI)
positive and negative healthy individuals using cine phase contrast imaging.
Materials and Methods: Fifty one healthy individuals [32 CCSVI negative
and 19 age-matched CCSVI positive subjects] were examined using Doppler
sonography (DS). Diagnosis of CCSVI was established if subjects fulfilled ≥2
venous hemodynamic criteria on DS. CSF flow and velocity measures were
quantified using a semi-automated method and compared with clinical and
routine 3T MRI outcomes.
Results: CCSVI was associated with increased CSF pulsatility in the AoS.
Net positive CSF flow was 32% greater in the CCSVI positive group
compared with the CCSVI negative group (p=0.008). This was accompanied
by a 28% increase in the mean aqueductal characteristic signal (i.e. the AoS
cross-sectional area over the cardiac cycle) in the CCSVI positive group
compared with the CCSVI negative group (p=0.021).
Conclusion: CSF dynamics are altered in CCSVI positive healthy individuals,
as demonstrated by increased pulsatility. This is accompanied by
enlargement of the AoS, suggesting that structural changes may be occurring
in the brain parenchyma of CCSVI positive healthy individuals.
Keywords: CSF dynamics, CCSVI, cerebral venous outflow, aqueduct of
Sylvius, healthy individuals, lateral ventricle volume

Introduction
Recently it has been suggested that abnormalities of the venous system might
be associated with multiple sclerosis (MS) (1-5). This has led some to
postulate the concept of chronic cerebrospinal venous insufficiency (CCSVI)
as an indicator of neurovascular pathology. However, a number of studies
have shown that CCSVI also occurs in healthy individuals with unknown
pathology (4,6,7), leading many to question its validity (8-13). Criticism has
been levelled at the concept of CCSVI because it implies an abnormal
cerebral venous drainage system. In reality, humans exhibit great variability in
the venous system, making it difficult to differentiate what is normal from what
is abnormal (14,15). Hydrodynamic analysis of the cerebral venous outflow
has shown that patients with MS exhibit increased hydraulic resistance to
extracranial venous blood flow compared with healthy controls (16,17).
Furthermore, several studies have shown that MS is associated with
increased cerebrospinal fluid (CSF) pulsatility in the aqueduct of Sylvius (AoS)
(18-20). Although Zamboni et al (19) observed increased CSF pulsatility in
MS patients diagnosed with CCSVI, it is not known if the two phenomena are
linked. Indeed, it may be that increased CSF pulsatility in MS patients is
primarily due to ventricular enlargement associated with brain atrophy (21,22).
In a similar manner to individuals with MS, patients with normal pressure
hydrocephalus (NPH) appear to exhibit increased AoS pulsatility (23-28).
Given that NPH is thought to be associated with venous hypertension in the
dural sinuses (29,30), it may be that impaired cerebral venous outflow alters
the dynamics of the intracranial CSF system, irrespective of any pathology. In

order to test this hypothesis, we undertook a study involving 51 age-matched
healthy individuals with no family history of MS. The aim of the study was
simply to evaluate whether or not CCSVI is associated with changes in the
dynamics of the intracranial CSF system in healthy individuals without any
known neurological condition.
Materials and methods
Patient population
Fifty one healthy individuals [32 CCSVI negative and 19 CCSVI positive] were
enrolled in this study. They were part of a larger study that investigated the
relationship between CCSVI and conventional MRI characteristics in MS
patients and healthy individuals (31). Inclusion criteria were: age 18 to 75
years, undergoing Doppler sonography (DS) and MRI scan with cine phase
contrast imaging for CSF flow estimation. Relevant information relating to:
vascular risk factors [body mass index (BMI), hypertension, heart disease and
smoking] was also collected. The individuals also needed to qualify on a
health screening questionnaire containing information about medical history
(illnesses, surgeries, medications, etc.) and meet the health screen
requirements for MRI on physical examination, as previously described
(4,31,32). Exclusion criteria were: pre-existing medical conditions known to
be associated with brain pathology (e.g. cerebrovascular disease, positive
history of alcohol abuse, etc.), history of cerebral congenital vascular
malformations, type 1 diabetes, or pregnancy.

All participants underwent clinical, DS and MRI examinations. The study was
approved by the local Institutional Review Board and informed consent was
obtained from all subjects.

Doppler sonography

Extra- and trans-cranial DS was performed on a color-coded DS scanner
(MyLab 25; Esaote-Biosound, Irvine, California) equipped with a 5.0- to 10-
Mhz transducer to examine venous return in the internal jugular veins (IJVs)
and vertebral veins (VVs). The DS examination was performed by 2 trained
technologists who were blinded to the subjects’ characteristics. The detailed
scanning protocol and validation were recently reported (4,33). Briefly, the
following 5 VH (venous hemodynamic) parameters indicative of CCSVI were
investigated: 1) Reflux/bidirectional flow in the IJVs and/or in the VVs in sitting
and in supine positions, defined as flow directed towards the brain for a
duration of >0.88 s; 2) Reflux/bidirectional flow in the deep cerebral veins
defined as reverse flow for a duration of 0.5 s in one of the intra-cranial veins;
3) B-mode abnormalities or stenoses in IJVs. IJV stenosis is defined as a
cross-sectional area (CSA) of this vein ≤0.3 cm2; 4) Flow that is not Doppler-
detectable in IJVs and/or VVs despite multiple deep breaths, and 5) Reverted
postural control of the main cerebral venous outflow pathway by measuring
the difference of the CSA of the IJVs in the supine and upright positions. A
subject was considered CCSVI-positive if ≥2 VH criteria were fulfilled, as
previously proposed (1). We also calculated the VH insufficiency severity
score (VHISS) as a measure of CCSVI severity (19). The overall VHISS score
is the weighted sum of the scores contributed by each individual VH criterion
(i.e. VHISS = VHISS1 + VHISS2 + VHISS3 + VHISS4 + VHISS5). The VHISS
score is an ordinal measure of the overall extent and number of VH flow
pattern anomalies, with a higher value of VHISS indicating a greater severity
of VH flow pattern anomalies. The minimum possible VHISS value is 0 and
the maximum 16.

MRI acquisition and analysis
All subjects were examined on a 3 Tesla GE Signa Excite HD 12.0 Twin
Speed scanner (General Electric, Milwaukee, WI). All sequences were run on
an 8-channel head and neck (HDNV) coil. All analyses were performed in a
blinded manner.
MRI sequences included 3D high resolution (HIRES) T1-WI using a fast
spoiled gradient echo (FSPGR) with magnetization-prepared inversion
recovery (IR) pulse and cine phase contrast imaging for CSF flow estimation.
Pulse sequence characteristics for 3D T1 sequence were: a 256 x 256 matrix
and a 25.6 cm field of view (FOV) for an in-plane resolution of 1 x 1 mm2 with
a phase FOV (pFOV) of 75% and one average. Sequence specific
parameters were: 1-mm thick slices with no gap, echo time/inversion
time/repetition time (TE/TI/TR)=2.8/900/5.9 ms, flip angle (FA)=10°. On 3D
t1, the SIENAX cross-sectional software tool (version 2.6;
http://fsl.fmrib.ox.ac.uk/fsl/fslwiki/SIENA) was used to estimate normalized
brain volume (NBV) and normalized lateral ventricular volume (NLVV), as
previously described (34). Prior to segmentation, the 3D T1 WI was modified
using an in-house developed inpainting tool to avoid the impact of T1
hypointensities.

CSF flow quantification was performed using a single slice cine phase-
contrast velocity-encoded pulse-gated gradient echo sequence (cine PC) with
an TE/TR of 7.9/40 ms, a slice thickness of 4 mm, a velocity encoding of 20
cm/s, and 32 phases acquired corresponding to the cardiac cycle (18). Other
relevant scan parameters included a FA of 20°, FOV 10.0 cm, and a phase
FOV of 100%. A sagittal T2-weighted fast SE sequence was also acquired as
a localizer for the cine PC prescription, as previously described, with the cine
PC sequence prescribed as an oblique axial slice through the AoS (18). All
subjects underwent the MRI exam during the same time of day (in the
afternoon hours) to control for circadian variation. The cine PC sequence was
acquired with the AoS in the center of the FOV, such that the wrap around
artifact was present in the edges of the FOV, but did not overlap with the
desired ROI. To ensure reproducibility, repeat scans were performed as
described in Magnano et al (18).
Cine phase contrast image analysis
The net positive and net negative flows (NPF and NNF), together with the net
flow (NF = NNF + NPF) were calculated, as previously described (18). Briefly,
CSF flow data was processed using GE ReportCard software (version 3.6;
General Electric, GE, Milwaukee, WI) and positive and negative velocities
over all 32 phases were recorded. A semi-automated minimum area of
contour change (MACC) program was used to correct the ROIs for each
phase, as previously described (18). MACC automatically determined the
edges of an ROI by selecting a surrounding iso-contour curve which marks
the steepest overall gradient of image intensity values, with sub-voxel
accuracy. NPF and NNF were calculated using only the phases which have
positive and negative velocities, respectively (18). The respective CSF flow
rates were calculated by multiplying the measured CSF velocities by the
measured CSA of the AoS over the cardiac cycle. CSF flow measures are
presented in microliters per beat (µL/beat, 1µL = 1mm3), while CSF velocity
measures are presented in cm/s. CSF flow direction was calculated based on
slice prescription such that flow through the AoS out of the slice (during
diastole, towards the third ventricle) was given as positive, whereas flow into
the slice (during systole, towards the fourth ventricle) was negative, as
described previously (18).
Statistical analysis
Analysis was undertaken using the Statistical Package for Social Sciences
(SPSS, IBM, Armonk, New York, USA) and in-house algorithms written in

Matlab (Mathworks, Natick, Mass). The demographic and clinical differences
between the CCSVI positive and negative groups were tested using the chi-
square test and Student’s t-test, while analysis of the MRI data was
undertaken using the Mann–Whitney rank sum test. CSF flow differences
between the study groups were evaluated using the Mann–Whitney rank sum
test. In order to assess the impact of a CCSVI diagnosis on aqueductal
behavior, for each subject we divided the sequential CSF flow signal by the
sequential CSF velocity signal, to produce the aqueductal characteristic signal
(ACS), shown in Figure 3, which represents the changes in the AoS cross-
sectional area throughout the cardiac cycle. This is identical to the cross
sectional area of the AoS as calculated by MACC at each instantaneous
phase of the cardiac cycle. Values of p<0.05 using a two-tailed test were
considered statistically significant after the Benjamini-Hochberg (35)
correction for multiple comparisons was applied.
The following analysis techniques were also employed:
1. Correlation matrices (Pearson’s r) were computed for the CCSVI
positive and negative groups, to identify changes in the
relationships between the variables within the dataset. Statistical
significance was determined using a two-tailed Fisher r-to-z
transformation.
2. Singular value decomposition (SVD) analysis was used to visualize
the differences between the CCSVI positive and negative groups,
and also to generate sensitivity and specificity scores.

In order to perform singular value decomposition (SVD) the data, we created
a (m 3) matrix, Z, containing the data for both the CCSVI negative and
positive groups. The columns of the Z matrix comprised the variables NNF,
NPF and NLVV, which we mean-adjusted and standardized to unit variance.
SVD was then performed on Z as follows:
(1)
where: U is a (m 3) left singular vector (LSV) matrix with identical
dimensions to Z; S is a (3 3) singular value (SV) matrix; and V is a (3 3)
right singular vector (RSV) matrix. In U, the columns (LSVs) are orthogonal
composites of the three original variables in Z, with the rows equating to the
participants in the study. Plotting the individual LSVs against each other
produced scatter plots of the orthogonalized data. By identifying the elements
of U that belong to the CCSVI negative and positive cohorts, respectively, it
was possible to perform cluster analysis.
Results
Demographic and clinical characteristics
Table 1 shows demographic, clinical and conventional MRI characteristics of
the CCSVI positive and negative groups. There were no significant age- or
sex- differences between the CCSVI positive and negative subjects, with no
significant difference between the NBV. No significant differences were found
between the two groups regarding: BMI; hypertension; heart problems; and

smoking habit. There were however significant differences for VH criteria
score (p<0.0001) and VHISS score (p<0.0001) between the CCSVI positive
and negative cohorts.
Time series analysis
Figures 1 and 2 present average time series signals for CSF flow and velocity
in the AoS over a cardiac cycle. From these it can be seen that the CCSVI
positive individuals exhibit increased pulsatility, in both the flow and velocity
signals. While there was no significant difference between the CSF velocity
signals for the two groups, the peak positive flow rate (towards the lateral
ventricles) was significantly greater (p=0.023) in the CCSVI positive group
compared with the negative group. Similarly, the mean ACS signal, shown in
Figure 3, was significantly greater (p=0.021) in the CCSVI positive group
compared with the negative group.
Univariate analysis
Table 2 shows the quantitative assessment and univariate analysis results for
the respective MRI variables, with the subjects grouped according to CCSVI
status. This reveals that although NLVV was increased in the CCSVI positive
group, this increase was not significant. A statistically significant 32% increase
in CSF NPF towards the lateral ventricles (p=0.008) was observed in the
CCSVI positive group. A similar increase was observed in NNF towards the
spine in the CCSVI positive individuals, but this did not reach significance.
Likewise, the decrease in CSF NF in the CCSVI positive individuals did not
reach significance. The 28% increase in the mean ACS value (p=0.021) in the

CCSVI positive group compared with the CCSVI negative group was
significant.
Correlation analysis
Correlation analysis of the MRI data revealed that associations between
NLVV and the CSF related variables in CCSVI positive subjects were
generally weaker then in CCSVI negative subjects. For example, Figure 4
presents a scatter plot of NNF verses NLVV, which in the CCSVI negative
group exhibited a relatively strong negative correlation (r=-0.686, p<0.001),
but was lost in the CCSVI positive group (r=-0.103, p=0.674) – a change that
was significant using a Fisher transformation (p=0.018). Likewise, the strong
positive correlations between the variables NPF and NLVV (r=0.761,
p<0.001), and ACS and NLVV (r=0.720, p<0.001) in the CCSVI negative
group were weaker in the positive group (r=0.404, p=0.086 and r=0.454,
p=0.051). However, these changes were not significant.
No significant correlation was observed between VHISS score and any of the
MRI variables for either group, or indeed when both groups were aggregated
together.
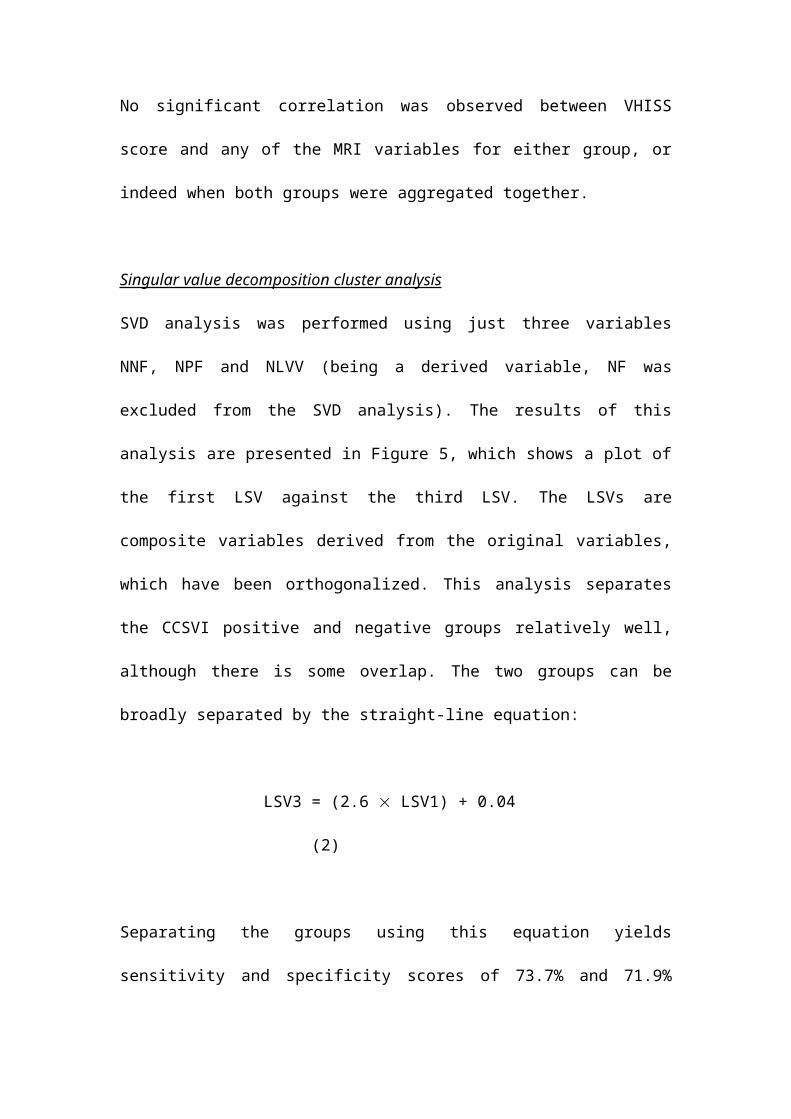
Singular value decomposition cluster analysis
SVD analysis was performed using just three variables NNF, NPF and NLVV
(being a derived variable, NF was excluded from the SVD analysis). The
results of this analysis are presented in Figure 5, which shows a plot of the
first LSV against the third LSV. The LSVs are composite variables derived
from the original variables, which have been orthogonalized. This analysis
separates the CCSVI positive and negative groups relatively well, although
there is some overlap. The two groups can be broadly separated by the
straight-line equation:
LSV3 = (2.6 LSV1) + 0.04 (2)
Separating the groups using this equation yields sensitivity and specificity
scores of 73.7% and 71.9% respectively (p=0.025). The singular values
associated with the first, second and third LSVs were 11.008, 5.058 and 1.800
respectively. This indicates that the first LSV explains 80.8% of the variance in
the system, while the second and third LSVs explain 17.0% and 2.2% of the
variance, respectively. The composition of the various LSVs is presented in
Table 3, which shows the linear coefficients that must be applied to the each
variable in order to reconstruct the respective LSVs. From this it can be seen
that the coefficients relating to variables NNF and NPF are more dominant in
the first and third LSVs, whereas the coefficient relating to NLVV is more
dominant in the second LSV.
Discussion
The subject of CCSVI has been mired with controversy (8,36), with many
researchers doubting that it is indicative of any pathology (8-13). However,
there is growing evidence that restricted cerebral venous outflow is a
phenomenon that is more prevalent in patients with MS, (1-3,5,37), even

though it is also observed in both healthy individuals (4,6,7) and those with
other neurological disease (4). While the reasons for this are unclear, it has
been shown using cervical plethysmography (16,17) that MS patients
diagnosed with CCSVI exhibit on average a 63.5% increase in the hydraulic
resistance of the venous pathways from the brain to the heart compared with
CCSVI negative healthy controls. As such, it raises intriguing questions as to
whether the increase in aqueductal CSF pulsatility observed in MS patients
(19) is associated with MS or CCSVI. If increased CSF pulsatility were purely
an attribute of MS, then one would not expect the phenomenon to be present
in CCSVI positive healthy controls.
In an attempt to answer the above question, we undertook the present study,
with the aim of establishing whether or not CCSVI is associated with altered
intracranial CSF dynamics in healthy individuals with no known neurological
pathology. From the results in Table 2 and figures 1-3 it appears that CCSVI
is associated with changes in the aqueductal CSF flow dynamics in healthy
individuals. In particular, NPF was significantly increased (p=0.008) in the
CCSVI positive group compared with the CCSVI negative group. NNF was
also increased, but this was not significant. Likewise, NF decreased in the
CCSVI positive group, but this was not significant. Comparison between the
aqueductal CSF flow curves published by Magnano et al (18) for both MS
patients and healthy controls reveals similar curves to those for the healthy
CCSVI positive and negative subjects in the present study, suggesting that
increased aqueductal pulsatility may be primarily associated with impaired
cerebral venous drainage rather than MS itself. Indeed, the fact that we found

greatly increased NPF in CCSVI positive healthy individuals, just as Zamboni
et al (19), Gorucu et al (20), Magnano et al (18) all observed in MS patients,
further implies that the phenomenon may be biomechanical in nature, rather
than due to neuronal damage/brain atrophy.
Being encased in a rigid enclosure, the brain employs a complex intracranial
fluid regulatory mechanism to compensate for increased blood flow during
systole. This system compensates for the transient increase in arterial blood
entering the cranium during systole, by displacing an approximately equal
volume of CSF through the foramen magnum into the spinal column (38). It
does this by employing a sophisticated windkessel mechanism to smooth
blood flow through the cerebral capillary bed (39,40); something that appears
to be sensitive to changes in the cerebral venous system (41-43). Indeed, it
has been postulated that the venous system plays an important role in
regulating the dynamics of the intracranial fluid system (44). While the
mechanisms involved are poorly understood, it can be hypothesized that
impairment of cerebral venous outflow is likely to induce retrograde
hypertension in the dural sinuses, as Zamboni et al (45) observed; something
that might reduce intracranial compliance resulting in altered CSF behaviour
(43). Evidence supporting this model comes from Luetmer et al (23), Schroth
& Klose (24), Gideon et al (25), Kim et al (26), El Sankari et al (27) and
Bradley (28), all of whom found CSF pulsatility in the AoS to be markedly
greater in NPH patients compared with controls. Given that reduced
intracranial compliance (29,30,46,47), induced by venous hypertension, is
thought to be involved in NPH (29,30,48,49), this suggests that impaired
venous outflow is capable of altering the intracranial CSF dynamics, just as
we observed in the CCSVI positive healthy individuals. Further evidence to
support this opinion comes from an interventional study by Zivadinov et al
(50) in which percutaneous transluminal venous angioplasty was shown to
reduce aqueductal CSF pulsatility in MS patients diagnosed with CCSVI.
Although abnormal CSF dynamics and their relation to health verses disease
status is beyond the scope of this article, it is noticeable that their role in
neurodegenerative disease is becoming increasingly contemplated (51).
One interesting finding of our study was that CCSVI appeared to be
associated with a weakening in the correlation between the aqueductal CSF
pulse variables and NLVV. In healthy individuals there is normally a strong
correlation between lateral ventricle size and aqueductal CSF flow (52).
However, in the CCSVI positive group we found the correlations between
NNF, NPF, ACS and NLVV to be markedly weaker than that in the CCSVI
negative group. While the reasons for this are not understood, it may be that
structural changes are at work. Evidence supporting this opinion comes from
the ensemble mean ACS over the cardiac cycle. This signal is derived by
dividing each CSF flow signal, by the corresponding CSF velocity signal and
therefore represents the changes in the AoS area throughout the cardiac
cycle. The mean ACS is significantly different in both groups, with the mean
aqueductal area being substantially larger in the CCSVI positive group
compared with the CCSVI negative group. From this it can be concluded that
the increased CSF pulsatile flow in the CCSVI positive group is facilitated
more by enlargement of the AoS than any increase in CSF velocity.
This study is not without limitations. First, the number of the enrolled healthy
individuals was relatively small and therefore further studies should extend
our findings using a larger sample size. Second, the diagnosis of CCSVI was
established only by using DS, while recent studies suggest that increased
sensitivity and specificity of CCSVI diagnosis, can be achieved using a variety
of non-invasive and invasive imaging approaches (53). Lastly, the effect of
altered CSF pulsatility on long-term neurologic outcomes is unknown, and
only longitudinal studies will be able to provide further insight on this important
question.
In conclusion, the results of the study suggest that CCSVI is associated with
intracranial biomechanical changes in healthy individuals. Indeed, such was
the magnitude of the changes observed that it was relatively easy to
discriminate, using SVD analysis, between the CCSVI positive and negative
groups using just the three variables NNF, NPF and NLVV. Given that
impaired cerebral venous outflow has been shown to be associated with MS
(16,17), this implies that similar changes in intracranial CSF dynamics
observed in MS patients (18-20), might be primarily due to the presence of
CCSVI rather than due to neuronal damage.

References
1. Zamboni P, Galeotti R, Menegatti E, et al. Chronic cerebrospinal
venous insufficiency in patients with multiple sclerosis. J Neurol
Neurosurg Psychiatry 2009;80(4):392-399.
2. Simka M, Kostecki J, Zaniewski M, Majewski E, Hartel M. Extracranial
Doppler sonographic criteria of chronic cerebrospinal venous
insufficiency in the patients with multiple sclerosis. Int Angiol
2010;29(2):109-114.
3. Al-Omari MH, Rousan LA. Internal jugular vein morphology and
hemodynamics in patients with multiple sclerosis. Int Angiol
2010;29(2):115-120.
4. Zivadinov R, Marr K, Cutter G, et al. Prevalence, sensitivity, and
specificity of chronic cerebrospinal venous insufficiency in MS.
Neurology 2011;77(2):138-144.
5. Zivadinov R, Galeotti R, Hojnacki D, et al. Value of MR Venography for
Detection of Internal Jugular Vein Anomalies in Multiple Sclerosis: A
Pilot Longitudinal Study. AJNR Am J Neuroradiol;32(5):938-946.
6. Wattjes MP, van Oosten BW, de Graaf WL, et al. No association of
abnormal cranial venous drainage with multiple sclerosis: a magnetic
resonance venography and flow-quantification study. J Neurol
Neurosurg Psychiatry 2011;82(4):429-435.
7. Centonze D, Floris R, Stefanini M, et al. Proposed chronic
cerebrospinal venous insufficiency criteria do not predict multiple
sclerosis risk or severity. Ann Neurol 2011;70(1):51-58.
8. Doepp F, Paul F, Valdueza JM, Schmierer K, Schreiber SJ. No
cerebrocervical venous congestion in patients with multiple sclerosis.
Ann Neurol 2010;68(2):173-183.
9. Doepp F, Wurfel JT, Pfueller CF, et al. Venous drainage in multiple
sclerosis: a combined MRI and ultrasound study. Neurology
2011;77(19):1745-1751.
10. Mayer CA, Pfeilschifter W, Lorenz MW, et al. The perfect crime?
CCSVI not leaving a trace in MS. J Neurol Neurosurg Psychiatry
2011;82(4):436-440.
11. Khan O, Filippi M, Freedman MS, et al. Chronic cerebrospinal venous
insufficiency and multiple sclerosis. Ann Neurol 2010;67(3):286-290.
12. Wattjes MP, Doepp F, Bendszus M, Fiehler J. ["Chronic cerebrospinal
venous insufficiency" in multiple sclerosis - is multiple sclerosis a
disease of the cerebrospinal venous outflow system?]. Rofo
2011;183(6):523-530.
13. Baracchini C, Atzori M, Gallo P. CCSVI and MS: no meaning, no fact.
Neurol Sci 2012.
14. Beards SC, Yule S, Kassner A, Jackson A. Anatomical variation of
cerebral venous drainage: the theoretical effect on jugular bulb blood
samples. Anaesthesia 1998;53(7):627-633.
15. Schummer W, Schummer C, Bredle D, Frober R. The anterior jugular
venous system: variability and clinical impact. Anesth Analg
2004;99(6):1625-1629, table of contents.

16. Zamboni P, Menegatti E, Conforti P, Shepherd S, Tessari M, Beggs C.
Assessment of cerebral venous return by a novel plethysmography
method. J Vasc Surg 2012;56:677-685.
17. Beggs C, Shepherd S, Zamboni P. Cerebral venous outflow resistance
and interpretation of cervical plethysmography data with respect to the
diagnosis of chronic cerebrospinal venous insufficiency. Phlebology
2012;DOI: 10.1258/phleb.2012.012039:1-9.
18. Magnano C, Schirda C, Weinstock-Guttman B, et al. Cine
cerebrospinal fluid imaging in multiple sclerosis. J Magn Reson
Imaging 2012;36:825-834.
19. Zamboni P, Menegatti E, Weinstock-Guttman B, et al. The severity of
chronic cerebrospinal venous insufficiency in patients with multiple
sclerosis is related to altered cerebrospinal fluid dynamics. Funct
Neurol 2009;24(3):133-138.
20. Gorucu Y, Albayram S, Balci B, et al. Cerebrospinal fluid flow dynamics
in patients with multiple sclerosis: a phase contrast magnetic
resonance study. Funct Neurol 2011;26(4):215-222.
21. Dalton CM, Brex PA, Jenkins R, et al. Progressive ventricular
enlargement in patients with clinically isolated syndromes is associated
with the early development of multiple sclerosis. J Neurol Neurosurg
Psychiatry 2002;73(2):141-147.
22. Dalton CM, Miszkiel KA, O'Connor PW, Plant GT, Rice GP, Miller DH.
Ventricular enlargement in MS: one-year change at various stages of
disease. Neurology 2006;66(5):693-698.
23. Luetmer PH, Huston J, Friedman JA, et al. Measurement of
cerebrospinal fluid flow at the cerebral aqueduct by use of phase-
contrast magnetic resonance imaging: technique validation and utility in
diagnosing idiopathic normal pressure hydrocephalus. Neurosurgery
2002;50(3):534-543; discussion 543-534.
24. Schroth G, Klose U. Cerebrospinal fluid flow. III. Pathological
cerebrospinal fluid pulsations. Neuroradiology 1992;35(1):16-24.
25. Gideon P, Stahlberg F, Thomsen C, Gjerris F, Sorensen PS, Henriksen
O. Cerebrospinal fluid flow and production in patients with normal
pressure hydrocephalus studied by MRI. Neuroradiology
1994;36(3):210-215.
26. Kim DS, Choi JU, Huh R, Yun PH, Kim DI. Quantitative assessment of
cerebrospinal fluid hydrodynamics using a phase-contrast cine MR
image in hydrocephalus. Childs Nerv Syst 1999;15(9):461-467.
27. El Sankari S, Gondry-Jouet C, Fichten A, et al. Cerebrospinal fluid and
blood flow in mild cognitive impairment and Alzheimer's disease: a
differential diagnosis from idiopathic normal pressure hydrocephalus.
Fluids Barriers CNS 2011;8(1):12.
28. Bradley WG, Jr., Scalzo D, Queralt J, Nitz WN, Atkinson DJ, Wong P.
Normal-pressure hydrocephalus: evaluation with cerebrospinal fluid
flow measurements at MR imaging. Radiology 1996;198(2):523-529.
29. Bateman GA. Vascular compliance in normal pressure hydrocephalus.
AJNR Am J Neuroradiol 2000;21(9):1574-1585.

30. Bateman GA. The pathophysiology of idiopathic normal pressure
hydrocephalus: cerebral ischemia or altered venous hemodynamics?
AJNR Am J Neuroradiol 2008;29(1):198-203.
31. Zivadinov R, Cutter G, Marr K, et al. No Association Between
Conventional Brain MR Imaging and Chronic Cerebrospinal Venous
Insufficiency in Multiple Sclerosis. AJNR Am J Neuroradiol 2012.
32. Dolic K, Weinstock-Guttman B, Marr K, et al. Risk factors for chronic
cerebrospinal venous insufficiency (CCSVI) in a large cohort of
volunteers. PLoS One 2011;6(11):e28062.
33. Dolic K, Marr K, Valnarov V, et al. Sensitivity and specificity for
screening of chronic cerebrospinal venous insufficiency using a
multimodal non-invasive imaging approach in patients with multiple
sclerosis. Funct Neurol 2011;26(4):205-214.
34. Zivadinov R, Heininen-Brown M, Schirda CV, et al. Abnormal
subcortical deep-gray matter susceptibility-weighted imaging filtered
phase measurements in patients with multiple sclerosis: a case-control
study. Neuroimage 2012;59(1):331-339.
35. Benjamini Y, Hochberg Y. Controlling the false discovery rate: a
practical and powerful approach to multiple testing. Journal of the
Royal Statistical Society B 1995;57(1):289-300.
36. Beggs C. Multiple sclerosis appears to be associated with cerebral
venous abnormalities. Ann Neurol 2010;68(4):560-561.
37. Zivadinov R, Marr K, Cutter G, et al. Prevalence, sensitivity, and
specificity of chronic cerebrospinal venous insufficiency in MS.
Neurology 2011;77:138-144.

38. Egnor M, Zheng L, Rosiello A, Gutman F, Davis R. A model of
pulsations in communicating hydrocephalus. Pediatr Neurosurg
2002;36(6):281-303.
39. Bateman GA, Levi CR, Schofield P, Wang Y, Lovett EC. The venous
manifestations of pulse wave encephalopathy: windkessel dysfunction
in normal aging and senile dementia. Neuroradiology 2008;50(6):491-
497.
40. Bateman GA. Pulse-wave encephalopathy: a comparative study of the
hydrodynamics of leukoaraiosis and normal-pressure hydrocephalus.
Neuroradiology 2002;44(9):740-748.
41. Bateman GA. Magnetic resonance imaging quantification of
compliance and collateral flow in late-onset idiopathic aqueductal
stenosis: venous pathophysiology revisited. J Neurosurg
2007;107(5):951-958.
42. Bateman GA. Arterial inflow and venous outflow in idiopathic
intracranial hypertension associated with venous outflow stenoses. J
Clin Neurosci 2008;15(4):402-408.
43. Beggs CB. Venous Haemodynamics in Neurological Disorders: An
Analytical Review with Hydrodynamic Analysis. BMC Medicine. BMC
Med (in press).
44. El Sankari S, Czosnyka M, Lehmann P, Meyer ME, Deramond H,
Baledent O. Cerebral Blood and CSF Flow Patterns in Patients
Diagnosed for Cerebral Venous Thrombosis - An Observational Study.
J Clin Imaging Sci 2012;2:41.
45. Zamboni P, Galeotti R, Menegatti E, et al. A prospective open-label
study of endovascular treatment of chronic cerebrospinal venous
insufficiency. J Vasc Surg 2009;50(6):1348-1358 e1341-1343.
46. Miyati T, Mase M, Kasai H, et al. Noninvasive MRI assessment of
intracranial compliance in idiopathic normal pressure hydrocephalus. J
Magn Reson Imaging 2007;26(2):274-278.
47. Mase M, Miyati T, Kasai H, et al. Noninvasive estimation of intracranial
compliance in idiopathic NPH using MRI. Acta Neurochir Suppl
2008;102:115-118.
48. Williams H. The venous hypothesis of hydrocephalus. Med Hypotheses
2008;70(4):743-747.
49. Williams H. A unifying hypothesis for hydrocephalus, Chiari
malformation, syringomyelia, anencephaly and spina bifida.
Cerebrospinal Fluid Res 2008;5:7.
50. Zivadinov R, Magnano C, Galeotti R, et al. Changes of Cine
Cerebrospinal Fluid Dynamics in Patients with Multiple Sclerosis
Treated with Percutaneous Transluminal Angioplasty: Case-control
Study. J Vasc Interv Radiol 2013;24(6):829-838.
51. Nedergaard M. Neuroscience. Garbage truck of the brain. Science
2013;340(6140):1529-1530.
52. Zhu DC, Xenos M, Linninger AA, Penn RD. Dynamics of lateral
ventricle and cerebrospinal fluid in normal and hydrocephalic brains. J
Magn Reson Imaging 2006;24(4):756-770.
53. Dolic K, Siddiqui AH, Karmon Y, Marr K, Zivadinov R. The role of
noninvasive and invasive diagnostic imaging techniques for detection
of extra-cranial venous system anomalies and developmental variants.
BMC Med 2013;11:155.

Tables
Table 1. Demographic, clinical and whole brain volume characteristics in
healthy CCSVI positive and negative individuals.
CCSVI
negative
(n = 32)
CCSVI
positive
(n = 19)
Significance
(p value)
Female gender, n (%) 21 (65.6) 9 (47.4) 0.200
Age in years, mean (SD) 44.3 (14.8) 44.5 (19.1) 0.967
BMI, mean (SD) 25.7 (5.3) 27.1 (5.3) 0.317
Hypertension, n (%) 2 (6.3) 0 (0.0) 0.266
Heart Disease, n (%) 5 (15.6) 2 (10.5) 0.609
Current Smokers, n (%) 3 (15.0) 0 (0.0) 0.143
Ever Smokers, n (%) 13 (65.0) 6 (13.0) 0.285
Type 1 Diabetes, n (%) 0 (0.0) 0 (0.0) 1.000
VH criteria score, mean (SD) 0.66 (0.48) 2.37 (0.60) <0.001
VHISS score, mean (SD) 1.31 (1.06) 4.42 (1.43) <0.001
NBV, mean (SD) 1531.4
(86.0)
1509.2
(74.8)
0.340
CCSVI - chronic cerebrospinal venous insufficiency; BMI – body mass index; VH –
venous hemodynamic; VHISS – venous hemodynamic insufficiency severity score;
NBV – normalized brain volume.
The differences between the study groups were tested using the student’s t-test and
chi-square test.

Table 2. MRI characteristics in healthy individuals.
CCSVI
Negative
(n = 32)
CCSVI
Positive
(n = 19)
Significance
(p value)
Effect Size
Cohen’s d
NNF (L/beat), mean (SD) -27.6 (19.5) -33.3 (16.9) 0.092 0.304
NPF (L/beat), mean (SD) 23.6 (22.0) 31.2 (13.6) 0.008 0.391
NF (L/beat), mean (SD) -4.0 (7.5) -2.1 (8.9) 0.080 0.245
Mean ACS (mm2), mean (SD) 1.0 (0.5) 1.3 (0.5) 0.021 0.585
NLVV (mL), mean (SD) 37.5 (21.5) 44.1 (18.3) 0.147 0.322
CCSVI - chronic cerebrospinal venous insufficiency; NNF – net negative CSF flow;
NPF – net positive CSF flow; NF – net CSF flow (i.e. NNF+NPF); NLVV – normalized
lateral ventricle volume.
The differences between the study groups were tested using the Mann-Whitney U-
test, and Cohen’s d test.

Table 3. Composition of respective left singular vectors (LSVs) used in
the singular value decomposition (SVD).
NNF NPF NLVV
First LSV 0.0566 -0.0535 0.0467
Second LSV -0.0402 0.1015 0.1648
Third LSV -0.4194 -0.3468 0.1113
NNF – net negative CSF flow; NPF – net positive CSF flow; NLVV – normalized
lateral ventricle volume.
NB. The values in the table are the linear coefficients that must be applied to the
component variables in order to reconstruct the respective LSVs.

Figures
Figure 1. Ensemble mean aqueductal CSF flow signal over a cardiac cycle for
both the CCSVI positive and negative groups. Between groups difference in
positive amplitude (p=0.023) and negative amplitude (p=0.044). The phases
of cycle where the difference between the signals is significant (p<0.050) are
8-14, 21 and 26-32. (Error bars represent one standard deviation.)

Figure 2. Ensemble mean aqueductal CSF velocity signal over a cardiac cycle
for both the CCSVI positive and negative groups. Between groups difference
in positive amplitude (p=0.136) and negative amplitude (p=0.316). A
statistically significant difference between the signals (p<0.050) is only
observed for phase 32 of the cycle. (Error bars represent one standard
deviation.)
Figure 3. Sequential ensemble mean ACS over a cardiac cycle for both the
CCSVI positive and negative groups. Between groups mean ACS, p=0.021.
The phases of cycle where the difference between the signals is significant
(p<0.050) are 8-10, 14-15, 18-28 and 30-32. (Error bars represent one
standard deviation.)

Figure 4. Scatter plot of NNF verses NLVV for the CCSVI positive and
negative groups. CCSVI negative group (r=-0.686; p<0.001) and CCSVI
positive group (r=-0.103; p=0.674).

Figure 5. Singular value decomposition (SVD) cluster analysis results (derived
using the three variables NNF, NPF and NLVV) (p=0.025).