introductory quiz - transtutors · web viewportfolio management - active and passive strategies...
TRANSCRIPT
INVESTMENT AND FUND MANAGEMENTMODULE HANDBOOK
2010/11SEMESTER 2
MODULE PROGRAMME OF DELIVERYWeek
CommencingTopic Handbook
Page no.
31st Jan 2011Session 1:Introduction- Introductory Quiz- Links with other modules
13
7th Feb 2011Session 2:The Investment Environment- Instruments- Security Analysis- Investment Policies - Investment Strategies
25
14th Feb &
21st Feb 2011
Sessions 3 & 4:Diversification and Portfolio Analysis- Portfolio Theory- Risk and Risk Aversion- Building the optimal risky portfolio- Mean Variance Models
32
28th Feb 2011 (NB: No session held in w/c 7th
March)
Session 5:Portfolio Management- Active and Passive Strategies- Security Analysis and Allocation- Portfolio Monitoring
35
14th Mar 2011Session 6:Management of Bond Portfolios- Duration- Convexity- Immunisation
47
21st Mar &
28th Mar 2011
Sessions 7 & 8:Performance Measurement and Portfolio Protection- Interest rate and yield curve risk- Immunisation, cash flow management and
combination strategies- Strategies with derivatives and futures- Managing equity, bond, interest rate and
currency risk- Attribution analysis
58
4th April 2011Session 9:The use of Financial Derivatives by Fund Mangers
72
11th April 2011 Session 10:Fund Classes- Pension Funds- Fixed Income Funds- Personal Investment Portfolios
79
TUTOR CONTACT DETAILS:2
Paul HoughtonAccountancy & Financial ServicesLeeds Business School,Faculty of Business & LawLeeds Metropolitan UniversityThe Rose Bowl1 Portland GateLEEDSLS1 3HB00 44 (0)113 812 [email protected]
MODULE SPECIFICATION:
The module aims to cover the range of skills involved in managing assets and liabilities against specified criteria. It is intended to be useful for input into treasury operations, asset/liability management in financial institutions and fund management in pension funds, mutual funds and other collective investments. It is applicable to both public and private sector operations and will cover the international aspects of fund management. The module also aims to provide scope for personal development in that many of the techniques and methods have potential uses for personal financial management.
Intended Learning Outcomes:
Upon successful completion of this module students should be able to:
Explain the investment objectives of the different institutional and individual investors;
Compare the major types of investment policies and the constraints which the different institutional and private investors are subject to;
Evaluate the expected return and risk of portfolios that are constructed by combining risky assets with risk free investments and discuss the concept of an optimal portfolio in the context of institutional and personal requirements;
Construct efficient portfolios for a range of investors; Demonstrate choices to be made in actively managing a fixed income portfolio and
formulate immunisation strategies for different investment horizons; Assess portfolio management performance and decompose returns into attributable factors.
Skills Development Opportunties:
The module will develop a range of skills including:
collection and evaluation of investment data through various methodologies; decision making skills; case study and problem-solving skills; identification of preferred learning and problem solving styles, considering the
implications for self-development; working effectively as a group member.
Postgraduate Skills and CompetenciesOpportunity to Develop
Assessed
Academic Skills:
3

Research Capability X XCritical Thinking X XProblem Solving X XCreativity X XKnowledge Management X X
Self Management Skills:Critical Self Awareness XManage Change / Adaptability XOrganisation and Planning XCareer Awareness XCommitment to Lifelong Learning X
Communication Skills:Written Communication X XOral/Visual Communication Skills XActive Listening XCIT Skills XNumeracy Skills X X
Interpersonal Skills:Citizenship XTeam Skills XLeadership XNetworking XNegotiating X
Learning Methods:
The teaching and learning strategy will be built upon the inter-dependent and independent learning skills which have been developed earlier in the programme and students will be expected to take a high degree of responsibility for their own learning.
A lecture programme will provide the conceptual underpinnings for the module. This will be supported by student-led and tutor-led seminar sessions which will cover a variety of activities to give students the opportunity to further develop their critical awareness of the concepts and implications of these for investment and fund management. Activities will include discussions, case studies and research centred tasks.
Assessment Methods:
The assessment will consist of coursework with two components:
1) Creation of an investment portfolio for a specific individual taking into account strategy, policy, needs and asset allocation. Worth 20% of module. Prior to final submission, students will have the opportunity to submit drafts and receive formative feedback.
2) A detailed, critical analysis of a case study or scenario facing an individual fund manager or personal investor. Students will be required to submit an individual report that includes appropriate research in support of their analysis and recommendations. Worth 80% of module.
Syllabus Content (Indicative):
1) The Investment Environment: the household, business and government sectors; financial innovation and derivatives
4

globalisation, securitisation, credit enhancement and financial engineering
2) Diversification and Portfolio Analysis:
risk and risk aversion building the optimal risky portfolio simple, superfluous and Markowitz diversification
3) Portfolio Management - practical applications:
active and passive strategies security analysis and allocation forecasting market movements portfolio monitoring
4) Performance Measurement and Portfolio Protection:
interest rate and yield curve risk immunisation, cash flow management and combination strategies strategies with derivatives and futures managing equity, bond, interest rate and currency risk attribution analysis
5) Fund Classes:
Pension Funds Fixed Income Funds Personal Investment Portfolios International Funds
ACTUAL ASSESSMENT:
The assessment for this module comprises two in-course assignments as follows:
Part A - an individual assignment to be submitted by Wednesday, 16th March 2011 (counts for 20% of total mark) (to be handed in to Reception, Rose Bowl, by 12 noon).
Part B – an individual assignment to be submitted by Tuesday, 3rd May 2011 (counts for 80% of total mark) (max of 3000 words) (to be handed in to Reception, Rose Bowl, by 12 noon)
RECOMMENDED TEXTS FOR BACKGROUND READING:
1) Main Text:
Reilly, F.K. & Brown, K.C. (2009)
Analysis of Investments and Management of Portfolios (International Edition) 9th Edition, Thompson (South Western – Cengage Learning) (ISBN: 0324658427)
5
2) Other Texts for Background Reading:
Bierman, H Jr (2006)
The Bare Essentials of Investing: Teaching the Horse to Talk, World Scientific Publishing (ISBN: 109812705406)
Boakes, B (2010) Reading and Understanding the FINANCIAL TIMES (update for 2010-2011), Prentice Hall (FT) (ISBN: 9780273731818)
Bodie, Z., Kane, A., & Marcus, AJ (2006)
Essentials of Investments McGraw Hill (London) (ISBN: 0071254455)
Campbell, J.Y. & Vicera, L.M. (2002)
Strategic Asset Allocation: portfolio choice for long-term investors Oxford University Press (ISBN: 0198296940)
Cuthbertson, K & Nitzsche, D (2008)
Investments 2nd Edition (Cass Business School), Wiley(ISBN: 9780470519561)
Elton, E.J, (2003) Modern Portfolio Theory and Investment Analysis 6th Edition, Wiley (ISBN: 0471238546)
Jones, C.P. (2007) Investments: Analysis & Management 10th Edition, Wiley (ISBN: 047004781X)
Litterman, B. (2003)
Modern Investment Management; an equilibrium approach John Wiley (ISBN: 0471124109)
Pilbeam, K (2005) Finance & Financial Markets 2nd Edition, Palgrave Macmillan (ISBN: 9781403948359)
Redhead, K. (2003) Introducing Investments: a personal finance approach FT Prentice Hall (ISBN: 027367305X)
3) Appropriate journal articles and relevant websites.
SEMINAR WORK
Session 1:
Introductory Quiz (Page 14)Presentations on:
Shareholder Value Analysis EMH CAPM
Session 2: 6

Group Discussion (page 27)
Exercises;
a) Imagine that your favourite aunt has just been advised to invest all her money in the following unit trusts:
Investec UK Smaller Companies Standard Life UK Equity High Income Artemis UK Special Situations Morgan Stanley Emerging Markets Debt Gartmore UK Focus
She is totally confused – advise her.
b) Susan is trying to decide which of the following ordinary shares to purchase. What would you recommend?
Expected Return%
Standard Deviation%
Able plc 7.0 3.7Baker plc 7.7 4.9Charles plc 15.0 15.0Diamond plc 3.0 3.7Energy Design plc 7.7 12.0
Session 3:
See XStream
Session 4:
See Page 34
Session 5:
See Page 40 and Page 46
Session 6:
See Page 57
Session 7:
See pages 65 and 67
Session 8:
See Page 71
Session 9:
See XStream
Session 10:
7

See page 84
ASSIGNMENT
Part A (worth 20%)
You are required to imagine that a friend of yours has just won £1 million on the British National Lottery. Your friend knows very little about investment and finance generally and she has asked for your advice.
She will definitely give up employment and retire and is looking for an income of about £100,000 per year. She wants her £1 million not only to remain intact but also to grow, at the very least, in line with inflation. She is quite risk averse, so she requires a good spread of investments so that only relatively small amounts are ‘at risk’ in any one instrument, company or country.
8

You are required to suggest a suitable portfolio of investments which might be expected to achieve your friend’s objectives. You are required to submit your suggested portfolio according to the following deadlines:
If you chose, you can E-Mail your first draft portfolio to [email protected] by 5pm on Friday, 25t February 2011, for feedback. You will receive comments and criticisms of your portfolio (by e-mail) by Friday, 4th March 2011.
Present a final portfolio (taking into account the comments and criticisms received) on Wednesday, 16th March 2011 – to be handed into 2nd Floor Reception, The Rose Bowl, by 12 noon. Please hand in paper copy and also copy on CD.
Your portfolio submission should include a brief explanation and justification of each of the investments you suggest.
Provisional marks for Assignment A will be available on X-stream by Monday, 6th April 2011.
Notes:
a) Brevity is important here – please try to keep your portfolio and justification to two pages maximum.b) Marks will be awarded for:
A sensibly diversified portfolio A logical justification of your choices of investment An attempt to meet the investment objectives of your friend
ASSIGNMENT
Part B (worth 80%)
An individual assignment based on the following case study is to be submitted by Tuesday, 3rd May 2011 (max 3000 words) – to be handed into 2nd Floor Reception, the Rose Bowl, by 12 noon.
Fortunes Inc is a successful London print shop. It is a co-operative which was set up ten years ago after an industrial dispute. The business is run by its 25 workers, including printers, graphic designers and sales staff. It has a flat management structure, which means that no-one is more senior than anyone else. Everyone earns
9

the same no matter how many years they have worked for the business. The ages of the members range from early twenties to mid fifties.
Staff turnover is very low largely, it is felt, because the members like having an equal say in the decision making. They can decide how to structure their hours, what benefits they should have and what equipment they need to buy for the business.
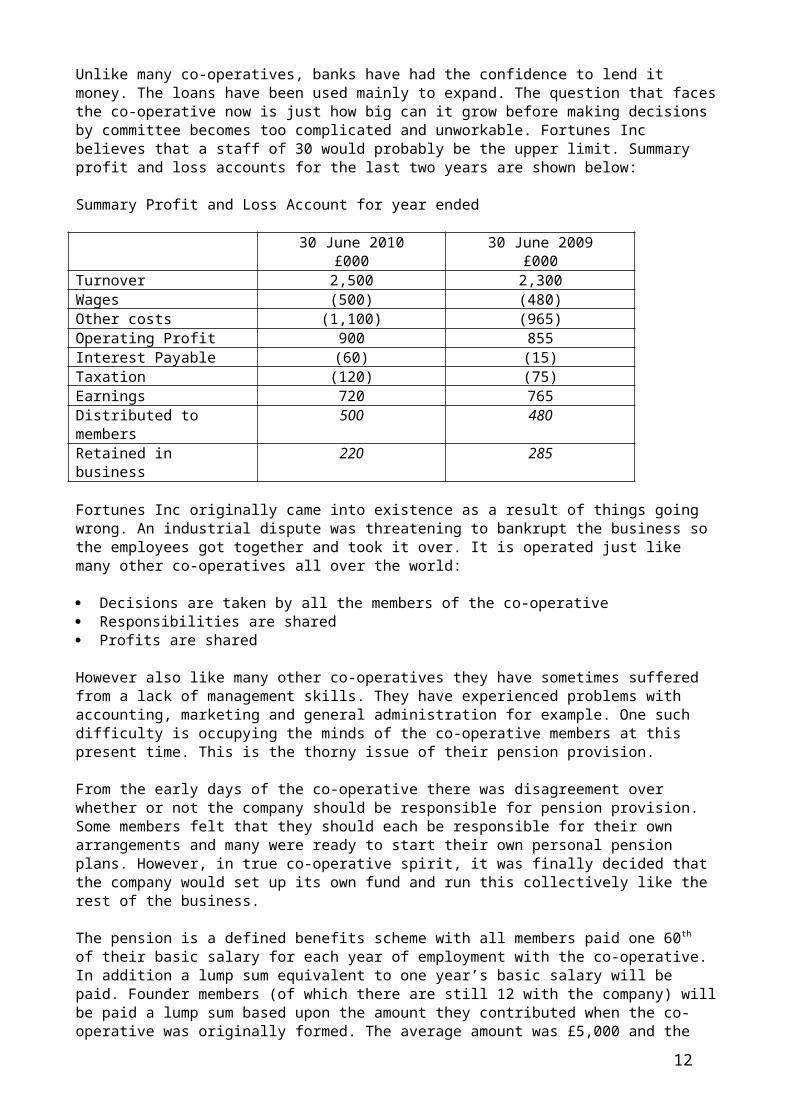
Unlike many co-operatives, banks have had the confidence to lend it money. The loans have been used mainly to expand. The question that faces the co-operative now is just how big can it grow before making decisions by committee becomes too complicated and unworkable. Fortunes Inc believes that a staff of 30 would probably be the upper limit. Summary profit and loss accounts for the last two years are shown below:
Summary Profit and Loss Account for year ended
30 June 2010£000
30 June 2009£000
Turnover 2,500 2,300Wages (500) (480)Other costs (1,100) (965)Operating Profit 900 855Interest Payable (60) (15)Taxation (120) (75)Earnings 720 765Distributed to members
500 480
Retained in business 220 285
Fortunes Inc originally came into existence as a result of things going wrong. An industrial dispute was threatening to bankrupt the business so the employees got together and took it over. It is operated just like many other co-operatives all over the world:
Decisions are taken by all the members of the co-operative Responsibilities are shared Profits are shared
However also like many other co-operatives they have sometimes suffered from a lack of management skills. They have experienced problems with accounting, marketing and general administration for example. One such difficulty is occupying the minds of the co-operative members at this present time. This is the thorny issue of their pension provision.
From the early days of the co-operative there was disagreement over whether or not the company should be responsible for pension provision. Some members felt that they should each be responsible for their own arrangements and many were ready to start their own personal pension plans. However, in true co-operative spirit, it was finally decided that the company would set up its own fund and run this collectively like the rest of the business.
The pension is a defined benefits scheme with all members paid one 60th of their basic salary for each year of employment with the co-operative. In addition a lump sum
10
equivalent to one year’s basic salary will be paid. Founder members (of which there are still 12 with the company) will be paid a lump sum based upon the amount they contributed when the co-operative was originally formed. The average amount was £5,000 and the agreement was that the original amount should be paid with 5% compound interest added annually (the 12 members affected have on average 20 years to retirement). The non-founder members have on average worked five years for the co-operative to date. At the moment the co-operative contributes a fixed sum per annum to the fund equal to 6% of the total wages bill. There has been debate over whether this should be more but no conclusion has yet been reached.
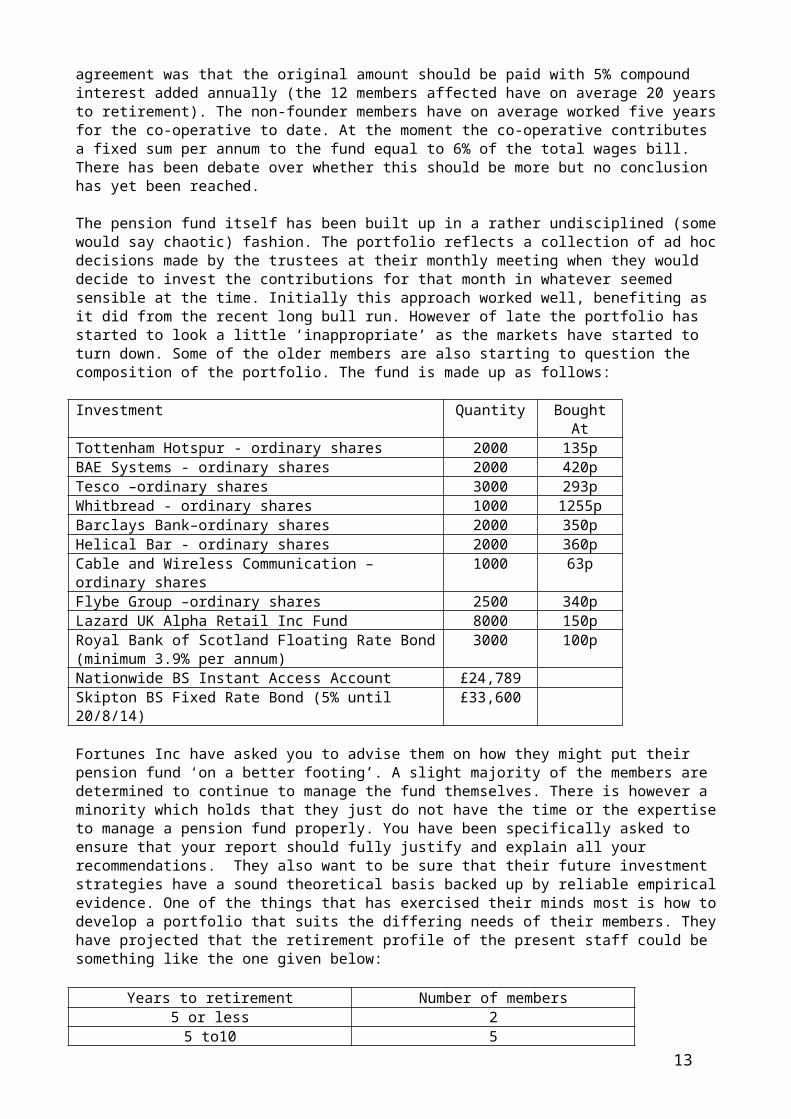
The pension fund itself has been built up in a rather undisciplined (some would say chaotic) fashion. The portfolio reflects a collection of ad hoc decisions made by the trustees at their monthly meeting when they would decide to invest the contributions for that month in whatever seemed sensible at the time. Initially this approach worked well, benefiting as it did from the recent long bull run. However of late the portfolio has started to look a little ‘inappropriate’ as the markets have started to turn down. Some of the older members are also starting to question the composition of the portfolio. The fund is made up as follows:
Investment Quantity Bought At
Tottenham Hotspur - ordinary shares 2000 135pBAE Systems - ordinary shares 2000 420pTesco –ordinary shares 3000 293pWhitbread - ordinary shares 1000 1255pBarclays Bank–ordinary shares 2000 350pHelical Bar - ordinary shares 2000 360pCable and Wireless Communication –ordinary shares
1000 63p
Flybe Group –ordinary shares 2500 340pLazard UK Alpha Retail Inc Fund 8000 150pRoyal Bank of Scotland Floating Rate Bond (minimum 3.9% per annum)
3000 100p
Nationwide BS Instant Access Account £24,789Skipton BS Fixed Rate Bond (5% until 20/8/14) £33,600
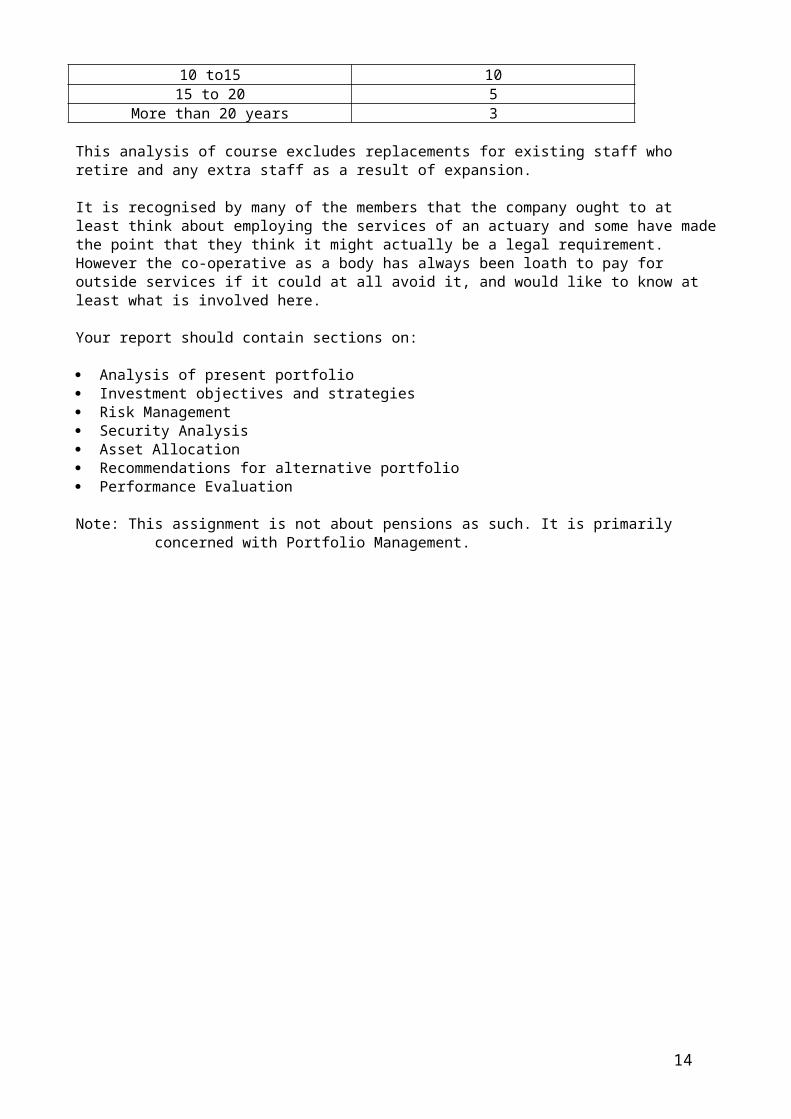
Fortunes Inc have asked you to advise them on how they might put their pension fund ‘on a better footing’. A slight majority of the members are determined to continue to manage the fund themselves. There is however a minority which holds that they just do not have the time or the expertise to manage a pension fund properly. You have been specifically asked to ensure that your report should fully justify and explain all your recommendations. They also want to be sure that their future investment strategies have a sound theoretical basis backed up by reliable empirical evidence. One of the things that has exercised their minds most is how to develop a portfolio that suits the differing needs of their members. They have projected that the retirement profile of the present staff could be something like the one given below:
Years to retirement Number of members5 or less 25 to10 5
10 to15 1015 to 20 5
11
More than 20 years 3
This analysis of course excludes replacements for existing staff who retire and any extra staff as a result of expansion.
It is recognised by many of the members that the company ought to at least think about employing the services of an actuary and some have made the point that they think it might actually be a legal requirement. However the co-operative as a body has always been loath to pay for outside services if it could at all avoid it, and would like to know at least what is involved here.
Your report should contain sections on:
Analysis of present portfolio Investment objectives and strategies Risk Management Security Analysis Asset Allocation Recommendations for alternative portfolio Performance Evaluation
Note: This assignment is not about pensions as such. It is primarily concerned with Portfolio Management.
12
Session 1
Introduction
Introductory Quiz
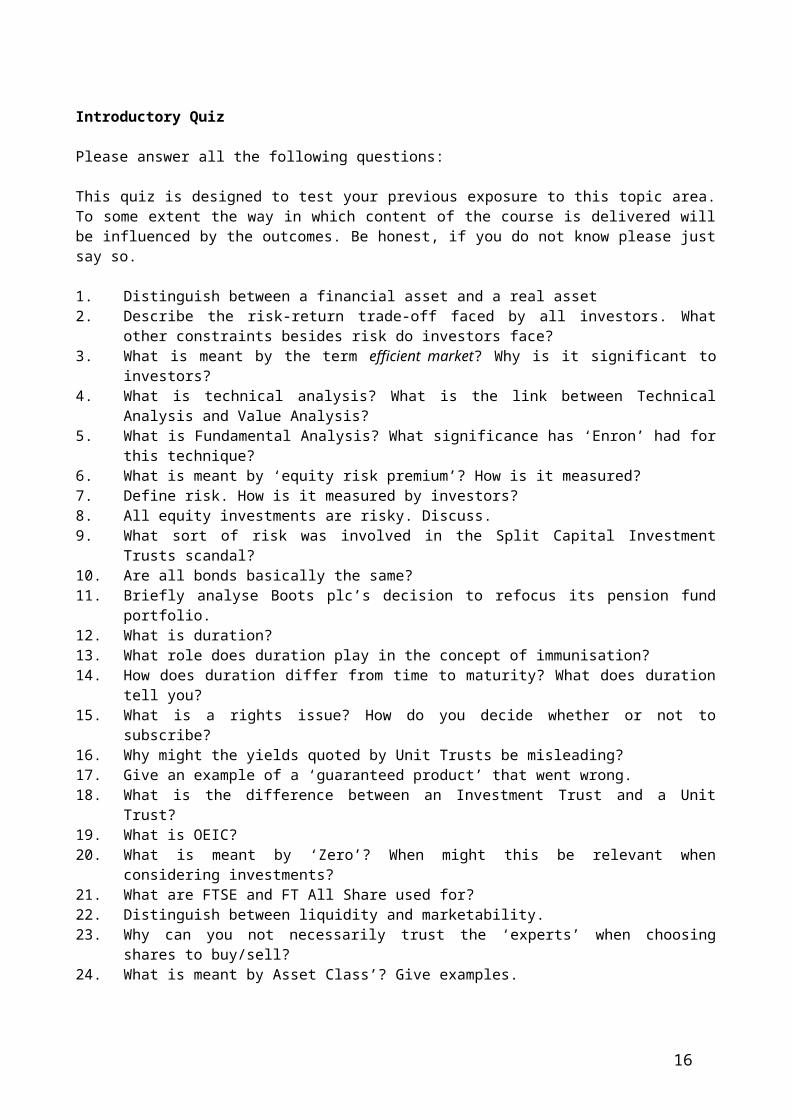
Please answer all the following questions:
This quiz is designed to test your previous exposure to this topic area. To some extent the way in which content of the course is delivered will be influenced by the outcomes. Be honest, if you do not know please just say so.
1. Distinguish between a financial asset and a real asset2. Describe the risk-return trade-off faced by all investors. What other constraints
besides risk do investors face?3. What is meant by the term efficient market? Why is it significant to investors?4. What is technical analysis? What is the link between Technical Analysis and
Value Analysis?13
5. What is Fundamental Analysis? What significance has ‘Enron’ had for this technique?
6. What is meant by ‘equity risk premium’? How is it measured? 7. Define risk. How is it measured by investors?8. All equity investments are risky. Discuss.9. What sort of risk was involved in the Split Capital Investment Trusts scandal?10. Are all bonds basically the same?11. Briefly analyse Boots plc’s decision to refocus its pension fund portfolio.12. What is duration?13. What role does duration play in the concept of immunisation?14. How does duration differ from time to maturity? What does duration tell you?15. What is a rights issue? How do you decide whether or not to subscribe?16. Why might the yields quoted by Unit Trusts be misleading?17. Give an example of a ‘guaranteed product’ that went wrong.18. What is the difference between an Investment Trust and a Unit Trust?19. What is OEIC?20. What is meant by ‘Zero’? When might this be relevant when considering
investments?21. What are FTSE and FT All Share used for?22. Distinguish between liquidity and marketability.23. Why can you not necessarily trust the ‘experts’ when choosing shares to
buy/sell?24. What is meant by Asset Class’? Give examples.
You may find the list on the next two pages useful in completing this exercise.
14

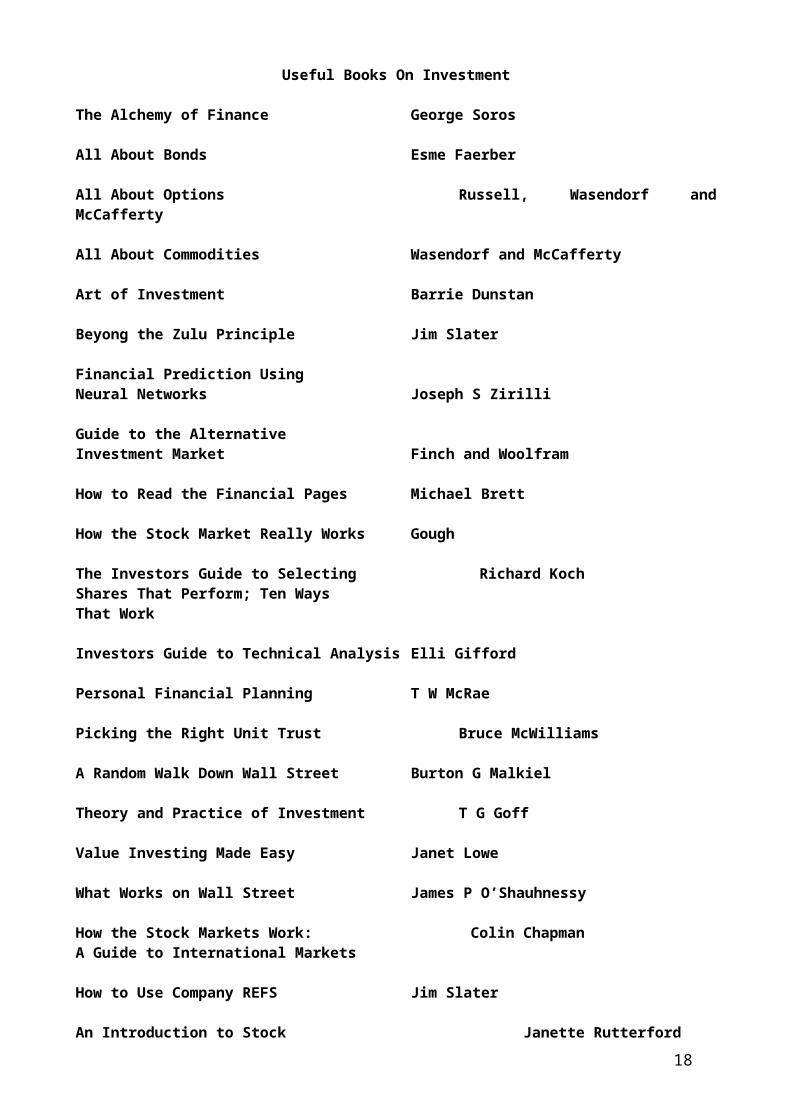
Useful Books On Investment
The Alchemy of Finance George Soros
All About Bonds Esme Faerber
All About Options Russell, Wasendorf and McCafferty
All About Commodities Wasendorf and McCafferty
Art of Investment Barrie Dunstan
Beyong the Zulu Principle Jim Slater
Financial Prediction UsingNeural Networks Joseph S Zirilli
Guide to the AlternativeInvestment Market Finch and Woolfram
How to Read the Financial Pages Michael Brett
How the Stock Market Really Works Gough
The Investors Guide to Selecting Richard KochShares That Perform; Ten WaysThat Work
Investors Guide to Technical Analysis Elli Gifford
Personal Financial Planning T W McRae
Picking the Right Unit Trust Bruce McWilliams
A Random Walk Down Wall Street Burton G Malkiel
Theory and Practice of Investment T G Goff
Value Investing Made Easy Janet Lowe
What Works on Wall Street James P O’Shauhnessy
How the Stock Markets Work: Colin ChapmanA Guide to International Markets
How to Use Company REFS Jim Slater
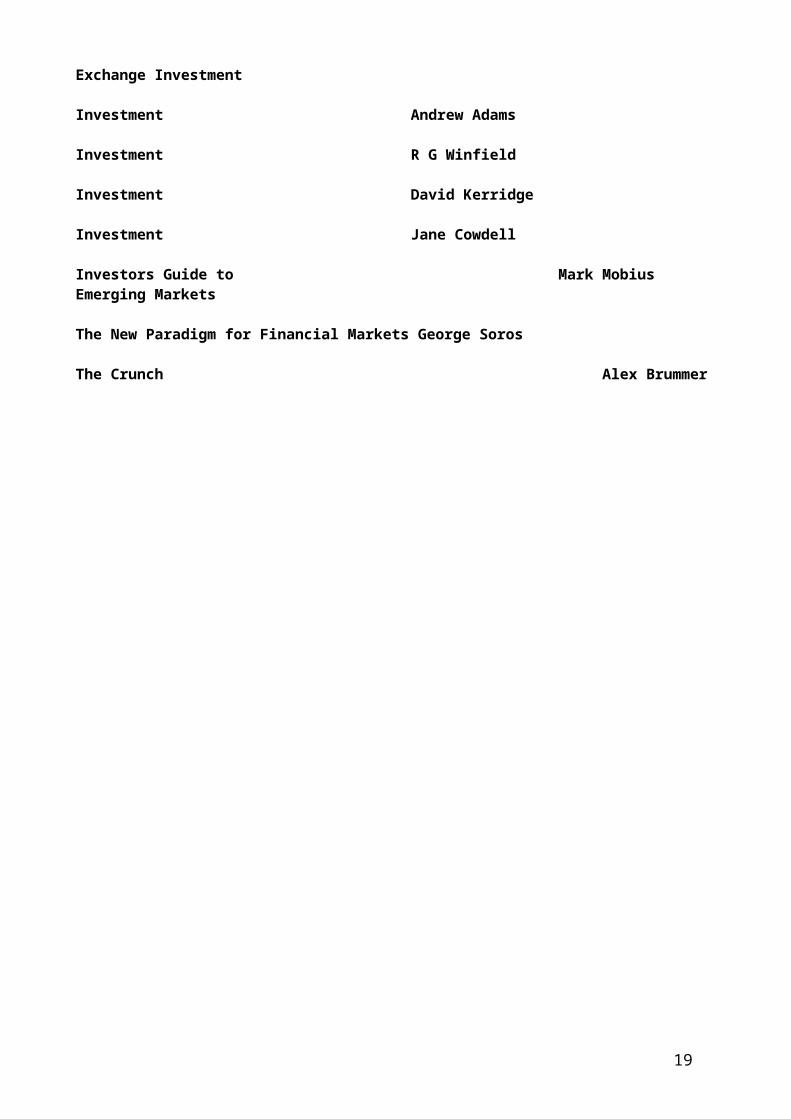
An Introduction to Stock Janette Rutterford Exchange Investment
Investment Andrew Adams
Investment R G Winfield
Investment David Kerridge
Investment Jane Cowdell15
Investors Guide to Mark MobiusEmerging Markets
The New Paradigm for Financial Markets George Soros
The Crunch Alex Brummer
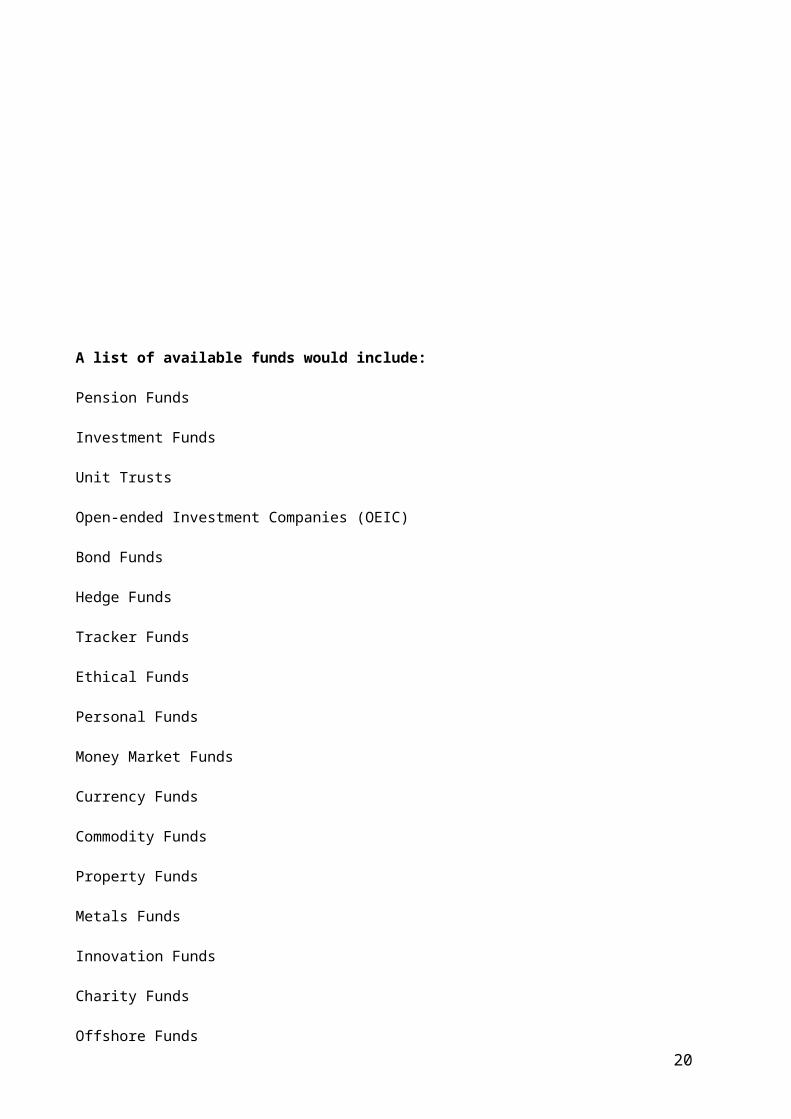
A list of available funds would include:
Pension Funds
16

Investment Funds
Unit Trusts
Open-ended Investment Companies (OEIC)
Bond Funds
Hedge Funds
Tracker Funds
Ethical Funds
Personal Funds
Money Market Funds
Currency Funds
Commodity Funds
Property Funds
Metals Funds
Innovation Funds
Charity Funds
Offshore Funds
Split Capital Trusts
Exchange Traded Funds
Venture Capital Trusts
Insurance Funds
Friendly Societies
Annuities
International Funds
Enterprise Initiative Funds
Links with other Modules
The following topics:
Shareholder Value Analysis 17
Efficient Market Hypothesis Capital Asset Pricing Model
Are not specifically part of this module. However an outline understanding of them will definitely aid your study and understanding of investment and fund management. Please study the notes on the following pages and ask any questions you may have on their content at the next seminar.
SHAREHOLDER VALUE ANALYSIS
Shareholder value analysis (SVA) is basically a novel way of linking the Net Present Value approach to Strategic Planning. It focuses on how a business can plan and manage its activities to increase value for shareholders and, at the same time, benefit other stakeholders. A number of large organisations have embraced SVA because it provides a way of linking management decisions and strategies to enhancing the value of the entity.
18
SVA is basically the net present value of future free cash flows. The simplest definition of free cash flow is:
Net operating profit after tax + depreciation – capital investmentRequirements – investment in additional working capital requirements
It is argued that the real benefit of SVA is that it encourages organisations to focus on value creating activities. Managers are expected to focus on value drivers i.e. the factors which are thought to have the most influence on shareholder value. Opinions may differ as to just what these value drivers are but they typically include:
Sales Growth Profit Margins Capital investment and acquisitions Working capital management cost of capital (i.e. cost of funds) Taxes (and their impact on investment decisions etc)
It is suggested that one of the other benefits of SVA is that it may encouragemanagement to focus more on long term aspects of operations and to see how shortterm profit related activities (e.g. padding the budget) may in fact destroy value.
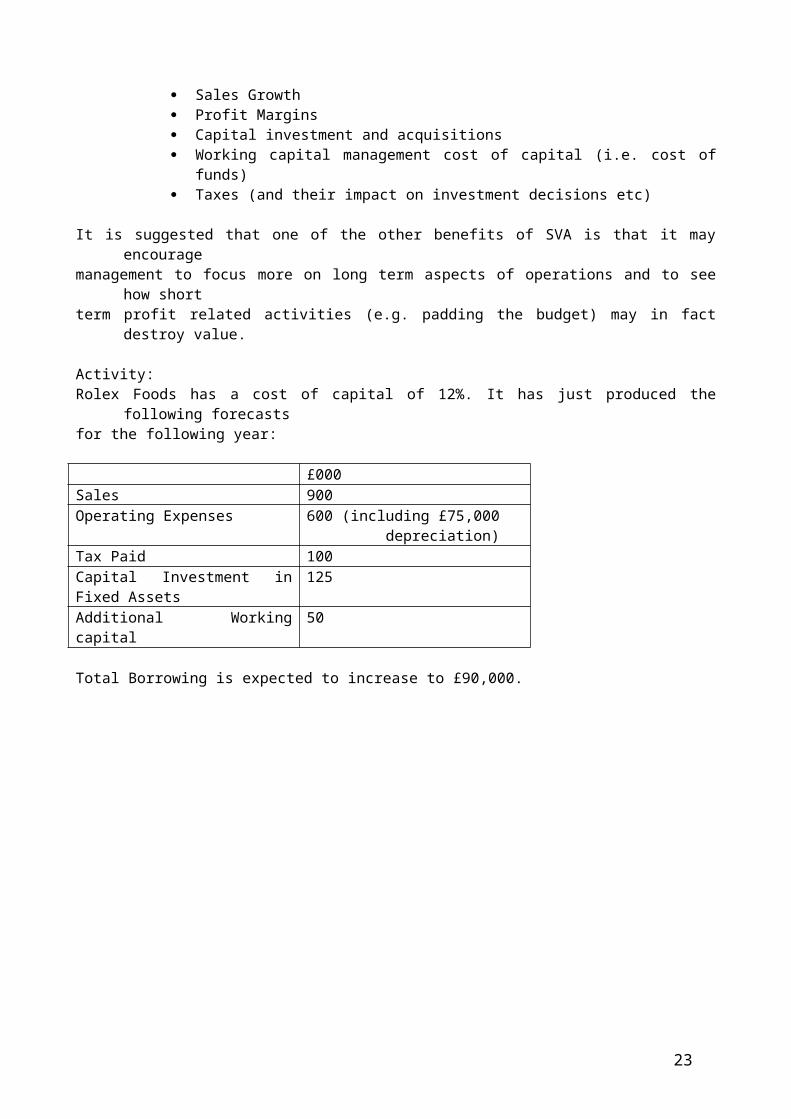
Activity:Rolex Foods has a cost of capital of 12%. It has just produced the following forecastsfor the following year:
£000Sales 900Operating Expenses 600 (including £75,000
depreciation)Tax Paid 100Capital Investment in Fixed Assets
125
Additional Working capital 50 Total Borrowing is expected to increase to £90,000.
19
The company expects free cash flow to increase at 50% per annum for the next four years (after the one above) and then to level out and remain fairly constant for the foreseeable future.
Calculate shareholder value. What use is the figure produced?
ECONOMIC VALUE ADDED (EVA)
EVA is a technique closely related to SVA. It is basically residual income after charging for the use of assets. It attempts to measure economic profit as follows:
EVA = Net Operating Profit after TaxLess
(book value of net assets x cost of capital)
Activity:
Two companies A and B have both got capital employed of £100 million and a cost of capital of 15%. Company A made an after tax profit of £20 million last year and Company B £10 million
Calculate the EVA for each company.
20
EFFICIENT MARKET HYPOTHESIS
Investment Strategies:
1. ‘Fair return for risk strategy’:- the strategy suggested by Portfolio Theory and CAPM;- the individual risk and return characteristics of each investment are matched to
the profile of an investor’s portfolio;- only possible to beat the market if extra risk taken (CAPM);- prices of investments already incorporate market expectations regarding price
sensitive information.
2. ‘Picking winners’:- possible to beat the market without taking extra risk;- the assumption that some investments, allowing for their relative risk, will offer
higher returns than others;- Investors who follow this strategy must assume that they know something
about these investments that either the market does not yet know or has not yet incorporated into the price.
Efficient Markets:
- if markets are efficient then trying to pick winners will be a waste of time;- this is because in an efficient market the prices of investments will reflect the
best estimate of their expected return and risk taking into account all that is known about them;
- there will be no undervalued investments offering higher than expected returns given their risk;
- excess returns will not be possible – this means consistent (over a number of years) returns above those in the CAPM, given the level of risk involved.
Random Walk Theory:
- argues that there are no trends in investment prices;- tomorrow’s price cannot be predicted by looking at today’s price change;- one difference to note between share prices and commodities, for example, is
that in so far as shares have positive expected return share prices will exhibit an upward trend;
- however Random Walk Theory is a much misunderstood concept which does NOT mean:
i) investment analysis is a waste of time;ii) no one can ever beat the market;iii) share prices are determined by chance.
Efficient Market Hypothesis:
- basically an attempt to explain why investments follow a random walk;- in a perfectly efficient market information is freely and instantly available to all;- thus each investment will be ‘correctly’ valued in that all information will be
fully absorbed into its price;- whilst in practice perfectly efficient markets do not exist it would appear that,
from evidence available, markets do appear to be relatively efficient at reflecting new information in prices;
- the real question is how efficient the markets are;- Fama (1970) defined three different levels of efficiency:
21
1. Weak Form:- each share price assumed to reflect fully the informational content of all past share prices
2. Semi-Strong Form:- each share price assumed to reflect also all publicly available information
relevant to share prices
E.g. Company announcementsBrokers’ reportsIndustry forecastsCompany accounts
3. Strong Form:- each share price also fully reflects all known information whether publicly
available or notE.g. insider information
The EMH does not claim that investors will never beat the market and will never make large profits. What it does say is that over a period of time above average or excess returns will not be earned. Evidence available in general supports both the Weak and the Semi-Strong forms but not the Strong form.
Implications of the EMH for Investors:
Technical Analysis – even in its weak form the EMH casts severe doubts over the use of Chartism and Mechanical Rules
Fundamental Analysis – in its semi-strong form the EMH questions the time spent by Investment Analysts;- there is a persuasive argument however that markets would not
be as efficient without them;- they should however switch emphasis from straight picking
winners to constructing portfolios for investors which take into account their risk-return preferences.
THE CAPITAL ASSET PRICING MODEL
Originally developed as an alternative approach to portfolio management, the CAPM can also be used to calculate cost of capital. It can be used in two different ways:
22
a) To calculate the equity cost of capital of a company which can then be incorporated into the calculation for the company's weighted average cost of capital.
b) To calculate the required rate of return for individual projects taking into account their specific risk profiles.
Systematic and Unsystematic Risk:
The concept that the risk associated with any particular investment can be subdivided into two types is fundamental to the CAPM.
Systematic (market) Risk is that part of total risk stemming from those changes in the general political and economic climate which, more or less, affect all investments.
Unsystematic (specific) risk is that part of total risk caused by factors that do not affect all investments and may affect just one investment (eg incorrect decisions made by a company's management).
It is well accepted that the effect of unsystematic risk can be virtually eliminated by the development of a sensibly 'diversified' portfolio (Markowitz's Efficient Diversification).
Given that investors do diversify effectively; all that remains to concern them, therefore, is systematic risk and this is what the CAPM deals with.
The underlying rationale of the CAPM:
Given a market where efficient diversification is the rule, investors are basically concerned with systematic risk. Unfortunately different investments differ with regard to the amount of systematic risk they carry. For example a firm manufacturing consumer durables is more likely to be affected by an economic downturn than, say, a firm producing staple food items. Consequently, the systematic variability of the former's shares is likely to be greater than that of the latter.
The most widely used index of systematic risk is the BETA COEFFICIENT. This is simply the slope coefficient of a linear regression of the investment's return on the market's return for a representative number of periods.
Investments with Beta factors of less than 1 have very low systematic variability and thus tend to lower the risk of fully diversified portfolios. Investments with Beta factors of more than one become progressively less attractive for inclusion in a portfolio based on risk alone.
Since investors are assumed to make their decisions on the basis of two factors (expected return and systematic risk), it therefore follows from the CAPM that the following should hold for individual investments:
E(Ri) = Rf + B(Rm - Rf)
where E(Ri) = expected return on investment Rf = risk free rate of return Rm = market rate of return
23
B = Beta factor of i
The Calculation of the Beta Factor:
The London Business School publishes a quarterly Risk Measurement Service containing the betas of most UK companies. They are calculated using a standard least squares regression programme using the monthly returns for each security over the previous five years.
What the above, in effect, does is to compare the standard deviation of market returns with the standard deviation of the returns of an individual security. It is possible, therefore, to approximate a beta factor for a security (or portfolio) if you are given the required standard deviations.
Thus Beta* = Standard Deviation of Security Standard Deviation of market return
*assuming an efficient market and thus a correlation coefficient of 1.
Where the correlation coefficient is different from one then the formula becomes:
Beta = Correlation Coefficient x Standard Deviation of Security Standard Deviation of Market
For examination purposes an alternative formula, derived from the one above, is oftenuseful:
Beta = Covariance of security returns with market returns Variance of market returns
24
Session 2
The Investment Environment
THE INVESTMENT ENVIRONMENT
What is Investment?
There are several ways of answering the above question. The first might be to distinguish between Real Investments and Financial Investments:
Purchase of one’s own home Rare stamps or coins Antiques Gold (in some forms) Paintings Jewellery Wine
25
Furniture Chinese ceramics English and continental silver Property Carpets and rugs
As interesting as they are these are not the subjects of this module because of their highly specialised nature. Financial Investments include:
Equities Loan Stocks Gilts National Savings Investments Unit Trusts (at least 20 different kinds) Investment Trusts Insurance Policies (some) Pension Plans Property Bonds Managed Bonds Warrants Convertibles (debentures and preference shares) Foreign bonds and equities Offshore deposits Futures and options Cumulative convertible redeemable preference shares Guaranteed Income and Growth Bonds
These are the subjects of this module and some will be covered in more detail later.
Another way of answering the question – ‘what is investment’ is to examine it from the point of view of its purpose. Investment by the individual can be regarded as more considered and more specific than just savings. The investor aims generally to achieve one, or both, of the following:
A specific regular income or growing income Medium to long term capital growth
However it must be said that the distinction between investment and saving can be extremely blurred at times.
Yet another way of looking at the question ‘what is investment’ is to consider how it differs from Saving, Speculation and Gambling.
26
Group Discussion:
(a) Can you briefly differentiate between saving, investment, speculation and gambling.
(b) Why do you think the distinctions in (a) might be important?
(c) What do you think might be the common theme linking all four in (a)?
(d) What is the significance of (c ) to an investment adviser?
(e) In which category from (a) would you place Premium Savings
Risk and Return
An investor can obtain two different kinds of return from an investment in a financial security:
Return from price appreciation (or losses from price depreciation) – commonly called capital gains (losses)
Return from dividends or interest payments
Therefore return for any period can be expressed as:
Return = Price Change + Cash Inflow (if any) x 100 Price at beginning of the period
However every investment involves uncertainties that makes its future investment returns risky. Sources of uncertainty include:
Interest Rate Risk
If interest rates rise then investment market prices will fall, and vice versa.
Inflation Rate Risk
Inflation reduces the real rate of return on investments. (It is often claimed that equities provide a hedge against inflation because assets and incomes should be able to keep pace with
inflation. However evidence does not seem to support this view). Bull-Bear Market Risk
Bull markets indicate periods of sustained security price increases and Bear markets the reverse. (In the past Bear markets have lasted for up to 3 years (although the average is probably less than a year). They also vary greatly in
intensity (i.e. in some instances most stocks are effected; in others relatively few). In the long run, Bull markets more than
compensate for bear markets but they can still be a serious source of risk). Default Risk
This is the perceived risk that a company may go bankrupt or similar.
Liquidity Risk
This is the possibility of loss created by lack of marketability of the financial asset.
Political Risk
International political risk is most often cited but the problems can be just as real on a domestic basis e.g. changes to the tax laws.
Industry Risk
This is the variability of returns caused by association with a particular business sector. The causes may be economic, technical, marketing, social etc.
Management Risk
27
This is the variability of returns caused by the quality of management in the company, industry, country etc.
There are more but the above should serve to illustrate the complex nature of measuring risk.
Relationship of Risk and Return
Investors are risk averse i.e. they require expected returns that vary in line with the amount of perceived risk. However different investors exhibit different levels of risk aversion and it has been proved that risk aversion:
decreases with wealth;
increases with age;
is influenced by economic cycles;
is influenced by ‘thin trading’.
different investors have different perceptions of risk in relation to individual investments
This is covered by the economic principle of Utility and manifests itself in the form of ‘Risk Premiums’ demanded for riskier investments.
Measurement of RiskVariability of returns is the most accepted measure of investment risk and most of this variability tends to be caused by fluctuations in stock prices.
Standard deviation and variance are usually used to measure the degree of risk involved. However there are problems with the use of these as measures:
they assume that investment returns are normally distributed – in fact they almost always are skewed;
they are basically historical; they ignore the Fractal Dimension i.e. they only exhibit the ‘range’ of returns and
not the frequency of fluctuations.
(one way of measuring this would be to draw the movements of a stock price on a chart then measure the length of the line – the
longer the line the higher the fractal dimension and thus risk)
What is Meant by Investment Policy and Investment Strategy?
Investment policy should start with Investment Objectives. This is basically what the investment portfolio is required to achieve eg:
funds for retirement funds for charity purposes funds for major projects etc
The Investment Policy should then be driven by the individual needs/requirements of the investor(s). It will cover such things as:
appropriate risk/return profile liquidity requirements tax positioning
28
ethical constraints
The Investment Strategy is basically the means of achieving the investment objectives whilst observing the investment policies. They are largely to do with balancing risk and return. They are mostly influenced by the following factors:
Rates of interest Rates of return from alternative assets Potential for capital growth Risk of capital loss Time horizon Asset classes available
The following list illustrates some of the many Investment Strategies used by investors/fund managers:
(a) Adopt a passive (buy and hold) investment strategy. The logic here is that an investor is less likely to be affected by the ups and downs of the securities market if they hold investments for long periods. This often works but is not foolproof – for example a sudden change in circumstances may force liquidation of investments at the bottom of a bear market.
(b) Adopt an active investment strategy. Here the use of Technical and/or Fundamental Analysis is adopted either by the investor personally or by the use of ‘expert’ recommendations. Studies have been largely found against these techniques (especially Technical Analysis) but some have shown that they can have value.
(c) Invest only in investments where risk is perceived to be low e.g. bank accounts. However this will not reduce all risks and the investor would be rewarded by suitably lower returns.
(d) Try to identify under or over valued shares and invest or disinvest appropriately. One reasonably straightforward way of doing this it to use Gordon’s Growth Model.
(e) Diversify. Diversification will help to reduce risk. Portfolio Theory shows that effective diversification can be achieved with less than 15 securities if they are carefully chosen. It is necessary to choose stocks (for example) that do not display positive correlation. Ideally stocks should have perfectly negative correlated returns (i.e. when one goes up the other always goes down and by an equal amount). However this does not happen in practice, but less than perfect correlation will still help to reduce risks. The problems with this approach are:
Diversification is a problem for the small investor because dealing charges make the acquisition and trading of numerous small lots of securities uneconomic.
Choosing securities with negative correlation is not easy. Investors are often reduced to making sure that their shares come from different sectors e.g. retailers, engineering, banking etc.
(f) Diversify using Unit Trusts or Investment Trusts. This is a popular option but it does have problems:
Unit Trust charges can greatly reduce the return earned. For example Initial Charges can be as high as 6% (that is £600 on an investment of £10,000) and means that the investment must increase by 6% before the investor is back where he/she started. Add to this Annual Charges (1% +) and you can see why some unit trusts (even when held in an ISA) are often a poor alternative.
29

It is generally accepted that most (up to 90%) of Unit Trusts do not do as well as the market average.
The number of unit trusts available is huge making the choice of which to buy onerous; and the right choice is important because the gap between the best and worst performing is significant.
Investment Trusts do generally perform better than unit trusts and their charges are lower. But they are relatively less known about and understood than unit trusts, which may help to explain why their performance can be disappointing at times.
(g) Build up a portfolio using Beta Factors. Beta factors measure the systematic risk of shares by comparing the standard deviation of the returns on an individual share with the standard deviation of market returns. Beta factors can be purchased from such sources as the London Business School and are also available on Data Stream (although not as up to date). This, in theory, allows an investor to build a portfolio with a level of risk and return suitable to their circumstances. Whilst tests show that returns do relate to Beta’s they also show that returns also relate to other things as well. Nevertheless there is evidence that a portfolio with a high weighted average beta will often give higher than average returns.
(h) Make use of System Trading for management of investments. There are numerous systems used for investment. One important group of these is known as Filter Methods. Share price movements can be identified as follows:
Tertiary – smallish movements without any long run significance. Secondary – more significant movements but still not having any long run
significance. Primary – the primary movements have long run significance and in fact
contribute to the long-term trend.
Filter methods attempt to filter out secondary and tertiary movements and identify the trend. One simple example of a filter method is the Hatch System.
(i) Make use of International Diversification. International investments can have their problems but it does seem to be generally accepted now that the benefits far outweigh any problems. In fact it has been said that you need excuses not to invest internationally nowadays. There are several ways of introducing an international element to your portfolio:
Buy overseas stocks quoted on the domestic Stock Exchange (there are often a lot).
Invest in UK stocks with a high level of overseas exposure. Invest in a Unit Trust with specialist international funds. Invest in appropriate Investment Trusts. (IT’s are major overseas investors
with a long and acknowledged track record).
(j) Invest in one of the many ‘Guaranteed Return’ products. These give you some sort of guarantee in relation to Stock Market Returns – for example some guarantee a certain percentage of any increase in a particular index. The guarantee does not come free however and the cost may take the form of tying your investments up for long periods with heavy penalties for early withdrawal.
(k) Invest in a Tracker Fund. These funds are designed to track particular index’s (e.g. FTSE, FT All-Share, Dow Jones, S & P etc). They do it by either buying every stock in the index – in which case they track the chosen index perfectly – or they attempt to replicate the index by the use of futures and options or some
30

sort of statistical methods. They tend to have lower charges than conventional unit trusts – for example most do not have any Initial Charge and Annual Charges seem to be generally lower.
Sessions 3 and 4
Diversification and
Portfolio Analysis
31
What are the main aspects to be taken into account when planning a portfolio?
There are three main elements:
Diversification Risk Timing
Diversification
A portfolio must be balanced to guard against failure in any one specific area. Therefore a portfolio should be well diversified and contain elements of:
Liquidity- To provide accessibility of funds for essential/unexpected commitments.
Fixed-interest Holdings- To provide stability in the form of a guaranteed income (plus capital growth)
Equity Holdings- to provide growth of capital and income
Risk
The liquidity and fixed interest elements of the portfolio are specifically subject to interest rate risk (interest rates rise and you cannot benefit from them) and inflation risk. The equity holding mitigates against these risks but also introduces other risks. These risks, poor performance and corporate collapse, can be reduced however by diversification. Research points to the conclusion that investing in 15 different shares in different sectors minimises risk effectively (for cost effectiveness a minimum of £2,000 per share is recommended, otherwise the share has to increase too much to simply recoup dealing costs – if you do not have £30,000 to invest in shares then consider Unit or Investment Trusts).
Timing
It is often said that the secret of making money is to buy just before a market takes off and sell just before it starts to fall.
32
The timing of the investments in a portfolio can be vital. The whole sum should not be invested all at once just because it is available. The investor should wait for the right opportunities to present themselves. Whilst waiting the money should be placed where it earns a good rate of interest but still remains readily accessible.
How do you decide how much of your portfolio to put into each element?
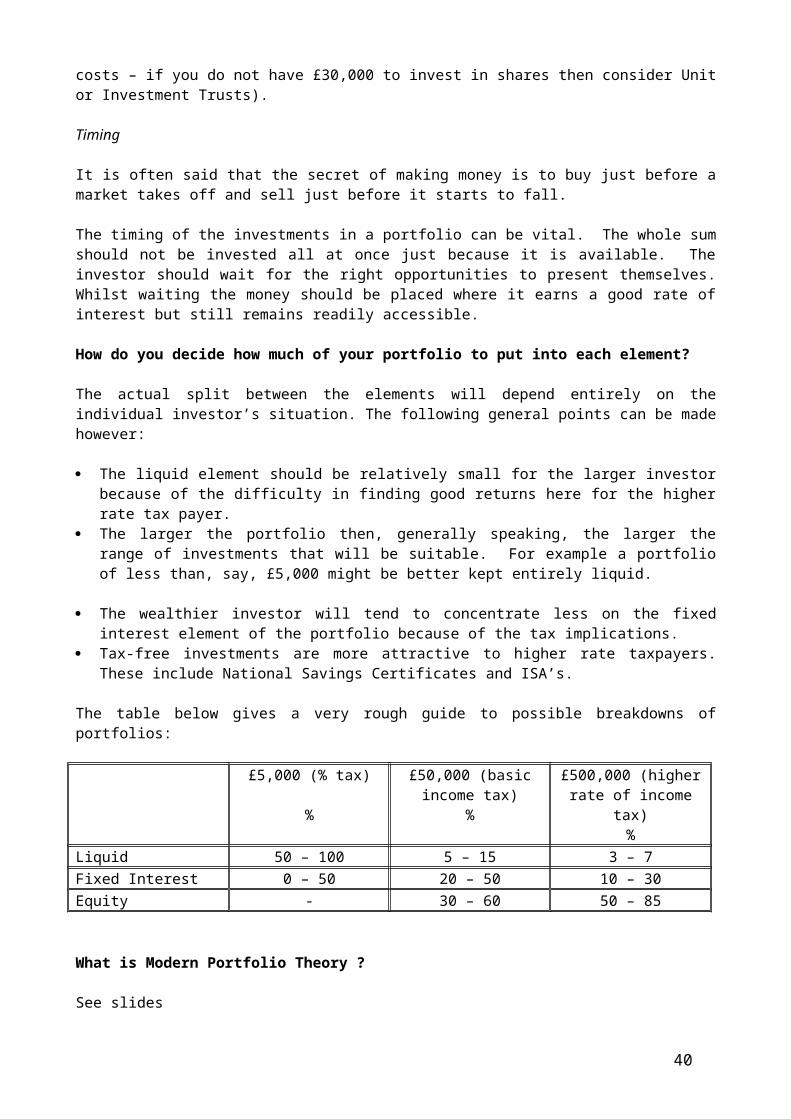
The actual split between the elements will depend entirely on the individual investor’s situation. The following general points can be made however:
The liquid element should be relatively small for the larger investor because of the difficulty in finding good returns here for the higher rate tax payer.
The larger the portfolio then, generally speaking, the larger the range of investments that will be suitable. For example a portfolio of less than, say, £5,000 might be better kept entirely liquid.
The wealthier investor will tend to concentrate less on the fixed interest element of the portfolio because of the tax implications.
Tax-free investments are more attractive to higher rate taxpayers. These include National Savings Certificates and ISA’s.
The table below gives a very rough guide to possible breakdowns of portfolios:
£5,000 (% tax)
%
£50,000 (basic income tax)
%
£500,000 (higher rate of income tax)
%Liquid 50 – 100 5 – 15 3 – 7Fixed Interest 0 – 50 20 – 50 10 – 30Equity - 30 – 60 50 – 85
What is Modern Portfolio Theory ?
See slides
Group Exercise
Discuss the theoretical and practical criticisms of MV Optimisation Models and produce a short report on the following:
a) To what extent the criticisms are justifiedb) Suggestions for possible solutions
33
Session 5
Portfolio Management
Strategic Asset Allocation
34
Having drawn up an overall financial plan which should cover:
How much money will be available to invest and when How much income will be required from the investments and when Where the investor is placed upon the risk/return scale
It is then necessary to decide how funds will be divided amongst the four asset classes and overseas investments:
Cash Bonds Property Shares Overseas investments
This is almost certainly the most important factor affecting portfolio performance. A recent American study showed that asset allocation alone accounted for most of the differences in performance as follows:
Asset allocation – 92% Stock Selection – 5% Timing – 2% Other – 1%
Finding the best mix of assets involves three key variables:
Risk Return Correlation
It is not just a matter of spreading the money around. In order to get the optimum portfolio providing the maximum return for the risk taken, asset classes must be chosen carefully. It is possible to choose a mix that will increase return without necessarily increasing risk – in other words to move the portfolio nearer to the efficient frontier.
There are two basic approaches to Strategic Asset Allocation:
Technical Approach
Initiative Approach
Technical Approach
This approach makes use of a computer and involves the following steps:
35
Establish historical benchmarks for risk, return and correlation for the range of investment options selected.
Establish as far as possible why the above happened – was inflation a factor? What about interest rates?
Attempt to establish a forecast of the expected relationships taking into account the future economic outlook. This process will mainly involve risk and return. Correlations tend to remain fairly stable.
Run an asset allocation model using suitable software.
Adjustments should be made if tax is a consideration.
Adjustments should also be made for special considerations e.g. requirements to keep a certain level of cash with overseas investments.
Initiative Approach
This is basically a common sense version of the computer-based approach. It takes into account the key characteristics of each asset class and of overseas investment:
Cash
- The safest asset class- Lowest returns- Low correlations with other asset classes- Tax ineffective for high earners.
Bonds
- Low to medium risk- Low correlations with cash- Fairly low correlations with shares and property.- Tax ineffective for high earners.
Property
- Medium to high risk- Low correlations with cash- Fairly low correlations with bonds- Moderate correlations with shares.- Returns highly susceptible to cycles.
Shares
- High risk- High returns in the long term- Short and medium term volatility
Overseas Investment
- Potentially high risk- Lack of correlation makes them very effective for diversification providing
moderate exposure.- Require special analysis of tax, risk, correlation, currency and political
factors.36
The overall approach recommended is to apply the characteristics of each asset class to the three main criteria of the investor profile:
Risk- The risk averse investor will put a larger proportion of their funds into
cash and bonds.- Those investors who are able to take on more risk will tend to put a larger
proportion of their funds into property, shares and overseas investments.- The medium risk investor will have a reasonable amount in each asset
class.
Tax - High earners will avoid tax ineffective asset classes.- Non-tax payers should avoid tax-free investments.
Time Horizon- Investors who wish to invest for the long term will find property and
shares relatively safe.- Short-term investors will tend to favour a less volatile portfolio containing
more cash and bonds.
Having decided the Strategic Asset Allocation it is then necessary to diversify at all rungs of the risk ladder:
Industry risk Firm specific risk Country risk
This can be achieved by using:
Tactical Asset Allocation
This is basically responding to current and forecast market conditions. The best way of achieving this without taking too many risks is to set a tactical allocation a few percentage points either side of the strategic allocations. The reason for keeping the allocation ranges fairly narrow is to avoid straying too far from the overall plan and thus endangering the achievement of the objectives.
Sub-sector Allocation
This involves selecting the appropriate sub-sectors within each class. The safest approach is to choose a representative range from each class but it might be sensible to be slightly ‘overweight’ in those sub-sectors thought to have better prospects.
Investment and Vehicle Selection
This basically involves the choice of investment medium – for example investment in shares can be carried out by investing in individual shares or by use of collective investments. Investment in property can be through insurance funds, property funds or directly. The choice will depend upon investment philosophy and funds available.
37

Active versus Passive Investment Strategies
Passive Portfolio Management
Passive portfolio management attempts to maintain an appropriate risk-return balance given market opportunities. Rather than attempting to ‘beat the market’ it accepts market prices of securities as correct. It accepts the principle of the Efficient Market Hypothesis. It tends to conform to the following:
Long-term buy-and-hold strategies. Index tracking Matching market performance Performance tracked against benchmark portfolios.
Active Portfolio Management
Active Portfolio Management attempts to outperform a passive benchmark portfolio by the use of superior insight or information. It tends to conform to the following:
Fundamental Analysis Technical Analysis Market Timing Value Analysis
Market Timing
“Someone can always tell you what you should have bought or sold in the past. No one, however, can guarantee you a successful portfolio for next year or any other specified period of time because no one can consistently forecast what will happen in the financial markets, including the professionals who are paid to make recommendations. Unanticipated events will affect the financial markets. Although the future is uncertain, it is manageable, and a thorough understanding of the basic principles of investing will allow investors to cope intelligently” (CP Jones, Investments, 2007, p13).
“No one on Wall Street has ever figured out how to time stocks’ swings perfectly. Most people, in fact, fail miserably at timing.” (Tom Petruno, LA Times: 4/9/97)
Market timers attempt to beat the market by use of the following types of approaches:
Technical Analysis Economic Indicators Specialised composite indexes
Group Discussion:
What do you consider to be the comparative advantages and disadvantages of Active and Passive investment strategies?
Is it always necessary to adopt one or the other strategy?
Security Analysis and Allocation
According to the Efficient Market Hypothesis it is not possible to find under or over valued shares except in unusual situations i.e. the so-called ‘anomalies’. Given a perfect market securities will always be valued at their true value.
38
However there is a lot of empirical evidence that seems to call the EMH into doubt. In fact there is a school of thought that suggests security prices are usually wrong; and that investors able to spot the mistakes can ‘beat the market’. The EMH suggests that the only way to earn higher than average returns is to take on higher than average risk. There are those that claim that it is in fact possible to earn higher returns and take on less risk.
Unfortunately most of the evidence seems to come from the USA but there is no reason to believe that the examples could not be replicated in the UK.
Walter Schloss (Tweety Browne) has outpaced the S&P 500 for the last 39 years. The funds he has managed have averaged a return of over 20% over that time compared with 10% on the S&P 500. Also whilst the S&P 500 has finished in the red nine times during the 39 years Walter Schloss has only lost money on six occasions.
Warren Buffett has an even more sparkling performance to show. Between 1965 and 1982 (when the S&P 500 averaged annual returns of 7%) he averaged 28%. Between 1983 and 1994 (when the S&P 500 averaged 14% per annum) he averaged 31%.
Charles Munger, Peter Lynch, John Neff, William Ruane, Benjamin Graham – all household names in the USA are just a few of the many examples of fund managers who have consistently ‘beaten the market’.
George Soros is another major investor who does not subscribe to the EMH. He contends that market values are always distorted. He also argues that share prices, far from being merely passive reflections of underlying values, are active ingredients in the process by which both share prices and the fortunes of the company are determined.
David Dreman (Investment Advisor and Author) quotes an investor who had been burned by the 86% fall in the value of Disney between 1972 and 1974. ‘When was the market efficient? When it took Disney up to $119 or when it put it back to $16?’
The general terms given to the non-EMH type of investors are Value Investors.
Who is right? EMH followers or ‘Value Investors?’
One way of looking at this problem might be to suggest that they are both right. Jack Clark Francis considers that security prices can be viewed as ‘a series of random fluctuations around their intrinsic value’. He illustrates this by considering two hypothetical groups of traders: Liquidity Traders and Information Traders.
Liquidity Traders have only limited access to relevant information and may not be able to interpret it properly. Their investment decisions are driven more by availability and need for funds (i.e. they invest when they happen to have a surplus and sell when they need the cash). They often make their decisions on whims or ‘hot tips’.
Information Traders on the other hand have access to much better information and know how to interpret it properly. They will buy and sell when they recognise deviations from intrinsic value and so force the market price into line with the intrinsic price.
It is thus agreed that the unsophisticated liquidity trader is responsible for the aimless price fluctuations observed in all shares and the information traders responsible for the fact that market prices at least meander around their true intrinsic value. This phenomenon was called the ‘intrinsic-value random-walk market’ by Professor Fama. The process is called a ‘random walk within reflecting barriers’ by mathematical statisticians.
39
This does not mean that any particular share will always keep the same intrinsic value – for some firms this may change on quite a regular basis. However it is the way in which investors react to these changes that may contribute yet another distortion to the so-called ‘perfect stock market’. Mark Johnson calls this the Overreaction Hypothesis. This argues that the prices of shares may well reflect the expectations of investors but ‘what if those expectations are wrong in some consistent (i.e. non-random manner). If so the market will not be perfectly efficient (returns will be related to more than just risk), and we ought to be able to formulate strategies to out-perform simple buy and hold strategies’. The evidence for this assertion comes from the psychological theories that hold that the human mind may have problems of sorting and filtering information, which will often lead to significant distortions in perceptions.
George Soros goes even further than this to maintain that:
Markets are always biased in one direction or another. Markets can influence the events that they anticipate. This point is in reaction to the assertion that markets always seem to be right.
Fundamental Analysis Methods
Shown below are some of the more common methods of share valuation:
1. Fixed interest securities
Most debentures and loan stocks are redeemable and thus their value is based upon the present value of future interest payments plus the present value of the redemption payment.
If a debenture or loan stock was irredeemable then its value can be calculated from:
Coupon Rate of Stock x nominal value Rate of Return Required
This is the same as the valuation of a perpetuity and can thus be used on those securities with a long time to redemption.
Variable rate securities are valued on a similar basis to shares (see below).
2. Shares
(i) Dividend Valuation Model
This is based upon the present value of a future stream of dividends allowing for dividend growth:
Po = D1 i-g Where Po = share price
D1 = next dividend i = market capitalisation rate g = dividend growth rate
(ii) Earnings Valuation Model
Po = P/E ratio x Earnings per share
Problems:40

How do you choose a representative P/E ratio?
Which earnings per share do you use?- Last years?- Next years?- Normalised?
Cash Flow Model
Use projected cash-flows discounted at a suitable cost of capital. Theoretically the soundest method but has obvious practical limitations – not least the forecasting of cash flows and the determination of a realistic cost of capital.
Capitalisation of Earnings Approach
Po = Maintainable Earnings per ShareExpected Rate of Return
Both denominator and numerator difficult to estimate.
Net Asset Basis
Po = Realisable Value of Assets – LiabilitiesNumber of Shares in Issue
Problems:
Valuation of Assets
Takes no account of future profits
Super Profits Approach
Po = Super Profits per Share x Suitable Multiplier + Net Asset Value
Problem is that this is a negotiated figure and as a result very arbitrary.
Capital Asset Pricing Model
This requires the determination of a realistic beta coefficient for the company – possibly by comparison with other similar firms. The standard CAPM formula is used to calculate the cost of capital (required return) which is then used in the Dividend Growth Model to produce a share price valuation.
Technical Analysis
This approach is usually used for valuing shares and is based upon a, sort of, behavioural approach. It makes use of charts (hence it is often called Charting) and weight of selling (or buying) to predict share price movements. The dedicated chartist makes use of moving averages and ‘patterns’ to value shares. It may sound crude and arbitrary but it is in fact a highly developed process requiring a lot of skill. There is also no evidence to show that it is more or less accurate than fundamental analysis.
Examples of ‘Value Investment’ Strategies
(a) Low P/E Strategy
41

Numerous studies have shown that shares with low price/earnings ratios tend to significantly outperform shares with high price/earnings ratios. One such study carried out by Sanjoy Basu over a fourteen year period came up with the following results:
Average P/E Average annual rate of return %
Average Beta
30 9.5 1.0619 9.3 1.0415 11.7 0.9713 13.6 0.9410 16.3 0.99
The study covered about 500 different shares and you will notice that the higher returns were earned by the lower p/e shares in spite of their lower risk ratings. The study did ignore dealing costs which would tend to be higher for the actively managed portfolio following the strategy – but even after such there is still a significant difference in the returns.
So what is the reason for this strategy working? According to Mark Johnson, whilst in a perfect world the p/e should embody the combined considered judgement of the financial community, we are not living in a perfect world. ‘In a less ideal world the p/e might be largely a measure of popularity’. He also identifies two sources of error in calculation of the p/e:
Simply error – even small differences in growth projections can cause dramatic differences in valuation when using the dividend discount model for example.
The psychological factor – we tend to exaggerate what we perceive as trends (Warren Buffett for example is an acknowledged master of exploiting the overreaction of the market).
(b) Market to Book Value Strategies
This approach was pioneered by Benjamin Graham and has stood the test of numerous empirical studies. His view was that when earnings seem to be inconsistent, unpredictable and so subjective then we ought to place greater emphasis on the balance sheet in determining share values. He developed a method of measuring a company’s Earnings Power (as he called it) from its balance sheet. Graham’s method focused on liquidation value:
Net Assets at book valueLessNon liquid assets such as land, buildings, equipment and goodwill
He then suggested that investors should purchase shares:
With market prices lower than two-thirds of the liquidation value per share Of companies with positive earnings Of companies that are paying dividends, and Hold them in a diversified portfolio
Various studies have shown returns well in excess of double (sometimes treble) the market returns. The beta factor of these ‘bargain issues’ as they are called does tend to be higher than the market average but not high enough to explain the differences in returns.
42
Walter Schloss favours this strategy. He prefers to consider asset values rather than earnings because he feels that accounting rules give too much room for manipulation. He generally prefers shares that are selling at one half to two thirds of book value – but admits that they are not easy to find so will occasionally go higher.
c) Price to Cash Flow Strategies
Kenneth Fisher, in his book called Super Stocks (1984), put the case for the Price/Sales Ratio. He argued that sales are a much more stable measure of a company’s growth and performance than earnings. Changes in earnings are much more volatile than changes in sales. He developed a set of P/S standards as follows:
Type of company Unpopular Shares
Accepted Shares Popular Shares
P/S Below P/S Over P/S OverSmall, growth, Technology
0.75 1.50 3.00
Large without growth
0.20 0.40 0.80
Low margin companies
0.03 0.06 0.12
Source: Fisher, 1984
Banks, securities firms, utilities and other firms whose profits are not based upon sales in the conventional sense could not be evaluated in this way.
Studies have shown that low P/S shares do outperform those with high P/S ratios and, as a strategy does seem to work at least as well as the low P/E strategy. Low p/s shares do seem to have higher betas though and probably the best way to use this measure is to find shares to avoid rather than those to purchase.
James O’Shaughnessy in “What Works on Wall Street” (McGraw-Hill, 1998) showed clearly that stocks with low price/sales ratios outperformed stocks with low P/E multiples.
So how can we explain the fact that the vast majority of fund managers under perform the market?
Possibly the strongest evidence in support of the EMH is the fact that most fund managers fail to do as well as the market. They are, after all, the professionals and do often profess themselves to be ‘value investors’. But study after study shows that most of them (more than 75% in some studies) are regularly beaten by the market.
Perhaps the answer lies in the fact that most fund managers are not actually ‘value investors’ even if they claim to be such. It is often claimed that the city institutions act more like lemmings than individuals driven by their own fundamental beliefs and analysis. It is often claimed that the fear of being seen to have missed an obvious buy or sell signal makes fund managers cautious and conformist. It is argued that on the contrary the true ‘value investor’ is a loner and somebody who goes their own way rather than following the herd.
Anomalies in the Efficient Markets Hypothesis
Many researchers have discovered anomalies in the EMH. Some of these include:
Low-Priced Stocks
43
Low priced stocks seem to out perform higher priced stock
Price-Earnings Ratio Effect
Shares with low P/E ratios tend to out perform shares with higher P/E’s.
January Effect
There is often a marked increase in share prices during January
Within-the-month Effects
Stock prices often tend to rise during the first part of the month – then level out until the end of the month – when they start to rise again.
Sales:Price Effect
It has been shown that the sales per share divided by the share price is a better indicator than the P/E ratio. Seems to be a flaw in the EMH because same sales could be unprofitable
Unsystematic Risk Effects
Some studies show that diversifiable risk does have a significant effect on share prices.
Agency effects
This implies that firms managed by their owners make better investments than firms that are managed by executives who are merely employees.
Effects of Earnings Surprises
This shows that abnormal price variations often occur as a result of financial information that was not anticipated.
Effects of trends in analyst’s earnings forecasts
This suggests that trends identified by analysts can effect share prices.
Effect of an earning ‘torpedo’
This suggests that share prices can sink like a torpedoed ship if worse than expected earnings are announced.
Effects of relative strength
Technical analysis suggests that some shares exhibit relative strength – that they rise faster during bull markets and/or decline slower during bear markets. Several studies have supported this.
Firm’s Size Effects
Small firms tend to earn better rates than larger ones
44
Effect of Neglect
Less popular stocks tend to perform better than well researched stocks.
Day of the week and time of the day effects
Shares tend to rise more on Fridays than on any other day of the week and have risen least often on Mondays. There are a number of times of the day effects – one involves an inordinate number of losses on Monday mornings.
Effects of the Book Value to Price Ratio
Evidence shows that shares having high book values per share relative to their share price tend to perform well. In particular when a share’s price falls below its book value then the share is judged to be a good buy.
Discussion Point:
Why, in spite of all the above anomalies, might the personal investor still be advised to follow the doctrine of the EMH?
Session 6
Management of Bond Portfolios
45
BOND PORTFOLIO MANAGEMENT
What are Bonds?
One way to explain this is to compare them with savings accounts.
Savings Accounts BondsAction Lending Money to Bank,
Building Society etc.Lending Money to Issuer of Bonds e.g. Government, Companies, Local Authorities etc.
Return Interest Interest plus possibility of capital gain or loss
Getting your money back
Withdraw from account (a) sell bond to other investors(b) wait for issuer to ‘redeem’
the bond
Why Invest in Bonds?
There are three main reasons:
The potential for higher returns than those earned on savings accounts The potential for capital gains through:
Falls in interest rates Investing in companies on the road to financial recovery
The ability to reduce UK taxes by investing in Government Bonds (Gilts)
Bond Terminology
Coupon Rate
This is the interest rate that the issuer of the bond promises to pay the bondholder. It must distinguish from Yield, which is described below. The coupon is invariably a fixed rate but it is possible to have bonds with floating (variable) rates of interest.
Par Value
46
The par value of the bond is the face value of a bond (usually £100). It is not necessarily the price at which they may be bought or sold.
Redemption Date
This is the date when the issuer of the bond will repay the par value of the bond.
Market Value
Bonds often trade at prices above or below their par value. A bond with a par value of £100 may trade below that (at a discount) or above (at a premium).
Yield
There are two measures of yield for bonds Flat Yield and Redemption Yield.
Flat Yield (sometimes called just Interest or Running Yield) measures the actual interest earned relative to the actual market price of the bond. If the bond is at par then the Flat Yield and the Coupon Rate will be the same.
Redemption Yield takes into account the flat yield and the fact that there may be a capital gain (or loss) for the investor on redemption of the bond.
Bid price
The bid price is the price that an investor will get if selling a bond
Offer Price
The offer price is the price an investor would have to pay for a bond.
Spread
This is the difference between the bid and offer price. It is the dealer’s profit on bond deals.
What different types of Bonds are available?
There are numerous different issuers of bonds. The following are some examples:
British Government Bonds (Gilts) Local Authority Stocks Corporate Debts
- Debentures- Loan Stocks
Foreign Bonds Eurobonds
In the English language there are many words with different meanings (e.g. return). The word bond is just the same. The following are not bonds in the strictest sense of the word:
Premium Savings Bonds Guaranteed Income Bond Insurance Bonds ( e.g. Property Bonds, Managed Bonds)
47
Building Society Bond Accounts
Mainly because they are not easily tradable, if at all.
British Government Bonds
We will now use British Government Bonds (Gilts) to illustrate the mechanics of investing in Bonds.
Gilts are traded on the Stock Exchange by Gilt Edged Market Makers (GEMMs). They form a very important segment of the business carried out on the exchange as can be illustrated from the figures below:
Indicative Market Values
Gilts £713.3 Billion
Equities £138.9 Billion
Monthly Turnover
Gilts £333.3 Billion
Equities £111.9 Billion (data from London Stock Exchange 6/09)
How are Yields Calculated?
Flat Yield is simply by using the following formula:
Flat Yield = Coupon Rate Current Market Price
Redemption Yield is rather more difficult to calculate. If you have studied accountancy at all you will have come across the concept of Net Present Value and the measure known as Internal Rate of Return (IRR). The Redemption Yield is the IRR of the flow of interest payments and the final redemption payment.
What is the Significance of the Yields?
The flat yield simply informs the investor of the interest return on the stock at the current market price. It ignores the possibility of any capital gain or loss and is therefore a little limited in its use.
The better guide to overall or total return is redemption yield because it takes into account the capital gain or loss if the stock is held to redemption.
48
Exercise:
Calculate the flat yield for the Treasury 8% 2021. Compare this with the coupon rate and the redemption yield for the bond and try to explain the reasons for the differences.
There is no totally satisfactory way of calculating the overall return on a gilt if you do not intend to keep it until maturity because of the impossibility of knowing what gain or loss may be incurred. The best way to avoid the uncertainty is to try to match maturity of the stock you choose to your need for the funds.
What is it that causes the prices of gilts to change?
This happens to all bonds of course, not just gilts. It is basically because the required rate of return on the bonds changes and the only way for this to occur is by a change in the price.
The required rate of return will change for three specific reasons:
A general change in interest rates making the return on the bond look out of line (i.e. unattractive or too high).
The expectations of interest rate changes – the prices of bonds will move in the opposite direction to the expected change in interest rates.
A change in the levels of perceived risk surrounding the bonds.
Why are the Redemption Yields on Gilts all different?
Look down the third column of the extract from the Financial Times and you will see that the redemption yields exhibit a range of values. Wouldn’t you expect them to be all the same? There are at least four basic reasons for the differences:
Long-term interest rates are usually higher than short-term rates for many different reasons.
The longer a bond is from redemption the more volatile its price will be. The higher the coupon of a bond the less volatile it will be. This is an arithmetical effect known as Duration.
Low coupon bonds can be more attractive to higher rate taxpayers, which can push their prices up and hence, their yields down.
There are different conditions attached to each different gilt issue (these can be found in the Stock Exchange Official Year Book available in many libraries). For example they may be ‘callable’ before redemption which may or may not make them more attractive. Also convertibles often have different yields from non-convertibles.
The above also helps to explain the high levels of turnover in gilts. Different perceptions of changes in interest rate and levels of risk lead to a great deal of ‘switching’ between stocks.
How are yields calculated?
The Flat Yield is calculated by simply using the following formulae:
Flat Yield = Coupon Rate up x 100 Current Market Price
49
Redemption yield is calculated as follows:
Imagine you have just purchased a bond with an 8% coupon for £103 (per %) and redeemable in exactly three years. Assume interest is payable at the end of each year.
YearCash Flow
DF 6%
Present Value DF 7%
Present Value
0 (103) 1.000 (103.00) 1.000 (103.00)1 8 0.943 7.55 0.935 7.482 8 0.890 7.12 0.873 6.983 108 0.840 90.68 0.816 88.13NPV 2.35 (0.41)
Redemption Yield = 6 + 2.35 (7-6) 2.35 + 0.41
= 6.85%
What would happen if there was a change in interest rates?
If interest rates increase (or were expected to increase) then the price of the bond would fall. If interest rates fell (or were expected to fall) the price of the bond would increase. This can be illustrated as below:
Lets say that required redemption yields increase to 14% as a result of a sudden increase in inflation; then the price of the bond could change as follows:
Year Cash Flow Discount Factor 14% Present Value0 Price of Bond 1.000 Price of Bond1 8 0.877 7.022 8 0.770 6.163 108 0.675 72.90NPV Nil
Price of Bond = 72.90 + 6.16 + 7.02
= £86.08
50
Now imagine that required redemption yields fell to only 3%.
Year Cash Flow Discount Factor 3% Present Value0 Price of Bond 1.000 Price of Bond1 8 0.971 7.772 8 0.943 7.543 108 0.915 98.82NPV Nil
Price of Bond = 98.92 + 7.54 + 7.77
= £114.13
Why are the Redemption Yields not the same?
Redemption yields for different gilts are not the same in each case. You would expect long dated gilts to have higher yields than shorter dated because of the effect of the yield curve but that does not explain all the differences. All things being equal this might seem to be an unusual phenomenon – after all they all carry the same amount of risk.
One of the reasons for this phenomenon can be explained by looking at the tables below:
Years to Maturity 1 5 10 20 UndatedRedemption Yield 10% £100 £100 £100 £100 £100 12% £98 £93 £89 £85 £83 14% £96 £86 £79 £74 £71 Price Range £4 £14 £21 £26 £29 Price Range as % of original price 4% 15% 24% 31% 35%
The above table examines the result of a 2% increase and a 2% fall in redemption yields on the price of a bond with a 10% coupon and an original redemption yield of 12%. As you can see the longer dated the bond is, the more volatile its price is to changes in redemption yields.
51
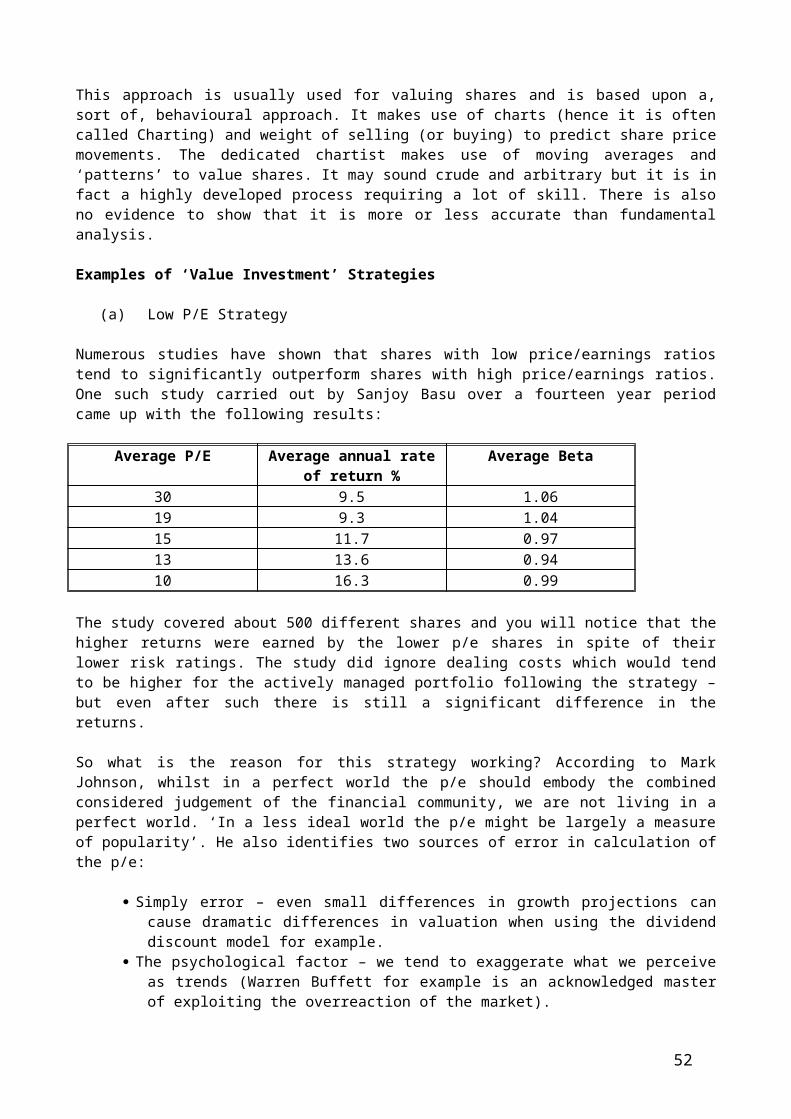
Coupon rates can also have a similar (although not as marked effect):
Coupon 5% 10% 15%
Redemption Yield 10% £69 £100 £131 12% £60 £89 £117 14% £53 £79 £105 Price Range £16 £21 £26 Price Range as % of original price 27% 24% 22%
The above assumes a 10 year maturity and shows that low coupon bonds are more volatile than higher coupon bonds.
Exercise:
What implications does the above have for the investor wishing to purchase gilts with a view to creating capital gains as a result of interest rate changes?
What is meant by Duration?
The effects of coupon and maturity on sensitivity to changes in redemption yield can be combined into one measure called DURATION.
Duration is defined as the weighted average of the length of time before each payment multiplied by the relative present value of each payment. It can easily be expressed as follows:
Duration = 1 x Present value of year 1 payment Current Price of the Bond
+ 2 x Present value of year 2 payment Current Price of the Bond
…….. + n x Present value of year n payment Current Price of the Bond
This can be illustrated using the figures for the 3 year 3% (redemption yield) bond we used before:
Year Cash Flow Discount Factor 3% Present Value0 Price of Bond 1.000 Price of Bond1 8 0.971 7.772 8 0.943 7.543 108 0.915 98.82NPV Nil
Price of Bond = 7.77 + 7.54 + 98.82
52
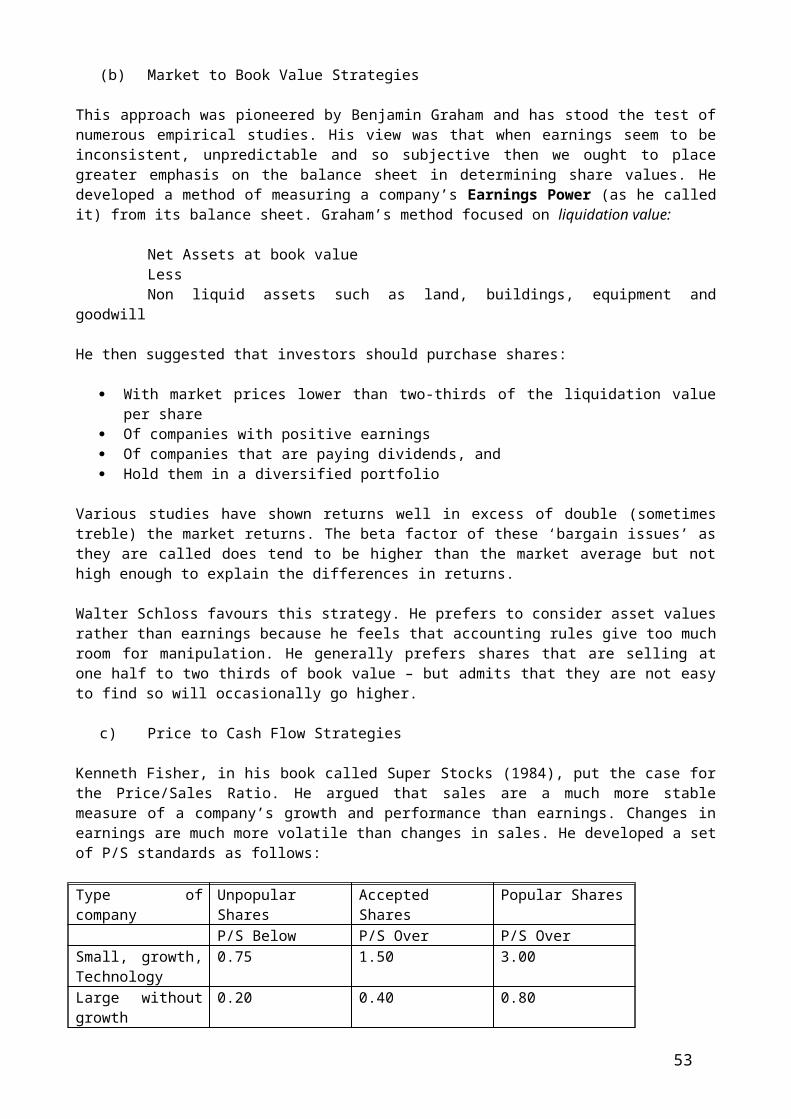
= £114.13
Duration = (1 x 7.77) + (2 x 7.54) + (3 x 98.82) 114.13
= 2.80 years
The duration will always be less than the maturity – except with a zero coupon bond where the duration and the maturity will be the same.
The above calculation of duration is known as Macauley Duration. Another way of using duration is to use Modified Duration, which we look at below.
What does the figure for duration signify?
The 2.8 years calculated above is the point at which the gain in the price of the bond exactly matches the loss in reinvestment income as a result of interest rates falling. Duration strategy can be used so as to achieve Bond Portfolio Immunisation, which basically means the construction of a bond portfolio to generate a known amount of cash at a specific point in time.
What is Duration?
Duration can be used to measure the sensitivity of bond prices to changes in required redemption yields. It is the weighted average maturity of a bond’s cash flow on a present value basis. The formula is:
Σ Present value of cash flow in year t x t Market Price
In order to use duration to estimate the volatility of bond prices we first need to calculate Modified Duration. This is the duration of a bond divided by one plus its redemption yield. The formula is:
Modified Duration = Duration
l + r
Where r = redemption yield
In order to use duration to estimate the volatility of bond prices we first need to calculate by multiplying the modified duration by the change in required yield as follows:
% change in price = Modified Duration x change in required yield
This represents the effect of change in required redemption yields. This is the phenomenon known as convexity. The above formula assumes that the relationship between required yields and bond prices is linear, whereas it is actually curvilinear. Calculations can be performed to allow for this but are not considered necessary for this course.
Duration can also be found for a bond portfolio – the duration for the portfolio being the weighted average of the durations of the individual bonds within the portfolio.
53
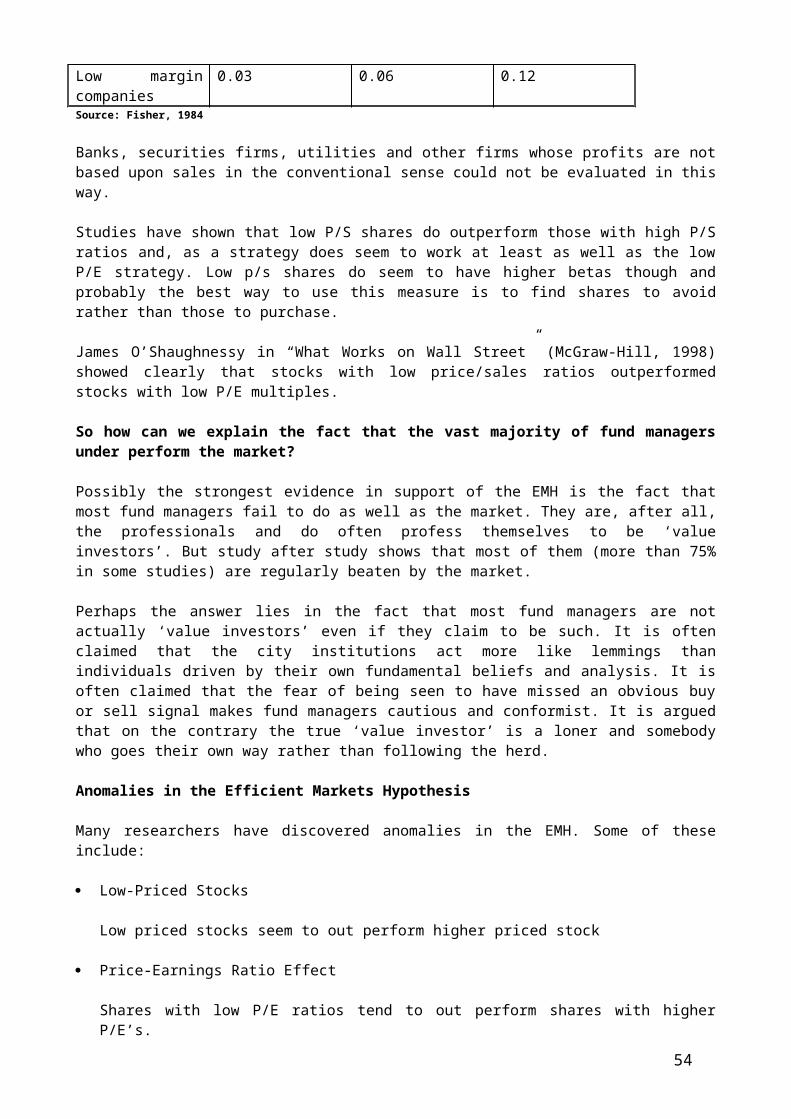
It should be noted that Duration is not necessarily a constant figure and will need recalculation when required yields change.
Exercise:
Calculate the approximate duration of a bond with a coupon of 7% redeemable in three years time. Assume that interest payments are made annually.
Can anything be done to protect a bond portfolio against changes in required yields?
The process of protecting a bond portfolio in this way is known as Immunisation.
Lets imagine that you are investing in a bond portfolio with the aim of having a specific amount of cash available for a specific point in time (possibly to discharge a particular obligation). Your portfolio will be subject to interest rate risk, which could effect your portfolio in two ways:
Price Risk – changes in the market price of the bond Reinvestment Rate Risk – the rate at which the coupon when received can be
reinvested.
One simple strategy for dealing with price risk is to match the maturity of the bonds in your portfolio to the maturity of your obligations. But this does not deal with reinvestment rate risk and you could find yourself with less than the required amount of cash available.
A simple way for dealing with reinvestment rate risk is to have only zero coupon bonds in your portfolio – thereby avoiding the need to reinvest the coupon payments. The above constitutes what is known as a Maturity Matching Strategy which is fine in theory. However in practice:
It is not always possible to find bonds of any kind with maturity dates which synchronise exactly with the due dates of the obligation
it is even less likely that suitable zero-coupon bonds will always be available the denominations required may not be available to match the exact size of the
obligation
Therefore it is often necessary to employ a Duration Matching Strategy. This involves constructing a portfolio with a weighted average duration equal to the number of years to the crystallisation of the obligation. This will be less than the weighted average maturity of the portfolio.
Duration
Imagine that a client of yours has just invested in a £200,000 8% bond, at par redeemable in 6 years time.
He wants to know if it is possible to guarantee a certain sum from the bond in about 4 to 6 years.
54
Assume that current interest rates are 8% and that the interest payments from the bond are received annually in arrears.
Illustrate using appropriate figures how this might be achieved.
55
Sessions 7 and 8
Portfolio Performance Measurement
The need for Investment Portfolio Management
Having set up your portfolio it is then necessary to continually review its ongoing suitability and its relative performance. This is necessary because:
It may not be performing, in terms of return, as well as alternative portfolios The proportions of the portfolio may have got out of line The suitability of some of the investments may have changed There may be tax considerations e.g. Bed and Breakfasting Your circumstances may have changed There may be new alternative investment opportunities
56
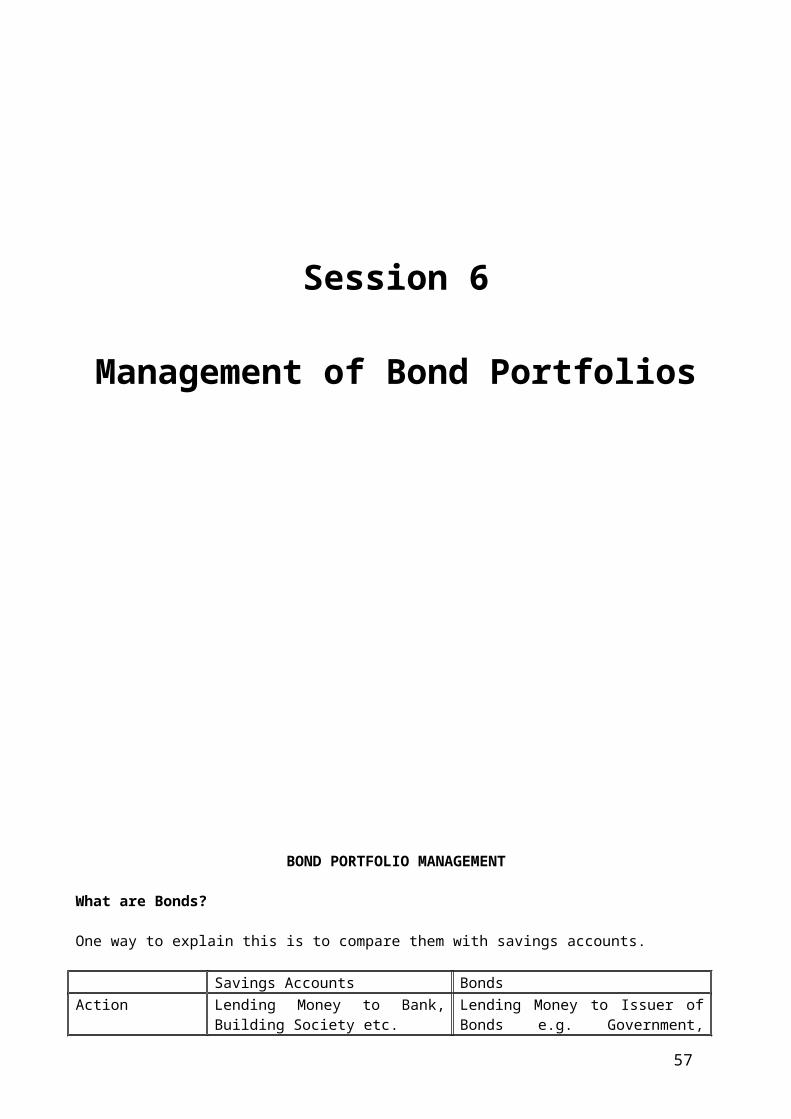
The use of security indices
Securities indices may perform one or more of the following functions:
To measure the relative strength of a group of securities To act as a guide to the timing of investment decisions To act as a general economic barometer To provide a yardstick for the measurement of portfolio performance
Why are there so many indices?
The reason for so many different indices is that they all perform different roles.
Financial Times Ordinary Index
This is an index made up of the top 30 leading shares. The purpose of the index is to give a guide to short term market sentiment. Although the top 30 companies represented account for only a small proportion of the market by number they do represent 25% by market capitalisation. They are all ‘blue chip’ shares, which are generally the first to respond to market sentiment.
Financial Times/Stock Exchange 100 Index (Footsie)
This index contains the 100 largest companies quoted on the Stock Exchange. Together they account for 70% of the total Stock Market capitalisation. The index was introduced to meet the needs of professional investors who required a constantly up-dated real-time index. It was also introduced to enable investors to hedge positions by taking out options and futures on the index.
The Financial Times/Stock Exchange – Actuaries Index
This index is prepared in conjunction with the Institute of Actuaries and the Faculty of Actuaries. It is by far the most comprehensive of the FT indices covering almost 1,000 companies.
Other Indices include:
The FT-SE Actuaries 350 Index
This index combines the FT-SE 100 and Mid 250 Index and represents about 90% of the total equity capitalisation.
The FT-SE Small Cap Index
This index includes all the shares not included in the FT-SE 350 Index.
These are relatively new indices and they provide benchmarks for ‘Tracker’ Funds and traded options contracts.
The FT – Actuaries World Index
Launched in March 1987
Primary Function is performance measurement – but also used for financial derivatives (e.g. Tracker Funds)
57
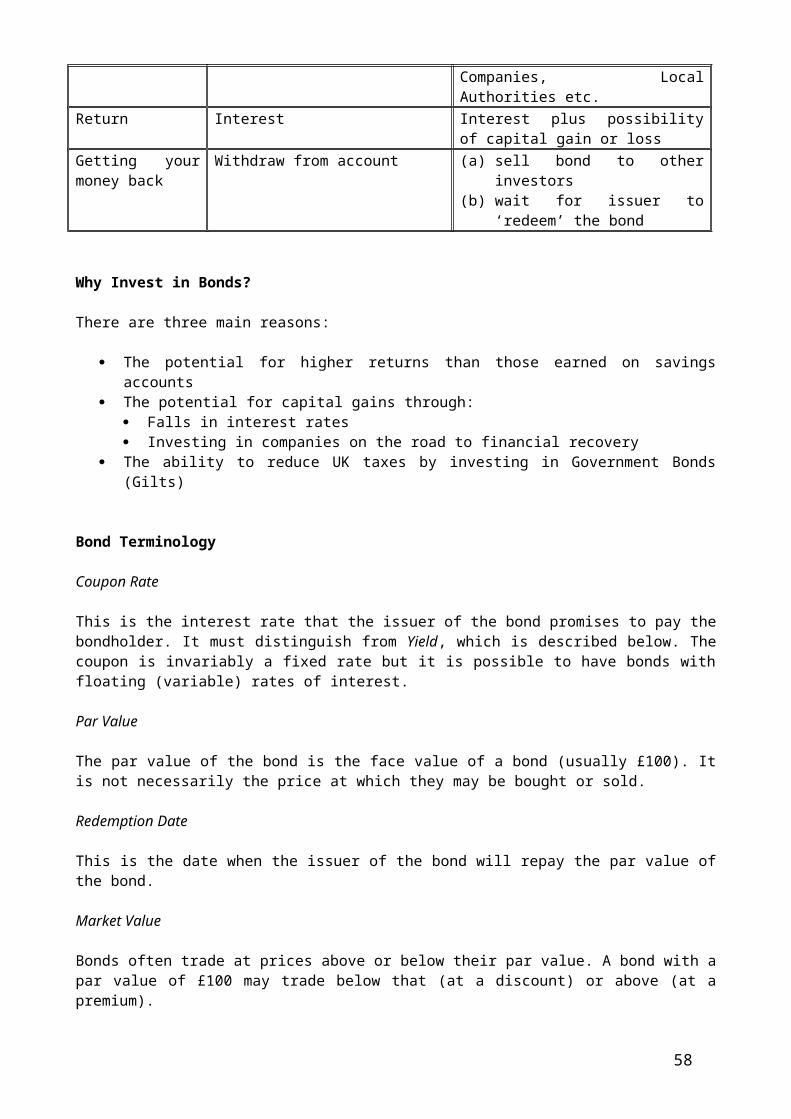
Based on approximately 2,500 equity securities from 24 countries.Represents at least 70% of the total market capitalisation of the World’s main stock markets.
Shares included must be available for international investment.
Calculated daily in five currencies (the US Dollar, Sterling, Yen, Euro, Local Currencies)
The indices are weighted arithmetic averages.
Not the only index that measures global equity performance – but is claimed to be the most comprehensive
Other Indices published in the FT
FT-SE Eurotrack 100FT-SE Eurotrack 200FT Stock Indices Government Securities Fixed Interest Gold MinesDow Jones Indices, Standard and Poors, NYSE Compostie.FAZ Aktien, DAX, CommerzbankHang SengNikei, Tokyo SEMorgan Stanley Capital InternationalCAC GeneralIndices (daily) for Austria, Belgium, Denmark, Finland, Italy, Netherlands, Norway, Singapore, Spain, Sweden, Switzerland etc.
Performance Evaluation
The rate of return on an investment can be a simple calculation. All you need is the following simple formula:
Return = Ve - Vb + D x 100 Vb
Where Vb = value of investment at the beginning of the period Ve = value of investment at the end of the period
D = income received during the period
Example:
500 shares bought at the beginning of 1999 for £2 each – sold at the end of 2004 for £2.60. Total dividends during the five years £150
58

Return = 1300 - 1000 + 150 x 100 = 45% 1000
And if the investment is over several years the following formula:
Average Annual Return = n√1 + Overall Return - 1
So 45% over 5 years (see earlier example) equates to:5√1.45 - 1
= 7.7% per annum
However the above was only a simple case and does ignore the many complications which can arise when attempting to derive a truly objective and representative measure of performance.
59
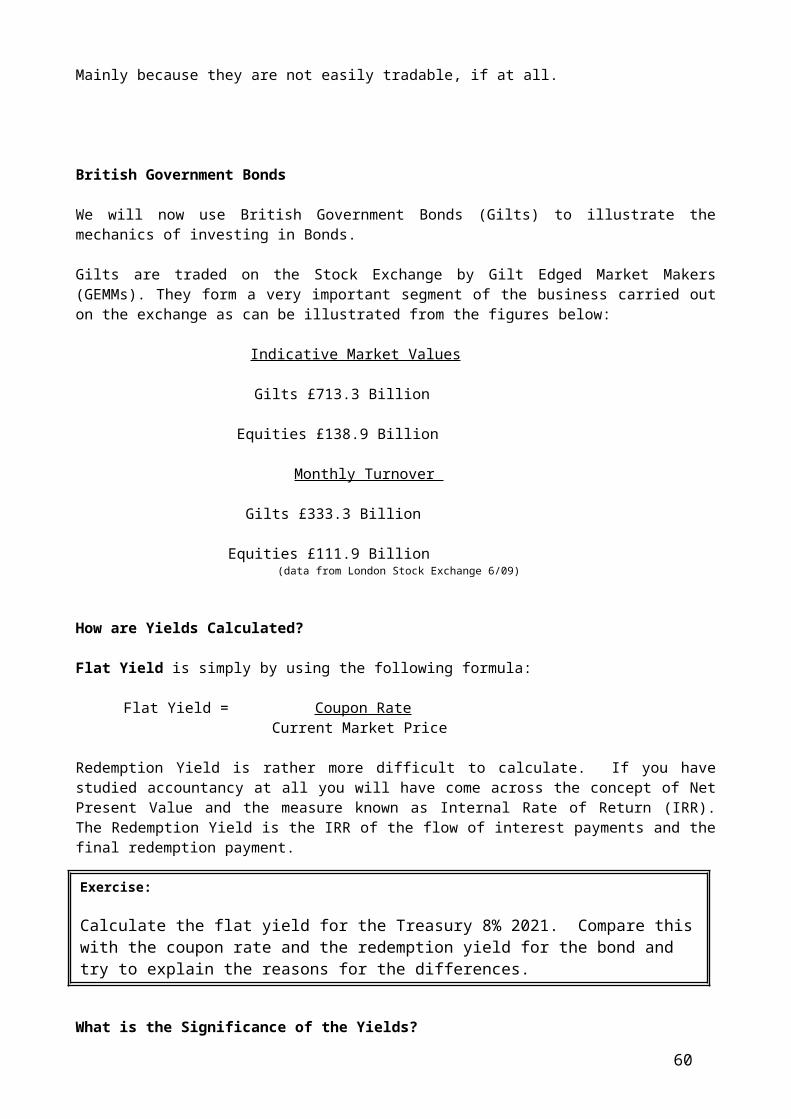
Factors Affecting Investment Performance
Factors affecting investment performance include the following:
The period over which performance is measured
For example breaking even in a bear market is a relatively better performance than under performing in a bull market
The timing of the investments
Timing (i.e. entry and exits into the market) it could be argued is a skill in itself. But it is often beyond the control of an investor – particularly a fund manager where inflows in particular are a function of other aspects.
The nature of the return sought
For example income or capital growth – long term or short term
The impact of taxation
Here changes to taxation rules and the way in which they effect different individuals can be decisive.
The selection of investments
The level of risk sought is an obvious factor here but others could be relevant e.g. green investments.
External factors
Like economic or international developments
The choice of index used for comparisons
The use of the FT-All Share Index has a simple attraction but the proliferation of indices does show that it is not always suitable.
Charges imposed by the investment manager
In the case of a unit trust for example initial charges of 5% (say) and annual charges of 1.5% (say) can have considerable influence on the portfolio performance.
The way the measurement is performed
For example the arithmetic used can often confuse the issue. As indicated later, the simple one period-return calculation is often inadequate and can distort the measure used.
It would obviously have to be an extremely complicated, and comprehensive, measure that took all the above into account. What these notes will do is to concentrate on measures that attempt to remove the arithmetical distortions or attempt to take the level of risk required into account.
The Money-weighted Rate of Return:
60
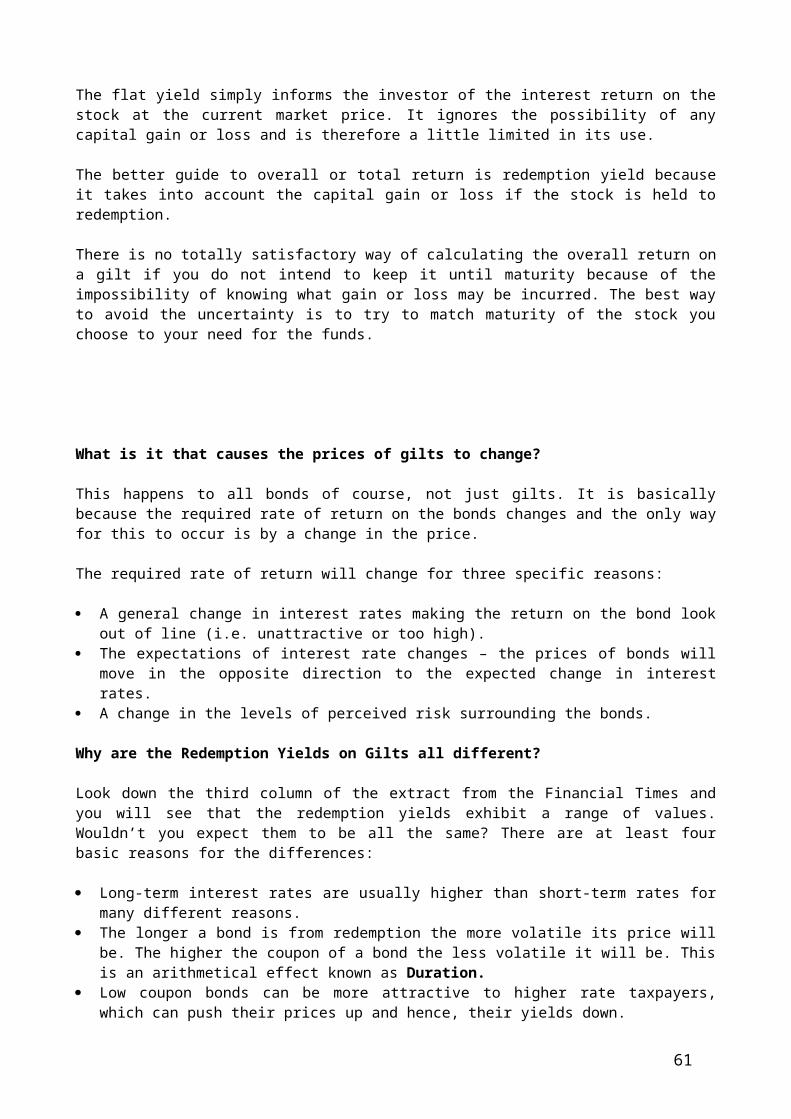
This method is most suitable for a private investor to measure his/her own performance and can be used in two ways:
(a) For single period investments
This method attempts to give the overall rate of return based upon the average value of a portfolio over a period.
Example:
An investor starts with an initial investment of £20,000 to which he adds £10,000 after three months, and withdraws £6,000 at the end of eight months. After one year the portfolio, together with income reinvested, has grown to £28,000. Thus:
Total return = (£28,000 + £6,000) – (£20,000 + £10,000)
= £4,000
Average Investment
£20,000 x 3/12 = £5,000£30,000 x 5/12 = £12,500£24,000 x 4/12 = £8,000 £25,500
Money-weighted Return = £4,000/£25,500
= 15.7%
This can be compared with a suitable index or alternative investment (e.g. bank account).
(b) For multi-period investments
This can best be illustrated using an example:
An investor purchases 100 shares in Xplc for £5 each at the beginning of 2002 and receives dividends of 20p per share. At the end of 2002 the fund is valued at £530. At the beginning of 2003 a further 100 shares in Xplc were purchased for £5.30 each. During 2003 £40 was paid out as dividend. At the end of 2003 the fund is valued at £1080.
This method works by calculating the internal rate of return of the cash flows as below:
500 + 530 + 20 + 1,080 + 401+r 1+r (1 + r)2
Resulting r = Money weighted rate of return = 7.117% (use of IRR)
The Time-weighted Rate of Return:
As you will see that the figure of 7.117% above is affected by the fact that the larger number of shares held in the second year has more influence on the average overall performance than the first year performance when the investment was smaller.
61

Because of this effect many fund managers do not like to use the money-weighted return and prefer the time-weighted return instead. This is how it works:
First calculate the return for each year:
1994 = 530 – 500 + 20 = 10% 500
1995 = 1080 – 1060 + 40 = 5.66% 1060
Then take a simple average of the two figures:
Time-weighted rate of return = 10 + 5.66% = 7.83% 2
It now becomes obvious why fund managers prefer the time-weighted approach.
Note: Most texts recommend the use of Geometric Mean rather than an arithmetic mean because:
Geometric means are less influenced by large abnormalities.
Arithmetic means do not give you the true average rate of return over multiple periods.
Geometric means are calculated using the following formula:
= n √(1 + r1)(1 + r2)…(1 + rn)
Where r = annual returnUsing this to calculate the geometric mean for the above examples gives:
2 √1.1 x 1.0566 = 7.81%
Exercise:
Two Pension funds have the following records for the last three years:
2005 2006 200762
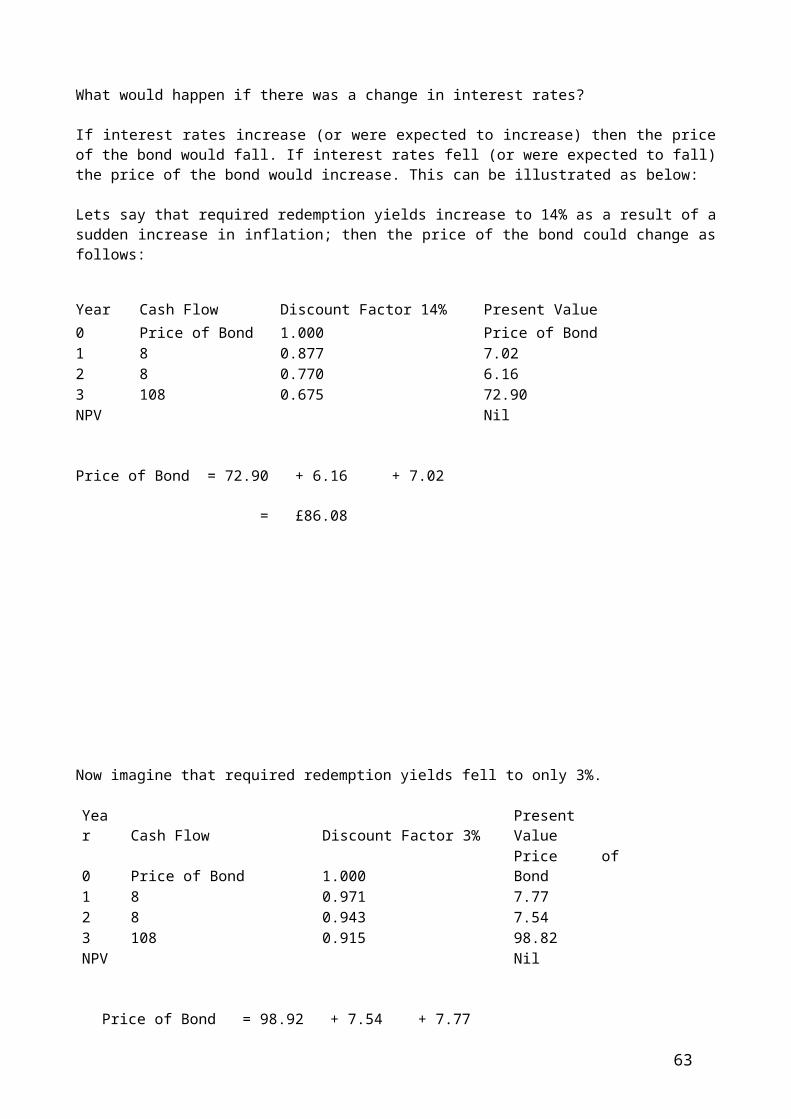
£m £m £m
Pension Fund A
Value of fund 1st Jan 100 120 180Cash Inflow 1st Jan 80Value of fund 31st Dec 120 180 234
Pension Fund B
Value of fund 1st Jan 100 120 300Cash Inflow 1st Jan 80 Value of fund 31st Dec 120 300 270
Comment upon the relative performances of the two funds.
Risk-Adjusted Returns
The riskier an investment is the greater should be its return – it should be easier to earn a better return on portfolio with a higher average beta for example. Therefore it could be argued that any performance measure that does not take into account risk is not a meaningful measure. Here we look at three different measures, which should be used for slightly different purposes.
(a) The Sharpe Measure
This measure calculates the relationship between average excess returns (over risk free investments) over a period and the standard deviation of returns over that period using the following formula:
Sp = Risk Premium = Rp – Rf Total Risk sp
Where Rp = average return from portfolio pRf = risk free rate of returnsp = standard deviation of returns of portfolio p
Example:
The average return over a five-year period on Portfolio Z is 16% with a standard deviation of 20%. The average return of the FT-All Share index was 14% over the same period with a standard deviation of 16%. Assume a risk free rate of 6%.
Sharpes measure Pz = 16 – 6 = 0.5 20
Sharpes measure FT-A = 14 – 6 = 0.5
63
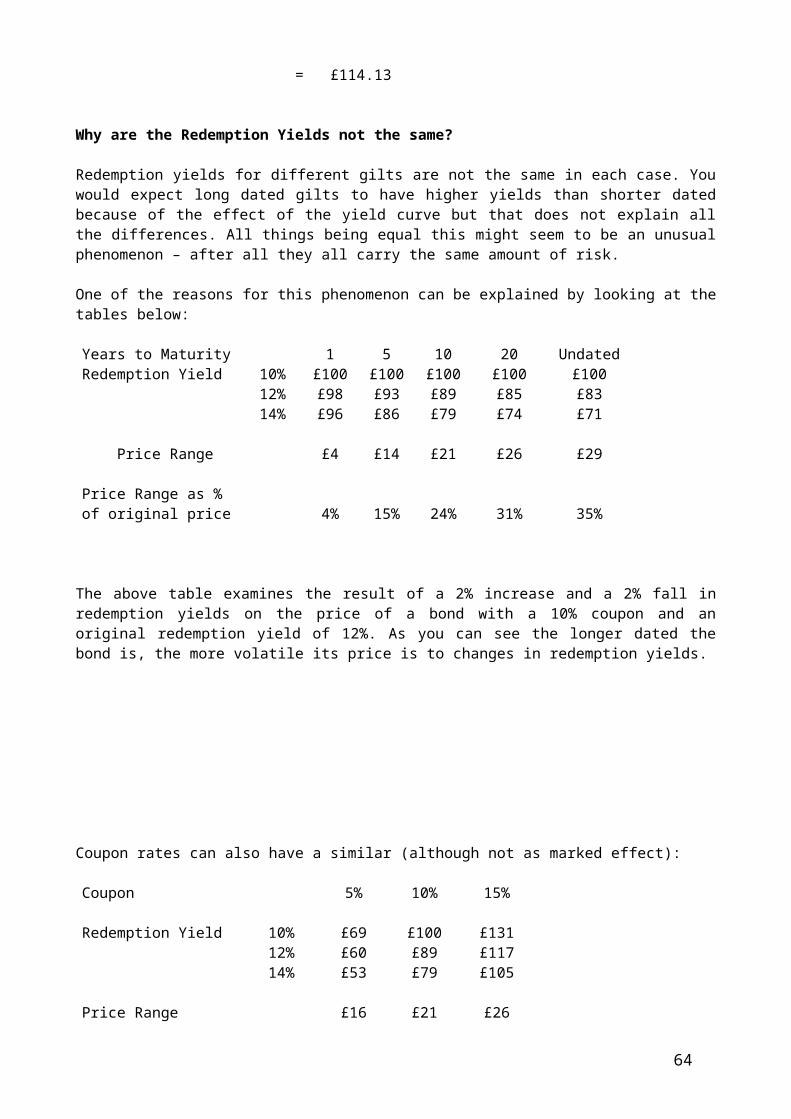
16
This shows that the better return on Portfolio Z is a function of the higher level of risk involved. It is not, as such, out performing the market.
(b) The Treynor Measure
This measure is similar to Sharpes but uses systematic instead of total risk. It is calculated using the following formula:
Sp = Risk Premium = Rp – Rf Systematic risk bp
Where Rp = average return from portfolio pRf = risk free rate of returnBp = beta factor for portfolio
(c) The Jensen Measure
This measure is the average return on a portfolio over and above that predicted by the CAPM, given the portfolio’s beta and the average market return. In other words it is a portfolio’s Alpha value. It is calculated using the following formula.
= Rp – [Rf + β(Rm – Rf)]
WhereRp = average return on the portfolioRf = risk free rateRm = market rate of returnΒ = Beta factor
Example:
Portfolio X has an average return over five years of 16% and a beta factor of 0.8%. The average return on the market is 14% with a risk free rate of 6%.
Jensen measure = 16 – [6 + 0.8(14 – 6)]
= 3.6%
How do you decide which to use?
The choice between Sharpe’s measure and either of the Treynor or Jensen methods depends on whether or not “s” or “b” is appropriate to the portfolio. If the portfolio is not well diversified (or it is a single investment) then Sharpe’s measure will be more appropriate. The better a portfolio is diversified then the more either Treynor’s or Jensen’s measures will be appropriate.
The choice between Treynor and the Jensen method is less clear cut. Treynor’s measure has the disadvantage that it is sensitive to the market index used, and it is not usually obvious which index is most relevant. Many shares do not exhibit a permanent Alpha however, which makes Jensen’s measure difficult to use.
64
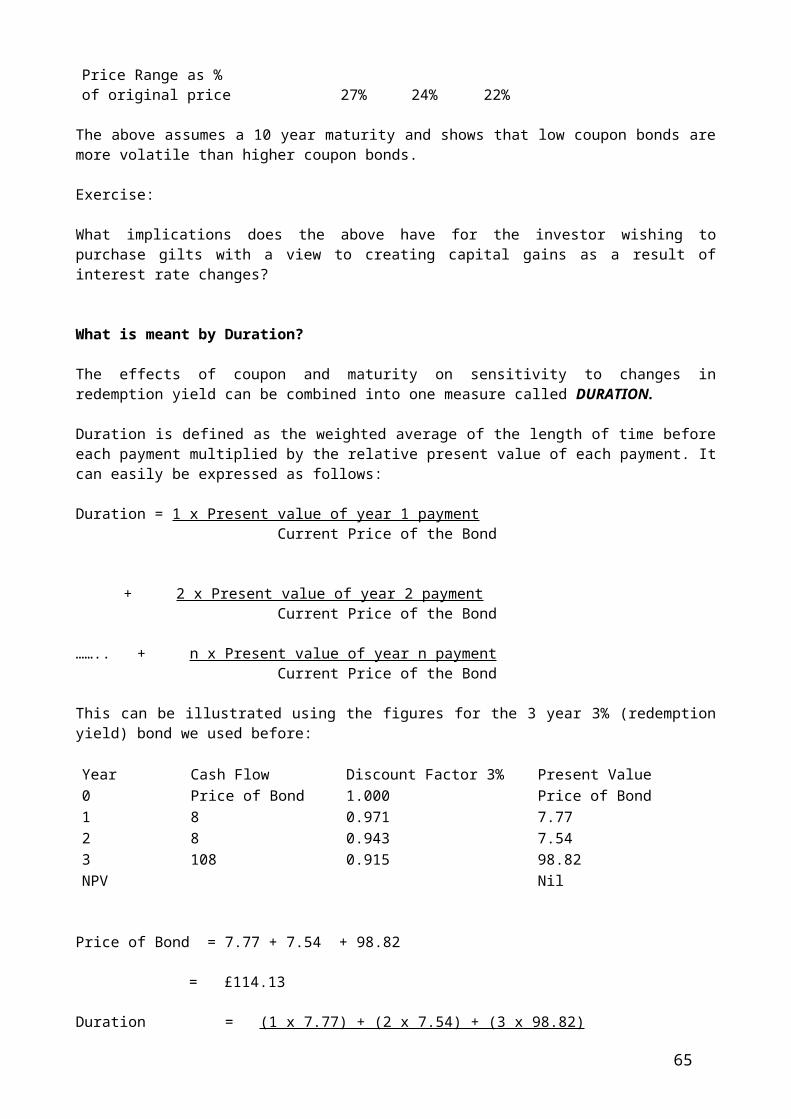
Attribution Analysis
Attribution Analysis
Is concerned with the measurement of investment performance. To quote the oft used phrase ‘superior investment performance is about being in the right securities at the right time’. Qualities required include:
Selection abilityo Asset selectiono Sector selectiono Security selection
Timing ability
65
Exercise:
Consider the following data for a particular period:
Portfolio X Market Average
Return 35% 28%
Beta Beta 1.2 1.0
Standard Deviation 42% 30%
Assume that the risk free rate was 6%
Calculate the Sharpe, Traynor and Jensen performance measures and interpret the results.
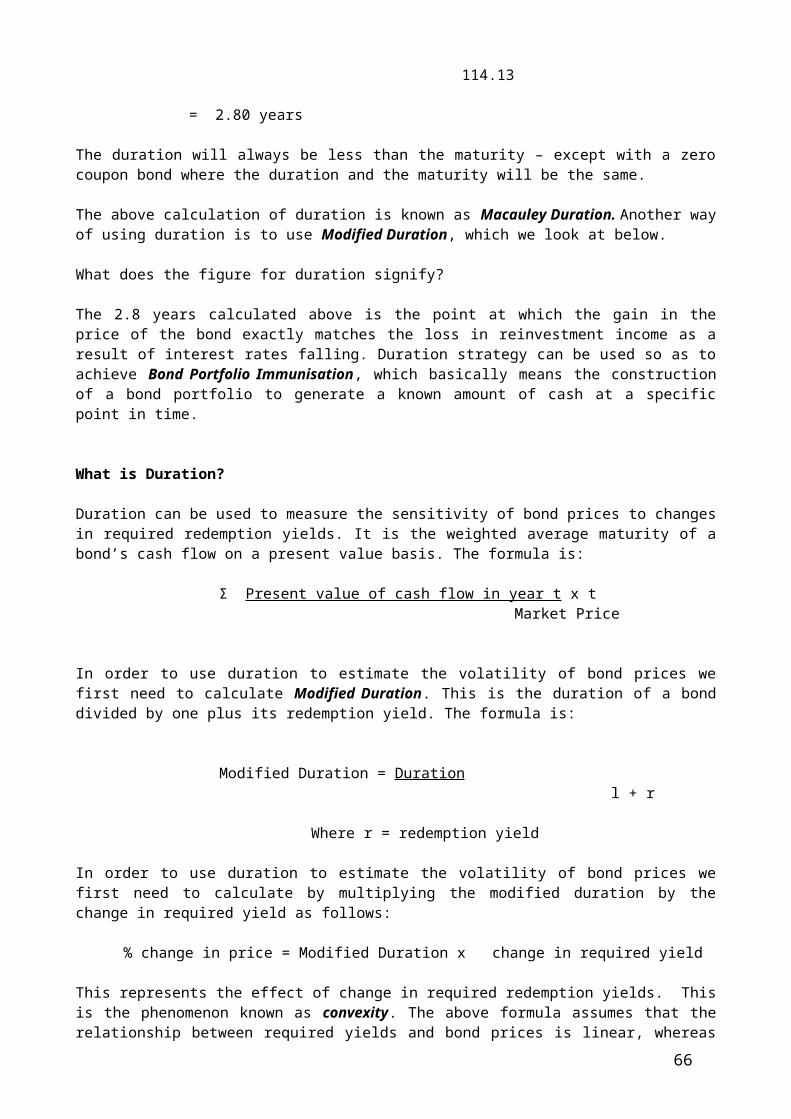
Decomposition
This is the analysis of overall performance into its discrete components. It involves measuring the effectiveness of investment strategy/policy along the following lines:
Broad Asset Allocationo Equitieso Bondso Money marketo Property
Sector choice within each asset class Security choice within each sector
Steps in Attribution Analysis
The following are the usual steps to be taken:
Establishment of a suitable/relevant benchmark level of performanceo Benchmark must be risk adjustedo Could be a ‘dummy’ portfolio with neutral allocation managed on a
passive basis Measure excess return Attribute excess return to individual decisions
Measurement of Selection Performance – Example
Imagine that your Fund Manager has just produced an annual return of 64.08%. Your benchmark portfolio meantime would have produced a return of 47.63%.
The weightings of your portfolio and the benchmark are as follows:
Your portfolio
%
Benchmark portfolio
%
Return on relevant index%
Equity 70 60 69.72Bonds 7 30 17.4Cash 23 10 5.76An analysis of the return within your portfolio shows the follows:
Equity 87.38%Bonds 22.68%Cash 5.76%
A comparison of Sector allocations reveals the following:
WeightingSector Your Portfolio
%Benchmark
Index%
Sector Return%
Manufacturing 1.96 8.3 76.8Services 7.84 4.1 78.0Leisure 1.87 7.8 44.4Technology 8.47 12.5 100.8Financial 24.01 21.8 55.2
66
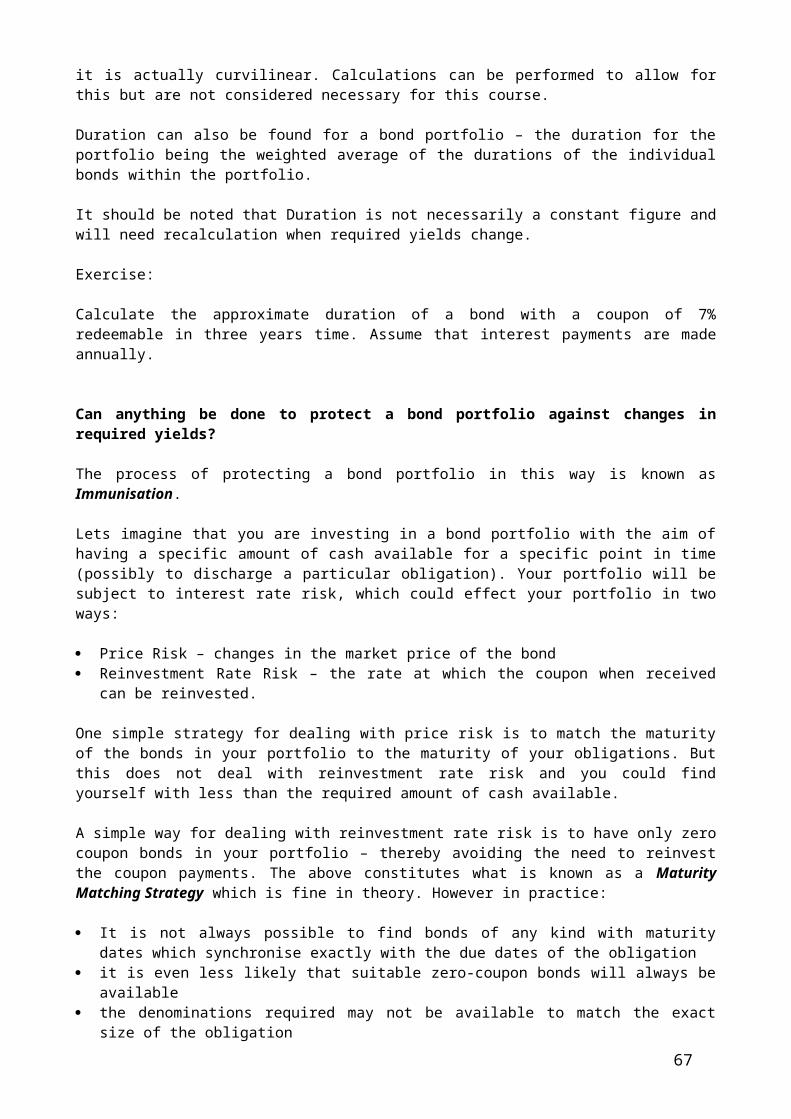
Capital Goods 13.53 14.2 25.2Banks 1.95 10.9 -1.20Energy 40.37 20.4 112.80
By decomposing the above figures Attribution Analysis can be carried out as follows:
Total Excess Return of Your Portfolio = 64.08 - 47.63 = 16.45%
Your portfolio if benchmark returns achieved:
(69.72 x 0.7) + (17.4 x 0.07) + (5.76 x 0.23) = 51.34%
Excess return due to Asset Allocation = 51.34 - 47.63 = 3.71%
Excess return due to Sector/security selection = 64.08 - 51.3468 = 12.73%
Excess Return due to Equity sector/security selection
= (87.38 –69.72) x 0.7 = 12.36%
Excess Return due to Bonds sector/security selection
= (22.68 – 17.4) x .07 = 0.37%
WeightingSector Your
Portfolio%
Benchmark Index
%
Difference in
Weighting
Sector under/over performanc
e%
Contribution %
Manufacturing 1.96 8.3 -6.34 7.08 - 0.45Services 7.84 4.1 3.74 8.28 0.31Leisure 1.87 7.8 -5.93 -25.32 1.50Technology 8.47 12.5 -4.03 31.08 -1.26Financial 24.01 21.8 2.21 -14.52 -0.32Capital Goods 13.53 14.2 -0.67 -44.52 0.30Banks 1.95 10.9 -8.95 -70.92 6.35Energy 40.37 20.4 19.97 43.08 8.60
15.03
Excess due to Sector Selection = 15.03% x 0.7 = 10.52%
Excess due to Security Selection = 12.36% - 10.52% = 1.84%67
Summary
Contribution%
Asset Allocation 3.71Sector Selection 10.52Security Selection 1.84Bonds Excess Return 0.37Total Excess Return 16.45
Measurement of Market Timing
Fund managers use one of two techniques in an attempt to improve portfolio performance through market timing:
Adjustment of asset allocation (e.g. equity to bonds or visa versa) Adjustment of the portfolios average beta (e.g. up if market expected to
rise or visa versa)
Both the above techniques are in effect attempts to adjust the average beta of a portfolio in response to anticipated market movements. In the main attempts to measure market timing concentrate on the measurement of average portfolio beta and its relationship to market movements. So for example, in simple terms:
Portfolio betas should be seen to rise before market upturns And fall before market downturns
What research has been carried out in this area seems, in the main, to demonstrate very little consistent timing ability on the part of fund managers.
Attribution Exercise
Imagine that, exactly one year ago, you agreed with your financial advisor for him to manage your investment portfolio. You agreed on the following strategic asset allocation:
Equities 60%
Gilts 30%
Cash 10%
You also agreed that the equities should be limited to the FTSE All-share index.
The actual portfolio produced for you was as follows:
Egg 6,500 shares at 152pBoosy and Hawk 4,200 shares at 120pAviva 900 shares at 550pBioquell 10,300 shares at 97pGilts
68

Treasury 8% 2010Treasury 5.75% 2012
£10,000 at £110.74 per cent£10,000 at £104.03 per cent
Cash £10,000
Assume that the cash was invested at 4% (an acceptable return) for the year and that rates have remained stable throughout the year.
Assume that the benchmark return on Gilts was 6.375% (including interest)
You have just received the following analysis, from your advisor, showing the performance of your portfolio for the year just completed:
%Portfolio Over/(Underperformance) (3.39)Made up of: Asset Allocation (0.16) Sector Selection (7.52) Security Selection 3.60Excess return on bonds 0.69
You are required to explain in your own words what the above analysis tells you. Also highlight questions you would like to ask your advisor in order to better appreciate his performance in managing your portfolio.
Session 969
Use of Financial Derivatives by Fund Managers
FINANCIAL DERIVATIVES
1 Introduction
In this section we will look at the basic principles of how financial derivatives work. In later sections we will be looking at how they can be used in the management of risk. Derivatives can play an important role in the reduction or avoidance of risk caused by:
• Price Exposure• Foreign Exchange Exposure• Interest Rate ExposureExposure for a company means that its profits might be adversely effected by changes in prices, foreign exchange rates or interest rates.
2 What is a derivative?
Derivatives are securities whose prices are determined by or 'derive from' the prices of other securities. There are three types of derivatives:
70
• Options• Futures• Swaps
The financial manager can use one, or all, of the above to try to ensure that the financial health of the business is not affected by financial market volatility. Derivatives can also be used to manage non-financial market risk (eg commodity options and futures) but that is beyond the scope of this course.
3 How does the Market for derivatives operate?
The players in all financial markets can be basically categorised into three distinct roles:
• Traders
These are the middlemen, market makers, brokers etc who make a living out of operating the market.
• Hedgers
These are those who aim to cover their own perceived risk exposure. They are concerned with transferring risk and ensuring that losses from adverse movements are compensated by offsetting gains from the hedge.
• Speculators
Speculators are the opposite of hedgers as they trade in anticipation of profiting from subsequent price movements. They are the risk takers within the market as they are prepared to assume the capital risk associated with an exposed position.
It is the hedgers that we are basically concerned with here - but an understanding of the operation of the markets does help the understanding of how derivatives work. One thing to always bear in mind though is that the players in the derivatives market must, and do, have different views on the likely direction of price movements.
Derivatives are available in two different forms:
• Over-the-Counter (OTC)
This generally covers derivatives bought from banks or other financial institutions which are often individually tailored to the needs and requirements of the individual customer.
• Exchange Traded
This covers those derivatives that are traded on recognised exchanges such as:
• London International Financial Futures Exchange (LIFFE)
• Chicago Board Options Exchange (CBOE)
They are traded in standard 'contracts' for standard amounts and standard expiry dates. They are less customer friendly than OTC derivatives but usually more flexible in trading terms.
71
4 Options
Options give the right, but not the obligation, to buy or sell specified assets at a specified price on, or before, some specified date.
A CALL option gives the right to buy the underlying assets.
A PUT option gives the right to sell the underlying assets.
The specified price is called the Exercise Price or Strike Price.
The specified date is called the Expiry Date.
The cost of an option is called the Premium.
There are always two parties to an option:
- The Writer or seller of the option who receives the premium.
- The giver or buyer of the option who pays the option premium.
The buyer of an option has three courses of action that can be taken on, or before, the expiry of the option:
- Exercise the option
This means buying, or selling, the underlying asset to, or from, the writer. A call will only be exercised if the market price of the underlying asset is higher than the strike price. A put will only be exercised if the strike price is higher than the market price.
- Trade the option
This means selling the option to another party. Where the price of the underlying asset has increased, and there is still time left to the expiry of the option, then it can often be sold at a profit (ie for an amount greater than the premium paid).
- Allow the option to lapse
This would happen, in the case of a call, where the underlying asset would be cheaper to buy in the 'cash' market (ie not exercising the option) and the option could not be sold. In the case of a put it would happen where the asset could be sold for a better price in the cash market and the option could not be sold.
In practice very few exchange traded options are exercised. It is usual for option buyers to offset a loss in the cash market with a profit on the option. You will see how this works later.
5 Valuation of Options
The value (or price) of an option is made up of two elements:
- Intrinsic Value which is the difference between the strike price and the price in the cash market of the underlying asset.
72

Intrinsic value of a Call = Asset Price - Strike Price
Intrinsic value of a Put = Strike Price - Asset Price
- Time Value which is that part of the premium due to the expectation of future price movements in the underlying asset.
As an example of the above lets imagine that the shares of X plc are currently standing at 300p on the stock exchange and that the premium on a call option to buy a share at 250p is 70p. How is the premium arrived at?
Intrinsic value = 300p - 250p = 50p
Time Value = 70p - 50p = 20p
The 20p is time value. This is a function of the time left before the expiry of the option and the expectation that the price of the share might rise above 300p.
6 Futures
In order to understand futures you first need to appreciate the nature of a Forward Contract. A forward contract is for the future delivery of a specific amount of a particular asset (or commodity) at a specified date and price. Forward contracts are very familiar to us all. For example we contract with travel agents for package holidays by paying a deposit immediately and the balance of the cost of the holiday at the commencement of (or shortly before) the holiday.
A Futures Contract is a form of forward contract. The difference is that futures are traded in standardised form on recognised exchanges. The procedure with futures is basically as follows:
• a party wishing to purchase a particular asset in the future commits themselves to taking delivery of the asset at a specified date for a specified price - this is known as a long position
• a party wishing to sell a particular asset commits themselves to deliver that asset at a specified date for a specified price - this is known as a short position
The party in the long position is said to 'buy' a contract; the short position party 'sells' a contract. The words 'buy' and 'sell' however are figurative only, because a contract is not really bought or sold like share or bond; it is entered into by mutual agreement. At the time the contract is entered into, no money changes hands between the two parties.
• at the time of 'buying' or 'selling' a futures contract each party has to pay a good faith deposit to the exchange. This is called a margin and is based upon the total value of the contract.
• the value of a futures contract is based upon the current price of the underlying asset and will obviously change as the price of the underlying asset changes. When this happens the margin is also adjusted and 'variation money 'paid as necessary. This process is known as 'marking to market'.
• a party's obligation under a futures contract can be easily cancelled (unlike a forward contract) by a process known as 'closing out'. Here the 'buyer' of a futures
73
contract simply 'sells' an identical contract and the 'seller' simply 'buys' an identical contract to cancel their obligations.
7 Hedging with Futures
Remember futures contracts are basically very simple - they are exchange tradable forward contracts. They can become a little difficult to understand because of the way in which they are actually traded. There are only two courses of action open with a futures contract:
• Fulfil the contract by delivering, or receiving, the underlying asset
or
• 'close out' the contract. The seller of a futures contract will close out a contract by buying an identical contract and the buyer will close out by selling an identical contract.
For technical reasons less than 5% of all futures contracts actually result in physical delivery - most are closed out. This is because there must always be a winner and a loser on each contract. The losers will always be willing to close out as soon as possible and 'cut their losses'. The winners find it easier to take their profits on the contracts and buy the underlying assets in the open market (if indeed they wish to).
So the way most futures are used is to use a profit on a contract to cancel a loss in the open market. Likewise a profit in the open market will be cancelled out by a loss on the future (do not forget we are talking here about hedging not speculation).
There are three basic types of hedges.
• A Long Hedge
This is for somebody wishing to acquire assets (eg foreign currency) and involves buying a futures contract.
• A Short Hedge
This is for somebody wishing to sell assets and involves selling futures contracts.
• A Cross Hedge
Very often there are not the futures contracts available for the exact asset involved. For example there may be futures contacts in 22 carat gold but not in 14 carat gold. In which case a futures contract will be written on an alternative underlying asset (probably 22 carat gold in this case but not necessarily). Most hedges are cross hedges.
8 Comparison of Option Contracts with Futures Contracts
An option contract gives the right but not the obligation to buy or sell an asset, for an agreed price, at some date in the future. In this way they are more flexible than futures contracts but also are more expensive because of the increased flexibility they afford and the fact that they also afford limited risk. It is not possible to actually sustain a loss on an option, other than the premium and this is a known risk. With a future the losses are theoretically without limit and certainly not known in advance.
74
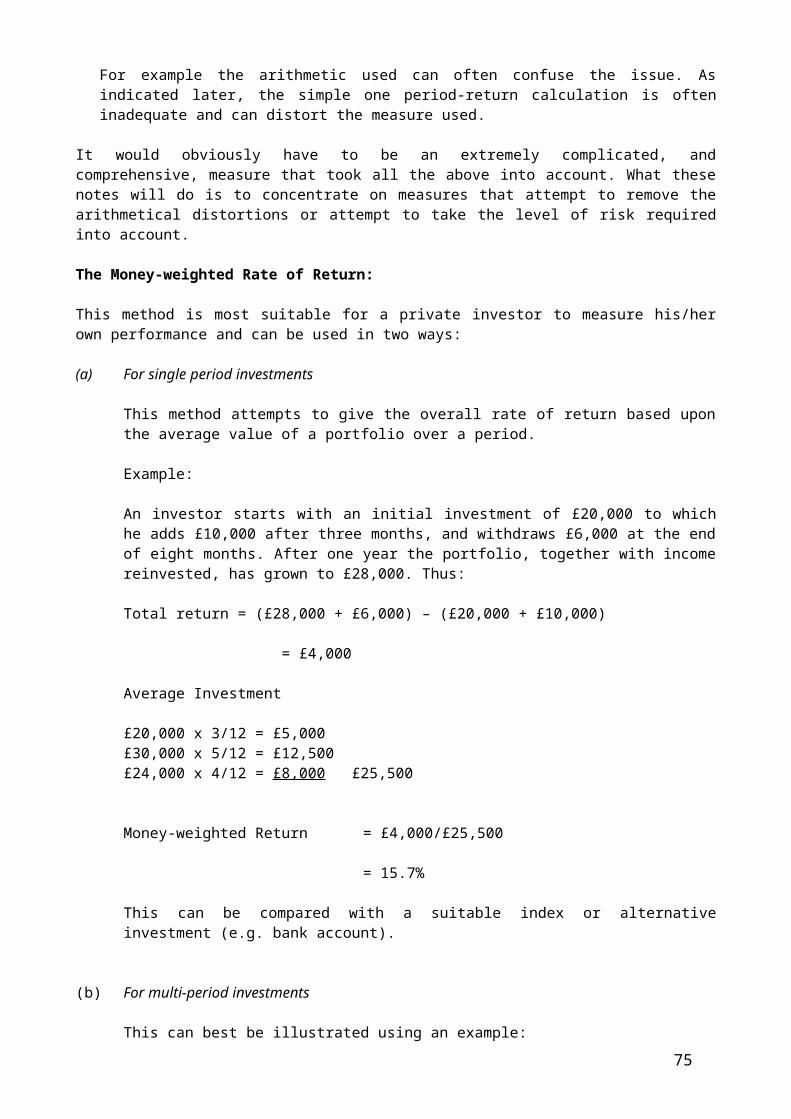
The choice between the use of options and futures is basically to do with risk. With futures the risk is unlimited. With options the downside risk is limited to the premium paid and the upside potential is, theoretically, unlimited being equal to the price specified in the option and the actual eventual price. Also a future basically locks you into a predetermined price (the futures price) whereas an option does not. Lets say you have an option to buy a share for £5 if the price of the share moves to £7 then it is obviously worthwhile exercising (or trading) the option. If the price of the share moved to £3 however then the option would be allowed to lapse and the share bought in the market if required. Thus an option gives the holder the ability to benefit from price movements both ways.
9 Swaps
In their most general form swaps are negotiated agreements between parties to exchange cash flows at specified futures dates in a prescribed manner.
• Currency Swaps
These allow parties to exchange amounts of foreign currencies and can be used to hedge foreign exchange rate risk.
• Interest Rate Swaps
These enable parties to exchange interest payments. The most common version involves exchanging fixed interest payments for floating interest payments. They are often used to manage interest rate risk exposure.
10 Use of Derivatives by Fund Managers
This is an extremely complex, and somewhat opaque, area. All we can really cover here is the theoretical possibilities enlightened by the occasional piece of empirical research. It is well to note here that some funds may make the use of derivatives a prime occupation (eg Hedge funds, Tracker funds etc) whilst others (such as Pension funds) may be barred from their use by their trust regulations.
For the purpose of this section, derivative is defined as any security whose price is determined by the price movement of some other asset. Derivatives, defined in this way, cover a very broad spectrum of investment vehicles. However they can be classified into three overall generic categories:
Straight forward ‘traditional instruments backed by ‘real’ asset classes (eg traded options or commodity futures)
Instruments that create an artificial exposure to an asset class (eg stock index futures or options)
Complex variations of traditional securities (eg Gilt strips)
Derivatives can be used by fund managers as follows:
Hedging Benchmark Risk.
Here fund managers make use of derivatives to improve the funds performance relative to their normal benchmark. For example a fund that is normally evaluated against the FTSE 100 may well make use of FTSE 100 Options to improve the performance of the fund (ie they will usually ‘short the index’ to counter general falls in their equity holdings).
75
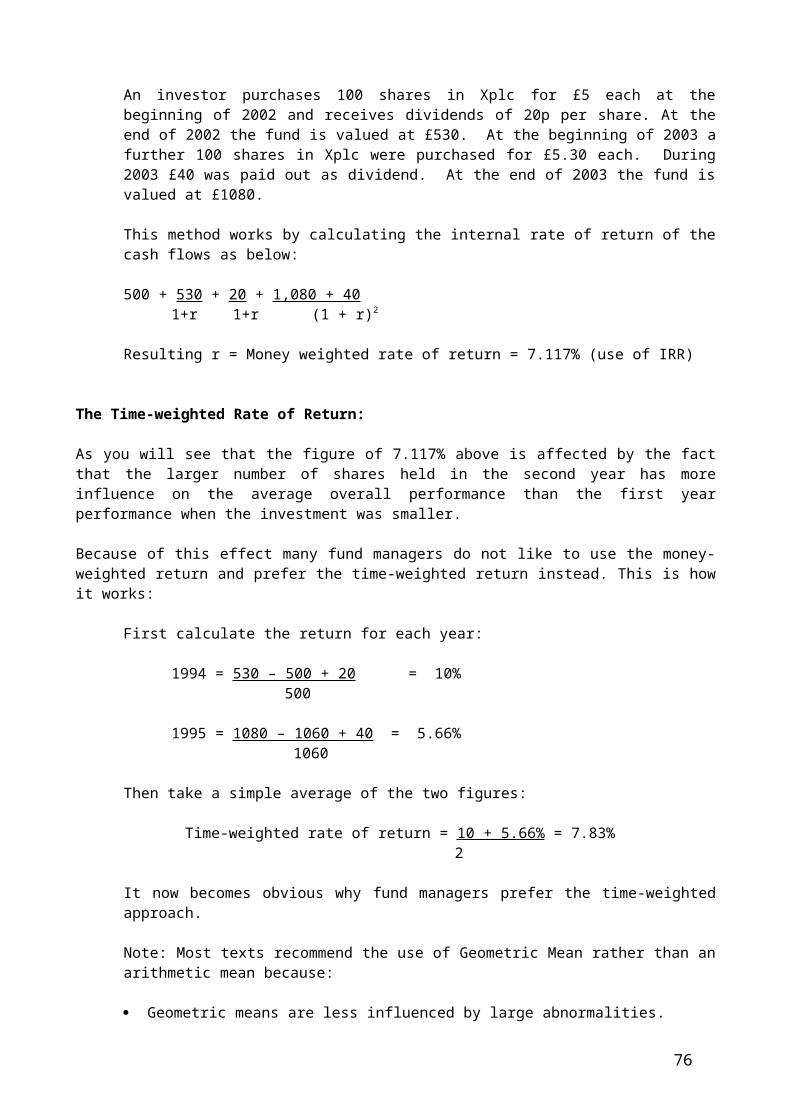
Hedging Currency Risk
Used by funds with significant holdings of international stocks.
Establishing Asset Class Exposure
Use by fund managers to establish an artificial position in assets where maybe the funds are not yet available or a permanent exposure is thought unnecessary (eg options in a takeover situation).
Yield Enhancement
Fund managers may be able to generate additional income by writing covered calls.
Session 10
Fund Classes
76

PENSIONS
UK pension provisions can be summarised in the following simplified manner:
State Pensions
Basic Old Age Pension
A basic entitlement of every UK citizen. Approximately £100 per week at the moment – index linked.
State Earnings Related Pension Scheme (SERPS)
A state sponsored earnings related pension payable to eligible employees. Basically employees, who are not in a company pension scheme, pay higher national insurance contributions in order to receive an earnings related pension in addition to their basic state pension. This scheme is gradually being phased out to be replaced by ‘private’ arrangements (see later).
Occupational Pension Schemes
Many companies (Company Pension Schemes) and all public bodies (dedicated pension schemes e.g. Teachers Pension Scheme) provide their own pension schemes as an alternative to SERPS. Schemes may be ‘contributory’ or ‘non-contributory’. Contributory schemes mean that the employee makes contributions (usually by deductions from wages/salaries). Most schemes do involve employer contributions however. Non-contributory schemes obviously do not involve employee contributions. They come in two basic forms:
Defined Benefit
Here the employer takes complete responsibility for the pension provision of its employees. They are often linked to earnings in a similar way to SERPS. It is difficult to generalise but a common formula is for the pension to be based upon the employee’s salary prior to retirement and the number of years service. This type of pension is financed in two basic ways:
1. Non-funded
77
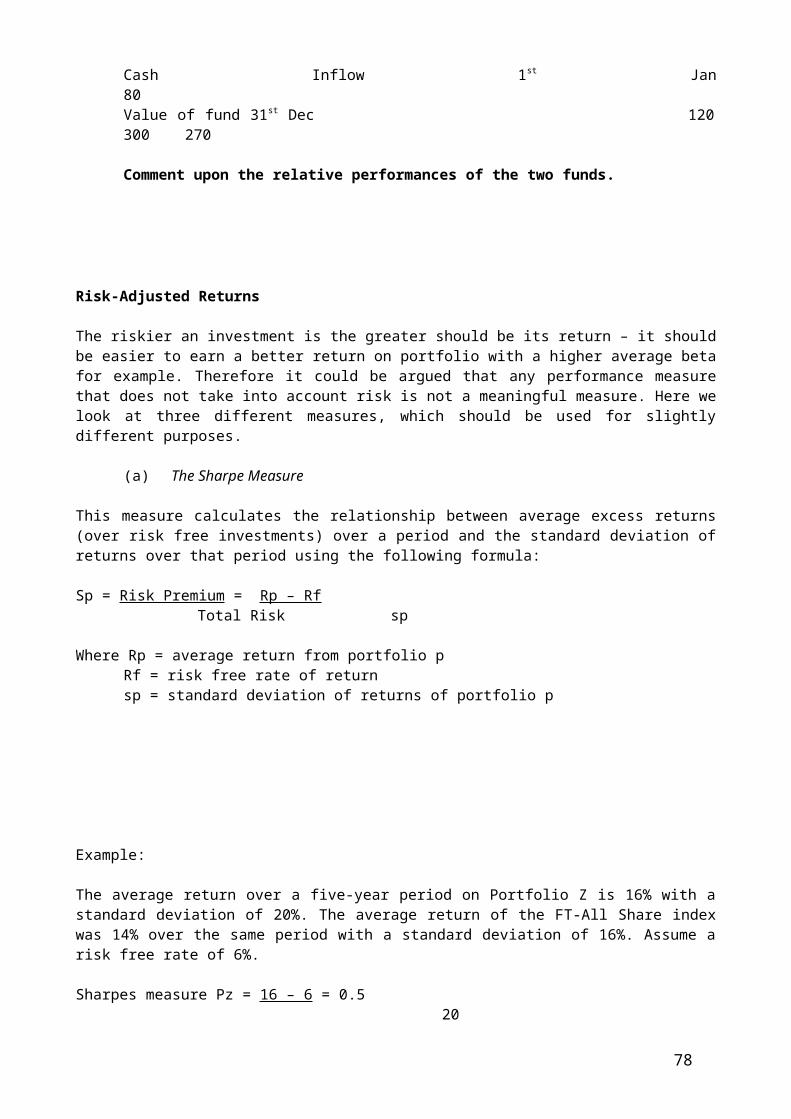
This type is usually provided by public bodies (Civil Service, Teachers, Police). The pensions are basically paid for by current employee contributions. Some doubts have been expressed over the continuing viability of such arrangements given the changing demography.
2. Funded
Here the employer sets up a fund (portfolio of investments) from which to pay pensions. The employer bears the entire investment risk. If the fund appears to be insufficient (insolvent) then, under the terms of the trust deed establishing the fund, it must ‘top it up’. This is becoming an increasing phenomenon due mainly to the poor current investment returns, but no doubt exacerbated by increasing longevity.
Many defined benefit company pensions have been ‘closed to new employees’ over recent years to be replaced by Money Purchase Schemes (see next).
Money Purchase Scheme
Here the employer also, usually, sets up an investment fund. But instead of receiving a pension related to salary and length of service an employee receives a ‘share of the fund on retirement’. The major part of this fund must then (under Inland Revenue rules) be used to purchase an annuity (usually from an Insurance company) which will then pay a pension for the rest of the employee’s life. Whilst the employer is usually responsible for the running of the pension fund (possibly using professional fund mangers) it is the employee that bears all the investment risk. So the final pension will depend upon a combination of the fund performance and annuity rates at the time of retirement. Both are particularly poor at the moment so many current retirees are suffering much reduced incomes.
Company pension schemes can be organised in many different ways. The following are just a few examples:
1. Insurance based:
These often take the form of endowment policies and may be on a “with profits” basis. This means that the employees will receive a guaranteed lump sum (with which to purchase their annuity) plus ‘annual’ and ‘terminal’ bonuses’. These are basically a share of the insurance company profits. With profits arrangements have been under considerable pressure over the last few years as a result of poor investment returns.
2. Managed funds:
These are investment portfolios operated by insurance companies or pension companies (often banks). They come in two basic forms:
(i) Unitised:
Here the employees and/or employers contributions are used to purchase “units” in a general fund which can be sold on retirement to buy an annuity. The value of the units (a lot like unit trusts) will depend upon the performance of the fund and investment returns generally.
(ii) Segregated portfolio
78
Here a separately identified investment portfolio is set up and operated by an insurance company.
3. ‘In-house’ Funds
These are usually operated by the larger companies who can afford to run their own schemes.
4. ‘Hybrid Schemes’
There are many variations of pension fund management but they usually combine aspects of the above methods.
Personal Pensions
These, as the name implies, are pensions taken out by individuals on a private basis. They are supplied mostly by insurance companies and operate on a money purchase basis with most of the accumulated fund being used to purchase an annuity on retirement. They are recommended in the following situations:
where the individual does not have access to an occupational pension scheme as an alternative to SERPS (this is only usually recommended for younger
individuals) as an alternative to an occupational pension scheme. This is usually only suitable
where: the individual has only a very basic occupational pension provision (poor
provision) where the individual is likely to change jobs on a very regular basis (in which
case the pension becomes portable) where an employee has additional earnings which he/she can use to create an
additional pension provision
Stakeholder pensions are a recent attempt by the UK authorities to tempt less well paid individuals into making their own pension provision. These are cheaper forms of Personal Pensions, with lower charges and benefits. They unfortunately do not appear to be working particularly well.
Annuities
An annuity is a lump-sum payment to an insurance company which in return guarantees to pay out a set sum for a guaranteed period or until death, whichever is later. The sum paid to the insurance company is never returned unless the annuity is a capital protected annuity. The guaranteed sum payable depends upon several things:
age at commencement of the annuity the sex of the annuitant (women tend to live longer so receive poorer rates) interest rates at the time of purchase
Annuities are available in several different forms, including:
‘level-term’ annuities – these pay the same amounts every year until death. Minimum Period Annuities – these pay a pension for a guaranteed minimum
period (say 10 years). If the annuitant dies within this period the income is paid into his/her estate until the period ends.
79
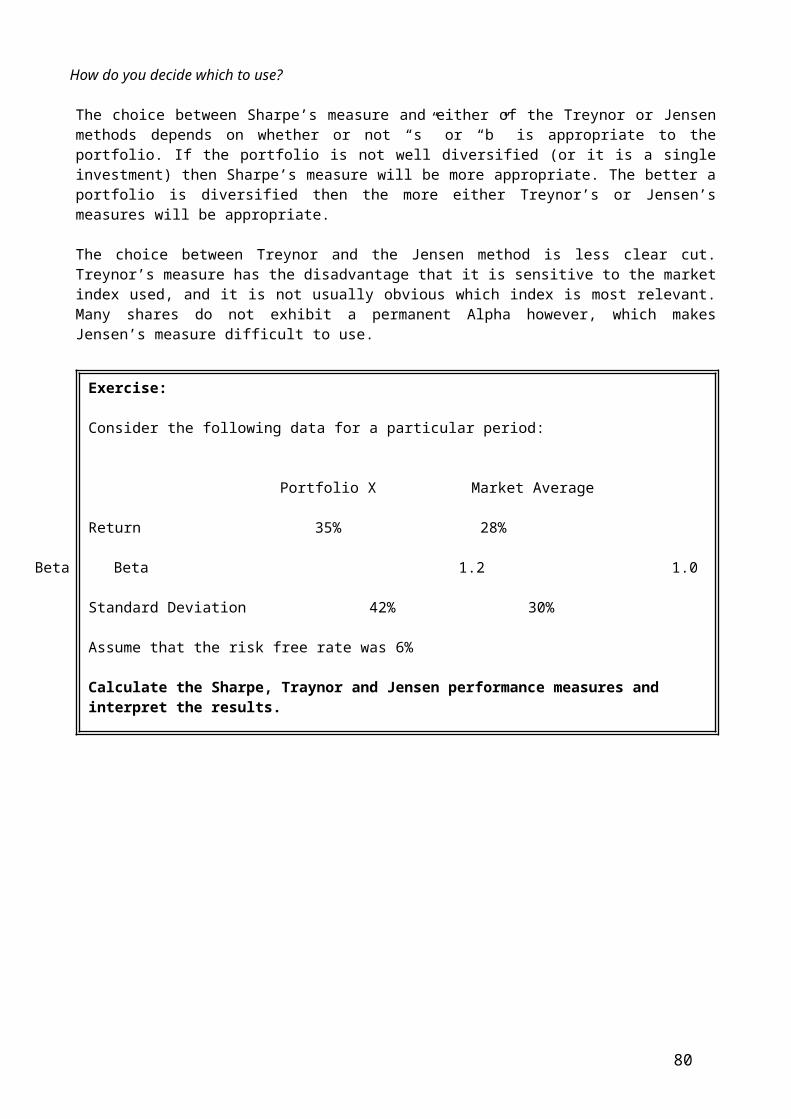
Escalator Annuities – These start with a lower initial income and the income rises each year by a set percentage or by the rate of inflation. These are obviously more expensive than ‘level-term’ annuities.
Joint and last survivor annuities – these are taken out on the joint lives of husband and wife and continue paying until the last survivor dies.
Taxation Aspects of Pensions
There are several tax aspects of pensions you may find useful to know:
Contributions are tax deductible up to certain agreed percentages. Pension funds themselves are not subject to tax (although they can no
longer reclaim the tax deducted from dividends) Pension payments are subject to tax (although annuity payments do receive
favourable tax treatment as they are treated as partly returns of capital) Most pensions provide for a lump sum payment in addition to the pension
itself. This is tax free up to a certain percentage and upper limit as to the total sum. The process of taking some of your pension benefits as a lump sum is know as ‘Commutation’.
The pension scheme itself must be ‘approved’ and comply with Inland Revenue requirements such as the one that the assets of a fund must not exceed its liabilities by more than 5%.
Actuarial Considerations
A pension fund should employ the services of an ACTUARY. This is somebody who’s job it is to help the fund managers provide the best possible pension to its beneficiaries. The actuary to the fund will stipulate the desired level of income which the fund should achieve to meet its liabilities. There are four key questions which must be answered before developing the investment strategy and asset allocation policy for a pension fund:
How long will the scheme members live? How big will their pensions be? What will the assets of the fund realise? What income will the assets of the fund generate in the meantime?
In order to answer these questions several assumptions will have to be made:
The levels of future investment returns The rates of future salary/wage growth The size of future pension increases The future trend in inflation The future rate of dividend growth The future rate of capital growth The numbers joining and leaving the scheme Will commutation be allowed ? How many and how much will be involved? The future expenses of running the fund
General Aspects of Pension Fund Management
80
Fund managers need to generate capital growth to ensure the long term survival of the fund and to ensure that it can fulfil its future obligations. It must also generate income from which it can make the pension payments. So the fund manager must take the following into consideration:
Investment in capital growth producing assets: Property investment (this produces both capital growth and income and is much
favoured) Investment in chattels (e.g. paintings) Growth equities Overseas investment (which tends to be more growth orientated – although
Translation Exposure can be a problem here) Investment in Unit Trusts and Investment Trusts – especially where the fund is
small (including use of Tracker Funds)
Investment in income producing assets: High yielding fixed interest bonds (with the use of anomaly and policy switching
to increase returns) High dividend yielding equities
Exercise:
As a newly appointed treasurer for a medium sized company you have been asked to comment upon the company’s pension scheme. An insurance company runs it as a segregated portfolio. It was initiated six months ago with a starting capital of £5 million and is expected to receive an estimated £1 million per annum in contributions from the company and its employees. The trust deed contains the widest investment powers.
You are asked to list the points you would consider in forming and implementing an effective investment plan for the pension scheme.
81