portfolio - department of the environment · web viewportfolio overview department abbreviation...
TRANSCRIPT

PORTFOLIO BUDGET STATEMENTS 2014-15
BUDGET RELATED PAPER NO. 1.7
ENVIRONMENT PORTFOLIO
BUDGET INITIATIVES AND EXPLANATIONS OFAPPROPRIATIONS SPECIFIED BY OUTCOMESAND PROGRAMMES BY AGENCY

© Commonwealth of Australia 2014
ISBN 9781760046774
This publication is available for your use under a Creative Commons BY Attribution 3.0 Australia licence, with the exception of the Commonwealth Coat of Arms, the Environment Portfolio logo, photographs, images, signatures and where otherwise stated. The full licence terms are available from http://creativecommons.org/licenses/by/3.0/au/legalcode .
Use of Environment Portfolio material under a Creative Commons BY Attribution 3.0 Australia licence requires you to attribute the work (but not in any way that suggests that the Environment Portfolio endorses you or your use of the work).
Environment Portfolio material used 'as supplied'
Provided you have not modified or transformed Environment Portfolio material in any way including, for example, by changing the Environment Portfolio text; calculating percentage changes; graphing or charting data; or deriving new statistics from published Environment Portfolio statistics – then Environment Portfolio prefers the following attribution:
Source: The Australian Government Environment Portfolio
Derivative material
If you have modified or transformed Environment Portfolio material, or derived new material from those of the Environment Portfolio in any way, then Environment Portfolio prefers the following attribution:
Based on The Australian Government Environment Portfolio data.
Use of the Coat of ArmsThe terms under which the Coat of Arms can be used are set out on the It’s an Honour website (see www.itsanhonour.gov.au)
Other UsesInquiries regarding this licence and any other use of this document are welcome at: First Assistant Secretary, Policy and Communications Division in the Department of the Environment on (02) 6274 1401.

GREG HUNTPARLIAMENT HOUSE
CANBERRA 2600
President of the SenateAustralian SenateParliament HouseCANBERRA ACT 2600
SpeakerHouse of RepresentativesParliament HouseCANBERRA ACT 2600
Dear Mr PresidentDear Madam Speaker
I hereby submit Portfolio Budget Statements in support of the 2014-15 Budget for the Environment portfolio.
These statements have been developed, and are submitted to the Parliament, as a statement on the outcomes for the portfolio.
I present these statements to provide accountability to the Parliament and, through it, the public.
Yours sincerely
Greg Hunt

Abbreviations and conventionsThe following notation may be used:
NEC/nec not elsewhere classified nil.. not zero, but rounded to zerona not applicable (unless otherwise specified)nfp not for publication$m $ million$b $ billion
Figures in tables and in the text may be rounded. Figures in text are generally rounded to one decimal place, whereas figures in tables are generally rounded to the nearest thousand. Discrepancies in tables between totals and sums of components are due to rounding.
EnquiriesShould you have any enquiries regarding this publication please contact Lily Viertmann, Chief Financial Officer, Department of the Environment on (02) 6274 1812.
A copy of this document can be located on the Australian Government Budget website at: http://www.budget.gov.au.
iv

USER GUIDETO THE
PORTFOLIO BUDGET STATEMENTS
v

USER GUIDE
The purpose of the 2014-15 Portfolio Budget Statements (PB Statements) is to inform Senators and Members of Parliament of the proposed allocation of resources to Government outcomes by agencies within the portfolio. Agencies receive resources from the annual appropriations acts, special appropriations (including standing appropriations and special accounts), and revenue from other sources.
A key role of the PB Statements is to facilitate the understanding of proposed annual appropriations in Appropriation Bills No. 1 and No. 2 2014-15 (or Appropriation Bill [Parliamentary Departments] No. 1 2014-15 for the parliamentary departments). In this sense the PB Statements are Budget related papers and are declared by the Appropriation Acts to be ‘relevant documents’ to the interpretation of the Acts according to section 15AB of the Acts Interpretation Act 1901.
The PB Statements provide information, explanation and justification to enable Parliament to understand the purpose of each outcome proposed in the Bills.
As required under section 12 of the Charter of Budget Honesty Act 1998, non-general government sector entities are not consolidated into the Commonwealth general government sector fiscal estimates and accordingly, these entities are not reported in the PB Statements.
vi

CONTENTS
Portfolio Overview.......................................................................................................1Environment Portfolio Overview.....................................................................................3
Agency Resources and Planned Performance..........................................................9Department of the Environment...................................................................................11Bureau of Meteorology...............................................................................................109Clean Energy Regulator.............................................................................................139Director of National Parks..........................................................................................165Great Barrier Reef Marine Park Authority...................................................................189Murray-Darling Basin Authority..................................................................................221National Water Commission.......................................................................................253Sydney Harbour Federation Trust..............................................................................273
vii

PORTFOLIO OVERVIEW
1

ENVIRONMENT PORTFOLIO OVERVIEW
Minister and Portfolio Responsibilities
The Environment portfolio is led by the Minister for the Environment and comprises the Department of the Environment, six prescribed agencies1 and two Commonwealth Authorities.2
The Department of the Environment advises on and implements environment policy to support the Government in achieving a healthy environment, strong economy and thriving community now and for the future. The programmes and initiatives of the Department work to protect and improve the environment through the four pillars of Clean Air, Clean Land, Clean Water and Heritage Protection.
Bureau of Meteorology
The Bureau of Meteorology is an executive3 and prescribed agency and is responsible for the outcome:
Informed safety, security and economic decisions by governments, industry and the community through the provision of information, forecasts, services and research relating to weather, climate and water.
The Bureau is Australia’s national meteorological authority. It takes and gathers observations of the weather, water and atmospheric conditions, and provides forecasts, warnings and long-term outlooks for weather, climate and water. The Bureau’s work supports all Australians including the Australian Defence Force and key sectors such as emergency management, aviation, transport, water management, agriculture and environmental management. The Bureau operates under the Meteorology Act 1955 and the Water Act 2007.
Climate Change Authority
With the Government’s commitment to repeal the carbon pricing mechanism, some functions under the Climate Change Authority will no longer be required. The Government has introduced legislation to abolish the Climate Change Authority and intends to cease its operation in 2014-15. In line with this intention, the Authority will not receive appropriation funding in 2014-15.
1 ‘prescribed agency’ as defined under the Financial Management and Accountability Act 1997.2 ‘Commonwealth authority’ as defined under the Commonwealth Authorities and Companies
Act.3 ‘executive agency’ as defined under the Public Service Act 1999.
3

Clean Energy Regulator
The Clean Energy Regulator is a statutory and prescribed agency, established under the Clean Energy Regulator Act 2011, and is responsible for the outcome:
Contribute to a reduction in Australia's net greenhouse gas emissions, including through the administration of market based mechanisms that incentivise reduction in emissions and the promotion of additional renewable electricity generation.
The Clean Energy Regulator provides data and information to Commonwealth organisations for policy development and to meet international reporting obligations. In addition, this information and data is provided to state and territory organisations to reduce their need to duplicate emissions and energy reporting.
Director of National Parks
The Director of National Parks is a Commonwealth and statutory authority4 and is responsible for the outcome:
Conservation and appreciation of Commonwealth reserves through the provision of safe visitor access, the control of invasive species and working with stakeholders and neighbours.
The Director manages the Commonwealth’s terrestrial and marine reserves and conservation zones and provides national leadership in protected area management. The Director operates under the Environment Protection and Biodiversity Conservation Act 1999.
Great Barrier Reef Marine Park Authority
The Great Barrier Reef Marine Park Authority is a prescribed and statutory agency and is responsible for the outcome:
The long-term protection, ecologically sustainable use, understanding and enjoyment of the Great Barrier Reef for all Australians and the international community through the care and development of the Marine Park.
The Authority protects and conserves the World Heritage values of the Great Barrier Reef and operates under the Great Barrier Reef Marine Park Act 1975.
4 ‘statutory authority’ as defined under the Commonwealth Authorities and Companies Act 1997.
4

Portfolio Overview
Low Carbon Australia Limited
Low Carbon Australia Limited will be wound up by the Government.
Murray-Darling Basin Authority
The Murray-Darling Basin Authority is a prescribed and statutory agency, established by the Water Act 2007 and is responsible for the outcome:
Equitable and sustainable use of the Murray-Darling Basin by governments and the community including through development and implementation of a Murray-Darling Basin Plan, operation of the River Murray system, shared natural resource management programmes, research, information and advice.
The Authority is responsible for developing and overseeing a planning framework for the integrated management of the Basin’s water and other natural resources.
National Water Commission
The National Water Commission is a prescribed and statutory authority within the portfolio and is responsible for the outcome:
Informed decisions by governments on national water issues, and improved management of Australia’s water resources, through advocacy, facilitation and independent advice.
The Government has decided to cease the operations of the Commission in 2014-15 and to reallocate its statutory and some assessment responsibilities to other agencies. Legislation to repeal the National Water Commission Act 2004 will be tabled in the Parliament during the Budget sittings for effect from 1 January 2015.
Sydney Harbour Federation Trust
The Sydney Harbour Federation Trust is a Commonwealth and statutory authority and is responsible for the outcome:
Enhanced appreciation and understanding of the natural and cultural values of Sydney for all visitors, through the remediation, conservation and adaptive re-use of, and access to, Trust lands on Sydney Harbour.
The Trust is responsible for conserving and planning the future uses of former military bases and other Commonwealth land around Sydney Harbour. The Trust operates under the Sydney Harbour Federation Trust Act 2001.
5

Portfolio Overview
Figure 1: Environment Portfolio Structure and Outcomes
Murray-Darling Basin AuthorityChief Executive Officer: Dr Rhondda Dickson
Outcome: Equitable and sustainable use of the Murray-Darling Basin by governments and the community including through development and implementation of a Basin Plan, operation of the River Murray system,
shared natural resource management programs, research, information and advice.
Bureau of MeteorologyDirector: Dr Rob Vertessy
Outcome: Informed safety, security, and economic decisions by governments, industry, and the community through the provision of information, forecasts, services and research relating to weather,
climate and water.
National Water CommissionActing Chief Executive Officer: Ms Kerry Olsson
Outcome: Informed decisions by governments on national water issues, and improved management of Australia’s water resources, through advocacy, facilitation and independent advice.
Department of the EnvironmentPortfolio Secretary - Dr Gordon de Brouwer
Outcome 1: Conserve, protect and sustainably manage Australia's biodiversity, ecosystems, environment and heritage through research, information management, supporting natural resource management, establishing and managing Commonwealth Protected areas, and reducing and regulating the use of
pollutants and hazardous substances. Outcome 2: Reduce Australia's greenhouse gas emissions, adapt to the impacts of climate change and
contribute to the negotiation of an effective global solution to climate change, through developing and implementing a national response to climate change.
Outcome 3: Advancement of Australia's strategic, scientific, environmental and economic interests in the Antarctic region by protecting, administering and researching the region.
Outcome 4: Improve the health of rivers and freshwater ecosystems and water use efficiency through implementing water reforms, and ensuring enhanced sustainability, efficiency and productivity in the
management and use of water resources.
Clean Energy RegulatorChief Executive Officer: Ms Chloe Munro
Outcome: Co ntrib ute to a re d uc tio n in Aus tra lia 's ne t g re e nh o use ga s e m is s io ns , inc lud ing thro ugh th e a d m inis tra tio n o f m a rk e t b a s e d m e c ha nis m s tha t inc e ntivis e re d uc tio n in
e m is s io ns a nd th e p ro m o tio n o f a d d itio na l re ne wa b le e le c tric ity ge ne ra tio n.
Sydney Harbour Federation TrustExecutive Director: Mr Geoff Bailey
Outcome: Enhance appreciation and understanding of the natural and cultural values of Sydney for all visitors, through the remediation, conservation and adaptive re-use of, and access to, Trust lands on
Sydney Harbour.
Great Barrier Reef Marine Park AuthorityChairperson: Dr Russel Reichelt
Outcome: The long-term protection, ecologically sustainable use, understanding and enjoyment of the Great Barrier Reef for all Australians and the international community through the care and development
of the Marine Park.
Director of National ParkesDirector: Ms Sally Barnes
Outcome: Conservation and appreciation of Commonwealth reserves through the provision of safe visitor access, the control of invasive species and working with stakeholders and neighbours.
6

Portfolio Overview
Portfolio ResourcesTable 1 shows the total new resources provided to the portfolio in the 2014-15 Budget year by agency.
Table 1: Portfolio Resources 2014-15
7
Receipts TotalBill No. 1 Bill No. 2 Special
$m $m $m $m $mDepartment of the EnvironmentAdministered appropriations 774.4 67.8 15.0 49.6 906.8 Departmental appropriations 446.3 2.7 - 60.8 509.8 Total: 1,416.6 Bureau of MeteorologyDepartmental appropriations 262.8 9.8 - 71.6 344.2 Total: 344.2
Clean Energy RegulatorAdministered appropriations 79.3 - 335.5 - 414.8 Departmental appropriations 77.9 4.4 - - 82.3 Total: 497.1
Director of National ParksDepartmental appropriations - - - 60.0 60.0 Total: 60.0 Great Barrier Reef MarinePark AuthorityDepartmental appropriations 21.9 - 5.0 21.7 48.6 Total: 48.6 Murray-Darling Basin AuthorityAdministered appropriations 7.0 - - - 7.0 Departmental appropriations 48.6 - - 86.2 134.8 Total: 141.8 National Water CommissionDepartmental appropriations 4.9 - - - 4.9 Total: 4.9 Sydney Harbour Federation TrustDepartmental appropriations - - - 15.5 15.5 Total: 15.5 Portfolio total 2,528.7 Less amounts transferred
w ithin portfolio (72.4)
Resources available w ithin portfolio: 2,456.3
Appropriation

AGENCY RESOURCES ANDPLANNED PERFORMANCE
Department of the Environment................................................................................11
Bureau of Meteorology............................................................................................109
Clean Energy Regulator...........................................................................................139
Director of National Parks.......................................................................................165
Great Barrier Reef Marine Park Authority..............................................................189
Murray-Darling Basin Authority..............................................................................221
National Water Commission....................................................................................253
Sydney Harbour Federation Trust..........................................................................273
9

Department of the Environment
Agency Resources and Planned Performance
11

DEPARTMENT OF THE ENVIRONMENT
Section 1: Agency Overview and Resources...........................................................151.1 Strategic Direction Statement........................................................................151.2 Agency Resource Statement.........................................................................191.3 Budget Measures...........................................................................................23
Section 2: Outcomes and Planned Performance....................................................312.1 Outcomes and Performance Information.......................................................31
Section 3: Explanatory Tables and Budgeted Financial Statements.....................893.1 Explanatory Tables........................................................................................893.2 Budgeted Financial Statements.....................................................................92
13

DEPARTMENT OF THE ENVIRONMENT
Section 1: Agency Overview and Resources
1.1 STRATEGIC DIRECTION STATEMENT
The Department of the Environment advises on and implements environment policy to support the Government in achieving a healthy environment, strong economy and thriving community now and for the future. The programmes and initiatives of the Department work to protect and improve the environment through the four pillars of Clean Air, Clean Land, Clean Water and Heritage Protection. The Department’s activities provide a variety of environmental and economic benefits to Australia, delivered across its four outcomes through robust environmental policy advice and a range of programme, regulatory and operational functions.
Outcome 1: Conserve, protect and sustainably manage Australia’s biodiversity, ecosystems, environment and heritage through research, information management, supporting natural resource management, establishing and managing Commonwealth Protected areas, and reducing and regulating the use of pollutants and hazardous substances.
The Department contributes to the Government’s Clean Land policy through the delivery of policies, programmes, information and research that enable the conservation, protection and sustainable management of Australia’s natural environment and heritage places.
This will be achieved through the delivery of practical change at local levels through the Green Army Programme and the 20 Million Trees programme, reform of administration of the Environment Protection and Biodiversity Conservation Act 1999, and continued work to build trusted, comprehensive and accessible national environmental research and information. The Department will also work to instil a new sense of pride in Australia’s heritage, by working with local communities to ensure that our heritage places are protected for future generations.
The Green Army will create Australia’s largest ever environmental workforce, building to 15,000 participants by 2018-19, capable of delivering 1,500 on-ground environmental projects. The Green Army will make a real difference to the environment and local communities through projects such as restoring and protecting habitat, weeding, planting, and cleaning up creeks and rivers and restoring cultural heritage places.
The Department will implement the Government’s commitment to establish a single environmental assessment and approval process in each State and Territory by accrediting planning systems under national environmental law. The one stop shop for environmental approvals will maintain the high environmental standards required
15

under national environmental law, but will simplify and streamline processes for both businesses and the community and drive enhanced economic benefits.
Other new environmental measures to be implemented by the Department include:
National Landcare Programme, which will provide a simple, local and long-term approach to land management so communities across Australia can take practical action to improve their local environment and productive landscapes.
20 Million Trees, involving $50.0 million over four years from 2014-15 to plant 20 million additional trees and associated understory by 2020, on both public and private land.
Reef Trust, with an initial contribution of $40.0 million, and in partnership with the Queensland Government, which will combine Australian Government investment with private funds to focus on key threats to the Great Barrier Reef by improving coastal habitat and water quality throughout the Reef and adjacent catchments.
The new Community Heritage and Icons Programme, involving $1.4 million over three years from 2014-15 for local heritage project grants, and to support the Federation of Australian Historic Societies and the Australian Heritage Council.
Outcome 2: Reduce Australia’s greenhouse gas emissions, adapt to the impacts of climate change and contribute to the negotiation of an effective global solution to climate change, through developing and implementing a national response to climate change.
The Department contributes to the Government’s Clean Air policy through the implementation of policies and programmes that will reduce Australia’s greenhouse gas emissions and facilitate adaptation to the impacts of climate variability.
The centrepiece of the Government’s climate change policy, the Emissions Reduction Fund, will support practical actions by businesses to achieve real reductions in emissions, lower their energy costs and increase their productivity.
The Emissions Reduction Fund will help reduce Australia’s greenhouse gas emissions while delivering valuable co-benefits to Australian businesses, households and the environment. For example, revegetation will improve water quality, and reduce erosion and salinity. Replenishing the carbon content of soils will improve the health and productivity of Australian farms. Households and businesses will save money by improving their energy efficiency.
In partnership with the Clean Energy Regulator, the Department will administer the Emissions Reduction Fund, which will comprise an initial $2.55 billion commitment.
16

Department of the Environment Budget Statements
The Department will provide direction to, and manage a funding agreement with, Griffith University for continued delivery of the National Climate Change Adaptation Research Facility over the next three years. This will deliver on the Government’s election commitment to maintain national climate adaptation research coordination in priority areas including human health, ecosystems, settlements and infrastructure.
Outcome 3: Advancement of Australia’s strategic, scientific, environmental and economic interests in the Antarctic region by protecting, administering and researching the region.
The Department leads a whole of government approach to Antarctic and sub-Antarctic policy development and operations and contributes to advancing Australia’s Antarctic interests within the Antarctic Treaty system.
As well as conducting and facilitating research that is relevant to national policy objectives in high priority areas of Antarctic and Southern Ocean science, particularly ecosystems, natural resource management and environmental protection, the Department will support Antarctic and sub-Antarctic research by other institutions, including through logistics support.
The Department will implement a number of new and continued measures from 2014-15, including:
Strengthening Australia’s Antarctic transport capabilities, including a Request for Tender for a replacement Antarctic Icebreaker, which enable Australia to continue to run a credible Antarctic scientific research programme and enable Australia’s ongoing presence in Antarctica.
Maintaining Australia’s presence in Antarctica with one year of additional funding of $9.3 million in 2014-15 to continue vital operations, including research and expedition activities, as well as the operation of the Antarctic and sub-Antarctic stations.
Outcome 4: Improve the health of rivers and freshwater ecosystems and water use efficiency through implementing water reforms, and ensuring enhanced sustainability, efficiency and productivity in the management and use of water resources.
The Department contributes to the Government’s Clean Water Policy through policies and programmes directed at enhancing the sustainability and productivity of water systems and improving their overall health. This includes the key commitment to implement the Murray-Darling Basin Plan in full and on time.
The Water Recovery Strategy will transparently outline how the Australian Government will recover the water needed to reduce extraction levels in the Murray-Darling Basin to sustainable levels. The adaptive approach in the Water Recovery
17
Department of the Environment Budget Statements
Strategy will maximise positive outcomes for communities, industry and the environment.
As part of this strategy to enhance the productivity and sustainability of water systems, the Government has implemented a 1,500 gigalitre cap on water buybacks in the Murray-Darling Basin. This measure will prioritise water recovery through infrastructure investment in preference to water buybacks, to ensure the productive future of regional economies in the Murray-Darling Basin.
18

Department of the Environment Budget Statements
1.2 AGENCY RESOURCE STATEMENT
Table 1.1 shows the total resources from all sources. The table summarises how resources will be applied by outcome and by administered and departmental classification.
Table 1.1: Department of the Environment Resource Statement — BudgetEstimates for 2014-15 as at Budget May 2014
19
Estimate Proposed Total estimate Totalof prior year + at Budget = available
amounts appropriationavailable in
2014-15 2014-15 2014-15 2013-14$'000 $'000 $'000 $'000
Ordinary annual services 1
Departmental appropriationPrior year departmental
appropriation 2 100,762 - 100,762 84,402 Departmental appropriation 3 - 405,256 405,256 419,572 s32 Transfer from Industry 4 - - - 30,676 Payment to CAC Act bodies 5 - 41,061 41,061 41,497 s31 Relevant agency receipts 6 - 60,770 60,770 89,088 Total 100,762 507,087 607,849 665,235
Administered expenses Outcome 1 - Clean Land - 445,976 445,976 505,558 Outcome 2 - Clean Air - 5,714 5,714 - Outcome 4 - Clean Water - 322,701 322,701 256,177 s32 Transfer of function from Industry - Climate Change functions 7 - - - 14,775 Total - 774,391 774,391 776,510
Total ordinary annual services including Special Accounts 100,762 1,281,478 1,382,240 1,441,745
Total ordinary annual services excluding Special Accounts A 100,762 999,762 1,100,524 1,151,581

Department of the Environment Budget Statements
Table 1.1: Department of the Environment Resource Statement — BudgetEstimates for 2014-15 as at Budget May 2014 (continued)
20
Estimate Proposed Total estimate Total
of prior year + at Budget = availableamounts appropriation
available in2014-15 2014-15 2014-15 2013-14
$'000 $'000 $'000 $'000Other services Administered expenses 8
Specific payments to States, ACT, NT and local governmentOutcome 1 - Clean Land - 120 120 800 Outcome 4 - Clean Water - 5,500 5,500 5,204 Total - 5,620 5,620 6,004
Departmental non-operatingEquity injections - 2,745 2,745 40,608 Prior year non-operating 2 1,019 - 1,019 - Total 1,019 2,745 3,764 40,608
Administered non-operatingAdministered assets and liabilities - 62,204 62,204 88 Prior year administered assets and
liabilities appropriation 2 447,098 - 447,098 - Total 447,098 62,204 509,302 88
Total other services B 448,117 70,569 518,686 46,700 Total available annual appropriations 548,879 1,352,047 1,900,926 1,488,445

Department of the Environment Budget Statements
Table 1.1: Department of the Environment Resource Statement — BudgetEstimates for 2014-15 as at Budget May 2014 (continued)
21
Estimate Proposed Total Totalof prior year + at Budget = estimate available
amounts appropriationavailable in
2014-15 2014-15 2014-15 2013-14$'000 $'000 $'000 $'000
Special appropriationsSpecial appropriations limited
by amountWater Act 2007, s86AG -Credits to the Water for the Environment special account - 15,000 15,000 -
Total special appropriations C - 15,000 15,000 -
Total appropriations excludingSpecial Accounts 548,879 1,085,331 1,634,210 1,198,281 Special AccountsOpening balance 9 478,030 - 478,030 451,368 Appropriation receipts - 281,716 281,716 290,164 Non-appropriation receipts to
Special Accounts 10 - 49,570 49,570 49,659 Total Special Accounts D 478,030 331,286 809,316 791,191
Total resourcingA+B+C+D 1,026,909 1,416,617 2,443,526 1,989,472
Less appropriations drawn fromannual or special appropriations aboveand credited to special accounts - (296,716) (296,716) (290,164)and CAC Act bodies through annual appropriations - (41,061) (41,061) (41,497)
Total net resourcing forEnvironment 1,026,909 1,078,840 2,105,749 1,657,811

Department of the Environment Budget Statements
Table 1.1: Department of the Environment Resource Statement — BudgetEstimates for 2014-15 as at Budget May 2014 (continued)
Special Accounts
Appropriation receiptsNon-appropriation receipts to
Special AccountsTotal Special Account
Total resourcingA+B+C
Less appropriations drawn fromannual or special appropriations above
and CAC Act bodies through annual appropriations
Total net resourcing forEnvironment
for further details). For accounting purposes the DCB amount has been designated as 'contributions by owners'.
of Industry consistent with the AAO changes announced on 18 September 2013. $30.676 million was transferred on the 31st of J anuary 2014 via a section 32 determination.
is directly appropriated the Director of National Parks' (DNP) appropriations, which is then allocatedto DNP by the Secretary.
of Industry consistent with the AAO changes announced on 18 September 2013. $14.775 million was transferred on the 31st of J anuary 2014 via a section 32 determination.
as Services for Other Entities and Trust Moneys account as they do not constitute funds availableto the department for operations). For further information on special accounts see table 3.1.1.
Reader note: All figures are GST exclusive.
Third party payments from and on behalf of other agencies
22
1 Appropriation Bill (No.1) 2014-15.2 Estimated adjusted balance carried from previous year for appropriation3 Includes $25.351 million for the Departmental Capital Budget (DCB) in 2014-15 (refer to table 3.2.5 for further details). For accounting purposes the DCB amount has been designated as 'contributions by owners'. 4 Ministerial responsibility for domestic climate change has been transferred from the Department of Industry consistent with the Administrative Arrangements Order dated 18 September 2013. $30.676 million was transferred on the 31st of J anuary 2014 via a section 32 determination. 5 As per the Environment Protection and Biodiversity Conservation Act 1999 section 514S, Environmentis directly appropriated the Director of National Parks' (DNP) appropriations, which is then allocatedto DNP by the Secretary.6 FMA Act s31 receipts, also known as FMA Regulation 15 receipts, are an estimate.7 Ministerial responsibility for domestic Climate Change has been transferred from the Department of Industry consistent with the Administrative Arrangements Order dated 18 September 2013. $14.775 million was transferred on the 31st of J anuary 2014 via a section 32 determination.8Appropriation Bill (No.2) 2014-15.9 Estimated opening balance for special accounts (less 'Special Public Money' held in accounts suchas Services for Other Entities and Trust Moneys account as they do not constitute funds availableto the department for operations). For further information on special accounts see table 3.1.2.10 Excludes the statutory credits to the Water for the Environment Special account .
Reader note: All figures are GST exclusive.

Department of the Environment Budget Statements
1.3 BUDGET MEASURES
Budget measures in Part 1 relating to the Department of the Environment are detailed in Budget Paper No. 2 and are summarised below.
Table 1.2: Department of the Environment 2014-15 Budget measuresPart 1: Measures announced since the 2013-14 MYEFO
23
2014-15 2013-14$'000 $'000
Payments made to CAC Act bodies within the portfolioDepartmental
Director of National Parks Appropriation Bill (No.1) 2014-15 41,061 41,497
Total Departmental CAC Act body payments disclosed above 41,061 41,497
Programme 2013-14 2014-15 2015-16 2016-17 2017-18$'000 $'000 $'000 $'000 $'000
Expense measures Reef 2050 Plan - 1.1 establishment 1
Administered expenses - 11,132 10,326 9,124 9,419 Departmental expenses - - - - -
Total - 11,132 10,326 9,124 9,419 National Landcare Programme - establishment2 1.1
Administered expenses (12,374) (31,365) (109,261) (124,527) (142,392) Departmental expenses (392) (945) (613) (574) (573)
Total (12,766) (32,310) (109,874) (125,101) (142,965) 20 Million Trees - commencement3 1.1
Administered expenses - - - - -Departmental expenses - - - - -
Total - - - - -Coastal River Recovery Initiatives - establishment4 1.1
Administered expenses - - - - -Departmental expenses - - - - -
Total - - - - -Greater Western Sydney - Cumberland Conservation Corridor - establishment5 1.1
Administered expenses - - - - -Departmental expenses - - - - -
Total - - - - -Dandenong Ranges Wildlife Recovery, Weed Management and Fuel Reduction Programme - establishment6 1.1
Administered expenses - - - - -Departmental expenses - - - - -
Total - - - - -

Department of the Environment Budget Statements
Part 1: Measures announced since the 2013-14 MYEFO (continued)
24
Programme 2013-14 2014-15 2015-16 2016-17 2017-18$'000 $'000 $'000 $'000 $'000
Whale and Dolphin Protection Plan 1.1Plan - establishment7
Administered expenses - (276) (84) (224) -Departmental expenses - - - - -
Total - (276) (84) (224) -
Keep Australia Beautiful and Clean Up Australia - contribution8 1.1
Administered expenses - - - - -Departmental expenses - - - - -
Total - - - - -Kimberley Cane Toad Clean Up - contribution9 1.1
Administered expenses - - - - -Departmental expenses - - - - -
Total - - - - -
Grants to Voluntary Environment, Sustainability and Heritage Organisations - cessation 1.1
Administered expenses - (1,345) (1,344) (1,342) (1,342) Departmental expenses - - - - -
Total - (1,345) (1,344) (1,342) (1,342) Tasmanian Forests Agreement Implementation Package - reduced funding 1.1
Administered expenses (1,000) (2,000) (1,000) - -Departmental expenses - - - - -
Total (1,000) (2,000) (1,000) - -National Wildlife Corridors Plan - reduced funding 1.1
Administered expenses (198) - - - -Departmental expenses - - - - -
Total (198) - - - -
National Environmental Science Programme - establishment10 1.2
Administered expenses - (4,566) (4,566) (6,300) (6,300) Departmental expenses - - - - -
Total - (4,566) (4,566) (6,300) (6,300)
Southern Ocean flights - monitoring of w haling and protest f lights 1.2
Administered expenses - - - - -Departmental expenses - - - - -
Total - - - - -

Department of the Environment Budget Statements
Part 1: Measures announced since the 2013-14 MYEFO (continued)
25
Programme 2013-14 2014-15 2015-16 2016-17 2017-18$'000 $'000 $'000 $'000 $'000
Community Heritage and Icons Programme - establishment 1.4
Administered expenses - 467 467 467 -Departmental expenses - - - - -
Total - 467 467 467 -Port Arthur Penitentiary restoration - contribution11 1.4
Administered expenses - - - - -Departmental expenses - - - - -
Total - - - - -Sustainable Regional Development - reduced funding 1.5
Administered expenses - (280) - - -Departmental expenses - (260) - - -
Total - (540) - - -Orangutan Reintroduction Project - contribution 1.5
Administered expenses - 200 100 - -Departmental expenses - - - - -
Total - 200 100 - -Solar Tow ns - establishment 2.1
Administered expenses - 500 1,350 250 -Departmental expenses - - - - -
Total - 500 1,350 250 -Asia-Pacif ic Rainforest Summit 2.1
Administered expenses - - - - -Departmental expenses - 757 - - -
Total - 757 - - -Harnessing the potential of algal synthesis and biofuels - redirection12 2.1
Administered expenses - - - - -Departmental expenses - - - - -
Total - - - - -National Climate Change Adaptation Research Facility - support 2.2
Administered expenses - 2,805 3,266 2,730 -Departmental expenses - 67 66 66 -
Total - 2,872 3,332 2,796 -Antarctica - maintaining Australia's presence13 3.1
Administered expenses - - - - -Departmental expenses - 9,359 - - -
Total - 9,359 - - -

Department of the Environment Budget Statements
Part 1: Measures announced since the 2013-14 MYEFO (continued)
26
Programme 2013-14 2014-15 2015-16 2016-17 2017-18$'000 $'000 $'000 $'000 $'000
Sustainable Rural Water Use and Infrastructure Programme - reduced funding14 4.1
Administered expenses (4,938) (10,500) (71,980) (30,000) (102,000) Departmental expenses - (401) (255) - 12,533
Total (4,938) (10,901) (72,235) (30,000) (89,467)
Water Resources Assessment and Research Grant Programme - reduced funding15 4.1
Administered expenses - - - - (175) Departmental expenses - - - - -
Total - - - - (175)
Office of Water Science research programme - cessation 4.1
Administered expenses - - - - -Departmental expenses (2,000) (2,000) (2,000) (2,000) (2,000)
Total (2,000) (2,000) (2,000) (2,000) (2,000) 1,500 Gigalitre Cap on Water Buybacks - establishment16 4.1
Administered expenses - - - - -Departmental expenses - - - - -
Total - - - - -Efficiency Dividend - a further temporary increase of All0.25 per cent
Administered expenses - - - - -Departmental expenses - (1,081) (2,023) (2,827) (2,782)
Total - (1,081) (2,023) (2,827) (2,782) Total expense measures
Administered (18,510) (35,228) (172,726) (149,822) (242,790) Departmental (2,392) 5,496 (4,825) (5,335) 7,178
Total (20,902) (29,732) (177,551) (155,157) (235,612)

Department of the Environment Budget Statements
Part 1: Measures announced since the 2013-14 MYEFO (continued)
27
Programme 2013-14 2014-15 2015-16 2016-17 2017-18$'000 $'000 $'000 $'000 $'000
Capital measures Sustainable Rural Water Use and Infrastructure Programme - reduced funding14 4.1
Administered capital (10,088) (9,220) - - (98,000) Departmental capital - - - - -
Total (10,088) (9,220) - - (98,000) Efficiency Dividend - a further temporary increase of All0.25 per cent
Administered capital - - - - -Departmental capital - (65) (129) (193) (195)
Total - (65) (129) (193) (195) Total capital measures
Administered (10,088) (9,220) - - (98,000) Departmental - (65) (129) (193) (195)
Total (10,088) (9,285) (129) (193) (98,195) Prepared on a Government Finance Statistics (f iscal) basis
1 Funding for this measure w ill be credited to the Reef Trust Special Account upon its establishment. 2 This measure includes savings of $397.2 million over f ive years from 2013-14 from the Natural Heritage Trust (across Environment and Agriculture components), and $25.8 million over f ive years from 2013-14 from the Environmental Stew ardship Programme. Further savings of $54.8 million are provided from the Environmental Stew ardship Programme over the period 2018-19 to 2027-28. This measure w ill bring the Government’s entire investment in natural resource management to $2.0 billion over four years from 2014-15. This includes $1,028.1 million for the National Landcare Programme, $525.4 million for the Green Army Programme (announced in the 2013-14 MYEFO), $40.0 million for the Reef 2050 Plan – establishment, $9.4 million for the Great Barrier Reef Foundation, $0.6 million for the Whale and Dolphin Protection Plan – establishment, $210.2 million for Working on Country and $203.6 million for the Land Sector Package.3 Funding of $50.0 million over four years from 2014-15 for this measure w ill be sourced from existing resources w ithin the National Landcare Programme.
4 Funding of $9.3 million over four years from 2014-15 for this measure w ill be sourced from existing resources w ithin the National Landcare Programme.
5 Funding of $7.5 million over three years from 2014-15 for this measure w ill be sourced from existing resources w ithin the National Landcare Programme .

Department of the Environment Budget Statements
Part 1: Measures announced since the 2013-14 MYEFO (continued)
28
10 This measure combines the former National Environmental Research Programme w ith the Australian Climate Change Science Programme. The new programme w ill have ongoing funding of $25.5 million each year.
7 Funding of $2.0 million over three years from 2014-15 for this measure w ill be sourced from existing resources w ithin the National Landcare Programme . Of this funding, $0.6 million w ill be appropriated to the Department of the Treasury under Federal Financial Relations arrangements to deliver programme funding to states and territories.
6 Funding of $3.0 million over three years from 2014-15 for this measure w ill be sourced from existing resources w ithin the National Landcare Programme.
8 Funding of $0.6 million over three years from 2014-15 for this measure w ill be sourced from existing resources w ithin the National Landcare Programme.
9 Funding of $0.5 million over tw o years from 2014-15 for this measure w ill be sourced from existing resources w ithin the National Landcare Programme.
16 This measure is expected to have no f inancial impact, based on the assumption that at least 435GL of Sustainable Diversion Limit (SDL) Adjustments are achieved from supply measures. The risk that the task to bridge the gap to the SDLs may not be achieved w ithin existing resources is included in the Statement of Risks in Budget Paper No. 1.
11 Funding of $1.5 million in 2014-15 w ill be appropriated to the Department of the Treasury under Federal Financial Relations arrangements to deliver programme funding to the Tasmanian Government for Port Arthur as part of the Australian Convict Sites World Heritage Area.
13 Funding of $9.4 million in 2014-15 w ill be directed to maintaining Australia's presence in Antarctica. This measure also includes funding of $45.3 million over four years from 2014-15 for the Australia-Antarctic Airlink and $13.4 million over four years from 2014-15 for logistics support for the Australian Antarctic Programme (ongoing funding for these components has already been included in the provisional budget estimates).
14 This measure includes a reduction in funding allocated to w ater recovery ($168.2 million over tw o years from 2017-18) and infrastructure projects ($239.4 million over five years from 2013-14). The Department w ill be provided w ith an additional $29.1 million over seven years from 2017-18 to support the delivery of the Sustainable Rural Water Use and Infrastructure Programme, w hich now includes all w ater recovery activity. 15 This measure incudes savings of $0.2 million each year from 2018-19 to 2021-22.
12 A provision of $5.0 million in 2014-15 w as included in the Contingency Reserve in the Mid-Year Economic and Fiscal Outlook 2013-14 .

Department of the Environment Budget Statements
Table 1.3 Changes to the Outcome and Programme Structures Since the Last Portfolio Statement
29
NewOutcome 1
Change Description:
Old Statement:
NewOutcome 2
Change Description:
Old Statement:
Conserve, protect and sustainably manage Australia's biodiversity, ecosystems, environment and heritage through research, information management, supporting natural resource management, establishing and managing Commonw ealth Protected areas, and reducing and regulating the use of pollutants and hazardous substances.
Outcome 1 - The conservation and protection of Australia's terrestrial and marine biodiversity and ecosystems through supporting research, developing information, supporting natural resource management, and establishing and managing Commonw ealth protected areas.Outcome 2 - Improved sustainability of Australia's population, communities and environment through coordination and development of sustainable population and communities policies, and the reduction and regulation of w aste, pollutants and hazardous substances. Outcome 5 - Increased protection, aw areness and appreciation of Australia's environment and heritage through regulating matters of national environment signif icance and the identif ication, conservation and celebration of natural, Indigenous and historic places of national and World Heritage signif icance.
Reduce Australia's greenhouse gas emissions, adapt to the impacts of climate change and contribute to the negotiation of an effective global solution to climate change, through developing and implementing a national response to climate change.
New outcome, created for the 2014-15 Budget, supersedes old Outcomes 1, 2 and 5.
New outcome, created for the 2014-15 Budget, supersedes old Outcomes 7.
Outcome 7 - Reduction of Australia's greenhouse gas emissions, adaptation to the impacts of climate change, and contribution tow ards the negotiation of an effective global solution to climate change, through the development and implementation of a national response to climate change.

Department of the Environment Budget Statements
Table 1.3 Changes to the Outcome and Programme Structures Since the Last Portfolio Statement (continued)
30
NewOutcome 4
Change Description:
Old Statement:
Programme Changes
Programme No.
Programme Title Change Description
1.2 Environmental Information and Research
New programme includes old programme 2.2
1.4 Conservation of Australia's Heritage and the Environment
PBS programme reference amended from 5.1
1.5 Environmental Regulation PBS programme reference amended from 5.2
1.6 Management of Hazardous Wastes, Substances and Pollutants
PBS programme reference amended from 2.1
2.1 Reducing Australia's Greenhouse Gas Emissions
PBS programme reference amended from 7.1
2.2 Adapting to Climate Change PBS programme reference amended from 7.2
4.2 Commonw ealth Environmental Water PBS programme reference amended from 6.1
Outcome 4 - Adaptation to climate change, w ise w ater use, secure w ater supplies and improved health of rivers, w aterw ays and freshw ater ecosystems by supporting research, and reforming the management and the use of w ater resources. Outcome 6 - Protection and restoration of environmental assets through the management and use of Commonw ealth environmental w ater.
New outcome, created for the 2014-15 Budget, supersedes old Outcomes 4 and 6.
Improve the health of rivers and freshw ater ecosystems and w ater use eff iciency through implementing w ater reforms, and ensuring enhanced sustainability, eff iciency and productivity in the management and use of w ater resources.

Department of the Environment Budget Statements
SECTION 2: OUTCOMES AND PLANNED PERFORMANCE
2.1 OUTCOMES AND PERFORMANCE INFORMATION
Government outcomes are the intended results, impacts or consequences of actions by the Government on the Australian community. Australian Government programmes are the primary vehicle by which Government agencies achieve the intended results of their outcome statements. Agencies are required to identify the programmes which contribute to Government outcomes over the Budget and forward years.
Each outcome is described below together with its related programmes, specifying the performance indicators and targets used to assess and monitor the performance of the Department of the Environment in achieving Government outcomes.
Outcome 1: Conserve, protect and sustainably manage Australia’s biodiversity, ecosystems, environment and heritage through research, information management, supporting natural resource management, establishing and managing Commonwealth Protected areas, and reducing and regulating the use of pollutants and hazardous substances.
Outcome 1 StrategyThe Department contributes to the objectives of the Government’s Plan for a Cleaner Environment through the delivery of policies, programmes, information and research that enable the conservation, protection and sustainable management of Australia’s natural environment and heritage places. Outcome 1 delivers this through six programmes:
• Sustainable Management of Natural Resources and the Environment
• Environmental Information and Research
• Carbon Pollution Reduction - Land Sector Initiatives
• Conservation of Australia's Heritage and the Environment
• Environmental Regulation
• Management of Hazardous Wastes, Substances and Pollutants
A key aspect of the Department’s responsibilities is the administration of the Environment Protection and Biodiversity Conservation Act 1999 (EPBC Act). The Department is supporting the Government’s commitment to regulatory reform, to simplify environmental approvals, cut duplication and end delays, by working with the States and Territories to create a ‘one-stop shop’ for environmental approvals.
The Department has responsibility for delivering the new Green Army Programme that will commence from July 2014. The Green Army will become Australia’s largest-ever environmental workforce, building to 15,000 participants by 2018. The Green
31

Department of the Environment Budget Statements
Army will make a real difference to the environment and local communities through projects such as restoring and protecting habitat, weeding, planting, cleaning up creeks and rivers and restoring cultural heritage places.
The Green Army Programme will be delivered by qualified service providers to engage participants aged 17 – 24 years to undertake environment and heritage conservation projects that generate real benefits for local communities. Participants will receive an allowance and be provided with opportunities to gain practical experience, training and qualifications in environmental and heritage conservation fields.
The Green Army Programme will support 250 projects in 2014-15, 500 projects in 2015-16 and 750 projects in 2016-17, with each project involving one Green Army team of up to nine participants and one qualified team supervisor. Green Army Teams will be deployed across the country and work with groups such as local councils, Indigenous and community groups, local catchment and natural resource management organisations to support achievement of priority conservation outcomes.
The Department will also administer the 20 Million Trees programme, which will fund the establishment of an additional 20 million trees and associated understorey species by 2020, on both public and private land. The programme will support local environment outcomes, re-establish green corridors and urban forests, support land productivity, provide habitat for threatened species, and contribute to Australia’s greenhouse gas abatement. The programme will engage closely with local Landcare, Indigenous and other community groups and complement other initiatives, including the Green Army, and Coastal River Recovery Initiatives.
The implementation of the Reef 2050 Long-term Sustainability Plan will guide sustainable management of the Great Barrier Reef, by providing a long term strategic approach to address key threats that it faces. This plan will draw together the outcomes of the Great Barrier Reef comprehensive strategic assessment to provide an overarching framework to guide the protection and management of the reef to 2050. The Reef Trust will be a key mechanism for delivering the Reef 2050 Long-term Sustainability Plan and will focus on improving coastal habitat, water quality and enhancing species protection.
Implementation of the National Landcare Programme, in partnership with the Departments of Agriculture and the Prime Minister and Cabinet, will support the Government’s commitment to deliver practical environmental outcomes. This programme will achieve environmental outcomes based on simple, local and long term principles through direct action and community participation. This approach includes a suite of new targeted environmental sub-programmes including the Cumberland Conservation Corridor Programme; Coastal River Recovery Initiatives; the Dandenong Ranges Wildlife Recovery, Weed Management and Fuel Reduction Programme; Whale and Dolphin Protection Plan; Keep Australia Beautiful and Clean up Australia; and the Kimberley Cane Toad Clean Up, which will further support the Government’s
32

Department of the Environment Budget Statements
investment in the sustainable management of natural resources and environmental achievements.
In 2014-15 the Government will continue to support the conservation, protection and promotion of Australia’s heritage places to ensure they are protected for future generations. The new Community Heritage and Icons programme will support community heritage and historical groups to preserve, protect and celebrate our local heritage. New funding provided for the World Heritage-listed Port Arthur penitentiary will provide for urgent conservation work to take place.
Outcome Expense Statement
Table 2.1 provides an overview of the total expenses for outcome 1, by programme.
Table 2.1: Budgeted Expenses for Outcome 1Note: Departmental appropriation splits and totals are indicative estimates and may change during the course of the Budget year as government priorities change.
33
2013-14 2014-15Estimated Estimated
actual expensesexpenses
$'000 $'000
Programme 1.1: Sustainable Management of Natural Resources and the EnvironmentAdministered expenses
Ordinary annual services (Appropriation Bill No. 1) 303,233 331,448 Less Special Accounts (262,541) (251,775)
Special AccountsNatural Heritage Trust of Australia Account 262,541 251,775
Departmental expensesDepartmental appropriation 1 113,255 106,359
Expenses not requiring appropriation in the Budget year 2 2,798 3,119
Total for Programme 1.1 419,286 440,926
Programme 1.2: Environmental Information and ResearchAdministered expenses
Ordinary annual services (Appropriation Bill No. 1) 46,316 35,520 Departmental expenses
Departmental appropriation 1 15,871 12,576 Expenses not requiring appropriation in the Budget year 2 831 698
Total for Programme 1.2 63,018 48,794
Programme 1.3: Carbon Pollution Reduction – Land Sector InitiativesAdministered expenses
Ordinary annual services (Appropriation Bill No. 1) 145,473 71,313 Departmental expenses
Departmental appropriation 1 9,985 6,693 Expenses not requiring appropriation in the Budget year 2 420 277
Total for Programme 1.3 155,878 78,283
Outcome 1: Conserve, protect and sustainably manage Australia's biodiversity, ecosystems, environment and heritage through research, information management, supporting natural resource management, establishing and managing Commonw ealth Protected areas, and reducing and regulating the use of pollutants and hazardous substances.

Department of the Environment Budget Statements
Table 2.1: Budgeted Expenses for Outcome 1 (continued)
34
2013-14 2014-15Estimated Estimated
actual expensesexpenses
$'000 $'000
Programme 1.4: Conservation of Australia's Heritage and EnvironmentAdministered expenses
Ordinary annual services (Appropriation Bill No. 1) 6,685 5,814 Departmental expenses
Departmental appropriation 1 33,417 25,467 Expenses not requiring appropriation in the Budget year 2 1,446 1,538
Total for Programme 1.4 41,548 32,819
Programme 1.5: Environmental RegulationAdministered expenses
Ordinary annual services (Appropriation Bill No. 1) 751 653 Other services (Appropriation Bill No. 2) 800 120
Departmental expensesDepartmental appropriation 1 64,107 56,932
Expenses not requiring appropriation in the Budget year 2 3,812 3,976 Total for Programme 1.5 69,470 61,681 Programme 1.6: Management of Hazardous Wastes, Substances and PollutantsAdministered expenses
Ordinary annual services (Appropriation Bill No. 1) 3,100 1,228 Special Accounts
Ozone & Synthetic Greenhouse Gas Account 11,933 12,346 Departmental expenses
Departmental appropriation 1 49,922 38,581 Expenses not requiring appropriation in the Budget year 2 1,887 1,737 Total for Programme 1.6 66,842 53,892
Outcome 1: Conserve, protect and sustainably manage Australia's biodiversity, ecosystems, environment and heritage through research, information management, supporting natural resource management, establishing and managing Commonwealth protected areas, and reducing and regulating the use of pollutants and hazardous substances.

Department of the Environment Budget Statements
Table 2.1: Budgeted Expenses for Outcome 1 (continued)
35
2013-14 2014-15Estimated Estimated
actual expensesexpenses
$'000 $'000
Outcome 1 Totals by appropriation typeAdministered Expenses
Ordinary annual services (Appropriation Bill No. 1) 243,017 194,201 Other services (Appropriation Bill No. 2) 800 120 Special Accounts 274,474 264,121
Departmental expensesDepartmental appropriation 1 286,557 246,608
Expenses not requiring appropriation in the Budget year 2 11,194 11,345
Total expenses for Outcome 1 816,042 716,395
2013-14 2014-15Average Staffing Level (number) 3 1,141 1,012
1 Departmental Appropriation combines "Ordinary annual services (Appropriation Bill No.1) " and Revenue from independent sources (s31)". Outcome 1 also has a departmental capital budget of $6.755 million in 2014-15.2 Expenses not requiring appropriation consists of depreciation and amortisation expense, resources received free of charge and other gains. 3 The decrease in ASL from 2013-14 to 2014-15 includes the impact of ASL transferred to the department of the Prime Minister and Cabinet as a result of the Administrative Arrangements Order dated 18 September 2013
Outcome 1: Conserve, protect and sustainably manage Australia's biodiversity, ecosystems, environment and heritage through research, information management, supporting natural resource management, establishing and managing Commonwealth protected areas, and reducing and regulating the use of pollutants and hazardous substances.

Department of the Environment Budget Statements
Contributions to Outcome 1
Programme 1.1: Sustainable Management of Natural Resources and the Environment
Programme ObjectiveGreen Army Programme
• Environmental Conservation: Support the delivery of enduring conservation outcomes at the local, regional and national level.
• Community Engagement: Work cooperatively with community groups, and help raise awareness of environment and heritage values in the community.
• Green Army Participation: Engage and deploy young Australians to participate in Green Army Teams, having highest regard for participant safety, wellbeing and personal need and development.
• Experience, skills and training: Provide participants with opportunities to undertake training recognised under the Australian Qualifications Framework, in areas which increase their skills and qualifications.
20 Million Trees
• Facilitate the establishment of 20 million trees and associated understorey by 2020 to improve the extent, connectivity and condition of native vegetation that supports native species (including threatened species and ecological communities) and contribute to reducing greenhouse gas emissions.
National Landcare Programme
• Provide long-term funding, with simplified application processes, to support local projects that:
– encourage community involvement in caring for the environment, protecting species and natural assets, and managing landscapes to sustain long-term economic and social benefits; and
– support farmers and fishers to increase their long-term returns through better management of the natural resource base.
36

Department of the Environment Budget Statements
Reef 2050
• Provide a long-term strategic approach to address key threats to the Great Barrier Reef through leading the development of the Reef 2050 Long-term Sustainability Plan.
• Establish the Reef Trust to improve coastal habitat, water quality and enhance species protection in the Great Barrier Reef and catchments for the enduring protection and conservation of the Reef’s Outstanding Universal Value.
Other initiatives:
• Manage, protect and enhance our natural assets through:
– finalising our existing natural resource management investments;
– conserving Australia’s biodiversity within our national conservation estate and through the establishment of natural corridors; and
– supporting greater Indigenous participation and engagement in policy and programme design and implementation.
Linked to:
• Department of Agriculture Programme 1.2: Sustainable Management – Natural Resources
• Department of the Prime Minister and Cabinet Programme 2.1: Indigenous Advancement - Jobs, Land and Economy Programme
37

Department of the Environment Budget Statements
Programme ExpensesAdministered programme expenses increase over the forward estimates period due to the spend on Green Army. The increase is net of savings measures announced in the Budget and the transfer of expenditure estimates associated with the Indigenous function, following the Administrative Arrangements Order dated 18 September 2013. The departmental expense profile decreases over the forward estimates period due to savings measures announced since last budget, which include a temporary increase in the efficiency dividend rate.
38
Department of the Environment Budget Statements
39
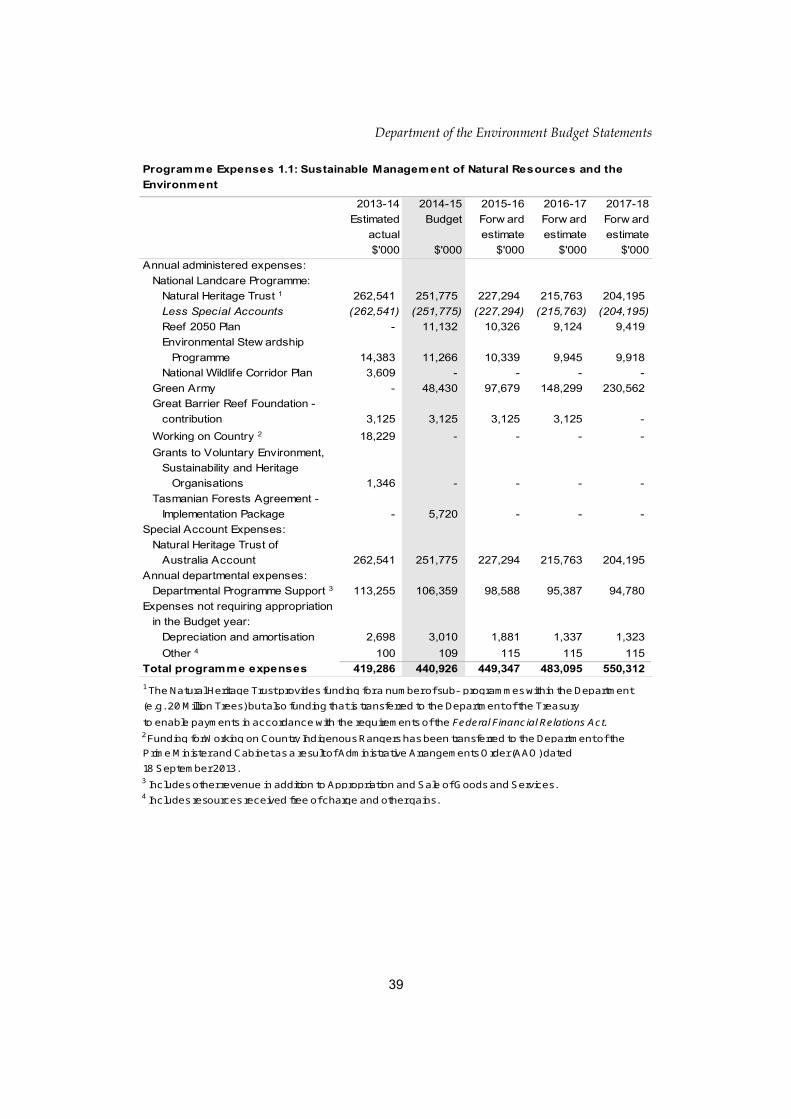
Programme Expenses 1.1: Sustainable Management of Natural Resources and theEnvironment
2013-14 2014-15 2015-16 2016-17 2017-18Estimated Budget Forw ard Forw ard Forw ard
actual estimate estimate estimate$'000 $'000 $'000 $'000 $'000
Annual administered expenses:National Landcare Programme:
Natural Heritage Trust 1 262,541 251,775 227,294 215,763 204,195 Less Special Accounts (262,541) (251,775) (227,294) (215,763) (204,195) Reef 2050 Plan - 11,132 10,326 9,124 9,419 Environmental Stew ardship
Programme 14,383 11,266 10,339 9,945 9,918 National Wildlife Corridor Plan 3,609 - - - -
Green Army - 48,430 97,679 148,299 230,562 Great Barrier Reef Foundation -
contribution 3,125 3,125 3,125 3,125 - Working on Country 2 18,229 - - - - Grants to Voluntary Environment,
Sustainability and Heritage Organisations 1,346 - - - -
Tasmanian Forests Agreement - Implementation Package - 5,720 - - -
Special Account Expenses: Natural Heritage Trust of
Australia Account 262,541 251,775 227,294 215,763 204,195 Annual departmental expenses:
Departmental Programme Support 3 113,255 106,359 98,588 95,387 94,780 Expenses not requiring appropriation
in the Budget year:Depreciation and amortisation 2,698 3,010 1,881 1,337 1,323 Other 4 100 109 115 115 115
Total programme expenses 419,286 440,926 449,347 483,095 550,312 1 The Natural Heritage Trust provides funding for a number of sub- programmes within the Department(e.g. 20 Million Trees) but also funding that is transferred to the Department of the Treasuryto enable payments in accordance with the requirements of the Federal Financial Relations Act.2 Funding for Working on Country Indigenous Rangers has been transferred to the Department of thePrime Minister and Cabinet as a result of Administrative Arrangements Order (AAO) dated 18 September 2013.3 Includes other revenue in addition to Appropriation and Sale of Goods and Services.4 Includes resources received free of charge and other gains.

Department of the Environment Budget Statements
Programme 1.1 DeliverablesGreen Army Programme
• Green Army Programme documentation is reviewed and updated, as required, throughout the 2014-15 financial year.
• Round 2 Green Army Projects are assessed and approved, in line with Australian Government requirements and probity principles by early 2015.
• 250 Green Army Projects commence in the 2014-15 financial year and 2,500 individuals (including Participants and Team Supervisors) are placed in Green Army Teams in the 2014-15 financial year (see quantitative table below for targets over the forward estimates).
20 Million Trees
• Grants for Round 1 are awarded and executed, in line with the Government’s standards and legislative requirements, by November 2014.
• Contract(s) are in place by mid 2015 to deliver large-scale plantings.
National Landcare Programme
• All regional natural resource management organisations are contracted against regional delivery guidelines to deliver programme outcomes by 31 December 2014.
• Programme Monitoring and Reporting Strategy and Performance Management Strategy are released by November 2014.
Reef 2050
• Develop and publish a Reef 2050 Long-term Sustainability Plan by 30 January 2015.
• Establish a Reef Trust and associated delivery arrangements, such as governance arrangements for joint delivery with Queensland Government, by 30 June 2014 and provide funding and support for projects.
Other initiatives:
• Existing projects are progressed as per funding agreements, and project proponents complete data collection using agreed methodologies, which is used to publicly report on program outcomes.
40

Department of the Environment Budget Statements
• Review the Australian Biodiversity Conservation Strategy, along with other national biodiversity conservation strategies, and develop an implementation strategy by June 2015.
• Provide investment and support for the conservation of urban, peri-urban and regional corridors to maintain and enhance connectivity.
41
2013-14 2014-15 2015-16 2016-17 2017-18Estimated Budget Forw ard Forw ard Forw ard
Deliverables actual estimate estimate estimateGreen Army Projects commenced 250 500 750 1,150 Individuals (including Participants and Team Supervisors) placed in Green Army Teams
2,500 5,000 7,500 11,500

Department of the Environment Budget Statements
Programme 1.1 Key Performance Indicators Green Army Programme
• All Green Army Projects address conservation and community priorities, and align with local, regional and/or national plans or strategies.
• 80 per cent of Green Army Participants complete their placement in a Green Army Project.
• 80 per cent of Green Army Participants complete the training agreed in their Participant Agreement.
• 80 per cent of Green Army Participants report a positive experience of the programme.
20 Million Trees
• Projects are in place for establishment of 2 million trees by June 2016.
National Landcare Programme
• By June 2015, all regional natural resource management organisations:
– have commenced activities to increase community engagement in natural resource management and catchment planning; and
– meet their quantitative targets for: protecting species and natural assets; managing environmental and agricultural landscapes; and achieving better management of the natural resource base by farmers and fishers.
Reef 2050
• By December 2014, develop a Reef Trust Investment Strategy and guidance documents, including establishing a mechanism to secure further funding contributions to the Reef Trust.
• By June 2018, in partnership with the Queensland Government and Great Barrier Reef Marine Park Authority, contribute to achieving Reef 2050 and Reef Water Quality Protection Plan 2013 outcomes.
42

Department of the Environment Budget Statements
Programme 1.2: Environmental Information and Research
Programme Objective
• Under the National Environmental Science Programme, improve our understanding of Australia’s environment through collaborative research that delivers accessible results and informs decisions.
• Through the National Plan for Environmental Information initiative, and in collaboration with the Bureau of Meteorology, improve the availability and quality of environmental information.
• Through the Measuring Sustainability Programme, improve awareness of and access to environmental and sustainability information against key national headline indicators.
• Through the Suburban Jobs Programme, support state and local governments to plan for and provide sustainable employment opportunities in rapidly growing suburban locations through the development of purpose-built facilities which provide local business support, training and research.
• Enhance Australia’s capabilities in taxonomy and species discovery through training and mentoring early career researchers, and by disseminating information on the taxonomy and biogeography of Australia’s biota.
• Collaborate in international efforts towards permanently ending all forms of commercial whaling and reforming the International Whaling Commission.
Linked to:
• Programme 2.2: Adapting to Climate Change
• Bureau of Meteorology Programme 1.1: Bureau of Meteorology
43

Department of the Environment Budget Statements
Programme ExpensesThe decrease in administered programme expenses from 2013-14 to 2015-16 is due mainly to the funding profile of the measure announced in the 2011-12 Budget for Sustainable Australia – Suburban Jobs. Departmental expenses are impacted by the savings measures announced since last budget, which include a temporary increase in the efficiency dividend rate.
44
Programme Expenses 1.2: Environmental Information and Research
2013-14 2014-15 2015-16 2016-17 2017-18Estimated Budget Forw ard Forw ard Forw ard
actual estimate estimate estimate$'000 $'000 $'000 $'000 $'000
Annual administered expenses:National Environmental Research
Programme 20,520 - - - - National Environmental Science Programme - 23,754 27,254 25,520 25,520 International Whale Science Initiative 1,688 1,000 - - - Australian Biological Resources Study 2,030 2,030 2,030 2,030 2,030 Sustainable Australia - Suburban Jobs 22,078 8,736 - - -
Annual departmental expenses:Departmental Programme Support 1 15,871 12,576 9,995 9,643 10,485
Expenses not requiring appropriationin the Budget year:
Depreciation and amortisation 806 673 320 244 241 Other 2 25 25 20 20 20
Total programme expenses 63,018 48,794 39,619 37,457 38,296 1 Includes other revenue in addition to Appropriation and Sale of Goods and Services.2 Includes resources received free of charge and other gains.

Department of the Environment Budget Statements
Programme 1.2 Deliverables
• Establish implementation arrangements for the National Environmental Science Programme, including release of programme guidelines by December 2014 and commencement of funding for new research addressing national priorities by 30 June 2015.
• Finalise existing programmes of research activity funded under the National Environmental Research Programme and make findings publicly available by 30 June 2015.
• In collaboration with the Bureau of Meteorology, develop a collaborative approach with Australian Government data holders to progress the discovery, access and reuse of datasets for priority environmental information.
• Refine and populate headline environmental indicators with key national datasets by December 2015.
• Acquit Suburban Jobs Programme funding, pending completion of milestones for the three purpose-built facilities funded under the programme in Penrith (NSW), Melton (Victoria) and Playford (South Australia), and publish key programme findings by 31 December 2015.
• Implement the National Taxonomy Research Grant Programme to support early career researchers and provide authoritative taxonomic and nomenclatural information on Australia’s biota.
• Continue collaboration with like-minded countries to promote whale conservation, including by improving the International Whaling Commission through conservation and governance reform initiatives.
• Deliver the final phase of the International Whale and Marine Mammal Conservation Initiative by 30 June 2015.
45

Department of the Environment Budget Statements
Programme 1.2 Key Performance Indicators
• Biennial qualitative assessment shows that departmental staff, state governments, business, community groups and others are using research outputs from the National Environmental Science Programme to inform policy development.
• Stakeholders make an increasing number of environmental datasets discoverable, accessible and reusable through the National Plan for Environmental Information initiative.
• Demonstrated use and provision of information against headline environmental indicators through public reporting under the Measuring Sustainability Programme.
• Suburban Jobs Programme project proponents provide regular and accurate milestone reports that demonstrate by 30 June 2015:
– an increase in demand for information about their projects from state and local governments;
– an increase in enquiries about business incubator leases and office space tenancies; and
– continued engagement with stakeholders.
• Policy and technical advice, and collaborative activities to further Australia’s international whale conservation objectives are effective, appropriate and timely.
46
2013-14 2014-15 2015-16 2016-17 2017-18Key Performance Estimated Budget Forw ard Forw ard Forw ard
Indicators actual estimate estimate estimateNumber of early career researchers trained in taxonomy and species discovery through Australian Biological Resources Study (ABRS)
64 64 64 64 64
Taxa revised or new ly described under the ABRS
200 200 200 200 200

Department of the Environment Budget Statements
Programme 1.3: Carbon Pollution Reduction – Land Sector Initiatives
Programme Objective
• Support regional natural resource management organisations to improve biodiversity and sequester carbon, while optimising environmental and economic co-benefits.
• Improve the condition and extent of native vegetation through progressing projects that establish, restore and/or protect biodiverse carbon stores.
Linked to:
• Programme 1.1: Sustainable Management of Natural Resources and the Environment
• Programme 2.1: Reducing Australia’s Greenhouse Gas Emissions
• Department of Agriculture Programme 1.1 – Agricultural Adaptation
47

Department of the Environment Budget Statements
Programme ExpensesThe programme expense profile reflects the measures announced since last Budget, which include the reduction and termination of spending associated with the Repeal of the Carbon Tax. Programme expense estimates were also adjusted for the transfer of the Indigenous function to the Department of the Prime Minister and Cabinet in the Administrative Arrangements Order dated 18 September 2013.
48
Programme Expenses 1.3: Carbon Pollution Reduction – Land Sector Initiatives
2013-14 2014-15 2015-16 2016-17 2017-18Estimated Budget Forw ard Forw ard Forw ard
actual estimate estimate estimate$'000 $'000 $'000 $'000 $'000
Annual administered expenses:Biodiversity Fund 1 126,018 70,167 56,965 42,423 1,997 Regional NRM Planning for Climate
Change 18,000 1,146 1,245 - - Indigenous Carbon Farming Fund 2 1,455 - - - -
Annual departmental expenses:Departmental Programme Support 3 9,985 6,693 6,189 5,138 5,018
Expenses not requiring appropriationin the Budget year:
Depreciation and amortisation 405 267 157 119 118 Other 4 15 10 10 10 10
Total programme expenses 155,878 78,283 64,566 47,690 7,143 1 Working on Country Supplementation, paid from the Biodiversity Fund, was transferred to the Departmentof the Prime Minister and Cabinet as a result of Administrative Arrangements Order (AAO) dated 18 September 2013.2 Indigenous Carbon Farming Fund was transferred to the Department of the Prime Minister and Cabinetas a result of Administrative Arrangements Order (AAO) dated 18 September 2013.3 Includes other revenue in addition to Appropriation and Sale of Goods and Services.4 Includes resources received free of charge and other gains.

Department of the Environment Budget Statements
Programme 1.3 Deliverables • Acquit funding to regional natural resource management organisations to update
existing regional natural resource management plans.
• Biodiversity Fund projects are progressed as per funding agreements, and project proponents complete data collection using agreed methodologies, which is used to publicly report on programme outcomes.
49

Department of the Environment Budget Statements
Programme 1.3 Key Performance Indicators • All contracted regional natural resource management organisations provide draft
updated regional natural resource management plans by December 2014 that address the programme principles.
• An increase in condition1 and extent of native vegetation in project areas (from baseline reported at July 2014) July 2015.
1 Measured by the following relevant methodologies: Biodiversity Fund Ecological Monitoring Guide; Habitat Hectares; BioMetric; Terrestrial Biodiversity Tool; BioCondition; TasVeg Tasmanian Vegetation Assessment Method; Bushland Condition Monitoring; or Native Vegetation Condition Assessment & Monitoring for WA.
50

Department of the Environment Budget Statements
Programme 1.4: Conservation of Australia’s Heritage and the Environment
Programme Objective
• Provide national and international leadership in conserving and protecting natural, Indigenous and historic heritage places by:
– administering national laws to identify, list and protect places of value, and enhancing community involvement with and appreciation of these places; and
– meeting obligations under international agreements regarding heritage matters.
• Value and protect our unique biodiversity by:
– identifying nationally-listed species and ecological communities, and supporting their protection;
– regulating wildlife trade (imports and exports) to protect Australia’s biodiversity and exotic wildlife potentially threatened by international trade;
– meeting obligations under international agreements regarding migratory species, wildlife trade and biodiversity conservation; and
– identifying threats to biodiversity and supporting efforts to mitigate those threats.
Linked to:
• Programme 1.5: Environmental Regulation
51

Department of the Environment Budget Statements
Programme ExpensesThe programme expense profile reflects the transfer of estimates associated with the Indigenous function following the Administrative Arrangements Order dated 18 September 2013, and the savings measures announced since last Budget, which include a temporary increase in the efficiency dividend rate also impact the departmental expense profile.
52
Programme Expenses 1.4: Conservation of Australia's Heritage and Environment
2013-14 2014-15 2015-16 2016-17 2017-18Estimated Budget Forw ard Forw ard Forw ard
actual estimate estimate estimate$'000 $'000 $'000 $'000 $'000
Annual administered expenses:Heritage Grants 4,420 4,420 4,420 4,420 4,420 National Trusts Partnership Programme 927 927 927 927 927 Indigenous Heritage Programme 1 988 - - - - Replica of Maw son's Hut 350 - - - - Community Heritage and Icons Grants ProgrammeProgramme - 467 467 467 -
Annual departmental expenses:Departmental Programme Support 2 33,417 25,467 22,742 21,355 29,368
Expenses not requiring appropriation inthe Budget year:
Depreciation and amortisation 1,400 1,497 1,056 965 955 Other 3 46 41 41 46 46
Total programme expenses 41,548 32,819 29,653 28,180 35,716 1. Indigenous Heritage Programme was transferred to the Department of the Prime Minister and Cabinetas a result of Administrative Arrangements Order (AAO) dated 18 September 2013.2 Includes other revenue in addition to Appropriation and Sale of Goods and Services.3 Includes resources received free of charge, other gains and impairment of financial assets.

Department of the Environment Budget Statements
Programme 1.4 Deliverables
• Identify places of special value in Australia for assessment and inclusion on the World and National Heritage Lists, and support the protection of such places, including finalising all outstanding national heritage assessments by 30 June 2015.
• Release the Australian Heritage Strategy, a strategic framework which identifies the Australian Government’s leadership role in and commitments to heritage conservation, by 31 July 2014.
• Deliver targeted funding under the Community Heritage and Icons Programme to support the protection and interpretation of the values of Australia’s significant historic, Indigenous and natural places by 30 June 2015.
• Deliver funding for restoration work at Port Arthur’s World Heritage listed penitentiary building by 30 June 2015.
• Support the protection of the Owen Stanley Ranges, Brown River Catchment and Kokoda Track Region through implementation of the Kokoda Initiative between Australia and Papua New Guinea.
• Identify threatened species and ecological communities for assessment and listing under the EPBC Act, and support their protection through developing and promoting implementation of conservation advices, recovery plans, wildlife management plans and threat abatement plans.
• Finalise terms of reference and appoint a Threatened Species Commissioner by 31 July 2014.
• Regulate wildlife trade (imports and exports) in accordance with the requirements of Part 13A of the EPBC Act, and commercial fisheries in accordance with Parts 10, 13 and 13A of the EPBC Act.
• Develop and implement a Whale and Dolphin Protection Plan and a Dugong and Turtle Protection Plan by 30 June 2017.
53

Department of the Environment Budget Statements
Programme 1.4 Key Performance Indicators • Heritage and environment conservation regulatory activities and processes are
identified for repeal or simplification to reduce compliance costs for business, not-for-profits and individuals while achieving similar or better conservation outcomes.
• Australia’s interests in international fora on heritage, wildlife and biodiversity matters are represented effectively.
• Australian support through the Kokoda Initiative enables the track to remain open for the trekking season.
• Under the EPBC Act, advice on threatened species and ecological communities, and advice and assessments on management plans and wildlife trade operations meet statutory requirements.
• Conservation advices, recovery plans, wildlife management plans and threat abatement plans are informed by current knowledge and research findings and are publicly available.
• Advice under the EPBC Act, the Aboriginal and Torres Strait Islander Heritage Protection Act 1984 and Historic Shipwrecks Act 1976 meets statutory requirements.
54

Department of the Environment Budget Statements
Programme 1.5: Environmental Regulation
Programme ObjectiveEnvironmental Regulation
• Implement the one stop shop policy for environmental approvals in a manner that delivers greater regulatory efficiency, while maintaining high environmental standards as required under the EPBC Act.
• Support sustainable development outcomes by delivering efficient and effective environmental regulation in relation to matters of national environmental significance consistent with the EPBC Act and the Environment Protection (Sea Dumping) Act 1981 (Sea Dumping Act).
• Contribute to the Australian Government agenda to achieve $1 billion a year of reduced compliance burden on business, not-for-profits and individuals, while maintaining or improving environmental outcomes.
Alligator Rivers Region
• Protect the Alligator Rivers Region from the impacts of uranium mining consistent with the requirements of the Environment Protection (Alligators Rivers Region) Act 1978.
• Improved knowledge and understanding of the environmental effects of uranium mining in the Alligator Rivers Region through ongoing scientific research and monitoring.
Linked to:
• Programme 1.1: Sustainable Management of Natural Resources and the Environment
• Programme 1.4: Conservation of Australia’s Heritage and the Environment
• Programme 4.1: Water Reform
55

Department of the Environment Budget Statements
Programme ExpensesProgramme expenses reflect the new measure announced in the 2014-15 Budget and the savings measures announced since last budget, such as the temporary increase in the efficiency dividend rate applied to departmental funding.
Programme Expenses 1.5: Environmental Regulation
2013-14 2014-15 2015-16 2016-17 2017-18Estimated Budget Forw ard Forw ard Forw ard
actual estimate estimate estimate$'000 $'000 $'000 $'000 $'000
Annual administered expenses:Remediation of land affected by the Tiw i
Islands Plantation Project 612 194 194 - - Environment Protection and Biodiversity
Conservation Act - Water ResourcesAmendment 139 259 259 259 259 Orangutan Reintroduction - 200 100 - -
Sustainable Australia - SustainableRegional Development (SPP) 1 800 120 - - -
Annual departmental expenses:Departmental Programme Support 2 64,107 56,932 58,536 57,487 57,075
Expenses not requiring appropriation inthe Budget year:
Depreciation and amortisation 3,715 3,879 3,310 3,056 3,025 Other 3 97 97 102 102 102
Total programme expenses 69,470 61,681 62,501 60,904 60,461 1 For further Sustainable Australia initiatives refer to Program 1.2 in Table 2.1.1.2 Includes other revenue in addition to Appropriation and Sale of Goods and Services.3 Includes resources received free of charge and other gains.
56

Department of the Environment Budget Statements
Programme 1.5 Deliverables Environmental Regulation
• Approval bilateral agreements negotiated with all willing State and Territory governments by 31 December 2014.
• Deliver timely assessment of individual and strategic environmental assessments and approvals under the EPBC Act and Sea Dumping Act.
• Four strategic assessments endorsed under the EPBC Act by 30 June 2015.
• Undertake risk based compliance and enforcement activities to support regulation under the EPBC Act and Sea Dumping Act.
• Finalise three local government grants and all research activities under the Sustainable Regional Development Programme by 30 June 2015.
• Publish a report by February 2015 on regulatory activities that were in place within the Portfolio, as at 3 October 2013.
• Undertake, with the States and Territories, reviews of current activities and future opportunities for the reform of environmental regulation across Australia by March 2015.
• Portfolio regulatory activities are identified for the Spring and Autumn repeal days for repeal or simplification to reduce compliance costs for business, not-for-profits and individuals while achieving similar or better environmental outcomes.
Alligator Rivers Region
• Oversee, and participate in, the regulatory process for uranium mining in the Alligator Rivers Region to ensure regulation is adequate, effective and consistent with Commonwealth environmental requirements.
• Undertake an annual scientific research programme into the environmental impacts of uranium mining to address key knowledge needs and contribute to the development of scientifically rigorous environmental performance criteria for the operational, rehabilitation and closure phases of mining.
• Undertake annual biological, chemical and radiological monitoring programs to ensure the environment remains protected from uranium mining impacts consistent with statutory requirements.
57

Department of the Environment Budget Statements
Programme 1.5 Key Performance IndicatorsEnvironmental Regulation
• States and Territories transparently meet respective obligations under the bilateral approval agreements to maintain high environmental standards for the protection of matters of national environmental significance.
• Demonstrate efficient environmental regulation by undertaking all assessments under the EPBC Act and Sea Dumping Act within statutory timeframes.
• Ensure environmental regulation is effective by reviewing all allegations of non-compliance under the EPBC Act and Sea Dumping Act and investigating as appropriate.
• All new policy initiatives within the Portfolio are supported by a regulation impact statement to cost and offset any potential regulatory burden placed on individuals, businesses and the not for profit sector.
Alligator Rivers Region
• Ensure the concentration of uranium in surface water downstream of Ranger Mine remains less than 6 micrograms per litre.1
• Annual research and monitoring programs are endorsed by the Alligator Rivers Region Technical Committee.2
• Environmental performance criteria for the operational, rehabilitation and closure phases of mining are scientifically sound and commensurate with stakeholder expectations.
1 Given uranium concentrations downstream of Ranger Mine are naturally low, the presence of elevated uranium concentrations is a good indicator of mine discharge effects on water quality. Ecotoxicity assessment by the Supervising Scientist indicates that limiting uranium concentrations downstream of Ranger Mine to less than 6 micrograms per litre will ensure the protection of the aquatic environment.
2 The Alligator Rivers Region Technical Committee independently reviews scientific research and monitoring undertaken by the Supervising Scientist and others into the environmental effects of uranium mining on the Alligator Rivers Region, including Kakadu National Park. The Committee also assists in ensuring that operational and regulatory decision making are based on the best available science.
58

Department of the Environment Budget Statements
Programme 1.6: Management of Hazardous Wastes, Substances and Pollutants
Programme Objective• Improve the quality of the environment and reduce pollution in Australia
through the implementation of national frameworks, standards, regulation, monitoring, and reporting for wastes, hazardous substances, air pollutants, ozone depleting substances and synthetic greenhouse gases.
Linked to:
• Department of Health Programme 7.7: Regulatory Policy
59

Department of the Environment Budget Statements
Programme ExpensesThe variation in programme expenses over the forward estimates is mainly due to the departmental expenditure profile. The profile is impacted by terminating expense measures, the savings measures announced since last Budget, which include the temporary increase in the efficiency dividend rate and variations in indirect support costs.
Programme Expenses 1.6: Management of Hazardous Wastes, Substances and Pollutants
2013-14 2014-15 2015-16 2016-17 2017-18Estimated Budget Forw ard Forw ard Forw ard
actual estimate estimate estimate$'000 $'000 $'000 $'000 $'000
Annual administered expenses:Destruction of SGG and Ozone Depleting
Substances 1,192 - - - - Other 13,841 13,574 13,333 13,333 13,333
Less Special Accounts (11,933) (12,346) (12,804) (12,804) (12,804) Special Account Expenses:
Ozone & Synthetic Greenhouse GasAccount 11,933 12,346 12,804 12,804 12,804
Annual departmental expenses:Departmental Programme Support 1 49,922 38,581 33,456 31,748 35,844
Expenses not requiring appropriation inthe Budget year:
Depreciation and amortisation 1,633 1,488 896 769 762 Other 2 254 249 244 244 244
Total programme expenses 66,842 53,892 47,929 46,094 50,183 1 Includes other revenue in addition to Appropriation and Sale of Goods and Services.2 Includes resources received free of charge and other gains.
60
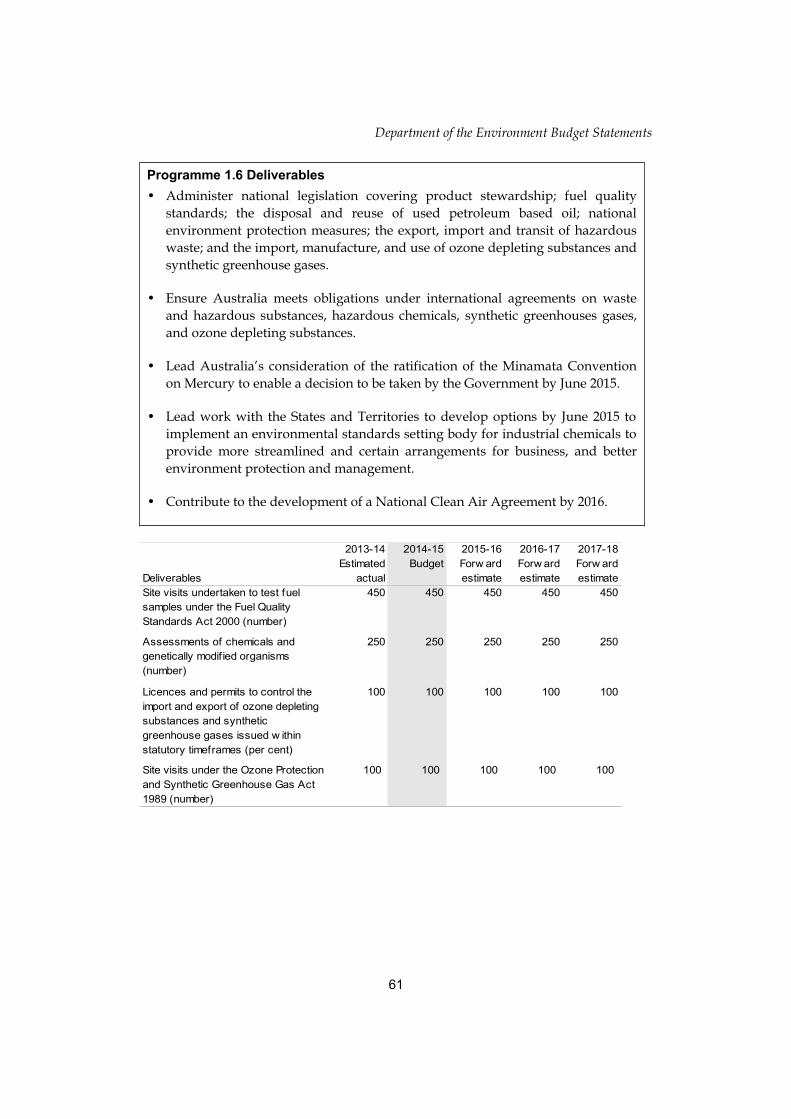
Department of the Environment Budget Statements
Programme 1.6 Deliverables • Administer national legislation covering product stewardship; fuel quality
standards; the disposal and reuse of used petroleum based oil; national environment protection measures; the export, import and transit of hazardous waste; and the import, manufacture, and use of ozone depleting substances and synthetic greenhouse gases.
• Ensure Australia meets obligations under international agreements on waste and hazardous substances, hazardous chemicals, synthetic greenhouses gases, and ozone depleting substances.
• Lead Australia’s consideration of the ratification of the Minamata Convention on Mercury to enable a decision to be taken by the Government by June 2015.
• Lead work with the States and Territories to develop options by June 2015 to implement an environmental standards setting body for industrial chemicals to provide more streamlined and certain arrangements for business, and better environment protection and management.
• Contribute to the development of a National Clean Air Agreement by 2016.
61
2013-14 2014-15 2015-16 2016-17 2017-18Estimated Budget Forw ard Forw ard Forw ard
Deliverables actual estimate estimate estimateSite visits undertaken to test fuel samples under the Fuel Quality Standards Act 2000 (number)
450 450 450 450 450
Assessments of chemicals and genetically modif ied organisms (number)
250 250 250 250 250
Licences and permits to control the import and export of ozone depleting substances and synthetic greenhouse gases issued w ithin statutory timeframes (per cent)
100 100 100 100 100
Site visits under the Ozone Protection and Synthetic Greenhouse Gas Act 1989 (number)
100 100 100 100 100

Department of the Environment Budget Statements
Programme 1.6 Key Performance Indicators • Help keep hazardous substances out of the environment by working with
industry to ensure that 35 per cent of televisions, computers, printers and computer products are collected and recycled by importers and manufacturers in 2014-15.
• Limit the environment impacts of ozone depleting substances by reducing the import quota from 10 Ozone Depleting Potential (ODP) tonnes in 2013-14 to 2.5 ODP tonnes from 1 July 2015.
• Lead the multi-jurisdictional process to finalise the Decision Regulatory Impact Statement for emissions from non-road spark ignition engines and equipment by September 2014.
* Recovering used oil for re-use helps to minimise improper disposal of used oil in the environment.
62
2013-14 2014-15 2015-16 2016-17 2017-18Key Performance Estimated Budget Forw ard Forw ard Forw ard
Indicators actual estimate estimate estimateUsed oil recovered for re-use over a 3 year average under the Product Stewardship (Oil) Act 2000 [megalitres]*
250 250 250 250 250

Department of the Environment Budget Statements
Outcome 2: Reduce Australia’s greenhouse gas emissions, adapt to the impacts of climate change and contribute to the negotiation of an effective global solution to climate change, through developing and implementing a national response to climate change.
Outcome 2 Strategy
The Department contributes to the Government’s Clean Air policy through its work implementing policies and programmes that will reduce Australia’s greenhouse gas emissions and facilitate adaptation to the impacts of climate variability. This strategy is delivered through the following areas of activity:
Achieving Australia’s greenhouse gas emissions reduction targets through mechanisms that drive cost effective emissions reductions, including through implementation of the Government’s Emissions Reduction Fund.
Supporting Australia’s capacity to adapt to a changing climate through well-coordinated climate science, and practical guidance to assist decision makers.
The centrepiece of the Government’s climate change policy, the Emissions Reduction Fund, will help meet Australia’s target of reducing emissions by five per cent below 2000 levels by 2020 and help business and households to reduce energy costs. It will replace the carbon tax, providing a more effective solution to reducing emissions by creating incentives for emissions reductions across the economy and making funding available for business to adopt cleaner technologies. In partnership with the Clean Energy Regulator, the Department will administer the Fund, which will comprise an initial $2.55 billion commitment.
The Emissions Reduction Fund will build on the architecture of the Carbon Farming Initiative. Through the Carbon Farming Initiative the Department will continue to work to enhance abatement opportunities that enable farmers and other landholders to reduce greenhouse gas emissions. Existing land sector and agricultural activities under the Carbon Farming Initiative are well-placed to benefit from the Emissions Reduction Fund as many projects are already underway, and the Emissions Reduction Fund will continue to provide a market for Australian Carbon Credit Units following the repeal of the carbon tax.
The Department will continue to lead delivery of initiatives that support adaptation to climate variability. These initiatives include funding of $9.0 million over three years from 2014-15 that will allow Griffith University to continue hosting the National Climate Change Adaptation Research Facility. The Facility supports better understanding and decision making across key sectors on managing climate risk, maintaining national adaptation research coordination and capacity building in priority areas including human health, settlements and infrastructure, and ecosystems. In addition, an Asia Pacific Rainforest Summit in 2014 will be hosted by the Minister for the Environment. The summit will seek practical solutions to help regional rainforest nations better manage their rainforest estates to maximise environmental, economic and social outcomes.
63

Department of the Environment Budget Statements
Outcome Expense Statement
Table 2.1 provides an overview of the total expenses for outcome 2, by programme.
Table 2.1: Budgeted Expenses for Outcome 2Note: Departmental appropriation splits and totals are indicative estimates and may change during the course of the Budget year as government priorities change.
64
2013-14 2014-15Estimated
actual Estimated expenses
expenses$'000 $'000
Programme 2.1: Reducing Australia's Greenhouse Gas Emissions 1
Administered expensesOrdinary annual services (Appropriation Bill No. 1) 3,098 1,659
Departmental expensesDepartmental appropriation 3 31,079 35,706
Expenses not requiring appropriation in the Budget year 4 11,559 9,680 Total for Programme 2.1 45,736 47,045 Programme 2.2: Adapting to Climate Change 2
Administered expensesOrdinary annual services (Appropriation Bill No. 1) 11,677 4,055
Departmental expensesDepartmental appropriation 3 6,249 6,486
Expenses not requiring appropriation in the Budget year 4 5,650 277 Total for Programme 2.2 23,576 10,818 Administered expenses
Ordinary annual services (Appropriation Bill No. 1) 14,775 5,714 Departmental expenses
Departmental appropriation 3 37,328 42,192 Expenses not requiring appropriation in the Budget year 4 17,209 9,957 Total expenses for Outcome 2 69,312 57,863
2013-14 2014-15Average Staffing Level (number) 5 231 265 1 Reducing Australia's Greenhouse Gas Emissions programme was transferred from the Department of Industry as the result of Administrative Arrangements Order (AAO) dated 18 September 20132 Adapting to Climate Change programme was transferred from the Department of Industry as the result of Administrative Arrangements Order (AAO) changes dated 18 September 2013.3 Departmental Appropriation combines "Ordinary annual services (Appropriation Bill No.1) " and Revenue from independent sources (s31)". Outcome 2 also has a departmental capital budget of $1.613 million in 2014-15.4 Expenses not requiring appropriation consists of depreciation and amortisation expense, resources received free of charge, other gains and approved operating loss. 5 The increase in ASL reflects the attribution of corporate ASL for a full year in 2014-15, compared to a part year for 2013- 14, as responsibility for the domestic climate change function transferred to the department following the Administrative Arrangements Order dated 18 September 2013.
Outcome 2: Reduce Australia's greenhouse gas emissions, adapt to the impacts of climate change and contribute to the negotiation of an effective global solution to climate change, through developing and implementing a national response to climate change.

Department of the Environment Budget Statements
Contributions to Outcome 2
Programme 2.1: Reducing Australia’s Greenhouse Gas Emissions
Programme ObjectiveMeet Australia’s greenhouse gas emissions reduction targets by:
• Reducing emissions through the implementation of the Emissions Reduction Fund.
• Encouraging the uptake of renewable energy through the Renewable Energy Target and targeted policies and programmes.
• Providing incentives to reduce emissions in the land sector through the Carbon Farming Initiative.
• Providing opportunities to reduce and offset emissions through the Carbon Neutral Programme.
Linked to:
• Programme 1.1: Sustainable Management of Natural Resources and the Environment
• Programme 1.3: Carbon Pollution Reduction – Land Sector Initiatives
• Clean Energy Regulator Programme 1.1: Clean Energy Regulator
• Department of Agriculture Programme 1.1 Agricultural Adaptation
65

Department of the Environment Budget Statements
Programme ExpensesProgramme expense variations arise from the allocation of indirect departmental costs and the savings measures announced since last Budget, which include the temporary increase in the efficiency dividend rate. The approved departmental operating losses relate to spending of funding from the Department of Foreign Affairs and Trade (the former AUSAID), which transferred to the Department as prior year appropriation following the Administrative Arrangements Order dated 18 September 2013.
66
Programme Expenses 2.1: Reducing Australia's Greenhouse Gas Emissions
2013-14 2014-15 2015-16 2016-17 2017-18Estimated Budget Forw ard Forw ard Forw ard
actual estimate estimate estimate$'000 $'000 $'000 $'000 $'000
Annual administered expenses:Extending the benef its of the Carbon
Farming initiative 3,025 909 475 428 - Carbon Farming Skills 73 250 - - - Solar Tow ns establishment - 500 1,350 250 -
Annual departmental expenses:Departmental Programme Support 1 31,079 35,706 31,818 30,136 26,055
Expenses not requiring appropriationin the Budget year:
Depreciation and amortisation 1,351 1,945 1,529 1,649 1,632
Approved operating loss2 10,157 7,673 7,247 - -
Other 3 51 62 56 56 56 Total programme expenses 45,736 47,045 42,475 32,519 27,743 1 Includes other revenue in addition to Appropriation and Sale of Goods and Services.2 Funded from prior year appropriation resulting in a departmental operating loss.3 Includes resources received free of charge and other gains.

Department of the Environment Budget Statements
Programme 2.1 Deliverables• Subject to the enactment of the Carbon Tax Repeal legislation, and in
collaboration with the Clean Energy Regulator, Australian Taxation Office, and the Australian Customs and Border Protection Service, implement processes to end the carbon tax and associated programmes by 31 March 2015.
• Support the implementation of the Emissions Reduction Fund from 1 July 2014, following repeal of the carbon tax and subject to the enactment of the Emissions Reduction Fund legislation.
• Following provision of the Renewable Energy Target Review to Government, develop the Government’s response to the Renewable Energy Target Review’s recommendations, including an implementation plan.
• Provide ongoing policy and technical advice to the Minister on:
– emissions reduction policies, including for the land sector;
– renewable energy and the Renewable Energy Target;
– emissions measurement, verification and reporting;
– deregulation opportunities for emissions reduction policies for implementation by 30 June 2015; and
– administrative arrangements to support emissions reduction policies, including governance of the Clean Energy Regulator.
• Provide secretariat support for the Domestic Offsets Integrity Committee and its successor the Emissions Reduction Assurance Committee.
• Review and revise, as appropriate, the National Carbon Offsets Standard by 30 June 2015.
• Provide technical advice to the Department of Foreign Affairs and Trade on land sector and inventory issues to support Australia’s national interests in negotiations towards a post-2020 global climate change agreement.
• Provide annual emissions projections to the Government by 31 December 2014.
• Prepare Australia’s national inventory of emissions for delivery to the United Nations Framework Convention on Climate Change by 15 April 2015.
67

Department of the Environment Budget Statements
Programme 2.1 Key Performance Indicators • The Department effectively supports the Minister to introduce all legislation
required to implement emissions reduction policies in line with the Government’s policies and Parliamentary requirements.
• Policy and technical advice to the Minister is effective in supporting national emissions reduction policies and programmes.
• Australia’s annual emissions are consistent with meeting the Government’s 2020 target to reduce emissions by five per cent based on 2000 levels.
• Carbon Farming Initiative and Emissions Reduction Fund methods cover the majority of national emissions by 30 June 2015.
68

Department of the Environment Budget Statements
Programme 2.2: Adapting to Climate Change
Programme Objective• Contribute to Australia’s capacity for managing climate change impacts through
coordinated adaptation research, information provision and policy support for decision makers.
Linked to:
• Programme 1.2: Environmental Information and Research
• Bureau of Meteorology Programme 1.1: Bureau of Meteorology
• Commonwealth Scientific and Industrial Research Organisation Programme 1.1: National Research Flagships
• Department of Agriculture Programme 1.1: Agricultural Adaptation
69

Department of the Environment Budget Statements
Programme ExpensesVariations in administered expenses primarily relate to the amalgamation of the Australian Climate Change Science Programme into the National Environmental Science Programme from 2014-15 in Programme 1.2. The departmental expense profile is impacted by the allocation of indirect costs and savings measures announced since last Budget, which include the temporary increase in the efficiency dividend rate. The 2013-14 approved departmental operating loss relates to expenditure of funding from the Department of Foreign Affairs and Trade (the former AUSAID), transferred to the Department as prior year appropriation following the Administrative Arrangements Order dated 18 September 2013.
70
Programme Expenses 2.2: Adapting to Climate Change
2013-14 2014-15 2015-16 2016-17 2017-18Estimated Budget Forw ard Forw ard Forw ard
actual estimate estimate estimate$'000 $'000 $'000 $'000 $'000
Annual administered expenses:Climate Change Science Programme 6,116 - - - - Natural resource management
for climate change 5,561 1,250 1,226 - - National Climate Change Adaptation
Research Facility - 2,805 3,266 2,730 - Annual departmental expenses:
Departmental Programme Support 1 6,249 6,486 6,079 5,755 4,906 Expenses not requiring appropriation
in the Budget year:Depreciation and amortisation 270 267 157 119 118 Approved operating loss 2 5,370 - - - - Other 3 10 10 10 10 10
Total programme expenses 23,576 10,818 10,738 8,614 5,034 1 Includes other revenue in addition to Appropriation and Sale of Goods and Services.2 Funded from prior year appropriation resulting in a departmental operating loss.3 Includes resources received free of charge and other gains.

Department of the Environment Budget Statements
Programme 2.2 Deliverables• Provide policy advice and access to information, tools and best practice
guidance on climate risk to adaptation decision makers across government, business and communities.
• Deliver renewed funding and establish governance arrangements for the National Climate Change Adaptation Research Facility to:
– maintain national adaptation research capacity;
– support synthesis and communication of research; and
– facilitate delivery of a national coastal climate risk management framework by 30 June 2017.
• Assist regional Natural Resource Management organisations to manage climate risk by delivering climate projections information by 31 December 2014 and targeted information on climate impacts and adaptation for natural resource management planning by 30 June 2016.
71

Department of the Environment Budget Statements
Programme 2.2 Key Performance Indicators • Adaptation decision-making tools, guidance and information are published on
an appropriate website within two weeks of final clearance.
• National climate change adaptation policy is coordinated effectively across Australian Government agencies, and the Department’s work continues to be influential in adaptation policy forums.
• An independent evaluation of the effectiveness of the National Climate Change Adaptation Research Facility programme will be undertaken by 30 June 2017.
• Information on climate change projections and adaptation approaches is well-targeted to the needs of regional Natural Resource Management organisations and other decision-makers.
72

Department of the Environment Budget Statements
Outcome 3: Advancement of Australia’s strategic, scientific, environmental and economic interests in the Antarctic region by protecting, administering and researching the region.
Outcome 3 StrategyThe Australian Antarctic Division of the Department leads Australia’s Antarctic programme. It pursues the vision of ‘Antarctica – valued, protected and understood’.
In pursuing outcome 3, the primary activities to be undertaken are:
• advancing Australia’s Antarctic interests within the Antarctic Treaty system;
• leading a whole of government approach to Antarctic and sub-Antarctic policy development and implementation;
• administering the Australian Antarctic Territory and Territory of Heard Island and McDonald Islands;
• conducting and facilitating research that is relevant to national policy objectives in high priority areas of Antarctic and Southern Ocean science, particularly climate change, ecosystems, natural resource management and environmental protection;
• supporting Antarctic and sub-Antarctic research by other institutions through grants and logistics support;
• coordinating and managing logistics support for Australia’s Antarctic programme including permanent stations, marine science, field support, transport, communication and medical services; and
• providing a repository and primary source of Australian Antarctic information.
The Government’s 20 Year Australian Antarctic Strategic Plan to guide Australia’s engagement in Antarctica will be released later in 2014.
The Department will continue to maintain and support Australia’s presence in Antarctica with additional funding of $9.3 million provided in the 2014-15 Budget to continue vital operations, including Australian research and expedition activities as well as the operation of the Antarctic and sub-Antarctic stations. Renewed funding is also provided in this Budget for the transport capabilities which enable Australia to deliver scientists to and from the ice.
In support of the key role Australia plays in Antarctica the Government has approved the next steps in the process to procure a new icebreaker to replace the ageing Aurora Australis through a release of a Request for Tender in 2014-15, which is central to
73

Department of the Environment Budget Statements
Australia’s Antarctic operations. This signifies the Government’s investment for the future of Australia’s presence in Antarctica.
Outcome 3 is delivered through one programme – Antarctica: Science, Policy and Presence.
Outcome Expense Statement
Table 2.1 provides an overview of the total expenses for outcome 3, by programme.
Table 2.1: Budgeted Expenses for Outcome 3Note: Departmental appropriation splits and totals are indicative estimates and may change during the course of the Budget year as government priorities change.
74

Department of the Environment Budget Statements
Contributions to Outcome 3
Programme 3.1: Antarctica: Science, Policy and Presence
Programme Objective• Conduct scientific research in Antarctica and the Southern Ocean that supports
national policy and environmental management priorities, in particular taking advantage of the special opportunities the Antarctic offers for globally significant and coordinated research.
• Preserve Australia’s sovereignty over the Australian Antarctic Territory, including our sovereign rights over adjacent offshore areas.
• Protect the Antarctic and the Southern Ocean environment, having regard to its special qualities and effects on our region.
• Contribute to maintaining Antarctica’s freedom from strategic and/or political confrontation.
• Remain informed about, and able to influence, developments in a region geographically proximate to Australia.
• Facilitate the deriving of any reasonable economic benefits from living and non-living resources of the Antarctic and the Southern Ocean (excluding deriving
75
2013-14 2014-15Estimated Estimated
actual expensesexpenses
$'000 $'000Programme 3.1: Antarctica: Science, Policy and PresenceDepartmental expenses
Departmental appropriation 1 136,391 107,752 Expenses not requiring appropriation in the Budget year 2 49,326 49,811
Total for Programme 3.1 185,717 157,563
Outcome 3 Totals by appropriation typeDepartmental expenses
Departmental appropriation 1 136,391 107,752 Expenses not requiring appropriation in the Budget year 2 49,326 49,811
Total expenses for Outcome 3 185,717 157,563
2013-14 2014-15Average Staffing Level (number) 403 403
1 Departmental Appropriation combines "Ordinary annual services (Appropriation Bill No.1) " and Revenue from independent sources (s31)". Outcome 3 also has a departmental capital budget of $14.943 million in 2014-15.2 Expenses not requiring appropriation consists of depreciation and amortisation expense,approved operating loss, resources received free of charge and other gains.
Outcome 3: Advancement of Australia’s strategic, scientific, environmental and economic interests in the Antarctic region by protecting, administering and researching the region.

Department of the Environment Budget Statements
benefits from mining and oil drilling in the Antarctic Treaty area).
76

Department of the Environment Budget Statements
Programme ExpensesVariations in expenses over the forward estimates period primarily relate to movements in departmental receipts and the Antarctica- maintaining Australia’s presence in Antarctica measure.
77
Programme Expenses 3.1: Antarctica: Science, Policy and Presence
2013-14 2014-15 2015-16 2016-17 2017-18Estimated Budget Forw ard Forw ard Forw ard
actual estimate estimate estimate$'000 $'000 $'000 $'000 $'000
Annual departmental expenses:Departmental Programme Support 1 136,391 107,752 91,632 89,757 89,935
Expenses not requiring appropriation inthe Budget year:
Depreciation and amortisation 33,446 33,931 32,783 31,701 31,376 Approved operating loss 15,880 15,880 15,880 15,880 15,880
Total programme expenses 185,717 157,563 140,295 137,338 137,191 1 Includes expenses associated with other revenue in addition to Appropriation and Sale of Goods and Services. This revenue is recognised as contracts for services are confirmed over time, thereby explaining the profile in 2013-14 and the forward years (no forward years contracts have been confirmed at this time).

Department of the Environment Budget Statements
Programme 3.1 Deliverables • Issue and evaluate a Request for Tender for replacement of the Australian
Antarctic Programme icebreaker during 2014-15.
• Deliver high priority Australian Antarctic scientific research in accordance with the goals of the Australian Antarctic Science Strategic Plan 2011-12 to 2020-21.
• Protect the Antarctic environment and undertake work of practical, economic and international significance including compliance with all Australian Antarctic environmental legislation.
• Pursue Australia’s Antarctic policy objectives through participation in the Antarctic Treaty system and related fora.
• Administer the Australian Antarctic Territory and the Territory of Heard Island and McDonald Islands, including the authorisation and management of Australian activities in accordance with relevant legislation and environmental protection measures.
• Maintain three stations in the Australian Antarctic Territory (Casey, Davis and Mawson) and one station in the sub-Antarctic (Macquarie Island).
• Operate a transport and logistics network using shipping and air services to:
– transport expeditioners and cargo between Australia, Antarctica and sub-Antarctic Islands; and
– support scientific research in Antarctica and the Southern Ocean.
78
2013-14 2014-15 2015-16 2016-17 2017-18Estimated Budget Forw ard Forw ard Forw ard
Deliverables actual estimate estimate estimateScientists active in Antarctica, the sub-Antarctic and the Southern Ocean during the f inancial year (number)
80 80 80 80 80
Flights betw een Hobart and Casey stations (number of return f lights)
15 15 15 15 15

Department of the Environment Budget Statements
Programme 3.1 Key Performance Indicators
• Scientific research conducted in Antarctica and the Southern Ocean is internationally recognised, as indicated by:
– the number of scientific papers published in peer reviewed journals and/or submitted to key international fora in the previous calendar year; and
– the number of international institutions collaborating in the Australian Antarctic programme during the financial year.
• Exhibit enhanced Australian influence in the Antarctic Treaty system, including through participation in its various fora, as measured by the extent to which Australia’s objectives are achieved and the number of senior positions (e.g. Chairperson or Vice-Chairperson) held by Australia during the financial year.
• Australia’s Antarctic programme contributes to protecting the Antarctic and the Southern Ocean environment through achieving full compliance with all Australian Antarctic environmental legislation during the financial year.
79
2013-14 2014-15 2015-16 2016-17 2017-18Key Performance Estimated Budget Forw ard Forw ard Forw ard
Indicators actual estimate estimate estimateEnvironmental authorisations assessed relating to tourism (number)
6 6 6 6 6

Department of the Environment Budget Statements
Outcome 4: Improve the health of rivers and freshwater ecosystems and water use efficiency through implementing water reforms, and ensuring enhanced sustainability, efficiency and productivity in the management and use of water resources.
Outcome 4 StrategyThe Department contributes to the Government’s Clean Water Policy through policies and programmes directed at enhancing the sustainability and productivity of water systems and improving their overall health.
A key commitment to achieve this is the implementation of the Murray-Darling Basin Plan in full and on time, restoring the river system to health while ensuring the viability of the Basin’s irrigation industries and communities. This will be advanced through prioritising environmental water recovery through infrastructure investment, and placing a 1,500 gigalitre cap on water buy backs.
The Department will continue to support the statutory Independent Expert Scientific Committee on Coal Seam Gas and Large Coal Mining Development to build an understanding of, and to provide advice to regulators on, the potential water related impacts of coal seam gas and large coal mining development.
Outcome Expense Statement
Table 2.1 provides an overview of the total expenses for outcome 4, by programme.
80

Department of the Environment Budget Statements
Table 2.1: Budgeted Expenses for Outcome 4Note: Departmental appropriation splits and totals are indicative estimates and may change during the course of the Budget year as government priorities change.
81

Department of the Environment Budget Statements
Contributions to Outcome 4
Programme 4.1: Water Reform
82
2013-14 2014-15Estimated Estimated
actual expensesexpenses
$'000 $'000Programme 4.1: Water ReformAdministered expenses
Ordinary annual services (Appropriation Bill No. 1) 228,744 292,975 Other services (Appropriation Bill No. 2) 5,204 5,500 Special Accounts
Water Eff iciency Labelling and Standards Account 1,913 1,948 Services for Other Entities and Trust Monies Special Account 510 510 Water for the Environment Special Account - 15,000
Departmental expensesDepartmental appropriation 1 79,252 78,184
Expenses not requiring appropriation in the Budget year 2 (32,338) 2,635
Total for Programme 4.1 283,285 396,752
Programme 4.2: Commonwealth Environmental WaterAdministered expenses
Ordinary annual services (Appropriation Bill No. 1) 36,774 26,226 Less Special Account (36,774) (26,226)
Special AccountsEnvironmental Water Holdings Special Account 36,774 26,226
Departmental expensesDepartmental appropriation 1 12,129 7,000
Expenses not requiring appropriation in the Budget year 2 560 416
Total for Programme 4.2 49,463 33,642 Outcome 4 Totals by appropriation typeAdministered Expenses
Ordinary annual services (Appropriation Bill No. 1) 228,744 292,975 Other services (Appropriation Bill No. 2) 5,204 5,500 Special Accounts 39,197 43,684
Departmental expensesDepartmental appropriation 1 91,381 85,184
Expenses not requiring appropriation in the Budget year 2 (31,778) 3,051
Total expenses for Outcome 4 332,748 430,394
2013-14 2014-15Average Staffing Level (number) 402 313
1 Departmental Appropriation combines "Ordinary annual services (Appropriation Bill No.1) " and Revenue from independent sources (s31)". Outcome 4 also has a departmental capital budget of $2.040 million in 2014-15.2 Expenses not requiring appropriation consists of depreciation and amortisation expense, resources received free of charge, other gains and reversal of impairment on water entitlements in 2013-14.
Outcome 4: Improve the health of rivers and freshwater ecosystems and water use efficiency through implementing water reforms, and ensuring enhanced sustainability, efficiency and productivity in the management and use of water resources.

Department of the Environment Budget Statements
Programme Objective
Water Policy and Programmes
• Help communities, irrigators and businesses, particularly in the Murray-Darling Basin, use water resources sustainably and efficiently by progressing national water reforms.
• Improve the environmental health of the Murray-Darling Basin by recovering water, through prioritising water-saving infrastructure projects, to ‘bridge the gap’ between the Sustainable Diversion Limits in the Murray-Darling Basin Plan and baseline diversions by 2019.
• Improve the health of rivers, wetlands and freshwater ecosystems by meeting our national and international obligations under the Ramsar Convention.
Water Science
• Ensure public access to scientific evidence that informs regulatory decisions on the potential water related impacts of coal seam gas and coal mining development.
Linked to:
• Programme 4.2: Commonwealth Environmental Water
Programme ExpensesVariations in administered expenses over the forward estimates period reflect the timing of Water Reform projects, the reclassification between appropriation Bills to pay States and Territories in accordance with the Federal Financial Relations Act 2009, and payments from the Water for the Environment Special Account. Measures associated with Water Reform are also terminating over the forward estimates period. The credit to administered expenses in 2013-14, is for the reversal of asset impairment and reflects an increase in the market value of water entitlement assets. Savings measures announced since last Budget and variations in indirect support costs, primarily account for decrease in departmental expenses over the forward estimates period.
83

Department of the Environment Budget Statements
84
Programme Expenses 4.1: Water Reform
2013-14 2014-15 2015-16 2016-17 2017-18Estimated Budget Forw ard Forw ard Forw ard
actual estimate estimate estimate$'000 $'000 $'000 $'000 $'000
Annual administered expenses:Sustainable Rural Water Use and
Infrastructure 1 186,123 244,279 304,065 192,844 199,054 National Urban Water and Desalination
Plan 21,295 26,559 13,860 - - Water Resources Assessment and
Research Grant 175 175 175 175 - Independent Expert Scientif ic Committee
on Coal Seam Gas and LargeCoal Mining 885 885 885 1,035 1,035
Commonw ealth Contribution underthe Murray-Darling Basin Agreement 2 20,266 21,077 22,300 23,100 -
National Urban Water and DesalinationPlan (SPP) 950 5,500 2,100 - -
National Water Security Plan for Citiesand Tow ns (SPP) 4,254 - - - -
Special Account Expenses:Water Eff iciency Labelling and
Standards Account 1,913 1,948 1,963 1,981 1,981 Water for the Environment
Special Account - 15,000 40,000 110,000 430,000 Services for Other Entities and
Trust Moneys Special Account 510 510 510 510 510 Annual departmental expenses:
Departmental Programme Support 3 53,668 52,528 51,412 48,332 31,912 Science Based Framew ork for
Coal Seam Gas and Coal MiningImpacts on Water 25,584 25,656 25,132 11,024 11,216
Expenses not requiring appropriationin the Budget year:
Depreciation and amortisation 2,567 2,538 1,570 1,132 1,120 Other 4 97 97 102 97 97 Asset impairment expense 5 (35,002) - - - -
Total programme expenses 283,285 396,752 464,074 390,230 676,925 1 The funding for Restoring the Balance of the Basin has been absorbed under the Sustainable Rural Water Use and Infrastructure Programme from November 2013.2 The level of funding provided to the Murray-Darling Basin Authority under the MDB Agreementhas been agreed for the years 2012-13 to 2013-14. The contribution for 2014-15 to 2016-17 above is an estimate.3 Includes other revenue in addition to Appropriation and Sale of Goods and Services.4 Includes resources received free of charge and other gains.5 Reversal of impairment on water entitlements for 2013-14.

Department of the Environment Budget Statements
Programme 4.1 Deliverables
Water Policy and Programmes
• Progress national water reform commitments in accordance with the National Water Initiative and the Water Act 2007 (Water Act).
• Deliver the Review of the Water Act to the Parliamentary Secretary within statutory timeframes.
• Implement Murray-Darling Basin reforms in accordance with scheduled timeframes.
• Assist States, Territories and landowners to improve the management of surface and ground freshwater ecosystems, rivers and wetlands, consistent with inter-governmental agreements where applicable.
• Recover water for the environment through investment in infrastructure and water purchases, to ‘bridge the gap’ by 2019 between the Sustainable Diversion Limits included in the Murray-Darling Basin Plan and baseline diversions.
Water Science
• Support the Independent Expert Scientific Committee on Coal Seam Gas and Large Coal Mining Development to provide advice to regulators on the potential water related impacts of coal seam gas and large coal mining development.
• Finalise bioregional assessments for up to 15 subregions by 30 June 2016.
• Complete for publication at least seven research products in 2014-15.
85

Department of the Environment Budget Statements
Programme 4.1 Key Performance Indicators
Water Policy and Programmes
• Policy and technical advice to the Minister on water policies and programmes is timely, effective and accurate.
• The Department’s work supports continued cooperation of Murray-Darling Basin States in implementing agreed Basin reforms.
• Continued water recovery from contracted efficiency measures, water purchases, and state activities towards meeting the Government’s ‘bridge the gap’ commitment.
Water Science
• The Independent Expert Science Committee on Coal Seam Gas and Large Coal Mining Development’s (IESC) advice to regulators on coal seam gas and large coal mining development proposals, as well as bioregional assessment technical products and research products on the water related impacts of coal seam gas and coal mining, are published on the IESC and Department web sites as soon as practicable after final clearance.
86

Department of the Environment Budget Statements
Programme 4.2: Commonwealth Environmental Water
Programme Objective• Protect and restore environmental assets in the Murray-Darling Basin through
the management and use of Commonwealth environmental water.
Linked to:
• Programme 4.1: Water Reform
87

Department of the Environment Budget Statements
Programme ExpensesAdministered expenses for 2013-14 include additional expenses due to a movement of funds and the commencement of trading in Commonwealth water allocations. The variations in departmental expenses reflect the allocation of indirect costs and savings measures announced since last Budget, which include the temporary increase in the efficiency dividend rate.
88
Programme Expenses 4.2: Commonwealth Environmental Water
2013-14 2014-15 2015-16 2016-17 2017-18Estimated Budget Forw ard Forw ard Forw ard
actual estimate estimate estimate$'000 $'000 $'000 $'000 $'000
Annual administered expenses:Commonw ealth Environmental Water
Office 36,774 26,226 28,021 29,160 - Less Special Accounts:
Environmental Water HoldingsSpecial Account (36,774) (26,226) (28,021) (29,160) -
Special Account Expenses:Environmental Water Holdings
Special Account 36,774 26,226 28,021 29,160 - Annual departmental expenses:
Departmental Programme Support 1 12,129 7,000 6,272 5,318 5,161 Expenses not requiring appropriation
in the Budget year:Depreciation and amortisation 540 401 236 179 177 Other 2 20 15 15 15 15
Total programme expenses 49,463 33,642 34,544 34,672 5,353 1 Includes other revenue in addition to Appropriation and Sale of Goods and Services.2 Includes resources received free of charge and other gains.

Department of the Environment Budget Statements
Programme 4.2 Deliverables • Develop and publish annual plans for Commonwealth environmental water use
options for ten planning regions by July 2014.
• Make Commonwealth environmental water available for delivery in response to seasonal conditions, and having regard to the Basin Wide Annual Environmental Watering Priorities.
• Develop and publish quarterly Portfolio Management Statements, including intentions for trade of water.
• Establish long term intervention monitoring at seven selected areas within 2014-15.
• Maintain accurate records of Commonwealth environmental water holdings, use, carryover and trade, and publish updated information monthly on the Commonwealth Environmental Water Office website.
• Engage with local communities and stakeholders and have regard to local experience, knowledge and perspectives when undertaking environmental watering.
89

Department of the Environment Budget Statements
Programme 4.2 Key Performance Indicators • By 30 June 2015, intervention monitoring demonstrates that Commonwealth
environmental water has contributed to survival, reproduction, and condition of water dependent vegetation, fish and waterbirds at selected monitoring sites in the Murray-Darling Basin.
• By 2018-19, intervention monitoring demonstrates that Commonwealth environmental water has contributed to species diversity and population of water dependent vegetation, fish and waterbirds in the Murray-Darling Basin.
• By 2018-19, Commonwealth environmental water has contributed to the achievement of water quality indicators in the Murray-Darling Basin Plan, including for salinity and dissolved oxygen.
• Commonwealth environmental water contributes to the achievement of broader environmental objectives of the Murray-Darling Basin Plan.
90

Department of the Environment Budget Statements
Section 3: Explanatory Tables and Budgeted Financial StatementsSection 3 presents explanatory tables and budgeted financial statements which provide a comprehensive snapshot of agency finances for the 2014-15 Budget year. It explains how budget plans are incorporated into the financial statements and provides further details of the reconciliation between appropriations and programme expenses, movements in administered funds, special accounts and Australian Government Indigenous expenditure.
3.1 EXPLANATORY TABLES
3.1.1 Movement of Administered Funds Between YearsAdministered funds can be provided for a specified period, for example under annual Appropriation Acts. Funds not used in the specified period with the agreement of the Finance Minister may be moved to a future year. Table 3.1.1 shows the movement of administered funds approved between years.
Table 3.1.1: Movement of Administered Funds Between Years1
91
2013-14 2014-15 2015-16 2016-17 2017-18$'000 $'000 $'000 $'000 $'000
Special Account: Outcome 4:
Environmental Water HoldingsSpecial Account 2 8,992 - - - -
Total Movement ofAdministered Funds 8,992 - - - - 1 Figures displayed as negative (-) represent a decrease in funds and positive reflects anincrease in funds.2. The $8.992m represents expense estimates from 2012-13 and the unspent funds are available in the Environmental Water Holdings Special Account to support the increased expenditure in 2013-14.

Department of the Environment Budget Statements
3.1.2 Special AccountsSpecial Accounts provide a means to set aside and record amounts used for specified purposes. Special Accounts can be created by a Finance Minister’s Determination under the FMA Act or under separate enabling legislation. Table 3.1.2 shows the expected additions (receipts) and reductions (payments) for each account used by the Department of the Environment.
Table 3.1.2: Estimates of Special Account Flows and Balances
92
Opening Closingbalance Receipts Payments Adjustments balance2014-15 2014-15 2014-15 2014-15 2014-15
2013-14 2013-14 2013-14 2013-14 2013-14Outcome $'000 $'000 $'000 $'000 $'000
Natural Heritage Trust of 1 421,087 289,119 (251,775) - 458,431 Australia Account (A) 1 386,598 297,030 (262,541) - 421,087
Ozone Protection and SGG 1 18,481 10,481 (12,346) - 16,616 Account (A) 2 20,213 10,201 (11,933) - 18,481
Services for Other Entities and 4 1,034 510 (510) - 1,034 Trust Moneys Special Account (A) 3 1,034 510 (510) - 1,034
Water Efficiency Labelling and 4 2,337 1,960 (1,948) - 2,349 Standards Account (A) 4 2,340 1,910 (1,913) - 2,337
Water for the Environment 4 - 15,000 (15,000) - - Special Account (A) 5 - - - - -
Environmental Water Holdings 4 36,125 29,726 (26,226) - 39,625 Special Account (A) 6 42,217 30,682 (36,774) - 36,125
Total Special Accounts 2014-15 Budget estimate 479,064 346,796 (307,805) - 518,055
Total Special Accounts2013-14 estimated actual 452,402 340,333 (313,671) - 479,064
(A) = Administered1 Natural Heritage Trust of Australia Account - s21 FMA Act [Natural Heritage Trust of Australia Act 1997].2 Ozone Protection and SGG Account - s21 FMA Act [Ozone Protection and Synthetic Greenhouse Gas Management Act 1989].3 Services for Other Entities and Trust Moneys Special Account - s20 FMA Act Det 2010/02.4 Water Efficiency Labelling and Standards Account - s21 FMA Act [Water Efficiency Labelling and Standards Act 2004].5 Water for the Environment Special Account - s21 FMA Act [Water Act 2007 ]. The account is credited by a special appropriation, refer table 1.1.6 Environmental Water Holdings Special Account - s21 FMA Act [Water Act 2007 ].

Department of the Environment Budget Statements
3.1.3 Australian Government Indigenous ExpenditureTable 3.1.3: Australian Government Indigenous Expenditure (AGIE)
93
Outcome Other Total ProgrammeBill Bill Special Total
No. 1 No. 2 approp approp$'000 $'000 $'000 $'000 $'000 $'000
EnvironmentOutcome 1
Administered 2014-15 17,855 - - 17,855 - 17,855 1.1Administered 2013-14 35,484 - - 35,484 - 35,484 1.1Administered 2014-15 - - - - - - 1.3Administered 2013-14 13,168 - - 13,168 - 13,168 1.3Administered 2014-15 - - - - - - 1.4Administered 2013-14 1,096 - - 1,096 - 1,096 1.4Departmental 2014-15 325 325 325 1.1Departmental 2013-14 325 325 325 1.1Departmental 2014-15 - - - 1.4Departmental 2013-14 283 283 283 1.4
Total administered 2014-15 17,855 - - 17,855 - 17,855Total administered 2013-14 49,748 - - 49,748 - 49,748
Total departmental 2014-15 325 - - 325 - 325Total departmental 2013-14 608 - - 608 - 608
Total outcome 2014-15 18,180 - - 18,180 - 18,180Total outcome 2013-14 50,356 - - 50,356 - 50,356
Total AGIE 2014-15 18,180 - - 18,180 - 18,180Total AGIE 2013-14 50,356 - - 50,356 - 50,356
Appropriations

Department of the Environment Budget Statements
3.2 BUDGETED FINANCIAL STATEMENTS
3.2.1 Differences in Agency Resourcing and Financial StatementsThere are no differences between the agency resourcing table 1.1 and financial statements.
3.2.2 Analysis of Budgeted Financial StatementsBudgeted Departmental Comprehensive Income Statement
Changes in appropriation revenue are the net result of new measures announced since the 2013-14 Portfolio Additional Estimates Statements. The new measures encompass expense and saving measures and are outlined in Table 1.2.
Overall, there has been realignment between employee and supplier expense items to better reflect the expected expenditure patterns across the forward estimates and total expenses are not impacted by these changes.
The variations in total expenses compared with the 2013-14 Portfolio Additional Estimates Statements are the net result of new measures, the Department’s 2013-14 redundancy programme, expenditure of prior year appropriation and variations in departmental receipts. The redundancy programme results in a one off increase to expenses in 2013-14 and employee expenses are estimated to decrease for 2014-15 and forward years. The expenditure of prior year appropriation is supported by an approval from the Finance Minister to increase the Department’s operating loss for 2013-14 to 2015-16 and the expenditure relates to functions gained under the Administrative Arrangements Order dated 18 September 2013. The variations in expenditure associated with departmental receipts primarily reflect new measures and changes in activity across the outcomes.
The transfer funding line item in the statements represents the funding provided to the Director of National Parks, and is reported separately to ensure consistency between Portfolio Budget Statement reporting and Financial Statement reporting in the Annual Report.
Expenses not requiring appropriation primarily account for the Department’s operating loss and result from maintaining a make-good provision for the Antarctic and depreciation and amortisation on the Department’s asset base.
Budgeted Departmental Balance Sheet
Changes in the departmental balance sheet since the 2013-14 Portfolio Additional Estimates Statements primarily impact balances for receivables and employee provisions. The receivables balance has decreased by the draw-down of prior year appropriation to fund expenditure associated with the additional operating losses for 2013-14 to 2015-16, and the reduction in employee provisions due to the 2013-14
94

Department of the Environment Budget Statements
redundancy programme. The Department has an obligation to pay accumulated leave entitlements when an employee separates from the Australian Public Service. Receivable and employee provision balances also transferred from the Department to the Department of the Prime Minister and Cabinet, in response to the Machinery of Government changes announced in the Administrative Arrangements Order dated 18 September 2013.
Further to the above, the increase in make good provisions over the forward estimates relates to the obligation the Department is required to recognise for the removal and site restoration of buildings and infrastructure located in Antarctica and on sub-Antarctic Macquarie Island and to remediate past waste disposal sites and areas of ground contamination for which the Commonwealth is responsible. These make good provisions are calculated using a net present value methodology. This requires that each year the provision be increased by the value of unwinding a discount on the future value of the provisions. This increase results in liabilities that are not covered by assets for the Department. Funding will not be provided to the Department until such time as payments are required to be made, which is beyond the forward estimates.
Schedule of Budgeted Income and Expenses Administered on Behalf of Government
Administered income has increased since the 2013-14 Portfolio Additional Estimates Statements as estimates variations have been recognised for:
The refund of goods and services tax from the Australian Taxation Office in relation to grant payments made in prior financial years;
Gains arising from the receipt of water entitlement assets from State and Territory Governments for no consideration in accordance with relevant National Partnership Agreements for Water Reform Programme projects;
The sale of water allocations by the Commonwealth Environmental Water Holder, which commenced in 2013-14.
The decrease in administered expenses is the net result of the following:
New measures announced since the 2013-14 Portfolio Additional Estimates Statements. The new measures encompass both expense and savings measures and are outlined in Table 1.2.
The transfer of administered funding to the Department of the Treasury Council of Australian Governments Reform Fund to provide for payments to be made under the Federal Financial Relations Act 2009 for the Water Reform programme;
Transfer of administered funding as a result of the Machinery of Government changes relating to Indigenous functions;
95

Department of the Environment Budget Statements
The reversal of asset impairment in 2013-14, following an increase in the market value of water entitlement assets.
Schedule of Budgeted Assets and Liabilities Administered on Behalf of Government
There are no significant movements in asset and liability balances since the 2013-14 Portfolio Additional Estimates Statements.
96

Department of the Environment Budget Statements
3.2.3 Budgeted Financial Statements TablesTable 3.2.1 Comprehensive Income Statement (Showing Net Cost of Services) for the period ended 30 June
97

Department of the Environment Budget Statements
Table 3.2.1: Comprehensive Income Statement (Showing Net Cost of Services) for the period ended 30 June (continued)
98
Estimated Budget Forw ard Forw ard Forw ardactual estimate estimate estimate estimate
2013-14 2014-15 2015-16 2016-17 2017-18$'000 $'000 $'000 $'000 $'000
EXPENSESEmployee benefits 273,557 245,559 236,789 223,104 226,541 Suppliers 240,374 196,264 165,229 141,900 131,556 Grants 12,045 6,840 6,801 6,227 3,599 Transfer funding 41,497 41,061 40,594 40,164 40,374 Depreciation and amortisation 48,831 49,896 43,895 41,270 40,847 Finance costs 15,880 15,880 15,880 15,880 15,880 Other 426 400 400 400 400 Total expenses 632,610 555,900 509,588 468,945 459,197
LESS: OWN-SOURCE INCOMEOwn-source revenueSale of goods and rendering of services
77,165 60,770 46,624 43,390 41,096 Other 11,923 - 1,287 1,233 - Total own-source revenue 89,088 60,770 47,911 44,623 41,096
GainsOther 715 715 715 715 715 Total gains 715 715 715 715 715 Total own-source income 89,803 61,485 48,626 45,338 41,811
Net cost of (contribution by)services 542,807 494,415 460,962 423,607 417,386
Revenue from Government 462,569 420,966 393,940 366,457 360,659
Surplus (Deficit) attributable tothe Australian Government (80,238) (73,449) (67,022) (57,150) (56,727)
OTHER COMPREHENSIVE INCOMEChanges in asset revaluation reserves - - - - -
Total other comprehensive income - - - - - Total comprehensive income (loss) (80,238) (73,449) (67,022) (57,150) (56,727)
Total comprehensive income (loss)attributable to the Australian
Government (80,238) (73,449) (67,022) (57,150) (56,727)

Department of the Environment Budget Statements
99
Note: Impact of Net Cash Appropriation Arrangements2013-14 2014-15 2015-16 2016-17 2017-18
$'000 $'000 $'000 $'000 $'000Total Comprehensive Income
(loss) less depreciation/amortisationexpenses previously funded through
revenue appropriations (31,407) (23,553) (23,127) (15,880) (15,880)
plus depreciation/amortisation expensespreviously funded through revenue
appropriations 1 48,831 49,896 43,895 41,270 40,847
Total Comprehensive Income(loss) - as per the Statement of
Comprehensive Income (80,238) (73,449) (67,022) (57,150) (56,727)
Prepared on Australian Accounting Standards basis.1 From 2010-11, the Government introduced net cash appropriation arrangements w hereAppropriation Act No.1 or Bill No. 3 revenue appropriations for the depreciation/amortisation expenses of FMA Act agencies w ere replaced w ith a separate capital budget (the DepartmentalCapital Budget, or DCB) provided through Appropriation Act No. 1 or Bill No. 3 equity appropriations. For information regarding DCBs, please refer to Table 3.2.5 Departmental Capital Budget Statement.

Department of the Environment Budget Statements
Table 3.2.2: Budgeted Departmental Balance Sheet (as at 30 June)
100
Estimated Budget Forw ard Forw ard Forw ardactual estimate estimate estimate estimate
2013-14 2014-15 2015-16 2016-17 2017-18$'000 $'000 $'000 $'000 $'000
ASSETSFinancial assets
Cash and equivalents 5,651 5,651 5,651 5,651 5,651 Trade and other receivables 102,317 94,644 87,397 87,397 87,397 Accrued revenue 4,738 4,738 4,738 4,738 4,738
Total financial assets 112,706 105,033 97,786 97,786 97,786
Non-financial assetsLand and buildings 242,942 231,080 220,347 210,352 200,460 Property, plant and equipment 102,930 91,668 83,291 75,007 67,015 Intangibles 35,923 37,947 38,993 42,006 44,696 Inventories 8,078 8,078 8,078 8,078 8,078 Other non - financial assets 1,921 1,921 1,921 1,921 1,921
Total non-financial assets 391,794 370,694 352,630 337,364 322,170 Total assets 504,500 475,727 450,416 435,150 419,956
LIABILITIESPayables
Suppliers 22,266 22,266 22,266 22,266 22,266 Grants 154 154 154 154 154 Other payables 13,143 13,143 13,143 13,143 13,143
Total payables 35,563 35,563 35,563 35,563 35,563
Interest bearing liabilitiesLeases 2,623 2,623 2,623 2,623 2,623
Total interest bearing liabil ities 2,623 2,623 2,623 2,623 2,623
ProvisionsEmployee provisions 79,036 79,036 79,036 79,036 79,036 Antarctic make good provisions 1 416,023 431,903 447,783 463,663 479,543 Other provisions 6,106 6,106 6,106 6,106 6,106
Total provisions 501,165 517,045 532,925 548,805 564,685 Total liabilities 539,351 555,231 571,111 586,991 602,871
Net assets/(liabilities) 1 (34,851) (79,504) (120,695) (151,841) (182,915)

Department of the Environment Budget Statements
Table 3.2.2: Budgeted Departmental Balance Sheet (as at 30 June) (continued)
101
Estimated Budget Forw ard Forw ard Forw ardactual estimate estimate estimate estimate
2013-14 2014-15 2015-16 2016-17 2017-18$'000 $'000 $'000 $'000 $'000
EQUITYParent entity interest
Contributed equity 118,050 146,846 172,677 198,681 224,334 Reserves 302,223 302,223 302,223 302,223 302,223 Retained surplus
(accumulated deficit) (455,124) (528,573) (595,595) (652,745) (709,472) Total parent entity interest (34,851) (79,504) (120,695) (151,841) (182,915) Total equity (34,851) (79,504) (120,695) (151,841) (182,915)
Prepared on Australian Accounting Standards basis.1 The department has a "make good" obligation for: the removal and site restoration of buildingsand infrastructure located in Antarctica and on sub-Antarctic Macquarie Island; and remediationof past waste disposal sites and areas of ground contamination in Antarctica for which Australiais responsible. These make good provisions are calculated using a net present value methodology.This requires that each year the provision increases by the value of unwinding a discount onthe future value of the provisions. This increase results in liabilities that are not covered by assetsfor the department. Funding will not be provided to the department until such time aspayments are required to be made, which is beyond the forward estimates.

Department of the Environment Budget Statements
Table 3.2.3: Departmental Statement of Changes in Equity — Summary of Movement (Budget Year 2014-15)
Prepared on Australian Accounting Standards basis.
102
Retained Asset Contributed Totalearnings revaluation equity/ equity
reserve capital$'000 $'000 $'000 $'000
Opening balance as at 1 July 2014Balance carried forw ard from
previous period (455,124) 302,223 118,050 (34,851) Adjusted opening balance (455,124) 302,223 118,050 (34,851)
Comprehensive income
Surplus (def icit) for the period (73,449) - - (73,449)
Total comprehensive income (73,449) - - (73,449) of w hich:
Attributable to the Australian Government (73,449) - - (73,449) Transactions with owners
Contributions by ownersEquity Injection - Appropriation - - 3,445 3,445 Departmental Capital Budget (DCB) - - 25,351 25,351
Sub-total transactions with owners - - 28,796 28,796
Estimated closing balanceas at 30 June 2015 (528,573) 302,223 146,846 (79,504) Less: non-controlling interests
Closing balance attributable to the Australian Government (528,573) 302,223 146,846 (79,504)

Department of the Environment Budget Statements
Table 3.2.4: Budgeted Departmental Statement of Cash Flows(for the period ended 30 June)
103

Department of the Environment Budget Statements
Table 3.2.5: Departmental Capital Budget Statement
104
Estimated Budget Forw ard Forw ard Forw ardactual estimate estimate estimate estimate
2013-14 2014-15 2015-16 2016-17 2017-18 $'000 $'000 $'000 $'000
OPERATING ACTIVITIESCash received
Sale of goods and rendering of services 76,933 60,770 46,624 43,390 41,096 Appropriations 453,981 428,639 401,187 366,457 360,659 Other 12,568 - 1,287 1,233 -
Total cash received 543,482 489,409 449,098 411,080 401,755
Cash usedEmployees 276,548 245,559 236,789 223,104 226,541 Suppliers 239,659 195,549 164,514 141,185 130,841 Grants 12,045 6,840 6,801 6,227 3,599 Transfer funding 41,497 41,061 40,594 40,164 40,374 Other 426 400 400 400 400
Total cash used 570,175 489,409 449,098 411,080 401,755 Net cash from (used by)
operating activities (26,693) - - - -
INVESTING ACTIVITIESCash received
Proceeds from sales of property, plant and equipment - - - - -
Total cash received - - - - - Cash used
Purchase of property, plant andequipment and intangibles 28,702 28,796 25,831 26,004 25,653
Total cash used 28,702 28,796 25,831 26,004 25,653 Net cash from (used by)
investing activities (28,702) (28,796) (25,831) (26,004) (25,653)
FINANCING ACTIVITIESCash received
Contributed equity 58,054 28,796 25,831 26,004 25,653 Total cash received 58,054 28,796 25,831 26,004 25,653 Cash usedTotal cash used - - - - - Net cash from (used by)
financing activities 58,054 28,796 25,831 26,004 25,653 Net increase (decrease)
in cash held 2,659 - - - - Cash and cash equivalents at the
beginning of the reporting period 2,992 5,651 5,651 5,651 5,651 Cash and cash equivalents at the
end of the reporting period 5,651 5,651 5,651 5,651 5,651
Prepared on Australian Accounting Standards basis.

Department of the Environment Budget Statements
105
Estimated Budget Forw ard Forw ard Forw ardactual estimate estimate estimate estimate
2013-14 2014-15 2015-16 2016-17 2017-18$'000 $'000 $'000 $'000 $'000
NEW CAPITAL APPROPRIATIONSCapital budget - Bill No. 1 (DCB) 26,550 25,351 25,186 25,059 25,253 Equity injections -Bill No. 2 40,608 2,745 645 945 400
Total new capital appropriations 67,158 28,096 25,831 26,004 25,653
Provided for:Purchase of non-financial assets 29,083 28,096 25,831 26,004 25,653 Other Items 1 38,075 - - - -
Total Items 67,158 28,096 25,831 26,004 25,653
PURCHASE OF NON-FINANCIALASSETSFunded by capital appropriations 2 2,152 3,445 645 945 400 Funded by capital appropriation - DCB 3 26,550 25,351 25,186 25,059 25,253
TOTAL 28,702 28,796 25,831 26,004 25,653
RECONCILIATION OF CASHUSED TO ACQUIRE ASSETSTO ASSET MOVEMENT TABLE
Total purchases 28,702 28,796 25,831 26,004 25,653 Total cash used to
acquire assets 28,702 28,796 25,831 26,004 25,653
Prepared on Australian Accounting Standards basis.1 Includes $38.1m for Domestic Climate Change functions transferred from Department of Industry as a result of Administrative Arrangements Order announced on 18 September 2013.2 Includes both current and prior year Appropriation Bill No. 2 and prior year Appropriation Act No.23 Does not include annual finance lease costs. Includes purchases funded by current and previous years' Departmental Capital Budgets.

Table 3.2.6: Statement of Asset Movements (2014-15)
Buildings Other property, Computer Totalplant and software and
equipment intangibles$'000 $'000 $'000 $'000
As at 1 July 2014Gross book value 315,041 172,680 74,806 562,527 Accumulated depreciation/amortisation
and impairment (72,099) (69,750) (38,883) (180,732) Opening net book balance 242,942 102,930 35,923 381,795 CAPITAL ASSET ADDITIONSEstimated expenditure on
new or replacement assetsBy purchase - appropriation equity 1 - - 3,445 3,445 By purchase - appropriation ordinary
annual services 2 7,809 11,980 5,562 25,351 Total additions 7,809 11,980 9,007 28,796
Other movementsDepreciation/amortisation expense (19,671) (23,242) (6,983) (49,896) Total other movements (19,671) (23,242) (6,983) (49,896)
As at 30 June 2015Gross book value 322,850 184,660 83,813 591,323 Accumulated depreciation/amortisation
and impairment (91,770) (92,992) (45,866) (230,628) Closing net book balance 231,080 91,668 37,947 360,695
Prepared on Australian Accounting Standards basis.1 "Appropriation equity" refers to equity injections provided through Appropriation Bill No.2 2014-15.2 "Appropriation ordinary annual services" refers to funding provided through Appropriation Bill No.1 2014-15 for DCBs.
102
Departm
ent of the Environment Budget Statem
ents

Department of the Environment Budget Statements
Table 3.2.7: Schedule of Budgeted Income and Expenses Administered on Behalf of Government (for the period ended 30 June)
Prepared on Australian Accounting Standards basis
107
Estimated Budget Forw ard Forw ard Forw ardactual estimate estimate estimate estimate
2013-14 2014-15 2015-16 2016-17 2017-18$'000 $'000 $'000 $'000 $'000
EXPENSES ADMINISTERED ONBEHALF OF GOVERNMENTSuppliers 64,340 53,897 58,857 54,971 22,404 Grants 740,679 752,418 817,296 782,877 1,112,756 Write-dow n and impairment
of assets (35,002) - - - - Other 1,192 - - - -
Total expenses administeredon behalf of Government 771,209 806,315 876,153 837,848 1,135,160
LESS:OWN-SOURCE INCOMEOwn-source revenueTaxation revenue
Other 99,099 122 145 1,498 1,498 Total taxation revenue 99,099 122 145 1,498 1,498
Non-taxation revenueSale of goods and rendering
of services 4,779 1,530 1,530 1,530 1,530 Fees and f ines 9,324 24,183 28,718 20,978 20,617 Interest 525 285 97 38 14 Other 104,201 2,228 2,228 15,465 14,177
Total non-taxation revenue 118,829 28,226 32,573 38,011 36,338 Total own-source revenues
administered on behalf of Government 217,928 28,348 32,718 39,509 37,836
GainsOther 118,474 142,376 149,836 170,450 32,916
Total gains administeredon behalf of Government 118,474 142,376 149,836 170,450 32,916
Total own-sourced incomeadministered on behalf of
Government 336,402 170,724 182,554 209,959 70,752 Net Cost of (contribution by)
services 434,807 635,591 693,599 627,889 1,064,408 Surplus (Deficit) (434,807) (635,591) (693,599) (627,889) (1,064,408)
OTHER COMPREHENSIVE INCOMEChanges in asset revaluation surplus - - - - -
Total other comprehensive income - - - - -
Total comprehensive income (loss) (434,807) (635,591) (693,599) (627,889) (1,064,408)

Department of the Environment Budget Statements
Table 3.2.8: Schedule of Budgeted Assets and Liabilities Administered on Behalf of Government (as at 30 June)
Table 3.2.9: Schedule of Budgeted Administered Cash Flows(for the period ended 30 June)
108
Estimated Budget Forw ard Forw ard Forw ardactual estimate estimate estimate estimate
2013-14 2014-15 2015-16 2016-17 2017-18$'000 $'000 $'000 $'000 $'000
Financial assetsCash and cash equivalents - - - - - Receivables 11,148 8,838 8,052 5,717 3,554 Taxation receivables 35,000 - - - - Other investments 562,045 562,045 562,045 562,045 562,045
Total financial assets 608,193 570,883 570,097 567,762 565,599
Non-financial assetsLand and buildings 1,459 1,459 1,459 1,459 1,459 Property, plant and equipment 516,901 516,901 516,901 516,901 516,901 Inventories 12,559 12,559 12,559 12,559 12,559 Intangibles 2,090,018 2,294,598 2,510,040 2,765,652 3,385,702
Total non-financial assets 2,620,937 2,825,517 3,040,959 3,296,571 3,916,621
Total assets administered on behalf of Government 3,229,130 3,396,400 3,611,056 3,864,333 4,482,220
LIABILITIES ADMINISTERED ONBEHALF OF GOVERNMENTPayables
Suppliers 7,103 7,103 7,103 7,103 7,103 Grants 23,058 23,058 23,058 23,058 23,058 Other 63 63 63 63 63
Total payables 30,224 30,224 30,224 30,224 30,224
Total liabilities administeredon behalf of Government 30,224 30,224 30,224 30,224 30,224
Net assets/(liabilities) 3,198,906 3,366,176 3,580,832 3,834,109 4,451,996 Prepared on Australian Accounting Standards basis.

Department of the Environment Budget Statements
Table 3.2.10: Schedule of Administered Capital Budget Statement
109
Estimated Budget Forw ard Forw ard Forw ardactual estimate estimate estimate estimate
2013-14 2014-15 2015-16 2016-17 2017-18$'000 $'000 $'000 $'000 $'000
OPERATING ACTIVITIESCash received
Sales of goods and rendering of services 4,779 1,530 1,530 1,530 1,530
Fees and f ines 9,324 24,183 28,718 20,978 20,617 Interest 525 285 97 38 14 Taxes 86,905 35,122 145 1,498 1,498 Other 104,269 2,228 2,228 15,465 14,177
Total cash received 205,802 63,348 32,718 39,509 37,836
Cash usedSuppliers 64,340 55,397 55,357 58,571 26,004 Grant payments 725,141 752,418 817,296 782,877 1,112,756 Other 1,192 - - - -
Total cash used 790,673 807,815 872,653 841,448 1,138,760 Net cash from (used by)
operating activities (584,871) (744,467) (839,935) (801,939) (1,100,924) INVESTING ACTIVITIESCash received
Repayments of advances and loans 2,335 2,310 786 340 168
Total cash received 2,335 2,310 786 340 168
Cash usedPurchase of property, plant,
equipment and intangibles 62,434 62,204 65,606 85,162 587,134 Total cash used 62,434 62,204 65,606 85,162 587,134 Net cash from (used by)
investing activities (60,099) (59,894) (64,820) (84,822) (586,966) Net increase (decrease) in
cash held (644,970) (804,361) (904,755) (886,761) (1,687,890) Cash and cash equivalents at
beginning of reporting period - - - - - Cash from Official Public Account for:- Appropriations 554,872 560,499 655,006 612,919 1,098,638 - Special Accounts 290,164 296,716 269,395 302,065 610,356
845,036 857,215 924,401 914,984 1,708,994 Cash to Official Public Account for:
- Appropriations 200,066 49,919 19,646 28,223 21,104 - Special Accounts - 2,935 - - -
200,066 52,854 19,646 28,223 21,104 Cash and cash equivalents at
end of reporting period - - - - -
Prepared on Australian Accounting Standards basis.
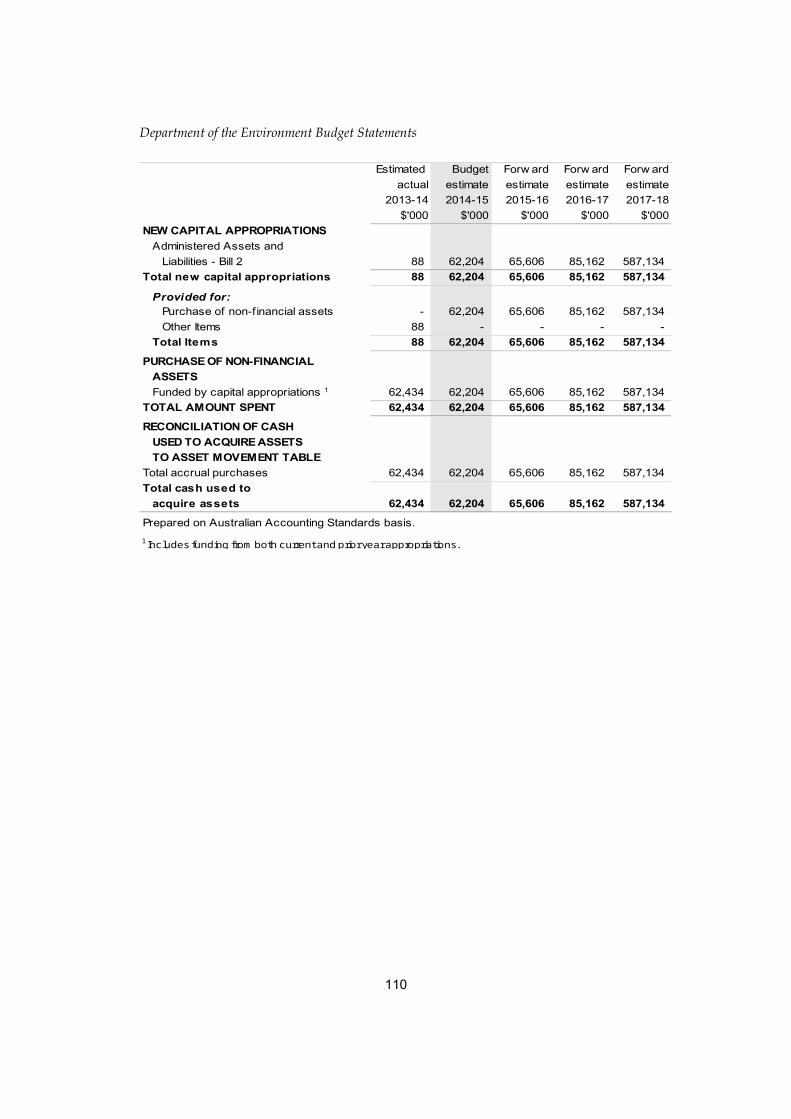
Department of the Environment Budget Statements
110
Estimated Budget Forw ard Forw ard Forw ardactual estimate estimate estimate estimate
2013-14 2014-15 2015-16 2016-17 2017-18$'000 $'000 $'000 $'000 $'000
NEW CAPITAL APPROPRIATIONSAdministered Assets and
Liabilities - Bill 2 88 62,204 65,606 85,162 587,134 Total new capital appropriations 88 62,204 65,606 85,162 587,134
Provided for:Purchase of non-financial assets - 62,204 65,606 85,162 587,134 Other Items 88 - - - -
Total Items 88 62,204 65,606 85,162 587,134
PURCHASE OF NON-FINANCIALASSETSFunded by capital appropriations 1 62,434 62,204 65,606 85,162 587,134
TOTAL AMOUNT SPENT 62,434 62,204 65,606 85,162 587,134
RECONCILIATION OF CASHUSED TO ACQUIRE ASSETSTO ASSET MOVEMENT TABLE
Total accrual purchases 62,434 62,204 65,606 85,162 587,134 Total cash used to
acquire assets 62,434 62,204 65,606 85,162 587,134
Prepared on Australian Accounting Standards basis.1 Includes funding from both current and prior year appropriations.

Departm
ent of the Environment Budget Statem
ents
Table 3.2.11: Statement of Administered Asset Movements (2014-15) Land Other property, Intangibles Total
plant andequipment
$'000 $'000 $'000 $'000As at 1 July 2014Gross book value 1,459 516,901 2,090,431 2,608,791 Accumulated depreciation/amortisation
and impairment - - (413) (413) Opening net book balance 1,459 516,901 2,090,018 2,608,378
CAPITAL ASSET ADDITIONSEstimated expenditure on new or
replacement assetsBy purchase - appropriation equity 1 - - 62,204 62,204 By purchase - appropriation ordinaryOther - - 142,376 142,376 Total additions - - 204,580 204,580
Other movements
As at 30 June 2015Gross book value 1,459 516,901 2,295,011 2,813,371 Accumulated depreciation/amortisation
and impairment - - (413) (413) Closing net book balance 1,459 516,901 2,294,598 2,812,958
Prepared on Australian Accounting Standards basis.1 "Appropriation equity" refers to Administered Assets and Liabilities appropriations provided through Appropriation Bill No.2 2014-15.
111

Bureau of Meteorology
Agency Resources and Planned Performance
113

BUREAU OF METEOROLOGY
Section 1: Agency Overview and Resources.........................................................1131.1 Strategic Direction Statement......................................................................1131.2 Agency Resource Statement.......................................................................1151.3 Budget Measures.........................................................................................116
Section 2: Outcomes and Planned Performance..................................................1182.1 Outcomes and Performance Information.....................................................118
Section 3: Explanatory Tables and Budgeted Financial Statements...................1233.1 Explanatory Tables......................................................................................1233.2 Budgeted Financial Statements...................................................................124
115

BUREAU OF METEOROLOGY
Section 1: Agency Overview and Resources
1.1 STRATEGIC DIRECTION STATEMENT
The Bureau of Meteorology (the Bureau) provides Australians with the environmental intelligence they need to manage and live within their natural environment, encompassing the atmosphere, oceans, water and land. To achieve this, the Bureau:
provides forecasts, warnings and long-term outlooks on weather, climate, water and other environmental phenomena;
monitors and reports on current environmental conditions;
analyses and explains trends in environmental data;
fosters greater public understanding and use of environmental intelligence; and
extends its understanding of, and ability to forecast, Australia’s weather, climate and water resources.
Under its Strategic Plan 2010–15, the Bureau will continue to refine its range of products and services and improve accessibility to better meet the needs of Australians. The Bureau will continue to support the safety, security and prosperity of all Australians, contributing to a strong and productive economy and helping to meet national challenges. The Bureau’s work directly informs decisions by governments, industry and the community and supports all Australians, the Australian Defence Force and key sectors such as emergency management, aviation, transport, water management, agriculture and environmental management.
The Bureau will commence a major initiative in 2014-15 to purchase, install and operate a new supercomputer to ensure it can continue to deliver high quality forecasts and warnings and meet the growing needs of stakeholders in the future. The new computing facilities will operate for five years from mid-2016, enabling the Bureau to deliver significant benefits to all Australians in terms of more accurate, responsive and up to date information, provided with greater certainty.
In 2014-15 the Bureau will continue its implementation of the Australian Government’s response to the Review of the Bureau of Meteorology's capacity to respond to future extreme weather and natural disaster events and to provide seasonal forecasting services, which was released in 2013. Delivery of this initiative will continue to improve the Bureau's capacity to respond to extreme weather events such as floods, bushfires, storms and tropical cyclones, particularly when these events occur simultaneously and in multiple locations.
117

The Bureau will also continue to pursue operational improvements to deliver efficient and effective outcomes. In particular, the Bureau will continue its efforts towards modernisation and automation of its observing infrastructure, with a strategic focus on building greater resilience and sustainability in all of its operations.
In 2014-15 the Bureau will also deliver the final stage in the rollout of the Next Generation Weather Forecast and Warning System, which is bringing the level of weather forecasting services for around 650 towns and regional centres in to line with capital cities.
118

Bureau of Meteorology Budget Statements
1.2 AGENCY RESOURCE STATEMENT
Table 1.1 shows the total resources from all sources. The table summarises how resources will be applied by outcome and by administered and departmental classification.
Table 1.1: Bureau of Meteorology Resource Statement — BudgetEstimates for 2014-15 as at Budget May 2014
119
Estimate Proposed Total Actualof prior + at Budget = estimate available
year amounts appropriation available in
2014-15 2014- 15 2014-15 2013-14$'000 $'000 $'000 $'000
Ordinary annual services1
Departmental appropriationPrior year departmental appropriation2 76,157 76,157 77,244Departmental appropriation3 262,754 262,754 254,724s31 Relevant agency receipts4 71,634 71,634 76,633Total 76,157 334,388 410,545 408,601
Total ordinary annual services A 76,157 334,388 410,545 408,601Other services5
Departmental non- operatingEquity injections 9,842 9,842 14,592Total - 9,842 9,842 14,592
Total other services B - 9,842 9,842 14,592Total available annual
appropriations 76,157 344,230 420,387 423,193Total appropriations excluding
Special Accounts 76,157 344,230 420,387 423,193Total resourcingA+B 76,157 344,230 420,387 423,193Total net resourcing for Bureauof Meteorology 76,157 344,230 420,387 423,1931 Appropriation Bill (No.1) 2014-152 Estimated adjusted balance carried forward from previous year3 Includes an amount of $44.551m in 2014-15 for the Departmental Capital Budget (refer to table 3.2.5 forfurther details). For accounting purposes this amount has been designated as 'contributions by owners'.4 s31 Relevant Agency receipts - estimate5 Appropriation Bill (No.2) 2014-15

Bureau of Meteorology Budget Statements
1.3 BUDGET MEASURES
Budget measures in Part 1 relating to Bureau of Meteorology are detailed in Budget Paper No. 2 and are summarised below.
Table 1.2: Agency 2014-15 Budget measuresPart 1: Measures announced since the 2013-14 MYEFO
120
Programme 2013-14 2014-15 2015-16 2016-17 2017-18$'000 $'000 $'000 $'000 $'000
Expense measures Supercomputer 1
Departmental expenses nfp nfp nfp nfpTotal nfp nfp nfp nfpImproved eff iciency 1
Departmental expenses (556) (3,961) (3,043) (2,569) Total (556) (3,961) (3,043) (2,569) Efficiency Dividend - a further temporary increase of 0.25 per cent 1
Departmental expenses (558) (1,088) (1,681) (1,437) Total (558) (1,088) (1,681) (1,437) Total expense measures
Departmental (1,114) (5,049) (4,724) (4,006) Total (1,114) (5,049) (4,724) (4,006) Capital measures Supercomputer 1
Departmental capital nfp nfp nfp nfpTotal nfp nfp nfp nfp1 Improved eff iciency 1
Departmental capital 100 Total 100
Efficiency Dividend - a further temporary increase of 0.25 per cent 1
Departmental capital (114) (227) (327) (330) Total (114) (227) (327) (330) Total capital measures
Departmental (14) (227) (327) (330) Total (14) (227) (327) (330) Prepared on a Government Finance Statistics (f iscal) basisNote: totals do not include 'not for publication' (nfp) amounts

Bureau of Meteorology Budget Statements
Part 2: MYEFO measures not previously reported in a portfolio statement
121
Programme 2013-14 2014-15 2015-16 2016-17 2017-18$'000 $'000 $'000 $'000 $'000
Measures Efficiency Dividend temporary increase in the rate 1
Departmental expenses/capital (2,615) (5,901) (9,560) (9,560) Total (2,615) (5,901) (9,560) (9,560) Reforms to APS Management and efficient procurement of agency softw are 1
Departmental expenses (307) (624) (1,102) (1,213) (1,213) Total (307) (624) (1,102) (1,213) (1,213) Public Service eff iciencies 1
Departmental expenses (88) (455) (940) (1,532) (1,532) Total (88) (455) (940) (1,532) (1,532) Total measures
Departmental expenses/capital (395) (3,694) (7,943) (12,305) (12,305) Total (395) (3,694) (7,943) (12,305) (12,305) Prepared on a Government Finance Statistics (f iscal) basis

Bureau of Meteorology Budget Statements
SECTION 2: OUTCOMES AND PLANNED PERFORMANCE
2.1 OUTCOMES AND PERFORMANCE INFORMATION
Government outcomes are the intended results, impacts or consequences of actions by the Government on the Australian community. Commonwealth programmes are the primary vehicle by which Government agencies achieve the intended results of their outcome statements. Agencies are required to identify the programmes which contribute to Government outcomes over the Budget and forward years.
Each outcome is described below together with its related programmes, specifying the performance indicators and targets used to assess and monitor the performance of the Bureau in achieving Government outcomes.
Outcome 1: Informed safety, security, and economic decisions by governments, industry, and the community through the provision of information, forecasts, services and research relating to weather, climate and water.
Outcome Expense Statement
Table 2.1 provides an overview of the total expenses for outcome 1 by programme.
122
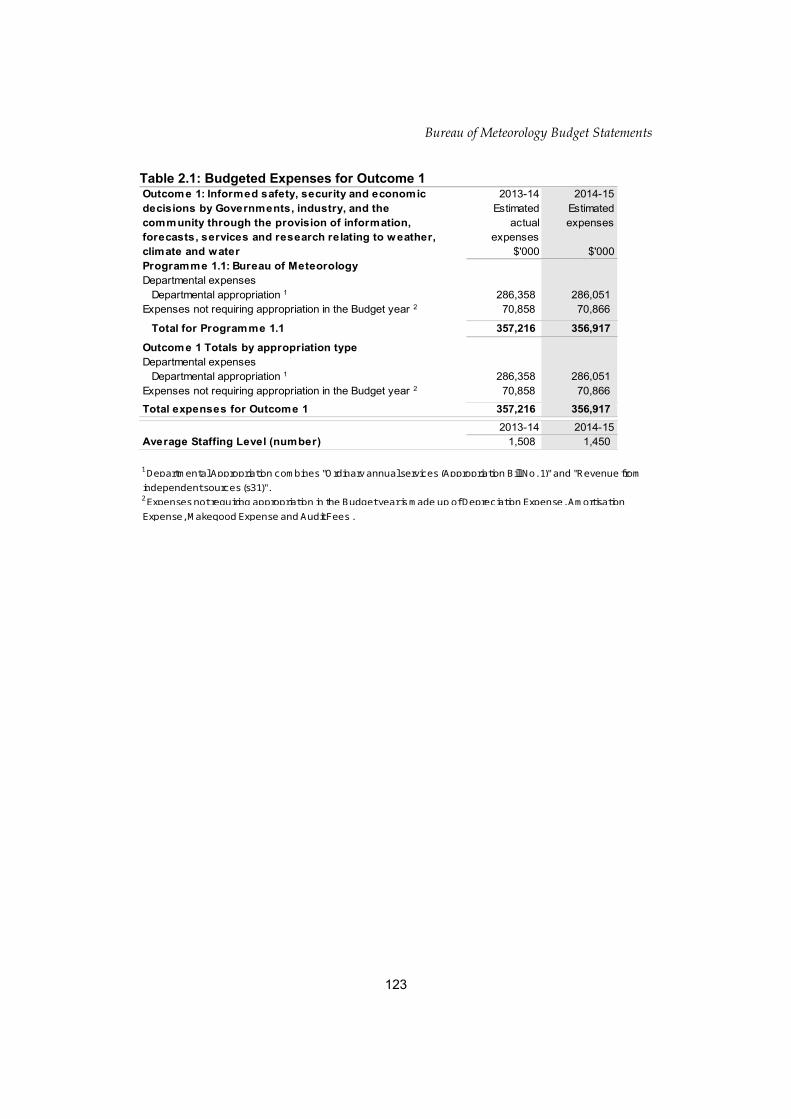
Bureau of Meteorology Budget Statements
Table 2.1: Budgeted Expenses for Outcome 1
123
Outcome 1: Informed safety, security and economic 2013-14 2014-15decisions by Governments, industry, and the Estimated Estimatedcommunity through the provision of information, actual expensesforecasts, services and research relating to weather, expensesclimate and water $'000 $'000Programme 1.1: Bureau of MeteorologyDepartmental expenses
Departmental appropriation 1 286,358 286,051Expenses not requiring appropriation in the Budget year 2 70,858 70,866
Total for Programme 1.1 357,216 356,917
Outcome 1 Totals by appropriation typeDepartmental expenses
Departmental appropriation 1 286,358 286,051Expenses not requiring appropriation in the Budget year 2 70,858 70,866
Total expenses for Outcome 1 357,216 356,9172013-14 2014-15
Average Staffing Level (number) 1,508 1,450
1 Departmental Appropriation combines "Ordinary annual services (Appropriation Bill No. 1)" and "Revenue from independent sources (s31)".2 Expenses not requiring appropriation in the Budget year is made up of Depreciation Expense, Amortisation Expense, Makegood Expense and Audit Fees .
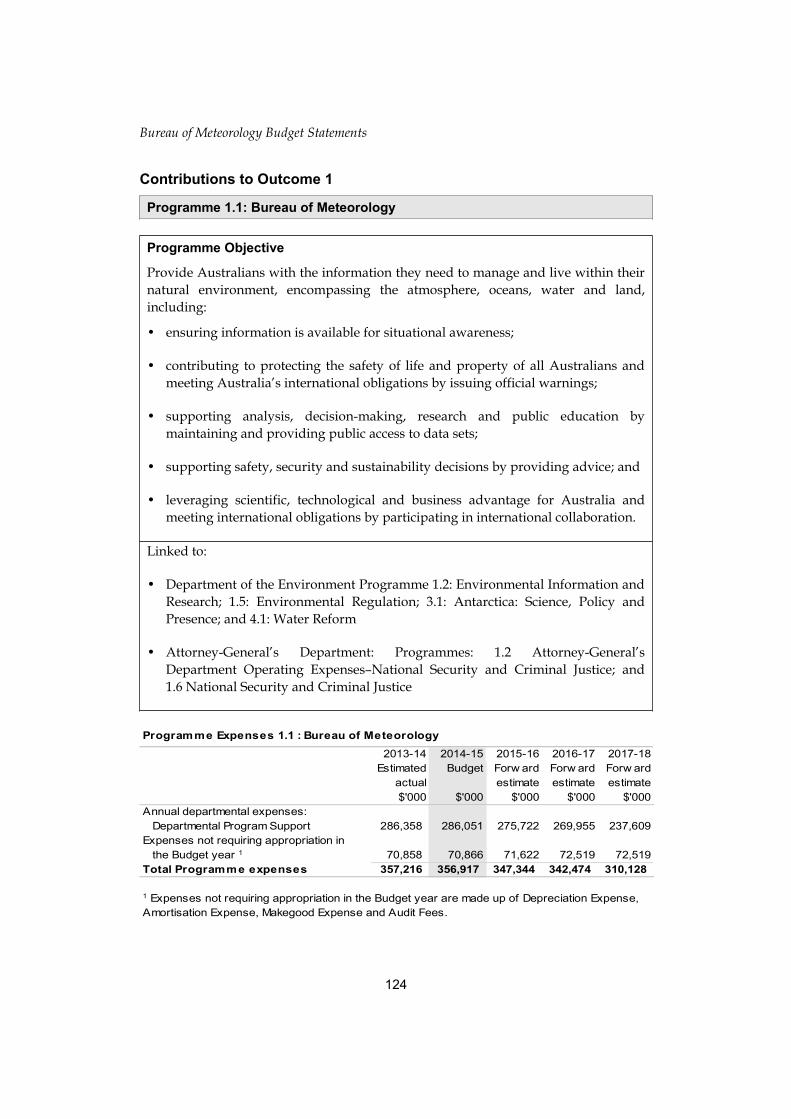
Bureau of Meteorology Budget Statements
Contributions to Outcome 1
Programme 1.1: Bureau of Meteorology
Programme Objective
Provide Australians with the information they need to manage and live within their natural environment, encompassing the atmosphere, oceans, water and land, including:
• ensuring information is available for situational awareness;
• contributing to protecting the safety of life and property of all Australians and meeting Australia’s international obligations by issuing official warnings;
• supporting analysis, decision-making, research and public education by maintaining and providing public access to data sets;
• supporting safety, security and sustainability decisions by providing advice; and
• leveraging scientific, technological and business advantage for Australia and meeting international obligations by participating in international collaboration.
Linked to:
• Department of the Environment Programme 1.2: Environmental Information and Research; 1.5: Environmental Regulation; 3.1: Antarctica: Science, Policy and Presence; and 4.1: Water Reform
• Attorney-General’s Department: Programmes: 1.2 Attorney-General’s Department Operating Expenses–National Security and Criminal Justice; and 1.6 National Security and Criminal Justice
124
Programme Expenses 1.1 : Bureau of Meteorology2013-14 2014-15 2015-16 2016-17 2017-18
Estimated Budget Forw ard Forw ard Forw ardactual estimate estimate estimate$'000 $'000 $'000 $'000 $'000
Annual departmental expenses:Departmental Program Support 286,358 286,051 275,722 269,955 237,609
Expenses not requiring appropriation inthe Budget year 1 70,858 70,866 71,622 72,519 72,519
Total Programme expenses 357,216 356,917 347,344 342,474 310,128
1 Expenses not requiring appropriation in the Budget year are made up of Depreciation Expense, Amortisation Expense, Makegood Expense and Audit Fees.

Bureau of Meteorology Budget Statements
125

Bureau of Meteorology Budget Statements
Programme 1.1 Deliverables • Take and gather observations of weather, water, ocean, marine, solar, space and
atmospheric conditions.
• Prepare and disseminate weather, water, ocean, marine, solar, space and climate variability forecasts to the Australian community and key sectors, including emergency services, aviation, the Australian Defence Force, mariners, primary producers and water managers.
• Issue official warnings for heavy rain, hail, strong winds, floods, tropical cyclones, bushfire weather, heatwaves, volcanic ash, heavy seas, tsunamis, air turbulence and space weather disturbances.
• Provide and maintain public access to national weather, water, oceans, climate and space weather data sets.
• Provide advice on Australia’s weather, water, ocean and climate matters.
• Undertake operational research and development leading to efficiency and effectiveness improvements in the Bureau’s weather, water, ocean and climate services.
• Participate in international collaboration to meet Australia’s obligations under the World Meteorological Organization, International Civil Aviation Organization, Intergovernmental Oceanographic Commission of UNESCO and International Maritime Organization.
126

Bureau of Meteorology Budget Statements
Programme 1.1 Key Performance Indicators • Observations meet accuracy, timeliness, completeness, coverage and accessibility
specifications.
• Forecasts meet accuracy and timeliness specifications, and are used extensively and satisfy users.
• Warnings meet accuracy, timeliness and coverage specifications, and are effective in influencing responses to impending critical events.
• Data and information meets accuracy, timeliness and coverage specifications and satisfies users.
• Accurate and timely advice effectively informs decision making and satisfies the needs of stakeholders and users.
• Increased accuracy and capacity of the Bureau’s products and services, and increased levels of stakeholder satisfaction.
• Australia’s interests are protected and advanced through effective engagement which influences the maintenance and development of international agreements that deliver improved outcomes for Australia.
127

Bureau of Meteorology Budget Statements
Section 3: Explanatory Tables and Budgeted Financial StatementsSection 3 presents explanatory tables and budgeted financial statements which provide a comprehensive snapshot of agency finances for the 2014–15 Budget year. It explains how budget plans are incorporated into the financial statements and provides further details of the reconciliation between appropriations and programme expenses, movements in administered funds, special accounts and Australian Government Indigenous expenditure.
3.1 EXPLANATORY TABLES
3.1.1 Movement of Administered Funds Between YearsThere are no movement of funds between years for the Bureau.
3.1.2 Special AccountsThe Bureau of Meteorology (the Bureau) operates one special account – Services for other entities and Trust Moneys. There are no movements of Commonwealth funds in this account.
3.1.3 Australian Government Indigenous ExpenditureThe 2014-15 Australian Government Indigenous Statement is not applicable because the Bureau of Meteorology has no Indigenous specific expenses.
128

Bureau of Meteorology Budget Statements
3.2 BUDGETED FINANCIAL STATEMENTS
3.2.1 Differences in Agency Resourcing and Financial StatementsThere are no differences between resource information presented in the Budget Papers and the Portfolio Budget Statements as a result of differences between Australian Accounting Standards (AAS) and Government Finance Statistics (GFC).
3.2.2 Analysis of Budgeted Financial StatementsAn analysis of the Bureau’s budgeted financial statements, as reflected in the Bureau’s budgeted departmental financial statements and administered schedules for 2014–15, is provided below:
Budgeted Departmental Income StatementTotal revenue to the Bureau in 2014-15 is estimated to be $288.6 million, an increase of $0.3 million from the 2013–14 estimated actual. The movement in funding is primarily the result of:
funding associated with the 2014-15 Budget measure Supercomputer;
funding associated with the 2013-14 Budget measure Resourcing Requirements in Response to the Munro Review;
funding associated with the 2013-14 Budget measure Recommissioning the Tennant Creek Radar;
funding associated with the 2013-14 Budget measure Website Advertising on a Permanent Basis;
funding associated with the Water for the Future initiative announced in the 2007-08 Budget;
increased funding for economic parameter adjustments;
reduced funding associated with cost recoverable projects and services;
reduced funding as a result of the increase in the Efficiency Dividend; and
reduced funding as a result of the Savings Measures and Targeted savings – Public Service Efficiencies.
Total expenses are estimated to be $356.9 million, a decrease of $0.3 million from the 2013–14 estimated actual.
129

Bureau of Meteorology Budget Statements
Whilst the Bureau is no longer funded for Depreciation through Appropriation Bill 1, the expenditure is still recognised on the Income Statement.
Budgeted Departmental Balance SheetThe Bureau’s anticipated budgeted equity position of $328.3 million represents a decrease of $13.9 million from the 2013–14 estimated actual. The decrease in equity is attributable to the changed arrangement for Depreciation and replacement Capital spend funding and change in equity injection funding for New Policy proposals.
The Bureau’s major asset, ‘Infrastructure, Plant and Equipment’, is projected to decrease by $10.0 million to a total of $257.8 million in 2014-15 due primarily to increased depreciation expense offsetting the Bureau capital works programme.
The Bureau’s primary liability continues to be accrued employee entitlements that total $72.9 million.
Schedule of Budgeted Assets and Liabilities Administered on behalf of GovernmentThe Bureau has no administered assets or liabilities.
130

Bureau of Meteorology Budget Statements
3.2.3 Budgeted Financial Statements TablesTable 3.2.1 Comprehensive Income Statement (Showing Net Cost of Services) for the period ended 30 June
131
Estimated Budget Forw ard Forw ard Forw ardactual estimate estimate estimate estimate
2013-14 2014-15 2015-16 2016-17 2017-18$'000 $'000 $'000 $'000 $'000
EXPENSESEmployee benefits 185,443 182,746 178,703 175,467 153,379Suppliers 99,166 101,559 95,267 92,722 82,449Depreciation and amortisation 70,858 70,866 71,622 72,519 72,519Write-dow n and impairment of assets 1 1 1 1 1Other expenses 1,748 1,745 1,751 1,765 1,780Total expenses 357,216 356,917 347,344 342,474 310,128LESS: OWN-SOURCE INCOMEOwn-source revenueSale of goods and rendering of services 75,408 70,409 66,994 54,826 54,826Other - - - - -Total own-source revenue 75,408 70,409 66,994 54,826 54,826GainsSale of assets - - - - -Other - - - - -Total gains - - - - -Total own-source income 75,408 70,409 66,994 54,826 54,826Net cost of (contribution by)
services 281,808 286,508 280,350 287,648 255,302Revenue from Government 212,930 218,203 211,289 217,690 185,344* * * *Surplus (Deficit) attributable to
the Australian Government (68,878) (68,305) (69,061) (69,958) (69,958)

Bureau of Meteorology Budget Statements
Table 3.2.1 Comprehensive Income Statement (Showing Net Cost of Services) for the period ended 30 June (continued)
132
Estimated Budget Forw ard Forw ard Forw ardactual estimate estimate estimate estimate
2013-14 2014-15 2015-16 2016-17 2017-18$'000 $'000 $'000 $'000 $'000
OTHER COMPREHENSIVE INCOMEChanges in asset revaluation surplus - - - - -
Total other comprehensive income - - - - -Total comprehensive income (loss) (68,878) (68,305) (69,061) (69,958) (69,958)Total comprehensive income (loss)
attributable to the Australian Government (68,878) (68,305) (69,061) (69,958) (69,958)
Total Comprehensive Income (loss) excluding depreciation/amortisationexpenses previously funded throughrevenue appropriations. 1,980 2,561 2,561 2,561 2,561
less depreciation/amortisation expensespreviously funded through revenueappropriations1 70,858 70,866 71,622 72,519 72,519
Total Comprehensive Income (loss) - as per the Statement ofComprehensive Income (68,878) (68,305) (69,061) (69,958) (69,958)
1 From 2010-11, the Government introduced net cash appropriation arrangements w here Bill 1 revenue appropriations for the depreciation/amortisation expenses of FMA Act agencies w ere replaced w ith a separate capital budget (the Departmental Capital Budget, or DCB) provided through Bill 1 equity appropriations. For information regarding DCBs, please refer to Table 3.2.5 Departmental Capital Budget Statement.

Bureau of Meteorology Budget Statements
Table 3.2.2: Budgeted Departmental Balance Sheet(as at 30 June)
133
Estimated Budget Forw ard Forw ard Forw ardactual estimate estimate estimate estimate
2013-14 2014-15 2015-16 2016-17 2017-18$'000 $'000 $'000 $'000 $'000
ASSETSFinancial assets
Cash and cash equivalents 1,195 1,195 1,195 1,195 1,195Trade and other receivables 83,857 78,781 79,531 80,281 80,281Other f inancial assets 911 911 911 911 911
Total financial assets 85,963 80,887 81,637 82,387 82,387 Non-financial assets
Land and buildings 81,086 82,802 85,718 89,834 93,950Property, plant and equipment 267,862 257,766 278,019 262,252 252,816Intangibles 34,126 28,619 21,312 12,905 3,898Inventories 10,068 10,068 10,068 10,068 10,068Other non-financial assets 6,439 6,439 6,439 6,439 6,439
Total non-financial assets 399,581 385,694 401,556 381,498 367,171 Total assets 485,544 466,581 483,193 463,885 449,558 LIABILITIESPayables
Suppliers 13,495 13,495 13,495 13,495 13,495Other payables 31,573 31,573 31,573 31,573 31,573
Total payables 45,068 45,068 45,068 45,068 45,068
ProvisionsEmployee provisions 77,920 72,869 73,619 74,369 74,369Other provisions 20,382 20,382 20,382 20,382 20,382
Total provisions 98,302 93,251 94,001 94,751 94,751 Total liabilities 143,370 138,319 139,069 139,819 139,819 Net assets 342,174 328,262 344,124 324,066 309,739

Bureau of Meteorology Budget Statements
Table 3.2.2: Budgeted Departmental Balance Sheet(as at 30 June) (continued)
* 'Equity' is the residual interest in assets after deduction of liabilities.Prepared on Australian Accounting Standards basis.
134
Estimated Budget Forw ard Forw ard Forw ardactual estimate estimate estimate estimate
2013-14 2014-15 2015-16 2016-17 2017-18$'000 $'000 $'000 $'000 $'000
EQUITY*Parent entity interest
Contributed equity 480,470 534,863 619,786 669,686 725,317Reserves 93,786 93,786 93,786 93,786 93,786Retained surplus
(accumulated def icit) (232,082) (300,387) (369,448) (439,406) (509,364)Total parent entity interest 342,174 328,262 344,124 324,066 309,739Total Equity 342,174 328,262 344,124 324,066 309,739

Bureau of Meteorology Budget Statements
Table 3.2.3: Departmental Statement of Changes in Equity — Summary of Movement (Budget Year 2014-15)
135
Retained Asset Other Contributed Totalearnings revaluation reserves equity/ equity
reserve capital$'000 $'000 $'000 $'000 $'000
Opening balance as at 1 July 2014Balance carried forw ard from
previous period (232,082) 93,786 480,470 342,174Adjusted opening balance (232,082) 93,786 - 480,470 342,174Comprehensive income
Surplus (deficit) for the period (68,305) (68,305)
Total comprehensive income (68,305) - - - (68,305)Transactions w ith owners
Contributions by ownersEquity Injection - Appropriation 9,842 9,842Departmental Capital Budget (DCBs) 44,551 44,551
Sub-total transactions with owners - - - 54,393 54,393Estimated closing balance
as at 30 June 2015 (300,387) 93,786 - 534,863 328,262Closing balance attributable to the
Australian Government (300,387) 93,786 - 534,863 328,262

Bureau of Meteorology Budget Statements
Table 3.2.4: Budgeted Departmental Statement of Cash Flows(for the period ended 30 June)
136
Estimated Budget Forw ard Forw ard Forw ardactual estimate estimate estimate estimate
2013-14 2014-15 2015-16 2016-17 2017-18$'000 $'000 $'000 $'000 $'000
OPERATING ACTIVITIESCash received
Appropriations 214,017 223,279 210,539 216,940 185,344Sale of goods and rendering of services 75,408 70,409 66,994 54,826 54,826Net GST received 8,310 8,310 8,310 8,310 8,310
Total cash received 297,735 301,998 285,843 280,076 248,480Cash used
Employees 185,109 187,807 177,953 174,717 153,379Suppliers 100,914 103,294 97,018 94,487 84,229Net GST paid 4,560 4,560 4,560 4,560 4,560
Total cash used 290,583 295,661 279,531 273,764 242,168Net cash from (used by)
operating activities 7,152 6,337 6,312 6,312 6,312INVESTING ACTIVITIESCash received
Proceeds from sales of property,plant and equipment 1,225 1,225 1,225 1,225 1,225
Total cash received 1,225 1,225 1,225 1,225 1,225Cash used
Purchase of property, plant and equipment 61,012 58,204 88,709 53,686 59,417
Other 3,751 3,751 3,751 3,751 3,751Total cash used 64,763 61,955 92,460 57,437 63,168Net cash from (used by)
investing activities (63,538) (60,730) (91,235) (56,212) (61,943)

Bureau of Meteorology Budget Statements
Table 3.2.4: Budgeted Departmental Statement of Cash Flows(for the period ended 30 June) (continued)
137
Estimated Budget Forw ard Forw ard Forw ardactual estimate estimate estimate estimate
2013-14 2014-15 2015-16 2016-17 2017-18$'000 $'000 $'000 $'000 $'000
FINANCING ACTIVITIESCash received
Contributed equity 56,386 54,393 84,923 49,900 55,631Other - - - - -
Total cash received 56,386 54,393 84,923 49,900 55,631Cash used
Repayments of borrow ings - - - - -Dividends paid - - - - -Other - - - - -
Total cash used - - - - -Net cash from (used by)
financing activities 56,386 54,393 84,923 49,900 55,631Net increase (decrease)
in cash held - - - - -Cash and cash equivalents at the
beginning of the reporting period 1,195 1,195 1,195 1,195 1,195Cash and cash equivalents at the
end of the reporting period 1,195 1,195 1,195 1,195 1,195 Prepared on Australian Accounting Standards basis.

Bureau of Meteorology Budget Statements
Table 3.2.5: Departmental Capital Budget Statement
138
Estimated Budget Forw ard Forw ard Forw ardactual estimate estimate estimate estimate
2013-14 2014-15 2015-16 2016-17 2017-18$'000 $'000 $'000 $'000 $'000
NEW CAPITAL APPROPRIATIONSCapital budget - Bill 1 (DCB) 41,794 44,551 44,177 42,416 42,849Equity injections - Bill 2 14,592 9,842 40,746 7,484 12,782
Total new capital appropriations 56,386 54,393 84,923 49,900 55,631
Provided for:Purchase of non-financial assets 56,386 54,393 84,923 49,900 55,631
Total Items 56,386 54,393 84,923 49,900 55,631PURCHASE OF NON-FINANCIAL
ASSETSFunded by capital appropriations 1 14,834 9,842 40,746 7,484 12,782Funded by capital appropriation - DCB 2 42,973 44,551 44,177 42,416 42,849Funded internally from
departmental resources 3 3,205 3,811 3,786 3,786 3,786TOTAL 61,012 58,204 88,709 53,686 59,417
RECONCILIATION OF CASHUSED TO ACQUIRE ASSETSTO ASSET MOVEMENT TABLE
Total purchases 61,012 58,204 88,709 53,686 59,417Total cash used to
acquire assets 61,012 58,204 88,709 53,686 59,417
1 Includes both current Bill 2 and prior Act 2/4/6 appropriations and special capital appropriations2 Does not include annual f inance lease costs. Include purchase from current and previous
years' Departmental Capital Budgets (DCBs).3 Includes the follow ing sources of funding:
- current Bill 1 and prior year Act 1/3/5 appropriations (excluding amounts from the DCB).
- internally developed assets
- s31 relevant agency receipts (for FMA agencies only)
- proceeds from the sale of assets Prepared on Australian Accounting Standards basis.

Table 3.2.6: Statement of Asset Movements (2014-15)Asset Category (as appropriate)
Land Buildings Other property, Heritage Investment Computer L&B, IP&E Other Totalplant and and cultural property software and held for sale
equipment intangibles$'000 $'000 $'000 $'000 $'000 $'000 $'000 $'000 $'000
As at 1 J uly 2014Gross book value 13,370 87,882 441,032 110,020 652,304Accumulated depreciation/amortisation
and impairment (20,166) (173,170) (75,894) (269,230)Opening net book balance 13,370 67,716 267,862 - - 34,126 - - 383,074CAPITAL ASSET ADDITIONSEstimated expenditure on
new or replacement assetsBy purchase - appropriation equity 1 9,842 9,842By purchase - appropriation ordinary
annual services 2 168 6,412 28,849 9,122 44,551By purchase - other 1,200 2,611 3,811Total additions 168 7,612 41,302 - - 9,122 - - 58,204Other movementsDepreciation/amortisation expense (4,864) (51,373) (14,629) (70,866)Disposals 3
From disposal of entities or operations 1,200 25 1,225(including restructuring)
Total other movements - (3,664) (51,348) - - (14,629) - - (69,641)As at 30 J une 2015Gross book value 13,538 94,294 482,309 - - 119,142 - - 709,283Accumulated depreciation/amortisation
and impairment - (25,030) (224,543) - - (90,523) - - (340,096)Closing net book balance 13,538 69,264 257,766 - - 28,619 - - 369,1871 "Appropriation equity" refers to equity injections or Administered Assets and Liabilities appropriations provided throughAppropriation Bill (No.2) 2014-15, including CDABs.2 "Appropriation ordinary annual services" refers to funding provided through Appropriation Bill (No.1) 2014-15 for depreciation / amortisation expenses, DCBs or other operational expenses.3 Net proceeds may be returned to the OPA.
139
Bureau of Meteorology Budget Statem
ents

Bureau of Meteorology Budget Statements
Table 3.2.7: Schedule of Budgeted Income and Expenses Administered on Behalf of Government (for the period ended 30 June)
140
Bureau of Meteorology Budget Statem
ents

Bureau of Meteorology Budget Statements
Table 3.2.8: Schedule of Budgeted Assets and Liabilities Administered on Behalf of Government (as at 30 June)The schedule of budgeted assets and liabilities administered on behalf of Government does not apply to the Bureau.
141
Estimated Budget Forw ard Forw ard Forw ardactual estimate estimate estimate estimate
2013-14 2014-15 2015-16 2016-17 2017-18$'000 $'000 $'000 $'000 $'000
EXPENSES ADMINISTERED ONBEHALF OF GOVERNMENT
Total expenses administeredon behalf of Government - - - - -
LESS:OWN-SOURCE INCOMEOwn-source revenueTaxation revenueTotal taxation revenue - - - - -Non-taxation revenue
Sale of goods and rendering of services nfp nfp nfp nfp nfp
Total non-taxation revenue - - - - -Total own-source revenues
administered on behalf of Government - - - - -
Net Cost of (contribution by)services
Surplus (Deficit) - - - - -
Total comprehensive income (loss) - - - - - Prepared on Australian Accounting Standards basis.

Bureau of Meteorology Budget Statements
Table 3.2.9: Schedule of Budgeted Administered Cash Flows(for the period ended 30 June)
142
Estimated Budget Forw ard Forw ard Forw ardactual estimate estimate estimate estimate
2013-14 2014-15 2015-16 2016-17 2017-18$'000 $'000 $'000 $'000 $'000
OPERATING ACTIVITIESCash received
Sales of goods and rendering of services nfp nfp nfp nfp nfp
Total cash received - - - - -Cash used
OtherTotal cash used - - - - -Net cash from (used by)
operating activities - - - - -INVESTING ACTIVITIESCash received
Proceeds from sale ofproperty, plant and equipment
Proceeds from sales of investments
Repayments of advances and loansTransfers from other entitiesInvestmentsOther
Total cash received - - - - -

Bureau of Meteorology Budget Statements
Table 3.2.9: Schedule of Budgeted Administered Cash Flows(for the period ended 30 June) (continued)
143
Estimated Budget Forw ard Forw ard Forw ardactual estimate estimate estimate estimate
2013-14 2014-15 2015-16 2016-17 2017-18$'000 $'000 $'000 $'000 $'000
Cash usedOther
Total cash used - - - - -Net cash from (used by)
investing activities - - - - -FINANCING ACTIVITIESCash received
Proceeds from borrow ingOther
Total cash received - - - - -Cash used
Net repayment of borrow ingsOther
Total cash used - - - - -Net cash from (used by)
financing activities - - - - -Net increase (decrease) in
cash held - - - - -
Cash to Official Public Account for:- Appropriations nfp nfp nfp nfp nfp- Special Accounts- Transfers to other entities(Finance - Whole of Government)
- - - - -Effect of exchange rate
movements on cash and cash equivalents at the beginning ofreporting period
Cash and cash equivalents at endof reporting period
Prepared on Australian Accounting Standards basis.

Clean Energy Regulator
Agency Resources and Planned Performance
144
Bureau of Meteorology Budget Statem
ents
CLEAN ENERGY REGULATOR
Section 1: Agency Overview and Resources.........................................................1431.1 Strategic Direction Statement......................................................................1431.2 Agency Resource Statement.......................................................................1441.3 Budget Measures.........................................................................................145
Section 2: Outcomes and Planned Performance..................................................1472.1 Outcomes and Performance Information.....................................................147
Section 3: Explanatory Tables and Budgeted Financial Statements...................1523.1 Explanatory Tables......................................................................................1523.2 Budgeted Financial Statements...................................................................153
145
Bureau of Meteorology Budget Statem
ents

CLEAN ENERGY REGULATOR
Section 1: Agency Overview and Resources
1.1 STRATEGIC DIRECTION STATEMENT
The Clean Energy Regulator is a statutory authority established under the Clean Energy Regulator Act 2011 to administer the:
National Greenhouse and Energy Reporting Scheme
Carbon pricing mechanism*
Emissions Reduction Fund**
Australian National Registry of Emissions Units
Carbon Farming Initiative, and
Renewable Energy Target.
The Clean Energy Regulator’s purpose is to support the Australian Government’s Plan for a Cleaner Environment by:
providing education and information on the schemes it administers and how they work
collecting, analysing and assessing emissions and energy data, which underpins the reduction of net greenhouse gas emissions and supports Australia’s emissions and energy data needs
operating the Australian National Registry of Emissions Units and the Renewable Energy Certificate Registry
monitoring, facilitating and enforcing compliance with the schemes it administers
issuing Australian carbon credit units to projects that reduce greenhouse gas emissions
accrediting greenhouse and energy auditors who are engaged by the scheme participations and the Clean Energy Regulator to undertake audit activities under the schemes, and
working with other Commonwealth, State and Territory law enforcement and regulatory bodies.
* until such time as the carbon tax is repealed.
** subject to the enactment of the Emissions Reduction Fund legislation.
147

1.2 AGENCY RESOURCE STATEMENT
Table 1.1 shows the total resources from all sources. The table summarises how resources will be applied by outcome and by administered and departmental classification.
Table 1.1: Clean Energy Regulator Resource Statement — BudgetEstimates for 2014-15 as at Budget May 2014
148
Estimate Proposed Total Actualof prior + at Budget = estimate available
year amounts appropriation available in
2014-15 2014- 15 2014- 15 2013- 14$'000 $'000 $'000 $'000
Ordinary annual services1
Departmental appropriationPrior year departmental appropriation2 13,297 - 13,297 13,792Departmental appropriation3 - 77,896 77,896 83,375s31 Relevant agency receipts4 - - - 345Total 13,297 77,896 91,193 97,512
Administered expensesOutcome 1 - 79,269 79,269 3,745Total - 79,269 79,269 3,745
Total ordinary annual services A 13,297 157,165 170,462 101,257Other services 5
Departmental non- operatingEquity injections - 4,406 4,406 12,553Total - 4,406 4,406 12,553
Total other services B - 4,406 4,406 12,553Total available annual
appropriations 13,297 161,571 174,868 113,810Special appropriationsSpecial appropriations limited
by criteria/entitlementClean Energy Act 2011 6 - 332,896 332,896 3,466,479Renewable Energy (Electricity) Act 2000 - 2,588 2,588 1,606
Total special appropriations C - 335,484 335,484 3,468,085
Total resourcing (A+B+C) 13,297 497,055 510,352 3,581,8951 Appropriation Bill (No.1) 2014-15.2 Estimated adjusted balance carried forward from previous year.3 Includes an amount of $1.199m in 2014-15 for the Departmental Capital Budget (refer to table 3.2.5 forfurther details). For accounting purposes this amount has been designated as 'contributions by owners'.4 s31 Relevant Agency receipts - estimate.5 Appropriation Bill (No.2) 2014-15.6 Estimates have been developed in consultation with Treasury.Reader note: All figures are GST exclusive.

Clean Energy Regulator Budget Statements
1.3 BUDGET MEASURES
Budget measures in Part 1 relating to the Clean Energy Regulator are detailed in Budget Paper No. 2 and are summarised below.
Table 1.2: Agency 2014-15 Budget measuresPart 1: Measures announced since the 2013-14 MYEFO
149
Programme 2013-14 2014-15 2015-16 2016-17 2017-18$'000 $'000 $'000 $'000 $'000
Expense measuresEfficiency Dividend - a further 1.1temporary increase of 0.25 per cent
Departmental expenses - (197) (379) (561) (567)Total - (197) (379) (561) (567)National Greenhouse and Energy Reporting Scheme - 1.1improve eff iciency
Departmental expenses - (500) (500) (500) (500)Total - (500) (500) (500) (500)Emissions Reduction Fund - 1.1establishment
Administered expenses - 75,452 299,783 354,520 416,864Total - 75,452 299,783 354,520 416,864Total expense measures
Administered expenses - 75,452 299,783 354,520 416,864Departmental expenses - (697) (879) (1,061) (1,067)
Total - 74,755 298,904 353,459 415,797Capital measuresEfficiency Dividend - a further temporary increase of 1.10.25 per cent
Departmental capital - (3) (6) (9) (9)Total - (3) (6) (9) (9)Total capital measures
Departmental expenses - (3) (6) (9) (9)Total - (3) (6) (9) (9)Prepared on a Government Finance Statistics (f iscal) basis.

Clean Energy Regulator Budget Statements
Table 1.3 Changes to the Outcome and Programme Structures Since the Last Portfolio Statement
150
NewOutcome 1
Change Description:New outcome, created for Budget 2014-15, supercedes the old Outcome 1.
Old Statement:
Contribute to a reduction in Australia's net greenhouse gas emissions, including through the administration of market based mechanisms that incentivise reduction in emissions and the promotion of additional renew able electricity generation.
Contribute to a reduction in Australia’s net greenhouse gas emissions, including through the administration of a carbon price on liable emissions intensive businesses and other entities; promoting additional renew able electricity generation; and land-based initiatives that support carbon abatement.

Clean Energy Regulator Budget Statements
SECTION 2: OUTCOMES AND PLANNED PERFORMANCE
2.1 OUTCOMES AND PERFORMANCE INFORMATION
Government outcomes are the intended results, impacts or consequences of actions by the Government on the Australian community. Commonwealth programmes are the primary vehicle by which Government agencies achieve the intended results of their outcome statements. Agencies are required to identify the programmes which contribute to Government outcomes over the Budget and forward years.
Each outcome is described below together with its related programmes, specifying the performance indicators and targets used to assess and monitor the performance of the Clean Energy Regulator in achieving Government outcomes.
Outcome 1: Contribute to a reduction in Australia's net greenhouse gas emissions, including through the administration of market based mechanisms that incentivise reduction in emissions and the promotion of additional renewable electricity generation.
Outcome 1 StrategyThe strategy for the delivery of this outcome contains a series of operational objectives.
These are to:
• ensure that regulated entities are meeting their obligations, reporting correct information and receiving entitlements
• protect the integrity of instruments (units)
• administer the schemes effectively
• build confidence in the market and the Clean Energy Regulator, and
• provide data and information to assist decision makers.
The Clean Energy Regulator takes a risk-based approach to ensure it achieves its objectives efficiently. It deploys the compliance and enforcement tools at its disposal judiciously and continues to streamline systems and processes used by its clients.
Outcome Expense Statement
Table 2.1 provides an overview of the total expenses for outcome 1 by programme.
151

Clean Energy Regulator Budget Statements
Table 2.1: Budgeted Expenses for Outcome 1
152
2013-14 2014-15Estimated Estimated
actual expensesexpenses
$'000 $'000Programme 1.1: Clean Energy RegulatorAdministered expenses
Ordinary annual services (Appropriation Bill No. 1) 3,745 79,269Special appropriations 3,533,750 2,588
Departmental expensesDepartmental appropriation 1 81,698 76,697
Expenses not requiring appropriation in the Budget year 2 17,524 13,216Total for Programme 1.1 3,636,717 171,770
Outcome 1 Totals by appropriation typeAdministered expenses
Ordinary annual services (Appropriation Bill No. 1) 3,745 79,269Special appropriations 3,533,750 2,588
Departmental expensesDepartmental appropriation 1 81,698 76,697
Expenses not requiring appropriation in the Budget year 2 17,524 13,216Total expenses for Outcome 1 3,636,717 171,770
2013-14 2014-15Average Staffing Level (number) 338 3391 Departmental Appropriation combines "Ordinary annual services (Appropriation Bill No. 1)" and"Revenue from independent sources (s31)".2 Expenses not requiring appropriation in the Budget year is made up of depreciation expense, amortisation expense and audit fees.
Outcome 1: Contribute to a reduction in Australia's net greenhouse gas emissions, including through the administration of market based mechanisms that incentivise reduction in emissions and promote additional renew able electricity generation.

Clean Energy Regulator Budget Statements
Contributions to Outcome 1
Programme 1.1: Clean Energy Regulator
Programme Objective• Effective and efficient regulation of greenhouse and energy reporting and market
based schemes that contribute to a reduction in Australia’s net greenhouse gas emissions and promote investment in renewable energy.
Linked to:
• Department of the Environment Programme 2.1: Reducing Australia’s Greenhouse Gas Emissions
153
Programme Expenses 1.1: Clean Energy Regulator2013-14 2014-15 2015-16 2016-17 2017-18
Estimated Budget Forw ard Forw ard Forw ardactual estimate estimate estimate$'000 $'000 $'000 $'000 $'000
Annual administered expenses:Administered item 3,745 79,269 303,600 358,337 420,681
Special Appropriations:Clean Energy Act 2011 3,532,144 - - - -Renewable Energy (Electricity) Act 2000 1,606 2,588 2,947 2,617 2,910
Programme support 81,698 76,697 73,722 72,752 73,477Expenses not requiring appropriation in
the Budget year 1 17,524 13,216 14,649 14,685 8,152Total Programme expenses 3,636,717 171,770 394,918 448,391 505,2201 Expenses not requiring appropriation in the Budget year is made up of depreciation expense, amortisation expense and audit fees.

Clean Energy Regulator Budget Statements
Programme 1.1 Deliverables • Administration of market based schemes that contribute to a reduction in
greenhouse gas emissions, including the Emissions Reduction Fund from 1 July 2014*.
• Administration of the National Greenhouse and Energy Reporting Scheme to:
- inform Government policy formulation and the Australian public
- underpin Australia’s international reporting obligations
- assist Commonwealth, State and Territory Government programmes and activities, and
- reduce the need for duplication of similar reporting requirements by the States and Territories.
• Operation of the Renewable Energy Target by:
- ensuring the integrity of renewable energy certificate market supply (certificates created)
- ensuring the integrity of renewable energy certificate market demand (certificates surrendered), and
- maintaining the registry that facilitates administration of renewable energy certificates by market participants.
• Maintenance of the electronic register for emissions units that:
- enables Australia to meet its commitment under the Kyoto Protocol
- allows for the issuance and management of Australian carbon credit units created through approved projects that reduce net greenhouse gas emissions, and
- allows for the management of carbon tax liabilities and issuance of units for industry assistance.
* subject to the enactment of the Emissions Reduction Fund legislation.
154

Clean Energy Regulator Budget Statements
Programme 1.1 Key Performance Indicators • Increased issuance of Australian carbon credit units for projects that reduce
greenhouse gas emissions.
• Additional generation of electricity from renewable sources consistent with annual legislated demand under the Renewable Energy Target.
• Participants in our schemes achieve over 95 per cent compliance with obligations.
• Clients are satisfied with the service, and respect the decisions, of the Clean Energy Regulator.
• Electronic registry of emissions units is available for public access for 99 per cent of time (excluding scheduled outages) and operates in accordance with United Nations Framework Convention on Climate Change requirements and directed Data Exchange Standards.
• Data publication and information sharing that is relevant, accurate and timely and meets user needs.
155

Clean Energy Regulator Budget Statements
Section 3: Explanatory Tables and Budgeted Financial StatementsSection 3 presents explanatory tables and budgeted financial statements which provide a comprehensive snapshot of agency finances for the 2014-15 Budget year. It explains how budget plans are incorporated into the financial statements and provides further details of the reconciliation between appropriations and programme expenses, movements in administered funds, special accounts and Australian Government Indigenous expenditure.
3.1 EXPLANATORY TABLES
3.1.1 Movement of Administered Funds Between YearsThere have been no movement of administered funds between years in the 2014-15 Budget, therefore Table 3.1.1 is not presented.
3.1.2 Special AccountsSpecial Accounts provide a means to set aside and record amounts used for specified purposes. Special Accounts can be created by a Finance Minister’s Determination under the Financial Management and Accountability Act 1997 or under separate enabling legislation. Table 3.1.2 shows the expected additions (receipts) and reductions (payments) for each account used by Clean Energy Regulator.
Table 3.1.2: Estimates of Special Account Flows and Balances
156
Opening Closingbalance Receipts Payments Adjustments balance2014-15 2014-15 2014-15 2014-15 2014-152013-14 2013-14 2013-14 2013-14 2013-14
Outcome $'000 $'000 $'000 $'000 $'000Renew able Energy Special
Account (Administered) 1 - 26,400 (26,400) - -Total Special Accounts
2014-15 Budget estimate - 26,400 (26,400) - -Total Special Accounts
2013-14 estimated actual - 239 (239) - -

Clean Energy Regulator Budget Statements
3.2 BUDGETED FINANCIAL STATEMENTS
3.2.1 Differences in Agency Resourcing and Financial StatementsThe Clean Energy Regulator has no significant differences between the resource information presented in the Budget Papers and the Portfolio Budget Statements.
3.2.2 Analysis of Budgeted Financial StatementsThe Clean Energy Regulator is budgeting to incur expenses of $89.9 million in 2014-15.
The Clean Energy Regulator is budgeting for a break-even position in 2014-15 excluding non-appropriated expenses relating to depreciation and amortisation.
157

Clean Energy Regulator Budget Statements
3.2.3 Budgeted Financial Statements TablesTable 3.2.1 Comprehensive Income Statement (Showing Net Cost of Services) for the period ended 30 June
Prepared on Australian Accounting Standards basis.
158
Estimated Budget Forw ard Forw ard Forw ardactual estimate estimate estimate estimate
2013-14 2014-15 2015-16 2016-17 2017-18$'000 $'000 $'000 $'000 $'000
EXPENSESEmployee benefits 44,223 44,660 44,894 45,119 45,337Suppliers 37,887 32,447 29,236 28,044 28,551Depreciation and amortisation 17,059 12,751 14,184 14,220 7,687Finance costs 53 55 57 54 54Total expenses 99,222 89,913 88,371 87,437 81,629LESS: OWN-SOURCE INCOMEOwn-source revenueSale of goods and rendering of services 345 - - - -Total own-source revenue 345 - - - -GainsOther 465 465 465 465 465Total gains 465 465 465 465 465Total own-source income 810 465 465 465 465Net cost of (contribution by)
services 98,412 89,448 87,906 86,972 81,164Revenue from Government 81,353 76,697 73,722 72,752 73,477
Surplus (Deficit) (17,059) (12,751) (14,184) (14,220) (7,687)OTHER COMPREHENSIVE INCOMEChanges in asset revaluation surplus - - - - -Total other comprehensive income - - - - -Total comprehensive income (loss) (17,059) (12,751) (14,184) (14,220) (7,687)
Note: Impact of Net Cash Appropriation Arrangements2013-14 2014-15 2015-16 2016-17 2017-18
$'000 $'000 $'000 $'000 $'000Total comprehensive income
(loss) excluding depreciation/amortisationexpenses previously funded throughrevenue appropriations. - - - - -
less depreciation/amortisation expensespreviously funded through revenueappropriations1 17,059 12,751 14,184 14,220 7,687
Total comprehensive income (loss) - as per the Statement ofComprehensive Income (17,059) (12,751) (14,184) (14,220) (7,687)
1 From 2010-11, the Government introduced net cash appropriation arrangements w here Bill 1 revenue appropriations for the depreciation/amortisation expenses of FMA Act agencies w ere replaced w ith a separate capital budget (the Departmental Capital Budget, or DCB) provided through Bill 1 equity appropriations. For information regarding DCBs, please refer to Table 3.2.5 Departmental Capital Budget Statement.
Prepared on Australian Accounting Standards basis.

Clean Energy Regulator Budget Statements
Table 3.2.2: Budgeted Departmental Balance Sheet(as at 30 June)
159
Estimated Budget Forw ard Forw ard Forw ardactual estimate estimate estimate estimate
2013-14 2014-15 2015-16 2016-17 2017-18$'000 $'000 $'000 $'000 $'000
ASSETSFinancial assets
Cash and cash equivalents 297 297 297 297 297Trade and other receivables 14,009 14,332 14,794 15,357 16,170Other f inancial assets 88 - - - -
Total financial assets 14,394 14,629 15,091 15,654 16,467 Non-financial assets
Land and buildings 5,540 3,638 1,736 1 1Property, plant and equipment 608 344 702 550 403Intangibles 44,031 39,051 27,599 16,456 10,118Other non-financial assets 424 424 424 424 424
Total non-financial assets 50,603 43,457 30,461 17,431 10,946 Total assets 64,997 58,086 45,552 33,085 27,413 LIABILITIESPayables
Suppliers 9,820 9,278 9,082 9,081 9,081Other payables 1,501 1,524 1,407 1,178 1,178
Total payables 11,321 10,802 10,489 10,259 10,259 Provisions
Employee provisions 9,915 10,614 11,332 12,071 12,830Other provisions 1,460 1,515 1,572 1,626 1,680
Total provisions 11,375 12,129 12,904 13,697 14,510 Total liabilities 22,696 22,931 23,393 23,956 24,769 Net assets 42,301 35,155 22,159 9,129 2,644 EQUITYParent entity interest
Contributed equity 71,837 77,442 78,630 79,820 81,022Reserves 3,581 3,581 3,581 3,581 3,581Retained surplus
(accumulated def icit) (33,117) (45,868) (60,052) (74,272) (81,959)Total equity 42,301 35,155 22,159 9,129 2,644Prepared on Australian Accounting Standards basis.

Clean Energy Regulator Budget Statements
Table 3.2.3: Departmental Statement of Changes in Equity — Summary of Movement (Budget Year 2014-15)
160
Retained Asset Contributed Totalearnings revaluation equity/ equity
reserve capital$'000 $'000 $'000 $'000
Opening balance as at 1 July 2014Balance carried forw ard from
previous period (33,117) 3,581 71,837 42,301Adjusted opening balance (33,117) 3,581 71,837 42,301Comprehensive income
Other comprehensive income - - - -Surplus (Deficit) for the period (12,751) - - (12,751)
Total comprehensive income (12,751) - - (12,751)Transactions w ith owners
Contributions by ownersEquity Injection - Appropriation - - 4,406 4,406Departmental Capital Budget (DCBs) - - 1,199 1,199
Sub-total transactions w ith owners - - 5,605 5,605Estimated closing balance
as at 30 June 2015 (45,868) 3,581 77,442 35,155Prepared on Australian Accounting Standards basis.

Clean Energy Regulator Budget Statements
Table 3.2.4: Budgeted Departmental Statement of Cash Flows(for the period ended 30 June)
161
Estimated Budget Forw ard Forw ard Forw ardactual estimate estimate estimate estimate
2013-14 2014-15 2015-16 2016-17 2017-18$'000 $'000 $'000 $'000 $'000
OPERATING ACTIVITIESCash received
Appropriations 81,551 76,373 73,189 72,117 72,592Receipts from Government 74 88 - - -Sale of goods and rendering of services 775 - - - -
Total cash received 82,400 76,461 73,189 72,117 72,592Cash used
Employees 43,739 43,961 44,176 44,380 44,578Suppliers 38,661 32,500 29,013 27,737 28,014
Total cash used 82,400 76,461 73,189 72,117 72,592Net cash from (used by)
operating activities - - - - -INVESTING ACTIVITIESCash used
Purchase of property, equipmentand intangibles 14,575 5,605 1,188 1,190 1,202
Total cash used 14,575 5,605 1,188 1,190 1,202Net cash from (used by)
investing activities (14,575) (5,605) (1,188) (1,190) (1,202)FINANCING ACTIVITIESCash received
Contributed equity 14,575 5,605 1,188 1,190 1,202Total cash received 14,575 5,605 1,188 1,190 1,202Net cash from (used by)
financing activities 14,575 5,605 1,188 1,190 1,202Net increase (decrease)
in cash held - - - - -Cash and cash equivalents at the
beginning of the reporting period 297 297 297 297 297Cash and cash equivalents at the
end of the reporting period 297 297 297 297 297Prepared on Australian Accounting Standards basis.

Clean Energy Regulator Budget Statements
Table 3.2.5: Departmental Capital Budget Statement
Prepared on Australian Accounting Standards basis.
162
Estimated Budget Forw ard Forw ard Forw ardactual estimate estimate estimate estimate
2013-14 2014-15 2015-16 2016-17 2017-18$'000 $'000 $'000 $'000 $'000
NEW CAPITAL APPROPRIATIONSCapital budget - Bill 1 (DCB) 2,022 1,199 1,188 1,190 1,202Equity injections - Bill 2 12,553 4,406 - - -
Total new capital appropriations 14,575 5,605 1,188 1,190 1,202Provided for:
Purchase of non-financial assets 14,575 5,605 1,188 1,190 1,202Total items 14,575 5,605 1,188 1,190 1,202
PURCHASE OF NON-FINANCIALASSETSFunded by capital appropriations 1 12,553 4,406 - - -Funded by capital appropriation - DCB 2 2,022 1,199 1,188 1,190 1,202
Total 14,575 5,605 1,188 1,190 1,202
RECONCILIATION OF CASHUSED TO ACQUIRE ASSETSTO ASSET MOVEMENT TABLE
Total purchases 14,575 5,605 1,188 1,190 1,202Total cash used to
acquire assets 14,575 5,605 1,188 1,190 1,202Consistent w ith information contained in the Statement of Asset Movements. and the Budgeted Statement of Cashflow s.1 Includes both current Bill 2 and prior Act 2/4/6 appropriations and special capital appropriations.2 Does not include annual f inance lease costs. Includes purchases from current and previous
years' Departmental Capital Budgets (DCBs).

Table 3.2.6: Statement of Asset Movements (2014-15)Buildings Other property, Computer Total
plant and software andequipment intangibles
$'000 $'000 $'000 $'000As at 1 J uly 2014Gross book value 7,612 950 74,173 82,735Accumulated depreciation/amortisation
and impairment (2,072) (342) (30,142) (32,556)Opening net book balance 5,540 608 44,031 50,179CAPITAL ASSET ADDITIONSEstimated expenditure on
new or replacement assetsBy purchase - appropriation equity 1 - - 4,406 4,406By purchase - appropriation ordinary
annual services 2 - - 1,199 1,199Total additions - - 5,605 5,605Other movementsDepreciation/amortisation expense (1,902) (264) (10,585) (12,751)Total other movements (1,902) (264) (10,585) (12,751)As at 30 J une 2015Gross book value 7,612 950 79,778 88,340Accumulated depreciation/amortisation
and impairment (3,974) (606) (40,727) (45,307)Closing net book balance 3,638 344 39,051 43,033Prepared on Australian Accounting Standards basis.1 "Appropriation equity" refers to equity injections provided through Appropriation Bill Appropriation Bill (No.2) 2014-15.2 "Appropriation ordinary annual services" refers to funding provided through AppropriationBill (No.1) 2014-15 for depreciation / amortisation expenses, DCBs or other operational expenses.
163
Clean Energy Regulator Budget Statements

Clean Energy Regulator Budget Statements
Table 3.2.7: Schedule of Budgeted Income and Expenses Administered on Behalf of Government (for the period ended 30 June)
164
Estimated Budget Forw ard Forw ard Forw ardactual estimate estimate estimate estimate
2013-14 2014-15 2015-16 2016-17 2017-18$'000 $'000 $'000 $'000 $'000
EXPENSES ADMINISTERED ONBEHALF OF GOVERNMENTSuppliers 5,351 6,405 6,764 6,434 6,727Purchase of emissions reductions - 75,452 299,783 354,520 416,864
Total expenses administeredon behalf of Government 5,351 81,857 306,547 360,954 423,591
LESS:OWN-SOURCE INCOMEOwn-source revenueTaxation revenue
Carbon price permits 1 7,340,000 - - - -Value of free permits and carbon credits 1 (3,532,144) - - - -Other taxes 6,088 5,817 5,635 5,954 6,373
Total taxation revenue 3,813,944 5,817 5,635 5,954 6,373Non-taxation revenue
Fees and f ines 12,645 12,015 12,265 12,758 13,344Total non-taxation revenue 12,645 12,015 12,265 12,758 13,344Total own-source revenues
administered on behalf of Government 3,826,589 17,832 17,900 18,712 19,717
GainsFair value gains carbon price 1 156,732
Total gains administeredon behalf of Government 156,732 - - - -
Total own-sourced incomeadministered on behalf ofGovernment 3,983,321 17,832 17,900 18,712 19,717
Net Cost of (contribution by)services (3,977,970) 64,025 288,647 342,242 403,874
Total comprehensive income(loss) 3,977,970 (64,025) (288,647) (342,242) (403,874)
Prepared on Australian Accounting Standards basis.

Clean Energy Regulator Budget Statements
Table 3.2.8: Schedule of Budgeted Assets and Liabilities Administered on Behalf of Government (as at 30 June)
165
Estimated Budget Forw ard Forw ard Forw ardactual estimate estimate estimate estimate
2013-14 2014-15 2015-16 2016-17 2017-18$'000 $'000 $'000 $'000 $'000
ASSETSFinancial assets
Cash and cash equivalents 1,305 1,305 1,305 1,305 1,305Carbon price revenue receivables 1 1,695,000 - - - -Trade and other receivables 81 81 81 81 81
Total financial assets 1,696,386 1,386 1,386 1,386 1,386Total assets administered
on behalf of Government 1,696,386 1,386 1,386 1,386 1,386LIABILITIESPayables
Suppliers 3,667 3,667 3,667 3,667 3,667Subsidies 1 332,896 - - - -
Total payables 336,563 3,667 3,667 3,667 3,667Provisions
Other provisions 262 262 262 262 262Total provisions 262 262 262 262 262Total liabilities administered
on behalf of Government 336,825 3,929 3,929 3,929 3,929Net assets/(liabilities) 1,359,561 (2,543) (2,543) (2,543) (2,543)Prepared on Australian Accounting Standards basis.1 Estimates have been developed in consultation w ith Treasury.

Clean Energy Regulator Budget Statements
Table 3.2.9: Schedule of Budgeted Administered Cash Flows(for the period ended 30 June)
166
Estimated Budget Forw ard Forw ard Forw ardactual estimate estimate estimate estimate
2013-14 2014-15 2015-16 2016-17 2017-18$'000 $'000 $'000 $'000 $'000
OPERATING ACTIVITIESCash received
Carbon price and other receipts1 7,186,088 1,700,817 5,635 5,954 6,373Fees 12,645 12,015 12,265 12,758 13,344
Total cash received 7,198,733 1,712,832 17,900 18,712 19,717Cash used
Suppliers 5,351 6,405 6,764 6,434 6,727Purchase of emissions reductions - 75,452 299,783 354,520 416,864Subsidies paid 1 3,466,479 332,896 - - -
Total cash used 3,471,830 414,753 306,547 360,954 423,591Net cash from (used by)
operating activities 3,726,903 1,298,079 (288,647) (342,242) (403,874)Net increase (decrease) in
cash held 3,726,903 1,298,079 (288,647) (342,242) (403,874)Cash and cash equivalents at
beginning of reporting period 1,305 1,305 1,305 1,305 1,305Cash from Official Public
Account for: - Appropriations 3,471,830 414,753 306,547 360,954 423,591Total 3,471,830 414,753 306,547 360,954 423,591
Cash to Official PublicAccount for:'- Appropriations (7,198,733) (1,712,832) (17,900) (18,712) (19,717)
Total (7,198,733) (1,712,832) (17,900) (18,712) (19,717)Cash and cash equivalents at endof reporting period 1,305 1,305 1,305 1,305 1,305Prepared on Australian Accounting Standards basis.1 Estimates have been developed in consultation w ith Treasury.

Clean Energy Regulator Budget Statements
3.2.4 Notes to the Financial StatementsThe statements have been prepared in accordance with:
Finance Minister’s Orders (FMOs), being the Financial Management and Accountability Orders;
Australian Equivalents of International Financial Reporting Standards (AEIFRS) issued by the Australian Accounting Standards Board (AASB) that apply for the reporting period; and
Interpretations issued by the AASB and Urgent Issues Group (UIG) that apply for the reporting period.
The statements have been prepared on an accrual basis and are in accordance with historical cost principles except for certain assets, which, as noted, are at valuation.
DepartmentalIncomeIncome includes the following items:
Revenues from Government—amounts appropriated to the Agency; and
Goods and Services—revenue is recognised upon the delivery of goods and services to customers.
ExpensesAll expenses are recognised on an accrual basis, as and when these can be reliably estimated.
AssetsLand, buildings, plant and equipment are carried at their fair value.
Non-current assets are reviewed at balance date for internal and external indications of impairment. Where indications of impairment are identified for an asset, its recoverable amount is determined and where lower than its carrying amount, written down to that amount.
The Department’s intangible assets comprise the acquisition of software configured for internal use and internally developed software. These assets are carried at cost less accumulated amortisation and accumulated impairment losses.
LiabilitiesLiabilities for services rendered by employees are recognised at the reporting date to the extent that they have not been settled. The liability for employee benefits includes provision for annual leave and long service leave.
167

Clean Energy Regulator Budget Statements
Liabilities for ‘short-term employee benefits’ (as defined in AASB 119) and termination benefits due within twelve months of balance date are measured at their nominal amounts. The nominal amount is calculated with regard to the rates expected to be paid on settlement of the liability. All other employee benefit liabilities are measured as the present value of the estimated future cash outflows to be made in respect of services provided by employees up to the reporting date.
Trade creditors and accruals are recognised at their nominal amounts, being the amounts at which the liabilities will be settled which represent their fair value. Liabilities are recognised to the extent that the goods or services have been received (and irrespective of having been invoiced).
AdministeredAdministered items are accounted for on the same basis and using the same policies as for departmental items, including the application of Australian Accounting Standards.
168

Director of National Parks
Agency Resources and Planned Performance
169

DIRECTOR OF NATIONAL PARKS
Section 1: Agency Overview and Resources.........................................................1691.1 Strategic Direction Statement......................................................................1691.2 Agency Resource Statement.......................................................................1711.3 Budget Measures.........................................................................................172
Section 2: Outcomes and Planned Performance..................................................1732.1 Outcomes and Performance Information.....................................................173
Section 3: Explanatory Tables and Budgeted Financial Statements...................1793.1 Explanatory Tables......................................................................................1793.2 Budgeted Financial Statements...................................................................180
171

DIRECTOR OF NATIONAL PARKS
Section 1: Agency Overview and Resources
1.1 STRATEGIC DIRECTION STATEMENT
The Director of National Parks (DNP) is Commonwealth and statutory authority, under the Environment Protection and Biodiversity Conservation Act 1999 (the EPBC Act) to administer and manage Commonwealth reserves (national parks, botanic gardens, marine and terrestrial reserves) declared under the EPBC Act.
These reserves include: Booderee, Kakadu and Uluru-Kata Tjuta National Parks, which are each jointly managed with their Aboriginal traditional owners; national parks in the Australian territories of Norfolk, Christmas and Cocos (Keeling) Islands; the Australian National Botanic Gardens, which is a major national institution for the study of Australian plants; and the recently declared Commonwealth marine reserves. Kakadu and Uluru-Kata Tjuta National Parks are World Heritage listed.
The reserves also include Commonwealth marine reserves in the South West, North West, North and Temperate East marine regions and the Coral Sea. These reserves, together with the South East marine reserves network and a number of pre-existing reserves in each region comprise the Commonwealth waters component of the National Representative System of Marine Protected Areas.
A significant focus in 2014-15 is a Marine Reserves Review to ensure the management of Australia’s Commonwealth marine reserve network is based on scientific rigor and genuine consultation with communities and businesses, and restore confidence in the Commonwealth marine reserve planning process. Management Plans for the new Commonwealth marine reserves around Australia will be developed following the review and, until then, transitional management arrangements will be in place.
In partnership with the New South Wales National Parks and Wildlife Service and the International Union for the Conservation of Nature (IUCN), the DNP will co-host the sixth IUCN World Parks Congress in November 2014. The World Parks Congress is a one in ten year event which sets the global agenda for protected area conservation for a decade to come. The aim of the Congress is to position parks and protected areas firmly within broader economic and community wellbeing goals.
Priority outcomes continue to be the conservation and appreciation of the natural and cultural values of Commonwealth reserves, including the provision of inspirational, rewarding and safe visitor experiences, the control of invasive species and working with stakeholders and neighbours. In the jointly managed parks, improving Indigenous employment and participation in management is also a priority.
173

The DNP will also continue to improve visitor facilities in reserves and further develop partnerships with the tourism industry.
To deliver these priorities, within the current Government’s fiscal strategy, the DNP will continue to diversify and increase external revenue, seek further improvements in the efficiency of resource use and continue to invest in the skills and capabilities of our staff.
Diagram 1: Location of Commonwealth Parks and Reserves
174

Director of National Parks Budget Statements
1.2 AGENCY RESOURCE STATEMENT
Table 1.1 shows the total resources from all sources. The table summarises how resources will be applied by outcome and by administered and departmental classification.
Table 1.1: Director of National Parks Resource Statement — BudgetEstimates for 2014-15 as at Budget May 2014
175
Table 1.1: Director of National Parks Resource StatementBudget Estimates for 2014- 15 as at Budget May 2014
Estimate Proposed Total Actualof prior + at Budget = estimate available
year amounts appropriation available in
2014-15 2014-15 2014-15 2013-14Source $'000 $'000 $'000 $'000Opening balance/Reserves at bank 34,225 34,225 42,847 REVENUE FROM GOVERNMENT
Payments from related entities1
Amounts from the portfolio department 41,061 41,061 41,497 Total - 41,061 41,061 41,497 -
Total funds from Government - 41,061 41,061 41,497
FUNDS FROM OTHER SOURCESInterest 655 655 655 Royalties - Sale of goods and services 18,009 18,009 14,280 Other 277 277 277 Total - 18,941 18,941 15,212
Total net resourcing for agency 34,225 60,002 94,227 99,556
All figures are GST exclusiveThe Director of National Parks is not directly appropriated as it is a CAC Act body. Appropriations are made to the Department of the Environment which are then paid to the Director of of National Parks and are considered 'departmental' for all purposes.
1 Funding provided by a Government body that is not specified within the annual appropriation bills as a payment to the CAC Act body (for example, a fee for service from an FMA Act agency paid to a CAC Act body would appear here and may be explained within this footnote, as would a payment from a third agency's special appropriation).

Director of National Parks Budget Statements
1.3 BUDGET MEASURES
There are no Budget measures relating to the DNP in 2014-15.
176

Director of National Parks Budget Statements
SECTION 2: OUTCOMES AND PLANNED PERFORMANCE
2.1 OUTCOMES AND PERFORMANCE INFORMATION
Government outcomes are the intended results, impacts or consequences of actions by the Government on the Australian community. Commonwealth programmes are the primary vehicle by which Government agencies achieve the intended results of their outcome statements. Agencies are required to identify the programmes which contribute to Government outcomes over the Budget and forward years.
Each outcome is described below together with its related programmes, specifying the performance indicators and targets used to assess and monitor the performance of the DNP in achieving Government outcomes.
Outcome 1: Conservation and appreciation of Commonwealth reserves through the provision of safe visitor access, the control of invasive species and working with stakeholders and neighbours.
Outcome 1 StrategyContinue, within the limits of available resources to: systematically repair and replace essential infrastructure and assets; control priority feral animal and weed species; provide for safe, inspirational and rewarding visitor experiences; train, develop and employ directly or indirectly local Indigenous staff; provide safe workplaces; value and develop staff; manage resources efficiently and transparently; and work closely with key stakeholders, neighbours and partners to achieve shared objectives.
Outcome Expense Statement
Table 2.1 provides an overview of the total expenses for outcome 1, by programme.
177

Director of National Parks Budget Statements
Table 2.1: Budgeted Expenses for Outcome 1
178
Outcome 1: 2013-14 2014-15Estimated Estimated
actual expensesexpenses
$'000 $'000Programme 1.1: Parks and ReservesRevenue from Government
Payment from related entities 41,497 41,061Revenues from other independent sources 19,112 22,841Expenses not requiring appropriation in the Budget year 1 12,442 6,389
Total for Programme 1.1 73,051 70,291
Total expenses for Outcome 1 73,051 70,2912013-14 2014-15
Average Staffing Level (number) 270 275
Conservation and appreciation of Commonw ealth reserves through the provision of safe visitor access, the control of invasive species and w orking w ith stakeholders and neighbours
1 Expenses not requiring appropriation consist of depreciation, amortisation expense and an approved operating loss.

Director of National Parks Budget Statements
Contributions to Outcome 1
Programme 1.1: Parks and Reserves
Programme Objective• Conserve and maintain natural and cultural values of Commonwealth reserves
through improved knowledge and effective management, using science, monitoring, research and local knowledge to prioritise and refine management actions.
• Improve engagement of traditional owners and local community partners in the management of Commonwealth reserves through capacity building, effective governance arrangements and Indigenous employment opportunities.
• Promote and enhance public awareness, appreciation and enjoyment, and foster stewardship of Commonwealth reserves through building partnerships, to facilitate appropriate use of reserves and provide high quality visitor experiences and information.
• Improve the efficiency and effectiveness of the Director of National Parks and safety within Commonwealth reserves through the development and delivery of work health and safety, risk and business systems.
179

Director of National Parks Budget Statements
Programme ExpensesMovements in total expenses over the forward years primarily reflect changes in depreciation expenses as a result of an asset revaluation in 2010-11.
180
Programme Expenses 1.1 Parks and Reserves2013-14 2014-15 2015-16 2016-17 2017-18
Estimated Budget Forw ard Forw ard Forw ardactual estimate estimate estimate
('000) $'000 $'000 $'000 $'000 $'000Annual departmental expenses:
Parks and Reserves 60,609 63,902 60,928 60,542 57,540 Expenses not requiring appropriation in
the Budget year 1 12,442 6,389 5,769 5,269 4,262 Total Programme expenses 73,051 70,291 66,697 65,811 61,802
1 Expenses not requiring appropriation consist of depreciation, amortisation expense and an approved operating loss.
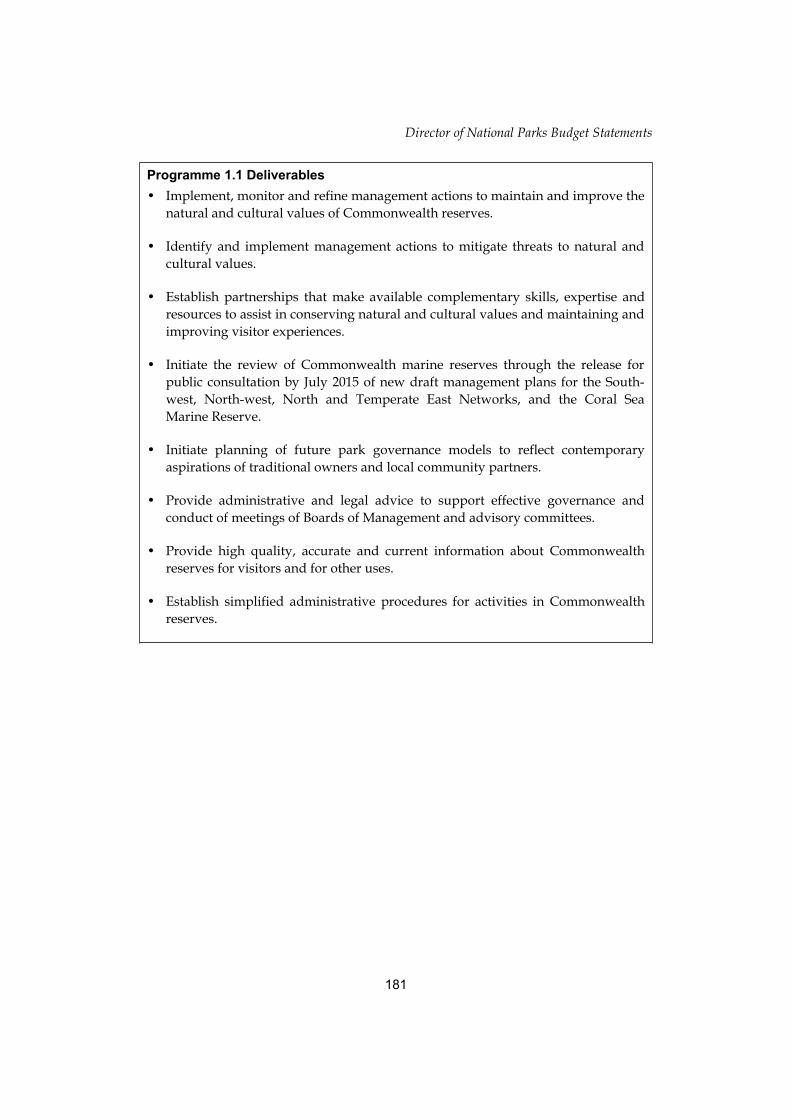
Director of National Parks Budget Statements
Programme 1.1 Deliverables • Implement, monitor and refine management actions to maintain and improve the
natural and cultural values of Commonwealth reserves.
• Identify and implement management actions to mitigate threats to natural and cultural values.
• Establish partnerships that make available complementary skills, expertise and resources to assist in conserving natural and cultural values and maintaining and improving visitor experiences.
• Initiate the review of Commonwealth marine reserves through the release for public consultation by July 2015 of new draft management plans for the South-west, North-west, North and Temperate East Networks, and the Coral Sea Marine Reserve.
• Initiate planning of future park governance models to reflect contemporary aspirations of traditional owners and local community partners.
• Provide administrative and legal advice to support effective governance and conduct of meetings of Boards of Management and advisory committees.
• Provide high quality, accurate and current information about Commonwealth reserves for visitors and for other uses.
• Establish simplified administrative procedures for activities in Commonwealth reserves.
181

Director of National Parks Budget Statements
Programme 1.1 Key Performance Indicators • Maintain or improve the status of significant species and priority cultural sites.
• Inform management actions through ensuring all outcomes of scientific research conducted within Commonwealth reserves are made available to the Director within one month of publication.
• Maintain or increase number of Indigenous staff (FTE) employed in jointly managed parks [% of total staff in those parks against previous year].
• Results of consultation processes relevant to management planning are made available to decision makers for timely consideration.
• Maintain or improve level of visitor satisfaction with their experiences in Commonwealth reserves [% against previous year].
• In the annual Comcover Risk Management Benchmarking Survey, achieve an overall risk maturity level of ‘Structured’ or above.
• The number of Comcare investigations is less than five per cent of the total notifiable incidents* reported to the regulator Comcare.
* An incident is notifiable to Comcare if it arises out of the conduct of a business or undertaking and results in the death, serious injury or serious illness of a person or involves a dangerous incident.
182

Director of National Parks Budget Statements
Section 3: Explanatory Tables and Budgeted Financial StatementsSection 3 presents explanatory tables and budgeted financial statements which provide a comprehensive snapshot of agency finances for the 2014-15 budget year. It explains how budget plans are incorporated into the financial statements and provides further details of the reconciliation between appropriations and programme expenses, movements in administered funds, special accounts and Australian Government Indigenous expenditure.
3.1 EXPLANATORY TABLES
3.1.1 Movement of Administered Funds Between YearsThere are no movements of administered funds between years for the DNP.
3.1.2 Special AccountsDNP does not manage any special accounts.
3.1.3 Australian Government Indigenous ExpenditureThe 2014-15 Australian Government Indigenous Expenditure Statement is not applicable because the DNP has no Indigenous specific expenses, although significant investments are being made in training and employment of Indigenous people in jointly managed parks.
183

Director of National Parks Budget Statements
3.2 BUDGETED FINANCIAL STATEMENTS
3.2.1 Differences in Agency Resourcing and Financial StatementsThere are no differences between the resource information presented in the Budget Papers and Portfolio Budget Submission as a result of differences between Australian Accountant Standards (AAS) and Government Finance Statistics (GFS).
3.2.2 Analysis of Budgeted Financial StatementsMovements in sale of goods and services primarily represent existing Memorandum of Understanding Agreements ceasing over the forward estimates, including agreements relating to Worlds Parks Congress (approximately $2 million in 2015-16) and Bush Blitz II (approximately $3 million in 2017-16). The increase in own-source revenue between 2013-14 and 2014- 15 predominately relates to increased allocations within these agreements.
Other gains of $3.9 million relate to the estimate of the cost of corporate services provided by the Department of the Environment free of charge under a Service Delivery Agreement with the Director.
The Director received approval from the Department of Finance to increase the estimated operating loss for the 2014-15 PBS estimates which is primarily related to the completion of the Asbestos Project in 2013-14 and the increased estimates for depreciation over the out-years.
184

Director of National Parks Budget Statements
3.2.3 Budgeted Financial Statements TablesTable 3.2.1 Comprehensive Income Statement (Showing Net Cost of Services) for the period ended 30 June
Prepared on Australian Accounting Standards basis.
185
Estimated Budget Forw ard Forw ard Forw ardactual estimate estimate estimate estimate
2013-14 2014-15 2015-16 2016-17 2017-18$'000 $'000 $'000 $'000 $'000
EXPENSESEmployee benefits 26,512 28,296 28,038 28,413 28,098Suppliers 30,626 26,724 24,008 23,247 20,560Depreciation and amortisation 15,746 15,104 14,484 13,984 12,977Other expenses 167 167 167 167 167Total expenses 73,051 70,291 66,697 65,811 61,802LESS: OWN-SOURCE INCOMEOwn-source revenueSale of goods and rendering of services 14,280 18,009 15,502 15,545 12,334Interest 655 655 655 655 655Other 277 277 277 277 277Total own-source revenue 15,212 18,941 16,434 16,477 13,266GainsSale of assetsOther 3,900 3,900 3,900 3,900 3,900Total gains 3,900 3,900 3,900 3,900 3,900Total own-source income 19,112 22,841 20,334 20,377 17,166Net cost of (contribution by)
services 53,939 47,450 46,363 45,434 44,636Revenue from Government 41,497 41,061 40,594 40,165 40,374* * * *Surplus (Deficit) attributable to
the Australian Government (12,442) (6,389) (5,769) (5,269) (4,262)
Total other comprehensive income - - - - -Total comprehensive income (loss) (12,442) (6,389) (5,769) (5,269) (4,262)Total comprehensive income (loss)
attributable to the Australian Government (12,442) (6,389) (5,769) (5,269) (4,262)

Director of National Parks Budget Statements
Table 3.2.2: Budgeted Departmental Balance Sheet(as at 30 June)
186
Estimated Budget Forw ard Forw ard Forw ardactual estimate estimate estimate estimate
2013-14 2014-15 2015-16 2016-17 2017-18$'000 $'000 $'000 $'000 $'000
ASSETSFinancial assets
Cash and cash equivalents 34,225 34,225 34,225 34,225 34,225Trade and other receivables 1,294 1,294 1,294 1,294 1,294Other financial assets 70 70 70 70 70
Total financial assets 35,589 35,589 35,589 35,589 35,589 Non-financial assets
Land and buildings 73,401 71,086 68,997 66,994 65,374Property, plant and equipment 122,364 118,290 114,610 111,344 108,702Intangibles 387 387 387 387 387Other non-financial assets 419 419 419 419 419
Total non-financial assets 196,571 190,182 184,413 179,144 174,882 Assets held for sale
Total assets 232,160 225,771 220,002 214,733 210,471 LIABILITIESPayables
Suppliers 2,274 2,274 2,274 2,274 2,274Other payables 4,358 4,358 4,358 4,358 4,358
Total payables 6,632 6,632 6,632 6,632 6,632
ProvisionsEmployee provisions 8,726 8,726 8,726 8,726 8,726Other provisions 26 26 26 26 26
Total provisions 8,752 8,752 8,752 8,752 8,752 Liabilities included in disposal
groups held for saleTotal liabilities 15,384 15,384 15,384 15,384 15,384 Net assets 216,776 210,387 204,618 199,349 195,087

Director of National Parks Budget Statements
Table 3.2.2: Budgeted Departmental Balance Sheet(as at 30 June) (continued)
Prepared on Australian Accounting Standards basis.
187
Estimated Budget Forw ard Forw ard Forw ardactual estimate estimate estimate estimate
2013-14 2014-15 2015-16 2016-17 2017-18$'000 $'000 $'000 $'000 $'000
EQUITYParent entity interest
Contributed equity 36,445 36,445 36,445 36,445 36,445Reserves 125,572 125,572 125,572 125,572 125,572Retained surplus
(accumulated deficit) 54,759 48,370 42,601 37,332 33,070Total parent entity interest 216,776 210,387 204,618 199,349 195,087Total Equity 216,776 210,387 204,618 199,349 195,087

Director of National Parks Budget Statements
Table 3.2.3: Departmental Statement of Changes in Equity — Summary of Movement (Budget Year 2014-15)
Prepared on Australian Accounting Standards basis.
188
Retained Asset Other Contributed Totalearnings revaluation reserves equity/ equity
reserve capital$'000 $'000 $'000 $'000 $'000
Opening balance as at 1 July 2014Balance carried forw ard from
previous period 54,759 125,572 36,445 216,776Adjustment for changes in -
accounting policies -Adjusted opening balance 54,759 125,572 - 36,445 216,776Comprehensive income
Other comprehensive income -
Surplus (def icit) for the period (6,389) (6,389)
Total comprehensive income (6,389) - - - (6,389)of w hich:
Attributable to the Australian Government -Attributable to non-controlling interest* (6,389) (6,389)
Estimated closing balanceas at 30 June 2015 48,370 125,572 - 36,445 210,387Less: non-controlling interests * -
Closing balance attributable to the Australian Government 48,370 125,572 - 36,445 210,387

Director of National Parks Budget Statements
Table 3.2.4: Budgeted Departmental Statement of Cash Flows(for the period ended 30 June)
Prepared on Australian Accounting Standards basis.
189
Estimated Budget Forw ard Forw ard Forw ardactual estimate estimate estimate estimate
2013-14 2014-15 2015-16 2016-17 2017-18$'000 $'000 $'000 $'000 $'000
OPERATING ACTIVITIESCash received
AppropriationsReceipts from Government 41,543 41,061 40,594 40,421 40,374Sale of goods and services 14,280 18,009 15,502 15,545 12,334Interest 655 655 655 655 655Other 277 277 277 277 277
Total cash received 56,755 60,002 57,028 56,898 53,640Cash used
Employees 25,488 27,221 26,951 28,669 28,098Suppliers 27,796 23,899 21,195 19,347 16,660Other 167 167 167 167 167
Total cash used 53,451 51,287 48,313 48,183 44,925Net cash from (used by)
operating activities 3,304 8,715 8,715 8,715 8,715INVESTING ACTIVITIESCash used
Purchase of property, plant and equipment 11,926 8,715 8,715 8,715 8,715
Total cash used 11,926 8,715 8,715 8,715 8,715Net cash from (used by)
investing activities (11,926) (8,715) (8,715) (8,715) (8,715)FINANCING ACTIVITIESNet cash from (used by)
financing activities - - - - -Net increase (decrease)
in cash held (8,622) - - - -Cash and cash equivalents at the
beginning of the reporting period 42,847 34,225 34,225 34,225 34,225Effect of exchange rate movements
on cash and cash equivalents at the beginning of reporting period
Cash and cash equivalents at the end of the reporting period 34,225 34,225 34,225 34,225 34,225

Director of National Parks Budget Statements
Table 3.2.5: Departmental Capital Budget Statement
Prepared on Australian Accounting Standards basis.
190
Estimated Budget Forw ard Forw ard Forw ardactual estimate estimate estimate estimate
2013-14 2014-15 2015-16 2016-17 2017-18$'000 $'000 $'000 $'000 $'000
PURCHASE OF NON-FINANCIALASSETSFunded internally from
departmental resources 1 11,926 8,715 8,715 8,715 8,715TOTAL 11,926 8,715 8,715 8,715 8,715
Total cash used toacquire assets 11,926 8,715 8,715 8,715 8,715
1 Includes the follow ing sources of funding:
- annual and prior year revenue from Government
- donations and contributions
- internally developed assets
- proceeds from the sale of assets

Table 3.2.6: Statement of Asset Movements (2014-15)
Prepared on Australian Accounting Standards basis.
Asset Category (as appropriate) Land Buildings Other property, Heritage Investment Computer L&B, IP&E Other Total
plant and and cultural property software and held for saleequipment intangibles
$'000 $'000 $'000 $'000 $'000 $'000 $'000 $'000 $'000As at 1 J uly 2014Gross book value 6,826 77,597 158,960 - - - - - 243,383Accumulated depreciation/amortisation
and impairment (11,022) (36,596) - - (53) - - (47,671)Opening net book balance 6,826 66,575 122,364 - - (53) - - 195,712CAPITAL ASSET ADDITIONSEstimated expenditure on
new or replacement assetsBy purchase - appropriation ordinary 2,500 6,215 - - - - - 8,715
annual services 1Total additions - 2,500 6,215 - - - - - 8,715Other movementsDepreciation/amortisation expense (4,815) (10,289) - - - - - (15,104)OtherTotal other movements - (4,815) (10,289) - - - - - (15,104)As at 30 J une 2015Gross book value 6,826 80,097 165,175 - - - - - 252,098Accumulated depreciation/amortisation
and impairment - (15,837) (46,885) - - (53) - - (62,775)Closing net book balance 6,826 64,260 118,290 - - (53) - - 189,3231 "Appropriation ordinary annual services" refers to funding provided from Government for depreciation / amortisation expenses, DCBs or other operational expenses.
191
Director of N
ational Parks Budget Statements

Great Barrier Reef Marine Park Authority
Agency Resources and Planned Performance
193
Director of N
ational Parks Budget Statements

GREAT BARRIER REEF MARINE PARK AUTHORITY
Section 1: Agency Overview and Resources.........................................................1931.1 Strategic Direction Statement......................................................................1931.2 Agency Resource Statement.......................................................................1951.3 Budget Measures.........................................................................................197
Section 2: Outcomes and Planned Performance..................................................1992.1 Outcomes and Performance Information.....................................................199
Section 3: Explanatory Tables and Budgeted Financial Statements...................2053.1 Explanatory Tables......................................................................................2053.2 Budgeted Financial Statements...................................................................207
195
Director of N
ational Parks Budget Statements

GREAT BARRIER REEF MARINE PARK AUTHORITY
Section 1: Agency Overview and Resources
1.1 STRATEGIC DIRECTION STATEMENT
Under the Great Barrier Reef Marine Park Act 1975, the Great Barrier Reef Marine Park Authority (the Authority) is responsible for managing one of the world’s premier natural resources — the Great Barrier Reef Marine Park.
The Authority’s primary outcome is to ensure the long-term protection, ecologically sustainable use, understanding and enjoyment of the Great Barrier Reef for all Australians and the international community through the care and development of the Marine Park.
This outcome is supported by three objectives — protecting and restoring the Reef’s ecosystem health and biodiversity, safeguarding the Reef’s heritage, and ensuring use of the Marine Park is ecologically sustainable and benefits current and future generations.
The Authority, the Queensland Government and a range of Australian Government agencies jointly manage the Marine Park — this close collaboration is critically important for effectively managing such a large, diverse and complex marine area.
In particular, the Field Management programme between the Australian and Queensland Governments coordinates the day-to-day activities and field operations required for managing the Marine Park, the associated Queensland Great Barrier Reef Coast Marine Park, and the World Heritage Area.
In carrying out its functions, the Authority will maintain strong relationships with Traditional Owners and a wide range of agencies, reef users, stakeholders, and community members with an interest in the long-term protection, ecologically sustainable use, understanding and enjoyment of the Great Barrier Reef.
The second phase of the Australian Government’s Reef Programme (2013–14 to 2017–18) builds on the success of the programme’s first phase with an additional investment to improve the quality of water entering the Great Barrier Reef.
It will assist land managers across the catchment to adopt improved agricultural and urban management practices that will reduce the discharge of nutrients, sediments and pesticides in the Reef lagoon and improve the Reef’s resilience to climate change. The Authority assists to deliver components of the program, including:
Marine monitoring and reporting of the long-term health of the Reef.
197

Crown-of-thorns starfish control to decrease the impact of the coral-eating starfish by supporting tourism operators to continue defending high value tourism sites, and also funding research on new control methods.
Land and sea country partnerships to strengthen communication between local communities, managers and Reef stakeholders and build a better understanding of Traditional Owner issues relevant to managing the Marine Park, including the sustainable use of traditional marine resources.
Stewardship programs including the highly successful Reef Guardian initiative to improve community, local government and industry capacity and facilitate the adoption of environmentally sustainable best practices and knowledge and information sharing, ultimately achieving critical environmental outcomes for the Great Barrier Reef.
A major focus for the Authority will be continuing to work with the Department of the Environment and the Queensland Government to finalise and begin implementing the Long-term Sustainability Plan and the new initiatives outlined in the Great Barrier Reef Region Strategic Assessment Program Report.
The Authority’s future programme of work will provide greater certainty on the standards to be met when undertaking activities in the Marine Park, the requirements for assessments and, most importantly, the outcomes the Authority is working to achieve.
The Authority will also work with the Department of the Environment to support implementing the Government’s election commitments including Reef Trust, the Turtle and Dugong Protection Plan and the deregulation agenda.
198
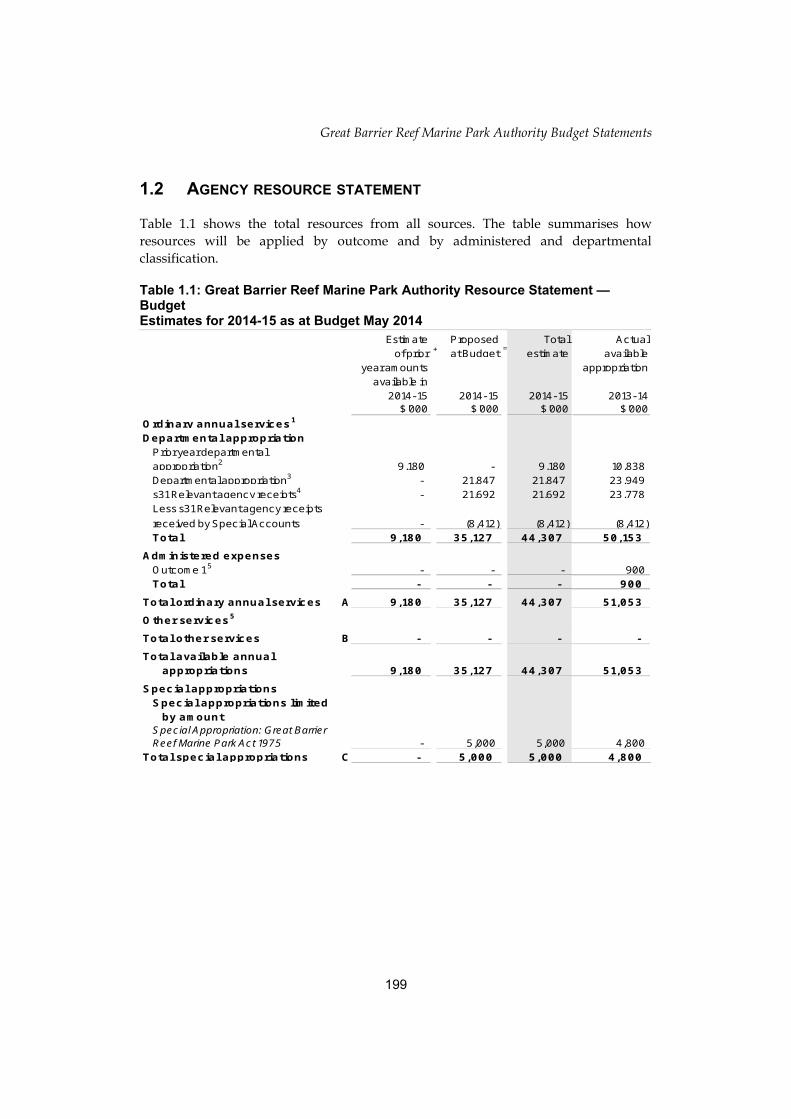
Great Barrier Reef Marine Park Authority Budget Statements
1.2 AGENCY RESOURCE STATEMENT
Table 1.1 shows the total resources from all sources. The table summarises how resources will be applied by outcome and by administered and departmental classification.
Table 1.1: Great Barrier Reef Marine Park Authority Resource Statement — BudgetEstimates for 2014-15 as at Budget May 2014
199
Estimate Proposed Total Actualof prior + at Budget = estimate available
year amounts appropriation available in
2014-15 2014-15 2014-15 2013-14$'000 $'000 $'000 $'000
Ordinary annual services1
Departmental appropriationPrior year departmentalappropriation2 9,180 - 9,180 10,838Departmental appropriation3 - 21,847 21,847 23,949s31 Relevant agency receipts4 - 21,692 21,692 23,778Less s31 Relevant agency receiptsreceived by Special Accounts - (8,412) (8,412) (8,412)Total 9,180 35,127 44,307 50,153
Administered expensesOutcome 1 5 - - - 900Total - - - 900
Total ordinary annual services A 9,180 35,127 44,307 51,053Other services5
Total other services B - - - -Total available annual
appropriations 9,180 35,127 44,307 51,053Special appropriations
Special appropriations limitedby amount
Special Appropriation: Great Barrier Reef Marine Park Act 1975 - 5,000 5,000 4,800
Total special appropriations C - 5,000 5,000 4,800

Great Barrier Reef Marine Park Authority Budget Statements
Table 1.1: Great Barrier Reef Marine Park Authority Resource Statement — BudgetEstimates for 2014-15 as at Budget May 2013 (continued)
200
Estimate Proposed Total Actualof prior + at Budget = estimate available
year amounts appropriation available in
2014-15 2014-15 2014-15 2013-14$'000 $'000 $'000 $'000
Total appropriations excluding Special Accounts 9,180 40,127 49,307 55,853
Special AccountsOpening balance6 - - - -Appropriation receipts7 - 8,372 8,372 8,372Non- appropriation receipts to - Special Accounts - 8,412 8,412 8,412
Total Special Account D - 16,784 16,784 16,784Total resourcingA+B+C+D 9,180 56,911 66,091 72,637Less appropriations drawnfrom annual or specialappropriations above and creditedto special accounts - (8,372) (8,372) (8,372)Total net resourcing for Great Barrier Reef Marine Park Authority 9,180 48,539 57,719 64,265
1 Appropriation Bill (No.1) 2014-152 Estimated adjusted balance carried forward from previous year3 Includes an amount of $0.78m in 2014-15 for the Departmental Capital Budget (refer to table 3.2.5 forfurther details). For accounting purposes this amount has been designated as 'contributions by owners'.4 s31 Relevant Agency receipts - estimate5 Appropriation Bill (No.2) 2014-156 Estimated opening balance for special accounts (less ‘Special Public Money’ held in accounts likeOther Trust Monies accounts (OTM), Services for other Government and Non-agency Bodies accounts (SOG), or Services for Other Entities and Trust Moneys Special accounts (SOETM)).For further information on special accounts see Table 3.1.2.7 Appropriation receipts from GBRMPA annual and special appropriations for 2014-15 included aboveReader note: All figures are GST exclusive.

Great Barrier Reef Marine Park Authority Budget Statements
1.3 BUDGET MEASURES
Budget measures in Part 1 relating to agency Great Barrier Reef Marine Park Authority are detailed in Budget Paper No. 2 and are summarised below.
Table 1.2: Agency 2014-15 Budget measuresPart 1: Measures announced since the 2013-14 MYEFO
201
Programme 2013-14 2014-15 2015-16 2016-17 2017-18$'000 $'000 $'000 $'000 $'000
Expense measures Savings for the Great Barrier Reef Marine Park Authority 1.1
Departmental expenses - (605) (601) (597) (603)Total - (605) (601) (597) (603)
Expense measures Efficiency Dividend - a further temporary increase of 0.25 per cent 1.1
Departmental expenses - (56) (93) (139) (140)Total - (56) (93) (139) (140)Total expense measures
Departmental - (661) (694) (736) (743)Total - (661) (694) (736) (743)Capital measuresSavings for the Great Barrier Reef Marine Park Authority 1.1
Departmental capital - (100) (99) (99) (100)Total - (100) (99) (99) (100)
Capital measuresEfficiency Dividend - a further temporary increase of 0.25 per cent 1.1
Departmental capital - (2) (5) (7) (7)Total - (2) (5) (7) (7)Total capital measures
Departmental - (102) (104) (106) (107)Total - (102) (104) (106) (107)Prepared on a Government Finance Statistics (fiscal) basis

Great Barrier Reef Marine Park Authority Budget Statements
Part 2: MYEFO measures not previously reported in a portfolio statement
202
Programme 2013-14 2014-15 2015-16 2016-17 2017-18$'000 $'000 $'000 $'000 $'000
MeasuresPublic Services efficiencies 1 1.1
Departmental expenses (3) (16) (35) (49) (49)Total (3) (16) (35) (49) (49)
Reforms to the APS management and efficient procurement of agency softw are 1 1.1
Departmental expenses (3) (16) (35) (48) (48)Total (3) (16) (35) (48) (48)
Expense measures Efficiency Dividend - temporary increase in the rate 1.1
Departmental expenses - (231) (442) (688) (688)Total - (231) (442) (688) (688)
Total measuresDepartmental (6) (263) (512) (785) (785)
Total (6) (263) (512) (785) (785) 1 Measure announced in the 2013-14 budget but not previously reported in a portfolio statement.

Great Barrier Reef Marine Park Authority Budget Statements
SECTION 2: OUTCOMES AND PLANNED PERFORMANCE
2.1 OUTCOMES AND PERFORMANCE INFORMATION
Government outcomes are the intended results, impacts or consequences of actions by the Government on the Australian community. Commonwealth programmes are the primary vehicle by which Government agencies achieve the intended results of their outcome statements. Agencies are required to identify the programmes which contribute to Government outcomes over the Budget and forward years.
Each outcome is described below together with its related programmes, specifying the performance indicators and targets used to assess and monitor the performance of the Authority in achieving Government outcomes.
Outcome 1: The long-term protection, ecologically sustainable use, understanding and enjoyment of the Great Barrier Reef for all Australians and the international community through the care and development of the Marine Park.
Outcome 1 StrategyThe Authority works to achieve outcome 1 by implementing policy, programmes, management strategies and legislative measures within the statutory framework of the Great Barrier Reef Marine Park Act 1975, the Environment Protection and Biodiversity Conservation Act 1999 (EPBC Act) and by complying with other legislation under Commonwealth and Queensland State law, together with relevant international conventions.
The outcome will be delivered through three objectives:
• To protect and restore the Great Barrier Reef’s ecosystem health and biodiversity;
• To safeguard the Reef’s heritage; and
• To ensure use of the Marine Park is ecologically sustainable and benefits current and future generations.
Within these objectives, over the next four years, the priorities of the Authority are:
• to implement new initiatives resulting from the comprehensive strategic assessment to protect and restore values, reduce pressures and ensure use is managed within ecologically sustainable limits;
• to have a collaborative approach to management, especially with Traditional Owners, the Queensland and Commonwealth Governments, Reef industries, the scientific community and the broader community; and
203

Great Barrier Reef Marine Park Authority Budget Statements
• to enable the Authority to evolve as a knowledge-based organisation, where decisions regarding the management of the Marine Park are fully informed by the best science and information available.
Outcome Expense Statement
Table 2.1 provides an overview of the total expenses for outcome 1, by programme.
Table 2.1: Budgeted Expenses for Outcome 1
204
2013-14 2014-15Estimated Estimated
actual expensesexpenses
$'000 $'000
Programme 1.1: Improving the outlook for the Great Administered expenses
Ordinary annual services (Appropriation Bill No. 1) 900 -Departmental expenses
Departmental appropriation 1 47,025 42,244Less Special Accounts (16,784) (16,784)
Special appropriations 4,800 5,000Special Accounts 16,784 16,784
Expenses not requiring appropriation in the Budget year 2 1,749 1,748
Total for Programme 1.1 54,474 48,992Outcome 1 Totals by appropriation typeAdministered Expenses
Ordinary annual services (Appropriation Bill No. 1) 900 -Departmental expenses
Departmental appropriation 1 30,241 25,460Special appropriations 4,800 5,000Special Accounts 16,784 16,784
Expenses not requiring appropriation in the Budget year 2 1,749 1,748
Total expenses for Outcome 1 54,474 48,9922013-14 2014-15
Average Staffing Level (number) 218 210
1 Departmental Appropriation combines "Ordinary annual services (Appropriation Bill No. 1)" and "Revenue from independent sources (s31)".2 Expenses not requiring appropriation in the Budget year is made up of Depreciation Expense, Amortisation, Expense, Makegood Expense and Audit Fees
Outcome 1: The long-term protection, ecologically sustainable use, understanding and enjoyment of the Great Barrier Reef for all Australians and the international community, through the care and development of the Marine Park
Great Barrier Reef Marine Park Authority Budget Statements
Contributions to Outcome 1
Programme 1.1: Improving the outlook for the Great Barrier Reef
Programme Objective• To protect and restore the Great Barrier Reef’s ecosystem health and biodiversity;
• To safeguard the Reef’s heritage; and
• To ensure use of the Marine Park is ecologically sustainable and benefits current and future generations.
Linked to:
• Department of the Environment Programme 1.1: Sustainable Management of Natural Resources and the Environment and Programme 1.5: Environmental Regulation
205

Great Barrier Reef Marine Park Authority Budget Statements
Programme ExpensesThe Government has provided funding through the National Landcare Programme for the Marine Monitoring programme, Sea Country Indigenous Partnerships, Crown of Thorns Starfish targeted control and to support the Authority to ensure the resilience of the Great Barrier Reef. The Environmental Management Charge on tourists to the Marine Park will continue to be reduced by $2.50 for the next year (to 31 March 2015). The reduction to the Special Appropriation is offset by an increase in departmental appropriation.
206
Programme Expenses 1.1 Improving the outlook for the Great Barrier Reef2013-14 2014-15 2015-16 2016-17 2017-18
Estimated Budget Forw ard Forw ard Forw ardactual estimate estimate estimate$'000 $'000 $'000 $'000 $'000
Annual administered expenses:Climate Change Adaptation 900 - - - - Administered item (incl. SPPs)
Annual departmental expenses:Departmental program support 47,025 42,244 36,728 36,637 36,835 Less Special Accounts (16,784) (16,784) (16,784) (16,784) (16,784)
Special Appropriations:Great Barrier Reef Marine Park Act 1975 4,800 5,000 8,400 9,000 9,000
Special Account Expenses: Great Barrier Reef Field Management Special Account
16,784 16,784 16,784 16,784 16,784
Expenses not requiring appropriation inthe Budget year 1 1,749 1,748 1,748 1,748 1,748
Total Programme expenses 54,474 48,992 46,876 47,385 47,5831 Expenses not requiring appropriation in the Budget year is made up of Depreciation Expense, Amortisation Expense, Makegood Expense and Audit Fees.

Great Barrier Reef Marine Park Authority Budget Statements
Programme 1.1 Deliverables Protect and restore the Great Barrier Reef’s ecosystem health and biodiversity
• Develop a suite of standards, thresholds and limits to maintain ecosystem health and biodiversity.
• Identify and implement a program of regionally based on-ground/in park restoration actions.
• Implement scheduled actions in the National Landcare Programme Memorandum of Understanding (for the Crown of Thorns Starfish control programme, the Land and Sea Country Indigenous Partnerships Programme and the Marine Monitoring Programme).
Safeguard the Reef’s heritage
• Develop and implement strategies to safeguard Indigenous heritage, historic heritage and other heritage values within a comprehensive management framework.
Ensure use of the Marine Park is ecologically sustainable and benefits current and future generations
• Implement the policy, planning and regulatory framework for the sustainable use of the Marine Park.
• Deliver the 2014-15 Annual Business Plan for Field Management.
• Implement partnership, stewardship, education and communications programmes.
207
2013-14 2014-15 2015-16 2016-17 2017-18Estimated Budget Forw ard Forw ard Forw ard
Deliverables actual estimate estimate estimateNumber of Reef Health Impact Surveys achieved 620 620 620 620 620 Number of Traditional Use of Marine Resource Agreements or Indigenous Land Use Agreements in place 6 8 8 8 8 Number of permits issued 650 650 650 650 650 Number of Reef Guardians schools 210 250 250 250 250 Number of ReefHQ Aquarium visitors 120,000 122,000 122,000 122,000 122,000

Great Barrier Reef Marine Park Authority Budget Statements
Programme 1.1 Key Performance Indicators Protect and restore the Reef’s ecosystem health and biodiversity
• Reduce local impacts affecting the condition of key species and habitats.
• Improving trends in water quality for end-of-catchment waters against the trigger levels outlined in the Reef Water Quality Guidelines.
Safeguard the Reef’s heritage
• Enhanced identification, understanding, recognition, protection and conservation of the Reef’s heritage values.
Ensure use of the Marine Park is ecologically sustainable and benefits current and future generations
• Improved uptake of best practice and stewardship in activities that contribute to the health and resilience of the Marine Park.
• Declining incidence of illegal fishing.
• Improved integration of knowledge about the Reef’s values, their condition and impacts that affect them into management decisions.
208
2013-14 2014-15 2015-16 2016-17 2017-18Key Performance Estimated Budget Forw ard Forw ard Forw ard
Indicators actual estimate estimate estimatePercentage of the Marine Park managed in accordance w ith an accredited Traditional Use of Marine Resource Agreement or Indigenous Land Use Agreement [%] 18 23 23 23 24Percentage of visitors to the Reef using tourism operators accredited as "High Standard Operators" [%] 50 55 55 55 60Student participants w ithin the Reef Guardian schools Programme 111,000 112,000 113,000 114,000 115,000
Percentage of visitors to Reef HQ that participate in talks and tours that deliver key messages about risks to the Reef [%] 63 63 63 63 63

Great Barrier Reef Marine Park Authority Budget Statements
Section 3: Explanatory Tables and Budgeted Financial StatementsSection 3 presents explanatory tables and budgeted financial statements which provide a comprehensive snapshot of agency finances for the 2014-15 Budget year. It explains how budget plans are incorporated into the financial statements and provides further details of the reconciliation between appropriations and programme expenses, movements in administered funds, special accounts and Australian Government Indigenous expenditure.
3.1 EXPLANATORY TABLES
3.1.1 Movement of Administered Funds Between YearsThere are no movement of administered funds between years for the Authority.
3.1.2 Special AccountsSpecial Accounts provide a means to set aside and record amounts used for specified purposes. Special Accounts can be created by a Finance Minister’s Determination under the FMA Act or under separate enabling legislation. Table 3.1.2 shows the expected additions (receipts) and reductions (payments) for each account used by the Great Barrier Marine Park Authority
Table 3.1.2: Estimates of Special Account Flows and Balances
209
Opening Closingbalance Receipts Payments Adjustments balance2014-15 2014-15 2014-15 2014-15 2014-152013-14 2013-14 2013-14 2013-14 2013-14
Outcome $'000 $'000 $'000 $'000 $'000
Great Barrier Reef Field Management Special Account (D) *
1 - 16,784 16,784 - -
- 16,784 16,784 - -
Total Special Accounts 2014-15 Budget estimate - 16,784 16,784 - -
Total Special Accounts2013-14 estimated actual - 16,784 16,784 - -
* Established under s49 of the Great Barrier Reef Marine Park Act 1975.(D) = Departmental

Great Barrier Reef Marine Park Authority Budget Statements
3.1.3 Australian Government Indigenous ExpenditureTable 3.1.3: Australian Government Indigenous Expenditure (AGIE)
210
Outcome Other Total ProgramBill Bill Special Total
No. 1 No. 2 approp approp$'000 $'000 $'000 $'000 $'000 $'000
Great Barrier Reef Marine Park AuthorityOutcome 1Departmental 2014-15 1,278 1,278 2,000 3,278 1.1Departmental 2013-14 1,200 1,200 2,000 3,200 1.1Total outcome 2014-15 1,278 - - 1,278 2,000 3,278 1.1Total outcome 2013-14 1,200 - - 1,200 2,000 3,200 1.1
Total AGIE 2014-15 1,278 - - 1,278 2,000 3,278 1.1Total AGIE 2013-14 1,200 - - 1,200 2,000 3,200 1.1
Appropriations

Great Barrier Reef Marine Park Authority Budget Statements
3.2 BUDGETED FINANCIAL STATEMENTS
3.2.1 Differences in Agency Resourcing and Financial StatementsThere are no differences between the resource information presented in the Budget Papers and the Portfolio Budget Statements as a result of differences between Australian Accounting Standards (AAS) and Government Finance Statistics (GFS).
3.2.2 Analysis of Budgeted Financial StatementsBudgeted Departmental Comprehensive Income Statement
Changes in appropriation from 2013-14 to 2014-15 are the result of the efficiency dividend, Targeted savings – public service efficiencies measure, and the conclusion of Climate Change Adaptation Action Plan funding. Funding was approved in 2013-14 to support the continuation of the work of the Authority towards Sea Country Indigenous Partnerships, the Marine Monitoring Programme and for improving the Resilience of the Reef. This funding will continue to 2017-18. This funding will also contribute to Capital Expenditure.
The Special Appropriation derived from the Environmental Management Charge was reduced in 2012–13, 2013–14 and 2014–15 and will be offset by an increase in Departmental Appropriation for those years. The forward estimates show the anticipated increase in the Special Appropriation and EMC cash flow from 2015-16.
In 2013-14 the Authority received $3.1 million for a targeted Crown of Thorns Starfish control programme. A further $2 million will be available in 2014-15 to continue the control programme in collaboration with the tourism industry.
The operating loss in 2013-14 reflects anticipated voluntary redundancies, additional legal costs and depreciation expenses.
Budgeted Departmental Balance Sheet
Changes in the departmental balance sheet reflect the estimated reduction in leave liabilities following anticipated voluntary redundancies.
211

Great Barrier Reef Marine Park Authority Budget Statements
3.2.3 Budgeted Financial Statements TablesTable 3.2.1 Comprehensive Income Statement (Showing Net Cost of Services) for the period ended 30 June
Prepared on Australian Accounting Standards basis.
212
Estimated Budget Forw ard Forw ard Forw ardactual estimate estimate estimate estimate
2013-14 2014-15 2015-16 2016-17 2017-18$'000 $'000 $'000 $'000 $'000
EXPENSESEmployee benefits 22,783 20,639 20,675 20,710 20,742Suppliers 16,829 14,392 12,240 12,714 12,880Grants 35 35 35 35 35Depreciation and amortisation 1,701 1,700 1,700 1,700 1,700Other expenses 12,226 12,226 12,226 12,226 12,226Total expenses 53,574 48,992 46,876 47,385 47,583LESS: OWN-SOURCE INCOMEOwn-source revenueSale of goods and rendering of services 3,797 3,020 3,020 3,020 3,020Other 19,981 18,672 16,722 16,772 16,822Total own-source revenue 23,778 21,692 19,742 19,792 19,842GainsOther 48 48 48 48 48Total gains 48 48 48 48 48Total own-source income 23,826 21,740 19,790 19,840 19,890Net cost of (contribution by)
services 29,748 27,252 27,086 27,545 27,693Revenue from Government 27,869 26,072 25,906 26,365 26,513
Surplus (Deficit) attributable to the Australian Government (1,879) (1,180) (1,180) (1,180) (1,180)

Great Barrier Reef Marine Park Authority Budget Statements
Table 3.2.1 Comprehensive Income Statement (Showing Net Cost of Services) for the period ended 30 June (continued)
213
Estimated Budget Forw ard Forw ard Forw ardactual estimate estimate estimate estimate
2013-14 2014-15 2015-16 2016-17 2017-18$'000 $'000 $'000 $'000 $'000
OTHER COMPREHENSIVE INCOMEChanges in asset revaluation surplus - - - - -Total other comprehensive income - - - - -Total comprehensive income (loss) (1,879) (1,180) (1,180) (1,180) (1,180)Total comprehensive income (loss)
attributable to the Australian Government (1,879) (1,180) (1,180) (1,180) (1,180)
Note: Impact of Net Cash Appropriation Arrangements2013-14 2014-15 2015-16 2016-17 2017-18
$'000 $'000 $'000 $'000 $'000Total Comprehensive Income
(loss) excluding depreciation/amortisationexpenses previously funded throughrevenue appropriations. (178) 520 520 520 520
less depreciation/amortisation expensespreviously funded through revenueappropriations1 1,701 1,700 1,700 1,700 1,700Total Comprehensive Income
(loss) - as per the Statement ofComprehensive Income (1,879) (1,180) (1,180) (1,180) (1,180)
1 From 2010-11, the Government introduced net cash appropriation arrangements w here Bill 1 revenue appropriations for the depreciation/amortisation expenses of FMA Act agencies w ere replaced w ith a separate capital budget (the Departmental Capital Budget, or DCB) provided through Bill 1 equity appropriations. For information regarding DCBs, please refer to Table 3.2.5 Departmental Capital Budget Statement.

Great Barrier Reef Marine Park Authority Budget Statements
Table 3.2.2: Budgeted Departmental Balance Sheet(as at 30 June)
214
Estimated Budget Forw ard Forw ard Forw ardactual estimate estimate estimate estimate
2013-14 2014-15 2015-16 2016-17 2017-18$'000 $'000 $'000 $'000 $'000
ASSETSFinancial assets
Cash and cash equivalents 480 480 480 480 480Trade and other receivables 10,511 10,511 10,511 10,511 10,511
Total financial assets 10,991 10,991 10,991 10,991 10,991 Non-financial assets
Land and buildings 18,764 18,269 17,774 17,279 16,334Property, plant and equipment 3,290 3,620 3,956 4,289 5,179Investment propertyIntangibles 2,416 2,176 1,936 1,696 1,356Inventories 81 81 81 81 81Tax assetsOther non-financial assets 193 193 193 193 193
Total non-financial assets 24,744 24,339 23,940 23,538 23,143 Assets held for sale
Total assets 35,735 35,330 34,931 34,529 34,134 LIABILITIESPayables
Suppliers 1,784 1,784 1,784 1,784 1,784Other payables 932 932 932 932 932
Total payables 2,716 2,716 2,716 2,716 2,716 Provisions
Employee provisions 5,873 5,873 5,873 5,873 5,873Other provisions 383 383 383 383 383
Total provisions 6,256 6,256 6,256 6,256 6,256 Total liabilities 8,972 8,972 8,972 8,972 8,972 Net assets 26,763 26,358 25,959 25,557 25,162

Great Barrier Reef Marine Park Authority Budget Statements
Table 3.2.2: Budgeted Departmental Balance Sheet(as at 30 June) (continued)
Prepared on Australian Accounting Standards basis.
215
Estimated Budget Forw ard Forw ard Forw ardactual estimate estimate estimate estimate
2013-14 2014-15 2015-16 2016-17 2017-18$'000 $'000 $'000 $'000 $'000
EQUITY*Parent entity interest
Contributed equity 13,016 13,791 14,572 15,350 16,135Reserves 22,209 22,209 22,209 22,209 22,209Retained surplus
(accumulated deficit) (8,462) (9,642) (10,822) (12,002) (13,182)Total parent entity interest 26,763 26,358 25,959 25,557 25,162Total Equity 26,763 26,358 25,959 25,557 25,162*This disclosure is not required if an entity does not have non-controlling interests.
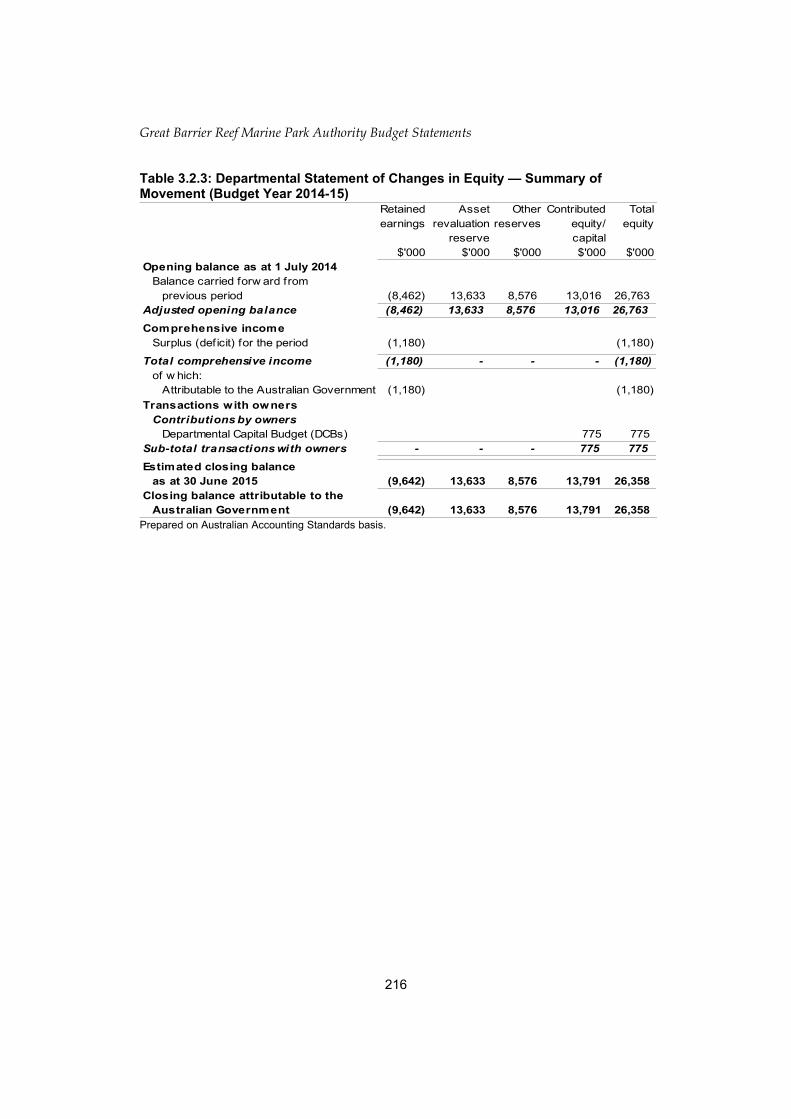
Great Barrier Reef Marine Park Authority Budget Statements
Table 3.2.3: Departmental Statement of Changes in Equity — Summary of Movement (Budget Year 2014-15)
Prepared on Australian Accounting Standards basis.
216
Retained Asset Other Contributed Totalearnings revaluation reserves equity/ equity
reserve capital$'000 $'000 $'000 $'000 $'000
Opening balance as at 1 July 2014Balance carried forw ard from
previous period (8,462) 13,633 8,576 13,016 26,763Adjusted opening balance (8,462) 13,633 8,576 13,016 26,763Comprehensive income
Surplus (deficit) for the period (1,180) (1,180)
Total comprehensive income (1,180) - - - (1,180)of w hich:
Attributable to the Australian Government (1,180) (1,180)Transactions with owners
Contributions by ownersDepartmental Capital Budget (DCBs) 775 775
Sub-total transactions with owners - - - 775 775Estimated closing balance
as at 30 June 2015 (9,642) 13,633 8,576 13,791 26,358Closing balance attributable to the
Australian Government (9,642) 13,633 8,576 13,791 26,358

Great Barrier Reef Marine Park Authority Budget Statements
Table 3.2.4: Budgeted Departmental Statement of Cash Flows(for the period ended 30 June)
217
Estimated Budget Forw ard Forw ard Forw ardactual estimate estimate estimate estimate
2013-14 2014-15 2015-16 2016-17 2017-18$'000 $'000 $'000 $'000 $'000
OPERATING ACTIVITIESCash received
Appropriations 28,999 26,072 25,906 26,365 26,513Receipts from Government 11,609 10,300 8,350 8,400 8,450Sale of goods and rendering of services
3,947 3,140 3,140 3,140 3,140
Net GST received 1,473 1,200 1,000 1,000 1,000Other 8,372 8,372 8,372 8,372 8,372
Total cash received 54,400 49,084 46,768 47,277 47,475Cash used
Employees 22,888 20,344 20,380 20,415 20,447Suppliers 18,276 15,544 13,192 13,666 13,832Borrow ing costsNet GST paid 150 120 120 120 120Grants 35 35 35 35 35Other 12,521 12,521 12,521 12,521 12,521
Total cash used 53,870 48,564 46,248 46,757 46,955Net cash from (used by)
operating activities 530 520 520 520 520INVESTING ACTIVITIESCash used
Purchase of property, plant and equipment 1,410 1,295 1,301 1,298 1,305
Total cash used 1,410 1,295 1,301 1,298 1,305Net cash from (used by)
investing activities (1,410) (1,295) (1,301) (1,298) (1,305)

Great Barrier Reef Marine Park Authority Budget Statements
Table 3.2.4: Budgeted Departmental Statement of Cash Flows(for the period ended 30 June) (continued)
Prepared on Australian Accounting Standards basis.
218
Estimated Budget Forw ard Forw ard Forw ardactual estimate estimate estimate estimate
2013-14 2014-15 2015-16 2016-17 2017-18$'000 $'000 $'000 $'000 $'000
FINANCING ACTIVITIESCash received
Contributed equity 880 775 781 778 785Total cash received 880 775 781 778 785Cash usedTotal cash used - - - - -Net cash from (used by)
financing activities 880 775 781 778 785Net increase (decrease)
in cash held - - - - -Cash and cash equivalents at the
beginning of the reporting period 480 480 480 480 480Effect of exchange rate movements
on cash and cash equivalents at the beginning of reporting period
Cash and cash equivalents at the end of the reporting period 480 480 480 480 480

Great Barrier Reef Marine Park Authority Budget Statements
Table 3.2.5: Departmental Capital Budget Statement
Prepared on Australian Accounting Standards basis.
219
Estimated Budget Forw ard Forw ard Forw ardactual estimate estimate estimate estimate
2013-14 2014-15 2015-16 2016-17 2017-18$'000 $'000 $'000 $'000 $'000
NEW CAPITAL APPROPRIATIONSCapital budget - Bill 1 (DCB) 880 775 781 778 785
Total new capital appropriations 880 775 781 778 785
Provided for:Purchase of non-f inancial assets 880 775 781 778 785
Total Items 880 775 781 778 785PURCHASE OF NON-FINANCIAL
ASSETS Funded by capital appropriation - DCB1 880 775 781 778 785
Funded internally f romdepartmental resources 2 530 520 520 520 520
TOTAL 1,410 1,295 1,301 1,298 1,305
RECONCILIATION OF CASHUSED TO ACQUIRE ASSETSTO ASSET MOVEMENT TABLE
Total purchases 1,410 1,295 1,301 1,298 1,305Total cash used to
acquire assets 1,410 1,295 1,301 1,298 1,305
1 Does not include annual f inance lease costs. Include purchase from current and previousyears' Departmental Capital Budgets (DCBs).
2 Includes the follow ing sources of funding: - current Bill 1 and prior year Act 1/3/5 appropriations (excluding amounts from the DCB). - internally developed assets - s31 relevant agency receipts (for FMA agencies only) - proceeds from the sale of assets

Table 3.2.6: Statement of Asset Movements (2014-15)
Prepared on Australian Accounting Standards basis.
Asset Category (as appropriate) Land Buildings Other property, Heritage Investment Computer L&B, IP&E Other Total
plant and and cultural property software and held for saleequipment intangibles
$'000 $'000 $'000 $'000 $'000 $'000 $'000 $'000 $'000As at 1 J uly 2014Gross book value - 19,737 3,878 - - 4,746 - - 28,361Accumulated depreciation/amortisation
and impairment - (973) (588) - - (2,330) - - (3,891)Opening net book balance - 18,764 3,290 - - 2,416 - - 24,470CAPITAL ASSET ADDITIONSEstimated expenditure on
new or replacement assetsBy purchase - appropriation equity 1By purchase - appropriation ordinary
annual services 2 450 745 100 1,295Total additions - 450 745 - - 100 - - 1,295Other movementsDepreciation/amortisation expense (945) (415) (340) (1,700)Disposals 3Total other movements - (945) (415) - - (340) - - (1,700)As at 30 J une 2015Gross book value - 20,187 4,623 - - 4,846 - - 29,656Accumulated depreciation/amortisation
and impairment - (1,918) (1,003) - - (2,670) - - (5,591)Closing net book balance - 18,269 3,620 - - 2,176 - - 24,065Prepared on Australian Accounting Standards basis.1 "Appropriation equity" refers to equity injections or Administered Assets and Liabilities appropriations provided throughAppropriation Bill (No.2) 2014-15, including CDABs.2 "Appropriation ordinary annual services" refers to funding provided through Appropriation Bill (No.1) 2014-15 for depreciation / amortisation expenses, DCBs or other operational expenses.3 Net proceeds may be returned to the OPA.
220
Great Barrier Reef M
arine Park Authority Budget Statem
ents

221

Great Barrier Reef Marine Park Authority Budget Statements
Table 3.2.7: Schedule of Budgeted Income and Expenses Administered on Behalf of Government (for the period ended 30 June)
Prepared on Australian Accounting Standards basis.
217
Estimated Budget Forw ard Forw ard Forw ardactual estimate estimate estimate estimate
2013-14 2014-15 2015-16 2016-17 2017-18$'000 $'000 $'000 $'000 $'000
EXPENSES ADMINISTERED ONBEHALF OF GOVERNMENTSuppliers 900 - - - -
Total expenses administeredon behalf of Government 900 - - - -
LESS:OWN-SOURCE INCOMEOwn-source revenueNon-taxation revenue
Rental income 285 285 285 285 285Other revenue 4,800 5,000 8,400 9,000 9,000
Total non-taxation revenue 5,085 5,285 8,685 9,285 9,285Total own-source revenues
administered on behalf of Government 5,085 5,285 8,685 9,285 9,285
Total own-sourced incomeadministered on behalf ofGovernment 5,085 5,285 8,685 9,285 9,285
Net Cost of (contribution by)services 4,185 5,285 8,685 9,285 9,285
Surplus (Deficit) 4,185 5,285 8,685 9,285 9,285
OTHER COMPREHENSIVE INCOMETotal other comprehensive income - - - - -Total comprehensive income (loss) 4,185 5,285 8,685 9,285 9,285
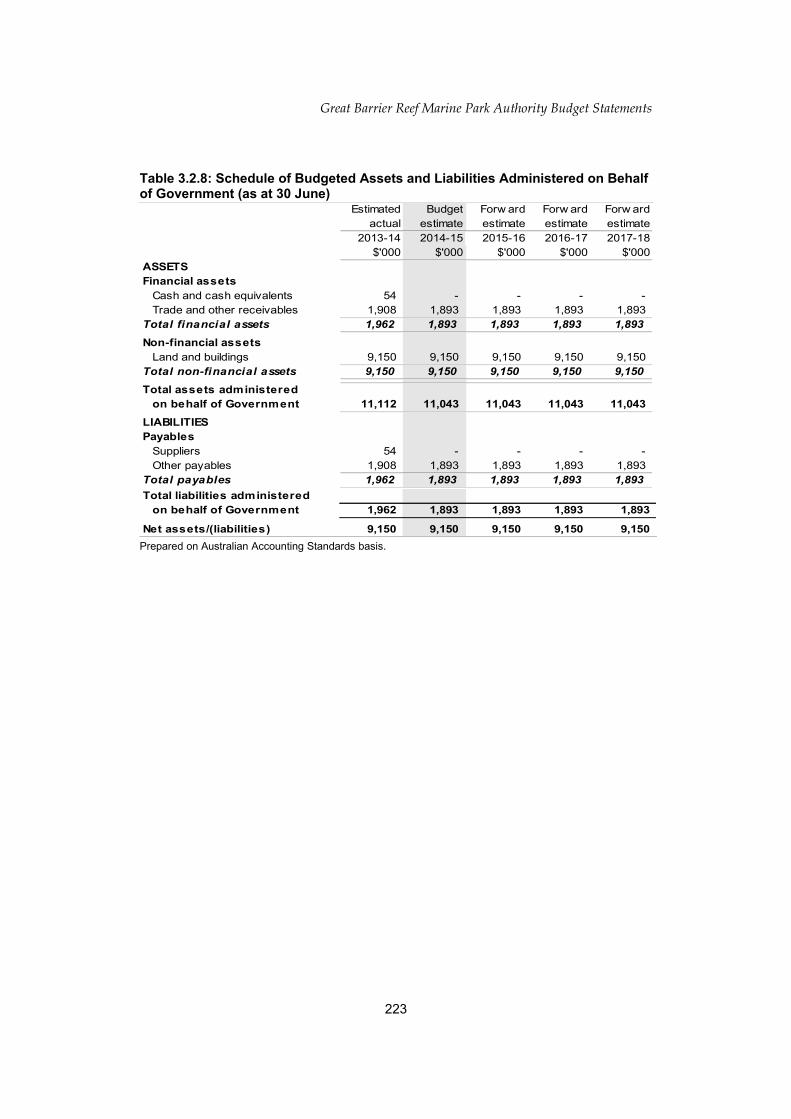
Great Barrier Reef Marine Park Authority Budget Statements
Table 3.2.8: Schedule of Budgeted Assets and Liabilities Administered on Behalf of Government (as at 30 June)
Prepared on Australian Accounting Standards basis.
223
Estimated Budget Forw ard Forw ard Forw ardactual estimate estimate estimate estimate
2013-14 2014-15 2015-16 2016-17 2017-18$'000 $'000 $'000 $'000 $'000
ASSETSFinancial assets
Cash and cash equivalents 54 - - - -Trade and other receivables 1,908 1,893 1,893 1,893 1,893
Total financial assets 1,962 1,893 1,893 1,893 1,893Non-financial assets
Land and buildings 9,150 9,150 9,150 9,150 9,150Total non-financial assets 9,150 9,150 9,150 9,150 9,150Total assets administered
on behalf of Government 11,112 11,043 11,043 11,043 11,043LIABILITIESPayables
Suppliers 54 - - - -Other payables 1,908 1,893 1,893 1,893 1,893
Total payables 1,962 1,893 1,893 1,893 1,893Total liabilities administered
on behalf of Government 1,962 1,893 1,893 1,893 1,893
Net assets/(liabilities) 9,150 9,150 9,150 9,150 9,150

Great Barrier Reef Marine Park Authority Budget Statements
Table 3.2.9: Schedule of Budgeted Administered Cash Flows(for the period ended 30 June)
Prepared on Australian Accounting Standards basis
224
Estimated Budget Forw ard Forw ard Forw ardactual estimate estimate estimate estimate
2013-14 2014-15 2015-16 2016-17 2017-18$'000 $'000 $'000 $'000 $'000
OPERATING ACTIVITIESCash received
Rental income 285 285 285 285 285Other 4,800 5,000 8,400 9,000 9,000
Total cash received 5,085 5,285 8,685 9,285 9,285Cash used
Suppliers 900 54 - - -Total cash used 900 54 - - -Net cash from (used by)
operating activities 4,185 5,231 8,685 9,285 9,285
Net increase (decrease) in cash held 4,185 5,231 8,685 9,285 9,285
Cash and cash equivalents atbeginning of reporting period 54 54 - - -
Cash from Off icial Public Account for:- Appropriations 900 - - - -- Special Accounts
Cash to Official Public Account for:- Appropriations 4,800 5,000 8,400 9,000 9,000- Other 285 285 285 285 285- Transfers to other entities(Finance - Whole of Government)
5,085 5,285 8,685 9,285 9,285Effect of exchange rate
of reporting period 54 - - - -

Great Barrier Reef M
arine Park Authority Budget Statem
ents
Table 3.2.11: Statement of Administered Asset Movements (2014-15)
Prepared on Australian Accounting Standards basis.
Asset Category (as appropriate) Land Buildings Other property, Heritage Investment Computer L&B, IP&E Other Total
plant and and cultural property software and held for saleequipment intangibles
$'000 $'000 $'000 $'000 $'000 $'000 $'000 $'000 $'000As at 1 J uly 2014Gross book value 9,150 9,150Accumulated depreciation/amortisation
and impairment - - - - - - - - -Opening net book balance 9,150 - - - - - - - 9,150
CAPITAL ASSET ADDITIONSEstimated expenditure on
new or replacement assetsBy purchase - appropriation equity 1 - - - - - - - - -By purchase - appropriation ordinary
annual services 2 - - - - - - - - -Total additions - - - - - - - - -Other movements - - - - - - - - -
Disposals 3Total other movements - - - - - - - - -
As at 30 J une 2015Gross book value 9,150 - - - - - - - 9,150Accumulated depreciation/amortisation
and impairment - - - - - - - - -Closing net book balance 9,150 - - - - - - - 9,150Prepared on Australian Accounting Standards basis1 "Appropriation equity" refers to equity injections or Administered Assets and Liabilities appropriations provided throughAppropriation Bill (No.2) 2014-15, including CDABs.2 "Appropriation ordinary annual services" refers to funding provided through Appropriation Bill (No.1) 2014-15 for depreciation / amortisation expenses, ACBs or other operational expenses.3 Net proceeds may be returned to the OPA.
225

Murray-Darling Basin Authority
Agency Resources and Planned Performance
227

MURRAY-DARLING BASIN AUTHORITY
Section 1: Agency Overview and Resources.........................................................2251.1 Strategic Direction Statement......................................................................2251.2 Agency Resource Statement.......................................................................2281.3 Budget Measures.........................................................................................230
Section 2: Outcomes and Planned Performance..................................................2312.1 Outcomes and Performance Information.....................................................231
Section 3: Explanatory Tables and Budgeted Financial Statements...................2403.1 Explanatory Tables......................................................................................2403.2 Budgeted Financial Statements...................................................................242
229

MURRAY-DARLING BASIN AUTHORITY
Section 1: Agency Overview and Resources
1.1 STRATEGIC DIRECTION STATEMENT
The Murray-Darling Basin Authority (MDBA) is established as a Commonwealth statutory authority under the Water Act 2007 (the Act) and is responsible for developing and overseeing a planning framework for the integrated management of the Basin’s water and other natural resources. This includes:
protecting, restoring and providing for the ecological values and ecosystem services of the Basin;
ensuring the return to environmentally sustainable levels of extraction of water resources that are over allocated or overused;
promoting the using and management of the Basin resources in a way that optimises economic, social and environmental outcomes in the national interest; and
giving effect to relevant international agreements.
In addition to its functions under the Act, the MDBA has functions under the Murray-Darling Basin Agreement (the Agreement), which forms Schedule 1 to the Act. These include giving effect to decisions of the Ministerial Council and the Basin Officials Committee in relation to Natural Resource Management programs and River Murray operations, advising these bodies and providing them with administrative support. The MDBA delivers its functions under the Agreement in conjunction with and on behalf of the contracting governments – the Australian Government and the governments of Victoria, South Australia, New South Wales, Queensland, and the Australian Capital Territory.
The MDBA’s functions under the Act and the Agreement are bought together under the MDBA’s single outcome - Equitable and sustainable use of the Murray-Darling Basin by governments and the community including through development and implementation of a Basin Plan, operation of the River Murray system, shared natural resource management programs, research, information and advice.
During 2014-15, the MDBA will continue its focus on the implementation of the Basin Plan. Key implementation priorities in 2014-15 will be to:
coordinate and provide technical advice to the intergovernmental processes and policy framework relating to the Sustainable Diversion Limit (SDL) Adjustment Mechanism;
further progress development of the Constraints Management Strategy including a pre-feasibility assessment of priority constraints, and a Basin Scale analysis, to inform development of the MDBA’s advice to Basin Ministers;
231

continue the development of the Basin Environmental Watering Strategy and Basin Annual Environmental Watering Priorities to support effective environmental watering that achieves long term environmental benefit to the Basin;
undertake further research and investigations into implementing aspects of the Basin Plan in the Northern Basin. This includes further development of the science and knowledge basis to inform a review of the Condamine-Balonne local reduction, the Northern Basin shared reduction and the related surface water SDLs;
prepare work programmes with each Basin State for the finalisation of water resource plans between 2015 and 2019, including setting up the administrative and policy framework by which the MDBA will facilitate the development, assessment and accreditation of 36 water resource plans through to 2019;
continue to work closely with Basin Governments to support compliance with the Basin Plan water trading rules, including educating stakeholders on the rules and conducting monitoring and evaluation activities; and
Develop the annual evaluation and reporting of Basin Plan effectiveness, including social, economic and environmental outcomes; contributing to open information on Basin Plan achievements and continuous improvement of implementation.
In relation to its Agreement functions the MDBA key priorities in 2014-15 will be to:
deliver the revised suite of joint programmes agreed by the Murray-Darling Basin Ministerial Council taking account of any revised contributions from Basin governments;
continue to work with the Basin governments to develop options for sustainable cost sharing arrangements for the delivery of joint programmes and the maintenance of existing and future jointly owned assets;
finalise the Environmental Works and Measures Programme projects including commissioning and first operations of the works;
support the review of cost effectiveness of the River Murray Operations;
effectively plan coordinated environmental water events; and
Continue to implement the Basin Salinity Management Strategy and Schedule B obligations including finalising a review of salinity management arrangements with jurisdictions.
The Public Governance, Performance and Accountability Act 2013 (PGPA Act) commences on 1 July 2014 and will create a resource management framework replacing the
232

Murray-Darling Basin Authority Budget Statements
existing financial framework governed by the Financial Management and Accountability Act 1997 (FMA Act). Under the PGPA Act the MDBA will be classified as a corporate Commonwealth entity.
233

Murray-Darling Basin Authority Budget Statements
1.2 AGENCY RESOURCE STATEMENT
Table 1.1 shows the total resources from all sources. The table summarises how resources will be applied by outcome and by administered and departmental classification.
234

Murray-Darling Basin Authority Budget Statements
Table 1.1: Murray-Darling Basin Authority Resource Statement — BudgetEstimates for 2014-15 as at Budget May 2014
235
Estimate Proposed Total Actualof prior + at Budget = estimate available
year amounts appropriation available in
2014-15 2014-15 2014-15 2013-14$'000 $'000 $'000 $'000
Ordinary annual services1
Departmental appropriationPrior year departmental appropriation2 80,420 80,420 141,958Departmental appropriation3 - 48,608 48,608 47,826s31 Relevant agency receipts4 - 74,812 74,812 88,034Total 80,420 123,420 203,840 277,818
Administered expensesOutcome 15 - 7,000 7,000 3,000Total - 7,000 7,000 3,000
Total ordinary annual services A 80,420 130,420 210,840 280,818
Total available annual appropriations 80,420 130,420 210,840 280,818
Special AccountsOpening balance6 75,100 75,100 136,638Appropriation receipts7 48,608 48,608 47,826Non-appropriation receipts to - Special Accounts8 86,154 86,154 104,325
Total Special Account B 75,100 134,762 209,862 288,789Total resourcingA+B 155,520 265,182 420,702 569,607Less appropriations drawn from
annual or special appropriations aboveand credited to special accounts 75,100 123,420 198,520 272,498
Total net resourcing for MDBA 80,420 141,762 222,182 297,1091 Appropriation Bill (No.1) 2014-15.2 Estimated adjusted MDB special Account balance carried forward from previous year. 3 MDBA does not receive a Departmental Capital Budget in 2014-15 (refer to table 3.2.5 forfurther details).
5MDBA does not receive the Administered Capital Budget in 2013-14 (refer to table 3.2.10 forfurther details).
7 Appropriation receipts includes Interest Equivalency of $2.711 million.8 Non-appropriation receipts to Special Accounts primarily include contributions from jurisdictions forMDB Agreement functions and GST receipts. Reader note: All figures are GST exclusive.
6 Estimated opening balance for special accounts. For further information on MDB special account see table 3.1.2
4 s31 Relevant Agency receipts comprises of mainly the jurisdictions contributions to the MDB Agreement functions. 2014-15 contributions are estimates pending Ministerial Council's decision on 'Cost sharing' review.

Murray-Darling Basin Authority Budget Statements
1.3 BUDGET MEASURES
Budget measures in Part 1 relating to MDBA are detailed in Budget Paper No. 2 and are summarised below.
Table 1.2: Agency 2014-15 Budget measuresPart 1: Measures announced since the 2013-14 MYEFO
Part 2: MYEFO Measures not previously reported in a portfolio statement
236
Programme 2013-14 2014-15 2015-16 2016-17 2017-18$'000 $'000 $'000 $'000 $'000
Expense measures
Efficiency Dividend - a further temporary increase of 0.25 per cent All
Administered expenses - - - - -Departmental expenses - (118) (241) (348) (58)
Total - (118) (241) (348) (58) Total expense measures
Administered - - - - -Departmental - (118) (241) (348) (58)
Total - (118) (241) (348) (58)
Programme 2013-14 2014-15 2015-16 2016-17 2017-18$'000 $'000 $'000 $'000 $'000
Expense Measures Public Service eff iciencies1 All
Administered expenses - - - - -Departmental expenses (9) (43) (94) (130) -
Total (9) (43) (94) (130) -Reforms to the APS management and eff icient procurement of agency softw are All
Administered expenses - - - - -Departmental expenses (78) (112) (164) (130) -
Total (78) (112) (164) (130) -Efficiency Dividend - temporary increase in rate All
Administered expenses - - - - -Departmental expenses - (470) (1,091) (1,648) -
Total - (470) (1,091) (1,648) -Total expense measures
Administered - - - - -Departmental (87) (625) (1,349) (1,908) -
Total (87) (625) (1,349) (1,908) -Prepared on a Government Finance Statistics (fiscal) basis1 Public Services Eff iciencies measure announced in the 2013-14 Budget but not previously reported in a portfolio statement

Murray-Darling Basin Authority Budget Statements
SECTION 2: OUTCOMES AND PLANNED PERFORMANCE
2.1 OUTCOMES AND PERFORMANCE INFORMATION
Government outcomes are the intended results, impacts or consequences of actions by the Government on the Australian community. Commonwealth programmes are the primary vehicle by which Government agencies achieve the intended results of their outcome statements. Agencies are required to identify the programmes which contribute to Government outcomes over the Budget and forward years.
The MDBA’s outcome is described below together with the Strategic Goals and Objectives which contribute to its achievement. Described in later pages are the key deliverables and performance indicators used to assess and monitor the performance of the MDBA in achieving the Government’s outcome.
Outcome 1: Equitable and sustainable use of the Murray-Darling Basin by governments and the community including through development and implementation of a Basin Plan, operation of the River Murray system, shared natural resource management programs, research, information and advice.
Outcome 1 StrategyThe delivery of the MDBA’s outcome is achieved through Programme 1.1 – Equitable and sustainable use of the Murray-Darling Basin and has the following strategic goals:
Strategic Goal 1: Integrated Water Management – Sustainable water planning and management arrangements that optimise the social, economic and environmental outcomes from the use of Basin water resources.
Strategic Goal 2: River and Ecosystem Health – Protect, restore or improve the ecological health and resilience of the Basin’s key environmental assets and water dependent ecosystems.
Strategic Goal 3: Knowledge into Action – Develop authoritative information, monitoring and research, in partnership with governments, scientists, and communities, to underpin decision making and adaptive management.
Strategic Goal 4: River Murray Asset Management – To equitably, efficiently and effectively manage, operate and sustain the River Murray System assets to deliver States’ water allocations and environmental outcomes.
237

Murray-Darling Basin Authority Budget Statements
Outcome Expense Statement
Table 2.1 provides an overview of the total expenses for outcome 1 by programme 1.1.
Table 2.1: Budgeted Expenses for Outcome 1
238
2013-14 2014-15Estimated Estimated
actual expensesexpenses
$'000 $'000
Programme 1.1: Equitable & sustainable use of the Murray-Darling BasinAdministered expenses 3,000 7,000Departmental expenses
Departmental appropriation 1 47,826 48,608Special Accounts 147,562 99,475
Expenses not requiring appropriation in the Budget year 2 2,134 2,869
Total for Programme 1.1 200,522 157,952
Outcome 1 Totals by appropriation typeAdministered Expenses 3,000 7,000Departmental expenses
Departmental appropriation 1 47,826 48,608Special Accounts 147,562 99,475
Expenses not requiring appropriation in the Budget year 2 2,134 2,869
Total expenses for Outcome 1 200,522 157,9522013-14 2014-15
Average Staffing Level (number) 295 290
1 Departmental Appropriation combines "Ordinary annual services (Appropriation Bill No. 1)" and "Revenue from independent sources (s31)". 2 Expenses not requiring appropriation in the Budget year is made up of Depreciation Expense, Amortisation Expense, Make-good Expense, Audit Fees. The MDBA does not receive a Departmental Capital Budget through Appropriation Bill 1 equity appropriations for capital acquisitions.
Outcome 1: Equitable and sustainable use of the Murray-Darling Basin by governments and the community including through development and implementation of a Basin Plan, operation of the River Murray system, shared natural resource management programs, research, information and advice
Note: Departmental appropriation splits and totals are indicative estimates and may change in the course of the budget year as government priorities change.

Murray-Darling Basin Authority Budget Statements
Contributions to Outcome 1
Programme 1.1: Equitable & Sustainable use of the Murray-Darling Basin
Programme ObjectiveStrategic Goal 1: Integrated Water Management
To optimise social, economic and environmental outcomes arising from the use of Basin-wide water resources in the national interest;
To embed sustainable and long-term adaptive management of Basin water resources,
To improve water security for all uses of Basin water resources; and
To strengthen support for the Basin Plan working together closely with governments and the wider community, in a way that respects the roles and responsibilities of all parties.
Strategic Goal 2: River and Ecosystem Health
To optimise ecological outcomes of environmental water in the Basin;
To improve the understanding of river health including ecosystem health, function and response to watering and management interventions; and
To reduce adverse impacts on river and ecosystem health.
Strategic Goal 3: Knowledge into Action
To continuously build an evidence base to support the implementation of the Basin Plan through data acquisition, research and dissemination of knowledge; and
To improve availability and accessibility of evidence to the community, Government and industry.
Strategic Goal 4: River Murray Asset Management
To build, maintain and improve River Murray system assets to achieve contemporary best practice standards; and
To manage the water sharing of the River Murray system between states to meet multiple social, economic and environmental objectives and support the community.
239

Murray-Darling Basin Authority Budget Statements
Programme ExpensesProgramme expenses will decline during 2014-15 and over the forward years due to the combined effect of the following:
• the finalisation of major infrastructure related projects comprising the Environmental Works and Measures programme;
• reductions in joint programme expenditure following decisions by the Ministerial Council to cease and/or reduce the delivery of Murray-Darling Basin Agreement programmes following reductions in contributions to the joint programs by New South Wales, South Australia and Queensland; and
• additional funding for constraints management and sustainable diversion limits, which commenced during 2013-14.
240
Programme Expenses 1.1 Equitable & sustainable use of the Murray-Darling Basin2013-14 2014-15 2015-16 2016-17 2017-18
Estimated Budget Forw ard Forw ard Forw ardactual estimate estimate estimate$'000 $'000 $'000 $'000 $'000
Annual administered expenses:Administered item 3,000 7,000 25,000 40,000 30,000
Special Account Expenses: Murray-Darling Basin Special Account - s21 FMA Act{s209 Water Act 2007 - Act No. 137] (D)
147,562 99,475 72,496 72,490 72,490
Annual departmental expenses:Departmental Appropriation 47,826 48,608 46,951 45,180 7,553
Programme supportExpenses not requiring appropriation in
the Budget year 1 2,134 2,869 2,316 2,322 2,322 Total Programme expenses 200,522 157,952 146,763 159,992 112,365
1 Expenses not requiring appropriation in the Budget year is made up of Depreciation Expense, Amortisation Expense, Make-good Expense, Audit Fees. The MDBA does not have a Departmental Capital Budget. Any capital acquisitions and/or investments are funded from non-appropriation receipts.

Murray-Darling Basin Authority Budget Statements
Programme 1.1 Deliverables Strategic Goal 1: Integrated Water Management
• Establish the Basin Plan reporting and evaluation approach and audit activities.
• Progress assessment of Sustainable Diversion Limit adjustment measures as agreed by the Basin Officials Committee.
• Implement the method to calculate environmental equivalence in the Sustainable Diversion Limit adjustment process.
• Progress research and investigation into scientific, social and economic aspects of the Basin Plan in the northern Basin.
• Conduct Victorian groundwater Sustainable Diversion Limit reviews as required in the Basin Plan.
• Progress any adjustments of groundwater Sustainable Diversion Limits in light of the New South Wales and the Victorian Reviews.
• Implement MDBA’s compliance strategy for the Basin Plan.
• Work with jurisdictions to build up a community of best practice in water resource planning.
• Finalise clear transitional arrangements for the Basin Plan.
• Publish a report on all surface water and groundwater use.
• Implement reporting arrangements for provisional Sustainable Diversion Limit compliance.
• Implement water trading rules including release of guidelines and development of systems for ensuring compliance.
• Publish Basin State Statements of Assurance.
• Establish arrangements to meet critical human water use needs and apply, if necessary, during times of severe water shortage;
• Collaborate with states and Commonwealth Environmental Water Office to implement the Basin Plan through the Basin Plan Implementation Committee and its Working Groups.
• Implement arrangements to ensure Basin governments and the community are involved in implementation of the Basin Plan.
Strategic Goal 2: River and Ecosystem Health
• Implement the Basin Plan reporting, evaluation and audit framework that allows assessment of ecosystem health function and response.
241

Murray-Darling Basin Authority Budget Statements
• Publish the Basin Annual Environmental Watering Priorities by the end of June each year.
• Finalise the Basin Environmental Watering Strategy by November 2014.
• Publish a report on the use of held environmental water in the Basin.
• Undertake the prefeasibility assessments under the Constraints Management Strategy.
• Publish the Living Murray annual water plan by the end of June each year.
• Work with States to develop transitional options for future arrangements for The Living Murray program.
• Develop planning tools to inform the prioritisation of environmental water delivery and other water management activities.
• Carry out River Murray Water Quality monitoring program as supported by joint governments.
• Synthesis of monitoring of the Living Murray icon sites.
• Estimate salt discharge from River Murray system.
• Produce material to support implementation of the Water Quality and Salinity Management Plan.
• Prepare salinity registers and reports.
• Finalise a review of salinity management arrangements with jurisdictions.
• Undertake risk assessment for Murray environmental watering activities.
• Business cases for South Australia Riverland Floodplain Integrated Infrastructure Program construction works completed and approved.
Strategic Goal 3: Knowledge into Action
• Develop partnerships with research institutions and agencies to give effect to the Murray-Darling Basin Authority science and research strategy.
• Develop indicators for monitoring and evaluating the long-term social, economic and environmental impacts of the Basin Plan.
• Progress the adoption of integrated water resource modelling to support the development and implementation of the Basin Plan.
• Complete Stage 1 of the Cultural Flows research project.
• Establish information co-ordination and collaboration arrangements to enhance Murray-Darling Basin Authority’s access to the best data, information and knowledge.
242

Murray-Darling Basin Authority Budget Statements
• Use the Murray-Darling Basin Authority website as the primary source of information for stakeholders and disseminate information through a range of media.
• Develop communication products to promote availability of information to stakeholders.
Strategic Goal 4: River Murray Asset Management
• Carry out annual planned maintenance and renewals program according to contemporary best practice.
• Reduce risks associated with joint venture assets to acceptable levels in accordance with jurisdictional dam safety regulations through the Dam Improvement Program.
• Finalise Environmental Works and Measures Program projects including commissioning and first operations.
• Operate and maintain existing salt interception schemes in accordance with agreed operating rules and operating and maintenance procedures.
• Conduct day to day operation of the River Murray System assets in accordance with the Objectives and Outcomes set by the Basin Officials Committee.
• Transparently determine State Water Entitlements in accordance with the Agreement.
• Effectively maintain the River Murray system water accounts;
• Support a review of cost effectiveness for the joint asset arrangements as directed by the Basin Officials Committee.
• Effective planning and real time management to deliver coordinated environmental water events.
243

Murray-Darling Basin Authority Budget Statements
Programme 1.1 Key Performance Indicators Strategic Goal 1: Integrated Water Management
• Reporting, evaluation and audit activities indicate that Basin Plan implementation is:
o improving the health of water-dependent ecosystems and ecosystem functions in the Basin;
o facilitating water reaching its most productive use; and
o contributing to productive and resilient water-dependent industries.
• The Sustainable Diversion Limit adjustment mechanism operates to allow surface water Sustainable Diversion Limits to be adjusted to reflect the operation of robust supply and efficiency measures developed by States.
• The northern Basin review and the review of 3 groundwater Sustainable Diversion Limit resource units determine whether there is a robust case to amend relevant settings of the Basin Plan.
• Compliance approach is risk based and minimises red tape.
• Progressive accreditation of state water resource plans that meet the Basin Plan requirements for sustainable and adaptive water management.
• Basin Plan implementation activities give effect to the principle of adaptive management.
• Reporting on water use based on provisional Sustainable Diversion Limits.
• Compliance with water trading rules.
• Effective management of critical human water needs during times of severe water shortage.
• Effective arrangements in place for working with Basin governments in Basin Plan implementation, with a rolling implementation work program updated annually.
• Local knowledge and solutions inform the implementation of the Basin Plan.
Strategic Goal 2: River and Ecosystem Health
• Basin Plan implementation is improving the health of water-dependent ecosystems and ecosystem functions in the Basin as indicated by the targets in Schedule 7 of the Basin Plan.
• Basin Annual and long term Environmental Watering Priorities are met and provide a Basin perspective over and above state priorities.
• The Constraints Management Strategy leads to the implementation of measures that allow environmental water to be used more effectively, while addressing impacts on third parties.
244

Murray-Darling Basin Authority Budget Statements
• The Living Murray transition arrangements complement the Basin Plan environmental watering plan and are supported by Basin governments. Positive report from the Independent River Operations Review Group in relation to The Living Murray water.
• Reporting on environmental watering implementation and outcomes influences subsequent planning and priority setting.
• Water quality and salinity targets in the Basin Plan are met and risks are considered and mitigated.
• Salinity accountability framework assists governments in meeting agreed outcomes.
• Outcomes of salinity review are supported by Basin governments.
• South Australia Riverland Floodplain Integrated Infrastructure Programme delivers environmental improvement.
Strategic Goal 3: Knowledge into Action
• Knowledge gaps are identified and priority gaps are addressed.
• Adoption of integrated water resource modelling across the Basin.
• Evaluation of Basin Plan effectiveness is well supported by evidence.
• Increased stakeholder access to data and information.
Strategic Goal 4: River Murray Asset Management
• No adverse rulings from jurisdictional dam safety regulators.
• Annual inspection assesses all assets to have achieved a good or high standard of maintenance.
• Environmental Works and specific projects are managed efficiently to achieve their objectives and are maintained to contemporary standards.
• Positive annual performance report for all salt interception schemes.
• Positive Report on River Murray System operations of the Independent River Operations Review Group endorsed by the Basin Officials Committee.
245

Murray-Darling Basin Authority Budget Statements
Section 3: Explanatory Tables and Budgeted Financial StatementsSection 3 presents explanatory tables and budgeted financial statements which provide a comprehensive snapshot of agency finances for the 2014-15 Budget year. It explains how budget plans are incorporated into the financial statements and provides further details of the reconciliation between appropriations and programme expenses, movements in administered funds, special accounts and Australian Government Indigenous expenditure.
3.1 EXPLANATORY TABLES
3.1.1 Movement of Administered Funds Between YearsAdministered funds can be provided for a specified period, for example under annual Appropriation Acts. Funds not used in the specified period with the agreement of the Finance Minister may be moved to a future year. Table 3.1.1 shows the movement of administered funds approved between years.
Table 3.1.1: Movement of Administered Funds Between Years1
There are no movements of Administered funds between years for the MDBA
3.1.2 Special AccountsSpecial Accounts provide a means to set aside and record amounts used for specified purposes. Special Accounts can be created by a Finance Minister’s Determination under the FMA Act or under separate enabling legislation. Table 3.1.2 shows the expected additions (receipts) and reductions (payments) for each account used by the MDBA.
Table 3.1.2: Estimates of Special Account Flows and Balances
246
Opening Closingbalance Receipts Payments Adjustments balance2014-15 2014-15 2014-15 2014-15 2014-152013-14 2013-14 2013-14 2013-14 2013-14
Outcome $'000 $'000 $'000 $'000 $'000
Murray-Darling Basin Special Account (D)* 75,100 134,762 (161,435) - 48,427Total Special Accounts
2014-15 Budget estimate 75,100 134,762 (161,435) - 48,427Total Special Accounts
2013-14 estimated actual 136,638 152,151 (213,689) - 75,100(D) = DepartmentalThe MDBA is in receipt of Interest Equivalency Payment (IEP) of $2.711 million. IEP is included in the receipts to the Special Account.

Murray-Darling Basin Authority Budget Statements
3.1.3 Australian Government Indigenous ExpenditureIn 2014-15 Australian Government Indigenous Expenditure is not applicable because the Authority has no Indigenous specific expenses.
247

Murray-Darling Basin Authority Budget Statements
3.2 BUDGETED FINANCIAL STATEMENTS
3.2.1 Differences in Agency Resourcing and Financial StatementsThere are no differences between the resource information presented in the Budget Papers and Portfolio Budget Statements as a result of differences between Australian Accounting Standards (AAS) and the Government Finance Statistics (GFS).
3.2.2 Analysis of Budgeted Financial StatementsRevenue is credited to the Murray-Darling Basin Special Account from the following sources:
Australian Government Departmental appropriation for Basin Plan functions and interest equivalency;
Australian Government contribution to Agreement functions; and
State and Territory Government contributions and other income sources (e.g. property revenues, hydro general and sale of assets) for the Agreement functions.
The commencement of the Public Governance, Performance and Accountability Act 2013 will result in some accounting and financial reporting changes, but will not fundamentally alter the nature of these revenue sources.
Australian Government and State and Territory government contributions to the Agreement joint programs, which are reflected as grants income in the Financial Statements and grants cash in the balance sheet, for 2014-15, represent estimates based on current advice from Basin jurisdictions.
Where appropriate, expenses, both employees and suppliers, have been adjusted to reflect the appropriations and reductions in revenues resulting from any revised contributions to the joint programs.
The MDBA has budget for an operating deficit in 2014-15 which reflects the completion of a number of environmental works and measures projects for which funds are retained in the Murray-Darling Basin Special Account.
Administered expenses have been incurred during 2013-14 for the first time reflecting the administered measures implemented in relation to the South-Australian Riverland floodplain integrated infrastructure projects. The projects, with an estimated total cost of $155 million, are planned to progress further over the next six years.
248

Murray-Darling Basin Authority Budget Statements
Table 3.2.1 Comprehensive Income Statement (Showing Net Cost of Services) for the period ended 30 June
Prepared on Australian Accounting Standards basis.
249
Estimated Budget Forw ard Forw ard Forw ardactual estimate estimate estimate estimate
2013-14 2014-15 2015-16 2016-17 2017-18$'000 $'000 $'000 $'000 $'000
EXPENSESEmployee benef its 38,613 39,379 38,538 38,629 38,629Suppliers 156,775 108,704 80,909 79,041 41,414Depreciation and amortisation 2,134 2,869 2,316 2,322 2,322Total expenses 197,522 150,952 121,763 119,992 82,365LESS: OWN-SOURCE INCOMEOwn-source revenueGrants1 85,713 72,491 72,491 72,491 72,491Royalties 477 477 477 477 477Other 1,844 1,844 1,844 1,844 1,844Total own-source revenue 88,034 74,812 74,812 74,812 74,812Total own-source income 88,034 74,812 74,812 74,812 74,812Net cost of (contribution by)
services 109,488 76,140 46,951 45,180 7,553Revenue from Government 47,826 48,608 46,951 45,180 7,553* * * *Surplus (Deficit) attributable to
the Australian Government (61,662) (27,532) - - -

Murray-Darling Basin Authority Budget Statements
Table 3.2.1 Comprehensive Income Statement (Showing Net Cost of Services) for the period ended 30 June (continued)
250
Estimated Budget Forw ard Forw ard Forw ardactual estimate estimate estimate estimate
2013-14 2014-15 2015-16 2016-17 2017-18$'000 $'000 $'000 $'000 $'000
OTHER COMPREHENSIVE INCOMEChanges in asset revaluation surplus
Total other comprehensive income - - - - -Total comprehensive income (loss) (61,662) (27,532) - - -Total comprehensive income (loss)
attributable to the Australian Government (61,662) (27,532) - - -
Note: Impact of Net Cash Appropriation ArrangementsTotal Comprehensive Income
(loss) excluding depreciation/amortisationexpenses previously funded throughrevenue appropriations. (61,662) (27,532) - - -
less depreciation/amortisation expensespreviously funded through revenue - - - - -appropriations2
Total Comprehensive Income (loss) - as per the Statement ofComprehensive Income (61,662) (27,532) - - -
2 From 2010-11, the Government introduced net cash appropriation arrangements w here Bill 1 revenue appropriations for the depreciation/amortisation expenses of FMA Act agencies w ere replaced w ith a separate capital budget (the Departmental Capital Budget, or DCB) provided through Bill 1 equity appropriations. For information regarding DCBs, please refer to Table 3.2.5 Departmental Capital Budget Statement.
1The Grants comprise of the jurisdictions contributions to the MDB Agreement functions. The contributions are estimates pending Ministerial Council's decision on contributions.

Murray-Darling Basin Authority Budget Statements
Table 3.2.2: Budgeted Departmental Balance Sheet(as at 30 June)
251
Estimated Budget Forw ard Forw ard Forw ardactual estimate estimate estimate estimate
2013-14 2014-15 2015-16 2016-17 2017-18$'000 $'000 $'000 $'000 $'000
ASSETSFinancial assets
Cash and cash equivalents 5,320 5,320 5,320 5,320 5,320Trade and other receivables 75,004 48,331 48,637 48,949 48,949Other f inancial assets 459 459 459 459 459
Total financial assets 80,783 54,110 54,416 54,728 54,728 Non-financial assets
Property, plant and equipment 2,739 2,213 1,907 1,595 1,595Intangibles 8,610 8,277 8,277 8,277 8,277Other non-financial assets 475 475 475 475 475
Total non-financial assets 11,824 10,965 10,659 10,347 10,347 Assets held for sale
Total assets 92,607 65,075 65,075 65,075 65,075 LIABILITIESPayables
Suppliers 33,299 33,439 33,579 33,675 33,675Other payables 3,643 3,643 3,643 3,643 3,643
Total payables 36,942 37,082 37,222 37,318 37,318 Interest bearing liabilities
Other interest bearing liabilities 481 306 131 - -Total interest bearing liabi lities 481 306 131 - - Provisions
Employee provisions 10,390 10,425 10,460 10,495 10,495Other provisions 632 632 632 632 632
Total provisions 11,022 11,057 11,092 11,127 11,127 Total liabilities 48,445 48,445 48,445 48,445 48,445 Net assets 44,162 16,630 16,630 16,630 16,630 EQUITY*Parent entity interest
Contributed equity (11,199) (11,199) (11,199) (11,199) (11,199)Reserves 87 87 87 87 87
(accumulated def icit) 55,274 27,742 27,742 27,742 27,742Total parent entity interest 44,162 16,630 16,630 16,630 16,630
Total Equity 44,162 16,630 16,630 16,630 16,630
* 'Equity' is the residual interest in assets af ter deduction of liabilities.
Prepared on Australian Accounting Standards basis.
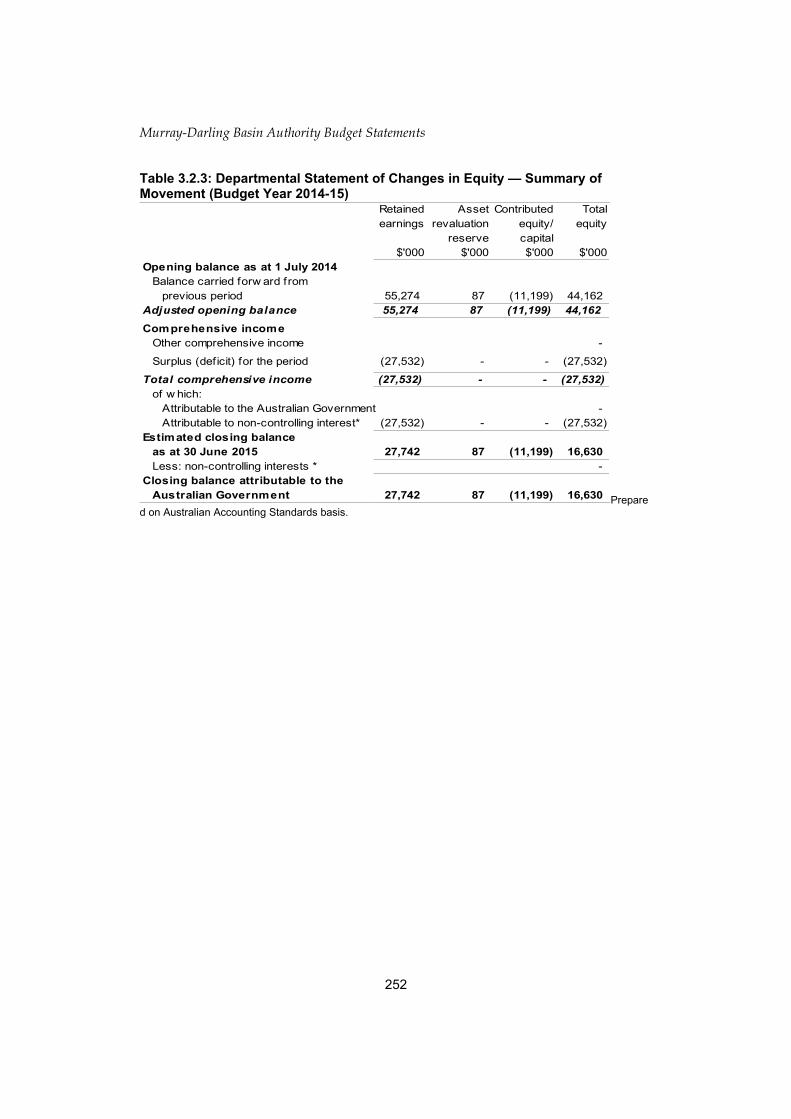
Murray-Darling Basin Authority Budget Statements
Table 3.2.3: Departmental Statement of Changes in Equity — Summary of Movement (Budget Year 2014-15)
Prepared on Australian Accounting Standards basis.
252
Retained Asset Contributed Totalearnings revaluation equity/ equity
reserve capital$'000 $'000 $'000 $'000
Opening balance as at 1 July 2014Balance carried forw ard from
previous period 55,274 87 (11,199) 44,162Adjusted opening balance 55,274 87 (11,199) 44,162Comprehensive income
Other comprehensive income -
Surplus (def icit) for the period (27,532) - - (27,532)
Total comprehensive income (27,532) - - (27,532)of w hich:
Attributable to the Australian Government -Attributable to non-controlling interest* (27,532) - - (27,532)
Estimated closing balanceas at 30 June 2015 27,742 87 (11,199) 16,630Less: non-controlling interests * -
Closing balance attributable to the Australian Government 27,742 87 (11,199) 16,630

Murray-Darling Basin Authority Budget Statements
Table 3.2.4: Budgeted Departmental Statement of Cash Flows(for the period ended 30 June)
Prepared on Australian Accounting Standards basis.
253
Estimated Budget Forw ard Forw ard Forw ardactual estimate estimate estimate estimate
2013-14 2014-15 2015-16 2016-17 2017-18$'000 $'000 $'000 $'000 $'000
OPERATING ACTIVITIESCash received
AppropriationsReceipts from Government 47,826 48,608 46,951 45,180 7,553Sale of goods and rendering of services 477 477 477 477 477Cash from Official Public Account 61,538 26,673 (306) (312) -Grants cash received 85,713 72,491 72,491 72,491 72,491Net GST received 16,291 11,342 8,473 5,392 4,372Other 1,844 1,844 1,844 1,844 1,844
Total cash received 213,689 161,435 129,930 125,072 86,737Cash used
Employees 38,463 39,344 38,503 38,594 38,629Suppliers 173,216 120,081 89,417 84,468 45,786
Total cash used 211,679 159,425 127,920 123,062 84,415Net cash from (used by)
operating activities 2,010 2,010 2,010 2,010 2,322INVESTING ACTIVITIESCash receivedTotal cash received - - - - -Cash used
Purchase of property, plant and equipment 2,010 2,010 2,010 2,010 2,322
Total cash used 2,010 2,010 2,010 2,010 2,322Net cash from (used by)
investing activities (2,010) (2,010) (2,010) (2,010) (2,322)
Cash and cash equivalents at thebeginning of the reporting period 5,320 5,320 5,320 5,320 5,320
Cash and cash equivalents at the end of the reporting period 5,320 5,320 5,320 5,320 5,320
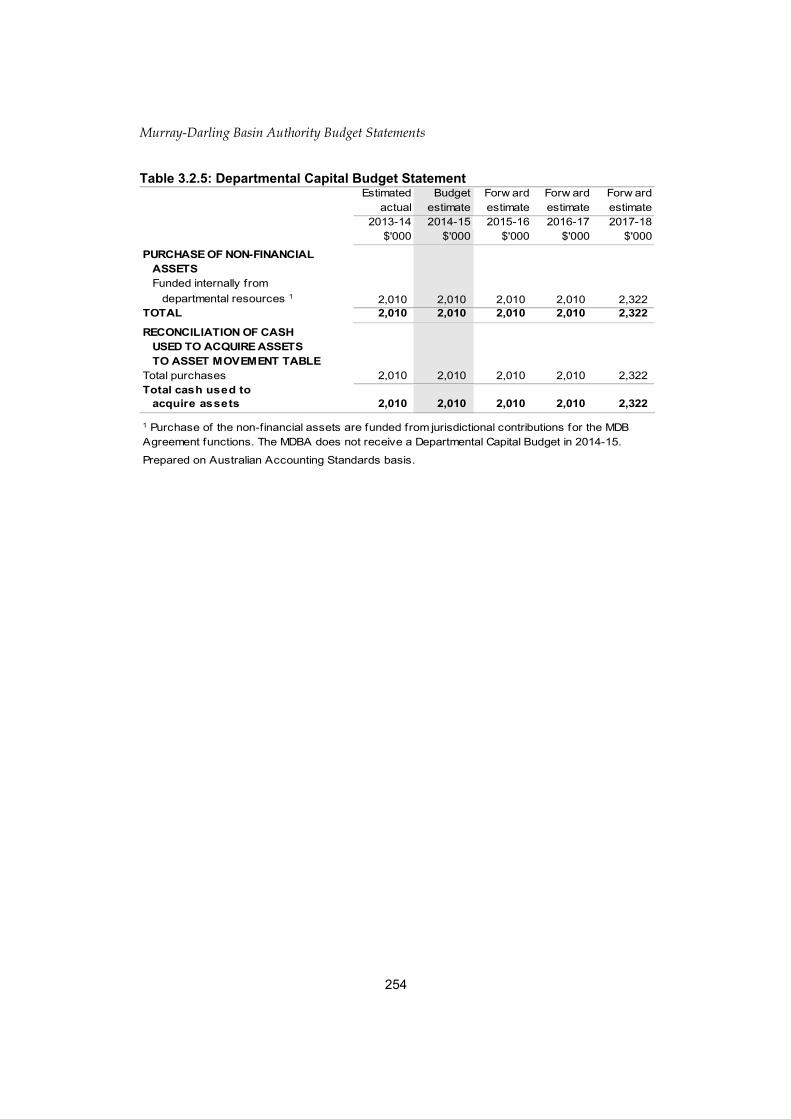
Murray-Darling Basin Authority Budget Statements
Table 3.2.5: Departmental Capital Budget Statement
254
Estimated Budget Forw ard Forw ard Forw ardactual estimate estimate estimate estimate
2013-14 2014-15 2015-16 2016-17 2017-18$'000 $'000 $'000 $'000 $'000
PURCHASE OF NON-FINANCIALASSETSFunded internally f rom
departmental resources 1 2,010 2,010 2,010 2,010 2,322TOTAL 2,010 2,010 2,010 2,010 2,322
RECONCILIATION OF CASHUSED TO ACQUIRE ASSETSTO ASSET MOVEMENT TABLE
Total purchases 2,010 2,010 2,010 2,010 2,322Total cash used to
acquire assets 2,010 2,010 2,010 2,010 2,322
Prepared on Australian Accounting Standards basis.
1 Purchase of the non-financial assets are funded from jurisdictional contributions for the MDB Agreement functions. The MDBA does not receive a Departmental Capital Budget in 2014-15.

Table 3.2.6: Statement of Asset Movements (2014-15)
255
Murray-D
arling Basin Authority Budget Statem
ents
Asset Category (as appropriate) Land Buildings Other property, Heritage Investment Computer L&B, IP&E Other Total
plant and and cultural property software and held for saleequipment intangibles
$'000 $'000 $'000 $'000 $'000 $'000 $'000 $'000 $'000As at 1 J uly 2014Gross book value 5,833 14,282 20,115Accumulated depreciation/amortisation -
and impairment (3,094) (5,672) (8,766)Opening net book balance - - 2,739 - - 8,610 - - 11,349CAPITAL ASSET ADDITIONSEstimated expenditure on
new or replacement assetsBy purchase - other1 425 1,585 2,010Total additions - - 425 - - 1,585 - - 2,010Other movementsDepreciation/amortisation expense (951) (1,918) (2,869)OtherTotal other movements - - (951) - - (1,918) - - (2,869)As at 30 J une 2015Gross book value - - 6,258 - - 15,867 - - 22,125Accumulated depreciation/amortisation
and impairment - - (4,045) - - (7,590) - - (11,635)Closing net book balance - - 2,213 - - 8,277 - - 10,490
Prepared on Australian Accounting Standards basis.
1 Purchase of 'Other property, plant and equipment' and internally developed softw are (Intangibles) are funded from non-appropriation receipts.

Murray-Darling Basin Authority Budget Statements
Table 3.2.7: Schedule of Budgeted Income and Expenses Administered on Behalf of Government (for the period ended 30 June)
Table 3.2.8: Schedule of Budgeted Assets and Liabilities Administered on Behalf of Government (as at 30 June)The Schedule of Budgeted Assets and Liabilities Administered on Behalf of Government does not apply to the MDBA.
256
Estimated Budget Forw ard Forw ard Forw ardactual estimate estimate estimate estimate
2013-14 2014-15 2015-16 2016-17 2017-18$'000 $'000 $'000 $'000 $'000
EXPENSES ADMINISTERED ONBEHALF OF GOVERNMENT Grants 3,000 7,000 25,000 40,000 30,000Total expenses administeredon behalf of Government 3,000 7,000 25,000 40,000 30,000
Net Cost of (contribution by)services 3,000 7,000 25,000 40,000 30,000Surplus (Deficit) (3,000) (7,000) (25,000) (40,000) (30,000)
Total comprehensive income (loss) (3,000) (7,000) (25,000) (40,000) (30,000)Prepared on Australian Accounting Standards basis.

Murray-Darling Basin Authority Budget Statements
Table 3.2.9: Schedule of Budgeted Administered Cash Flows(for the period ended 30 June)
Table 3.2.10: Schedule of Administered Capital Budget StatementThe MDBA is not in receipt of Administered Capital Budget. The Schedule of Administered Capital Budget statement does not apply to the MDBA.
Table 3.2.11: Statement of Administered Asset Movements (2014-15) There are no movement of Administered assets for the MDBA.
257
Estimated Budget Forw ard Forw ard Forw ardactual estimate estimate estimate estimate
2013-14 2014-15 2015-16 2016-17 2017-18$'000 $'000 $'000 $'000 $'000
OPERATING ACTIVITIESCash received
Net GST received 300 700 2,500 4,000 3,000Total cash received 300 700 2,500 4,000 3,000Cash used
Grant 3,300 7,700 27,500 44,000 33,000Total cash used 3,300 7,700 27,500 44,000 33,000Net cash from (used by)
operating activities (3,000) (7,000) (25,000) (40,000) (30,000)
Net increase (decrease) in cash held (3,000) (7,000) (25,000) (40,000) (30,000)
- Appropriations 3,000 7,000 25,000 40,000 30,000
3,000 7,000 25,000 40,000 30,000Cash and cash equivalents at endof reporting period - - - - -Prepared on Australian Accounting Standards basis.

National Water Commission
Agency Resources and Planned Performance
259

NATIONAL WATER COMMISSION
Section 1: Agency Overview and Resources.........................................................2571.1 Strategic Direction Statement......................................................................2571.2 Agency Resource Statement.......................................................................2581.3 Budget Measures.........................................................................................259
Section 2: Outcomes and Planned Performance..................................................2612.1 Outcomes and Performance Information.....................................................261
Section 3: Explanatory Tables and Budgeted Financial Statements...................2653.1 Explanatory Tables......................................................................................2653.2 Budgeted Financial Statements...................................................................266
261

NATIONAL WATER COMMISSION
Section 1: Agency Overview and Resources
1.1 STRATEGIC DIRECTION STATEMENT
The National Water Commission (NWC) is an independent statutory authority whose key responsibilities are to provide independent assurance of governments’ progress on water reform and to promote the objectives and outcomes of the Intergovernmental Agreement on a National Water Initiative (NWI). The NWC was created as a result of the NWI, and formally established by the National Water Commission Act 2004.
The NWC has one outcome – informed decisions by governments on national water issues, and improved management of Australia’s water resources, through advocacy, facilitation and independent advice.
In addition to meeting its functional requirements under the National Water Commission Act 2004, the NWC is required under other Commonwealth legislation or agreements to independently undertake a number of activities and to provide advice and reports. The NWC has an ongoing function established under the Water Act 2007 to audit the effectiveness of the implementation of the Murray-Darling Basin Plan and associated water resource plans. The NWC also has functions under the Carbon Credits (Carbon Farming Initiative) Regulations 2011.
The Government has decided to cease the operations of the NWC in 2014-15 and to reallocate its statutory and some assessment responsibilities to other agencies. Legislation to repeal the National Water Commission Act 2004 will be tabled in the Parliament during the Budget sittings for effect from 1 January 2015.
In 2014-15 the NWC will focus its activities on the completion of the Triennial Assessment of Commonwealth, State and Territory governments’ implementation of their commitments under the NWI and provide a report to the Minister and the Council of Australian Governments (COAG) on progress of reform and on key issues needing to be addressed in the future. The NWC will also undertake administrative action to close it’s operations by 31 December 2014.

1.2 AGENCY RESOURCE STATEMENT
Table 1.1 shows the total resources from all sources. The table summarises how resources will be applied by outcome and by administered and departmental classification.
Table 1.1: National Water Commission Resource Statement — BudgetEstimates for 2014-15 as at Budget May 2014
Estimate Proposed Total Actualof prior + at Budget = estimate available
year amounts appropriation available in
2014-15 2014-15 2014-15 2013-14$'000 $'000 $'000 $'000
Ordinary annual services1
Departmental appropriationPrior year departmental appropriation2
8,955- 8,955 7,755
Departmental appropriation - 4,922 4,922 8,302Total 8,955 4,922 13,877 16,057
Total ordinary annual services A 8,955 4,922 13,877 16,057
Other services3
Departmental non- operatingEquity injections4 - - - 1,238Total B - - - 1,238
Total available annual appropriations (A+B) 8,955 4,922 13,877 17,295
Total resourcingA+B 8,955 4,922 13,877 17,295
1 Appropriation Bill (No.1) 2014-152 Estimated adjusted balance carried forward from previous year3 Appropriation Bill (No. 2) 2014-154 Includes an amount of $1.238m in 2013-14 for the Departmental Capital Budget (refer to table 3.2.5 for further details). For accounting purposes this amount has been designated as 'contributions by owners'.Reader note: All figures are GST exclusive.

National Water Commission Budget Statements
1.3 BUDGET MEASURES
Budget measures in Part 1 relating to the National Water Commission are detailed in Budget Paper No. 2 and are summarised below.
Table 1.2: Agency 2014-15 Budget measuresPart 1: Measures announced since the 2013-14 MYEFO
Prepared on a Government Finance Statistics (fiscal) basis.
265
Programme 2013-14 2014-15 2015-16 2016-17 2017-18$'000 $'000 $'000 $'000 $'000
Saving measuresNational Water Commission - cessation1 1.1
Administered expenses - - - - -Departmental expenses - (3,260) (8,139) (8,089) (8,168)
Total expense measures - (3,260) (8,139) (8,089) (8,168)
Efficiency Dividend - a further temporary increase of 0.25 per cent 1.1
Administered expenses - - - - -Departmental expenses - (21) (42) (62) (63)
Total saving measures - (21) (42) (62) (63)
Total saving measuresAdministered - - - - -Departmental - (3,281) (8,181) (8,151) (8,231)
Total - (3,281) (8,181) (8,151) (8,231)1 This measure represents the budget savings derived from the closure of the National Water Commission.

National Water Commission Budget Statements
Part 2: MYEFO measures not previously reported in a portfolio statement
266
Programme 2013-14 2014-15 2015-16 2016-17 2017-18$'000 $'000 $'000 $'000 $'000
Saving measuresPublic service eff iciencies 1.1
Administered expenses - - - - -Departmental expenses (2) (38) (47) (53) (53)
(2) (38) (47) (53) (53)
Reforms to APS management and efficient procurement of agency softw are 1.1
Administered expenses - - - - -Departmental expenses (10) (16) (24) (21) (21)
(10) (16) (24) (21) (21)Efficiency Dividend - temporary increase in rate 1.1
Administered expenses - - - - -Departmental expenses - (84) (190) (296) (296)
- (84) (190) (296) (296)Total saving measures
Administered - - - - -Departmental (12) (138) (261) (370) (370)
Total (12) (138) (261) (370) (370)

National Water Commission Budget Statements
SECTION 2: OUTCOMES AND PLANNED PERFORMANCE
2.1 OUTCOMES AND PERFORMANCE INFORMATION
Government outcomes are the intended results, impacts or consequences of actions by the Government on the Australian community. Commonwealth programmes are the primary vehicle by which Government agencies achieve the intended results of their outcome statements. Agencies are required to identify the programmes which contribute to Government outcomes over the Budget and forward years.
Each outcome is described below together with its related programmes, specifying the performance indicators and targets used to assess and monitor the performance of the National Water Commission in achieving Government outcomes.
Outcome 1: Informed decisions by governments on national water issues, and improved management of Australia’s water resources, through advocacy, facilitation and independent advice.
Outcome 1 StrategyThe outcome will be achieved through:
providing strategic assessments, independent advice and recommendations to the Minister for the Environment, and to the Australian, State and Territory governments on the implementation of the National Water Initiative;
conducting assessment and monitoring of water reform issues, including identifying priority and emerging issues that impact on the sustainability and use of Australia’s water resources; and
consulting with jurisdictions and other stakeholders to identify priorities for water reform.
The National Water Commission will maintain a high level of consultation with stakeholders to inform its assessment activities and structure recommendations for ongoing water reform.
Outcome Expense Statement
Table 2.1 provides an overview of the total expenses for outcome 1, by programme.
267

National Water Commission Budget Statements
Table 2.1: Budgeted Expenses for Outcome 1
268
Outcome 1: Informed decisions by governments on national water issues, and improved management of Australia's water resources through advocacy, facilitation and independent advice
2013-14 2014-15
Estimated Estimatedactual expenses
expenses$'000 $'000
Program 1.1: Water ReformAdministered expenses
Ordinary annual services (Appropriation Bill No. 1) - -Departmental expenses
Departmental appropriation 1 8,302 4,922Expenses not requiring appropriation in the Budget year 2 313 182
Total expenses for Outcome 1 8,615 5,1042013-14 2014-15
Average Staffing Level (number) 37 11
1 Departmental Appropriation is "Ordinary annual services (Appropriation Bill No. 1)"2 Expenses not requiring appropriation in the Budget year is made up of Depreciation Expense, Amortisation Expense and Audit Fees

National Water Commission Budget Statements
Contributions to Outcome 1
Programme 1.1: Water Reform
Programme ObjectiveAssist Australian governments’ implementation of the National Water Initiative (NWI) to improve the management of Australia’s water resources by:
• assessing, monitoring and providing advice and recommendations on priority national issues related to water management in Australia and progress in implementing the NWI; and
• working with all Australian governments and other stakeholders to facilitate reform initiatives.
Programme Expenses• The National Water Commission (NWC) has been appropriated funding in 2014-
15 to meet the cost of the completion of its Triennial Assessment report and subordinate reports and for closure activities. Employee expense funding is based on a stepped reduction in staff resources and the payment of separation costs if needed. The NWC will cease its operations on 31 December 2014 so no funding beyond 2014-15 is required.
269
Program Expenses 1.1: Water Reform2013-14 2014-15 2015-16 2016-17 2017-18
Estimated Budget Forw ard Forw ard Forw ardactual estimate estimate estimate
('000) $'000 $'000 $'000 $'000 $'000Annual administered expenses:
Other - - - - - Annual departmental expenses:
Employees 5,771 3,539 - - - Suppliers 2,531 1,383 - - -
Expenses not requiring appropriation in - the Budget year 1 313 182 - - -
Total program expenses 8,615 5,104 - - -1 Expenses not requiring appropriation in the Budget year is made up of Depreciation Expense, Amortisation, Expense and Audit Fees.

National Water Commission Budget Statements
Programme 1.1 Deliverables• Assessment, monitoring and evaluation activities on priority issues related to
water management in Australia.
• Report to the Minister and jurisdictions on progress with implementation of the NWI, including delivery of the Triennial Assessment Report and subordinate reports in 2014.
• Provide information and advice to governments, stakeholders and the community to inform improved water management.
Programme 1.1 Key Performance Indicators • Strategic assessments and advice provided to the Minister and jurisdictions on
national water reform issues are credible and independent.
• The Triennial Assessment Report and subordinate reports are delivered on time and are credible and independent.
• Engagement with all Australian governments and other stakeholders contributes to water reform.
270

National Water Commission Budget Statements
Section 3: Explanatory Tables and Budgeted Financial StatementsSection 3 presents explanatory tables and budgeted financial statements which provide a comprehensive snapshot of agency finances for the 2014-15 Budget year. It explains how budget plans are incorporated into the financial statements and provides further details of the reconciliation between appropriations and programme expenses, movements in administered funds, special accounts and Australian Government Indigenous expenditure.
3.1 EXPLANATORY TABLES
3.1.1 Movement of Administered Funds Between YearsThere are no movement of administered funds between years for the NWC.
3.1.2 Special AccountsThe NWC does not operate a special account.
3.1.3 Australian Government Indigenous ExpenditureThe Australian Government Indigenous Expenditure Statement 2014-15 is not applicable because the NWC has no Indigenous specific expenses.
271

National Water Commission Budget Statements
3.2 BUDGETED FINANCIAL STATEMENTS
3.2.1 Differences in Agency Resourcing and Financial StatementsThere are no differences between the resource information presented in the Budget Papers and the Portfolio Budget Statements as a result of differences between Australian Accounting Standards (AAS) and Government Financial Statistics (GFS).
3.2.2 Analysis of Budgeted Financial StatementsThe change in the level of funding for the National Water Commission (NWC) in 2014-15 and future years reflects the government’s decision to cease the operations of the NWC and to reallocate some of its functions to other agencies.
Funding in 2014-15 includes employee and supplier expenses for the completion and reporting of the Triennial Assessment into the Australian, State and Territory governments’ implementation of their commitments under the NWI and for closure activities.
The financial statements have been presented to reflect the closure of the NWC.
272

National Water Commission Budget Statements
3.2.3 Budgeted Financial Statements Tables
Table 3.2.1 Comprehensive Income Statement (Showing Net Cost of Services) for the period ended 30 June
Prepared on Australian Accounting Standards basis.
273
Estimated Budget Forw ard Forw ard Forw ardactual estimate estimate estimate estimate
2013-14 2014-15 2015-16 2016-17 2017-18$'000 $'000 $'000 $'000 $'000
EXPENSESEmployee benefits 5,771 3,539 - - -Suppliers 2,607 1,436 - - -Depreciation and amortisation 237 129 - - -Total expenses 8,615 5,104 - - -LESS: OWN-SOURCE INCOMEOwn-source revenueOther - - - - -Total own-source revenue - - - - -GainsOther 76 53 - - -Total gains 76 53 - - -Total own-source income 76 53 - - -Net cost of (contribution by)
services 8,539 5,051 - - -Revenue from Government 8,302 4,922 - - -* * * *Surplus (Deficit) attributable to
the Australian Government (237) (129) - - -
Total comprehensive income (loss) attributable to the Australian Government (237) (129) - - -
Note: Impact of Net Cash Apppropriation Arrangements2013-14 2014-15 2015-16 2016-17 2017-18
$'000 $'000 $'000 $'000 $'000Total Comprehensive Income
(loss) excluding depreciation/amortisationexpenses previously funded throughrevenue appropriations. - - - - -
less depreciation/amortisation expensespreviously funded through revenueappropriations1 237 129 - - -
Total Comprehensive Income (loss) - as per the Statement ofComprehensive Income (237) (129) - - -
1 From 2010-11, the Government introduced net cash appropriation arrangements w here Bill 1 revenue appropriations for the depreciation/amortisation expenses of FMA Act agencies w ere replaced w ith a separate capital budget (the Departmental Capital Budget, or DCB) provided through Bill 1 equity appropriations. For information regarding DCBs, please refer to Table 3.2.5 Departmental Capital Budget Statement.

National Water Commission Budget Statements
Table 3.2.2: Budgeted Departmental Balance Sheet(as at 30 June)
274
Estimated Budget Forw ard Forw ard Forw ardactual estimate estimate estimate estimate
2013-14 2014-15 2015-16 2016-17 2017-18$'000 $'000 $'000 $'000 $'000
ASSETSFinancial assets
Cash and cash equivalents 181 - - - -Trade and other receivables 8,786 - - - -
Total financial assets 8,967 - - - -
Non-financial assetsLand and buildings - - - - -Property, plant and equipment 44 - - - -Intangibles 85 - - - -Other non-financial assets 23 - - - -
Total non-financial assets 152 - - - - Assets held for sale
Total assets 9,119 - - - - LIABILITIESPayables
Suppliers 368 - - - -Other payables 31 - - - -
Total payables 399 - - - -
ProvisionsEmployee provisions 1,320 - - - -Other provisions 149 - - - -
Total provisions 1,469 - - - - Liabilities included in disposal
groups held for saleTotal liabilities 1,868 - - - - Net assets 7,251 - - - -
EQUITY*Parent entity interest
Contributed equity 3,159 - - - -Reserves 595 - - - -Retained surplus
(accumulated def icit) 3,497 - - - -Total parent entity interest 7,251 - - - -Total Equity 7,251 - - - -

National Water Commission Budget Statements
Table 3.2.3: Departmental Statement of Changes in Equity — Summary of Movement (Budget Year 2014-15)
Prepared on Australian Accounting Standards basis.
275
Retained Asset Other Contributed Totalearnings revaluation reserves equity/ equity
reserve capital$'000 $'000 $'000 $'000 $'000
Opening balance as at 1 July 2014Balance carried forw ard from
previous period 3,497 595 - 3,159 7,251Adjusted opening balance 3,497 595 - 3,159 7,251Comprehensive income
Other comprehensive income - - - - -
Surplus (deficit) for the period (129) - - - (129)
Total comprehensive income (129) - - - (129)of w hich:
Attributable to the Australian Government (129) - - - (129)
Transactions with ow nersDistributions to owners Cash transfers to the OPA (3,368) - - - (3,368)
Equity adjustment on cessation - (595) - (3,159) (3,754)Contributions by owners
Equity Injection - Departmental capital Budget (DCB)
- - - - -
Sub-total transactions with owners (3,368) (595) - (3,159) (7,122)Estimated closing balance
as at 30 June 2015 - - - - -Closing balance attributable to the
Australian Government - - - - -

National Water Commission Budget Statements
Table 3.2.4: Budgeted Departmental Statement of Cash Flows(for the period ended 30 June)
Prepared on Australian Accounting Standards basis.
276
Estimated Budget Forw ard Forw ard Forw ardactual estimate estimate estimate estimate
2013-14 2014-15 2015-16 2016-17 2017-18$'000 $'000 $'000 $'000 $'000
OPERATING ACTIVITIESCash received
Appropriations 8,458 6,507 - - -Total cash received 8,458 6,507 - - -Cash used
Employees 5,764 4,859 - - -Suppliers 2,540 1,599 - - -
Total cash used 8,304 6,458 - - -Net cash from (used by)
operating activities 154 49 - - -INVESTING ACTIVITIESCash received - - - - -Total cash received - - - - -Cash used
Purchase of property, plant (36) (230) - - -and equipment
Total cash used (36) (230) - - -Net cash from (used by)
investing activities (36) (230) - - -FINANCING ACTIVITIESCash received
Contributed equity - - - - -Total cash received - - - - -Cash usedTotal cash used - - - - -Net cash from (used by)
financing activities - - - - -Net increase (decrease)
in cash held 118 (181) - - -Cash and cash equivalents at the
beginning of the reporting period 63 181 - - -Cash and cash equivalents at the
end of the reporting period 181 - - - -

National Water Commission Budget Statements
Table 3.2.5: Departmental Capital Budget Statement
Prepared on Australian Accounting Standards basis.
277
Estimated Budget Forw ard Forw ard Forw ardactual estimate estimate estimate estimate
2013-14 2014-15 2015-16 2016-17 2017-18$'000 $'000 $'000 $'000 $'000
NEW CAPITAL APPROPRIATIONSEquity injections - Bill 2 1,238 - - - -
Total new capital appropriations 1,238 - - - -Provided for:
Purchase of non-f inancial assets 1,238 - - - -Total Items 1,238 - - - -
PURCHASE OF NON-FINANCIALASSETSFunded by capital appropriations 1 - 230 - - -Funded internally f rom
departmental resources 2 36 - - - -TOTAL 36 230 - - -RECONCILIATION OF CASH
USED TO ACQUIRE ASSETSTO ASSET MOVEMENT TABLE
Total purchases 36 230 - - -Total cash used to
acquire assets 36 230 - - -
1 Funded from Appropriation Bill (No. 2) 2013-14 equity injection2 Funding source includes current Bill 1 and prior year Act 1 appropriations (excluding amounts from the DCB).

Table 3.2.6: Statement of Asset Movements (2014-15)
Prepared on Australian Accounting Standards basis.
278
Asset Category (as appropriate) Land Buildings Other property, Heritage Investment Computer L&B, IP&E Other Total
plant and and cultural property software and held for saleequipment intangibles
$'000 $'000 $'000 $'000 $'000 $'000 $'000 $'000 $'000As at 1 J uly 2014Gross book value - 442 220 - - 402 - - 1,064Accumulated depreciation/amortisation
and impairment - (442) (176) - - (317) - - (935)Opening net book balance - - 44 - - 85 - - 129CAPITAL ASSET ADDITIONSEstimated expenditure on
new or replacement assetsBy purchase - appropriation equity 1 - 230 - - - - - - 230By purchase - appropriation ordinary
annual services 2 - - - - - - - - -Total additions - 230 - - - - - - 230Other movementsDepreciation/amortisation expense - - (44) - - (85) - - (129)Other movements - (230) - - - - - - (230)Total other movements - (230) (44) - - (85) - - (359)As at 30 J une 2015Gross book value - - - - - - - - -Accumulated depreciation/amortisation
and impairment - - - - - - - - -Closing net book balance - - - - - - - - -1 "Appropriation equity" refers to equity injections provided through Appropriation Bill (No.2) 2013-14.2 "Appropriation ordinary annual services" refers to funding provided through Appropriation Bill (No.1) 2014-15 for depreciation / amortisation expenses, DCBs or other operational expenses.
National W
ater Comm
ission Budget Statements

Sydney Harbour Federation Trust
Agency Resources and Planned Performance
279
National W
ater Comm
ission Budget Statements

SYDNEY HARBOUR FEDERATION TRUST
Section 1: Agency Overview and Resources.........................................................2771.1 Strategic Direction Statement......................................................................2771.2 Agency Resource Statement.......................................................................2791.3 Budget Measures.........................................................................................280
Section 2: Outcomes and Planned Performance..................................................2812.1 Outcomes and Performance Information.....................................................281
Section 3: Explanatory Tables and Budgeted Financial Statements...................2863.1 Explanatory Tables......................................................................................2863.2 Budgeted Financial Statements...................................................................287
281
National W
ater Comm
ission Budget Statements
SYDNEY HARBOUR FEDERATION TRUST
Section 1: Agency Overview and Resources
1.1 STRATEGIC DIRECTION STATEMENT
Sydney Harbour Federation Trust (SHFT) manages some of Sydney’s most renowned and prominent foreshore lands on Sydney Harbour. These sites are the former Defence lands at Middle Head–Georges Head and Chowder Bay in Mosman, the North Head former School of Artillery, Macquarie Lightstation near South Head, Woolwich Dock and Parklands, Cockatoo and Snapper Islands, the former Marine Biological Station at Watsons Bay and the former HMAS Platypus at Neutral Bay.
SHFT is adapting and reusing heritage buildings to bring life and activity to these harbour foreshores and, at the same time, generating revenue for operating and maintaining the sites. Its overarching objective is to transform its sites into precincts and parklands that will enhance the cultural and historical values of the city, while conserving the environmental integrity and unique heritage of the site.
Over its life SHFT’s focus has moved from predominantly community consultation and planning to rehabilitation of lands and buildings, leasing and public programmes. SHFT is progressing well with its plans and from a works perspective is approximately 95 per cent through its programme of remediation and rehabilitation of the lands and buildings (except the former HMAS Platypus). As decontamination, conservation, refurbishment and rehabilitation of sites is completed, the emphasis of SHFT’s activities is moving increasingly towards management and maintenance, increasing visitation and enhancing the visitor and tenant experience. The extension of the life of SHFT to 2033 has influenced the way the organisation views itself and its operations, including the importance of its long-term financial sustainability.
SHFT’s goals for 2014-15 and the forward estimates are to continue to focus on the sustainability of our precincts to ensure we leave them preserved for future generations. SHFT will also focus attention and resources on greater community engagement, enhancing the visitor and tenant experience and encouraging public use, understanding and enjoyment of SHFT sites. SHFT is expanding its network of volunteers and pursuing partnerships with both cultural and corporate organisations to improve SHFT’s capacity to implement its charter.
During 2014-15 the final remediation stage of the decontamination works at HMAS Platypus, Neutral Bay will be completed in early August 2014. The SHFT will prepare a more detailed plan for the rehabilitation and adaptive re-use of the site post decontamination.
In 2014-15 and the forward years, the SHFT will continue to improve public awareness, access and appreciation of the natural and cultural values of the former
283

Artillery School and North Fort at North Head. It will also continue to improve visitor services, amenities and accommodation integrated with event use at Cockatoo Island.
Since 2009-10, SHFT has been solely reliant on its own income generation as it no longer receives a Commonwealth appropriation. Accordingly, SHFT is committed to improving existing revenue streams and identifying new revenue sources to facilitate continued investment in its natural and heritage assets.
284

Sydney Harbour Federation Trust Budget Statements
1.2 AGENCY RESOURCE STATEMENT
Table 1.1 shows the total resources from all sources. The table summarises how resources will be applied by outcome and by administered and departmental classification.
Table 1.1: Sydney Harbour Federation Trust Resource Statement — BudgetEstimates for 2014-15 as at Budget May 2014
285
Estimate Proposed Total Actualof prior + at Budget = estimate available
year amounts appropriation available in
2014-15 2014-15 2014-15 2013-14Source $'000 $'000 $'000 $'000Opening balance/Reserves at bank 39,396 - 39,396 62,161 FUNDS FROM OTHER SOURCES
Interest - 270 270 223 Grants - - - 272 Sale of goods and services - 3,043 3,043 2,973 Other - 12,168 12,168 11,650 Total - 15,481 15,481 15,118
Total net resourcing for agency 39,396 15,481 54,877 77,279

Sydney Harbour Federation Trust Budget Statements
1.3 BUDGET MEASURES
There are no Budget measures relating to the SHFT in 2014-15.
286

Sydney Harbour Federation Trust Budget Statements
Section 2: Outcomes and planned performance
2.1 OUTCOMES AND PERFORMANCE INFORMATION
Government outcomes are the intended results, impacts or consequences of actions by the Government on the Australian community. Commonwealth programmes are the primary vehicle by which Government agencies achieve the intended results of their outcome statements. Agencies are required to identify the programmes which contribute to Government outcomes over the Budget and forward years.
Each outcome is described below together with its related programmes, specifying the performance indicators and targets used to assess and monitor the performance of Sydney Harbour Federation Trust in achieving Government outcomes.
Outcome 1: Enhance appreciation and understanding of the natural and cultural values of Sydney for all visitors, through the remediation, conservation and adaptive re-use of, and access to, Trust lands on Sydney Harbour.
Outcome 1 StrategyOver the forward estimates SHFT’s focus will be on greater community engagement and enhancing the visitor experience. During this period SHFT will encourage public use, understanding and enjoyment of its sites through its interpretation projects, public programmes and enhanced visitor services and facilities. To this end, SHFT has committed to deliver a programme of events through the year and expand opportunities for third party events, meetings and conferencing on Cockatoo Island. Rehabilitation and building works on the unfinished sites will also be a key focus. Works to progress the Middle Head site are expected within 2014–15. SHFT will continue to develop and deliver programme content on Cockatoo Island during 2014–15. Conservation works on the World Heritage listed convict structures and their interpretation will continue. Works will also continue at the North Head Sanctuary site where by the end of 2014–15 improvements to integrate access through the site with the surroundings, conserve and interpret its Indigenous, institutional and military heritage as well as offer scope for research, education and leasing opportunities. The major decontamination stage of the works at HMAS Platypus commenced during 2011–12 will be completed in August 2014.
Outcome Expense Statement
Table 2.1 provides an overview of the total expenses for outcome 1, by programme.
287

Sydney Harbour Federation Trust Budget Statements
Table 2.1: Budgeted Expenses for Outcome 1
288
Outcome 1: Enhance appreciation and understanding of 2013-14 2014-15the natural and cultural values of Sydney for all visitors, Estimated Estimated through the remediation, conservation and adaptive re- actual expensesuse of, and access to, Trust lands on Sydney Harbour expenses
$'000 $'000Programme 1.1: Sydney Harbour Federation TrustRevenues from other independent sources 15,648 16,688
Total for Programme 1.1 15,648 16,688Outcome 1 Totals by resource typeRevenues from other independent sources 15,648 16,688
Total expenses for Outcome 1 15,648 16,6882013-14 2014-15
Average Staffing Level (number) 53 58

Sydney Harbour Federation Trust Budget Statements
Contributions to Outcome 1
Programme 1.1: Sydney Harbour Federation Trust
Programme ObjectiveThe transformation of Sydney Harbour Federation Trust (SHFT) sites into precincts and parklands that will enrich the cultural and historical values of the city, while conserving the environmental integrity and unique heritage of the sites, through:
• Increasing public awareness, appreciation and enjoyment of the SHFT sites;
• Ensuring the public lands are restored, maintained and kept in good repair;
• Leasing and hiring of residential and commercial buildings to bring compatible activities to the sites, and generate revenue; and
• Ensuring the financial sustainability of the ongoing management and operations.
289
Programme Expenses 1.12013-14 2014-15 2015-16 2016-17 2017-18
Estimated Budget Forw ard Forw ard Forw ardactual estimate estimate estimate$'000 $'000 $'000 $'000 $'000
Programme support 13,547 14,443 15,699 16,922 18,075 Expenses not requiring appropriation in
the Budget year 1 2,101 2,245 2,304 2,364 2,424 Total Programme expenses 15,648 16,688 18,003 19,286 20,4991 Expenses not requiring appropriation in the Budget year is made up of Depreciation Expense, Amortisation Expense, Makegood Expense and Audit Fees.

Sydney Harbour Federation Trust Budget Statements
Programme 1.1 Deliverables Undertake works and develop programmes and facilities to ensure SHFT sites are progressively rehabilitated, conserved and made available for public use and enjoyment.
290
2013-14 2014-15 2015-16 2016-17 2017-18Estimated Budget Forw ard Forw ard Forw ard
Deliverables actual estimate estimate estimate
Total visitation to all sites [#] 660,000 720,000 790,000 870,000 957,000Capital spend on rehabilitation and conservation of sites [$m]
12 6 1 1 1
Capital spend on increasing amenity and services on sites [$m]
2 1 1 1 1
Spend on heritage and cultural interpretation [$m]
1 0.6 0.6 0.6 0.6

Sydney Harbour Federation Trust Budget Statements
Programme 1.1 Key Performance Indicators Performance of this programme is measured through:
• Reported quantitative increases in awareness and visitation; and
• Site improvement, rehabilitation and conservation activities undertaken.
291
2013-14 2014-15 2015-16 2016-17 2017-18Key Performance Estimated Budget Forw ard Forw ard Forw ard
Indicators actual estimate estimate estimate
Increased in visitation on Trust sites from previous year [%]
8 10 10 10 10
Number of SHFT site/buildings new ly rehabilitated, conserved and made available for public enjoyment [#]
6 4 5 1 1
Increase in revenue from commercial operations from previous year [%]
9 3 8 13 8
SHFT w ebsite hits [#'000] 2,114 2,438 2,821 3,230 3,456Positive media coverage [# of articles] 625 650 700 700 700

Sydney Harbour Federation Trust Budget Statements
Section 3: Explanatory Tables and Budgeted Financial StatementsSection 3 presents explanatory tables and budgeted financial statements which provide a comprehensive snapshot of agency finances for the 2014-15 Budget year. It explains how budget plans are incorporated into the financial statements and provides further details of the reconciliation between appropriations and programme expenses, movements in administered funds, special accounts and Australian Government Indigenous expenditure.
3.1 EXPLANATORY TABLES
3.1.1 Movement of Administered Funds Between YearsThere are no movements of administered funds for the SHFT.
3.1.2 Special AccountsThere are no special accounts for the SHFT.
3.1.3 Australian Government Indigenous ExpenditureThe 2014–15 Australian Government Indigenous Statement is not applicable because the SHFT has no Indigenous specific expenses
292

Sydney Harbour Federation Trust Budget Statements
3.2 BUDGETED FINANCIAL STATEMENTS
3.2.1 Differences in Agency Resourcing and Financial StatementsThere are no differences between the resource information presented in the Budget Papers and Portfolio Budget Statements.
3.2.2 Analysis of Budgeted Financial StatementsIncome Statement
The SHFT has budgeted for a small operating surplus of $0.038 million in 2014–15.
Operating surpluses are maintained in forward years with an increasing trend in profitability as new income streams are realised. SHFT receives no funding from the Government with its final capital appropriation received in 2009–10. The majority of the SHFT’s income comes from the leasing of its rehabilitated heritage buildings. Property leasing revenue is expected to increase by $0.8 million in 2014–15 with steady growth in the out-years as new leasing opportunities are made available through the remaining capital works program and renewal reserves. Overall expenditure forecasts for the 2014–15 financial year are $16.7 million, an increase over 2013–14 estimated expenditure as a result of further funds allocated to the preservation and conservation of our aging assets. This reflects improvements in agency efficiencies and the allocation of additional resources to the ongoing management and maintenance of Trust sites as capital works are completed.
Balance Sheet
The SHFT major assets are its lands and buildings, which it holds on behalf of the Commonwealth. Early in 2014–15 the major remediation works will be completed at HMAS Platypus. The cost of these works is offset against the provision held on the balance sheet. In 2014–15 the value of SHFT’s non-financial assets is estimated to remain unchanged as a result of the winding down of the Trust’s capital works program.
Equity injections from Government for capital works program ceased in 2009–10.
293

Sydney Harbour Federation Trust Budget Statements
3.2.3 Budgeted Financial Statements TablesTable 3.2.1 Comprehensive Income Statement (Showing Net Cost of Services) for the period ended 30 June
294
Estimated Budget Forw ard Forw ard Forw ardactual estimate estimate estimate estimate
2013-14 2014-15 2015-16 2016-17 2017-18$'000 $'000 $'000 $'000 $'000
EXPENSESEmployee benefits 6,367 6,938 7,408 7,668 7,936Suppliers 7,158 7,480 8,271 9,234 10,119Depreciation and amortisation 2,101 2,245 2,304 2,364 2,424Write-dow n and impairment of assets 22 25 20 20 20Total expenses 15,648 16,688 18,003 19,286 20,499LESS: OWN-SOURCE INCOMEOwn-source revenueSale of goods and rendering of services 205 121 123 126 128Interest 1,857 1,495 1,618 1,747 1,893Rental income 11,360 12,152 13,253 15,454 17,007Other 3,206 2,958 3,074 3,132 3,249Total own-source revenue 16,628 16,726 18,068 20,459 22,277GainsTotal gains - - - - -Total own-source income 16,628 16,726 18,068 20,459 22,277Net cost of (contribution by)
services (980) (38) (65) (1,173) (1,778)Surplus (Deficit) attributable to
the Australian Government 980 38 65 1,173 1,778OTHER COMPREHENSIVE INCOMETotal other comprehensive income - - - - -Total comprehensive income (loss) 980 38 65 1,173 1,778Total comprehensive income (loss)
attributable to the Australian Government 980 38 65 1,173 1,778
Total Comprehensive Income (loss) excluding heritage and culturaldepreciation expenses previouslyfunded through revenue appropriations 980 38 65 1,173 1,778
Total Comprehensive Income (loss) - as per the Statement ofComprehensive Income 980 38 65 1,173 1,778
Prepared on Australian Accounting Standards basis
1 From 2009-10, the Government replaced Bill 1 revenue appropriations for the heritage and cultural depreciation expenses of designated Collection Institutions, w ith a separate capital budget (the Collection Development Acquisition Budget, or CDAB) provided through Bill 2 equity appropriations. For information regarding CDABs, please refer to Table 3.2.5 Departmental Capital Budget Statement.

Sydney Harbour Federation Trust Budget Statements
Table 3.2.2: Budgeted Departmental Balance Sheet(as at 30 June)
295
Estimated Budget Forw ard Forw ard Forw ardactual estimate estimate estimate estimate
2013-14 2014-15 2015-16 2016-17 2017-18$'000 $'000 $'000 $'000 $'000
ASSETSFinancial assets
Cash and cash equivalents 3,286 2,907 889 923 581Trade and other receivables 645 615 595 580 570Other investments 35,465 35,865 38,265 39,665 42,065
Total financial assets 39,396 39,387 39,749 41,168 43,216 Non-financial assets
Land and buildings 251,513 252,016 251,852 251,655 251,423Property, plant and equipment 14,385 13,761 13,725 13,653 13,557Intangibles 851 728 624 529 432Inventories 88 58 28 58 28Heritage & Cultural assets 32,109 32,109 32,109 32,109 32,109Other non-financial assets 15 15 15 15 15
Total non-financial assets 298,961 298,687 298,353 298,019 297,564 Assets held for sale
Total assets 338,357 338,074 338,102 339,187 340,780 LIABILITIESPayables
Suppliers 425 225 225 225 225Other payables 3,600 3,416 3,232 3,048 2,863
Total payables 4,025 3,641 3,457 3,273 3,088 Provisions
Employee provisions 1,480 1,543 1,690 1,786 1,786Total provisions 1,480 1,543 1,690 1,786 1,786 Total liabilities 5,505 5,184 5,147 5,059 4,874 Net assets 332,852 332,890 332,955 334,128 335,906

Sydney Harbour Federation Trust Budget Statements
Table 3.2.2: Budgeted Departmental Balance Sheet(as at 30 June) (continued)
296
Estimated Budget Forw ard Forw ard Forw ardactual estimate estimate estimate estimate
2013-14 2014-15 2015-16 2016-17 2017-18$'000 $'000 $'000 $'000 $'000
EQUITY*Parent entity interest
Contributed equity 257,735 257,735 257,735 257,735 257,735Reserves 60,150 60,150 60,150 60,150 60,150Other reserves 4,200 4,200 4,200 4,200 4,200Retained surplus
(accumulated deficit) 10,767 10,805 10,870 12,043 13,821Total parent entity interest 332,852 332,890 332,955 334,128 335,906Total Equity 332,852 332,890 332,955 334,128 335,906* 'Equity' is the residual interest in assets after deduction of liabilities.Prepared on Australian Accounting Standards basis.

Sydney Harbour Federation Trust Budget Statements
Table 3.2.3: Departmental Statement of Changes in Equity — Summary of Movement (Budget Year 2014-15)
Prepared on Australian Accounting Standards basis.
297
Retained Asset Other Contributed Totalearnings revaluation reserves equity/ equity
reserve capital$'000 $'000 $'000 $'000 $'000
Opening balance as at 1 July 2014Balance carried forw ard from
previous period 10,767 60,150 4,200 257,735 332,852Adjustment for changes in
accounting policies - - - - -Adjusted opening balance 10,767 60,150 4,200 257,735 332,852Comprehensive income
Other comprehensive income - - - - -
Surplus (deficit) for the period 38 - - - 38
Total comprehensive income 38 - - - 38of w hich:
Attributable to the Australian Government -Attributable to non-controlling interest* -
Estimated closing balanceas at 30 June 2015 10,805 60,150 4,200 257,735 332,890Less: non-controlling interests * -
Closing balance attributable to the Australian Government 10,805 60,150 4,200 257,735 332,890

Sydney Harbour Federation Trust Budget Statements
Table 3.2.4: Budgeted Departmental Statement of Cash Flows(for the period ended 30 June)
Prepared on Australian Accounting Standards basis.
298
Estimated Budget Forw ard Forw ard Forw ardactual estimate estimate estimate estimate
2013-14 2014-15 2015-16 2016-17 2017-18$'000 $'000 $'000 $'000 $'000
OPERATING ACTIVITIESCash received
Sale of goods and rendering ofservices 2,973 3,043 3,154 3,214 3,331Interest 223 270 260 260 260Net GST received 217 40 20 15 10Other 11,922 12,168 13,296 15,498 17,053
Total cash received 15,335 15,521 16,730 18,987 20,654Cash used
Employees 6,149 6,875 7,261 7,572 7,936Suppliers 9,438 7,890 8,476 9,438 10,323
Total cash used 15,587 14,765 15,737 17,010 18,259Net cash from (used by)
operating activities (252) 756 993 1,977 2,395INVESTING ACTIVITIESCash received
Investments 68,102 41,835 42,958 41,087 41,233Total cash received 68,102 41,835 42,958 41,087 41,233Cash used
Purchase of property, plant and equipment 23,804 1,970 1,970 2,030 1,970
Investments 48,000 41,000 44,000 41,000 42,000Total cash used 71,804 42,970 45,970 43,030 43,970Net cash from (used by)
investing activities (3,702) (1,135) (3,012) (1,943) (2,737)Net increase (decrease)
in cash held (3,954) (379) (2,019) 34 (342)Cash and cash equivalents at the
beginning of the reporting period 7,240 3,286 2,908 889 923Cash and cash equivalents at the
end of the reporting period 3,286 2,907 889 923 581

Sydney Harbour Federation Trust Budget Statements
Table 3.2.5: Departmental Capital Budget Statement
Prepared on Australian Accounting Standards basis.
299
Estimated Budget Forw ard Forw ard Forw ardactual estimate estimate estimate estimate
2013-14 2014-15 2015-16 2016-17 2017-18$'000 $'000 $'000 $'000 $'000
NEW CAPITAL APPROPRIATIONSTotal new capital appropriations - - - - -
Provided for:Total Items - - - - -
PURCHASE OF NON-FINANCIALASSETS
departmental resources 23,804 1,970 1,970 2,030 1,970TOTAL 23,804 1,970 1,970 2,030 1,970
RECONCILIATION OF CASHUSED TO ACQUIRE ASSETSTO ASSET MOVEMENT TABLE
Total purchases 23,804 1,970 1,970 2,030 1,970Total cash used to
acquire assets 23,804 1,970 1,970 2,030 1,970

Table 3.2.6: Statement of Asset Movements (2014-15)
Asset Category (as appropriate) Land Buildings Other property, Heritage Investment Computer L&B, IP&E Other Total
plant and and cultural property software and held for saleequipment intangibles
$'000 $'000 $'000 $'000 $'000 $'000 $'000 $'000 $'000As at 1 J uly 2014Gross book value 179,676 76,764 17,876 32,109 1,854 308,279Accumulated depreciation/amortisation
and impairment (4,926) (3,490) (1,003) (9,419)Opening net book balance 179,676 71,838 14,386 32,109 - 851 - - 298,860CAPITAL ASSET ADDITIONSEstimated expenditure on
new or replacement assetsBy purchase - other 1,781 217 1 1,999Total additions - 1,781 217 - - 1 - - 1,999Other movementsDepreciation/amortisation expense (1,279) (842) (124) (2,245)OtherTotal other movements - (1,279) (842) - - (124) - - (2,245)As at 30 J une 2015Gross book value 179,676 78,545 18,093 32,109 - 1,855 - - 310,278Accumulated depreciation/amortisation
and impairment - (6,205) (4,332) - - (1,127) - - (11,664)Closing net book balance 179,676 72,340 13,761 32,109 - 728 - - 298,614
Prepared on Australian Accounting Standards basis.
Sydney Harbour Federation Trust Budget Statem
ents
300