investigation of nfats regulatory potential and role in
TRANSCRIPT

Investigation of NFATs regulatory potential and role in skeletal muscle
during voluntary exercise
Markus Heldrup
Thesis submitted for the degree of Master of Science in Molecular Bioscience
60 credits
Department of Bioscience Faculty of mathematics and Natural Sciences
UNIVERSITETET I OSLO
June 2018

II
© Markus Heldrup
2018
Investigation of NFATs regulatory potential and role in skeletal muscle during voluntary exercise
Markus Heldrup
http://www.duo.uio.no/

III
Acknowledgements
This master thesis was carried out at the section of Cell Biology and Physiology at the University
of Oslo in the period January 2017 to June 2018.
I would like to give a big thank you to my supervisor Mads Bengtsen for the enthusiasm,
everything he has thought me and for always being available to help me when needed. I
appreciate the time and supervising you have put into my master thesis. It is very much
appreciated! I would further like to thank my co-supervisor Professor Kristian Gundersen for
accepting me into his group and let me use his laboratory and other facilities.
Secondly I would like to thank Ivan Winje Myhre for helping me out during the time lapse of the
thesis and teach me how to dissect and work with mice. I would also like to thank the rest of the
Gundersen-group for feedback along the way and for the social atmosphere.
Finally I would like to thank my family for all the support throughout the last 2 years. I’m
grateful that you let me live with you for a year, and for the financial support along the way. It
would have been very challenging to do all this without your contributions. I would also like to
thank all my friends for supporting and putting up with me in this stressful period of time, and to
Sebastian Basing for reading through parts of my thesis.
Oslo, June 2018
Markus Heldrup
IV
Abstract
Nuclear factor of activated T cells (NFAT) is a family of transcription factors, named NFATc1-4,
that is activated in response to calcium signals. The NFAT family members are sequentially
similar but are found to play different roles in the skeletal muscle, where they regulate phenotype
and size of the muscle fibers.
In the present study, the aim was to explore and characterize the members of the NFAT family in
skeletal muscle. The transcriptional potential of the family members was assessed in vitro by
transfecting HEK293 cells with a stably integrated 5x Gal-recognition elements followed by the
gene coding for Firefly-Luciferase. In addition, the influence of the interaction partner and
coregulator p300 on NFAT was assessed in the same system. Furthermore, the NFAT activity
and the expression of NFAT and selected NFAT target genes in skeletal muscle were explored in
response to voluntary endurance training in vivo with NFAT luciferase reporter mice and NMRI,
respectively.
The results show that all NFAT family members have a transcriptional activating potential;
however, NFATc1 is a significantly less potent activator and is also the only NFAT that display a
repressive potential in vitro. Subsequently, cotransfection of p300 together with NFAT increases
the transactivational potential of all NFATs in the HEK293 system. The in vivo analysis found
that the NFAT activity is increased in soleus and plantaris in response to voluntary exercise,
while expression of the NFATs are decreased in plantaris in response to exercise, pointing
towards an interesting regulatory mechanism to control the NFAT level in the muscle cell.

V
Abbreviations
Abbreviation Description
ATP Adenosine triphosphate
bp Base pairs
Ca Calcium
CaM Calmodulin
CBP CREB-binding protein
cDNA Complementary DNA
ChIP Chromatin immunoprecipitation
CMV Cytomegalovirus
Cq Cycle number
DBD DNA-binding domain
DNA Deoxyribonucleic acid
DTT DL-Dithiothreitol
EDL Extensor Digitorum Longus
F-luc Firefly-Luciferase
GAPDH Glyceraldehyde 3-phosphate dehydrogenase
GBD Gal-binding domain
GRE Gal-recognition elements
HEK-293 Human embryonic kidney cells
JNK c-Jun N-terminal kinases
kb Kilo bases
kD Kilo Dalton
LB Lysogeny broth
MEF2 Myocyte enhancer factor 2
Min Minute
mRNA Messenger RNA
MyHC Myosin heavy chain
n Sum of replicates
NFAT Nuclear factor of activated T cells
NLS Nuclear localization sequence
NMRI Naval Medical Research Institute
nt Nucleotides
ORI Origin of replication
PAGE Polyacrylamide gel electrophoresis
PCR Polymerase chain reaction
PIC Pre-initiation complex
PVDF Polyvinylidene difluoride
qPCR Quantitative PCR
RCAN Regulator of Calcineurin
RD Regulatory domain
RHD Rel homology domain

VI
RLU Relative luciferase unit
RNA Ribonucleic acid
SDS Sodium dodecyl sulfate
SEM Standard error of the mean
SR Sarcoplasmic reticulum
SRR Serine-rich region
TAD Transactivation domain
TF Transcription factor
UV Ultra violet

VII
Table of contents
Acknowledgements ...................................................................................................................................... III
Abstract ........................................................................................................................................................ IV
Abbreviations ................................................................................................................................................ V
Table of contents ......................................................................................................................................... VII
1 Introduction ................................................................................................................................................ 1
1.1 Transcription factors ........................................................................................................................... 1
1.2 Skeletal muscle .................................................................................................................................... 1
1.3 Calcineurin ........................................................................................................................................... 3
1.4 NFAT .................................................................................................................................................... 4
1.4.1 The structure of NFAT .................................................................................................................. 4
1.4.2 Activation of the NFAT pathway ................................................................................................... 6
1.4.3 NFAT expression in skeletal muscle ............................................................................................. 8
1.4.4 NFATs role in skeletal muscle ....................................................................................................... 8
1.4.5 Target genes of NFAT ................................................................................................................... 9
1.4.6 NFAT interaction partners ............................................................................................................ 9
1.4.6.1 p300 and NFAT ................................................................................................................... 10
2 Aims of the study ...................................................................................................................................... 11
3 Methods: .................................................................................................................................................. 12
3.1 Preparation of recombinant plasmid ................................................................................................ 12
3.1.1 GBD-NFAT expression vector ..................................................................................................... 12
3.1.2 PCR of EGFP-NFATc1-4 plasmids ................................................................................................ 13
3.1.3 Primer design .............................................................................................................................. 14
3.1.4 Purification of PCR product ........................................................................................................ 16
3.1.5 Sequencing of NFATc1-4 ............................................................................................................. 16
3.1.6 Restriction enzyme digestion ..................................................................................................... 16
3.1.7 DNA ligation of the insert into vector DNA ................................................................................ 17
3.1.8 Gel electrophoresis..................................................................................................................... 18
3.1.8.1 Purification of NFAT constructs from a gel ........................................................................ 19
3.2 Working with bacteria ....................................................................................................................... 19
VIII
3.2.1 Culturing of bacteria ................................................................................................................... 20
3.2.2 Transformation of E. coli DH5α .................................................................................................. 20
3.2.3 Plasmid isolation and purification .............................................................................................. 20
3.3 Working with mammalian cells ......................................................................................................... 21
3.3.1 Subcultivation of cells ................................................................................................................. 23
3.3.2 Transfection ................................................................................................................................ 24
3.3.2.1 Seeding out cells: ................................................................................................................ 24
3.3.2.2 Preparing the constructs: ................................................................................................... 24
3.3.2.3 Luciferase assay: ................................................................................................................. 25
3.3.2.4 Western blot:...................................................................................................................... 25
3.3.3 Western blot ............................................................................................................................... 26
3.4 Working with animals ........................................................................................................................ 27
3.4.1 Ethical considerations................................................................................................................. 27
3.4.2 Animals ....................................................................................................................................... 27
3.4.3 Voluntary endurance exercise .................................................................................................... 29
3.4.4 Anaesthesia ................................................................................................................................ 30
3.4.5 Surgical procedures .................................................................................................................... 30
3.4.6 Luciferase assay .......................................................................................................................... 30
3.5 Purification of RNA and cDNA-synthesis ........................................................................................... 31
3.5.1 Total RNA isolation ..................................................................................................................... 31
3.5.2 cDNA synthesis ........................................................................................................................... 31
3.5.3 Nanodrop .................................................................................................................................... 32
3.6 qPCR .................................................................................................................................................. 32
3.6.1 qPCR of cDNA ............................................................................................................................. 32
3.6.1.1 Primer evaluation ............................................................................................................... 34
3.6.2 Quantification of gene expression ............................................................................................. 35
3.7 T-test .................................................................................................................................................. 36
4 Results ...................................................................................................................................................... 37
4.1 Subcloning of pCIneo-GBD2-NFATc1-4 plasmids .............................................................................. 37
4.2 The transcriptional potential of the different NFATs ........................................................................ 38
4.2.1 p300 increase the transcriptional potential of NFATs ................................................................ 40
4.2.2 Validation of transfected HEK293 cells ...................................................................................... 42

IX
4.3 NFAT activity in response to in vivo endurance training ................................................................... 43
4.4 The influence of endurance training on NFAT expression ................................................................ 44
5 Discussion ................................................................................................................................................. 48
5.1 The activation potential of NFATs ..................................................................................................... 48
5.1.1 The influence of p300 on NFAT .................................................................................................. 49
5.1.2 Transfection of HEK293 .............................................................................................................. 50
5.2 NFATs response to endurance training ............................................................................................. 50
5.3 NFAT expression in response to endurance training ........................................................................ 51
5.4 Endurance training setup .................................................................................................................. 52
5.5 Future study ...................................................................................................................................... 53
5.6 Conclusions ........................................................................................................................................ 54
6 References ................................................................................................................................................ 55
7 Appendix ................................................................................................................................................... 61
7.1 Materials:........................................................................................................................................... 61
7.1.1 Solutions: .................................................................................................................................... 61
7.1.2 Kits: ............................................................................................................................................. 62
7.1.3 Restriction enzymes: .................................................................................................................. 62
7.1.4 Antibodies: ................................................................................................................................. 62
7.1.5 Instruments: ............................................................................................................................... 62
7.1.6 Software: .................................................................................................................................... 63
7.1.7 Materials: .................................................................................................................................... 63
7.2 Western blot: ..................................................................................................................................... 64
7.3 Primers: ............................................................................................................................................. 64
7.3.1 Primer pairs used for qPCR ......................................................................................................... 65
7.3.2 Primer pairs used for subcloning ................................................................................................ 66

X

1 Introduction
1
1 Introduction
1.1 Transcription factors Eukaryotic cells of a multicellular organism have the same genomic sequence. Despite this, cells
can diversify into distinct phenotypes to perform specialized functions within an organism. The
phenotype a cell adopts are governed by what genes are expressed, and the first step of gene
expression is transcription. Transcription is a complex and tightly regulated process and involves
the basal transcription machinery, sequence-specific transcription factors (TF) and co-regulators.
Transcription is initiated by formation of the pre-initiation complex (PIC) on the promoter of the
gene and consists of different classes of general TFs (TFIIB, TFIID, TFIIA, TFIIE, TFIIF, and
TFIIH) which recruits the polymerase (Thomas and Chiang, 2006). Sequence-specific TFs can
regulate the expression of genes by binding to the promoter of a gene or distal regulatory
elements known as enhancers.
A TF is composed of a deoxyribonucleic acid (DNA)-binding domain (DBD), a regulatory
domain (RD), and a transactivating domain (TAD) (Latchman, 1997). The DBD is often well
conserved between members of the same transcriptional family, while a higher divergence is
found in the additional parts of the factors (Harrison, 1991). TFs can exert their regulatory role
alone or by recruitment of coregulators. Coregulators have the ability to either activate or repress
the transcriptional activity (coactivators and corepressors, respectively) by modifying the
chromatin structure through bridging the contact between the TF and the general transcription
machinery (Wang, Marshall and Ikura, 2013). TFs are essential both during development and in
the post-mitotic tissue in order to respond to stimuli and change in the environment.
1.2 Skeletal muscle Skeletal muscles are a striated muscle tissue consisting of long multinuclear fibers and are
primarily used for locomotion. Myofibrillar contraction is controlled by the somatic nervous
system and is a response to released Ca2+
from sarcoplasmic reticulum (SR) in muscle cells. The
temporal differences in the calcium transients are important for contractile strength and speed.
2
Skeletal muscles are composed of fast and slow fiber types, with the composition reflecting the
functional properties of the muscle. Fiber type is determined by the expression of the specific
skeletal myosin heavy chain (MYH) isoforms (table 1). In rodents, slow type 1 fibers express
MYH7 and the fast-twitch fibers are subdivided into 3 different isoforms, the fast oxidative type
IIA (MYH2), the fast glycolytic type IIB (MYH4), and an intermediate known as IIX (MYH1)
(Schiaffino and Reggiani, 1994, 2011; Spangenburg and Booth, 2003). The soleus muscle is a
postural muscle, thus has a high composition of the slow oxidative type I fibers which allow for a
steady supply of ATP for prolonged activity. The two muscles extensor digitorum longus (EDL)
and plantaris have a significantly higher composition of the fast glycolytic type II fiber and are
fatigued more easily.
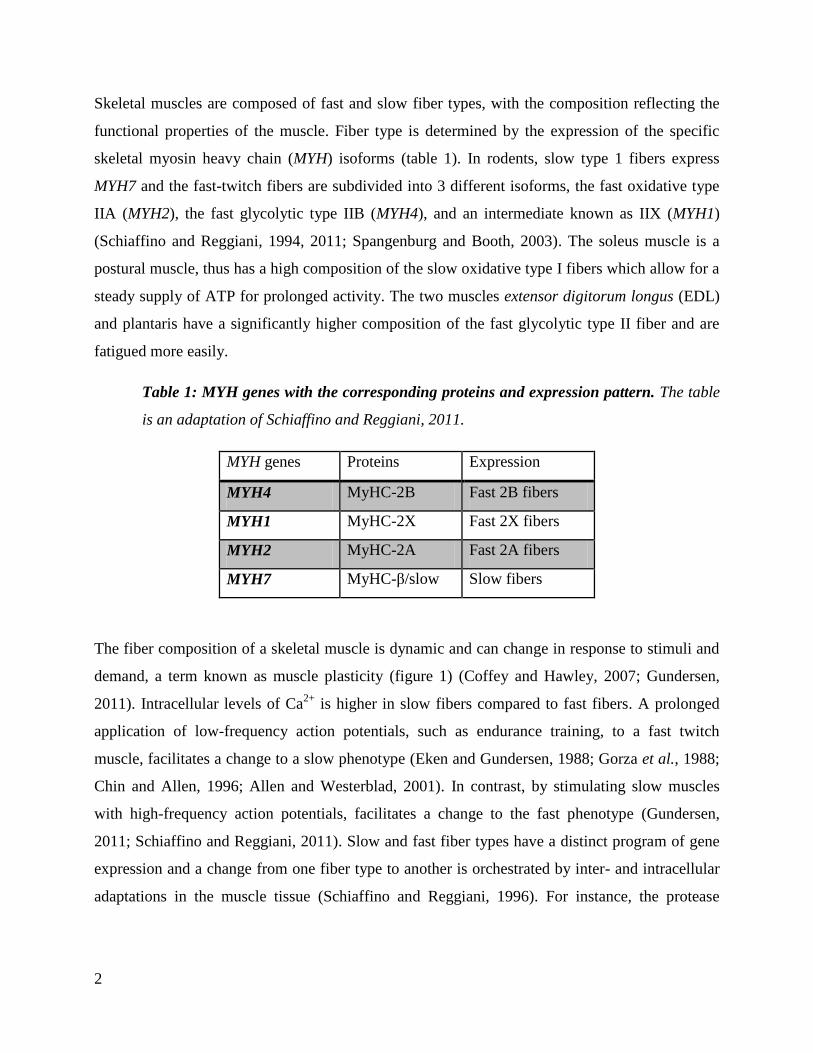
Table 1: MYH genes with the corresponding proteins and expression pattern. The table
is an adaptation of Schiaffino and Reggiani, 2011.
MYH genes Proteins Expression
MYH4 MyHC-2B Fast 2B fibers
MYH1 MyHC-2X Fast 2X fibers
MYH2 MyHC-2A Fast 2A fibers
MYH7 MyHC-β/slow Slow fibers
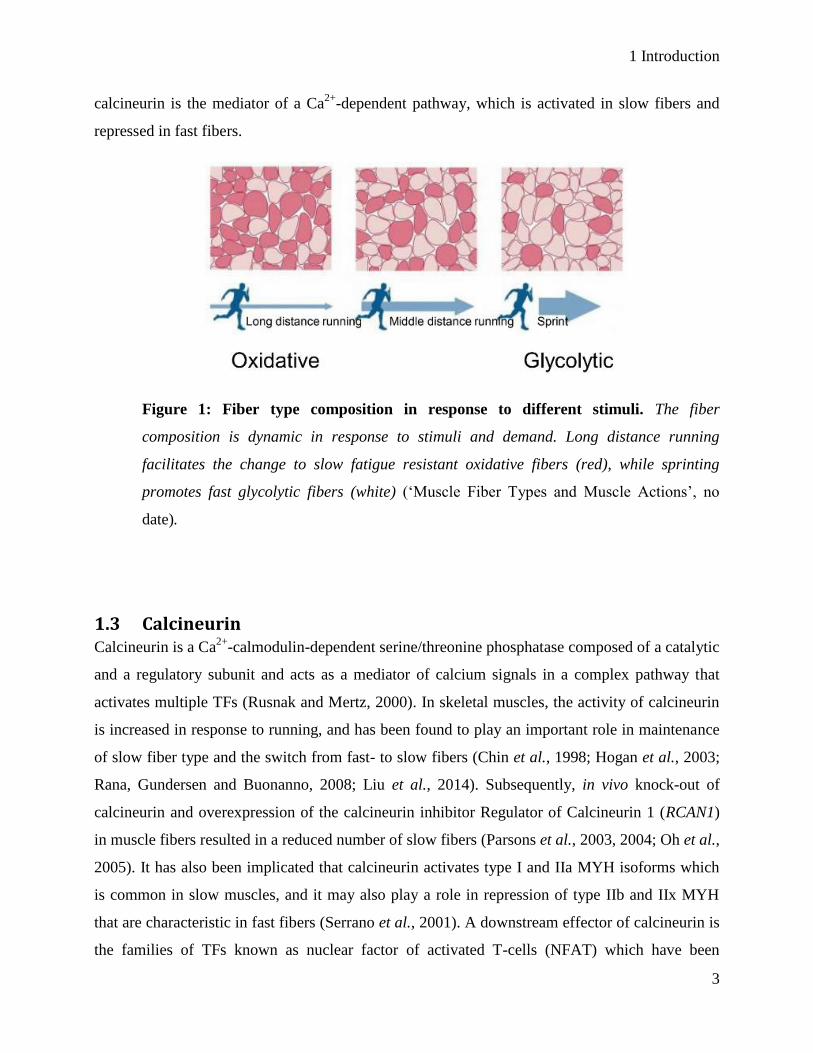
The fiber composition of a skeletal muscle is dynamic and can change in response to stimuli and
demand, a term known as muscle plasticity (figure 1) (Coffey and Hawley, 2007; Gundersen,
2011). Intracellular levels of Ca2+
is higher in slow fibers compared to fast fibers. A prolonged
application of low-frequency action potentials, such as endurance training, to a fast twitch
muscle, facilitates a change to a slow phenotype (Eken and Gundersen, 1988; Gorza et al., 1988;
Chin and Allen, 1996; Allen and Westerblad, 2001). In contrast, by stimulating slow muscles
with high-frequency action potentials, facilitates a change to the fast phenotype (Gundersen,
2011; Schiaffino and Reggiani, 2011). Slow and fast fiber types have a distinct program of gene
expression and a change from one fiber type to another is orchestrated by inter- and intracellular
adaptations in the muscle tissue (Schiaffino and Reggiani, 1996). For instance, the protease
1 Introduction
3
calcineurin is the mediator of a Ca2+
-dependent pathway, which is activated in slow fibers and
repressed in fast fibers.
Figure 1: Fiber type composition in response to different stimuli. The fiber
composition is dynamic in response to stimuli and demand. Long distance running
facilitates the change to slow fatigue resistant oxidative fibers (red), while sprinting
promotes fast glycolytic fibers (white) (‘Muscle Fiber Types and Muscle Actions’, no
date).
1.3 Calcineurin Calcineurin is a Ca
2+-calmodulin-dependent serine/threonine phosphatase composed of a catalytic
and a regulatory subunit and acts as a mediator of calcium signals in a complex pathway that
activates multiple TFs (Rusnak and Mertz, 2000). In skeletal muscles, the activity of calcineurin
is increased in response to running, and has been found to play an important role in maintenance
of slow fiber type and the switch from fast- to slow fibers (Chin et al., 1998; Hogan et al., 2003;
Rana, Gundersen and Buonanno, 2008; Liu et al., 2014). Subsequently, in vivo knock-out of
calcineurin and overexpression of the calcineurin inhibitor Regulator of Calcineurin 1 (RCAN1)
in muscle fibers resulted in a reduced number of slow fibers (Parsons et al., 2003, 2004; Oh et al.,
2005). It has also been implicated that calcineurin activates type I and IIa MYH isoforms which
is common in slow muscles, and it may also play a role in repression of type IIb and IIx MYH
that are characteristic in fast fibers (Serrano et al., 2001). A downstream effector of calcineurin is
the families of TFs known as nuclear factor of activated T-cells (NFAT) which have been
4
proposed to be one of the critical regulators of genes in defining the phenotype of slow muscles
(Chin et al., 1998).
1.4 NFAT NFAT is a family of TFs evolutionary related to the Rel/NFĸB and was first discovered as an
activator of T-cells (Shaw et al., 1988; Chytil and Verdine, 1996). NFAT has later been found in
several other cell types with a diversity of functions like control of development and
differentiation (Rao, Luo and Hogan, 1997; Graef et al., 2001; Crabtree and Olson, 2002; Hogan
et al., 2003; Macian, 2005). In skeletal muscles, NFAT has been found to play a role in the
maintenance of the slow muscle phenotype and in switching from fast- to slow fibers (Chin et al.,
1998).
1.4.1 The structure of NFAT
The NFAT family consists of five different members, NFATc1-4 and NFAT5 (table 2) and are
activated in response to Ca2+
-signaling by calcineurin with exception of NFAT5 which is
activated by osmotic stress (Rao, Luo and Hogan, 1997; López-Rodríguez et al., 1999, 2003;
Hogan et al., 2003; Mognol et al., 2016). The main focus for this thesis will only be NFATc1-4,
as NFATc5 is distinctively different from the other family members. Non-specified NFAT is
referred to as NFATc1-4 throughout the thesis. NFAT is related to the Rel/NFĸB family of TFs
and binds to the DNA motif GGAAA through their highly conserved DNA-binding domain
(DBD) with ∼70% sequence identity (figure 2) (Rao, Luo and Hogan, 1997; Graef et al., 2001;
Mognol et al., 2016). The NFATs share a regulatory domain (RD) with ∼30% sequence identity
between the family members.

1 Introduction
5
Figure 2: Important domains of NFAT. The N-terminal end consists of a TAD and a
RD that are able to interact with other proteins. The RD has a PxIxIT-motif which is the
docking site for calcineurin and the nuclear localization sequence (NLS) which is
essential for activation and localization of NFAT. Slightly upstream of NLS are two
serine-rich regions (SRR-1 and SRR-2). These regions are involved in masking of NLS to
prevent translocalization and are therefore important targets of the NFAT activator,
calcineurin. NFAT bind to the GGAAA DNA motif through its Rel homology domain
(RHD)/DBD. The figure is an adaptation of Macián, López-Rodríguez and Rao, 2001.
Table 2: The NFAT family member’s nomenclature and gene structure. The table is an
adaptation of Macián, López-Rodríguez and Rao, 2001.

6
Despite the sequential similarities, the NFAT members are found to have different regulatory
roles. For instance, NFATc1 in T-cells has been linked to induction of cell cycle arrest and
apoptosis, in contrast to NFATc2 that act as a positive regulator of cell proliferation and repressor
of cell death (Robbs et al., 2008). While in skeletal muscle, NFATc1 is found to repress fast
fiber-specific genes and NFATc2 is found to play a role in the fusion of myoblasts in the
formation of the multi-nuclear fibers during development (Rana, Gundersen and Buonanno,
2008). However, the different roles of NFAT family members in myocytes have yet to be
completely elucidated.
1.4.2 Activation of the NFAT pathway
NFAT is found in a phosphorylated inactive state in the cytoplasm and becomes activated in
response to dephosphorylation by calcineurin. This promotes translocation of NFAT into the
nucleus, effectively enabling transcription of the target genes (figure 3) (Rao, Luo and Hogan,
1997; Crabtree and Olson, 2002). The translocation of NFAT into the nucleus is a response to
Ca2+
spikes generated by the myofiber depolarization. Intercellular Ca2+
enter the cell leading to
opening of the calcium channels in the SR to promote elevation of calcium levels in the cell and
binding of calcium to the intermediate calcium-binding messenger, Calmodulin (CaM) (figure 3,
[1], [2] and [3]) (Cheung, 1980; Fabiato, 1983). Calcineurin is partially inactivated in response to
phosphorylation of a serine site; however, the inactivation is prevented by dimerization with CaM
(figure 3, [4]) (Hashimoto, King and Soderling, 1988; Kincaid, Nightingale and Martin, 1988).
The dimerization enables calcineurin to dephosphorylate NFAT, promoting activation and
translocation of NFAT into the nucleus (figure 3, [5] and [6]). Nuclear NFAT is able to activate
the expression of target genes alone or in cooperation with other TFs, see section 1.4.6 (figure 3,
[7]). NFAT is constitutively inactivated by kinases like CK1 and GSK3, which phosphorylate
nuclear NFAT to mask the nuclear localization signal (NLS), promoting inactivation and nuclear
export (figure 3, [8]) (Scott, Ruff and Leach, 1997; Masuda et al., 1998). It has been suggested
that a constant level of active calcineurin is required for NFAT to stay dephosphorylated due to
the constantly active NFAT-kinases (Timmerman et al., 1996; Hogan et al., 2003). Furthermore,
NFAT-kinases like JNK1 and p38, are able to target specific NFAT isoforms for selective export;

1 Introduction
7
however, the exact mechanism and use of this needs to investigated further (Chow et al., 1997;
Gomez del Arco et al., 2000; Yang et al., 2002).
Figure 3: The pathway of NFAT activation and translocation into the nucleus.
Calcium enters the cell through calcium channels in the cellular membrane [1]. This
influx leads to opening of calcium channels in SR, to generate a calcium spike [2].
Calcium binds to ApoCaM [3] and activated CaM can bind to the regulatory domain of
calcineurin [4]. This activates the phosphatase activity of calcineurin leading to

8
dephosphorylation and activation of NFAT [5]. Activated NFAT is translocated into the
nucleus [6], and a complex of NFAT and other TFs are formed to promote expression of
target genes [7]. Kinases are continually phosphorylating nuclear NFAT leading to
inactivation and nuclear export [8]. The figure is adapted from Meissner et al., 2011 and
Bugge, 2017.
1.4.3 NFAT expression in skeletal muscle All NFATs are expressed in skeletal muscles but to a different extent (Hoey et al., 1995; Parsons
et al., 2003; Vihma, Pruunsild and Timmusk, 2008; Calabria et al., 2009). The overall expression
level of the NFATs is higher in slow muscles compared to fast, with NFATc3 being the generally
highest expressed family member (Swoap et al., 2000; Horsley et al., 2001; Kegley et al., 2001;
McCullagh et al., 2004; Rana, Gundersen and Buonanno, 2008; Calabria et al., 2009). However,
there are no studies of a correlation between NFAT expression and NFAT activity.
1.4.4 NFATs role in skeletal muscle NFATs are an activity sensor for the nerves, where they play a role in fiber type specification
(Schiaffino and Reggiani, 2011). NFAT seems to be necessary for slow fibers, as calcium
inhibition with Cyclosporin A and FK506, as well as inhibition of calcineurin/NFAT interaction
by VIVIT, promotes a change from slow- to fast phenotype (Chin et al., 1998; Serrano et al.,
2001; Chakkalakal et al., 2003; McCullagh et al., 2004). Furthermore, muscle-specific
overexpression of calcineurin in transgenic mice exhibits an increase of slow fibers (Naya et al.,
2000). In fast muscles, NFATc1 is found in the cytoplasm, while in slow muscles the most
substantial fraction is localized in the nucleus. However, upon stimulation of fast muscles with a
low-frequency pattern as in slow muscles, the TF migrates to the nucleus (Liu et al., 2001).
NFATc1 seems to be necessary for expression of slow myosin fiber types as seen both by
reporter assays and in a skeletal muscle-specific knock out (Ehlers, Celona and Black, 2014). In
line with this, NFATc1 is found to have a repressive effect on the expression of the fast Troponin
I isoform (TnIf or TNNI2) ( found in skeletal muscle (Rana, Gundersen and Buonanno, 2008).

1 Introduction
9
Knock-out of NFATc2-4 shows minor or no alteration of phenotype (Horsley et al., 2001; Kegley
et al., 2001). Not much is known about the role of NFATc2 in adult muscles, however, the TF is
found to play a role in the fusion of myoblasts in the formation of the multi-nuclear fibers during
development (Calabria et al., 2009). NFATc3 is found to migrate to the nucleus both by low and
high-frequency pattern (e.g., slow and fast fiber type) and be able to induce expression of both
fast and slow myosin genes (Calabria et al., 2009). In muscle, NFATc4 is found only in the
nucleus and seems to play a role in determining the size of the fiber (Perroud et al., 2017).
1.4.5 Target genes of NFAT
As mentioned in the previous section, the NFAT family members are essential during the
formation and in adult muscles, where they play a role in fiber type specificity. Specific for the
Myosin genes, a study by Calabria et al. used in vivo cotransfection of NFAT short interfering
ribonucleic acid (siRNA) with an MYH reporter suggesting that NFAT regulates the different
MYH isoforms in a complex manner (Calabria et al., 2009). NFATc1-4 was found to affect the
expression of the slow MYH7 while the type-2A (MYH2) and type-2X (MYH1) isoforms were
only affected by silencing of either one of NFATc2-4. Expression of the fast type-2B (MYH4)
isoform was found to be affected only by NFATc4.
TNNI2 is a gene expressed in fast fibers, and has been found to be regulated by NFATc1 (Rana,
Gundersen and Buonanno, 2008). It has been found an NFAT binding site in an intronic
regulatory element of TNNI2 that NFATc1 can bind to and repress expression. Furthermore,
NFAT has been found to upregulate expression of RCAN1, an inhibitor of calcineurin/NFAT
signaling, in a negative feedback loop (Lee et al., 2009). Lastly, NFAT has been found to
upregulate myoglobin by regulating the MB gene in cooperation with Myocyte enhancer factor 2
(MEF2) (Wu et al., 2000).
1.4.6 NFAT interaction partners
The NFAT family members cooperate with other transcriptional regulators to fine-tune the
expression of their target genes. The interactome of NFAT in skeletal muscles is mostly
unexplored; however, a few partners are known. NFATc1 is known to be able to interact with

10
GATA2 to induce muscle hypertrophy (Musarò et al., 1999). MEF2 in cooperation with NFAT
has been found to regulate MB and TNNI1 by transactivation of the enhancer (Nakayama et al.,
1996; Wu et al., 2000). Another important interaction partner of NFAT is the co-regulator p300
which is found to have a positive influence on the activity level of the NFAT family members.
1.4.6.1 p300 and NFAT
p300 and its close homolog CBP are a histone acetyltransferase known to play an essential role in
cell transcriptional regulation by remodeling chromatin and bridge the interaction with the
polymerase (Wang, Marshall and Ikura, 2013). NFATc1 and NFATc2 interact with p300 through
the TAD (Garcia-Rodriguez and Rao, 1998; Avots et al., 1999). Increased intracellular calcium
level induces the expression of the gene Nur77 in T-cells through recruitment of p300, MEF2 and
NFAT to the promoter of the gene, and NFATc2 has been found to recruit p300 to promoters in
β-cells (Blaeser et al., 2000; Lawrence et al., 2015). In order to fine-tune the expression of target
genes, NFATc1 is found to be able to block the recruitment of p300 by MyoD to repress
expression of fast fiber genes (Ehlers, Celona and Black, 2014).
2 Aims of the study
11
2 Aims of the study
The thesis aims to explore and characterize the members of the NFAT transcription factor family
in skeletal muscle.
1) What is the transcriptional potential of the different NFATs?
2) How does p300 influence the transactivational activity of the different members of the
NFAT family?
3) Does voluntary exercise increase the transactivational activity of NFAT?
4) How does voluntary exercise affect the expression of the different NFAT family
members?
12
3 Methods:
This section describes the techniques and experimental methods used in this thesis. List of
materials can be found in section 7.1. Each method contains a short description of the method and
how it was performed.
3.1 Preparation of recombinant plasmid
3.1.1 GBD-NFAT expression vector
To investigate the transactivational activity of the NFAT family members, each member was
subcloned into the pCIneo-GBD2 (a kind gift from Professor Odd Stokke Gabrielsen, Department
of Biosciences, University of Oslo, Norway) to create the GBD-NFAT constructs used in the
luciferase assay, in section 4.1 and 4.2. The new constructs were subcloned using polymerase
chain reaction (PCR), followed by purification from agarose gel, restriction digestion, and
ligation; these steps are described in more detail below.
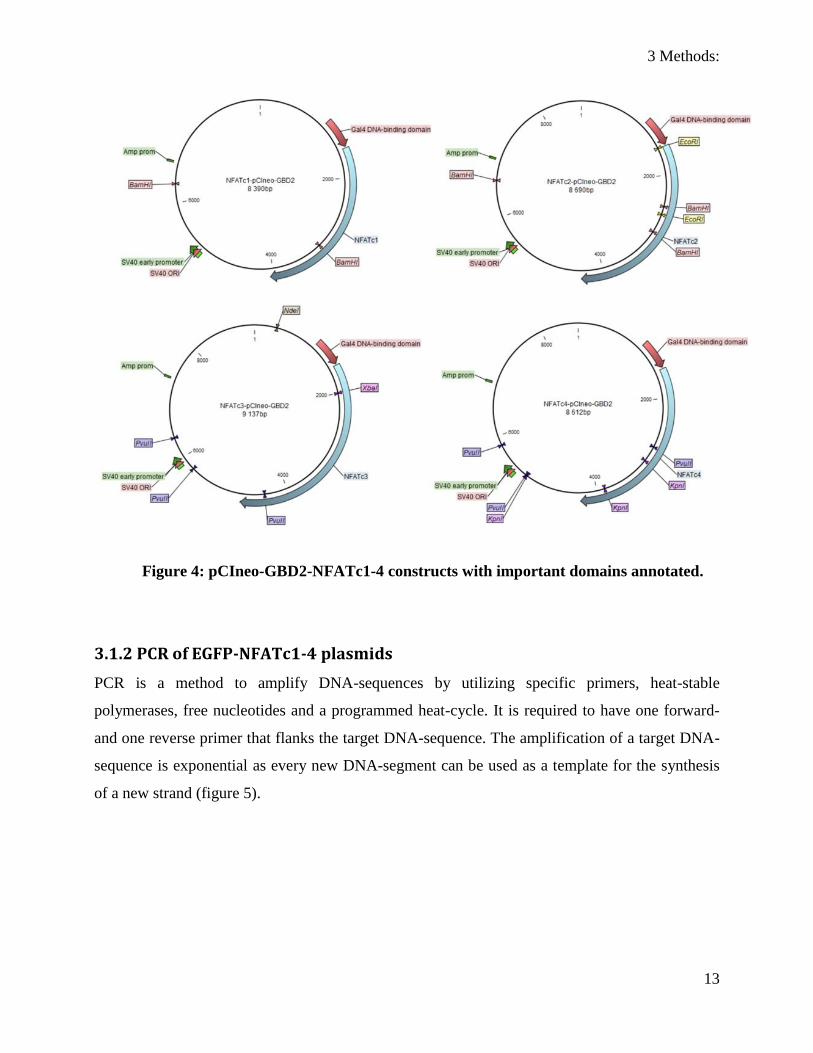
The pCIneo-GBD2 contains a cytomegalovirus (CMV) promoter upstream of the Gal-binding
domain (GBD) to facilitate expression of the fused GBD-NFAT construct (figure 4).
Furthermore, the vector contains additional elements such as restriction sites for cloning, the
selectable markers ampicillin (bacteria) and neomycin (mammalian) and ColE1 and The Simian
Virus 40 origin of replication (SV40 ORI) for replication of the vector in bacteria and
mammalians, respectively.
3 Methods:
13
Figure 4: pCIneo-GBD2-NFATc1-4 constructs with important domains annotated.
3.1.2 PCR of EGFP-NFATc1-4 plasmids
PCR is a method to amplify DNA-sequences by utilizing specific primers, heat-stable
polymerases, free nucleotides and a programmed heat-cycle. It is required to have one forward-
and one reverse primer that flanks the target DNA-sequence. The amplification of a target DNA-
sequence is exponential as every new DNA-segment can be used as a template for the synthesis
of a new strand (figure 5).

14
Figure 5: Amplification pattern of the targeted DNA-sequence in a PCR. The green
lines are the targeted DNA-sequence while the blue lines are the original template. The
first PCR-cycle produces an extension of the targeted gene, and the following cycles
amplify the targeted gene exponentially and an extended version of the amplicon in a
linear fashion. A PCR consists of 25-40 heat cycles to get high enough concentration of
the amplicon to greatly exceed the extended version of the target gene. Figure adapted
from ‘What is PCR?’, no date.
A PCR cycle consists of three steps. The first step is denaturing of the DNA-double helix, which
is achieved by heating the sample to 95-98°C. The second step is annealing of the primers to their
targeted sequence which is achieved by heating the sample to 45-70°C, 10-30 seconds depending
on the primer. The final step is elongation which is performed at 72°C.
3.1.3 Primer design
A primer is a short DNA sequence that can bind to complementary DNA and facilitate
recruitment of the polymerase. This is used in PCR to amplify a target sequence. The primer can
be extended with an overhang in order to add a restriction site, which can be used in subcloning
of the amplicon into a vector or to modify the reading frame.

3 Methods:
15
To design primers, the designing tools in CLC main workbench 7 (Qiagen) and Primer Design
Tools (Eurofinsgenomics) was used. For cloning applications, primers were designed to target the
area of interest. Restriction sites were added to the 5’-end in addition to 7 base pairs (bp) of
overhang to facilitate the restriction. Expression primers were designed to be 20 – 24 nucleotides
(nt) long, with a GC content of 40-65%, maximum melting temperature difference of 3°C
between primers and to have a single annealing site in the genome. Furthermore, the primers
were designed to amplify between 80 and 300 nt and with a GC content of 20-80% and only
target one exon, in order to detect both cytosolic and nuclear messenger RNA (mRNA). To check
for multiple annealing sites in the mouse genome (mm9), the blat feature at Genome browser
(‘Human BLAT Search’, no date) was used. Primers can be found in section 7.3.
PCR was used to amplify NFATc1-4 from template vectors containing EGFP-NFATc1-4 (kind
gift from Dr. Ida G. Lunde, Institute for Experimental Medical Reseach, Oslo University
Hospital, Norway). The primers were designed to amplify the reading frame of NFATc1-4. The
forward primers were designed to contain the restriction site SalI at the 5’-end, while the reverse
primer NotI at the 3’-end. To promote restriction nuclease activity, an additional 5 nucleotides
were added to the 5’-end of the primer. For the forward primer at the 5’-end, an additional base
was added between the restriction site and the coding sequence to prevent frameshift. For the
reverse primer, two stop codons were inserted after the last bp in the NFAT reading frame. The
NFAT specific part was designed to contain 14 bp to ensure annealing specificity. Primers can be
found in section 7.3.
Protocol:
1. Mix on ice according to the table
5x Phusion HF or GC
buffer
20 µl
10 mM dNTP 2 µl
Forward primer 0,5 µM
Reverse primer 0,5 µM
DNA 2 µl (<250 ng)
Phusion DNA 1 µl (1,0 units/50 µl

16
polymerase PCR)
DMSO 1,5 µl (3%)
H2O Up to 100 µl
Total 100 µl
2. Run PCR:
a) Initial denaturation: 98°C, 30 seconds.
b) 25-35 cycles:
1. 98°C, 5-10 seconds.
2. 45-72°C, 10-30 seconds.
3. 72°C, 15-30 seconds per kb.
c) Final extension: 72°C, 5-10 minutes.
d) Hold: 4-10°C.
3.1.4 Purification of PCR product
The PCR products were purified using MinElute PCR Purification Kit (Qiagen) to up-concentrate
and to remove enzymes and buffers according to the recommendations from the manufacturer.
3.1.5 Sequencing of NFATc1-4
To verify that the subcloned plasmid contained the correct DNA sequence, the plasmids were
sequenced with a primer upstream of the 5’ insertion site. Sequencing was performed by GATC,
for primer see section 7.3.
3.1.6 Restriction enzyme digestion
Restriction enzymes are endonucleases that are able to recognize specific motif in the DNA and
cleave the nucleotide inside the motif. The enzyme can create either a cohesive or blunt end at the
restriction site. To clone the NFAT constructs both PCR products and the plasmid was digested
3 Methods:
17
with the same enzymes. Furthermore, the final cloned constructs were validated with digestion
with restriction enzymes in addition to sequencing.
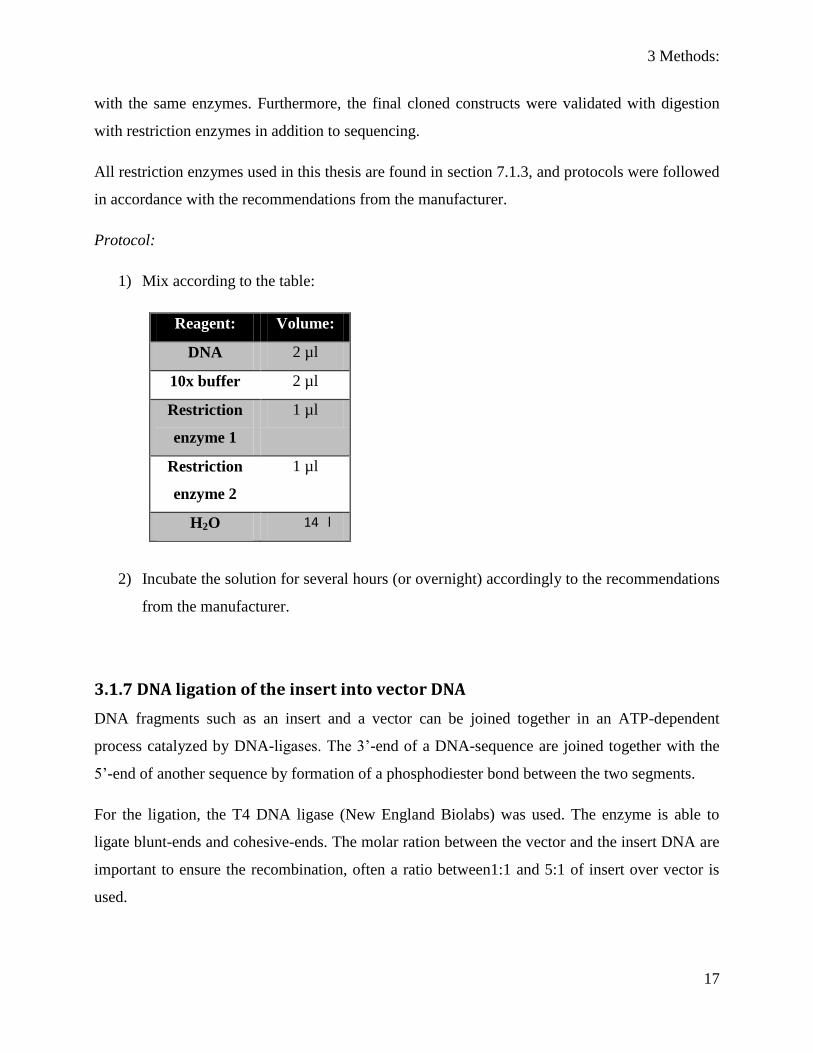
All restriction enzymes used in this thesis are found in section 7.1.3, and protocols were followed
in accordance with the recommendations from the manufacturer.
Protocol:
1) Mix according to the table:
Reagent: Volume:
DNA 2 µl
10x buffer 2 µl
Restriction
enzyme 1
1 µl
Restriction
enzyme 2
1 µl
H2O 14 l
2) Incubate the solution for several hours (or overnight) accordingly to the recommendations
from the manufacturer.
3.1.7 DNA ligation of the insert into vector DNA
DNA fragments such as an insert and a vector can be joined together in an ATP-dependent
process catalyzed by DNA-ligases. The 3’-end of a DNA-sequence are joined together with the
5’-end of another sequence by formation of a phosphodiester bond between the two segments.
For the ligation, the T4 DNA ligase (New England Biolabs) was used. The enzyme is able to
ligate blunt-ends and cohesive-ends. The molar ration between the vector and the insert DNA are
important to ensure the recombination, often a ratio between1:1 and 5:1 of insert over vector is
used.
18
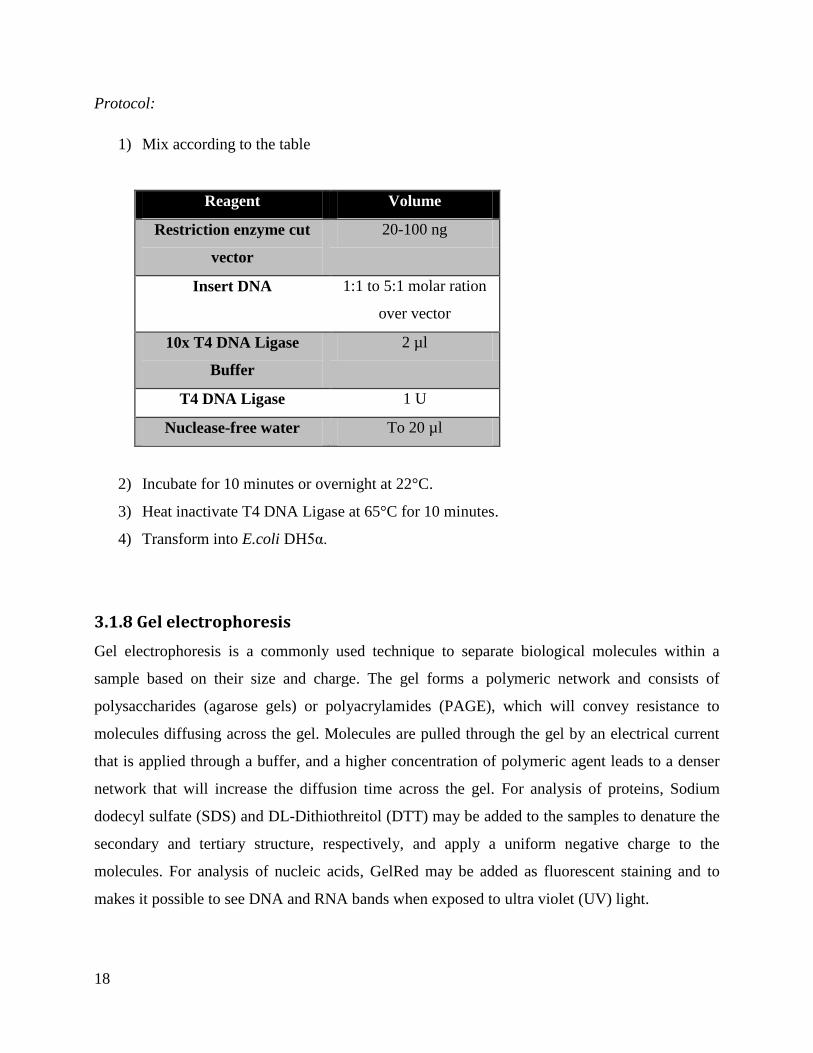
Protocol:
1) Mix according to the table
Reagent Volume
Restriction enzyme cut
vector
20-100 ng
Insert DNA 1:1 to 5:1 molar ration
over vector
10x T4 DNA Ligase
Buffer
2 µl
T4 DNA Ligase 1 U
Nuclease-free water To 20 µl
2) Incubate for 10 minutes or overnight at 22°C.
3) Heat inactivate T4 DNA Ligase at 65°C for 10 minutes.
4) Transform into E.coli DH5α.
3.1.8 Gel electrophoresis
Gel electrophoresis is a commonly used technique to separate biological molecules within a
sample based on their size and charge. The gel forms a polymeric network and consists of
polysaccharides (agarose gels) or polyacrylamides (PAGE), which will convey resistance to
molecules diffusing across the gel. Molecules are pulled through the gel by an electrical current
that is applied through a buffer, and a higher concentration of polymeric agent leads to a denser
network that will increase the diffusion time across the gel. For analysis of proteins, Sodium
dodecyl sulfate (SDS) and DL-Dithiothreitol (DTT) may be added to the samples to denature the
secondary and tertiary structure, respectively, and apply a uniform negative charge to the
molecules. For analysis of nucleic acids, GelRed may be added as fluorescent staining and to
makes it possible to see DNA and RNA bands when exposed to ultra violet (UV) light.

3 Methods:
19
Agarose-gel:
A 1.5% agarose gel run at 100V for 90 minutes was used to separate successfully amplified
NFATc1-4 for subcloning and for analysis of the final cloned constructs.
Protocol:
1) Add 1-5g of agarose in 100 µl TAE buffer to an Erlenmeyer flask.
2) Heat solution until all the agarose is dissolved.
3) Let it cool down to 40°C, and add 10 µl gel red (10 000x). Mix well.
4) Pour the solution onto a gel tray, and let it solidify.
5) Prepare the samples that are to be run by adding 6x Loading dye.
6) Put the cooled gel into the electrophoresis chamber and add TAE buffer to the gel is
covered.
7) Load samples and a ladder.
8) Run the gel on 100-200V for 40- to 90 minutes.
9) Visualize the gel using UV light.
3.1.8.1 Purification of NFAT constructs from a gel
Bonds formed by gel electrophoresis can be cut out and isolated by using a gel extraction kit. To
purify the NFAT PCR products the QIAquick Gel Extraction Kit (Qiagen) was used following
the recommendations from the manufacturer.
3.2 Working with bacteria When working with bacteria it is important always to maintain everything as sterile as possible to
prevent contamination, and thus all the equipment and solutions have been autoclaved for 20
minutes at 121°C.
20
3.2.1 Culturing of bacteria
E. coli DH5α was cultured on nutritious Lysogeny broth (LB) plates or in LB medium
supplemented with 100 µg/ml ampicillin. The incubation was done overnight at 37°C in a closed
plastic container that was put into an incubator (Hybrigene, Techne). Ampicillin was used as a
selective marker for successful transformation of bacteria.
3.2.2 Transformation of E. coli DH5α
Transformation is the process of bacterial uptake of exogenous DNA. A transformed plasmid
containing an origin of replication (ORI) can be amplified in the host bacteria, and subsequently,
the plasmid can be isolated experimentally. To ensure isolation of only the successfully
transformed bacteria, a selective marker such as antibiotics is introduced in the plasmid. Hence,
only successfully transformed bacteria will be able to grow in nutritious medium containing the
antibiotic.
For transformation of the cloned pCIneo-GBD2-NFAT plasmids the E. coli strain DH5α was
used.
Protocol:
1) Thaw competent E. coli DH5α on ice.
2) Depending on the concentration of DNA, add 1 ng of plasmid to 50 µl cell suspension.
3) Incubate the solution for 20 minutes on ice.
4) Heat-shock the cells by incubation on a heat-block at 42°C for 45 seconds.
5) Leave the cells on ice for 2 minutes.
6) Add LB medium.
7) Spread the cells on LB agar plates containing appropriate antibiotics.
8) Incubate the plates upside down at 37°C overnight (or 16-18 hours).
3.2.3 Plasmid isolation and purification
A plasmid of interest can be transformed and isolated from DH5α. Depending on the yield
plasmid and downstream application two different kits were used. For identification of

3 Methods:
21
successfully cloned pCIneo-GBD2-NFATc1-4 plasmids the Miniprep kit (Qiagen) was used. For
plasmid to use for transfection of mammalian cells the Maxiprep kit (Mahcerey-Nagel) was used.
For both kits, purifications were conducted according to the recommendations from the
manufacturer. Both kits are based on an anion-exchanger column with high affinity for the
plasmid.
Procedure:
Bacterial culture for miniprep:
1) Add a single E.coli DH5α colony to a 13 ml tube containing 3 ml LB medium and 100
µg/ml ampicillin.
2) Incubate for 16-18 hours at 37°C with constant shaking.
The plasmids were isolated using Miniprep kit (Qiagen) following the recommendations from the
manufacturer.
Bacterial culture for maxiprep:
1) 1) Add a single E.coli DH5α to a 1 L Erlenmeyer flask containing 200 ml LB medium and
100 100 µg/ml ampicillin.
2) Incubate for 16-18 hours at 37°C with constant shaking.
The plasmids were further isolated using Maxiprep kit (Macherey-Nagel) following the
recommendations from the manufacturer.
Finally, the plasmids were dissolved in 1:9 of TE-buffer and MiliQ-water.
3.3 Working with mammalian cells When working with mammalian cells, it is important to always keep everything as sterile as
possible to prevent contamination. Subsequently, philtered pipette tips were used, and all
equipment and solutions have been autoclaved or sprayed with 70% ethanol before use. All
exposure of cells has been within NU-5510E (NuAire), and all chemicals applied to the cells
have been between room temperature and 37°C.
22
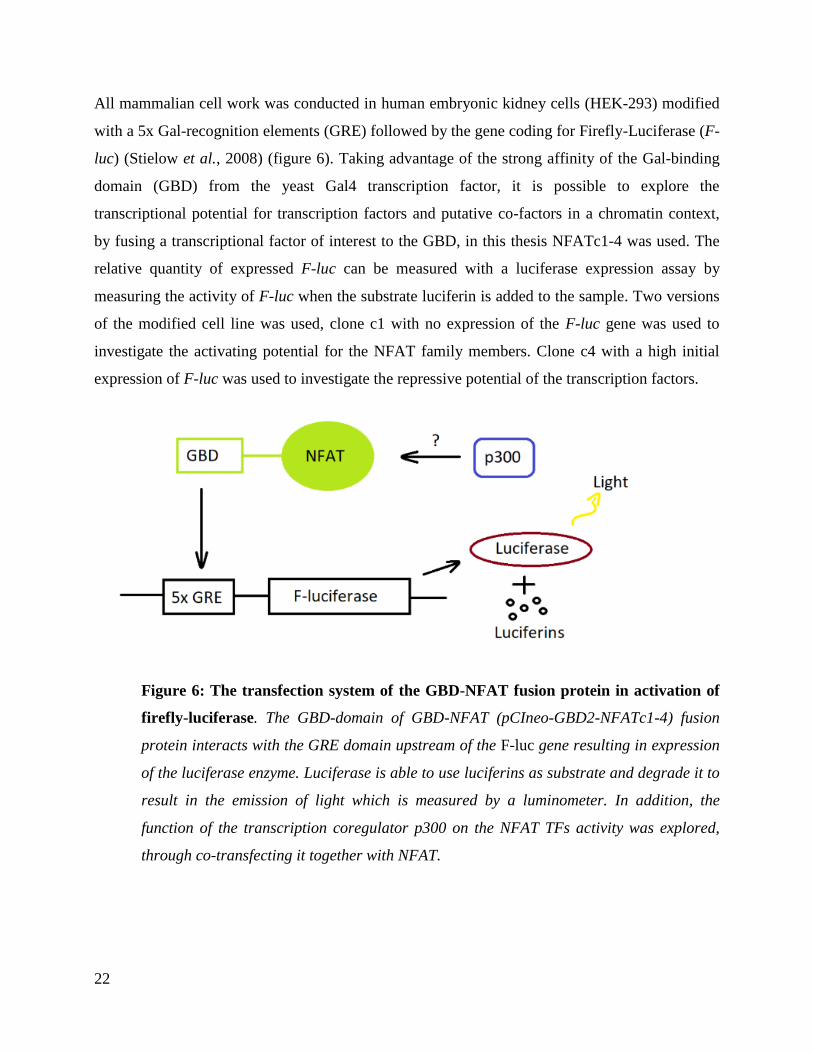
All mammalian cell work was conducted in human embryonic kidney cells (HEK-293) modified
with a 5x Gal-recognition elements (GRE) followed by the gene coding for Firefly-Luciferase (F-
luc) (Stielow et al., 2008) (figure 6). Taking advantage of the strong affinity of the Gal-binding
domain (GBD) from the yeast Gal4 transcription factor, it is possible to explore the
transcriptional potential for transcription factors and putative co-factors in a chromatin context,
by fusing a transcriptional factor of interest to the GBD, in this thesis NFATc1-4 was used. The
relative quantity of expressed F-luc can be measured with a luciferase expression assay by
measuring the activity of F-luc when the substrate luciferin is added to the sample. Two versions
of the modified cell line was used, clone c1 with no expression of the F-luc gene was used to
investigate the activating potential for the NFAT family members. Clone c4 with a high initial
expression of F-luc was used to investigate the repressive potential of the transcription factors.
Figure 6: The transfection system of the GBD-NFAT fusion protein in activation of
firefly-luciferase. The GBD-domain of GBD-NFAT (pCIneo-GBD2-NFATc1-4) fusion
protein interacts with the GRE domain upstream of the F-luc gene resulting in expression
of the luciferase enzyme. Luciferase is able to use luciferins as substrate and degrade it to
result in the emission of light which is measured by a luminometer. In addition, the
function of the transcription coregulator p300 on the NFAT TFs activity was explored,
through co-transfecting it together with NFAT.
3 Methods:
23
3.3.1 Subcultivation of cells
The cells were cultured in Tissue culture flask (VWR) containing Dulbecco's Modified Eagle
Medium (DMEM, Thermo Fisher Scientific) supplemented with 10% fetal bovine serum (FBS,
Thermo Fisher Scientific) and 2% Penicillin-Streptomycin (PS, Lonza). The cells were incubated
at 37°C with a 5% CO2 in an incubator (NU-5510E, NuAire) with humidified air.
The cells were subcultivated in order to maintain a normal growth for a longer period of time.
The cells were split every 2nd or 3rd day by detaching the cells from the culture flask with
trypsin EDTA. 1µg/ml puromycin (Thermo Fisher Scientific) was added in order to hold the
selective pressure on the modified cells.
Procedure:
1) Pre-warm DMEM and trypsin-EDTA to 37°C in a water bath.
2) Inspect the cells in a light microscope; confluence should be between 50-80%.
3) Remove media from the cells.
4) Wash twice with 5 ml 1x DPBS.
5) Remove PBS and add 2.5 ml trypsin-EDTA.
6) Incubate for 4 minutes at 37°C in the CO2 incubator
7) Inspect the cells in a light microscope. If they are not completely detached, shake the
bottle carefully.
8) Resuspend the cells in DMEM twice the volume of trypsin to stop the activity of trypsin.
9) Dilute the cells 1:4 or 1:10 depending on the time of the next subcultivation and
confluency, and add DMEM to a total of 15 ml.
10) Add puromycin to a final concentration at 1 µg/ml.
11) Incubate the cells at 37°C in the CO2 incubator for 48 or 72 hours depending on the
subcultivation ratio.

24
3.3.2 Transfection
Transfection is a method for introducing DNA into eukaryotic cells. The DNA is encapsulated by
polymeric gene carriers that can fuse with a cell membrane and leave the DNA in the cytosol.
Transfections were performed with the Mirus TransIT (Mirus Bio). The reagent consists of lipids
diluted in 80 % ethanol.
Protocol:
3.3.2.1 Seeding out cells:
1. Heat cell medium and trypsin-EDTA to 37°C.
2. Remove the medium from the cells, and wash them twice in 5 ml room tempered PBS.
3. Add 2.5 ml trypsin, and incubate the cells at 37° until the cells have detached.
4. Add 7.5 ml DMEM containing FBS and PS. Resuspend thoroughly.
5. Count the cells with Countess™ automated cell counter.
a) Add 20 µl cell suspension to 20 µl trypan blue and mix.
b) Add 20 µl to the chamber in the cell counter.
c) Count the cells.
6. Dilute the cells to 4.0 х 104 cells/ml.
7. Add puromycin to a final concentration of 1 µg/ml.
8. Add 0.5 ml in each well of a 24-well plate.
9. Shake the plate carefully to distribute the cells evenly on the surface.
10. Incubate at 37°C, 5% CO2 overnight (preferably 24 hours, 50-80% confluence).
3.3.2.2 Preparing the constructs:
1. Dilute the plasmid constructs in 1:10 TE buffer/MiliQ water, to a concentration of 0.10
µg/µl.
2. Transfer 4 µl of the diluted constructs per well to a new Eppendorf tube.
3. Add 50 µl DMEM (without FBS and PS) and TransIT 2x (add TransIT equal to 2 times
the mass of DNA). Mix thoroughly.
4. Incubate at room temperature for 15-30 minutes.

3 Methods:
25
5. Transfer 55 µl of the transfection solution to each well. Apply it drop-wise in equal
distribution throughout the well.
6. Incubate at 37°C, 5% CO2 overnight (preferably 24 hours).
3.3.2.3 Luciferase assay:
1. Turn on the luminometer at least 5 min before use.
2. Dilute 5x Lysis buffer (Promega) to 1x in MiliQ water. Thaw luciferase substrate in room
temperature (make sure it is protected from light).
3. Remove medium from the cells.
4. Wash twice with 0.5 ml room tempered PBS.
5. Remove excess PBS and add 100 µl 1x cell lysis buffer.
6. Incubate the cells on an orbital shaker for 15 min, 80 rpm at room temperature.
7. Transfer the lysates to microcentrifuge tubes and centrifuge at 10 000 rpm for 2 minutes.
8. Transfer the supernatant to a new tube.
9. Mix 50 µl lysate and 50 µl room tempered luciferase substrate (Promega) in a glass tube.
10. Measure the luciferase activity with a luminometer using the parameters in the table
below:
Delay 2 sec
Integration 10 sec
Replicates 1
Sensitivity 59,6%
3.3.2.4 Western blot:
1. Remove the cell medium and wash two times with PBS.
2. Add 100 µl SDS loading buffer (Bio-Rad) supplemented with 100 mM DTT and incubate
on an orbital shaker for 15 minutes, at 80 rpm.
3. Transfer the sample to an Eppendorf tube, and spin down at 10 000 rcf for 10 minutes.
4. Transfer the supernatant to a new tube, and heat it for 5 minutes at 95°C.
5. Load the samples and a ladder to an SDS-PAGE, and run it for 40 minutes at 150V.
6. Run a Western blot of the gel, see below.

26
3.3.3 Western blot Western blot is a method to identify and semi-quantify a target protein in a sample. Following an
SDS-PAGE, the separated proteins can be blotted onto a Polyvinylidene difluoride (PVDF)
membrane. The membrane is soaked in a blocking buffer to decrease unspecific binding of
antibodies, thus reducing background noise, before the antibody is added.
An organism’s immune system produces antibodies as a response to foreign pathogens as they
can bind to specific membrane proteins of the pathogens. A primary antibody is used in Western
blot to bind to the target protein. A secondary antibody attached to a fluorophore is used to bind
to the primary antibody to produce a readable signal that reflects the quantity of the target
protein.
Anti-GBD was used as an antibody against GBD and GBD-NFAT. Anti-GAPDH was run as a
loading control. The secondary antibody was donkey anti-mouse antibody. The Western blots
were developed with Odyssey CLx (Licor) and edited with Image Studio (Licor). Precision plus
protein standards (Bio-Rad) was used as a ladder.
Procedure:
1. Separate proteins by SDS-PAGE.
2. Cut 6 pieces of Whatman filter paper (0.92 mm)(GE Healthcare) and the PVDF
membrane (GE Healthcare) to the same size as the gel:
a. Pre-wet three pieces of Whatman paper in plus buffer.
b. Activate the PVDF membrane in 100% methanol for 2 minutes.
c. Equilibrate PVDF membrane in plus buffer.
3. After electrophoresis, assemble the blotting sandwich in the following direction from the
anode (bottom) to the cathode (top):
a. Three pieces of filter paper soaked in plus buffer.
b. PVDF membrane.
c. Gel.
d. Three pieces of filter paper soaked in minus buffer.
4. Remove air bubbles and blot at accordingly to Bio-Rads recommendation.
5. Transfer the membrane to Odyssey Blocking Buffer block for 1 hour with shaking.

3 Methods:
27
6. Incubate the membrane with primary antibody diluted in blocking buffer in a heat-sealed
bag overnight at 4°C with shaking.
7. Remove the primary antibody and wash the membrane 3x15 minutes in Wash buffer.
8. Incubate the membrane with secondary antibody (1:10.000) diluted in blocking buffer for
1 hour with shaking – Protect membrane from light during incubation.
9. Remove the secondary antibody and wash the membrane 3x15 minutes in Wash buffer –
Protect membrane from light during washes.
10. Rinse membrane with 1x TBS.
11. Develop Western blot at Odyssey CLx.
3.4 Working with animals
3.4.1 Ethical considerations
Animal procedures were reviewed and approved by the Norwegian Animal Research Authority
and were conducted in accordance with the Norwegian Animal Welfare Act of December 20th,
1974, no. 37, chapter VI, sections 20-22, and the Regulation of Animal Experimentation of
January 15th, 1996. An animal researcher certificate (FELASA C) was obtained before
proceeding with the animal experiments.
3.4.2 Animals
NFAT-luciferase reporter mice (FVB/J) (Wilkins et al., 2004), kindly provided by Dr. Jeffery D.
Molkentin (Cincinnati Children`s Hospital Medical Center, Cincinnati, OH) were used in all the
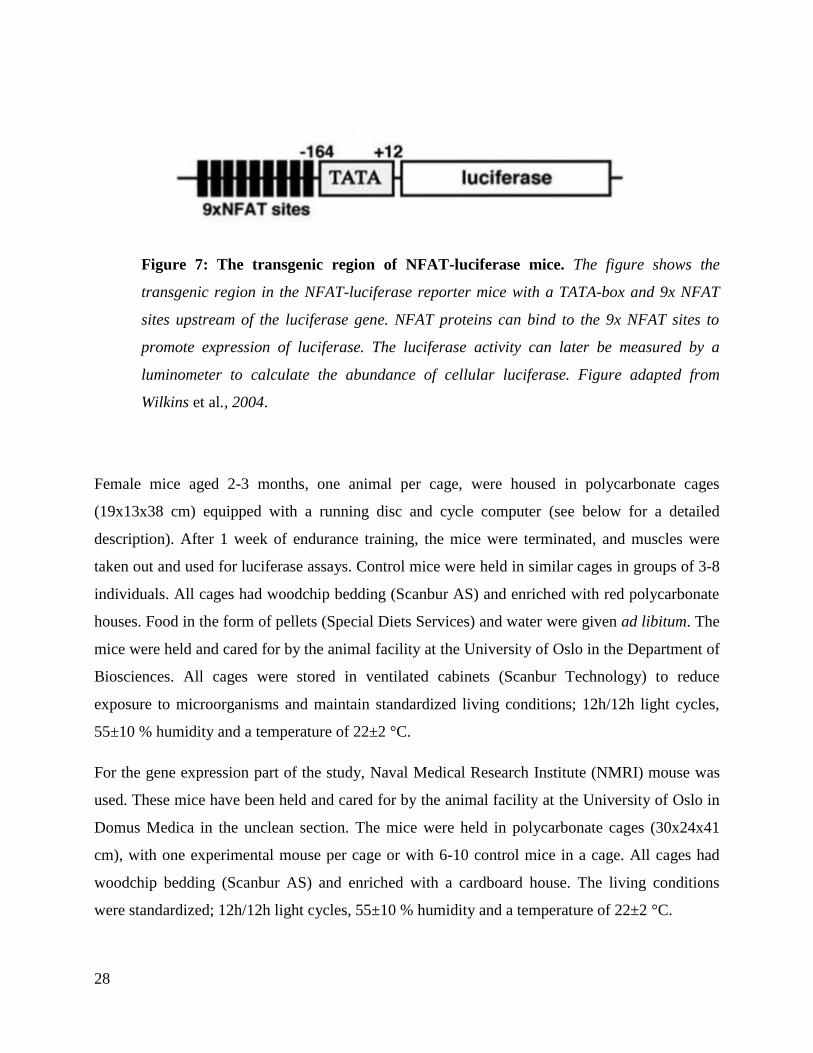
mice luciferase assays. The transgenic regions are divided in three: 1) A cluster of nine consensus
NFAT binding sites. 2) TATA-box from the α-MyHC gene. 3) A firefly luciferase (Photinus
pyralis) reporter gene from pGL-3Basic (Promega) (Figure 7). NFAT is able to bind to the NFAT
binding sites and thereby promote expression of the luciferase. Luciferase activity, measured in
relative luciferase unit (RLU), can subsequently be measured with a luminometer, see section 4.3.
28
Figure 7: The transgenic region of NFAT-luciferase mice. The figure shows the
transgenic region in the NFAT-luciferase reporter mice with a TATA-box and 9x NFAT
sites upstream of the luciferase gene. NFAT proteins can bind to the 9x NFAT sites to
promote expression of luciferase. The luciferase activity can later be measured by a
luminometer to calculate the abundance of cellular luciferase. Figure adapted from
Wilkins et al., 2004.
Female mice aged 2-3 months, one animal per cage, were housed in polycarbonate cages
(19x13x38 cm) equipped with a running disc and cycle computer (see below for a detailed
description). After 1 week of endurance training, the mice were terminated, and muscles were
taken out and used for luciferase assays. Control mice were held in similar cages in groups of 3-8
individuals. All cages had woodchip bedding (Scanbur AS) and enriched with red polycarbonate
houses. Food in the form of pellets (Special Diets Services) and water were given ad libitum. The
mice were held and cared for by the animal facility at the University of Oslo in the Department of
Biosciences. All cages were stored in ventilated cabinets (Scanbur Technology) to reduce
exposure to microorganisms and maintain standardized living conditions; 12h/12h light cycles,
55±10 % humidity and a temperature of 22±2 °C.
For the gene expression part of the study, Naval Medical Research Institute (NMRI) mouse was
used. These mice have been held and cared for by the animal facility at the University of Oslo in
Domus Medica in the unclean section. The mice were held in polycarbonate cages (30x24x41
cm), with one experimental mouse per cage or with 6-10 control mice in a cage. All cages had
woodchip bedding (Scanbur AS) and enriched with a cardboard house. The living conditions
were standardized; 12h/12h light cycles, 55±10 % humidity and a temperature of 22±2 °C.
3 Methods:
29
3.4.3 Voluntary endurance exercise
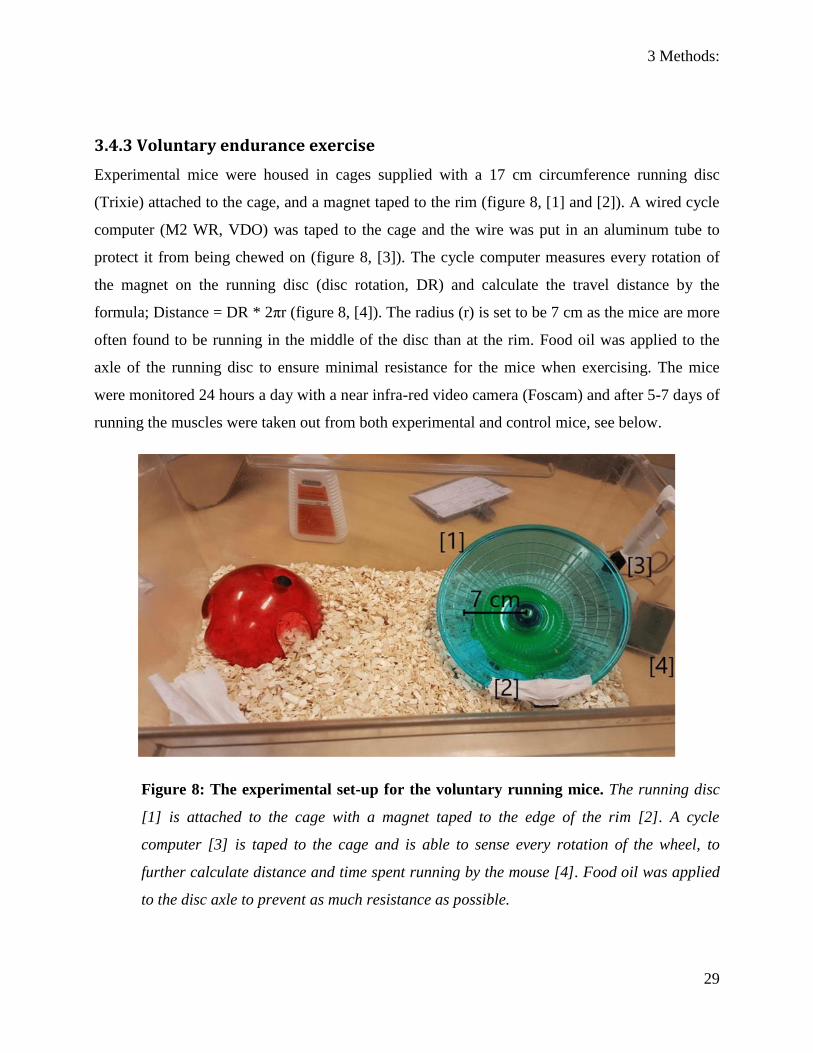
Experimental mice were housed in cages supplied with a 17 cm circumference running disc
(Trixie) attached to the cage, and a magnet taped to the rim (figure 8, [1] and [2]). A wired cycle
computer (M2 WR, VDO) was taped to the cage and the wire was put in an aluminum tube to
protect it from being chewed on (figure 8, [3]). The cycle computer measures every rotation of
the magnet on the running disc (disc rotation, DR) and calculate the travel distance by the
formula; Distance = DR * 2πr (figure 8, [4]). The radius (r) is set to be 7 cm as the mice are more
often found to be running in the middle of the disc than at the rim. Food oil was applied to the
axle of the running disc to ensure minimal resistance for the mice when exercising. The mice
were monitored 24 hours a day with a near infra-red video camera (Foscam) and after 5-7 days of
running the muscles were taken out from both experimental and control mice, see below.
Figure 8: The experimental set-up for the voluntary running mice. The running disc
[1] is attached to the cage with a magnet taped to the edge of the rim [2]. A cycle
computer [3] is taped to the cage and is able to sense every rotation of the wheel, to
further calculate distance and time spent running by the mouse [4]. Food oil was applied
to the disc axle to prevent as much resistance as possible.
30
3.4.4 Anaesthesia
All surgical procedures were performed on deeply anesthetized mice. Firstly, the mice were put
into a chamber with 3-4% isoflurane gas (MSS isoflurane with the SurgiVet Gas Evacuation
System) to secure quick and deep anesthesia. When this was achieved, they were attached to a
mask with a continuous flow of 2-3% isoflurane at 0.8-1.5 liter/min (depending on the respiratory
rate of the mice) to maintain deep anesthesia during the surgical procedures. To confirm deep
anesthesia, a pinch of the metatarsus region of the foot in the absence of any reflexes was done
prior to, and during any surgical any surgical procedures.
3.4.5 Surgical procedures
The hair was removed from the leg using an electrical shaver followed by a vacuum cleaner to
remove excess loose hair. The leg was pinned in a fixed position and a cut through the skin was
made with a scalpel. Muscles were taken out and dried from blood with a fiber-less lens paper.
Further, the weight of the muscle was measured and flash-frozen in liquid nitrogen. The muscles
were stored in -80°C until use. Due to inconvenience at the animal facility at Domus Medica, it
was not possible to measure the muscle weight of the NMRI mice.
3.4.6 Luciferase assay
In this procedure it is important to work quickly especially after the luciferase substrate is added,
as it has been reported a three hours half-life of luciferase proteins in cell lysates (Thompson,
Hayes and Lloyd, 1991).
To homogenize the skeletal muscles, Tissue Lyser II (Qiagen) was used.
Protocol:
1) Precool the free parts of the tissue lyser to -4°C.
2) Add 15 mg muscle/ml cell lysis buffer to a 2ml Eppendorf tube.
3) Add the muscle and a Tissue Lyser bead.
4) Homogenize the sample twice for 2 minutes at a frequency of 20 s-1
and 30 seconds of
resting between intervals.

3 Methods:
31
5) Centrifuge the samples for 1 minute at 13 000g.
6) Transfer the supernatant to new 1.5 ml tubes.
7) Mix 50 µl lysate and 50 µl room tempered luciferase substrate in a glass tube.
8) Measure the luciferase activity with a luminometer using the parameters in the table
below:
Delay 2 sec
Integration 10 sec
Replicates 1
Sensitivity 100%
9) Include a blank which is composed of 50 µl luciferase substrate and 50 µl cell lysis
buffer.
3.5 Purification of RNA and cDNA-synthesis
3.5.1 Total RNA isolation
RNA was purified using RNeasy Fibrous Tissue Mini Kit (Qiagen) and the Tissue Lyser II
(Qiagen) in accordance with the recommendations from the manufacturer using 10 mg of tissue.
3.5.2 cDNA synthesis
mRNA can be used as a template complementary DNA (cDNA) synthesis, a reaction catalyzed
by reverse transcriptases. It is commonly used two types of primers for cDNA synthesis of the
RNA in a cell; random- and poly-dT primers. Random primers are a mixture of different random
primers that can bind to most RNAs, while poly-dT primers bind to the poly-A tail of mRNA.
The cDNA can be used to study the transcriptome of a cell by quantitative PCR (qPCR) against
specific genes.
32
SensiFAST cDNA Synthesis Kit (Bioline) using a mix of random- and oligodT primers were
used according to the recommendations from the manufacturer to synthesize cDNA from the
isolated RNA. After the synthesis, cDNA was diluted 1/20 for downstream qPCR analysis.
3.5.3 Nanodrop
Nanodrop is a spectrophotometer that can measure concentrations of a sample by emitting light
with specific wavelengths and measure the amount of absorbed energy. The aromatic structures
of DNA, RNA, and proteins absorb energy at specific wavelengths. DNA and RNA are both
measured at 260 nm which makes it inaccurate to measure DNA or RNA in a sample where both
are present as they will interfere with each other. Proteins are measured at 280 nm which is the
light absorbed by the aromatic amino acids; phenylalanine, tyrosine, and tryptophan. Using
Nanodrop is a fast and easy method to measure DNA, RNA and protein concentrations in a
sample. However, the downside is the multitude of interferences within the sample, and thus
Nanodrop is primarily used to obtain an indication of the concentration.
Nanodrop 2000 spectrophotometer (Thermo Fisher Scientific) has been used according to
recommendations from the manufacturer for all measurements of DNA and RNA throughout the
thesis.
3.6 qPCR
3.6.1 qPCR of cDNA
In contrast to conventional PCR, quantitative polymerase chain reaction (qPCR) acquires data
after each PCR cycle to measure the relative amount of the sample in real time. qPCR can be
used for quantitative analysis of a target DNA; for instance to measure the relative expression of
a gene in a cell. In order to quantify the amount of DNA after each PCR cycle, a non-specific
fluorescent dye that intercalates with double-stranded DNA is found in the PCR mix, in this
thesis SYBR Green was used. To quantify the amount of DNA in a sample, the Cq value is used,
which describes when the fluorescence exceeds the background threshold (figure 9).

3 Methods:
33
In order to be able to compare different primer pairs, it is important that they amplify the DNA
optimally and double the amount of DNA after each cycle, this is known as the efficiency and
should be close to, or a bit lower, than 2.0.
Figure 9: The qPCR process with regards to emitted fluorescence per PCR cycle. A
qPCR reaction has exponential growth as long as there are sufficient reaction
components. The threshold marks the end of the exponential growth phase, and the
emitted fluorescence (measured in absorption, A) can be measured by the thermo cycler.
The cycle number (Cq) when the fluorescence reaches the threshold can be used in the
calculation of the initial quantity of template, with a lower number reflecting more initial
template. The non-exponential plateau phase is reached when PCR components are
diminished. The figure is taken from ‘What is Real-Time PCR (qPCR)?’, no date.
Protocol:
1) Make a 5 µM dilution of relevant combinations of forward and reverse primers:
a. 5 µl of each primer stock (100 µM) with 90 µl MiliQ water.
2) Make a master mix according to the table below, with 3 replicates per gene tested.

34
Per reaction
Primer 1 µl
SYBR Green 2x 5 µl
MiliQ Water 2 µl
Total 8 µl
3) Pipette 8 µl of the master mix to each well in a 96 well lightcycler plate (Sarsted).
4) Add 2 µl DNA to each well.
5) Run the plate in a Light cycler 96 using the following setup:
a. Initial denaturation: 95°C, 600 seconds.
b. 45 cycles.
i. 95°C, 10 seconds.
ii. 60 °C, 10 seconds.
iii. 72 °C, 10 seconds (Acquisition mode: single).
Melting curve (1 cycle):
iv. 95°C, 10 seconds.
v. 65 °C, 60 seconds.
vi. 97 °C, 1 second (Acquisition mode: continues)
c. End of program.
6) Analyze the data using a Light cycler 96 software.
3.6.1.1 Primer evaluation
All primers designed for qPCR, see section 7.3, were evaluated to make sure they work as
intended. The ideal primer should have 1 sharp peak with a preferred Cq value of about 10-25
and an efficiency between 1.9 and 2.0.
Protocol:
1) Make a master mix according to the table below for 2 positive tests (SYBR Green +
DNA) and a negative test (SYBR Green + H2O) for each primer. The added DNA can be
either whole genome DNA or cDNA depending on the designed primers.

3 Methods:
35
Positive sample Negative sample
DNA 0,1 µl -
SYBR Green
2x
5 µl 5 µl
MiliQ Water 3,9 µl 4 µl
Total 9 µl 9 µl
2) Pipette 2x 9 µl of the positive samples and 1x 9 µl of the negative sample to a PCR well
plate.
3) Add 1 µl primer to each well.
4) Run the plate in a Light cycler 96 (as above).
5) Analyze the data using a Light cycler 96 software.
To validate the efficiency of the primers, a 5 fold dilution curve with 4 dilutions and 2 replicates
for each concentration was made using positive samples described above. Samples were run as
above. Efficiency for each primer pair was calculated using the Light cycler 96 software.
3.6.2 Quantification of gene expression
In order to compare the expression of target genes between biological replicates and experimental
conditions, their expression was aligned to a reference gene which is supposed not to alter
expression, in this thesis ACTB was used as reference gene. To quantify the expression of target
genes in each replicate the ΔΔCq-method was used.
( )
( )( )
To calculate the expression ratio for each gene the mean expression ratio for all the biological
replicate were used. The mean from each biological replicate were used to calculate the standard
error of the mean.

36
3.7 T-test A t-test was used to check if two means are significantly different from each other, and take into
account the variance within a data group and the variance between the data groups. The p-value is
the product of a t-test and is the probability that the pattern of data in the sample could be
produced by random data. In this thesis, a t-test was used to calculate the significance of the
obtained data, with a p-value equal of below 0.05 is considered significant. All t-tests were
calculated using Prism (GraphPad).

4 Results
37
4 Results
4.1 Subcloning of pCIneo-GBD2-NFATc1-4 plasmids To create the fused constructs of GBD and NFATc1-4, the NFATs were amplified with PCR
from the EGFP-NFATc1-4 plasmids using primers spanning the reading frames with a NotI and
SalI restriction sites 5’ and 3’, respectively, primers are listed in section 7.3. The amplified
NFATc1-4 were introduced to the vector pCIneo-GBD2, and the constructs were validated with
restriction analysis, an overview of the cloned plasmids can be found in section 3.1.1, figure 4.
The sizes of the obtained fragments were larger than the calculated sizes, which is most likely
due to the GelRed staining (table 3 and figure 10). Plasmids were further validated by sequencing
(GATC) using primers spanning the 5’-end of the NFAT reading frames (data not shown),
primers are listed in section 7.3.
Table 3: Expected fragments of pCIneo-GBD2-NFATc1-4 digested with restriction
enzymes. The restriction enzymes used to digest pCIneo-GBD2-NFATc1-4 are shown to
the left, while the plasmids are shown in the upper part of the table. Expected base pairs
of each fragment are displayed in the table’s body.
Restriction
enzyme
pCIneo-GBD2-
NFATc1
pCIneo-GBD2-
NFATc2
pCIneo-GBD2-
NFATc3
pCIneo-GBD2-
NFATc4
BamHI 3150 and 5140 bp 450, 3650 and 4600
bp
EcoRI 1100 and 7600 bp
PvuII 600, 1300 and 7150
bp
650, 2450 and 5500
bp
XbaI +
NdeI
1900 and 7200 bp
KpnI 800, 1400 and 6500
bp

38
Figure 10: Gel electrophoresis of restriction-digested pCIneo-GBD2-NFATc1-4
plasmids. Restriction analysis of pCIneo-GBD2-NFATc1-4 plasmids run on a 1.5%
agarose gel. The ladders are GeneRuler 100 bp Plus and 1 Kb Plus, with the annotated
sizes in bp.
4.2 The transcriptional potential of the different NFATs To obtain a more detailed understanding of the transcriptional potential of the NFAT family
members, a transfection assay was performed in HEK293 cells with stable 5x GRE-Luciferase
integrated into the genome, see section 3.3, figure 6. To investigate both the activating and
repressive potential of the NFATs, two versions of the HEK293 cell line were used; the HEK293-
c1 with no detectable luciferase activity and the HEK293-c4 with a high background luciferase
activity in the presence of GBD.

4 Results
39
The HEK293 cells were co-transfected with 0.2 µg pCIneo-GBD2 or pCIneo-GBD2-NFATc1-4
and 0.2 µg pCIneo empty plasmid. The HEK293 cells were subsequently lysed after 24 hours.
The luciferase activity was measured with a luminometer and normalized to the GBD control
(figure 11), for more details see section 3.3.
In the HEK293-c1 cells, all NFAT showed a significant upregulation but with substantial
differences between the family members. NFATc1 showed a weak activating potential with a
fold change of 3.4 while NFATc2, NFATc3, and NFATc4 displayed a strong activating potential
with a fold change of 600, 550 and 1850, respectively. In the HEK293-c4 cells, NFATc1
repressed the luciferase expression with 80% compared to the control GBD, while NFATc2 and
NFATc4 had a fold change of 1.5 and 2.6, respectively. NFATc3 was not able to significantly
influence the activity in either positive or negative way.
Figure 11: Luciferase activity in HEK293 cells transfected with pCIneo-GBD2-
NFATc1-4. HEK293-c1 and HEK293-c4 cells were transfected with pCIneo-GBD2-
NFATc1-4 and pCIneo empty and the luciferase activity was measured after 24 hours.
The values have been normalized to the GBD control; cells transfected with pCIneo-
GBD2 and pCIneo empty. N.s. (not significant) = p > 0.05; * = p =< 0.05; ** = p =<
0.005; *** = p = 0.0005; **** = p =< 0.00005. The error bars show the ±SEM with
n=12 for HEK293-c1 and n = 9 for HEK293-c4.
40
4.2.1 p300 increase the transcriptional potential of NFATs
To investigate the influence of the co-regulator p300 on the NFAT family members, a second
assay was performed where p300 was co-transfected with NFATc1-4. HEK293 cells were
transfected with 0.2 µg pCIneo-GBD2 or pCIneo-GBD2-NFATc1-4, 0.2 µg pCMVβ-NHA-p300
or with a p300 control consisting of 0.2 µg pCMVβ-NHA-p300 with pCIneo empty. The cells
were lysed after 24 hours, and the luciferase activity was measured with a luminometer and
normalized to the GBD control (figure 12).
In HEK293-c1 cells, the presence of overexpressed p300 gave rise to an overall increase of
luciferase activity of the NFATs compared to the assay where the transcription factors were
transfected alone. The smallest increase was observed for NFATc1 with a fold change of 30.
NFATc2, NFATc3, and NFATc4 have a fold change of 3540, 2940 and 6300, respectively. In
HEK293-c4 cells, it was found an overall increase of the transcriptional activation as well.
Interestingly, NFATc3 showed an increase in transactivational potential in the presence of
overexpressed p300 with an increase of fold change from 1.1 to 2.77. NFATc1, NFATc2, and
NFATc4 had a fold change of 0.25, 2.27 and 3.94, respectively. For both the HEK293c1 and -c4
cell all fold changes were found to be significant compared to NFAT or GBD without p300.

4 Results
41
Figure 12: Luciferase activity in HEK293 transfected with pCIneo-GBD2-NFATc1-4
in the presence of overexpressed p300. HEK293-c1 and HEK293-c4 were transfected
with pCIneo-GBD2-NFATc1-4 and pCMVβ-NHA-p300 and the luciferase activity was
measured after 24 hours. The values have been normalized to the GBD control; cells
transfected with pCIneo-GBD2 and pCMVβ-NHA-p300. The p300 control is cells
transfected with pCMVβ-NHA-p300 and pCIneo empty. * = p = 0.005-0.05 and **** = p
=< 0.00005. The error bars show the ±SEM, with n=12 for HEK293-c1 and n=9 for
HEK293-c4.
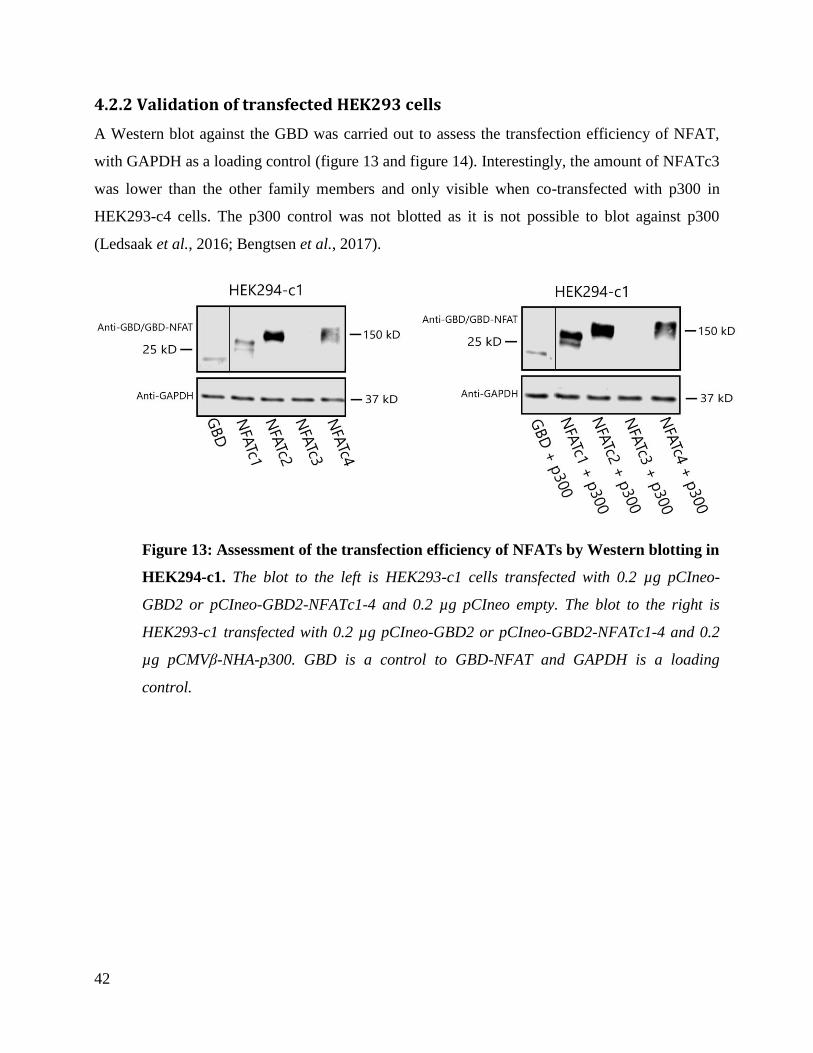
42
4.2.2 Validation of transfected HEK293 cells
A Western blot against the GBD was carried out to assess the transfection efficiency of NFAT,
with GAPDH as a loading control (figure 13 and figure 14). Interestingly, the amount of NFATc3
was lower than the other family members and only visible when co-transfected with p300 in
HEK293-c4 cells. The p300 control was not blotted as it is not possible to blot against p300
(Ledsaak et al., 2016; Bengtsen et al., 2017).
Figure 13: Assessment of the transfection efficiency of NFATs by Western blotting in
HEK294-c1. The blot to the left is HEK293-c1 cells transfected with 0.2 µg pCIneo-
GBD2 or pCIneo-GBD2-NFATc1-4 and 0.2 µg pCIneo empty. The blot to the right is
HEK293-c1 transfected with 0.2 µg pCIneo-GBD2 or pCIneo-GBD2-NFATc1-4 and 0.2
µg pCMVβ-NHA-p300. GBD is a control to GBD-NFAT and GAPDH is a loading
control.
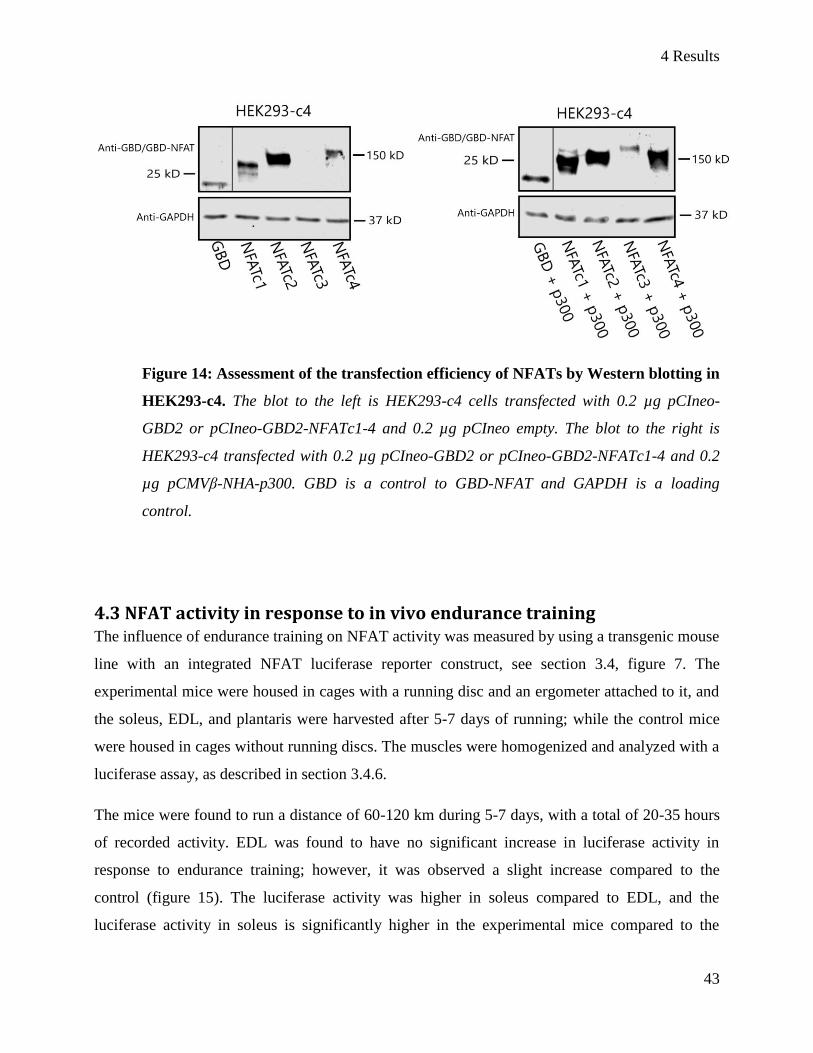
4 Results
43
Figure 14: Assessment of the transfection efficiency of NFATs by Western blotting in
HEK293-c4. The blot to the left is HEK293-c4 cells transfected with 0.2 µg pCIneo-
GBD2 or pCIneo-GBD2-NFATc1-4 and 0.2 µg pCIneo empty. The blot to the right is
HEK293-c4 transfected with 0.2 µg pCIneo-GBD2 or pCIneo-GBD2-NFATc1-4 and 0.2
µg pCMVβ-NHA-p300. GBD is a control to GBD-NFAT and GAPDH is a loading
control.
4.3 NFAT activity in response to in vivo endurance training The influence of endurance training on NFAT activity was measured by using a transgenic mouse
line with an integrated NFAT luciferase reporter construct, see section 3.4, figure 7. The
experimental mice were housed in cages with a running disc and an ergometer attached to it, and
the soleus, EDL, and plantaris were harvested after 5-7 days of running; while the control mice
were housed in cages without running discs. The muscles were homogenized and analyzed with a
luciferase assay, as described in section 3.4.6.
The mice were found to run a distance of 60-120 km during 5-7 days, with a total of 20-35 hours
of recorded activity. EDL was found to have no significant increase in luciferase activity in
response to endurance training; however, it was observed a slight increase compared to the
control (figure 15). The luciferase activity was higher in soleus compared to EDL, and the
luciferase activity in soleus is significantly higher in the experimental mice compared to the

44
control. Plantaris had the highest luciferase activity with more than 14 times higher activity
compared to the control, though unfortunate events led to the harvest of only 6 plantaris from 3
experimental mice and 8 plantaris from 5 control mice.
Figure 15: NFAT activity in response to endurance training. Luciferase activity in
EDL, soleus (SOL) and plantaris from both legs in NFAT luciferase reporter mice were
measured with a luciferase assay after 5-7 days of voluntary running in cages equipped
with a running disc and an ergometer. The luciferase activity is measured in RLU. N.s.
(not significant) = p > 0.05; * = p = 0.005-0.05; **** = p =< 0.00005. The error bars
show the ±SEM with n = 4 for control and n = 7 for experimental EDL; n = 7 for control
and n = 9 for experimental soleus; n = 5 for control and n = 3 for experimental plantaris.
4.4 The influence of endurance training on NFAT expression To investigate the expression levels of NFAT and their target genes in response to endurance
training of plantaris, a qPCR was run of the cDNA from plantaris of NMRI mice, as described in
section 3.4, 3.5 and 3.6. The experimental mice were housed in cages with a running disc and an
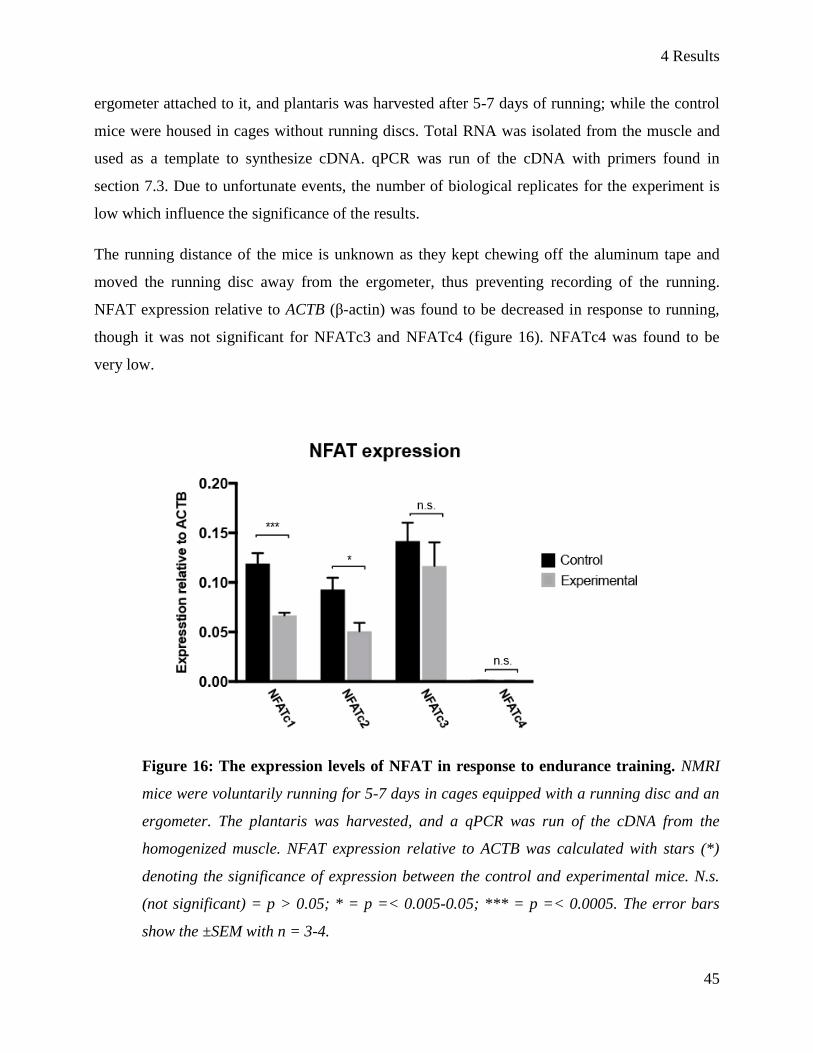
4 Results
45
ergometer attached to it, and plantaris was harvested after 5-7 days of running; while the control
mice were housed in cages without running discs. Total RNA was isolated from the muscle and
used as a template to synthesize cDNA. qPCR was run of the cDNA with primers found in
section 7.3. Due to unfortunate events, the number of biological replicates for the experiment is
low which influence the significance of the results.
The running distance of the mice is unknown as they kept chewing off the aluminum tape and
moved the running disc away from the ergometer, thus preventing recording of the running.
NFAT expression relative to ACTB (β-actin) was found to be decreased in response to running,
though it was not significant for NFATc3 and NFATc4 (figure 16). NFATc4 was found to be
very low.
Figure 16: The expression levels of NFAT in response to endurance training. NMRI
mice were voluntarily running for 5-7 days in cages equipped with a running disc and an
ergometer. The plantaris was harvested, and a qPCR was run of the cDNA from the
homogenized muscle. NFAT expression relative to ACTB was calculated with stars (*)
denoting the significance of expression between the control and experimental mice. N.s.
(not significant) = p > 0.05; * = p =< 0.005-0.05; *** = p =< 0.0005. The error bars
show the ±SEM with n = 3-4.

46
To further explore NFAT activity of plantaris in response to endurance training, the expression
levels of selected NFAT target genes and the NFAT interaction partner MEF2a was investigated
(figure 17). The expression levels of NFAT target genes indicate NFAT activity; however, the
results are not significant. Expression levels of MEF2a were significantly decreased in response
to endurance training.
Figure 17: The expression levels of MEF2a and NFAT target genes in response to
endurance training. NMRI mice were voluntarily running for 5-7 days in cages equipped
with a running disc and an ergometer. The plantaris was harvested, and a qPCR was run
of the cDNA from the homogenized muscle. Expression levels relative to ACTB was
calculated with stars (*) denoting the significance of expression between the control and
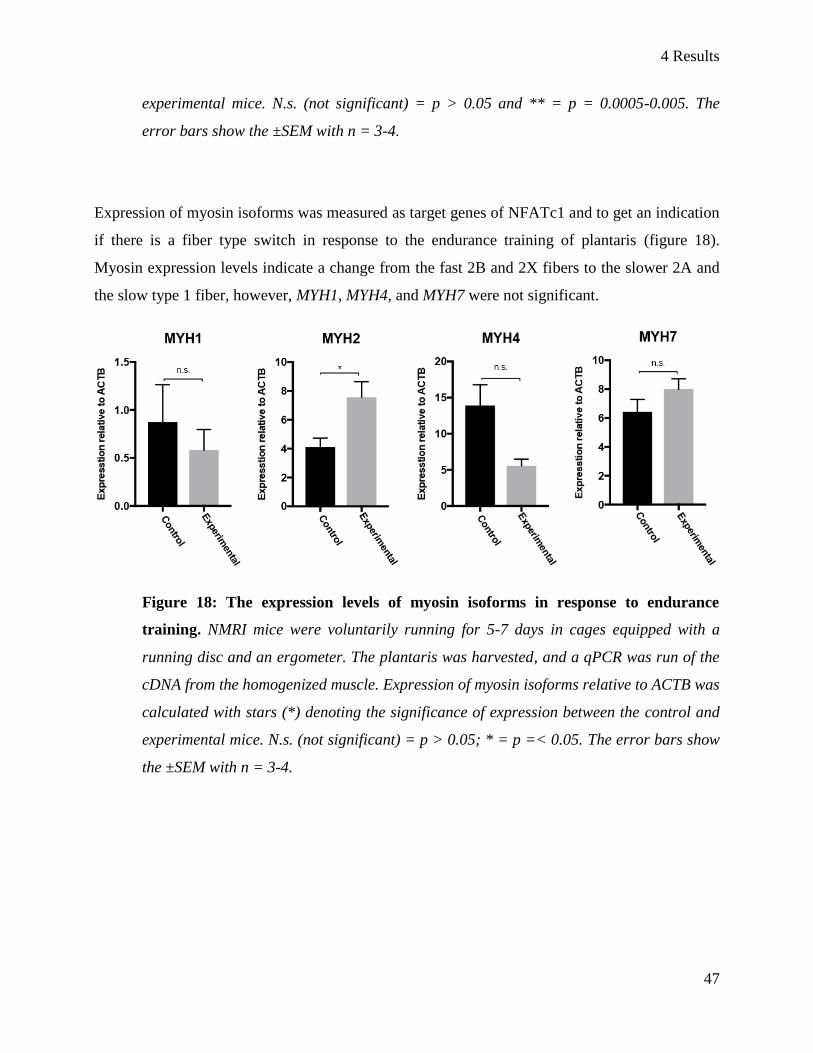
4 Results
47
experimental mice. N.s. (not significant) = p > 0.05 and ** = p = 0.0005-0.005. The
error bars show the ±SEM with n = 3-4.
Expression of myosin isoforms was measured as target genes of NFATc1 and to get an indication
if there is a fiber type switch in response to the endurance training of plantaris (figure 18).
Myosin expression levels indicate a change from the fast 2B and 2X fibers to the slower 2A and
the slow type 1 fiber, however, MYH1, MYH4, and MYH7 were not significant.
Figure 18: The expression levels of myosin isoforms in response to endurance
training. NMRI mice were voluntarily running for 5-7 days in cages equipped with a
running disc and an ergometer. The plantaris was harvested, and a qPCR was run of the
cDNA from the homogenized muscle. Expression of myosin isoforms relative to ACTB was
calculated with stars (*) denoting the significance of expression between the control and
experimental mice. N.s. (not significant) = p > 0.05; * = p =< 0.05. The error bars show
the ±SEM with n = 3-4.

48
5 Discussion
The thesis aims to explore and characterize the members of the NFAT transcription factor family
in skeletal muscle. This section evaluates and discusses the results obtained in the thesis as well
as the experimental procedures and future aspects.
5.1 The activation potential of NFATs NFATc1-4-GBD transfection of HEK293 c1 and c4 cell lines was performed to study the
transcriptional potential of the NFATs, see section 4.2 (Stielow et al., 2008). The experimental
setup uses the GBD fused to the TF of interest, to enable binding to a stably integrated
chromatinized GRE-binding sites located upstream of the luciferase gene, and hence can be used
to study the regulatory potential of the TF. HEK293-c1 has the GRE-luciferase domain in a
closed chromatin environment and requires transactivational potential to produce luciferase, and
thus the transactivational characteristics of a TF can be investigated. HEK293-c4 has the GRE-
luciferase domain in an open environment, and thus the basal activity in these cells is higher, and
the repressive potential of a TF can be investigated. The system is flawed in that it does not
entirely represent the transcriptional potential of a TF, as the regulatory role is dependent on
factors such as the affinity to DNA and its cooperation with other proteins at a specific locus,
both of which is affected by the affinity between GBD and GRE. Furthermore, by fusing GBD
with NFAT, the structure of the TF may alter, and thus affect the transcriptional potential.
However, the system is still a very useful tool to study the regulatory role of a TF.
The subcloning of the different GBD-NFAT constructs was successful, and all constructs were
able to be expressed, see below.
In HEK293-c1, NFATc2-4 shows an activating potential with NFATc4 as the most prominent
activator. NFATc1 shows only a slight increase in transcription relative to the other family
members. In HEK293-c4, NFATc2 and NFATc4 activated the transcription, while NFATc3 did
not induce a change in the transactivational activity and NFATc1 repressed the transcription.
The regulative potential found in the present study correlates with other studies that have found
NFATc1 to repress target genes in skeletal muscle or to inhibit other TFs to prevent transcription

5 Discussion
49
(Rana, Gundersen and Buonanno, 2008; Ehlers, Celona and Black, 2014). The low activation
potential of NFATc1 seen in HEK293-c1 is supported by previous reports of NFATc1 as a dose-
dependent activator of the Ache promoter in rat muscle, which may indicate a dual role of
NFATc1 as a weak transcriptional activator and also a repressor of target genes (Cohen and
Randall, 2004). NFATc2-4 were found to activate transcription, which is supported by findings
of NFAT as transcriptional activators of genes such as RCAN1 and MB (Wu et al., 2000; Lee et
al., 2009). Additionally, NFAT has been found to recruit the histone acetyltransferase p300 to
promoters, which is often associated with the opening of chromatin to facilitate transcription
(Wang, Marshall and Ikura, 2013). NFATc4 was the most potent activator and has former been
found present in all MyHC isoforms while NFATc1-3 have only been found present in type I, IIA
and IIX fibers (Calabria et al., 2009). This may suggest that NFATc4 is activating essential genes
that need to be constantly expressed in skeletal muscles. Subsequently, a high activating potential
enables a TF to respond quickly to external stimuli. One may speculate that NFATc4 has a role in
the regulation of fast response genes, a feature supported by the rapid activation and translocation
of NFAT in response to external Ca2+
stimuli; which is also seen by the NFAT related NF-κB/Rel
family of TF (Steinle et al., 1999).
5.1.1 The influence of p300 on NFAT Cotransfection of HEK293 c1 and c4 cell lines with NFATc1-4 and p300 was performed to study
the influence of p300 on the transcriptional potential of the NFATs in a chromatin context, see
section 4.2.1. The presence of overexpressed p300 increased the transcriptional potential of
NFATs, though NFATc1 remained lower than the other NFAT family members. A change of
transcription was expected as it has previously been found that p300 can interact with NFATc1
and NFATc2 through the TAD, and have also been found to be recruited by NFATc2 to
promoters in β-cells (Garcia-Rodriguez and Rao, 1998; Avots et al., 1999; Blaeser et al., 2000;
Lawrence et al., 2015). So far the regulatory role of p300 with NFATc3 and NFATc4 has not
been explored. Furthermore, there are no reports of the cooperation between p300 and NFAT in
the regulation of genes in a chromatin context, with the exception of NFATc2 in β-cells
(Lawrence et al., 2015). The low change in the transcriptional potential of NFATc1 cotransfected
with p300 was surprising, as a previous study has found that the TAD of NFATc1 is activated

50
and controlled by p300 in a dose-dependent manner, however this experiment was performed in a
conventional luciferase assay and not in a chromatin context (Avots et al., 1999). NFATc3 shows
no transcriptional potential in HEK293-c4; however, interestingly it becomes activated when
cotransfected with p300. Moreover, NFATc3 in the Western blot in section 4.2.2 is only
detectable in the presence of p300, and may suggest that NFATc3 is stabilized in the presence of
p300, a phenomenon seen for the TF c-Myb in previous studies (Ledsaak et al., 2016; Bengtsen
et al., 2017). Another suggestion is that NFATc3 may be involved in the early stages chromatin
remodeling to activate transcription of a gene, and thus only display a transcriptional activation in
HEK293-c1 as the luciferase is localized in a closed chromatin formation. Subsequently,
NFATc3 may recruit p300 to increase the transactivational activity further, as seen in HEK293-
c4 and HEK293-c1 when cotransfected with p300.
5.1.2 Transfection of HEK293 The integrity of transfection experiments can, in general, be difficult to assess as there are several
factors prone to variation, such as cell type, viability, and confluency (‘Factors Influencing
Transfection Efficiency - NO’, no date). To assess the efficiency of the transfection, a Western
blot was run, see section 4.2.2. The result showed the presence of NFATc1, NFATc2, and
NFATc4 during all experimental conditions. NFATc3 was only found in HEK293-c4 cells when
cotransfected with p300, even though the results from the transfection assay shows that NFATc3
has been successfully transfected in both the HEK293 c1 and c4. This is proposedly due to the
stability of the NFATc3 as discussed in the section above.
5.2 NFATs response to endurance training This section aims to discuss the NFAT activity in EDL, soleus, and plantaris in response to
voluntary endurance training, see section 4.3. The experimental setup has not been optimal and is
described in more details below. In our assay using the NFAT luciferase reporter mice, the EDL
shows little or no increase in NFAT activity in response to endurance training, which correlates
with another finding (Bugge, 2017). The highest basal expression of luciferase was found in
soleus, which is in correlation with other studies (Swoap et al., 2000; McCullagh et al., 2004;

5 Discussion
51
Bugge, 2017). This can be expected due to the high composition of slow fibers in soleus, where
NFAT is believed to play an important regulatory role in maintaining the slow phenotype (Chin
et al., 1998). Soleus has a significant increase in NFAT activity in response to endurance training,
which is in correlation with another finding (Bugge, 2017). Of the three muscles investigated,
plantaris had the lowest basal NFAT activity; however, it shows the most significant response to
endurance training. The high fold change in luciferase activity is surprising as plantaris is known
to be a fast muscle; hence the value was expected to be lower than in soleus. This may be
explained by its transition from a fast to slow phenotype, and thus the NFAT activity is increased
substantially before RCAN expression is increased by the proposed negative feedback loop
resulting in a reduction of the NFAT activity to a more stable level (Lee et al., 2009). Another
reason for the substantially elevated NFAT activity may be because plantaris is the main muscle
used when running, and thus the hypertrophy will be greater compared to EDL and soleus. In line
with this, NFAT has previously been suggested to induce muscle hypertrophy and may thus be
the causing factor for the elevated NFAT activity in plantaris (Musarò et al., 1999; Talmadge et
al., 2004; Oh et al., 2005; Sakuma et al., 2008).
In the future, the experiment needs to be repeated as the number of replicates is low for plantaris
(n = 3 for experimental mice, and n = 5 for control mice).
5.3 NFAT expression in response to endurance training This section aims to study the expression of the different NFAT family members in response to
voluntary exercise, see section 4.4. It is difficult to draw final conclusions of the data due to the
low number of replicates, and hence the experiment needs to be repeated. Furthermore, due to the
closure of the animal facility, the NMRI mouse strain was used instead of the NFAT luciferase
reporter mouse, which was inconvenient.
The results showed increased transcription of MYH2, MYH7 and the slow TNNI1, and a decrease
in expression of MYH1, MYH4 and the fast TNNI2 (Schiaffino and Reggiani, 2011). The data
indicate that the plantaris undergo a transition from the fast MYH4 fiber isoforms to the slower
MYH2 and MYH7 isoforms. Interestingly, the expression levels of NFAT in response to
endurance training were found to be decreased. One would expect the expression of NFAT to
52
accompany the increase of NFAT activity in plantaris found earlier, see above. Expression of the
NFAT target genes RCAN1, MB, and MYH7 were found to be increased, while MYH4 was
decreased, and thus indicate an increase of NFAT activity despite the decrease of expression (Wu
et al., 2000; Lee et al., 2009; Schiaffino and Reggiani, 2011). An explanation may be the
decrease of NFAT expression as a response by the RCAN negative feedback loop, consequently
to compensate for the increased nuclear NFAT and to stabilize the activity level (Lee et al.,
2009).
The expression of NFATc4 was found to be very low in both control and experimental mice. This
does not correlate with other findings as other studies have found NFATc4 expressed in skeletal
muscle, though there have been no studies of NFAT expression in plantaris (Calabria et al.,
2009). A reason for the low expression of NFATc4 may be linked to its strong activating potency
that is observed in vitro. Subsequently, one can speculate if activated NFATc4 may be less prone
to cellular degradation, and thus require fewer transcripts to maintain a stable level of the TF.
Another reason may be that NFATc4 may play a role in the regulation of genes that require a
strong means of regulation.
5.4 Endurance training setup Endurance training of the mice was performed using running discs in the setup displayed in
section 3.4.3. The setup opposes several problems in the determination of the running distance,
with the main issue of the individual differences between the mice. Additionally, a mouse that
prefers to run closer to the center of the disc will have a longer distance recorded on the
ergometer than a mouse that prefers to run closer to the rim. With this in mind, the time spent
running was measured as well as distance, even though the time can be misleading as the mouse
was found to frequently spend time playing on the running disc and activating the ergometer
without running. Furthermore, the magnet attached and running disc was frequently detached
from the surface and a day or two of running could be missed. This was especially a problem
with the NMRI mice used in the expression study, as they tended to chew through the aluminum
tape. This was not observed in the NFAT luciferase strain. Finally, there is a discrepancy in
resistance applied to the left and right leg due to the slight increase of resistance for the leg

5 Discussion
53
closest to the center of the disc. In summary, the most important aspect of the study is for the
mice to activate an intracellular change in response to endurance training. The experimental setup
has worked out well and interestingly, the luciferase activity was somehow similar between the
mice even though the above-mentioned issue.
5.5 Future study The present study has shed light on some new characteristics of NFAT in vitro, and in skeletal
muscle in vivo. Future studies of NFAT characteristics should be proceeded to elucidate the role
NFAT plays in the skeletal muscle. The NFAT family member responsible for the elevated
activity in response to endurance training should be identified to discover if there is a particular
NFAT that is more activated in response to training, or if all four NFATs are equally activated.
The genomic distribution of the NFAT members can be identified through the use of chromatin
immunoprecipitation (ChIP). Furthermore, ChIP should be used to explore the co-localization
with other factors such as p300 and MEF2, and how it changes during training, both at target
genes and for the inserted luciferase gene in the NFAT luciferase reporter mice. To further study
the impact of each factor knock-down using small RNA interference or knock out of each factor
can be applied.
For future studies, it would be interesting to study NFAT expression in NFAT luciferase reporter
mice to correlate the expression with the activity, as it was not possible to do this in the present
study due to the close down of the animal facility. Subsequently, additional experiments should
be performed of the in vivo experiments of the present study, and it should be considered using
forced running on treadmills to overcome inter-animal differences, though this will most likely
apply more stress to the animal.
The proposed role of NFATc1 as a regulator of maintenance and switching to a slow fiber
phenotype is a point of interest for further studies. Measurements of luciferase at time intervals in
a prolonged period can increase our knowledge of the elevated NFAT activity in plantaris. It can
indicate if the activity is persistent, or if it is mainly activated in the early stages of slow fiber
transition. Subsequently, it should be investigated if 5-7 days of running is substantial for a
change of fiber phenotype. This can be carried out by staining a cross-section area of plantaris
54
with antibodies against the different fiber-type isoforms and observe it with a microscope.
Furthermore, the NFAT activity in plantaris in response to resistance training should be studied to
get a better understanding of the increase in NFAT activity is caused by hypertrophy as opposed
to a fiber-type change.
5.6 Conclusions 1) NFATc1 has a repressive and an activating effect on transcription, while NFATc2-4 only
have an activating effect.
2) Overexpression of p300 increases the transactivational activity of NFATc2-4 in vitro.
3) Voluntary exercise increases the transactivational activity of NFAT in soleus and plantaris
with the most prominent effect in the latter.
4) Voluntary exercise decreases the expression of NFATs in plantaris.

6 References
55
6 References
Allen, D. G. and Westerblad, H. (2001) ‘Role of phosphate and calcium stores in muscle fatigue’,
Journal of Physiology. doi: 10.1111/j.1469-7793.2001.t01-1-00657.x.
Avots, A. et al. (1999) ‘CBP/p300 integrates Raf/Rac-signaling pathways in the transcriptional
induction of NF-ATc during T cell activation’, Immunity. doi: 10.1016/S1074-7613(00)80051-5.
Bengtsen, M. et al. (2017) ‘The adaptor protein ARA55 and the nuclear kinase HIPK1 assist c-
Myb in recruiting p300 to chromatin’, Biochimica et Biophysica Acta - Gene Regulatory
Mechanisms. doi: 10.1016/j.bbagrm.2017.05.001.
Blaeser, F. et al. (2000) ‘Ca2+-dependent gene expression mediated by MEF2 transcription
factors’, Journal of Biological Chemistry. doi: 10.1074/jbc.275.1.197.
Bugge, R. (2017) ‘Differences in skeletal muscle NFAT activity in response to strength- and
endurance training’, Master thesis.
Calabria, E. et al. (2009) ‘NFAT isoforms control activity-dependent muscle fiber type
specification’, Proceedings of the National Academy of Sciences. doi: 10.1073/pnas.0812911106.
Chakkalakal, J. V et al. (2003) ‘Expression of utrophin A mRNA correlates with the oxidative
capacity of skeletal muscle fiber types and is regulated by calcineurin/NFAT signaling.’,
Proceedings of the National Academy of Sciences of the United States of America. doi:
10.1073/pnas.0932671100.
Cheung, W. Y. (1980) ‘Calmodulin plays a pivotal role in cellular regulation.’, Science. doi:
10.1126/science.6243188.
Chin, E. R. et al. (1998) ‘A calcineurin-dependent transcriptional pathway controls skeletal
muscle fiber type.’, Genes & development. doi: 10.1101/gad.12.16.2499.
Chin, E. R. and Allen, D. G. (1996) ‘The role of elevations in intracellular [Ca2+] in the
development of low frequency fatigue in mouse single muscle fibres’, Journal of Physiology. doi:
10.1113/jphysiol.1996.sp021259.
Chow, C. W. et al. (1997) ‘Nuclear accumulation of NFAT4 opposed by the JNK signal
transduction pathway’, Science. doi: 10.1126/science.278.5343.1638.
Chytil, M. and Verdine, G. L. (1996) ‘The Rel family of eukaryotic transcription factors’,
Current Opinion in Structural Biology. doi: 10.1016/S0959-440X(96)80100-X.
Coffey, V. G. and Hawley, J. A. (2007) ‘The molecular bases of training adaptation’, Sports
Medicine. doi: 10.2165/00007256-200737090-00001.
Cohen, T. V. and Randall, W. R. (2004) ‘NFATc1 activates the acetylcholinesterase promoter in
rat muscle’, Journal of Neurochemistry, 90(5), pp. 1059–1067. doi: 10.1111/j.1471-
4159.2004.02564.x.

56
Crabtree, G. R. and Olson, E. N. (2002) ‘NFAT signaling: Choreographing the social lives of
cells’, Cell. doi: 10.1016/S0092-8674(02)00699-2.
Ehlers, M. L., Celona, B. and Black, B. L. (2014) ‘NFATc1 controls skeletal muscle fiber type
and is a negative regulator of MyoD activity’, Cell Reports. doi: 10.1016/j.celrep.2014.08.035.
Eken, T. and Gundersen, K. (1988) ‘Electrical stimulation resembling normal motor???unit
activity: effects on denervated fast and slow rat muscles.’, The Journal of Physiology. doi:
10.1113/jphysiol.1988.sp017227.
Fabiato, A. (1983) ‘Calcium-induced release of calcium from the cardiac sarcoplasmic
reticulum.’, The American journal of physiology. doi: 10.1016/0022-2828(92)90114-F.
‘Factors Influencing Transfection Efficiency - NO’ (no date). Available at:
https://www.thermofisher.com/no/en/home/references/gibco-cell-culture-basics/transfection-
basics/factors-influencing-transfection-efficiency.html (Accessed: 18 June 2018).
Garcia-Rodriguez, C. and Rao, A. (1998) ‘Nuclear factor of activated T cells (NFAT)-dependent
transactivation regulated by the coactivators p300/CREB-binding protein (CBP)’, J Exp Med.
doi: 10.1084/jem.187.12.2031.
Gomez del Arco, P. et al. (2000) ‘A role for the p38 MAP kinase pathway in the nuclear shuttling
of NFATp’, J Biol Chem. doi: 275/18/13872 [pii].
Gorza, L. et al. (1988) ‘Slow-to-fast transformation of denervated soleus muscles by chronic
high-frequency stimulation in the rat.’, The Journal of Physiology, 402(1), pp. 627–649. doi:
10.1113/jphysiol.1988.sp017226.
Graef, I. A. et al. (2001) ‘Signals transduced by Ca(2+)/calcineurin and NFATc3/c4 pattern the
developing vasculature.’, Cell. doi: 10.1016/S0092-8674(01)00396-8.
Gundersen, K. (2011) ‘Excitation-transcription coupling in skeletal muscle: The molecular
pathways of exercise’, Biological Reviews. doi: 10.1111/j.1469-185X.2010.00161.x.
Harrison, S. C. (1991) ‘A structural taxonomy of DNA-binding domains’, Nature. doi:
10.1038/353715a0.
Hashimoto, Y., King, M. M. and Soderling, T. R. (1988) ‘Regulatory Interactions of Calmodulin-
Binding Proteins: Phosphorylation of Calcineurin by Autophosphorylated Ca2+/calmodulin-
dependent Protein Kinase II’, Proceedings of the National Academy of Sciences, 85(18), pp.
7001–7005. doi: 10.1073/pnas.85.18.7001.
Hoey, T. et al. (1995) ‘Isolation of two new members of the NF-AT gene family and functional
characterization of the NF-AT proteins’, Immunity. doi: 10.1016/1074-7613(95)90027-6.
Hogan, P. G. et al. (2003) ‘Transcriptional regulation by calcium, calcineurin, and NFAT’, Genes
and Development. doi: 10.1101/gad.1102703.
Horsley, V. et al. (2001) ‘Regulation of the growth of multinucleated muscle cells by an
NFATC2-dependent pathway’, Journal of Cell Biology. doi: 10.1083/jcb.153.2.329.
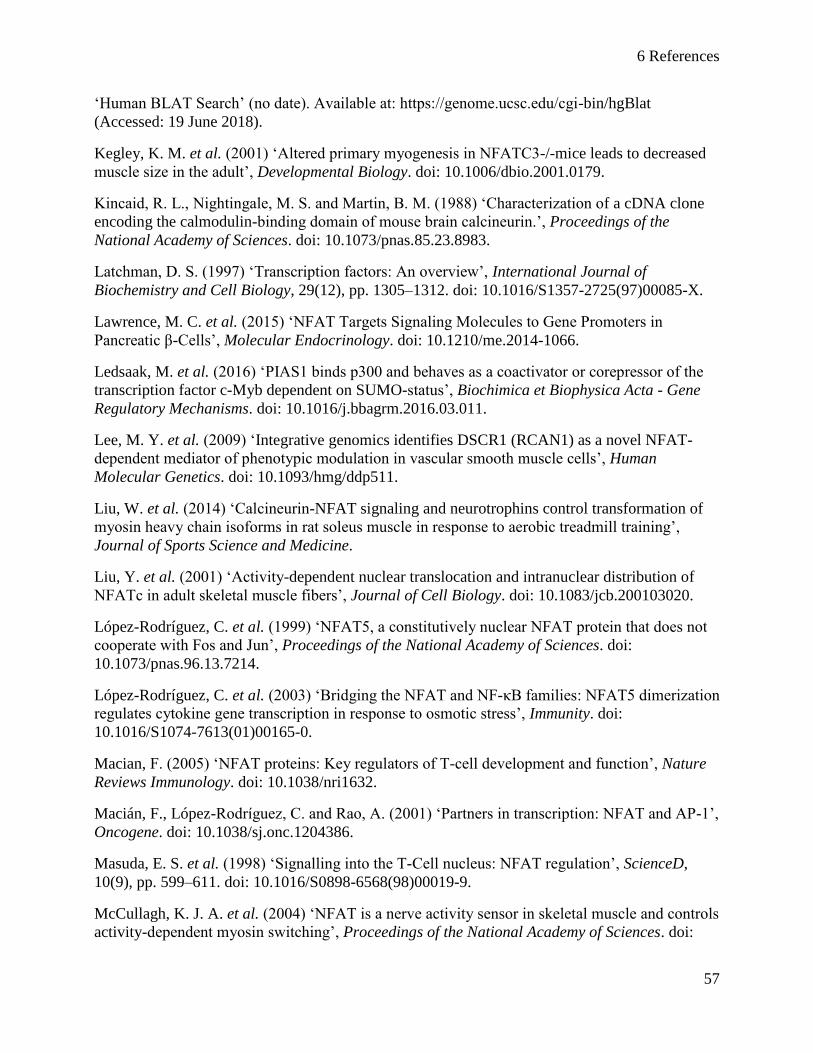
6 References
57
‘Human BLAT Search’ (no date). Available at: https://genome.ucsc.edu/cgi-bin/hgBlat
(Accessed: 19 June 2018).
Kegley, K. M. et al. (2001) ‘Altered primary myogenesis in NFATC3-/-mice leads to decreased
muscle size in the adult’, Developmental Biology. doi: 10.1006/dbio.2001.0179.
Kincaid, R. L., Nightingale, M. S. and Martin, B. M. (1988) ‘Characterization of a cDNA clone
encoding the calmodulin-binding domain of mouse brain calcineurin.’, Proceedings of the
National Academy of Sciences. doi: 10.1073/pnas.85.23.8983.
Latchman, D. S. (1997) ‘Transcription factors: An overview’, International Journal of
Biochemistry and Cell Biology, 29(12), pp. 1305–1312. doi: 10.1016/S1357-2725(97)00085-X.
Lawrence, M. C. et al. (2015) ‘NFAT Targets Signaling Molecules to Gene Promoters in
Pancreatic β-Cells’, Molecular Endocrinology. doi: 10.1210/me.2014-1066.
Ledsaak, M. et al. (2016) ‘PIAS1 binds p300 and behaves as a coactivator or corepressor of the
transcription factor c-Myb dependent on SUMO-status’, Biochimica et Biophysica Acta - Gene
Regulatory Mechanisms. doi: 10.1016/j.bbagrm.2016.03.011.
Lee, M. Y. et al. (2009) ‘Integrative genomics identifies DSCR1 (RCAN1) as a novel NFAT-
dependent mediator of phenotypic modulation in vascular smooth muscle cells’, Human
Molecular Genetics. doi: 10.1093/hmg/ddp511.
Liu, W. et al. (2014) ‘Calcineurin-NFAT signaling and neurotrophins control transformation of
myosin heavy chain isoforms in rat soleus muscle in response to aerobic treadmill training’,
Journal of Sports Science and Medicine.
Liu, Y. et al. (2001) ‘Activity-dependent nuclear translocation and intranuclear distribution of
NFATc in adult skeletal muscle fibers’, Journal of Cell Biology. doi: 10.1083/jcb.200103020.
López-Rodríguez, C. et al. (1999) ‘NFAT5, a constitutively nuclear NFAT protein that does not
cooperate with Fos and Jun’, Proceedings of the National Academy of Sciences. doi:
10.1073/pnas.96.13.7214.
López-Rodríguez, C. et al. (2003) ‘Bridging the NFAT and NF-κB families: NFAT5 dimerization
regulates cytokine gene transcription in response to osmotic stress’, Immunity. doi:
10.1016/S1074-7613(01)00165-0.
Macian, F. (2005) ‘NFAT proteins: Key regulators of T-cell development and function’, Nature
Reviews Immunology. doi: 10.1038/nri1632.
Macián, F., López-Rodríguez, C. and Rao, A. (2001) ‘Partners in transcription: NFAT and AP-1’,
Oncogene. doi: 10.1038/sj.onc.1204386.
Masuda, E. S. et al. (1998) ‘Signalling into the T-Cell nucleus: NFAT regulation’, ScienceD,
10(9), pp. 599–611. doi: 10.1016/S0898-6568(98)00019-9.
McCullagh, K. J. A. et al. (2004) ‘NFAT is a nerve activity sensor in skeletal muscle and controls
activity-dependent myosin switching’, Proceedings of the National Academy of Sciences. doi:

58
10.1073/pnas.0308035101.
Meissner, J. D. et al. (2011) ‘Extracellular signal-regulated kinase 1/2-mediated phosphorylation
of p300 enhances myosin heavy chain I/{beta} gene expression via acetylation of nuclear factor
of activated T cells c1.’, Nucleic acids research. doi: 10.1093/nar/gkr162.
Mognol, G. P. et al. (2016) ‘Cell cycle and apoptosis regulation by NFAT transcription factors:
new roles for an old player.’, Cell death & disease. doi: 10.1038/cddis.2016.97.
Musarò, A. et al. (1999) ‘IGF-1 induces skeletal myocyte hypertrophy through calcineurin in
association with GATA-2 and NF-ATc1’, Nature. doi: 10.1038/23060.
‘Muscle Fiber Types and Muscle Actions’ (no date). Available at:
https://www.nestacertified.com/muscle-fiber-types-and-muscle-actions/ (Accessed: 19 June
2018).
Nakayama, M. et al. (1996) ‘Common core sequences are found in skeletal muscle slow- and
fast-fiber-type-specific regulatory elements.’, Molecular and cellular biology. doi:
10.1128/MCB.16.5.2408.
Naya, F. J. et al. (2000) ‘Stimulation of slow skeletal muscle fiber gene expression by calcineurin
in vivo’, Journal of Biological Chemistry. doi: 10.1074/jbc.275.7.4545.
Oh, M. et al. (2005) ‘Calcineurin is necessary for the maintenance but not embryonic
development of slow muscle fibers’, Mol.Cell Biol. doi: 10.1128/MCB.25.15.6629-6638.2005.
Parsons, S. A. et al. (2003) ‘Altered skeletal muscle phenotypes in calcineurin Aalpha and Abeta
gene-targeted mice’, Mol.Cell Biol. doi: 10.1128/MCB.23.12.4331–4343.2003.
Parsons, S. A. et al. (2004) ‘Genetic loss of calcineurin blocks mechanical overload-induced
skeletal muscle fiber type switching but not hypertrophy’, Journal of Biological Chemistry. doi:
10.1074/jbc.M313800200.
Perroud, J. et al. (2017) ‘Distinct roles of NFATc1 and NFATc4 in human primary myoblast
differentiation and in the maintenance of reserve cells’, pp. 3083–3093. doi: 10.1242/jcs.198978.
Rana, Z. A., Gundersen, K. and Buonanno, A. (2008) ‘Activity-dependent repression of muscle
genes by NFAT’, Proceedings of the National Academy of Sciences. doi:
10.1073/pnas.0801330105.
Rao, A., Luo, C. and Hogan, P. G. (1997) ‘Transcription factors of the NFAT family: regulation
and function’, Annu Rev Immunol. doi: 10.1146/annurev.immunol.15.1.707.
Robbs, B. K. et al. (2008) ‘Dual roles for NFAT transcription factor genes as oncogenes and
tumor suppressors.’, Molecular and cellular biology. doi: 10.1128/MCB.00256-08.
Rusnak, F. and Mertz, P. (2000) ‘Calcineurin: Form and Function’, Physiological Reviews. doi:
10.1152/physrev.2000.80.4.1483.
Sakuma, K. et al. (2008) ‘Cyclosporin A modulates cellular localization of MEF2C protein and
blocks fiber hypertrophy in the overloaded soleus muscle of mice’, Acta Neuropathologica. doi:

6 References
59
10.1007/s00401-008-0371-5.
Schiaffino, S. and Reggiani, C. (1994) ‘Myosin isoforms in mammalian skeletal muscle’, Journal
of Applied Physiology. doi: 10.1152/jappl.1994.77.2.493.
Schiaffino, S. and Reggiani, C. (1996) ‘Molecular diversity of myofibrillar proteins: Gene
regulation and functional significance’, Physiol Rev.
Schiaffino, S. and Reggiani, C. (2011) ‘Fiber types in mammalian skeletal muscles.’,
Physiological reviews. doi: 10.1152/physrev.00031.2010.
Scott, J. E., Ruff, V. A. and Leach, K. L. (1997) ‘Dynamic equilibrium between calcineurin and
kinase activities regulates the phosphorylation state and localization of the nuclear factor of
activated T-cells’, The Biochemical journal.
Serrano, A. L. et al. (2001) ‘Calcineurin controls nerve activity-dependent specification of slow
skeletal muscle fibers but not muscle growth’, Proceedings of the National Academy of Sciences.
doi: 10.1073/pnas.231148598.
Shaw, J. P. et al. (1988) ‘Identification of a putative regulator of early T cell activation genes’,
Science. doi: 10.1126/science.3260404.
Spangenburg, E. E. and Booth, F. W. (2003) ‘Molecular regulation of individual skeletal muscle
fibre types’, in Acta Physiologica Scandinavica. doi: 10.1046/j.1365-201X.2003.01158.x.
Steinle, A. U. et al. (1999) ‘NF-κB/Rel activation in cerulein pancreatitis’, Gastroenterology. doi:
10.1016/S0016-5085(99)70140-X.
Stielow, B. et al. (2008) ‘SUMO-modified Sp3 represses transcription by provoking local
heterochromatic gene silencing’, EMBO Reports. doi: 10.1038/embor.2008.127.
Swoap, S. J. et al. (2000) ‘The calcineurin-NFAT pathway and muscle fiber-type gene
expression.’, American journal of physiology. Cell physiology.
Talmadge, R. J. et al. (2004) ‘Calcineurin activation influences muscle phenotype in a muscle-
specific fashion’, BMC Cell Biology. doi: 10.1186/1471-2121-5-28.
Thomas, M. C. and Chiang, C. M. (2006) ‘The general transcription machinery and general
cofactors.’, Critical reviews in biochemistry and molecular biology. doi:
10.1080/10409230600648736.
Thompson, J. F., Hayes, L. S. and Lloyd, D. B. (1991) ‘Modulation of firefly luciferase stability
and impact on studies of gene regulation’, Gene. doi: 10.1016/0378-1119(91)90270-L.
Timmerman, L. A. et al. (1996) ‘Rapid shuttling of NF-AT in discrimination of Ca2+ signals and
immunosuppression’, Nature. doi: 10.1038/383837a0.
Vihma, H., Pruunsild, P. and Timmusk, T. (2008) ‘Alternative splicing and expression of human
and mouse NFAT genes’, Genomics. doi: 10.1016/j.ygeno.2008.06.011.
Wang, F., Marshall, C. B. and Ikura, M. (2013) ‘Transcriptional/epigenetic regulator CBP/p300

60
in tumorigenesis: Structural and functional versatility in target recognition’, Cellular and
Molecular Life Sciences. doi: 10.1007/s00018-012-1254-4.
‘What is PCR?’ (no date). Available at: https://www.acsh.org/news/2016/10/11/what-pcr-
molecular-biology-lesson-10267 (Accessed: 19 June 2018).
‘What is Real-Time PCR (qPCR)?’ (no date). Available at: https://www.bio-rad.com/en-
no/applications-technologies/what-real-time-pcr-qpcr?ID=LUSO4W8UU (Accessed: 19 June
2018).
Wilkins, B. J. et al. (2004) ‘Calcineurin/NFAT Coupling Participates in Pathological, but not
Physiological, Cardiac Hypertrophy’, Circulation Research. doi:
10.1161/01.RES.0000109415.17511.18.
Wu, H. et al. (2000) ‘MEF2 responds to multiple calcium-regulated signals in the control of
skeletal muscle fiber type’, EMBO Journal. doi: 10.1093/emboj/19.9.1963.
Yang, T. T. C. et al. (2002) ‘Phosphorylation of NFATc4 by p38 Mitogen-Activated Protein
Kinases’, Molecular and cellular biology, 22(11), pp. 3892–3904. doi:
10.1128/MCB.22.11.3892.

7 Appendix
61
7 Appendix
7.1 Materials:
7.1.1 Solutions:
Solution Provider Catalog
DMEM Thermo Fisher Scientific 41965-039
Puromycin Thermo Fisher Scientific A11138-03
DPBS Thermo Fisher Scientific 14190-094
Trypsin-EDTA Thermo Fisher Scientific 25300-054
Trypan blue Thermo Fisher Scientific 15250061
Transfection reagent
(TransIT)
Mirus MIR 6010
TE buffer Qiagen 1018499
FBS Thermo Fisher Scientific A31608-01
PEN-STREP Lonza DE17-603E
SYBR-Green Roche 6402712001
Isoflurane Baxter
Ethanol Kemetyl
Phusion High-Fidelity
Buffer
BioLabs B0518S
Phusion High-Fidelity
Polymerase
BioLabs M0530S
DMSO Biolabs B0515A
LE Agarose (SeaKem) Lonza 50004
TAE-buffer Omega AC10088
Loading Dye Thermo Fisher Scientific R0611
GeneRuler 100 bp
Plus DNA Ladder
Thermo Fisher Scientific SM0323
GelRed Biotum 41003
RNAZap Ambion AM9780
T4 DNA Ligase BioLabs
1 Kb Plus DNA
Ladder
Thermo Fisher Scientific 10488090
Precision plus protein
standards
Bio-Rad 161-0375
Odyssey Blocking
Buffer
Licor 927-50100

62
Puromycin Thermo Fisher Scientific A1113802
SDS loading buffer Bio-Rad 1610302
FastStart Essential
DNA Green Master
Roche 06402712001
7.1.2 Kits:
Kit name Provider Catalog
Luciferase Assay System Promega E1500
RNeasy Fibrous Tissue Mini Kit Qiagen 74704
MinElute PCR Purification Qiagen 28004
QIAquick Gel Extraction Kit Qiagen 28704
SensiFAST Bioline BIO-65053
NucleoBond® Xtra plasmid
purification
Macherey-Nagel 740414.100
7.1.3 Restriction enzymes:
Enzyme Provider Catalog/Model
BamHI BioLabs R0136S
EcoRI BioLabs R0101S
PvuII BioLabs R0151S
XbaI BioLabs R0145S
NdeI BioLabs R0111S
KpnI BioLabs R0142S
7.1.4 Antibodies:
Antibody Provider Catalog/Model
Donkey anti-Mouse Licor C80108-05
Mouse anti-GAPDH Santa Cruz sc-47724
Mouse anti-GBD Santa Cruz
Biotechnology
RK5C1
7.1.5 Instruments:
Instrument Provider
NU-5510E NuAire
SW22 Julabo
TissueLyser II Qiagen
TD 20/20 Luminometer Turner Designs
DP8340 Star
MasterCycler Gradient Eppendorf
Hybrigene Techne

7 Appendix
63
Countess™, Automated Cell
Counter
Invitrogen
Isoflurane vaporiser MSS
Gas Evacuation System SurgiVet
Light Cycler 96 Roche
PowerPac Universal Bio-Rad
Nanodrop 2000 Thermo Fisher Scientific
Odyssey CLx Licor
CK2 Olympus
7.1.6 Software:
Software Provider
CLC workbench Quigen
Light Cycler 96 Roche
Primer Design Tool Eurofinsgenomics.eu
Image Studio Licor
Prism GraphPad
7.1.7 Materials:
Material Provider Catalog/Model
Running disc Trixie 60811
M2 WR VDO 3002
Camera Foscam C1
Glass tubes for luciferase Sarstedt 55.484.005
24-well tissue culture plate VWR 734-2325
Tissue culture flask VWR 734-2313
Immobilon-FL Merck IPFL00005
Whatman filter paper GE healthcare
96 Well Lightcycler Plate Sarstedt 72.1982.202
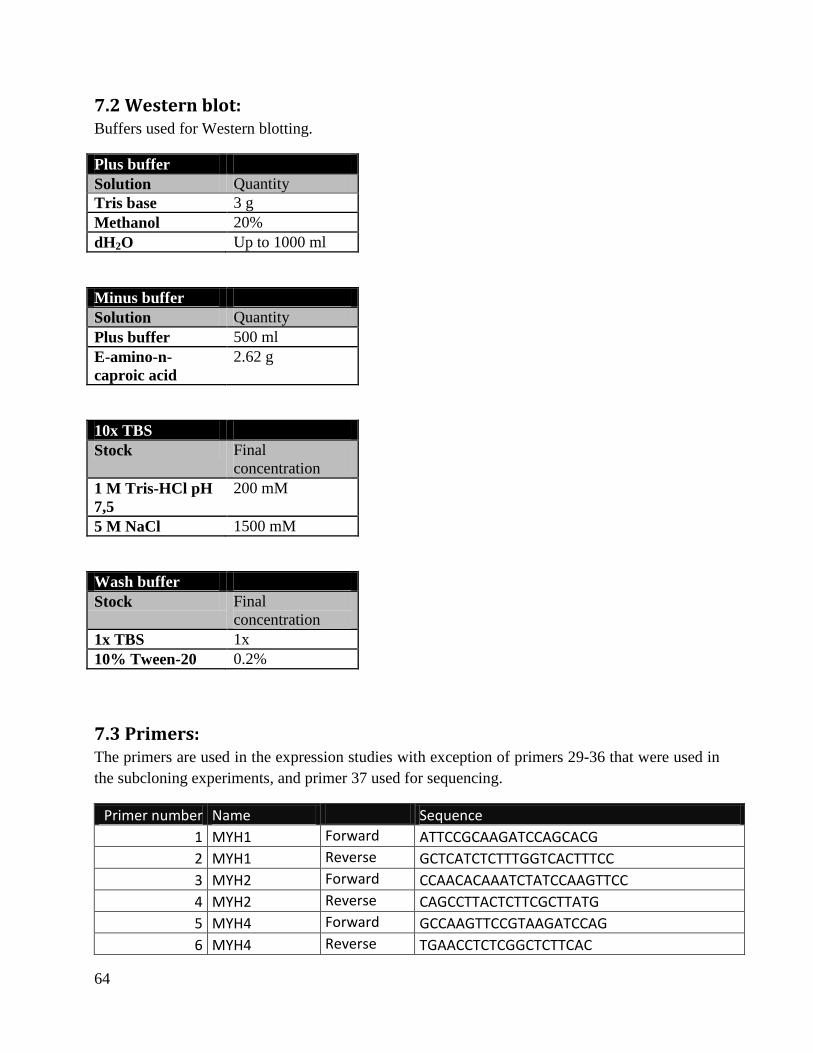
64
7.2 Western blot: Buffers used for Western blotting.
Plus buffer
Solution Quantity
Tris base 3 g
Methanol 20%
dH2O Up to 1000 ml
Minus buffer
Solution Quantity
Plus buffer 500 ml
E-amino-n-
caproic acid
2.62 g
10x TBS
Stock Final
concentration
1 M Tris-HCl pH
7,5
200 mM
5 M NaCl 1500 mM
Wash buffer
Stock Final
concentration
1x TBS 1x
10% Tween-20 0.2%
7.3 Primers: The primers are used in the expression studies with exception of primers 29-36 that were used in
the subcloning experiments, and primer 37 used for sequencing.
Primer number Name Sequence
1 MYH1 Forward ATTCCGCAAGATCCAGCACG
2 MYH1 Reverse GCTCATCTCTTTGGTCACTTTCC
3 MYH2 Forward CCAACACAAATCTATCCAAGTTCC
4 MYH2 Reverse CAGCCTTACTCTTCGCTTATG
5 MYH4 Forward GCCAAGTTCCGTAAGATCCAG
6 MYH4 Reverse TGAACCTCTCGGCTCTTCAC
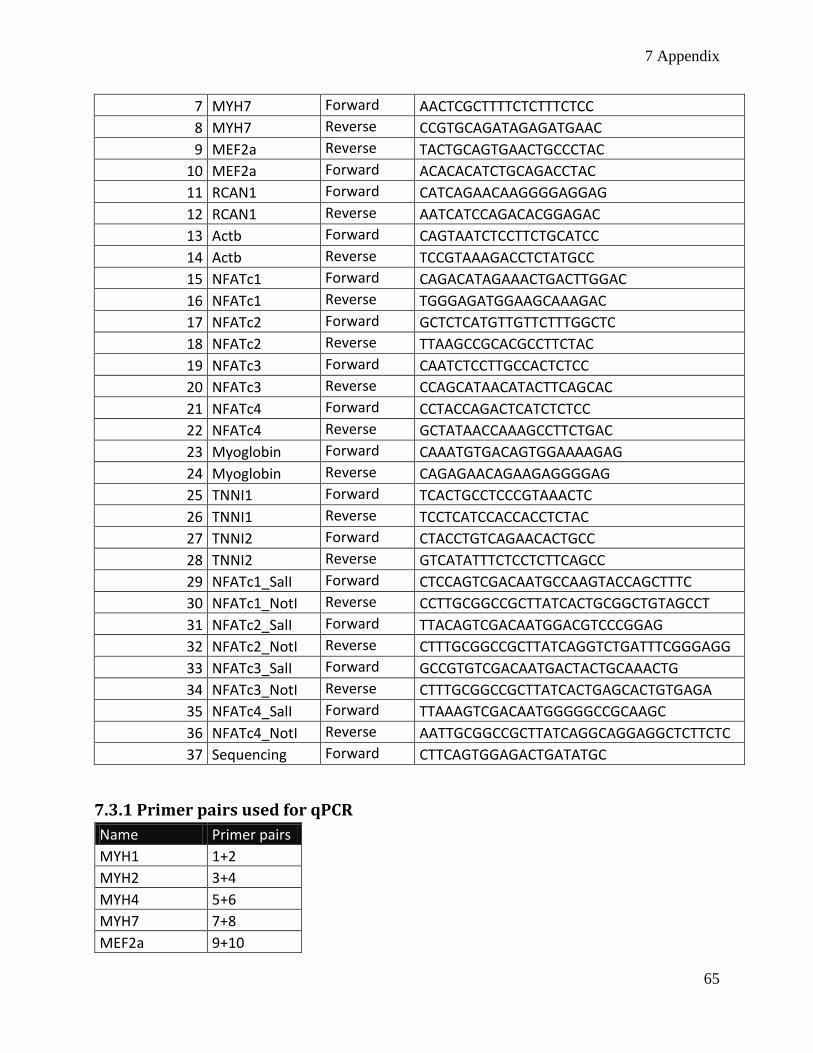
7 Appendix
65
7 MYH7 Forward AACTCGCTTTTCTCTTTCTCC
8 MYH7 Reverse CCGTGCAGATAGAGATGAAC
9 MEF2a Reverse TACTGCAGTGAACTGCCCTAC
10 MEF2a Forward ACACACATCTGCAGACCTAC
11 RCAN1 Forward CATCAGAACAAGGGGAGGAG
12 RCAN1 Reverse AATCATCCAGACACGGAGAC
13 Actb Forward CAGTAATCTCCTTCTGCATCC
14 Actb Reverse TCCGTAAAGACCTCTATGCC
15 NFATc1 Forward CAGACATAGAAACTGACTTGGAC
16 NFATc1 Reverse TGGGAGATGGAAGCAAAGAC
17 NFATc2 Forward GCTCTCATGTTGTTCTTTGGCTC
18 NFATc2 Reverse TTAAGCCGCACGCCTTCTAC
19 NFATc3 Forward CAATCTCCTTGCCACTCTCC
20 NFATc3 Reverse CCAGCATAACATACTTCAGCAC
21 NFATc4 Forward CCTACCAGACTCATCTCTCC
22 NFATc4 Reverse GCTATAACCAAAGCCTTCTGAC
23 Myoglobin Forward CAAATGTGACAGTGGAAAAGAG
24 Myoglobin Reverse CAGAGAACAGAAGAGGGGAG
25 TNNI1 Forward TCACTGCCTCCCGTAAACTC
26 TNNI1 Reverse TCCTCATCCACCACCTCTAC
27 TNNI2 Forward CTACCTGTCAGAACACTGCC
28 TNNI2 Reverse GTCATATTTCTCCTCTTCAGCC
29 NFATc1_SalI Forward CTCCAGTCGACAATGCCAAGTACCAGCTTTC
30 NFATc1_NotI Reverse CCTTGCGGCCGCTTATCACTGCGGCTGTAGCCT
31 NFATc2_SalI Forward TTACAGTCGACAATGGACGTCCCGGAG
32 NFATc2_NotI Reverse CTTTGCGGCCGCTTATCAGGTCTGATTTCGGGAGG
33 NFATc3_SalI Forward GCCGTGTCGACAATGACTACTGCAAACTG
34 NFATc3_NotI Reverse CTTTGCGGCCGCTTATCACTGAGCACTGTGAGA
35 NFATc4_SalI Forward TTAAAGTCGACAATGGGGGCCGCAAGC
36 NFATc4_NotI Reverse AATTGCGGCCGCTTATCAGGCAGGAGGCTCTTCTC
37 Sequencing Forward CTTCAGTGGAGACTGATATGC
7.3.1 Primer pairs used for qPCR
Name Primer pairs
MYH1 1+2
MYH2 3+4
MYH4 5+6
MYH7 7+8
MEF2a 9+10

66
RCAN1 11+12
ACTB 13+14
NFATc1 15+16
NFATc2 17+18
NFATc3 19+20
NFATc4 21+22
Myoglobin 23+24
TNNI1 25+26
TNNI2 27+28
7.3.2 Primer pairs used for subcloning
Name Primer pairs
NFATc1 29+30
NFATc2 31+32
NFATc3 33+34
NFATc4 35+36