investment in indonesia what are the upcoming opportunities. energy.27 july2011.jakarta
TRANSCRIPT

Rajat Gupta, Consultant EPS Practice
Pradi Wigianto, Consultant EPS Practice
Investment in Indonesia: What are the upcoming opportunities ?
Investment Opportunities in:
ENERGY

2
Primary Objectives for Utilities by 2020
1. Increase Power Reliability
by minimizing interruptions in power delivery
2. Improve Energy Efficiency
by reducing waste in power delivery and energy losses
3. Accommodate Renewable Power
-
Prevent congestion on the power lines and interruptions
4. Preparing for Growing Power Load

3
Fuel Balance – Today and in 2020
Coal
Oil
Gas
Nuclear
Hydro
Wind
Solar, Other
Renewables
Coal
Oil
Gas
Nuclear
Hydro
Wind
Solar, Other
Renewables
0
5000
10000
15000
20000
25000
30000
2010 2020
Coal
Oil
Gas
Nuclear
Hydro
Wind
Solar, Other
Renewables
Coal
Oil
Gas
Nuclear
Hydro
Wind
Solar, Other
Renewables
0
5000
10000
15000
20000
25000
30000
2010 2020
3%
Coal
Oil
Gas
Nuclear
Hydro
Wind
Solar, Other
Renewables
Coal
Oil
Gas
Nuclear
Hydro
Wind
Solar, Other
Renewables
0
5000
10000
15000
20000
25000
30000
2010 2020
7%

4
2010 2020 2015
Power Demand
Growth
Major
Trend
New Age of
Natural Gas
Renewable Grid
Parity
Clean Coal
Commercia-
lisation
Low demand in West
offset by boom in Middle East
Outlook for the Energy & Power Industry Top 10 World Power & Energy Trends over the Next Decade
Commercial CCS viability established
and large-scale development commences
Big expansion of
electric/hybrid vehicles
World electrification
reaches 80%
Non-OECD countries
Surpass OECD China becomes
largest consumer
CCGT favourite generation technology
Shale gas boom in USA
Growth in World
pipeline network Massive boost in
LNG availability
Gas demand peaks in OECD but
keeps growing elsewhere
Ultrasupercritical technology
becomes prevalent Worldly
Carbon Capture and Storage
Pilot Plants
Solar and wind reach grid parity
in some European markets Grid parity reached in
majority of developed world
Renewables share in power generation
25% Worldwide and 30% in EU
Market
Liberalisation Focus on emerging
markets retail liberalisation
Growing trans-regional
power trading
Most power generation markets
fully liberalised Towards a World
emissions trading system

5
2010 2020 2015 Major
Trend
Energy
Efficiency
Smarter Grids
Demand
Management
Energy Storage
Outlook for the Energy & Power Industry Top 10 World Energy & Water Trends over the Next Decade
World coverage for energy-
efficient lighting
Smart meters
taking off In US
and Europe
Boosting breakthrough
for electric vehicles
Expansion of virtual
power plants
Smart meters reach
most consumers in
developed world
Green buildings become norm
in developed world Grid investments lead to
reduction in T&D losses
Grid-scale energy storage such as
pumped storage and CAES takes off
Improved existing battery technologies emerge
such as Li-ion, Nickel-Zinc, and Molten Salt
World penetration of micro-
renewables and micro-CHP
Direct load control of smart
appliances via remote management
Smart meters optimise consumer
usage patterns and flatten peak demand Peak shaving through energy efficiency
and promotion of embedded generation

6
Electricity consumption in China = 550 billion
kWh in 1990
2008 = 2,200 billion kWh in 2008
Forecast to increase further to 6,000 billion
kWh by 2030.
China’s share of the global market will increase
by a staggering 15% from 5% in 1990 to 20%
in 2030.
Other developing regions also up - rest of
Asia’s up from 13% to 15%, Latin America’s
from 4% to 7% and India’s from 2% to 6%.
Asia-Pacific is likely to witness the largest increase in the Electricity consumption owing to the economic development in countries such as China, India and so on.
Regional Share of Electricity Consumption, 1990
Source: Frost &
Sullivan and EIA.
Regional Share of Electricity Consumption, 2008
Regional Share of Electricity Consumption, 2030
7
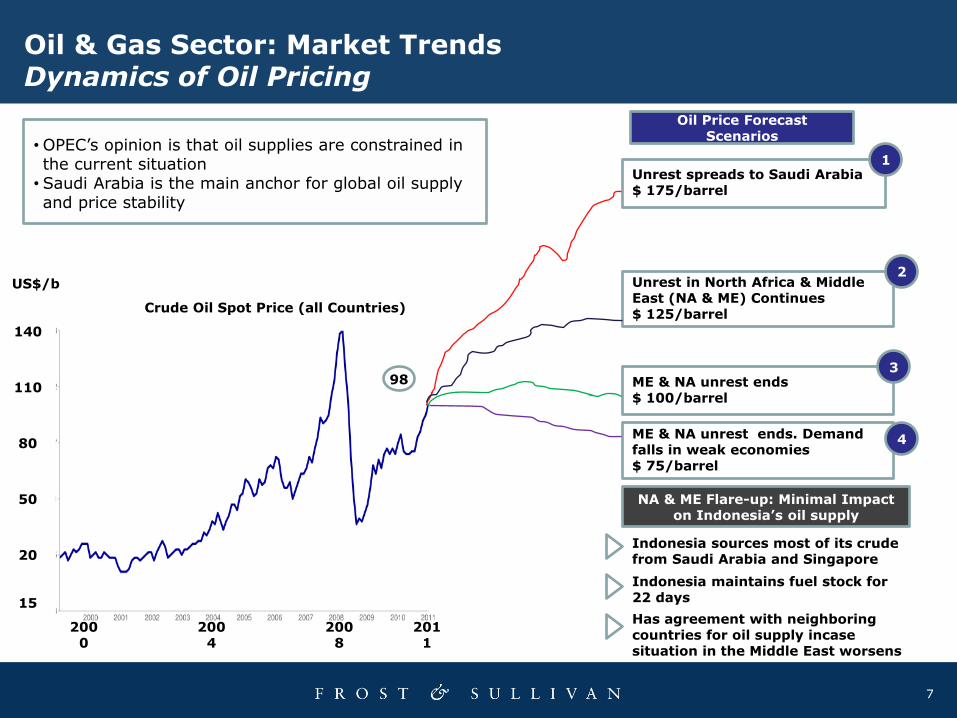
Oil & Gas Sector: Market Trends Dynamics of Oil Pricing
Unrest spreads to Saudi Arabia $ 175/barrel
ME & NA unrest ends $ 100/barrel
Unrest in North Africa & Middle East (NA & ME) Continues $ 125/barrel
•OPEC’s opinion is that oil supplies are constrained in the current situation • Saudi Arabia is the main anchor for global oil supply and price stability
ME & NA unrest ends. Demand falls in weak economies $ 75/barrel
140
110
80
50
20
15
98
Crude Oil Spot Price (all Countries)
2011
2008
2004
2000
Oil Price Forecast Scenarios
1
2
3
4
Indonesia maintains fuel stock for 22 days
Indonesia sources most of its crude from Saudi Arabia and Singapore
Has agreement with neighboring countries for oil supply incase situation in the Middle East worsens
NA & ME Flare-up: Minimal Impact on Indonesia’s oil supply
US$/b

8
Oil & Gas Sector: Market Trends Major Emerging Trends
Key Trend 1: Strong Demand Driving Prices Up
Middle East & North Africa unrest impacts supply and adds to speculation
Japan catastrophe to increase gas demand
Strong Demand from Asia
Shallow-water & Mature Onshore Fields Depleting
Domestic Demand Versus Import Commitments
Need to increase exploration efforts and work mature fields harder
Crude oil prices increase driving up subsidy bill
Indonesia

9 Source: Compiled by Frost & Sullivan
The gas reserves in relation to the size of the individual fields
There are around 6000 fields with reserves less than 5 trillion cubic feet (TCF). Most of them are considered stranded fields Stranded gas reserves refer to the natural gas, which have been discovered but cannot be developed due to their location disadvantage or negative economics of getting the natural gas delivered to the marketplace About 40% of global natural gas reserves are located far from the shores and are classified as stranded
• Floating LNG Terminals (FLNG) can monetize stranded reserves held in over 2500 gas fields containing 0.1 to 5 trillion TCF
Indonesia has identified 52 marginal fields (oil & gas) for development
Oil & Gas Sector: Market Trends Major Emerging Trends
Key Trend 2: The development of marginal fields

10
Source: Lambert Energy Advisory
Coal-Bed Methane (CBM) Potential, barrels of oil
equivalent
Shale Gas Potential, barrels of oil equivalent
US Shale Gas 100bn
US CBM 15bn+
Latin America Shale Gas 50-100bn
China Shale Gas 50-100bn
Europe Shale Gas 90bn Canada Shale Gas
20bn+
China CBM 75bn
Indonesia CBM 75bn
Australia CBM 40bn
Outlook for the Energy & Power Industry: Unconventional Gas World Hotspot (World), 2010
Outlook for the Energy & Power Industry Growth of Unconventional Gas

Outlook for Opportunities in Indonesia – Conventional Energy
Indonesia in the Global Context – Conventional Energy
Table of Contents – Conventional Energy
Contents
1
2

12
Key Opportunities in Indonesia
Sector Growth Commercial
Viability Time Frame
High Opportunity
Application
Coal VERY HIGH VERY HIGH NOW Production, CBM, CTL
and coal to gas
Natural Gas VERY HIGH HIGH NOW Exploration, production
FPSO and FSRU
LNG VERY HIGH HIGH NOW LNG plants
development, tankers
Oil HIGH VERY HIGH NOW Exploration and
production
Source: Frost & Sullivan analysis.

13
Opportunity Assessment – Energy Sector
Source: Frost & Sullivan analysis.
Sector Growth Commercial
potential Time Frame
High Opportunity Application
Electricity Power infrastructure
VERY HIGH HIGH NOW Gas and Coal
Gas Infrastructure and services
HIGH HIGH Next 1 – 3 years FPSO, FLNG, FSRT
Coal development HIGH HIGH NOW Low Calorie coal is rising
Oil Infrastructure and services
HIGH HIGH NOW Production equipment
Pipeline HIGH HIGH NOW Intercity gas distribution network
Brownfield services MODERATE to
HIGH MODERATE NOW Old oilfields
Fuel Infrastructure MODERATE MODERATE NOW Fuel station
Refinery facilities MODERATE HIGH NOW LPG and fuel
Drilling rigs MEDIUM HIGH Next 1 – 2 years Oil, Gas, CBM and geothermal
Decommissioning Services
Low MODERATE Next 3 – 5 years A lot of Indonesian oil gas
field are old fields with aging rigs and equipment
14
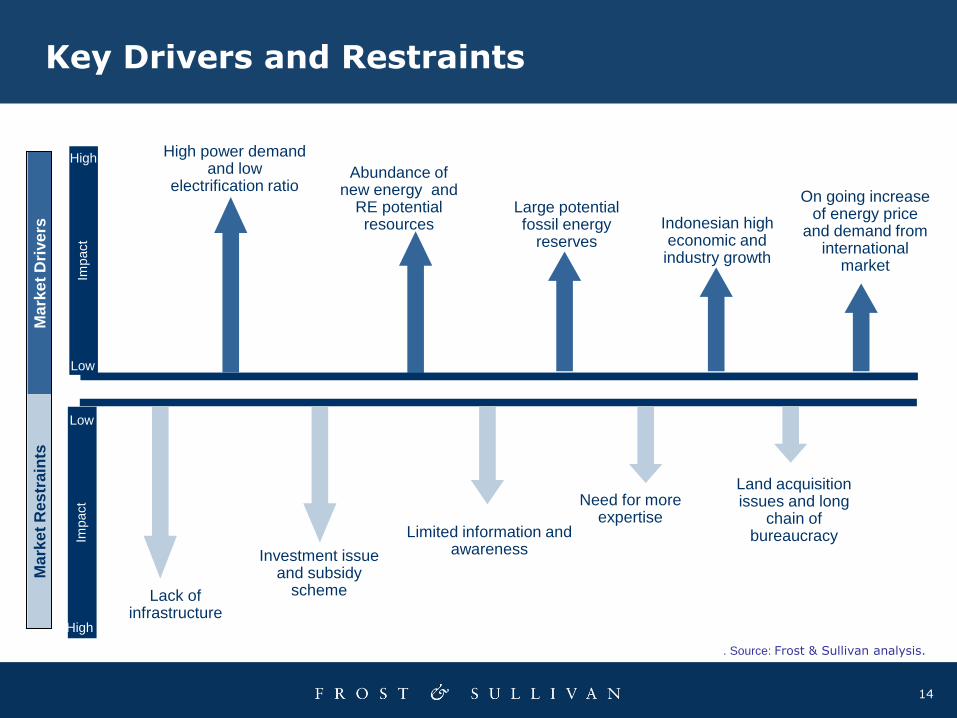
Key Drivers and Restraints Im
pact
Ma
rke
t D
rive
rs
Ma
rke
t R
es
train
ts
Impact
High power demand and low
electrification ratio Abundance of
new energy and RE potential resources
Investment issue and subsidy
scheme
Limited information and awareness
Lack of infrastructure
Low
High
High
Need for more expertise
Land acquisition issues and long
chain of bureaucracy
Large potential fossil energy
reserves Indonesian high economic and industry growth
On going increase of energy price
and demand from international
market
. Source: Frost & Sullivan analysis.
Low

15
Oil Energy Sector
Growth Potential 2011
0
1
2 3
4
5
5.0
1-2 Years 3-6 Years 7-10 Years
High
Growth
Medium
Growth
Low
Growth
• High power demand
• Industrial and automotive growth
• Conventional sources
Growth Factor
• Oil field exploration and production activities
• Oil production service provider
• Midstream and downstream sector
Opportunities
Source: Frost & Sullivan analysis.

16
Gas Energy Sector
Growth Potential 2011
0
1
2 3
4
5
5.0
1-2 Years 3-6 Years 7-10 Years
High
Growth
Medium
Growth
Low
Growth
• High power demand
• Industrial and automotive growth
• Decrease in oil production
Growth Factor
• Gas field exploration and production activities
• Gas production service provider
• CNG, LPG and LNG plant development
Opportunities
Source: Frost & Sullivan analysis.

17
Coal Energy Sector
Growth Potential 2011
0
1
2 3
4
5
5.0
1-2 Years 3-6 Years 7-10 Years
High
Growth
Medium
Growth
Low
Growth
• High power demand
• Industrial and automotive growth
• Decrease in oil production
Growth Factor
• Coal field exploration and production activities
• Coal production service provider
• Coal power plant development
Opportunities
Source: Frost & Sullivan analysis.

Indonesia in the Global Context – Conventional Energy
Outlook for Opportunities in Indonesia – Conventional Energy
Table of Contents – Conventional Energy
Contents
2
1
19 Source: Compiled by Frost & Sullivan
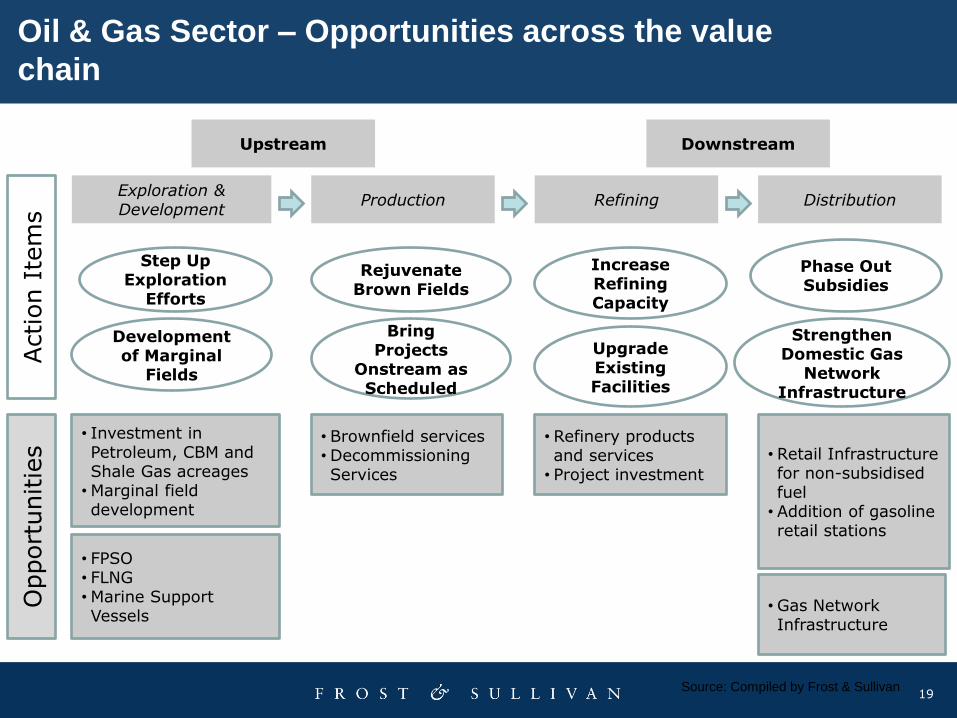
Exploration & Development
Refining
Downstream
Distribution
Oil & Gas Sector – Opportunities across the value
chain
Upstream
Production
Rejuvenate Brown Fields
Step Up Exploration
Efforts
Increase Refining Capacity
Phase Out Subsidies
Bring Projects
Onstream as Scheduled
Development of Marginal
Fields
Upgrade Existing Facilities
Strengthen Domestic Gas
Network Infrastructure
• Investment in Petroleum, CBM and Shale Gas acreages •Marginal field development
• FPSO • FLNG •Marine Support Vessels
• Brownfield services •Decommissioning Services
• Refinery products and services • Project investment
•Gas Network Infrastructure
• Retail Infrastructure for non-subsidised fuel • Addition of gasoline retail stations
Action I
tem
s
Opport
unitie
s

20
Environmental Impact Controversies
Restraining Growth of the Industry
Coal Seam Gas (CSG)/CBM to LNG
Projects
Commercial production of CBM is still at a nascent stage in Indonesia • The total CBM reserves in Indonesia is estimated to be 450 TCF • This is more than double its natural gas reserves and the world's second largest CBM reserves after
China. • At least 10 percent of these reserves can be extracted economically
Production Start-up in 2011; to be supplied to domestic power plants • By 2015, Indonesia’s total production of unconventional gas to reach 100 million cubic feet per day • By 2020, unconventional gas production to reach 500 million cubic feet per day • Unconventional gas and CBM are expected to account for 30.0 percent of Indonesia’s energy mix in
2025
Oil & Gas Sector: Unconventional Gas is set to emerge
as a viable option
Shale Gas Exploitation is a Possibility • Indonesia is estimated to have shale gas reserves of 1000 TCF • Shale gas can be produced in Indonesia by 2018 provided right steps are taken for harnessing this
energy resource.

21
Oil & Gas Sector: Exploration and Production Continue to remain a massive investment area
Tril
lio
n C
ub
ic
Mete
rs
0.0
1.0
2.0
3.0
4.0
5.0
6.0
2002 2003 2004 2005 2006 2007 2008 2009 2010
Oil Proved Reserves
Th
ou
san
d M
illio
n
Barrels
•More gas provinces to increase proven natural gas reserves • Unconventional gas to add to reserves •More investments in gas projects
• Falling Oil Reserves •Oil projects are more complex now
Total Upstream Exploration & Production Expenditure in Indonesia for 2011 is forecast to be US$ 17 billion. 1TCM=35.3TCF

22
Oil & Gas Sector: Offshore opportunities
Deepwater Potential: Tarakan basin; Papalan Basin
Thrust from Government for faster development of gas projects for
meeting domestic and export gas demand
East Kalimantan
Masela Block
10 TCF Reserves; water
depth 300m to 1000m
Inpex to invest $ 4.9 billion
For floating LNG plant (2.5
mmtpa) with production
start-up in 2016
Makassar Strait
Gehem, Gendalo, Gandang, Maha and Bangka fields
Chevron to developing East Kalimantan deepwater fields,
Gehem and Gendalo.
Invest ment $ 7 to 8 billion.
Plan Of Development approved
Source: Planning Dept, Govt of Indonesia; Petroleum Geo-Services ;
Compiled by Frost & Sullivan
Shallow Water
• Terang/Sirasun FPSO (TSB),
• Pagerungan
• Madura
• Kakap Natuna
• Bukit Tua
Deep Water
• Gehem
• Gendalo
• INPEX Masela FLNG
• Petramina FSRU
Prospective FPSO Projects

23
Location : Jakarta Bay, West Java Start up plan : 2012 Capacity : 3 MTPA Contractor : Golar LNG Energy
Location : East Java Start up plan : 2013-14 Capacity : 2-4 MTPA
Location : Belawan, North Sumatra Start up plan : 2013-14 Capacity : 3 MTPA
Oil & Gas Sector : Floating Storage Re-gas Storage Units (FSRU) Projects
24
Coal Production and Consumption
Source : Indonesian MOE (ESDM)
0
50
100
150
200
250
300
2005 2006 2007 2008 2009 2010
Mil
lio
n T
on
s
Production Export Domestic
Coal Sector: Production, Consumption and Export,
2005-2010
Increasing prices and unreliability over global coal supply, and rapid industrial growth of
Indonesia have led to expansion in both local and export market for coal
•Over half of local consumption
would be due to power generation
•Local coal companies are focusing
on low calorie coal which gaining
popularity in local market
•Kalimantan (60%) and Sumatra
(38%) have the largest reserves
•Significant opportunities exist in
Coal to Liquid (CTL), Coal Based
Methane (CBM) and Coal to gas
apart from coal mining
25
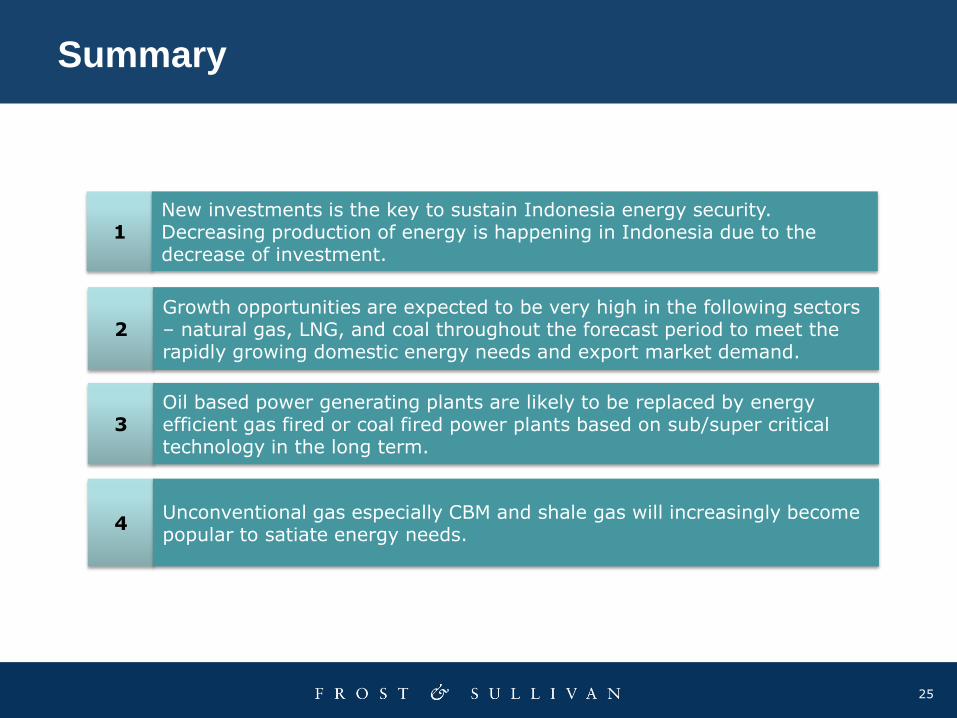
Summary
3 Oil based power generating plants are likely to be replaced by energy efficient gas fired or coal fired power plants based on sub/super critical technology in the long term.
4 Unconventional gas especially CBM and shale gas will increasingly become popular to satiate energy needs.
2 Growth opportunities are expected to be very high in the following sectors – natural gas, LNG, and coal throughout the forecast period to meet the rapidly growing domestic energy needs and export market demand.
1 New investments is the key to sustain Indonesia energy security. Decreasing production of energy is happening in Indonesia due to the decrease of investment.

Outlook for Opportunities in Indonesia – New and renewable energy
Indonesia in the Global Context – New and renewable energy
Table of Contents – New and Renewable Energy
Contents
1
2

27
Indonesia Power Sector – An Overview
Source: Frost & Sullivan analysis.
Installed Capacity Forecast, 2010 and 2030
Indonesia
2010 2030
Total Installed Capacity (GW)
40 110
PT PLN Ownership 75.0% 60.0%
IPP Ownership 25.0% 40.0%
Demand (GW) 60 120 0
20
40
60
80
100
120
140
2010 2030
Total Installed Capacity (GW) Demand (GW)
Installed Capacity Forecast, 2010 and 2030
Indonesia
• Oil dominates the country’s energy mix. Oil reserves are depleting, although gas and coal reserves have been
increasing.
• Part of energy prices are still subsidized which burdens the state budget and interferes the development of alternative
energy.
• Electrification ratio was about 66.0% in 2008, increased to 72.0% in 2010 and is expected to reach 80.0% by 2014.
• Total installed power capacity is 40,000 MW in 2010; nearly 75.0% percent of the country’s installed base is run buy
PLN and its subsidiaries, IPP accounts the rest of 25.0%.

28
Renewable Energy Potential in Indonesia
Renewable Energy Type Potential Resources Installed Capacity Underdeveloped Potential
Geothermal 28534 MW 1189 MW 92.5%
Hydro 75670 MW 5705.29 MW 95.80%
Mini / Micro Hydro 769.69 MW 217.89 MW 71.70%
Biomass 49810 MW 1618.40 MW 96.80%
Solar 4.8 kWh / m2 / day 13.5 MWp 99%
Wind 3 - 6 m/s 1.87 MW 99%
Uranium 3000 MWt 30 MWt 100%
Source: MOE ESDM, US Department of Commerce obtained from PLN

29
Key Opportunities in Indonesia
Sector Relevance Commercial
Viability Time Frame
High Opportunity
Application
Bioenergy VERY HIGH HIGH NOW Biomass, Biogas and
Biofuel
Geothermal VERY HIGH HIGH NOW On grid applications
Hydro Power VERY HIGH MODERATE NOW Large and Mini Hydro
Waste to Energy HIGH MODERATE Next 3-5 years Municipal and Industrial
waste to energy
Solar PV HIGH LOW Next 3-7 years Rural offgrid
applications
Wind Power MODERATE MODERATE Next 4-8 years
Small capacity wind
farms and potential
offshore
Nuclear Power MODERATE LOW Next 15 - 20 years Utility scale power plant
Source: Frost & Sullivan analysis.

30
Opportunity Assessment – Key Products
Equipment Growth Commercial potential Time Frame
High Opportunity
Application
Electricity Meters VERY HIGH MODERATE NOW Last mile meters especially in
rural areas
Cable & Wire HIGH HIGH NOW Will be mostly MV and LV
cables
Transformer HIGH HIGH NOW Transformer needs for MV
group
CBM and Shale Gas development
MODERATE HIGH Next 2 – 3 years Specialized production
equipment
Geothermal MODERATE HIGH NOW Specialized tools and
equipment
Boilers, heat exchangers, turbines and
related auxiliary equipment
MODERATE HIGH NOW Rural offgrid applications
Drilling rigs MODERATE HIGH Next 1 – 2 years CBM and geothermal
Battery LOW MODERATE Next 3 – 7 years For renewable energy source
power production and EV car
Power Storage LOW MODERATE Next 3 – 7 years For renewable energy source
power production
Solar Cell LOW MODERATE Next 2 – 5 years In rural marginal area
Wind Blade LOW MODERATE Next 5 - 10 years In rural marginal area

31
Geothermal Energy Sector
Growth Potential 2011
0
1
2 3
4
5
3.0
1-2 Years 3-6 Years 7-10 Years
High
Growth
Medium
Growth
Low
Growth
• High demand new and renewable energy for national power security
• Investment in geothermal exploration and production
• The second biggest geothermal sourcing
Growth Factor
• Geothermal field exploration and production activities
• Geothermal production service provider
• Geothermal power plant development
Opportunities
Source: Frost & Sullivan analysis.

32
Bioenergy Sector
Growth Potential 2011
0
1
2 3
4
5
2.5
1-2 Years 3-6 Years 7-10 Years
High
Growth
Medium
Growth
Low
Growth
• High demand new and renewable energy for national power security
• Investment in biofuel
• Investment in biomass power production facilities
• Petroleum reserves is depleting
Growth Factor
• Biomass power electricity production development
• Biofuel plant
• Biofuel transportation technology
• Biomass energy source production (e.g waste processing plant)
• Biomass and biofuel tools and equipment
Opportunities
Source: Frost & Sullivan analysis.

33
Hydropower Sector
Growth Potential 2011
0
1
2 3
4
5
2.5
1-2 Years 3-6 Years 7-10 Years
High
Growth
Medium
Growth
Low
Growth
• High demand new and renewable energy for national power security
• Investment in hydro and micro hydro power plant
• The biggest power energy source potential in Indonesia
Growth Factor
• Hydro power plant development
• Equipment and service in hydro power plant
• Micro hydro power plant is the most popular for hydro energy source
Opportunities
Source: Frost & Sullivan analysis.

34
CBM Sector
Growth Potential 2011
0
1
2 3
4
5
2.0
1-2 Years 3-6 Years 7-10 Years
High
Growth
Medium
Growth
Low
Growth
• The third biggest resources in the world
• Investment in CBM field production
• New source of energy for Indonesia
• Multi used as power source and LNG
Growth Factor
• CBM field exploration and production activities
• Starting of CBM production in 2012 will need CBM specialized tools and equipment
• CBM production service provider
• Additional LNG facilities to convert CBM to LNG
Opportunities
Source: Frost & Sullivan analysis.

35
Solar Energy Sector
Growth Potential 2011
0
1
2 3
4
5
1.0
1-2 Years 3-6 Years 7-10 Years
High
Growth
Medium
Growth
Low
Growth
• High demand new and renewable energy for national power security
• Investment in solar energy power source
• High potential in solar source
Growth Factor
• Solar PV equipment (solar cell, battery and power storage) producer and provider
• Solar PV equipment service maintenance provider
• Solar energy for power electricity investment
Opportunities
Source: Frost & Sullivan analysis.

36
Wind Energy Sector
Growth Potential 2011
0
1
2 3
4
5
0.5
1-2 Years 3-6 Years 7-10 Years
High
Growth
Medium
Growth
Low
Growth
• High demand new and renewable energy for national power security
• High domestic demand for power electricity
• Investment in wind energy power production
Growth Factor
• Wind energy equipment (blade, battery and power storage) producer and provider
• Wind energy equipment service maintenance provider
• Wind energy for power electricity investment
Opportunities
Source: Frost & Sullivan analysis.

37
Key Drivers and Restraints Im
pact
Ma
rke
t D
rive
rs
Ma
rke
t R
es
train
ts
Impact
High power demand and low
electrification ratio Abundance of
new energy and RE potential resources
Investment issue and subsidy
scheme
Limited information and awareness
Lack of infrastructure
Low
High
High
Need for more expertise
Land acquisition issues and long
chain of bureaucracy
Large potential fossil energy
reserves Indonesian high economic and industry growth
On going increase of energy price
and demand from international
market
. Source: Frost & Sullivan analysis.
Low

Outlook for Opportunities in Indonesia – New and renewable energy
Indonesia in the Global Context – New and renewable energy
Table of Contents – New and Renewable Energy
Contents
1
2

39
Indonesia Power Sector – Opportunities across the value chain
Source: Compiled by Frost & Sullivan
Transmission Generation
Increase electrification
ratio
Diversify fuel mix
Promote energy
efficiency
Demand management
Increase power supply
reliability
Ensure long term power
security
Customer satisfaction
• Investment in renewable energy •Geothermal and biomass to be the key sourced of renewable energy
• Focus on coal based power generation • Increase in coal mining • Hydro power
• Increase in T&D infrastructure
•Grid automation
• Smart metering/Remote meter reading
Action I
tem
s
Opport
unitie
s
Distribution
• Upgrade and maintenance of existing network
• Utility process automation
•Distribution infrastructure
40
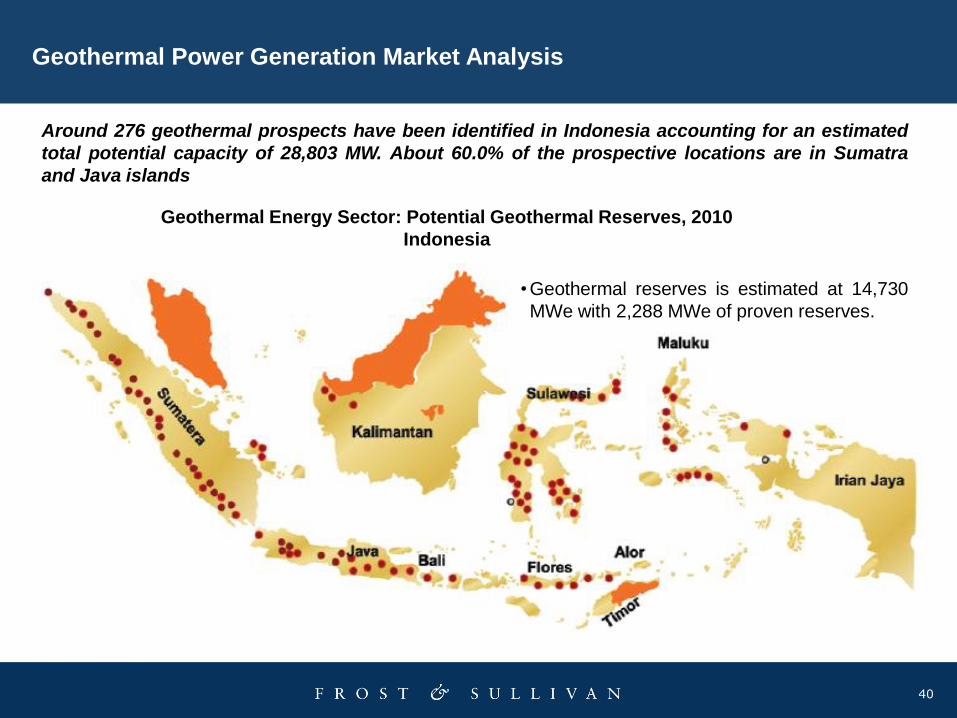
Around 276 geothermal prospects have been identified in Indonesia accounting for an estimated
total potential capacity of 28,803 MW. About 60.0% of the prospective locations are in Sumatra
and Java islands
Source: MOE (ESDM)
•Geothermal reserves is estimated at 14,730
MWe with 2,288 MWe of proven reserves.
Geothermal Energy Sector: Potential Geothermal Reserves, 2010
Indonesia
Geothermal Power Generation Market Analysis
41
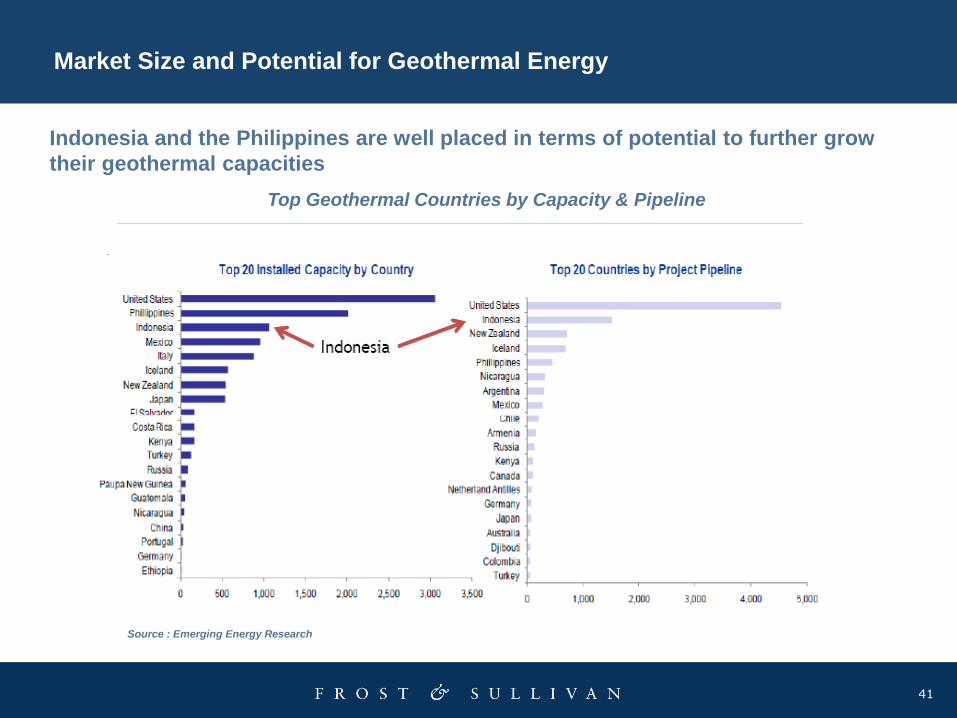
Indonesia and the Philippines are well placed in terms of potential to further grow
their geothermal capacities
Market Size and Potential for Geothermal Energy
Top Geothermal Countries by Capacity & Pipeline
Source : Emerging Energy Research

42
Summary
3 Feed in Tariff in power purchase agreement will become the most important factor
4 Geothermal and Biomass will be the key for short term investment. Hydropower will included for midterm investment. Whilst Solar, Wind and other source of RE will be the longer term investment
2 New and renewable energy will start to developed as government put their focus in this sector. Policies and incentives will boost the development of these energy sources.
1 The key in choosing investment in renewable energy sector will be eyeing the government focus in power infrastructure

Thank You

44
About Frost & Sullivan
Frost & Sullivan, the Growth Partnership Company, enables clients to accelerate growth and achieve best-in-class positions in growth, innovation and leadership. The company's Growth Partnership Service provides the CEO and the CEO's Growth Team with disciplined research and best-practice models to drive the generation, evaluation, and implementation of powerful growth strategies. Frost & Sullivan leverages 50 years of experience in partnering with Global 1000 companies, emerging businesses and the investment community from more than 40 offices on six continents. To join our Growth Partnership, please visit http://www.frost.com
Dewi Nuraini
Corporate Communications, Frost & Sullivan
Phone : (+6221) 571.0838 / 571.3246
Email : [email protected]
http://www.facebook.com/pages/Frost-Sullivan/
http://www.linkedin.com/companies/4506
http://www.slideshare.net/FrostandSullivan
http://twitter.com/frost_sullivan
http://twitter.com/FROST_ID
About Frost & Sullivan