investor perceptions of potential ifrs adoption in the united final round paper
TRANSCRIPT

INVESTOR PERCEPTIONS OF POTENTIAL IFRS ADOPTION IN THE UNITED
STATES
Philip JOOS
Department of Accountancy
Tilburg University
P.O. Box 90153, 5000 LE Tilburg, The Netherlands
TIASNimbas Business School
Edith LEUNG
Department of Accountancy
Tilburg University
P.O. Box 90153, 5000 LE Tilburg, The Netherlands
June 2012
We are grateful to John Harry Evans III (the editor), Wayne Thomas (the former editor) and two
anonymous referees for their constructive feedback and detailed suggestions. We also appreciate
helpful comments from Wayne Landsman, Christian Leuz, Peter Pope, Holly Skaife and seminar
participants at the 2010 AAA IAS midyear conference, 2010 EAA doctoral colloquium and
annual conference, the HMMT workshop at Maastricht University, Humboldt University and
Tilburg University.

INVESTOR PERCEPTIONS OF POTENTIAL IFRS ADOPTION IN THE UNITED
STATES
ABSTRACT: This paper examines the stock market reaction to 15 events relating to IFRS
adoption in the United States. The goal is to assess whether investors perceive the switch to
IFRS as beneficial or costly. Our findings suggest that investors’ reaction to IFRS adoption is
more positive in cases where IFRS is expected to lead to convergence benefits. Our results
also indicate a less positive market reaction for firms with higher litigation risk, which is
consistent with investors’ concerns about greater discretion and less implementation
guidance under IFRS for these firms. Overall, the findings are relevant to the current debate
on IFRS adoption in the U.S. and highlight the importance of convergence to investors.
Keywords: IFRS Adoption; Convergence; SEC.
Data Availability: All data are publicly available from the sources indicated in the paper
(see the Appendix).

1
I. INTRODUCTION
This study investigates to what degree the U.S. stock market reacted to public events
associated with the adoption of International Financial Reporting Standards (IFRS) by domestic
U.S. firms. On April 24, 2007, the Securities and Exchange Commission (SEC) announced it
was contemplating the mandatory use of IFRS by U.S. companies. The SEC’s motivation was
that U.S. investors would benefit from a single set of high-quality global standards. Although
several studies have documented positive effects of IFRS adoption in Europe (Barth et al. 2008;
Daske et al. 2008; Armstrong et al. 2010), it is unclear whether a switch to IFRS would be
beneficial in the U.S. Since current U.S. accounting standards (i.e., U.S. GAAP) and U.S.
reporting are generally considered to be of high quality (Leuz et al. 2003; Bradshaw et al. 2004),
the switch may not provide significant benefits in terms of “higher quality” financial reporting. It
is also unclear whether investors expect the switch to lead to convergence benefits, such as
reduced costs of comparing firms’ financial reporting globally (SEC 2008; Armstrong et al.
2010; Hail et al. 2010) and greater consistency of financial information by enabling auditors and
their clients to develop consistent global practices to deal with accounting issues (Tweedie
2006), especially since U.S. GAAP and IFRS have become increasingly similar in recent years.
This study provides empirical evidence on how investors evaluate the potential switch to
IFRS. We examine U.S. stock market reactions to events that affect the likelihood of IFRS
adoption, similarly to Christensen et al. (2007) and Armstrong et al. (2010).1 If investors perceive
IFRS adoption to be beneficial, we expect to observe a positive (negative) market reaction to
1 We focus on market reactions for two reasons. First, since the switch to IFRS was proposed by the SEC and its foremost mission is to protect investors, it makes sense to examine the benefits and costs from the investors’ viewpoint. This was explicitly stated by the SEC’s Chief Accountant, James Kroeker, at the 2009 AICPA conference. He stressed that “the fundamental focus of our evaluation of implementing a set of high quality international standards must be on the impact to investors. I believe that implementing a single set of global accounting standards for U.S. issuers can, and must, be done only in a manner that is beneficial to U.S. capital markets and consistent with the SEC’s mission of protecting investors” (Kroeker 2009). Second, since IFRS has not yet been adopted in the U.S., we cannot examine the direct effects of the standards on financial reporting outcomes.

2
events that increase (decrease) the likelihood of adoption. Our main analysis focuses on a
differential effect of IFRS adoption across U.S. firms for which we make three predictions. First,
we expect a lower market reaction if investors believe IFRS will adversely affect reporting
quality due to the lack of implementation guidance, which is a particular concern for firms in the
extractive and insurance industries and firms with high litigation risk. 2 Second, we predict that
investors will react more positively if they expect IFRS to result in convergence benefits, which
is more likely in industries where IFRS is already widely adopted by non-U.S. peer firms. Third,
we expect investors’ reaction to IFRS adoption to vary with the direct cost impact of introducing
these standards and focus on firms that currently report under both U.S. GAAP and those that
apply LIFO.
We identify 15 events between April 24, 2007 and January 15, 2009 that affected the
likelihood of IFRS adoption in the U.S. We use the cumulative three-day market-adjusted return
centered on each event date for a sample of U.S. firms to capture investors’ reactions to these
events. Indicator variables based on SIC codes are assigned to identify whether the firms are in
the insurance, extractive, or high-litigation-risk industries. We also expect investors in industries
where IFRS is most commonly used compared to other internationally used local standards to
benefit from convergence to a greater extent, since the potential reduction in information
processing costs is presumed to be larger for such industries (SEC 2008). Finally, we identify
whether a firm applies LIFO and whether it operates in countries that apply IFRS to examine the
potential costs and cost reductions associated with IFRS adoption.
Overall, we find a positive market reaction to the events that increase the likelihood of
adoption. We also find that the positive reaction is stronger if the adoption of IFRS is expected to
2 A “lower” market reaction indicates a less positive or more negative reaction, whereas a “higher” market reaction indicates a more positive or less negative reaction, i.e., we are referring to the algebraic direction and not the absolute magnitude of the impact.
3
result in convergence benefits, and weaker for firms with high litigation risk. However, the
findings do not show that investors in insurance or extractive firms are concerned about the lack
of industry-specific guidance, which is inconsistent with concerns put forward by the SEC and
FASB. In addition, we do not find that investors react more positively to IFRS adoption events if
cost reductions are expected and the market reaction is not lower for LIFO firms. Our results are
consistent with the view that convergence benefits matter to investors, and that the lower
implementation guidance under IFRS appears to be an issue for investors in high litigation risk
firms.
Although the study is subject to several caveats, such as the correct identification of events
and the assumption that investors respond rapidly to events, the findings are relevant to the
current debate on whether the SEC should move forward with the transition to IFRS, especially
given the scarcity of empirical evidence to guide this decision.3 The paper also contributes to the
recent literature on the economic consequences of IFRS adoption (e.g., Barth et al. 2008; Daske
et al. 2008; Armstrong et al. 2010) and provides evidence on the importance of convergence to
investors.
Next, Section II offers an overview of the events that affect the likelihood of IFRS adoption
in the U.S. The theoretical background is presented in Section III, Section IV discusses the
sample and variables, and the main results are presented in Section V. Section VI discusses the
sensitivity analyses, and Section VII provides concluding remarks.
II. EVENT HISTORY 3 We are aware of only one other study that examines the impact of IFRS in the U.S. Lin and Tanyi (2010) investigate market reactions to events relating to the general acceptance and use of IFRS. However, they focus on whether investors react to events that increase the use or acceptance of IFRS (e.g., their sample also includes events that capture convergence efforts between IASB and FASB) and they investigate only comparability. In contrast, this study focuses on the impact of IFRS adoption, since this is the key topic of debate in the U.S., and investigates several potential consequences for investors.

4
In the spring of 2007, the SEC announced for the first time that it was contemplating
allowing U.S. companies to use IFRS instead of U.S. GAAP. The SEC was motivated by a
longstanding desire to move to a single set of high-quality global accounting standards and by
the widespread adoption of IFRS in almost 120 countries to date (IASB 2011). The underlying
argument was that investors would benefit from such a move; for example, it would decrease the
costs of comparing financial reports on a global basis. However, previous studies suggest that
investors might not benefit significantly from this move (e.g., Hail et al. 2010), and there is little
empirical evidence to substantiate the SEC’s claims. This paper provides such evidence by
examining U.S. investors’ reactions to events that affect the likelihood of IFRS adoption in the
U.S. This methodology has also been used in previous studies to assess the perceived net benefits
or costs of new regulations for investors, including Christensen et al. (2007), Zhang (2007), and
Armstrong et al. (2010).
To identify the events, we searched the websites of the SEC, Financial Accounting Standards
Board (FASB), and International Accounting Standards Board (IASB) for relevant press
releases, announcements and meetings. For related news, we searched Factiva and LexisNexis
Academic Universe with the words “IFRS” and “U.S.” Table 1 shows the resulting list of 15
events occurring between April 24, 2007, when the SEC first announced plans to potentially
allow the use of IFRS reporting for U.S. firms, and January 15, 2009, when SEC chairperson
Mary Schapiro publicly expressed her doubts about the IFRS plans.4 We classify 13 events as
4 To the best of our knowledge, these are all of the relevant events within our sample period. We concentrate on events that are publicly observable or known, which makes it easier to attribute stock returns to these news events. Moreover, our focus is on investors’ perception of IFRS adoption specifically and thus on actions or news that relate directly to this. This is in line with the approach by Armstrong et al. (2010), who also focus specifically on events that affect the likelihood of adoption. We do not include earlier events such as convergence efforts between IASB and FASB, since we are unsure how to interpret these in our context and they were never explicitly mentioned as related to adoption of IFRS by U.S. firms. By contrast, we did include convergence events occurring after April 24, 2007, that directly relate to the adoption of IFRS. For instance, the elimination of the reconciliation requirement is included, because this was explicitly stated to be a step toward the adoption of IFRS by an SEC spokesperson.
5
increasing the likelihood of IFRS adoption, one event as decreasing it, and we have no
directional prediction for one event.
The first event occurred on April 24, 2007, when the SEC first announced that it was
considering whether U.S. issuers should switch to IFRS. The SEC had long been supportive of
the use of a single set of high-quality global accounting standards and now expressed the
intention to move in this direction (SEC 2007). The SEC announced a planned “Concept Release
relating to issues surrounding the possibility [of] providing U.S. issuers the alternative to use
IFRS.” At the time, the SEC was eliminating Form 20-F reconciliations for foreign firms that
prepared financial statements under IFRS as promulgated by the IASB. The SEC now decided
that switching from U.S. GAAP to IFRS would be the next critical step. The second event
occurred on August 7, 2007 when the SEC published the Concept Release, which discussed
reporting practices within and outside the U.S., potential IFRS benefits for the U.S. capital
market, and implementation issues, including the training of accountants in IFRS and whether to
adopt a transition period. We classify these two events as increasing the likelihood of IFRS
adoption.
The third event occurred on October 24, 2007 when the U.S. Senate Subcommittee on
Securities, Insurance and Investment held an open meeting about international accounting
standards.5 Its goal was to discuss the concept release and the proposed elimination of Form 20-F
reconciliations. Among those who testified were IASB chairman David Tweedie, FASB
chairman Robert Herz, representatives of the SEC, the American Institute of Certified Public
Accountants (AICPA), and the Emerging Issues Task Force (EITF). The general view was that a
switch to high-quality global standards would be beneficial after IFRS had been improved in
5 A webcast of the meeting and the testimonies are available at: http://banking.senate.gov/public/index.cfm?FuseAction=Hearings.Hearing&Hearing_ID=a96cc028-3b6d-4996-b849-768e83af35fc.

6
areas where it lacked standards and the differences between IFRS and U.S. GAAP were reduced
or eliminated.
In response to the Concept Release, the SEC received over 85 comment letters that were
published on its website. Among the respondents were the Big-4 accounting firms that strongly
supported the use of IFRS. The fourth set of events occurred on November 7, 2007 when FASB
chairman Robert Herz expressed the joint standpoint of the FASB and the Financial Accounting
Foundation (FAF) in a letter. In line with his earlier statement at the Senate hearing, Herz
expressed the FASB’s support for the move. He also gave specific suggestions on how to achieve
improvements in IFRS and the IASB’s governance and funding.6 On the same day, the IASB
trustees agreed that governance improvements were necessary. The IASB published the
discussion document on the proposed changes for public comment on July 21, 2008, which
marks the tenth event in our sample period.7 This document proposed establishing a monitoring
group consisting of securities regulators to oversee the actions of the IASB and approve any new
appointments to the board of the International Accounting Standards Committee Foundation
(IASCF) trustees. Since both the Senate hearing and the FASB/FAF response by Herz were
supportive of the adoption, and the IASB started to improve its governance system, we classify
all three events as increasing the likelihood of IFRS adoption.
The fifth event occurred on November 15, 2007 when the SEC finally approved elimination
of the Form 20-F reconciliation. This was a key step in moving toward IFRS because the
6 The concern was the IASB’s lack of accountability to a single securities regulator, similar to the FASB’s accountability to the SEC. This made it possible for countries to create adapted versions of IFRS, which went against the aim of the IASB to have a single set of global standards. In addition, the IASB was funded largely by the Big-4 accounting firms and voluntary donations from around 200 companies in contrast to the FASB being funded by public companies through SEC registration fees. This led to concerns that major IASB contributors might unduly influence the standard-setting process. Since the IASB’s funding and accountability was a major issue that needed to be addressed prior to the U.S. adoption of IFRS (SEC 2008), we view the announcement of governance improvements as an event that increased the likelihood of adoption. 7 We number our events in chronological order, not in order of when they are discussed in this section.

7
elimination proposal had led the SEC to consider IFRS for domestic companies (SEC 2007, 12).
The SEC’s Chief Accountant, Conrad Hewitt, called this decision “a small but significant step in
moving the U.S. to IFRS” (Hewitt 2008). We therefore classify this event as increasing the
likelihood of IFRS adoption.
Events six and seven occurred on December 13 and 17, 2007, when the SEC held
Roundtables on IFRS to discuss the role of IFRS in the U.S. capital markets and the impact on
U.S. issuers’ reporting. The participants were representatives from the investment community
and U.S. stock exchanges, accounting firms, underwriters, academics, and U.S. issuers. The first
roundtable focused on whether the U.S. should switch to IFRS for its domestic issuers, and the
second on how to structure the switch. The conclusion that emerged from both roundtables was
that there would certainly be benefits in the long run, in terms of higher comparability and
competition for capital, from moving to a single set of global accounting standards, which would
likely be IFRS. The panelists also agreed that the U.S. should not transition to IFRS without a
structured plan. This would give U.S. companies, auditors, investors, and regulators time to
prepare, and also allow the IASB trustees to improve IFRS in certain areas and to improve their
own organization in terms of independence, accountability, and governance. However, there was
no agreement on whether to mandate or allow IFRS, or when the transition should occur. There
were also concerns about jurisdictional adaptations of IFRS which were related to the IASB
governance problems. Despite these disagreements, the roundtables revealed clear support for
the switch. Therefore, we classify these events as increasing the likelihood of IFRS adoption.
The eighth event occurred on April 18, 2008 when SEC chairman Cox stated in an address to
the U.S. Chamber of Commerce that an official “roadmap” for the adoption of IFRS would be
released later that year, with more details on how the transition would be structured. The joint
8
FAF/FASB conference on June 16, 2008 marks the ninth event. Participants including investors,
auditors, educators, and issuers, voiced a need for a definite date and more information about the
potential adoption of IFRS, noting that without a definite date, key players would not start
preparing for the switch. Despite the ongoing financial crisis, during the SEC’s roundtable on
August 4, 2008 (event 11), participants discussing the performance of IFRS during the crisis and
its progress in general remained positive about an imminent transition. The 12th event occurred
on August 27, 2008 when the SEC presented outlines of the roadmap at an open meeting, and all
the SEC commissioners voted in favor of opening a public discussion of the roadmap. These four
events again show the SEC’s commitment to IFRS and the stakeholders’ desire for more
certainty about the timing and planning, and we classify them as increasing the likelihood of
IFRS adoption.
However, the financial institutions required to use IFRS reporting were hit particularly hard
by the subprime crisis. Since banks had to state certain assets at fair value and current market
prices had declined significantly during the crisis, they would have been required to impair many
of their assets. Largely due to political pressure from the European Commission and finance
ministers, and two days after the FASB issued its Staff Position 157-3 on the same accounting
issue, on October 13, 2008 the IASB hastily adapted its fair-value accounting standard IAS 39 to
give financial institutions more leeway in classifying financial assets out of fair value by
designating these as no longer held for sale, enabling firms to avoid these impairment losses.
Although the IASB explained the adaptation as an attempt to make IFRS and U.S. GAAP more
similar, its actions were deemed damaging to its credibility as an independent standard setter,
also because IASB adapted IAS 39 without the usual due process and transparent procedures
(Bothwell 2009). Although this event could be classified as decreasing the likelihood of IFRS, it
9
also resulted in convergence between U.S. GAAP and IFRS in this area. As continued
convergence between the two sets of standards was also an important prerequisite for IFRS
adoption (SEC 2007), it might be viewed as increasing the likelihood of adoption. Since it is
difficult to predict investors’ reactions, we classify this 13th event is classified as neither
increasing nor decreasing the likelihood of IFRS adoption.
Despite the controversy surrounding IAS 39, the SEC published the official roadmap on
November 14, 2008, and we classify this 14th event as increasing the likelihood of IFRS
adoption. The roadmap sets out seven milestones, which if attained by 2011 would likely lead to
the phased mandatory adoption of IFRS by 2014, although the roadmap suggests that some
companies will be eligible for early voluntary adoption.8 Although the roadmap suggests 2014 as
the adoption year, the final decision was to be made in 2011.9
In January 2009, SEC chairman Christopher Cox, who was largely responsible for
developing the IFRS plans, was succeeded by Mary Schapiro, who made several critical remarks
about these plans. On January 15, Schapiro expressed her doubts about the IFRS plans at her
confirmation hearing before the Senate Banking Committee, stating that she would not be bound
by the roadmap and would take time to carefully review the plans before proceeding. She further
expressed concerns regarding the IASB’s lack of political independence and the quality of IFRS
compared to U.S. GAAP. Since these remarks signaled the SEC’s intention to delay, or even
8 The milestones in the roadmap relate to issues such as improvements in IFRS, in the accountability and funding of the IASCF, and in the ability to use XBRL for IFRS reporting, and training in IFRS, that must be addressed before the mandatory adoption of IFRS. They also relate to the transition plan for mandatory IFRS, including successful early use by eligible firms, the anticipated timing of future rule-making by the SEC, and the implementation of mandatory IFRS. The roadmap states that if a firm is among the largest 20 in its industry based on market capitalization, and the industry’s most commonly used accounting method worldwide is IFRS, the firm may be allowed to voluntarily adopt IFRS. 9 On February 24, 2010, the SEC announced that it had changed the proposed adoption date to 2015 to allow companies more time to prepare (see http://www.sec.gov/news/press/2010/2010-27.htm). To date, the SEC has not yet made a final decision on whether the U.S. will adopt IFRS; an announcement is expected mid-2012 (see http://www.journalofaccountancy.com/Web/20125186.htm).

10
halt, the adoption process (Johnson 2009), we classify this final event as decreasing the
likelihood of adoption.
[INSERT TABLE 1 ABOUT HERE]
III. THEORETICAL BACKGROUND
Convergence and IFRS Adoption
Whether convergence in accounting standards benefits investors is a much-debated issue.
Convergence means increasing the compatibility of accounting standards while maintaining a
high level of quality (Pacter 2005; Zeff 2007). For U.S. GAAP and IFRS in particular,
convergence efforts have ranged from the joint efforts of the FASB and IASB to make existing
standards more similar to the potential adoption of IFRS for use by U.S. companies. Regulators
and standard setters often emphasize that convergence benefits investors through lower
information processing costs, since it reduces the need for investors to learn and understand
different sets of accounting standards (Chi 2009). Convergence could increase the quality and
comparability of financial reporting (SEC 2008; Hail et al. 2010) and enhance the consistency of
financial information by enabling auditors and their clients to develop consistent global practices
to deal with accounting issues (Tweedie 2006).10 However, the extent to which these benefits
10 Similar to Armstrong et al. (2010) and Hail et al. (2010), we view increased reporting quality and convergence benefits as two different but related effects of IFRS adoption. Because there is no standard definition of reporting quality, we view it as the extent to which financial reporting reflects a firm’s underlying economic performance. Research has associated quality with earnings attributes such as the degree of earnings management, timely loss recognition, and value relevance (e.g., Francis et al. 2004; Barth et al. 2008) or the quantity of disclosure (e.g., Botosan 1997; Leuz and Verrecchia 2000). As explained above, convergence benefits are broader than reporting quality and can include reduced information processing costs due to greater ease in comparing firms’ financial performance globally. One potential benefit of convergence is comparability, which is the extent to which the information presented allows investors “to identify the similarities in and differences between two sets of economic phenomena” (FASB 1980). Even if reporting quality is held constant, comparability can increase the usefulness of reporting to investors by making it less costly to compare firms (Hail et al. 2010), which has been a key motivation for allowing or requiring the use of IFRS (see e.g., FASB 2008; FAF 2009, 2009; FCAG 2009).

11
will be realized is unclear. For instance, Barth et al. (1999) show that conceptually, the effect of
harmonization or convergence is ambiguous. Depending on its impact on the precision of GAAP
and investors’ costs and benefits of acquiring expertise in understanding different GAAPs,
harmonization may not always lead to more precise information and capital market benefits. In
addition, there are different views on whether uniformity in accounting standards is desirable. On
the one hand, the SEC has long supported global convergence in accounting standards (SEC
2007) and Barth (2008) states that the use of a common reporting language in business, or a
single set of accounting standards, is an important step in making financial reporting more
comparable. However, opponents argue that convergence may not leave room for “considering
differences in circumstances among companies or countries” (Zeff 2007) and could even result
in less informative reporting if a “one-size-fits-all” approach obscures underlying performance or
characteristics of firms and thus could result in a loss of information (Chi 2009). Moreover,
Kothari et al. (2010) predict that forcing FASB and IASB to compete instead of converge would
lead to GAAP rules that facilitate efficient capital allocation. Finally, prior research also
highlights the importance of reporting incentives together with accounting standards (e.g., Hung
2000, Ball et al. 2000, 2003; Ball and Shivakumar 2005; Burgstahler et al. 2006), meaning that
convergence alone may not necessarily result in more informative reporting and capital market
benefits.
Empirically, findings from prior literature provide evidence that convergence does result in
capital market benefits and changes in financial reporting characteristics. For instance, Chi
(2009) examines whether investors’ ability to process earnings information is hindered by firms’
use of different GAAPs. She finds that when multiple firms announce their earnings on the same
day, the price and trading-volume reaction is greater and the post-earnings-announcement drift is

12
smaller if these firms use fewer different domestic GAAPs. This suggests that investors are able
to process information more efficiently when the analysis is not complicated by the presence of
multiple standards, which supports convergence as being beneficial to capital markets. Other
studies on the effects of IFRS adoption in particular have shown that IFRS results in greater
reporting quality and requires greater disclosure than most local GAAPs (Ashbaugh and Pincus
2001; Barth et al. 2008), and can result in greater reporting comparability (Yip and Young 2011).
Theoretical research shows that this can reduce information asymmetry problems and estimation
risk, which in turn has benefits for liquidity and the cost of equity (Diamond and Verrecchia
1991; Lambert et al. 2007).
Armstrong et al. (2010) find empirical support for this prediction in a European setting,
where share prices react positively to events that increase the likelihood of IFRS adoption, in
particular for firms that are expected to benefit from IFRS in terms of higher information quality
and convergence. Beuselinck et al. (2011) find that disclosure under IFRS revealed new firm-
specific information in the year of mandatory adoption in the EU, which subsequently reduced
the surprise of future disclosures. There is also evidence that mandatory IFRS adopters
experience improvements in liquidity, cost of capital, and equity valuation (Daske et al. 2008).
Drake et al. (2010) find that these increases in market liquidity are greater for firms with high
quality pre-adoption information environments. Since these firms are unlikely to benefit from
increased reporting quality, Drake et al. attribute these positive market effects to increased
comparability. Li (2010) also shows that mandatory IFRS adopters experience a decrease in cost
of equity and that this can be attributed in part to increased comparability as well as to greater
disclosure under IFRS. Wu and Zhang (2010) find that in the EU the use of relative performance
evaluation with international industry peers increases after IFRS adoption, while DeFond et al.
13
(2011) report increased U.S mutual fund ownership in firms that credibly adopt IFRS, which
they interpret as consistent with increased comparability under IFRS. Furthermore, in line with
prior research, the cited studies show that the effect of IFRS is highly dependent on reporting
incentives shaped by regulatory enforcement and other institutional factors.
Potential Effects of IFRS Adoption in the U.S.
Although prior studies find positive capital market effects associated with convergence and
IFRS adoption in particular, these findings do not necessarily apply to the U.S. context. First,
there are opposing views on whether IFRS is, overall, of higher quality than U.S. GAAP (Hail et
al. 2010). IFRS proponents argue that it is less complex than U.S. GAAP, and that the nature of
current U.S. standards induces managers to follow rules rather than to consider whether financial
reporting reflects the underlying economics of a firm. On the other hand, critics of IFRS claim
that its principles-based nature can be abused by managers, since more discretion and less
guidance leaves more room for earnings management. Also, IFRS and U.S. GAAP have become
increasingly similar over time, as the FASB and IASB have worked together intensively to
increase and maintain the compatibility of standards (Hail et al. 2010). Examples include IASB’s
new standards on borrowing costs (IAS23R) and segment reporting (IFRS8) that mirror U.S.
GAAP.
If investors believe that these convergence efforts have sufficiently reduced the differences,
then adopting IFRS would not result in significant convergence benefits and would bias against
finding a more positive market reaction. However, anecdotal evidence suggests that the
application of U.S. GAAP versus IFRS still results in different reporting outcomes. For example,
Ahold, a Dutch food retailer that operates internationally, showed a net profit of €120 million for

14
2005 under IFRS, but reported a net loss of €20 million for the same year under U.S. GAAP in
its reconciliation footnote. This illustrates that despite ongoing convergence, the use of different
accounting standards has a material impact on financial reporting. Second, since reporting
quality in the U.S. is among the highest in the world (Leuz et al. 2003), and factors such as
incentives play an important role in determining this quality, it is unclear whether the adoption of
IFRS will have a significant impact on the quality of reporting in the U.S.
We acknowledge that it is difficult to predict the overall effect of IFRS adoption. However,
we expect cross-sectional variation in the extent to which it is beneficial or costly. We therefore
focus on three settings where the effects of adopting IFRS are expected to be most pronounced.
First, we examine whether IFRS adoption is perceived by investors as more costly in industries
where it will most likely decrease the quality of standards. Although U.S. GAAP and IFRS have
become increasingly similar (Hail et al. 2010), the SEC and FASB have expressed concerns
about the lack of IFRS implementation guidelines for certain industries, notably the extractive
and insurance industries. Their concern is that investors might lose information that is currently
available under U.S. GAAP. To the extent that the lack of industry-specific guidance is indeed a
concern, then investors in these firms might be opposed to IFRS adoption and react negatively to
events that increase the likelihood of adoption. Also, the lack of specific rules could be
problematic for industries with high litigation risk. Managers will have to rely more on their own
judgment when interpreting IFRS, which could result in more legal challenges to their decisions.
To avoid this, firms might make overly conservative accounting choices (Hail et al. 2010) that
reduce the informativeness of financial reporting. If the lack of implementation guidance is
indeed viewed as a valid concern by investors, we would expect to observe a less positive market
reaction for firms in extractive, insurance and high litigation risk industries.

15
Second, we expect convergence benefits to be more pronounced in industries where many
non-U.S. peer firms have already adopted IFRS. Wide-spread adoption of IFRS in a particular
industry may be an indication that the benefits, such as reduced information processing costs, of
adopting these standards are greater, resulting in a larger proportion of non-U.S. firms adopting
IFRS. Analogously, these benefits may also apply to U.S. firms in such industries, thus resulting
in a more positive market reaction to IFRS adoption events for these firms. In line with this
argument, the fact that many global competitors use IFRS would indicate more consistent global
practices to deal with accounting issues and possibly greater familiarity among the international
investment community with IFRS reporting in that industry. Supporting this view, the SEC
considered allowing certain U.S. firms for which IFRS would be most beneficial to adopt IFRS
early, and proposed that the use of IFRS by a majority of significant competitors should be the
key requirement for deciding which firms would be eligible for this option (SEC 2008). For these
reasons, we expect that U.S. firms in such industries would benefit from IFRS adoption to a
greater extent than firms in industries where IFRS is not widely adopted by non-U.S. peers.
Third, we examine the potential costs and cost reductions of IFRS adoption. Experience with
the adoption of new accounting regulations has shown that there are substantial implementation
costs. For example, the implementation of SOX Section 404 cost an estimated $3 to $8 million
per firm (FEI 2004). The Institute of Chartered Accountants in England and Wales (ICAEW)
issued a report discussing the compliance costs of IFRS adoption in Europe. They estimated
these costs to be between 0.05% (for larger companies) and 0.31% (for smaller companies) of
revenue. The SEC’s estimate of implementation costs for the largest U.S. firms is around 0.125%
of revenue, or around $32 million per firm for the first three years of filings on Form 10-K (SEC
2008).

16
IFRS could also result in a recurrent loss of tax benefits for firms that use LIFO. Since U.S.
tax regulations require the use of LIFO for tax-reporting purposes, and IFRS does not permit the
use of this method, firms applying LIFO valuation would be forced to forego tax benefits.11
Although Hail et al. (2010) suggest several approaches to this issue, such as dropping the book-
tax conformity requirement or providing a tax credit to LIFO firms, investors in LIFO firms
might react negatively to IFRS if it results in substantially higher taxes and lower cash inflows.
By contrast, U.S.-based multinationals might benefit from recurrent cost reductions.
Corporations with subsidiaries in countries with mandatory IFRS reporting may be able to
reduce their costs because they no longer have to report under both U.S. GAAP and IFRS (SEC
2008; Hail et al. 2010). Investors in these multinationals might therefore react positively to IFRS
adoption.
Predictions
Based on the above discussion, we make the following cross-sectional predictions regarding
market reactions. First, investors are likely to be concerned that IFRS will adversely affect
reporting quality because of the lack of implementation guidance for extractive and insurance
firms and firms with high litigation risk. We therefore expect a less positive market reaction for
such firms. Second, we expect investors to react more positively if they expect IFRS to result in
convergence benefits, which is more likely in industries where IFRS is already widely adopted
by non-U.S. peer firms. Finally, we examine whether investors consider the cost impact of IFRS
in their valuations. IFRS is expected to decrease costs for firms that must comply with both U.S.
11 Although this may seem a minor concern, over 120 U.S. companies have joined the LIFO Coalition that aims to preserve the use of LIFO and have lobbied against the adoption of IFRS (see http://www.msci.org/GovtAffairs/LIFO/LIFO-Coalition-SEC-Comments.pdf). It is ultimately an empirical question whether investors consider the potential loss of tax benefits to be economically significant.
17
GAAP and IFRS, so we expect such firms to experience a most positive market reaction. By
contrast, we expect a lower reaction for firms that use LIFO because of the higher costs resulting
from a loss of tax benefits.
IV. SAMPLE SELECTION, VARIABLES, AND DESCRIPTIVE STATISTICS
Sample Selection
Because we are mainly interested in the cross-sectional differences in investor responses, the
sample includes all domestic U.S. firms that have the necessary price and financial-statement
data for the period 2007 to 2009 encompassing the 15 events. Firms are not required to have data
for all 15 events, i.e., they are included if they have return data for at least one event and data for
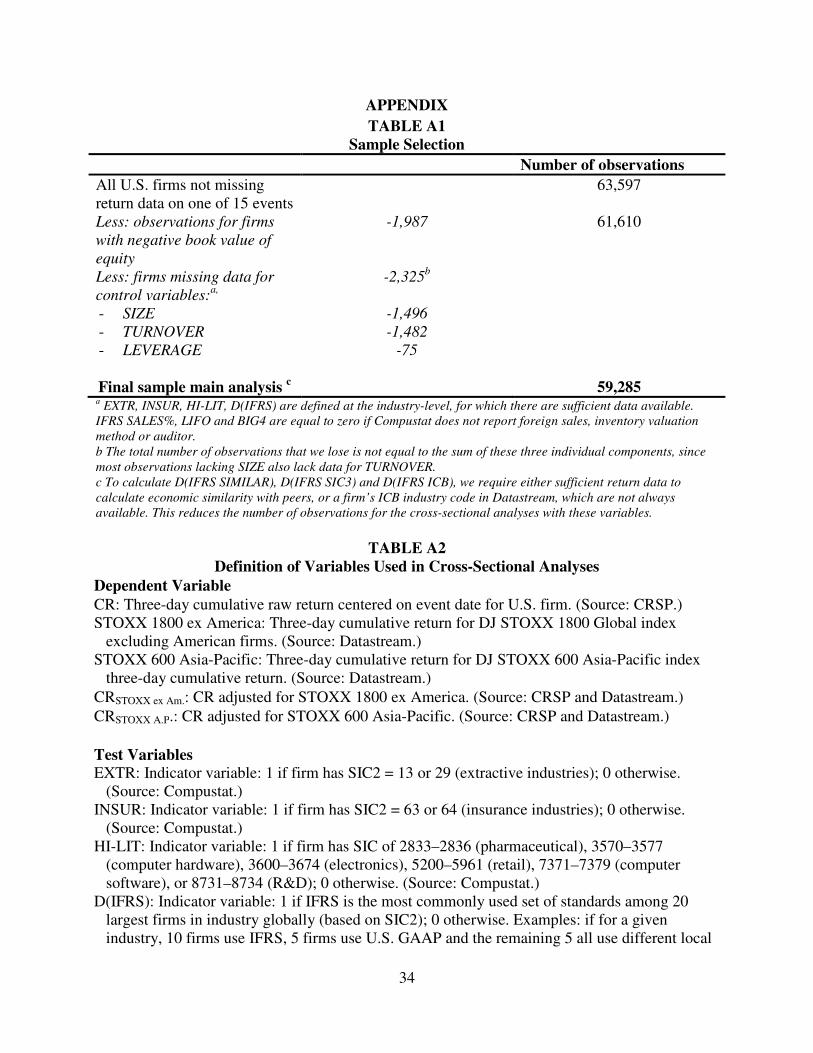
the corresponding variables in the cross-sectional analyses. We start with 63,597 domestic U.S.
firm-event observations with return data for one of the 15 events. We do not exclude any
industries, but do exclude observations for firms with a negative book value of equity, resulting
in 61,610 observations. We further exclude firms for which we lack data to calculate the test or
control variables, resulting in the final sample of 59,285 firm-event observations for 4,820 firms.
Details on sample selection are provided in the Appendix.
Variable Definitions
The variables used in the analyses are discussed in this section. Further details on the variable
measurement and data sources are provided in the Appendix.
Dependent Variable
The dependent variable is the market reaction to the events identified in Section II. This is
measured by the three-day cumulative return centered on the event date, retrieved from CRSP,

18
and is adjusted for other news using a market index. Because IFRS adoption would affect all
publicly listed U.S. firms, it is inappropriate to adjust returns with a U.S.-based index, because
the index itself would also reflect the market reaction to IFRS adoption events. In the spirit of
Armstrong et al. (2010), we use the three-day return to the DJ STOXX 1800 index excluding
American firms as the market adjustment for the main analyses.12 We obtain the return data for
the STOXX adjustment from Datastream.
Test Variables
First, as discussed in Section III, in some instances reporting quality may decrease due to less
implementation guidance. We define indicator variables that capture whether a firm operates in
the insurance (INSUR) or extractive (EXTR) industries, or in industries with a high litigation
risk (HI-LIT). INSUR is equal to 1 if a firm’s two-digit SIC code (SIC2) is 63 or 64, and EXTR
is equal to 1 if SIC2 is 13 or 29.13 Following Kasznik and Lev (1995), Matsumoto (2002), and
Field et al. (2005), HI-LIT is equal to 1 if a firm’s SIC is 2833–2836, 3570–3577, 3600–3674,
5200–5961, 7371–7379, or 8731–8734. If investors expect IFRS adoption to lead to lower
reporting quality, we expect the coefficients on these three variables to be negative.
Second, we test whether investors respond more positively to IFRS adoption events if IFRS
12 Prior studies that have also used non-U.S. firms’ returns to adjust for other contemporaneous economic news include Zhang 2007 and Armstrong et al., 2010. A potential drawback of using this DJ STOXX 1800 index excluding American firms is that it includes European firms, most of which will have adopted IFRS. To the extent that these firms also respond positively to IFRS adoption events in the U.S. since it could affect the comparability of their financial reporting, this adjustment could remove some of the effect of the IFRS adoption news we seek to document. An alternative would be to use the DJ STOXX Asia-Pacific index returns, which consist of the 600 largest firms in the Asia-Pacific. One drawback of this index is that Asian and U.S. firms may be dissimilar, so adjusting with this index may not adequately remove market reactions to news unrelated to IFRS adoption. We base our choice of adjustment on the correlations between the index returns and our sample returns. For 2007-2008, the correlation between three-day U.S. returns and the STOXX 600 Asia-Pacific index is 0.64, and the correlation between the U.S. returns and the STOXX Global 1800 ex America index is 0.79. On the event dates, the correlations are 0.66 for the former index and 0.88 for the latter. For completeness’ sake, Table 3 shows results for both indices, and Table 6 reports regression results for the STOXX Asia-Pacific index. Nevertheless, we acknowledge the challenge of selecting an appropriate market adjustment, and that using non-U.S. firms’ returns as an adjustment does not remove the impact of news events that are unrelated to IFRS and specific to the U.S. (Leuz 2007). 13 The industry classification of insurance companies is based on Fama and French (1997) and that of extractive industries is based on Hand (2003).
19
is expected to result in convergence benefits. As explained earlier, we expect these benefits to be
most pronounced in industries where a majority of firms apply IFRS. To assess this, we look at
the accounting standards that are applied by peer firms in the same industry on a worldwide
basis. We use the Worldscope database to determine the accounting standards used by peers.14
Global industry peers are selected from Worldscope by ranking firms on market capitalization in
two-digit SIC groups.15 For the 20 largest firms in each industry group, we determine the
statistical mode of the accounting standards and classify an industry as “IFRS-predominant” if
IFRS is the most commonly used standard among these 20 firms where we set D(IFRS)=1. We
expect a positive coefficient for D(IFRS) if investors expect IFRS adoption to lead to net
convergence benefits for these firms. In Section VI we conduct several additional analyses to
gain more insight into the nature of these convergence benefits.
Third, we examine whether the market reactions vary with the cost impact of IFRS. We
expect U.S. firms operating in countries with mandatory IFRS reporting to experience reduced
costs by switching to IFRS. We first use the Compustat segment files to determine the
geographic origin of a firm’s sales. We then determine which countries have mandated the use of
IFRS, using the IASPlus website and the classification by Sletten and Ramanna (2009). The
variable IFRS SALES% represents the proportion of sales in countries that mandate IFRS
relative to the firm’s total sales. We expect firms with a higher proportion of IFRS sales to
14 Daske et al. (2008) show that some firms have incorrect accounting-standard classifications in Worldscope. We acknowledge that there are flaws in the commercially available databases, but we do not think that this is a severe problem for our study, since our data are derived from a more recent period and we use only the largest firms to determine the most common standards. Misclassification is likely to be a more serious issue in the years preceding mandatory IFRS adoption and for smaller firms. 15 We also conduct analyses with different industry groupings based on the three-digit SIC as well as the Industry Classification Benchmark (ICB) subsector codes. The ICB system was developed by Dow Jones Indexes and FTSE and is also used in Lang et al. (2010). ICB classifies firms into industry sectors based on their sources of revenue. This system has been adopted by many stock exchanges globally and aims to offer a comprehensive tool for global sector analysis, with a focus on relevance to investors. The findings are robust to alternative industry definitions and are discussed in more detail later in the paper.

20
benefit more from IFRS adoption. Finally, we determine whether a company uses LIFO via
Compustat information about inventory-valuation methods. LIFO is an indicator variable equal
to 1 if a firm applies this method to value its inventory.
Control Variables
Following Christensen et al. (2007) and Armstrong et al. (2010), we include the following
additional control variables: firm size, turnover, leverage, industry concentration, and auditor
size. These variables are proxies for the firm’s information environment and information
asymmetry with investors. On the one hand, smaller and less liquid firms with low turnover,
firms with higher leverage, and those in more concentrated industries are expected to have
poorer information environments. If investors expect IFRS adoption to improve reporting quality
and reduce information asymmetry, we would expect such firms to benefit more from the
adoption of IFRS. On the other hand, larger and more liquid firms attract more institutional
owners who prefer conformity in accounting choices (Bradshaw et al. 2004). If investors expect
IFRS adoption to result in such convergence benefits, we would expect a more positive reaction
for companies where the demand for conformity is higher. Firms with a Big-4 auditor are also
expected to benefit more from IFRS adoption, since such auditors are better equipped to support
the transition (Armstrong et al. 2010).
Descriptive Statistics and Correlations
Table 2 presents descriptive statistics and correlations. Panel A shows that the proportion of
firms in extractive (insurance) industries is 4.1% (3.3%), and 25.12% of firms are in high-
litigation industries. Furthermore, 40.01% of firms operate in an industry where IFRS is
21
commonly used internationally.16 The descriptive statistics for D(IFRS SALES), which equals 1
if a firm has non-zero sales in a country that mandates IFRS, indicate that 19.80% of firms
generate sales in a country that mandates IFRS reporting. For such firms, the average proportion
of IFRS sales is 22.15% of total sales. 8.08% of sample firms apply LIFO valuation.
Panel B reveals that the correlation between the market reaction to events (CRSTOXX ex Am.)
and EXTR is positive and significant at the p<0.05 level, which is inconsistent with the view that
investors in extractive industries are concerned about the lack of industry-specific guidance
under IFRS. The same holds for the insurance industries (INSUR). By contrast, HI-LIT is
negatively correlated with the market reaction, consistent with the notion that less guidance
under IFRS is perceived as costly for firms with a high litigation risk. The correlation between
CRSTOXX ex Am. and D(IFRS) is also positive, consistent with convergence benefits being greater
in IFRS-predominant industries. The correlation between the event returns and the variables
D(IFRS SALES) and IFRS SALES% is insignificant, which does not support the prediction that
investors react more positively to IFRS adoption because of reduced reporting costs. The
correlation between LIFO and CRSTOXX ex Am is positive and significant, suggesting that investors
do not perceive IFRS adoption to be more costly due to the potential loss of tax benefits. Overall,
the correlations in Panel B are preliminary evidence that IFRS is perceived as costly for firms
with high litigation risk and as beneficial in cases where investors expect IFRS to lead to
convergence benefits.
[INSERT TABLE 2 ABOUT HERE]
V. RESULTS
16 IFRS is predominantly used in the agricultural and mining industries, several manufacturing industries (such as food, fabrics, and electronic equipment), trucking and transportation, finance and insurance, and leisure services.

22
Overall Market Reaction
We first examine the overall market reaction to the 15 events to assess whether U.S.
investors on average perceive IFRS adoption to be net beneficial or costly. Table 3 shows an
average positive abnormal return across all events (adjusting for STOXX 1800 ex America) of
0.86%, which is marginally statistically significant (t-statistic = 1.94; two-tailed p-value =
0.0724). The significance is determined using the empirical distribution of the value-weighted
returns for the 15 events, assuming that the mean returns per event are uncorrelated across
events.17 We use the mean (-0.0006) of non-event returns adjusted for STOXX 1800 ex America
measured over non-overlapping three-day windows as the benchmark, rather than assuming
H0=0 as explained in the Appendix. This allows for unequal variances between event and non-
event return distributions and does not assume that the market-adjustment fully adjusts for the
market return (Armstrong et al. 2010). This second t-statistic is slightly higher (2.08) and
marginally statistically significant with a two-tailed p-value of 0.056. We find similar and
statistically stronger results with the STOXX Asia-Pacific adjustment.
For comparison purposes, we also include the three-day raw returns for the S&P500 index
for each of the 15 events alongside the three-day raw returns of our sample firms in Table 3, to
allow readers to assess the representativeness of the sample. We do not find major discrepancies
between the returns for our sample and the S&P500 index in terms of direction or magnitude.
Although these returns appear to indicate that the overall market reaction to events that
increase the likelihood of adoption is positive, we do not interpret this as evidence for the overall
desirability of IFRS adoption. We acknowledge the need to appropriately adjust stock returns
17 To calculate the t-statistics in Table 3 and for the cross-sectional analyses in Tables 4 to 6, we multiply the returns for event 15, which is classified as decreasing the adoption likelihood, by -1. This is done to ease the interpretation of the t-statistics, since all the other events are classified as increasing adoption likelihood or unsigned (Armstrong et al. 2010).

23
and to control for the effect of confounding events. This is especially important because the
period of interest coincides with the financial crisis and the heightened volatility of financial
markets. The last column of Table 3 shows the Chicago Board Options Exchange Volatility
index over the three days of each event window. We find that volatility is especially high during
the last three events in our sample. In particular, event 13 coincides with the stock market crash
of 2008, which had a large influence on the returns during that event. Immediately preceding this
event, the S&P 500 had lost 22% of its value over the course of six trading days of October 2nd
to October 6th (Steverman 2008), while the Dow Jones Industrial Average (DJIA) fell 18% in
the week starting October 6th, making it the worst week in the history of the index (Curran
2008). On Monday October 13th, global stock markets temporarily recovered as governments
announced plans to bail out financial institutions. These extreme conditions make it difficult to
interpret the return on this particular date and it is unlikely that it reflects investors’ reaction to
IFRS adoption news alone, but it is unclear if and how it would influence the cross-sectional
results. In our opinion, the main contribution lies in the cross-sectional analyses presented below,
since these results allow for more rigorous testing of alternative explanations for our tests. We
find that the results are generally robust to event 13 or any of the 15 events, and discuss this issue
in more detail in Section VI.
[INSERT TABLE 3 ABOUT HERE]
Cross-Sectional Analyses
This section presents the results from cross-sectional analyses that examine whether market
reactions vary across firms according to our theoretical predictions. We estimate the following
model, which includes all test variables and control variables simultaneously:
CRSTOXX ex Am. i, e, = f(EXTRi,e, INSURi,e, HI-LITi,e, D(IFRS)i,e, IFRS SALES%i,e, (1)

24
LIFOi,e, control variables),
where i denotes firm i and e denotes the event.
We recognize that news of IFRS adoption affects all firms in the sample simultaneously,
potentially resulting in cross-sectional correlations in returns and biased standard errors (Petersen
2009). To address this concern, the reported t-statistics (in parentheses below the coefficients)
are based on standard errors clustered at the event level and are adjusted for heteroskedasticity.
[INSERT TABLE 4 ABOUT HERE]
Considering the results in the first column of Table 4, we find no support for the idea that
investors in extractive and insurance industries respond more negatively to IFRS adoption
events. The coefficients for EXTR and INSUR are positive but insignificant. This result could
reflect investors’ confidence in the efforts of the IASB to develop specific standards for these
two industries. In particular, this would include the second phase of the comprehensive insurance
contracts project to replace the current IFRS 4, and the efforts aimed at developing a new
standard considering all unique issues of the extractive industry, to replace IFRS 6.
Second, we find a significantly negative coefficient for the HI-LIT variable. This indicates
that investors in firms with high litigation risk react more negatively to events that increase the
likelihood of IFRS adoption. This is consistent with concerns that investors may have about the
lack of specific guidance under IFRS resulting in higher litigation risk.
Third, the significant and positive coefficient for D(IFRS) is consistent with investors
expecting IFRS adoption to result in convergence benefits for firms in industries where IFRS is
already widely adopted. This finding supports the SEC’s claim that the benefits of IFRS adoption
are likely to be most pronounced for firms in IFRS-predominant industries.18 In Section VI, we
18 We also examine whether event returns are positively related to the proportion of global industry peers using IFRS. Untabulated results indicate that the market reaction is significantly positively associated with this proportion,

25
conduct additional analyses to gain more insight into the nature of these convergence benefits.
Fourth, the findings on the cost impact variables are inconsistent with the theoretical
predictions. The coefficient for IFRS SALES% is insignificant, which does not support the idea
that firms with sales in IFRS countries would benefit significantly from reduced preparation
costs. One explanation could be that from the investors’ point of view, the cost impact is not
important enough to lead to a significant response to news about IFRS adoption. Another
explanation is that the tests lack power. IFRS SALES% captures the firms that operate in IFRS
countries, but not necessarily those that are required to use IFRS. Unfortunately, we cannot
identify which U.S. firms are legally required to report in IFRS for their foreign subsidiaries.
Also, firms that apply LIFO do not react more negatively to IFRS adoption. Although the
LIFO variable has the expected negative sign, it is not significant (p = 0.51). Since this variable
does not take into account the extent to which LIFO is used, and thus what the cost impact would
be of adopting IFRS, we also use the ratio LIFO Reserve/Total Assets and identify firms that use
LIFO as their primary inventory-valuation method as alternative proxies, but obtain similar
results. Similar to the explanations for the insignificance of IFRS SALES%, it could be that
investors do not expect that disallowing the use of LIFO under IFRS will have a major cost
impact and therefore do not react more negatively to IFRS adoption events.
Fifth, the market reaction is positively and significantly related to the control variables SIZE,
TURNOVER and BIG4. As explained in Section IV, one explanation for the positive relation
between size and event returns is that convergence benefits could be larger, since larger firms are
more likely to compete and be compared on a global basis. Moreover, larger and more liquid
firms attract institutional ownership and analyst following (O'Brien and Bhushan 1990; Gompers
similar to the results for D(IFRS). This is consistent with investors valuing convergence benefits, and with these benefits increasing with the number of firms that use IFRS in a given industry.

26
and Metrick 2001). Since institutional investors and analysts have been shown to favor
conformity in accounting choices or outcomes (Bradshaw et al. 2004; De Franco et al. 2011), this
might be another reason for the positive coefficients for these variables. Finally, the positive
coefficient for BIG4 indicates that investors react more favorably to IFRS adoption for firms
with a Big-4 auditor, consistent with these auditors being more able to support the transition
from U.S. GAAP to IFRS.
VI. SENSITIVITY ANALYSES
In Section V, we find that the coefficient for D(IFRS) is positive and significant, suggesting that
investors expect IFRS to lead to convergence benefits. We examine whether this result is robust
to different definitions and refinements of our measure of convergence benefits. We also conduct
additional analyses to check the sensitivity of our findings to potential confounding events,
which is particularly important given that our events take place during the recent financial crisis.
Further Evidence on Convergence Benefits
We perform several analyses to examine whether D(IFRS) accurately captures net
convergence benefits for U.S. firms. First, as explained earlier, we expect net convergence
benefits to be most pronounced for U.S. firms in industries where IFRS is most commonly used
by industry peers, assuming that firms within an industry are economically similar. Since there is
variation in the extent to which firms are similar within an industry, we refine D(IFRS) by
explicitly incorporating the degree of economic similarity. We calculate the absolute correlation
in daily stock returns between the U.S. firm and each of the top 20 peers using all trading days in
the calendar year preceding an event, resulting in 20 correlations per firm. A high absolute

27
correlation indicates that firms are affected to a similar extent by the same economic events,
suggesting a high degree of economic similarity.19 We calculate the average of these 20
correlations for each U.S. firm, and if this average correlation is higher than the median value
across all U.S. firms in the same year, we label this firm as having a high degree of economic
similarity with the top 20 peers. The variable D(IFRS SIMILAR) is equal to 1 for a particular
firm if most of its top 20 peers use IFRS and its stock returns are highly correlated with those of
the peers. We replace D(IFRS) with D(IFRS SIMILAR) in the regression analysis; the results are
presented in the second column of Table 4, Panel A. The coefficient for D(IFRS SIMILAR) is
positive and has a slightly higher statistical significance than for D(IFRS).
In a related untabulated analysis, we examine whether investors expect IFRS to make
dissimilarities between dissimilar firms more apparent. We calculate the average absolute
correlation of a firm with the top twenty largest peers in all SIC2 industries except for its own
and identify the industry that has the lowest average correlation. D(IFRS DISSIMILAR) equals 1
if IFRS is the predominant standard in that industry. If investors expect IFRS to significantly
increase this aspect of comparability, then D(IFRS DISSIMILAR) should have a positive
significant coefficient. However, if investors expect no comparability increase after IFRS, then
D(IFRS DISSIMILAR) would have an insignificant or significantly negative coefficient. We
find that D(IFRS DISSIMILAR) has a positive but insignificant coefficient in the regressions,
suggesting that investors do not expect IFRS to make the dissimilarities between firms more
19 We use absolute correlations, because we focus on the magnitude of the impact of economic events on firms rather than the direction. General economic events, such as changes in oil prices, may affect similar firms to the same extent and cause stock returns to move in the same direction. However, if one firm for instance announces increased R&D spending, investors may perceive this as good news for this firm but as bad news for an economically similar competing firm. Thus, we would observe a positive reaction for the announcing firm, but a negative reaction for the competing firm. In such cases, a high negative correlation may also indicate a high degree of economic similarity, which is why we focus on high absolute correlations as a measure of similarity. However, empirically there are few instances where there is a high negative absolute correlation between firms, and the findings are similar if we use non-absolute correlations to capture similarity.

28
apparent. However, our measures of convergence benefits remain significant.
Second, to assess the sensitivity of our convergence result to industry definitions, we define
D(IFRS SIMILAR) at the three-digit SIC level and use this variable, labeled D(IFRS SIC3),
instead of D(IFRS). We also define D(IFRS) using ICB subsector codes. We find similar results
using these two variables as is shown in the last two columns of Table 4, Panel A. Overall, the
tests discussed above show that the presence of convergence benefits is a plausible explanation
for the higher market reaction in IFRS-predominant industries. The correlations between the
different convergence benefit measures are also provided in Panel B of Table 4; all are positive
and significant as expected, and most of them are reasonably high (above 0.5).
Next, we examine whether the coefficient on D(IFRS) reflects investors’ expectations of
higher reporting quality under IFRS rather than net convergence benefits. We test whether
reporting quality is systematically lower in IFRS-predominant industries using measures of
earnings quality following Francis et al. (2004). If this is the case, then an alternative explanation
for the D(IFRS) coefficient is that investors expect IFRS to improve reporting quality for firms
in those industries. We also examine the sensitivity of the findings in Table 4 and D(IFRS) in
particular to inclusion of these earnings quality measures in the analyses. Table 5 presents our
analyses using seven commonly used earnings quality proxies (accrual quality, earnings
persistence, predictability and smoothness, value relevance, earnings timeliness and
conservatism) following Francis et al. (2004), measured in the year preceding the events. First, as
Panel A shows, we find that most of these measures (accrual quality, persistence, smoothness,
conservatism and timeliness) indicate that the quality of reporting is not lower in IFRS-
predominant industries, which is inconsistent with reporting quality being a larger concern for
firms in these industries. Second, we find that the coefficients on the convergence benefit proxies

29
are still significant when we include the earnings quality measures in the regressions, although
D(IFRS) is only weakly significant. For parsimony, we only report the analyses including the
accrual quality proxies in Panel B of Table 5, but the findings are similar if we use any of the
other earnings quality measures. Overall, these results suggest that D(IFRS) proxies for the
extent of net convergence benefits rather than expectations of increased reporting quality that
could result from IFRS adoption.
[INSERT TABLE 5 ABOUT HERE]
Credible Implementation of IFRS
Convergence might lower the costs of comparing information for investors, but this is likely
to occur only if firms implement IFRS properly. The intuition is similar to that in DeFond et al.
(2011), who use the change in mutual fund ownership after IFRS adoption to infer whether IFRS
led to higher reporting comparability, which is a potential benefit of convergence. They find that
mutual fund ownership only increases in the event of a “credible increase in uniformity”, i.e., if
the implementation of IFRS is well-enforced. Similarly, we use the World Bank rule-of-law
scores from Kaufmann et al. (2009) to measure the implementation quality of IFRS. We assign
these scores to each firm in the top 20 peer group based on its country of origin and calculate the
average rule-of-law score for each group. We define two variables, D(IFRSWeak) and
D(IFRSStrong), to distinguish between industries where IFRS is commonly used but with different
levels of implementation quality. D(IFRSWeak) (respectively D(IFRSStrong)) is equal to 1 if IFRS
is commonly used and the average rule-of-law score for the peer group is below (above) the
median value across industries. If implementation quality matters, then the coefficient for
D(IFRSStrong) should be higher than that for D(IFRSWeak). We find that D(IFRSStrong) is indeed

30
positively and significantly associated with the market reaction, whereas D(IFRSWeak) is
insignificant. However, the difference in the two coefficients is not statistically significant (p =
0.74). A possible explanation is the fact that convergence benefits encompass more than reduced
costs of comparing information. For example, enhanced consistency in global accounting
practices applied by preparers and their auditors is a convergence benefit that does not rely on
the implementation quality of peers. Hence, since both D(IFRSWeak) and D(IFRSStrong) capture
net convergence benefits to some extent, it is plausible that the coefficients do not differ
significantly.
[INSERT TABLE 6 ABOUT HERE]
Foreign Institutional Ownership and Analyst Following
Prior research has shown that there is a demand for conformity in reporting choices across
firms from analysts and institutional investors (e.g., Bradshaw et al. 2004; De Franco et al. 2011;
DeFond et al. 2011). We therefore investigate whether the market reactions are higher when
there is greater demand for convergence and include analyst following and a variable for high
foreign institutional ownership in the regression model.20 We find that analyst following is not
significantly related to the market reaction, but if a firm has a higher number of foreign
institutional owners, the market reaction is significantly higher. Table 6 also shows that despite
the inclusion of analyst following and institutional ownership, D(IFRS SIMILAR) remains
significantly and positively related to the market reaction. This evidence supports the main
finding that investors appear to value convergence benefits of IFRS adoption within IFRS-
predominant industries.
20 For parsimony, we have tabulated the sensitivity analyses with D(IFRS SIMILAR), but we find similar results when we measure convergence benefits with D(IFRS), D(IFRS SIC3) and D(IFRS ICB), unless stated otherwise. Results are available from the authors upon request.

31
Other News and Market Adjustment
We take several steps to ensure our results are not sensitive to the chosen market adjustment,
other news events and selection of events.
First, we assess the sensitivity of our results to an alternative market adjustment by
subtracting the STOXX 600 Asia-Pacific index return instead of the STOXX 1800 Global ex
America index return. The results for the overall market reaction (Table 3) are similar for both
adjustments. We also find that the cross-sectional analyses are generally robust to this alternative
adjustment (column 3 of Table 6 shows the regression results for the D(IFRS SIMILAR)
specification): the coefficients for the convergence benefit proxies are generally similar to those
in the main analysis, except for D(IFRS) which loses significance.
Second, Tables 4 to 6 provide additional information on whether crisis-related news is
driving our results. It reports alternative t-statistics (in brackets), which are based on a
comparison of the coefficients in the main analysis with coefficients from the same models when
we replace the event returns with non-event returns (see also Armstrong et al. 2010). We do this
to eliminate the possibility that we are merely capturing systematic relations between returns and
firm characteristics. We find that most of the results are unaltered and that the significance of our
metrics of convergence benefits is enhanced by this procedure.
Third, we search in Factiva for other major news in our sample period (April 2007 to January
2009). News about the problems with mortgage securities and the economic downturn was
reported in several event windows. This may explain why some of our returns in Table 3 are
inconsistent with their predicted signs. For example, for the events on October 24, 2007 and
November 7 and 15, 2007, the Wall Street Journal reported news on disappointing economic

32
statistics, downgrades of mortgage securities, and slowing economic growth and inflation. The
most strongly affected event is October 13, 2008, which overlaps with the 2008 stock market
crash, as mentioned earlier. We also repeat the cross-sectional analyses in Table 4 excluding this
event; the last column of Table 6 shows the results for D(IFRS SIMILAR). Although the cross-
sectional results are weaker when we exclude this event, the results for any of the convergence
benefit proxies do not seem to be driven by any particular event. We find similar results if we
exclude any other event from the sample. Also, unreported analyses show that excluding banks
from the sample (firms with SIC2 equal to 60 or 61), which were most severely affected by the
crisis, does not affect the tenor of our results.
We acknowledge that it is impossible to perfectly adjust for potentially confounding effects,
since major news events can occur every day. However, the inferences from our main cross-
sectional analyses are similar when we control for confounding events, and we believe that they
provide insight into which firms investors expect will benefit from IFRS adoption.
VII. CONCLUSION
The goal of this study is to provide empirical evidence for the costs and benefits of IFRS
adoption by U.S. firms from the investors’ point of view. We use the stock market reaction to
events that affect the likelihood of IFRS adoption and examine whether this varies cross-
sectionally in a predictable manner. We find that investors react more positively to events that
increase the likelihood of IFRS adoption in cases where IFRS is expected to result in
convergence benefits. We find a significantly more positive market reaction for firms operating
in industries where IFRS is the predominant choice worldwide; for larger and more liquid firms
that are more likely to attract investors who stand to benefit from convergence; and for firms

33
with high foreign institutional ownership. Collectively, these findings suggest that investors
expect U.S. adoption of IFRS to result in net convergence benefits. Further, investors in firms
with high litigation risk respond less positively to events that increase the likelihood of IFRS,
consistent with the notion that IFRS may increase the likelihood of expensive legal challenges,
or may lead to overly conservative behavior by these firms to avoid litigation.
The findings of this paper must be interpreted carefully in light of several limitations. First,
our focus is only on investors, rather than on all parties that could be affected by the change.
Second, the methodology relies on a correct identification of events and requires that event-
related information be incorporated into stock prices rapidly and without bias (Armstrong et al.
2010). We have carefully identified the relevant events and dates, but we cannot exclude the
possibility that participants were privy to relevant information prior to the dates identified here.
Third, the findings relate to the expected effects of IFRS adoption, rather than to the realized
effects, and should therefore be seen as preliminary evidence for the effects of IFRS adoption.
Despite these limitations, our findings are relevant to the current debate on whether the U.S.
should switch to IFRS. The SEC has stated that the transition should be made only if it benefits
U.S. investors and capital markets, and this paper provides evidence relevant to that issue. A
final contribution is our finding that despite the ongoing efforts of the IASB and FASB to reduce
the differences between IFRS and U.S. GAAP, investors still react positively to news that
increases the likelihood of having a single set of standards. Our findings highlight the importance
of convergence benefits to investors and show that there are both costs and benefits to the use of
a common global accounting standard.
34
APPENDIX
TABLE A1
Sample Selection
Number of observations
All U.S. firms not missing return data on one of 15 events
63,597
Less: observations for firms
with negative book value of
equity
-1,987 61,610
Less: firms missing data for
control variables:a,
-2,325b
- SIZE
- TURNOVER
- LEVERAGE
-1,496
-1,482
-75
Final sample main analysis c 59,285
a EXTR, INSUR, HI-LIT, D(IFRS) are defined at the industry-level, for which there are sufficient data available.
IFRS SALES%, LIFO and BIG4 are equal to zero if Compustat does not report foreign sales, inventory valuation
method or auditor.
b The total number of observations that we lose is not equal to the sum of these three individual components, since
most observations lacking SIZE also lack data for TURNOVER.
c To calculate D(IFRS SIMILAR), D(IFRS SIC3) and D(IFRS ICB), we require either sufficient return data to
calculate economic similarity with peers, or a firm’s ICB industry code in Datastream, which are not always
available. This reduces the number of observations for the cross-sectional analyses with these variables.
TABLE A2
Definition of Variables Used in Cross-Sectional Analyses
Dependent Variable
CR: Three-day cumulative raw return centered on event date for U.S. firm. (Source: CRSP.) STOXX 1800 ex America: Three-day cumulative return for DJ STOXX 1800 Global index
excluding American firms. (Source: Datastream.) STOXX 600 Asia-Pacific: Three-day cumulative return for DJ STOXX 600 Asia-Pacific index
three-day cumulative return. (Source: Datastream.)
CRSTOXX ex Am.: CR adjusted for STOXX 1800 ex America. (Source: CRSP and Datastream.)
CRSTOXX A.P.: CR adjusted for STOXX 600 Asia-Pacific. (Source: CRSP and Datastream.)
Test Variables EXTR: Indicator variable: 1 if firm has SIC2 = 13 or 29 (extractive industries); 0 otherwise.
(Source: Compustat.) INSUR: Indicator variable: 1 if firm has SIC2 = 63 or 64 (insurance industries); 0 otherwise.
(Source: Compustat.) HI-LIT: Indicator variable: 1 if firm has SIC of 2833–2836 (pharmaceutical), 3570–3577
(computer hardware), 3600–3674 (electronics), 5200–5961 (retail), 7371–7379 (computer software), or 8731–8734 (R&D); 0 otherwise. (Source: Compustat.)
D(IFRS): Indicator variable: 1 if IFRS is the most commonly used set of standards among 20 largest firms in industry globally (based on SIC2); 0 otherwise. Examples: if for a given industry, 10 firms use IFRS, 5 firms use U.S. GAAP and the remaining 5 all use different local

35
GAAPs, D(IFRS) = 1 for the firms in this industry. Another example would be that 8 firms use IFRS, 3 use U.S. GAAP and the other 9 each use a different local GAAP; this industry would also be classified as IFRS-predominant. (Source: Worldscope.)
D(IFRS SIMILAR): Indicator variable: 1 if IFRS is the most commonly used set of standards among 20 largest firms in industry globally (based on SIC2) and average yearly correlation in daily stock returns with these firms exceeds median average value; 0 otherwise. We use daily returns for all trading days in the calendar year preceding an event to calculate the correlation. For a given U.S. firm, the correlation is calculated with each of the 20 largest firm peers separately, and then averaged. (Source: Worldscope/Datastream.)
D(IFRS SIC3): Indicator variable: 1 if IFRS is the most commonly used set of standards among 20 largest firms in industry globally (based on SIC3) and average correlation in daily stock returns with these firms exceeds median in year preceding event; 0 otherwise. Calculation of the correlation is as described for D(IFRS SIMILAR). (Source: Worldscope/Datastream.)
D(IFRS ICB): Indicator variable: 1 if IFRS is the most commonly used set of standards among 20 largest firms in industry globally (based on ICB subsectors); 0 otherwise. (Source: Worldscope.)
D(IFRS SALES): Indicator variable: 1 if firm has nonzero foreign sales in countries that require IFRS reporting; 0 otherwise. (Source: Compustat segment file for foreign sales; IASPlus and Sletten and Ramanna (2009) used to identify IFRS countries.)
IFRS SALES%: Firm’s sales in countries that require IFRS relative to its total sales. (Source: Compustat segment file for foreign sales; IASPlus.com and Sletten and Ramanna (2009) used to identify IFRS countries.)
LIFO: Indicator variable: 1 if firm uses LIFO to value its inventory; 0 otherwise. (Source: Compustat.)
D(IFRSWeak): Indicator variable equal to 1 if IFRS is the most commonly used set of standards among 20 largest firms in industry globally (based on SIC2) and the average implementation quality of IFRS is below the median value. Implementation quality is measured using the Kaufmann et al. (2009) country-level rule-of-law score. We calculate the average rule-of-law score across firms applying IFRS in industries where IFRS is most commonly used (i.e., D(IFRS) = 1). (Source: Worldscope for firms’ accounting standards; WorldBank/Kaufmann et al. (2009) for rule of law scores.)
D(IFRSStrong): Indicator variable equal to 1 if IFRS is the most commonly used set of standards among 20 largest firms in industry globally (based on SIC2) and the average implementation quality of IFRS is above the median value. See also D(IFRSWeak) for further details on measure of implementation quality. (Source: Worldscope for firms’ accounting standards; WorldBank/Kaufmann et al. (2009) for rule of law scores.)
ANALYST: Number of estimates (NUMEST) from I/B/E/S, measured at end of quarter preceding event. (Source: I/B/E/S.)
FORINSTIT: Indicator variable: 1 if number of foreign institutional owners exceeds median, measured at end of quarter preceding event. (Source: Thomson Research.)
Earnings Quality Variables (following Francis et al. (2004)) ACCRUAL QUALITY: Standard deviation of residuals of Dechow and Dichev (2002)
regression model, estimated over ten-year windows for each firm separately. Lower values of standard deviation indicate higher accrual quality.
Dechow and Dichev (2002) model:

36
ACC�,�
Assets�,� β�,� β�,�
CFO�,���
Assets�,� β�,�
CFO�,�
Assets�,� β�,�
CFO�,���
Assets�,� ε�,�
where: ACCi,t = total current accruals of firm i in year t, calculated as the difference between income
before extraordinary items and cash flow from operations; Assetsi,t = average assets of firm i in year t;
CFOi,t = cash flow from operations of firm i in year. (Source: Compustat.)
PERSISTENCE: Negative of AR coefficient (γ1,i) in the following first-order autoregressive (AR1) model of earnings, estimated over ten-year windows for each firm separately:
EPS�,� γ�,� γ�,�EPS�,��� ω�,�. (Source: Compustat.)
PREDICTABILITY: Square root of the error variance from AR1 model above (see PERSISTENCE). (Source: Compustat.)
SMOOTHNESS: Standard deviation of firm’s income before extraordinary items/standard deviation of cash flow from operations, calculated over ten-year window. (Source: Compustat.)
VALUE RELEVANCE: R2 of following regression, multiplied by -1 (estimated over ten-year windows for each firm-separately):
R�,� δ�,� δ�,�E�,� δ�,�∆E�,� ��,�
where:
Ri,t = 15-month return of firm i in year t, ending three months after the fiscal year end; Ei,t = income before extraordinary items of firm i in year t, divided by market value of equity at
the end of year t-1; ∆ Ei,t = change of firm i’s income before extraordinary items in year t, divided by market value of
equity at the end of year t-1. (Source: Compustat and CRSP.) TIMELINESS: R2 of following regression, multiplied by -1 (estimated over ten-year windows
for each firm separately):
E�,� θ�,� θ�,�NEG�,� θ�,�R�,� θ�,�NEG�,� ! R�,� φ�,�
where: NEGi,t = 1 if Ri,t < 0, and 0 otherwise, and other variables as defined above. (Source: Compustat
and CRSP.) CONSERVATISM: Defined as -(θ2,i+θ3,i)/θ2,i , see regression model above. (Source: Compustat
and CRSP.)
Control Variables
SIZE: Log of firm’s market value at end of prior calendar year. (Source: CRSP.) HERFINDAHL: Measure of industry concentration (Herfindahl index): sum of each firm’s
squared percentage market-share, calculated at SIC2 level. (Source: Compustat.)
LEVERAGE: Ratio of firm’s total liabilities to total assets. (Source: Compustat.) TURNOVER: Indicator variable: 1 if firm’s mean daily percentage shares traded during calendar
year is above median for all firms; 0 otherwise. (Source: CRSP.)
BIG4: Indicator variable: 1 if firm’s auditor belongs to Big 4; 0 otherwise. (Source: Compustat.)
Non-Event Return Adjustments We use three-day non-event market-adjusted returns as a benchmark for assessing the significance of the overall market reaction in Table 3 and for the alternative t-statistics of the cross-sectional analyses in Tables 4 to 8 (see Armstrong et al. 2010). We start from the first

37
trading day in 2007, and calculate the cumulative return for three consecutive non-event trading days for each U.S. firm in our sample. We subtract the contemporaneous three-day STOXX index return for the same three days, similarly to how we calculate CRSTOXX ex Am. and CRSTOXX A.P. We repeat this for the next three consecutive non-event trading days (i.e., the non-event three-day windows do not overlap) and for all non-event trading days in 2007 and 2008.
Note: All test, earnings quality and control variables are measured at the end of the fiscal year preceding
an event, unless specified otherwise.
REFERENCES
Armstrong, C. S., M. E. Barth, A. D. Jagolinzer and E. J. Riedl. 2010. Market reaction to the
adoption of IFRS in Europe. The Accounting Review 85 (1): 31-61. Ashbaugh, H. and M. Pincus. 2001. Domestic accounting standards, international accounting
standards, and the predictability of earnings. Journal of Accounting Research 39 (3): 417-434. Ball, R., S. P. Kothari and A. Robin. 2000. The effect of international institutional factors on
properties of accounting earnings. Journal of Accounting and Economics 29 (1): 1-51. Ball, R., A. Robin and J. S. Wu. 2003. Incentives versus standards: Properties of accounting
income in four East Asian countries. Journal of Accounting and Economics 36 (1-3): 235-270. Ball, R. and L. Shivakumar. 2005. Earnings quality in UK private firms: Comparative loss
recognition timeliness. Journal of Accounting and Economics 39 (1): 83-128. Barth, M. E. 2008. Global financial reporting: Implications for U.S. academics. The Accounting
Review 83 (5): 1159-1179. Barth, M. E., G. Clinch and T. Shibano. 1999. International accounting harmonization and global
equity markets. Journal of Accounting and Economics 26 (1-3): 201-235. Barth, M. E., W. R. Landsman and M. H. Lang. 2008. International accounting standards and
accounting quality. Journal of Accounting Research 46 (3): 467-498. Beuselinck, C., P. Joos, I. K. Khurana and S. Van der Meulen. 2011. Mandatory IFRS reporting
and stock price informativeness. Working paper. Bothwell, J. L. 2009. Adopting International Financial Reporting Standards for use in the United
States: An economic and public policy perspective. (Study commissioned by the FASB and included as part of the FAF response to the SEC Roadmap).
Botosan, C. A. 1997. Disclosure level and the cost of equity capital. The Accounting Review 72 (3): 323-349.
Bradshaw, M. T., B. J. Bushee and G. S. Miller. 2004. Accounting choice, home bias, and U.S. investment in non-U.S. firms. Journal of Accounting Research 42 (5): 795-841.
Burgstahler, D. C., L. Hail and C. Leuz. 2006. The importance of reporting incentives: Earnings management in European private and public firms. The Accounting Review 81 (5): 983-1016.
Chi, S. 2009. Simultaneous presence of different domestic GAAPs and investors’ limited attention bias in U.S. equity markets: Implications for convergence. Working paper.
Christensen, H. B., E. Lee and M. Walker. 2007. Cross-sectional variation in the economic consequences of international accounting harmonization: The case of mandatory IFRS adoption in the UK. The International Journal of Accounting 42 (4): 341-379.
Curran, R. 2008. Dow Jones Industrials lost 18% in their worst week ever, Wachovia gains 43%, but lost on week; 'Look at me; It's a flush; It's a panic. Wall Street Journal (October 11): B3

38
Daske, H., L. Hail, C. Leuz and R. Verdi. 2008. Mandatory IFRS reporting around the world: Early evidence on the economic consequences. Journal of Accounting Research 46 (5): 1085-1142.
De Franco, G., S. P. Kothari and R. Verdi. 2011. The benefits of financial statement comparability. Journal of Accounting and Economics 49 (4): 895-931.
DeFond, M. L., X. Hu, M. Hung and S. Li. 2011. The impact of mandatory IFRS adoption on foreign mutual fund ownership: The role of comparability. Journal of Accounting and
Economics 51 (3): 240-258. Diamond, D. W. and R. E. Verrecchia. 1991. Disclosure, liquidity, and the cost of capital. The
Journal of Finance 46 (4): 1325-1359. Drake, M. S., L. A. Myers and L. Yao. 2010. Are liquidity improvements around the mandatory
adoption of IFRS attributable to comparability effects or to quality effects? : Working paper. FAF. 2009. Response letter to Roadmap for the potential use of financial statement prepared in
accordance with International Financial Reporting standards (IFRS) by U.S. issuers. Available at: http://www.sec.gov/comments/s7-27-08/s72708-65.pdf.
Fama, E. F. and K. R. French. 1997. Industry costs of equity. Journal of Financial Economics 43: 153-193.
FASB. 1980. Statement of Financial Accounting Concepts No. 2: Qualitative Characteristics of
Accounting Information. Available at: http://www.fasb.org/pdf/con2.pdf. FASB. 2008. Completing the February 2006 Memorandum of Understanding: A progress report
and timetable for completion. Available at: http://www.fasb.org/intl/MOU_09-11-08.pdf. FCAG. 2009. Report of the Financial Crisis Advisory Group. Available at:
http://www.iasb.org/NR/rdonlyres/2D2862CCBEFC-4A1E-8DDC-F159B78C2AA6/0/FCAGReportJuly2009.pdf.
FEI. 2004. FEI special survey on Sarbanes-Oxley Section 404 implementation executive
summary. Available at: http://www.404institute.com/docs/SOXSurveyJuly.pdf. Field, L., M. Lowry and S. Z. Shu. 2005. Does disclosure deter or trigger litigation? Journal of
Accounting and Economics 39: 487-507. Francis, J., R. LaFond, P. M. Olsson and K. Schipper. 2004. Costs of equity and earnings
attributes. The Accounting Review 79 (4): 967-1010. Gompers, P. A. and A. Metrick. 2001. Institutional investors and equity prices. Quarterly
Journal of Economics 116: 229-259. Hail, L., C. Leuz and P. D. Wysocki. 2010. Global accounting convergence and the potential
adoption of IFRS by the U.S. (Part I): Conceptual underpinnings and economic analysis. Accounting Horizons 24 (3): 355-394.
Hand, J. R. M. 2003. The increasing returns-to-scale of intangibles. In Intangible Assets: Values,
Measures and Risks, edited by B. Lev. New York: Oxford University Press. Hewitt, C. W. 2008. Speech by SEC Staff:
Remarks before the 2008 AICPA National Conference on Current SEC and PCAOB
Developments. Speech delivered at the AICPA National Conference in Washington, D.C.,
December 8. Available at: http://www.sec.gov/news/speech/2008/spch120808cwh.htm. Hung, M. 2000. Accounting standards and value relevance of financial statements: An
international analysis. Journal of Accounting and Economics 30 (3): 401-420. IASB. 2011. May. Who we are and what we do. Available at:
http://www.ifrs.org/NR/rdonlyres/F9EC8205-E883-4A53-9972-AD95BD28E0B5/0/WhoWeAre21JULY2010.pdf.

39
Johnson, S. 2009. Mary Schapiro vows to be tough enforcer. CFO.com (January 15). Kasznik, R. and B. Lev. 1995. To warn or not to warn: Management disclosures in the face of an
earnings surprise. The Accounting Review 70 (1): 113-134. Kaufmann, D., A. Kraay and M. Mastruzzi. 2009. Governance natters VIII: Aggregate and
individual governance indicators, 1996-2008. World Bank Policy Research Working Paper No. 4978.
Kothari, S. P., K. Ramanna and D. J. Skinner. 2010. Implications for GAAP from an analysis of positive research in accounting. Journal of Accounting and Economics 50: 246-286.
Kroeker, J. 2009. Speech by SEC staff: Remarks before the 2009 AICPA national conference on
current SEC and PCAOB developments. Speech delivered at the AICPA National Conference
in Washington D.C., December 7. Available at: http://www.sec.gov/news/speech/2009/spch120709pab.htm.
Lambert, R., C. Leuz and R. E. Verrecchia. 2007. Accounting information, disclosure and the cost of capital. Journal of Accounting Research 45 (2): 385-420.
Lang, M., M. Maffett and E. Owens. 2010. Earnings comovement and accounting comparability: The effects of mandatory IFRS adoption. Working paper.
Leuz, C. 2007. Was the Sarbanes–Oxley Act of 2002 really this costly? A discussion of evidence from event returns and going-private decisions. Journal of Accounting and Economics 44: 146-165.
Leuz, C., D. Nanda and P. D. Wysocki. 2003. Earnings management and investor protection: An international comparison. Journal of Financial Economics 69 (3): 505-527.
Leuz, C. and R. E. Verrecchia. 2000. The economic consequences of increased disclosure. Journal of Accounting Research 38 (Supplement): 91-124.
Li, S. 2010. Does mandatory adoption of International Financial Reporting Standards in the European Union reduce the cost of equity capital? The Accounting Review 85 (2): 607-636.
Lin, S. and P. Tanyi. 2010. Market reaction to the potential adoption of International Accounting Standards in the U.S.: Working paper.
Matsumoto, D. A. 2002. Management's incentives to avoid negative earnings surprises. The
Accounting Review 77 (3): 483-514. O'Brien, P. C. and R. Bhushan. 1990. Analyst following and institutional ownership. Journal of
Accounting Research 28 (Supplement): 55-76. Pacter, P. 2005. What exactly is convergence? International Journal of Accounting, Auditing and
Performance Evaluation 2 (1): 67-83. Petersen, M. A. 2009. Estimating standard errors in finance panel data sets: Comparing
approaches. Review of Financial Studies 22 (1): 435-480. SEC. 2007. Concept Release on allowing U.S. issuers to prepare financial statements in
accordance with International Financial Reporting Standards. Release Nos. 33-8831, 34-56217. Washington, D.C.: SEC.
SEC. 2008. Roadmap for the Potential use of financial statements prepared in accordance with International Financial Reporting Standards by U.S. issuers. Release No. 33-8982. Washington, D. C.: SEC.
Sletten, E. and K. Ramanna. 2009. Why do countries adopt International Financial Reporting Standards? : Harvard Business School Accounting & Management Unit Working Paper No. 09-102.
Steverman, B. 2008. Stock market crash: Understanding the panic. Business Week (October 13). Available at: http://www.businessweek.com/investor/content/oct2008/pi2008109_360708.htm.

40
Tweedie, D. 2006, February. Prepared statement of Sir David Tweedie, chairman of the
International Accounting Standards Board before the Economic and Monetary Affairs
Committee of the European Parliament. Available at: http://www.ifrs.org/News/Announcements+and+Speeches/The+IASB+Chairman+Addresses+European+Parliament+-+read+the+full+address.htm.
Wu, J. S. and I. X. Zhang. 2010. Accounting integration and comparability: Evidence from relative performance evaluation around IFRS adoption. Working paper.
Yip, R. W. Y. and D. Young. 2011. Does Mandatory IFRS Adoption Improve Information Comparability? The Accounting Review (forthcoming).
Zeff, S. A. 2007. Some obstacles to global financial reporting comparability and convergence at a high level of quality. The British Accounting Review 39: 290-302.
Zhang, I. X. 2007. Economic consequences of the Sarbanes-Oxley Act of 2002. Journal of
Accounting and Economics: Conference Issue on Corporate Governance: Financial Reporting,
Internal Control, and Auditing 44 (1-2): 74-115.

41
TABLE 1
Summary of Key Events
Event Description of Event
Increasing/
Decreasing
Likelihood
of Adoption
Predicted Market
Reaction if:
Benefits > Costs
(Costs > Benefits)
1) April 24, 2007
SEC announces plan to allow IFRS for U.S. issuers.
Increasing + (-)
2) August 7, 2007
SEC Concept Release on allowing U.S. issuers to prepare financial statements in accordance with IFRS.
Increasing + (-)
3) October 24, 2007
Senate hearing about international accounting standards.
Increasing + (-)
4) November 7, 2007
FAF/FASB positive response to Concept Release. Proposals for improving IASB governance.
Increasing + (-)
5) November 15, 2007
SEC approves elimination of Form 20-F reconciliation requirements for foreign issuers using IFRS as issued by IASB.
Increasing + (-)
6) December 13, 2007
SEC roundtable: Should U.S. switch to IFRS?
Increasing + (-)
7) December 17, 2007
SEC roundtable: What are practical implications of switching to IFRS?
Increasing + (-)
8) April 18, 2008
SEC chairman Cox states that SEC is working on a roadmap for adoption of IFRS.
Increasing + (-)
9) June 16, 2008
FAF/FASB conference on IFRS: Participants voice need for firm date for IFRS adoption.
Increasing + (-)
10) July 21, 2008
IASB officially publishes discussion documents on IASCF Monitoring Group.
Increasing + (-)
11) August 4, 2008
SEC roundtable on performance of IFRS during subprime crisis and progress of IFRS.
Increasing + (-)
12) August, 27, 2008
Outlines of roadmap discussed during open meeting on IFRS held by SEC.
Increasing + (-)
13) October 13, 2008
IASB adapts IAS39. Unsigned ?
14) November 14, 2008
Roadmap for potential use of financial statements prepared in accordance with IFRS by U.S. issuers.
Increasing + (-)
15) January 15, 2009
SEC chairwoman Mary Schapiro expresses doubts about IFRS plans.
Decreasing - (+)
Table 1 presents a summary of all events included in the sample and their expected impact on the likelihood of IFRS adoption.

42
TABLE 2
Descriptive Statistics
Panel A: Distribution of Variables
Variable Mean 25% Median 75% Std
CRSTOXX ex Am. 0.0052 -0.0263 0.0034 0.0342 0.0688
CRSTOXX A.P. 0.0084 -0.0274 0.0069 0.0418 0.0711
EXTR 0.0413 0 0 0 0.1991
INSUR 0.0326 0 0 0 0.1775
HI-LIT 0.2512 0 0 1 0.4337
D(IFRS) 0.4001 0 0 1 0.4899
D(IFRS
SIMILAR) 0.1980 0 0 0 0.3985
D(IFRS SIC3) 0.1613 0 0 0 0.3678
D(IFRS ICB) 0.3748 0 0 1 0.4841
ANALYST 5.3594 1 4 8 5.6724
# FOREIGN
INSTITUTIONAL
OWNERS
10.7341 2 5 11 15.0068
D(IFRS SALES) 0.1961 0 0 0 0.3971
IFRS SALES% 0.2215 0.1057 0.1832 0.2900 0.1701
LIFO 0.0808 0 0 0 0.2726
SIZE 13.1055 11.7442 13.0042 14.3441 1.9274
HERFINDAHL 0.0748 0.0347 0.0509 0.0800 0.0725
LEVERAGE 0.5299 0.3218 0.5308 0.7473 0.2598
TURNOVER 0.5237 0 1 1 0.4994
BIG4 0.6884 0 1 1 0.4632

43
Panel B: Correlations
Variable [1] [2] [3] [4] [5] [6] [7] [8] [9] [10] [11] [12] [13] [14] [15]
[1] CRSTOXX ex Am. 0.02 0.03 -0.03 0.03 0.05 0.05 -0.01 -0.01 0.01 0.08 0.00 0.02 0.03 0.05 [2] EXTR 0.03 -0.04 -0.12 -0.16 0.12 0.04 -0.04 -0.02 0.01 0.07 -0.05 -0.04 0.06 -0.02
[3] INSUR 0.02 -0.04 -0.11 0.15 0.04 0.08 -0.08 -0.06 -0.05 0.10 -0.01 0.12 -0.05 0.07
[4] HI-LIT -0.03 -0.12 -0.11 -0.39 0.13 0.00 0.08 0.06 -0.05 -0.05 -0.14 -0.29 0.15 0.06
[5] D(IFRS) 0.02 -0.16 0.15 -0.39 -0.14 -0.02 -0.22 -0.18 -0.07 0.02 0.00 0.44 -0.22 -0.09
[6] ANALYST 0.07 0.09 0.04 0.11 -0.14 0.70 0.11 0.05 0.11 0.73 0.03 -0.01 0.40 0.42
[7] # FOREIGN
INSTOWN 0.10 0.05 0.08 0.00 -0.04 0.71 0.14 0.08 0.23 0.81 0.05 0.10 0.25 0.37
[8] D(IFRS SALES) 0.01 -0.04 -0.08 0.08 -0.22 0.12 0.15 0.76 0.13 0.13 -0.05 -0.16 0.11 0.12
[9] IFRS SALES% 0.01 -0.04 -0.08 0.08 -0.22 0.12 0.15 0.99 0.07 0.07 -0.05 -0.11 0.08 0.07
[10] LIFO 0.02 0.01 -0.05 -0.05 -0.07 0.12 0.20 0.13 0.13 0.23 0.15 0.02 0.05 0.15
[11] SIZE 0.10 0.08 0.10 -0.05 0.01 0.76 0.88 0.13 0.13 0.22 0.06 0.10 0.36 0.54
[12] HERFINDAHL 0.00 -0.10 0.01 -0.27 0.11 0.02 -0.03 -0.07 -0.07 0.14 0.01 0.03 -0.02 0.02
[13] LEVERAGE 0.02 -0.04 0.12 -0.29 0.45 -0.01 0.05 -0.16 -0.15 0.02 0.10 0.19 -0.15 -0.02
[14] TURNOVER 0.04 0.06 -0.05 0.15 -0.22 0.47 0.47 0.11 0.11 0.05 0.41 -0.05 -0.15 0.34
[15] BIG4 0.06 -0.02 0.07 0.06 -0.09 0.50 0.54 0.12 0.11 0.15 0.57 -0.04 -0.01 0.34 Table 2 presents descriptive statistics for variables used in cross-sectional analyses. For both panels, N = 59,285, except for IFRS SALES% in panel A, where N = 11,628. Panel A presents distributions; correlations are presented in Panel B (Pearson (Spearman) correlations are above (below) diagonal). Distributional statistics of IFRS SALES% in panel A are for firms that have non-zero sales in IFRS countries. Correlations in bold are significant at 5% level or less for two-tailed tests. Variable definitions are given in the Appendix.

44
TABLE 3
Overall Reaction to Events Affecting Likelihood of IFRS Adoption
Event date Impact on
Adoption Likelihood CR
S&P 500
index
STOXX 1800
ex America
CRSTOXX
ex Am.
STOXX 600
Asia-Pacific
CRSTOXX
A.P. VIX
April 24, 2007 Increasing 0.0065 0.0075 -0.0043 0.0108 -0.0099 0.0164 13.12 August 7, 2007 Increasing 0.0443 0.0444 0.0172 0.0271 0.0038 0.0405 21.98 October 24, 2007 Increasing 0.0039 0.0054 0.0135 -0.0096 0.0055 -0.0016 20.79 November 7, 2007 Increasing -0.0162 -0.0179 -0.0116 -0.0046 -0.0214 0.0052 24.68 November 15, 2007 Increasing -0.0161 -0.0151 -0.0041 -0.0121 0.0057 -0.0219 26.50 December 13, 2007 Increasing -0.0103 -0.0065 -0.0262 0.0159 -0.0430 0.0328 22.77 December 17, 2007 Increasing -0.0229 -0.0225 -0.0214 -0.0014 -0.0361 0.0132 23.48 April 18, 2008 Increasing 0.0136 0.0172 0.0216 -0.0080 0.0387 -0.0252 20.33 June 16, 2008 Increasing 0.0099 0.0084 0.0139 -0.0039 0.0243 -0.0144 21.10 July 21, 2008 Increasing 0.0145 0.0132 0.0175 -0.0029 0.0211 -0.0066 22.76 August 4, 2008 Increasing 0.0072 0.0142 -0.0175 0.0247 -0.0394 0.0466 22.40 August 27, 2008 Increasing 0.0289 0.0265 0.0081 0.0209 -0.0089 0.0378 19.89 October 13, 2008 Unsigned 0.1070 0.0987 0.0601 0.0470 0.0607 0.0463 60.02 November 14, 2008 Increasing -0.0014 0.0017 -0.0252 0.0238 -0.0361 0.0347 65.10 January 15, 2009 Decreasing -0.0321 -0.0246 -0.0300 -0.0020 -0.0063 -0.0258 48.75
Mean return across events 0.0134 0.0133 0.0048 0.0086 -0.0019 0.0153 T-statistic regular 1.94* 2.39**
(two-sided p-value) (0.0724) (0.0318) Non-event average -0.0006 -0.0040
T-statistic non-event 2.08* 3.00*** (two-sided p-value) (0.0563) (0.0095)
Mean return excluding event 13 0.0067 0.0072 0.0008 0.0059 -0.0064 0.0131 T-statistic regular 1.57 2.02*
(two-sided p-value) (0.1408) (0.0641) T-statistic non-event 1.73 2.64**
(two-sided p-value) (0.1072) (0.0206)
Table 3 presents the value-weighted mean return by event. We multiply returns for event 15 by -1 to calculate the mean across events (see footnote 17). Variables are as defined in the Appendix. S&P500 index is three-day cumulative return for S&P500 index. VIX is the three-day average Chicago Board Options Exchange (CBOE) volatility index. T-statistic regular shows significance of mean return across events with H0 = 0. For T-statistic non-event, H0 = mean of non-overlapping STOXX-adjusted three-day non-event returns over 2007 and 2008. *, **, and *** indicate significance at 0.10, 0.05, and 0.01 levels, respectively.
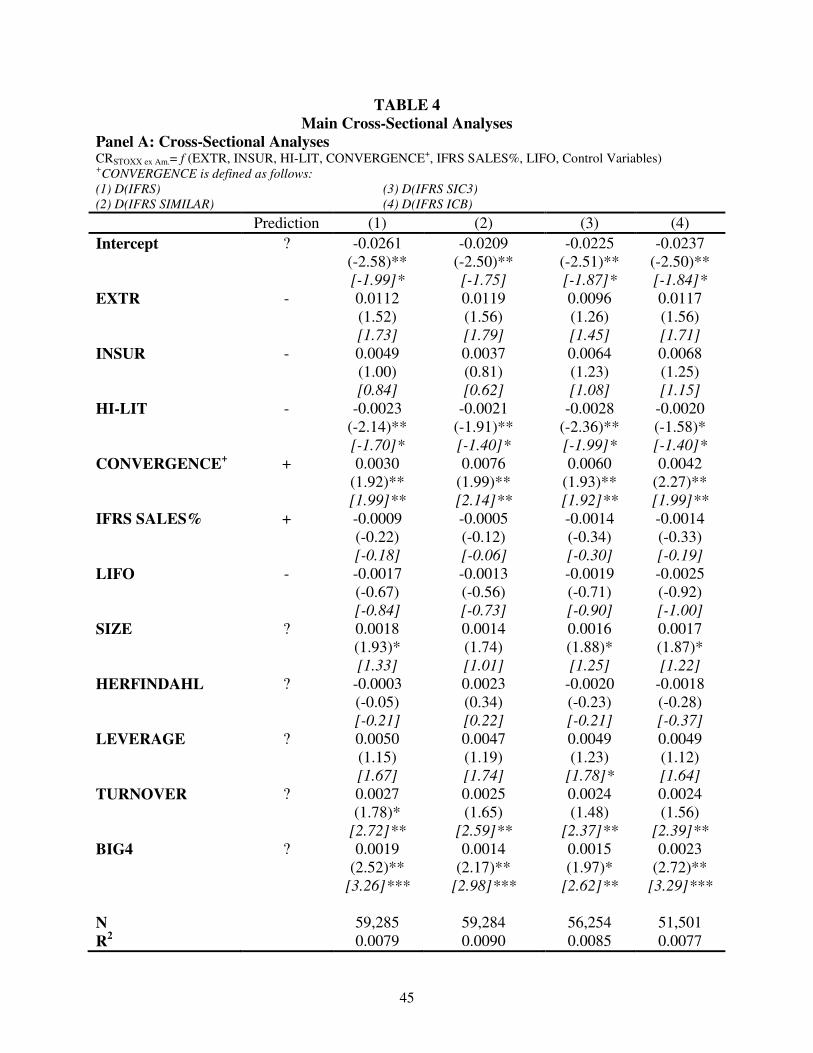
45
TABLE 4
Main Cross-Sectional Analyses
Panel A: Cross-Sectional Analyses CRSTOXX ex Am.= f (EXTR, INSUR, HI-LIT, CONVERGENCE+, IFRS SALES%, LIFO, Control Variables) +CONVERGENCE is defined as follows:
(1) D(IFRS) (3) D(IFRS SIC3)
(2) D(IFRS SIMILAR) (4) D(IFRS ICB)
Prediction (1) (2) (3) (4)
Intercept ? -0.0261 -0.0209 -0.0225 -0.0237 (-2.58)** (-2.50)** (-2.51)** (-2.50)** [-1.99]* [-1.75] [-1.87]* [-1.84]*
EXTR - 0.0112 0.0119 0.0096 0.0117 (1.52) (1.56) (1.26) (1.56) [1.73] [1.79] [1.45] [1.71]
INSUR - 0.0049 0.0037 0.0064 0.0068 (1.00) (0.81) (1.23) (1.25) [0.84] [0.62] [1.08] [1.15]
HI-LIT - -0.0023 -0.0021 -0.0028 -0.0020 (-2.14)** (-1.91)** (-2.36)** (-1.58)* [-1.70]* [-1.40]* [-1.99]* [-1.40]*
CONVERGENCE+ + 0.0030 0.0076 0.0060 0.0042
(1.92)** (1.99)** (1.93)** (2.27)** [1.99]** [2.14]** [1.92]** [1.99]**
IFRS SALES% + -0.0009 -0.0005 -0.0014 -0.0014 (-0.22) (-0.12) (-0.34) (-0.33)
[-0.18] [-0.06] [-0.30] [-0.19]
LIFO - -0.0017 -0.0013 -0.0019 -0.0025 (-0.67) (-0.56) (-0.71) (-0.92) [-0.84] [-0.73] [-0.90] [-1.00]
SIZE ? 0.0018 0.0014 0.0016 0.0017 (1.93)* (1.74) (1.88)* (1.87)* [1.33] [1.01] [1.25] [1.22]
HERFINDAHL ? -0.0003 0.0023 -0.0020 -0.0018 (-0.05) (0.34) (-0.23) (-0.28) [-0.21] [0.22] [-0.21] [-0.37]
LEVERAGE ? 0.0050 0.0047 0.0049 0.0049 (1.15) (1.19) (1.23) (1.12) [1.67] [1.74] [1.78]* [1.64]
TURNOVER ? 0.0027 0.0025 0.0024 0.0024 (1.78)* (1.65) (1.48) (1.56) [2.72]** [2.59]** [2.37]** [2.39]**
BIG4 ? 0.0019 0.0014 0.0015 0.0023 (2.52)** (2.17)** (1.97)* (2.72)** [3.26]*** [2.98]*** [2.62]** [3.29]***
N 59,285 59,284 56,254 51,501 R
2 0.0079 0.0090 0.0085 0.0077

46
Panel B: Correlations D(IFRS) Measures
D(IFRS) D(IFRS
SIMILAR)
D(IFRS
SIC3)
D(IFRS
SIMILAR) 0.608
D(IFRS SIC3) 0.344 0.542
D(IFRS ICB) 0.514 0.286 0.328
Table 4 Panel A presents main cross-sectional analyses. Each model includes a different measure of convergence benefits; numbers correspond to variables defined above table. T-statistics in parentheses are based on White standard errors that are also clustered at event level. T-statistics in square brackets are from comparison of coefficients for three-day event-returns (reported in table) and coefficients with three-day non-event returns as dependent variable. The non-event coefficient is used as the benchmark value instead of assuming H0 = 0.*, **, and *** indicate significance at 0.10, 0.05, and 0.01 levels, respectively (two-sided, unless direction is predicted). Spearman correlations between the different convergence benefit measures are provided in Panel B; all correlations are significant at less than the 0.01 level. Variables are as defined in the Appendix.
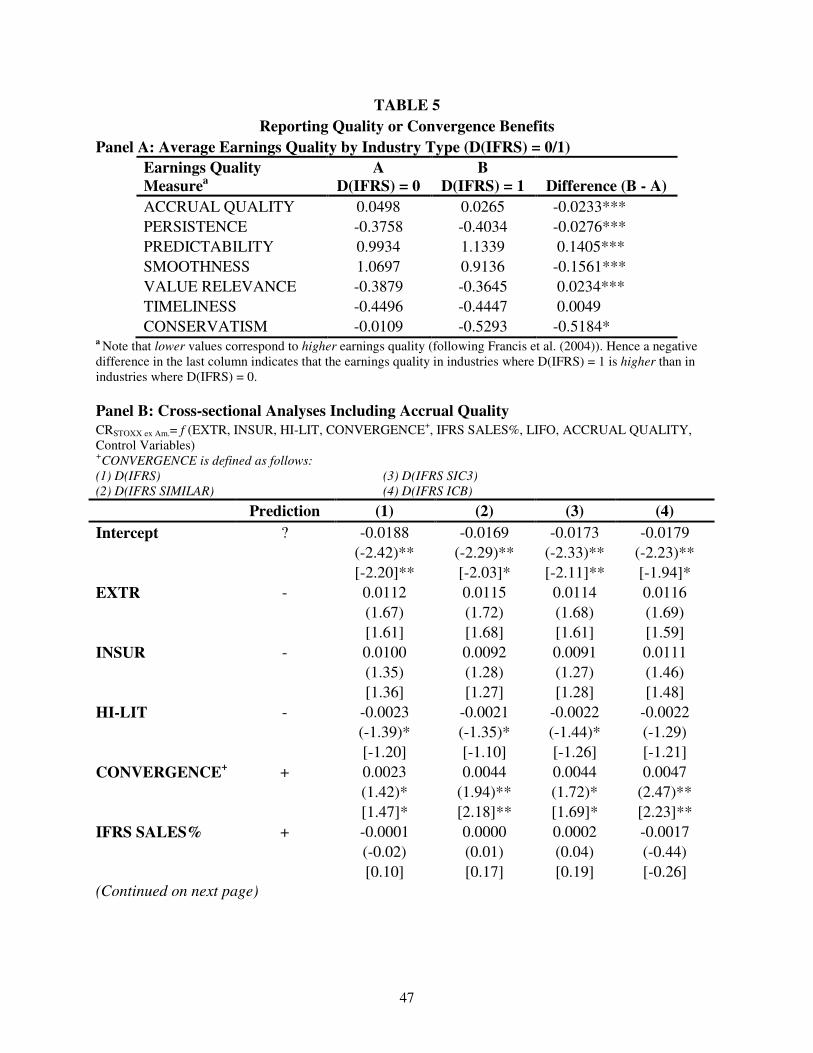
47
TABLE 5
Reporting Quality or Convergence Benefits
Panel A: Average Earnings Quality by Industry Type (D(IFRS) = 0/1)
Earnings Quality
Measurea
A
D(IFRS) = 0
B
D(IFRS) = 1 Difference (B - A)
ACCRUAL QUALITY 0.0498 0.0265 -0.0233***
PERSISTENCE -0.3758 -0.4034 -0.0276***
PREDICTABILITY 0.9934 1.1339 0.1405***
SMOOTHNESS 1.0697 0.9136 -0.1561***
VALUE RELEVANCE -0.3879 -0.3645 0.0234***
TIMELINESS -0.4496 -0.4447 0.0049
CONSERVATISM -0.0109 -0.5293 -0.5184* a Note that lower values correspond to higher earnings quality (following Francis et al. (2004)). Hence a negative difference in the last column indicates that the earnings quality in industries where D(IFRS) = 1 is higher than in industries where D(IFRS) = 0.
Panel B: Cross-sectional Analyses Including Accrual Quality
CRSTOXX ex Am.= f (EXTR, INSUR, HI-LIT, CONVERGENCE+, IFRS SALES%, LIFO, ACCRUAL QUALITY, Control Variables) +CONVERGENCE is defined as follows:
(1) D(IFRS) (3) D(IFRS SIC3)
(2) D(IFRS SIMILAR) (4) D(IFRS ICB)
Prediction (1) (2) (3) (4)
Intercept ? -0.0188 -0.0169 -0.0173 -0.0179
(-2.42)** (-2.29)** (-2.33)** (-2.23)**
[-2.20]** [-2.03]* [-2.11]** [-1.94]*
EXTR - 0.0112 0.0115 0.0114 0.0116
(1.67) (1.72) (1.68) (1.69)
[1.61] [1.68] [1.61] [1.59]
INSUR - 0.0100 0.0092 0.0091 0.0111
(1.35) (1.28) (1.27) (1.46)
[1.36] [1.27] [1.28] [1.48]
HI-LIT - -0.0023 -0.0021 -0.0022 -0.0022
(-1.39)* (-1.35)* (-1.44)* (-1.29)
[-1.20] [-1.10] [-1.26] [-1.21]
CONVERGENCE+ + 0.0023 0.0044 0.0044 0.0047
(1.42)* (1.94)** (1.72)* (2.47)**
[1.47]* [2.18]** [1.69]* [2.23]**
IFRS SALES% + -0.0001 0.0000 0.0002 -0.0017
(-0.02) (0.01) (0.04) (-0.44)
[0.10] [0.17] [0.19] [-0.26]
(Continued on next page)

48
LIFO - 0.0007 0.0009 0.0010 0.0000
(0.50) (0.64) (0.73) (-0.02)
[0.51] [0.68] [0.62] [0.10]
ACCRUAL ? -0.0083 -0.0080 -0.0072 0.0031
QUALITY (-0.43) (-0.42) (-0.37) (0.14)
[0.38] [0.40] [0.39] [0.84]
SIZE ? 0.0013 0.0011 0.0012 0.0012
(1.73) (1.61) (1.65) (1.58)
[1.23] [1.06] [1.14] [1.03]
HERFINDAHL ? -0.0041 -0.0026 -0.0015 -0.0041
(-0.42) (-0.26) (-0.16) (-0.39)
[-0.39] [-0.21] [0.17] [-0.38]
LEVERAGE ? 0.0039 0.0037 0.0035 0.0044
(0.99) (0.93) (0.91) (1.08)
[1.89]* [1.81]* [1.79]* [1.91]*
TURNOVER ? 0.0019 0.0018 0.0018 0.0018
(1.09) (1.00) (1.02) (1.02)
[1.77]* [1.69] [1.72] [1.67]
BIG4 ? 0.0021 0.0020 0.0020 0.0020
(2.19)** (2.16)** (2.18)** (2.16)**
[2.98]*** [2.97]** [2.95]** [3.15]*** N 28,117 28,117 28,117 25,378
R2 0.0087 0.0091 0.0091 0.0089
Table 5 presents sensitivity analyses to assess whether reporting quality is a credible explanation for convergence
benefit proxies. Panel A presents average earnings quality in industries that are IFRS-predominant versus those that
are not. If reporting quality explains the positive coefficient on the convergence benefit proxies in Table 4, we
expect to observe lower reporting quality (i.e., high values on these earnings quality measures) for industries where
D(IFRS) = 1. Panel B presents the results for cross-sectional analyses controlling for ACCRUAL QUALITY (for
parsimony, results including the other earnings quality measures are untabulated). Calculation of earnings quality
measures follows Francis et al. (2004); as these are estimated on a ten-year rolling window basis, the number of
observations drops compared to Table 4. For calculation of t-statistics (in parentheses), see footnote to Table 4. *,
**, and *** indicate significance at 0.10, 0.05, and 0.01 levels, respectively (two-sided, unless direction is
predicted). Variables are as defined in the Appendix.

49
TABLE 6
Additional Sensitivity Analyses
Prediction
(1)
Prediction
(2) (3) (4)
Implementation
Quality IFRS
Analyst Following/
Foreign Institutional
Ownership
STOXX 600
AP Market
Adjustment
Exclude
Event 13
Intercept ? -0.0262 Intercept ? -0.0151 -0.0107 -0.0172 (-2.63)** (-1.29) (-0.92) (-2.12)* [-2.04]* [-0.69] [-0.01] [-1.35]
EXTR - 0.0112 EXTR - 0.0119 0.0119 0.0076 (1.51) (1.55) (1.58) (1.13) [1.72] [1.76] [1.84] [1.38]
INSUR - 0.0052 INSUR - 0.0037 0.0039 0.0001 (1.00) (0.80) (0.87) (0.03) [0.86] [0.61] [0.65] [-0.27]
HI-LIT - -0.0024 HI-LIT - -0.0020 -0.0024 -0.0018 (-2.18)** (-1.93)** (-2.26)** (-1.63)* [-1.74]* [-1.50]* [-1.68]* [-1.13]
D(IFRSWeak) ? 0.0026 D(IFRS
SIMILAR)
+ 0.0073 0.0071 0.0052 (1.14) (2.02)** (1.79)** (1.60)* [1.12] [2.22]** [2.04]** [1.78]**
D(IFRSStrong) + 0.0037 ANALYST + 0.0000 (1.69)* (0.01) [1.82]** [0.32]
FORINSTIT + 0.0035 (1.94)** [1.65]*
IFRS SALES% + -0.0011 IFRS SALES% + -0.0007 -0.0007 0.0018 (-0.25) (-0.17) (-0.18) (0.55) [-0.22] [-0.09] [-0.01] [0.62]
(Continued on next page)

50
LIFO - -0.0018 LIFO - -0.0014 -0.0007 0.0001 (-0.72) (-0.58) (-0.34) (0.03) [-0.91] [-0.70] [-0.50] [-0.17]
SIZE ? 0.0018 SIZE ? 0.0009 0.0011 0.0011 (1.97)* (0.79) (1.06) (1.32) [1.37] [0.20] [0.41] [0.59]
HERFINDAHL ? -0.0005 HERFINDAHL ? 0.0031 -0.0033 0.0045 (-0.08) (0.45) (-0.48) (0.68) [-0.25] [0.32] [-0.45] [0.56]
LEVERAGE ? 0.0053 LEVERAGE ? 0.0046 0.0053 0.0031 (1.09) (1.19) (1.27) (0.80) [1.56] [1.74] [1.83]* [1.35]
TURNOVER ? 0.0026 TURNOVER ? 0.0017 0.0029 0.0020 (1.76)* (1.00) (1.77)* (1.25) [2.71]** [1.84]* [2.74]** [2.14]**
BIG4 ? 0.0018 BIG4 ? 0.0011 0.0020 0.0013 (2.60)** (1.65) (2.43)** (1.89)*
[3.37]*** [2.51]** [3.14]*** [2.65]**
N 59,285 59,284 59,284 55,784 R
2 0.0079 0.0093 0.0080 0.0058
Table 6 presents additional sensitivity analyses, where we differentiate between industries where IFRS is predominant based on average IFRS implementation quality (column 1), include analyst following and foreign institutional ownership (column 2), use an alternative market index to adjust returns (STOXX 600 Asia-Pacific index) (column 3) and exclude event 13 from the analyses (column 4). Variables are as defined in the Appendix. For calculation of t-statistics (in parentheses and square brackets), see footnote to Table 4. *, **, and *** indicate significance at 0.10, 0.05, and 0.01 levels, respectively (two-sided, unless direction is predicted).