iowa pm2.5 24-hr design values 2004-2006 iowa continuous pm2.5 monitors zero air test initial...
TRANSCRIPT

#S
#S
#S
#S
#S
#S
#S
#S
#S#S
#S
Mason City
Waterloo
Cedar Rapids
Iowa City
Davenport
Clinton
Des Moines
Council Bluffs
Sioux CityDubuque
30
34
35
30
28
3428
30
32
25
28
Viking Lake
Muscatine
Iowa PM2.5 24-hr Design Values 2004-2006Iowa Continuous PM2.5 Monitors
Zero Air Test
Initial Results using New Continuous PM2.5
Monitoring Designs in Iowa
Sean Fitzsimmons, Iowa DNR
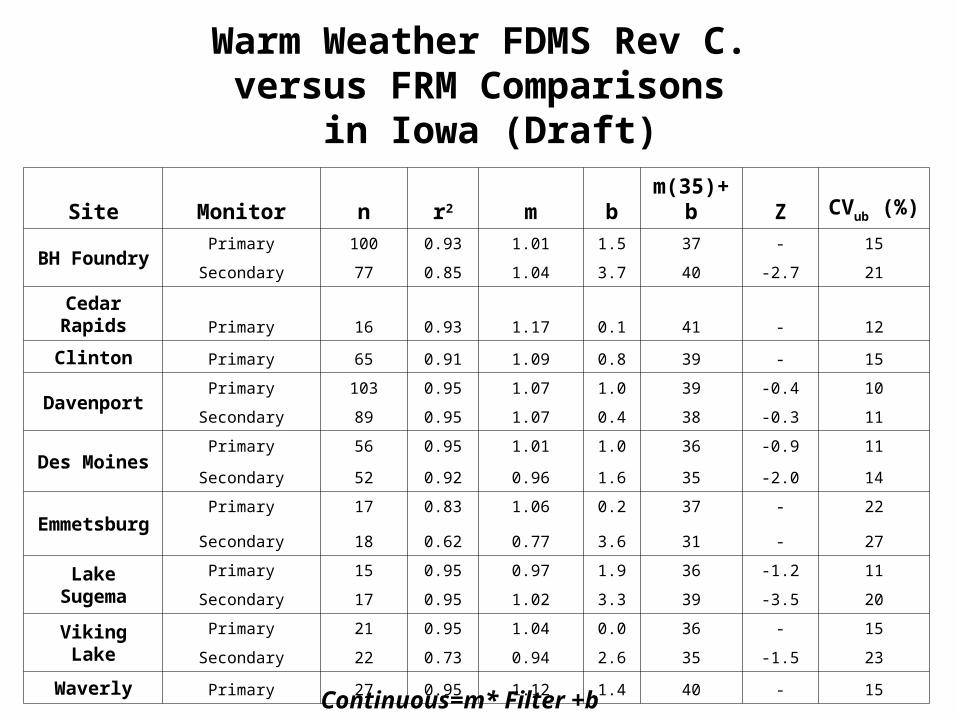
Warm Weather FDMS Rev C. versus FRM Comparisons
in Iowa (Draft)
Site Monitor n r2 m b m(35)+b Z CVub (%)
BH FoundryPrimary 100 0.93 1.01 1.5 37 - 15
Secondary 77 0.85 1.04 3.7 40 -2.7 21
Cedar Rapids Primary 16 0.93 1.17 0.1 41 - 12
Clinton Primary 65 0.91 1.09 0.8 39 - 15
DavenportPrimary 103 0.95 1.07 1.0 39 -0.4 10
Secondary 89 0.95 1.07 0.4 38 -0.3 11
Des MoinesPrimary 56 0.95 1.01 1.0 36 -0.9 11
Secondary 52 0.92 0.96 1.6 35 -2.0 14
EmmetsburgPrimary 17 0.83 1.06 0.2 37 - 22
Secondary 18 0.62 0.77 3.6 31 - 27
Lake Sugema
Primary 15 0.95 0.97 1.9 36 -1.2 11
Secondary 17 0.95 1.02 3.3 39 -3.5 20
Viking LakePrimary 21 0.95 1.04 0.0 36 - 15
Secondary 22 0.73 0.94 2.6 35 -1.5 23
Waverly Primary 27 0.95 1.12 1.4 40 - 15
Continuous=m* Filter +b
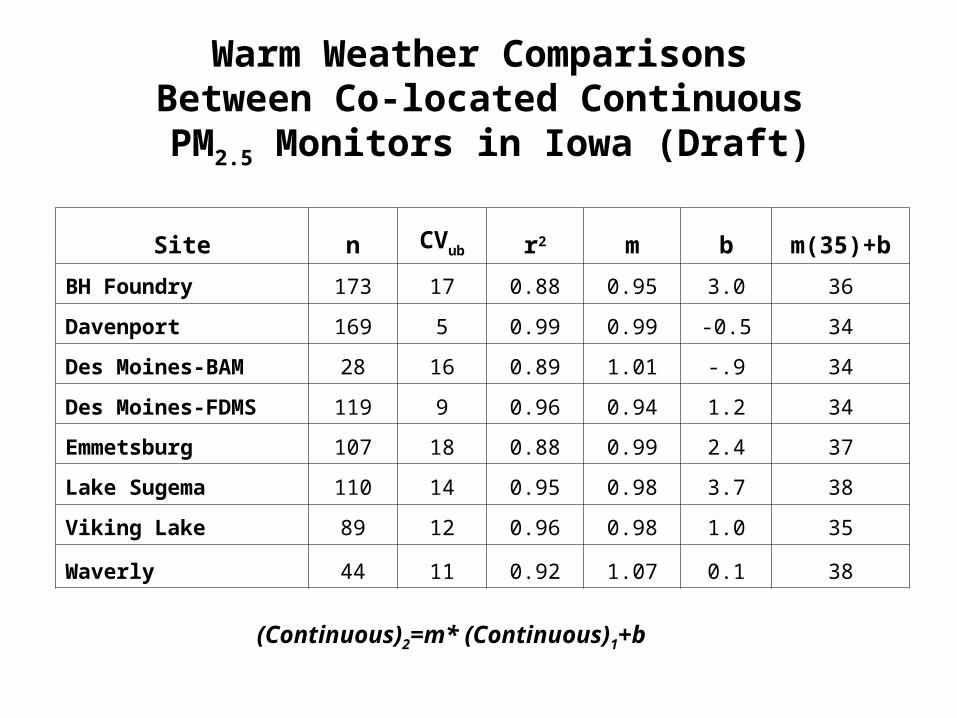
Warm Weather Comparisons Between Co-located Continuous
PM2.5 Monitors in Iowa (Draft)
Site n CVub r2 m b m(35)+b
BH Foundry 173 17 0.88 0.95 3.0 36
Davenport 169 5 0.99 0.99 -0.5 34
Des Moines-BAM 28 16 0.89 1.01 -.9 34
Des Moines-FDMS 119 9 0.96 0.94 1.2 34
Emmetsburg 107 18 0.88 0.99 2.4 37
Lake Sugema 110 14 0.95 0.98 3.7 38
Viking Lake 89 12 0.96 0.98 1.0 35
Waverly 44 11 0.92 1.07 0.1 38
(Continuous)2=m* (Continuous)1+b
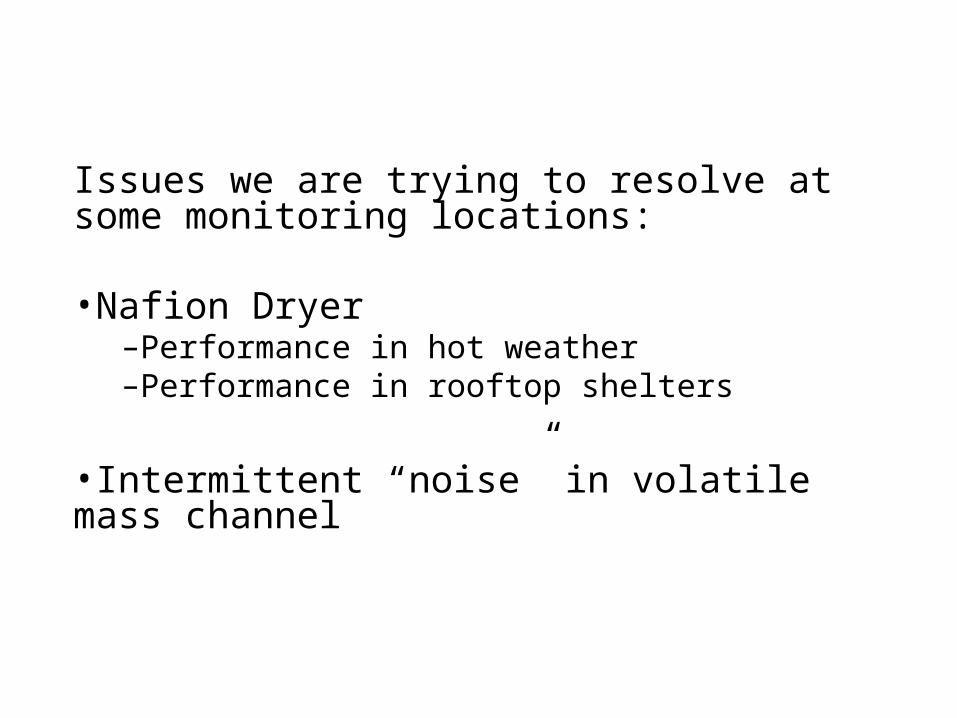
Issues we are trying to resolve at some monitoring locations:
•Nafion Dryer –Performance in hot weather–Performance in rooftop shelters
•Intermittent “noise” in volatile mass channel