iridium, ruthenium and osmium distribution in gold jewellery. presented … · iridium, ruthenium...
TRANSCRIPT

An MKS PAMP GROUP Company
Iridium, Ruthenium and Osmium distribution in Gold Jewellery. Presented by Ankur Goyal and Pankaj Deshmukh
20th March 2017 LBMA Assaying and Refining Conference

Objectives 1.
2
An MKS PAMP GROUP Company
Iridium – Ruthenium – Osmium in Gold
3
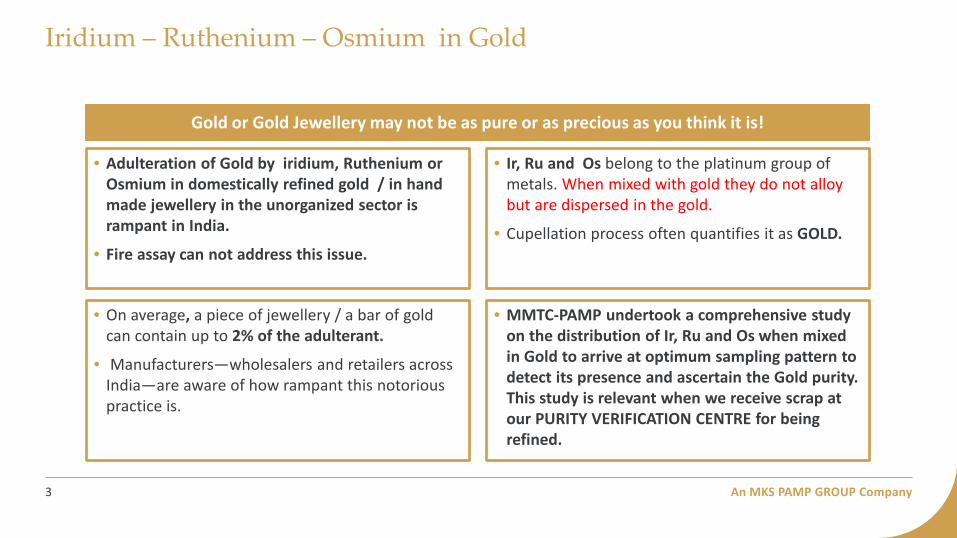
• Adulteration of Gold by iridium, Ruthenium or Osmium in domestically refined gold / in hand made jewellery in the unorganized sector is rampant in India.
• Fire assay can not address this issue.
Gold or Gold Jewellery may not be as pure or as precious as you think it is!
• On average, a piece of jewellery / a bar of gold can contain up to 2% of the adulterant.
• Manufacturers—wholesalers and retailers across India—are aware of how rampant this notorious practice is.
• MMTC-PAMP undertook a comprehensive study on the distribution of Ir, Ru and Os when mixed in Gold to arrive at optimum sampling pattern to detect its presence and ascertain the Gold purity. This study is relevant when we receive scrap at our PURITY VERIFICATION CENTRE for being refined.
• Ir, Ru and Os belong to the platinum group of metals. When mixed with gold they do not alloy but are dispersed in the gold.
• Cupellation process often quantifies it as GOLD.

An MKS PAMP GROUP Company
Detect distribution of Ir, Ru and Os (PGM) when added to Gold
4
Ir, Ru and Os addition ranging from 0.1% to 0.5% with following combination: Iridium; Iridium and Ruthenium; Iridium and Osmium
Effect on distribution of PGM while melting different quantities of metal ranging from 100 gm to 1600 gm
Melting in 2 types of induction furnaces with capacity of 500 gm and 2 kg
1
3
2

Properties of Ir, Ru ,Os 2.
5

An MKS PAMP GROUP Company
Properties of PGMs
6
Element Atomic Mass
Atomic number
Melting point
(Deg C)
Boiling point
(Deg C)
Heat of fusion
(KJ/mol)
Heat of vaporisation
(KJ/mol)
Vickers Hardness
(HV)
Density
(g/cm3)
Thermal Conducti
vity (W/m.K)
Thermal Expansio
n (μ.m/mK @ 25deg
)
Crystal Structure
Gold 196.96 79 1064.18 2970 12.56 342 19.7 – 22.02 19.3 318 14.2 F.C.C.*
Silver 107.86 47 961.78 2163 11.28 254 25.59 10.49 429 18.9 F.C.C.*
Copper 63.54 29 1084 2562 13.26 300.4 34.98 – 37.62 8.96 401 16.5 F.C.C.*
Iridium 77 77 2446 4130 41.12 564 179.5 -224.29 22.56 147 6.4 F.C.C.*
Osmium 190.23 76 3033 5012 31 378 NA 22.59 86.75 5.1 H.C.P**
Ruthenium 101.7 44 2334 4150 38.59 619 NA 12.45 117 6.4 H.C.P**
* Face centered Cubic system ** Hexagonal closed packed
An MKS PAMP GROUP Company
Ir, Ru, Os have a few salient features
7
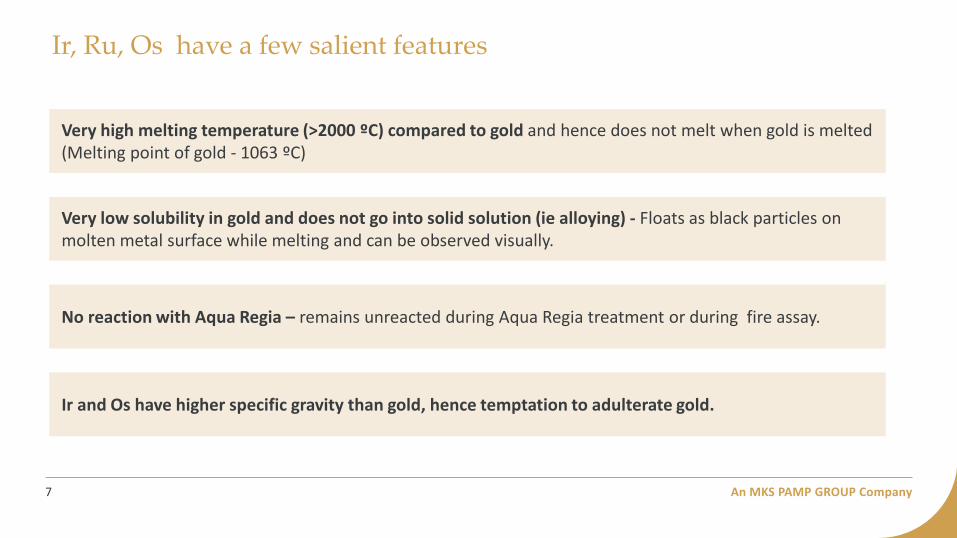
Very high melting temperature (>2000 ºC) compared to gold and hence does not melt when gold is melted (Melting point of gold - 1063 ºC)
Ir and Os have higher specific gravity than gold, hence temptation to adulterate gold.
Very low solubility in gold and does not go into solid solution (ie alloying) - Floats as black particles on molten metal surface while melting and can be observed visually.
No reaction with Aqua Regia – remains unreacted during Aqua Regia treatment or during fire assay.

An MKS PAMP GROUP Company
Advantages and Disadvantages
8
• The process of Jewellery fabrication by cold working involves annealing which is to restore alloy ductility by recrystallization of the work-hardened structure.
• Annealing leads to coarse grained structure and addition of 0.01 to 0.1% Iridium, Ruthenium or Osmium restricts grain growth resulting into fine grain structure. The finer the grains better is its workability and also improves surface quality.
• Ir, Ru and Os When mixed with gold, do not form an alloy but are dispersed in the Gold
• On testing by Cupellation process these elements are found in the final gold cornet but cannot be quantified so is taken as GOLD
• Its difficult to remove these elements by Chemical or electrolytic process easily.
• Results in customer not getting accurate value of Gold.
Disadvantages Advantages
FIRE ASSAY-X-RAY – SEM a quick overview 3.
9
An MKS PAMP GROUP Company
Fire Assay
10
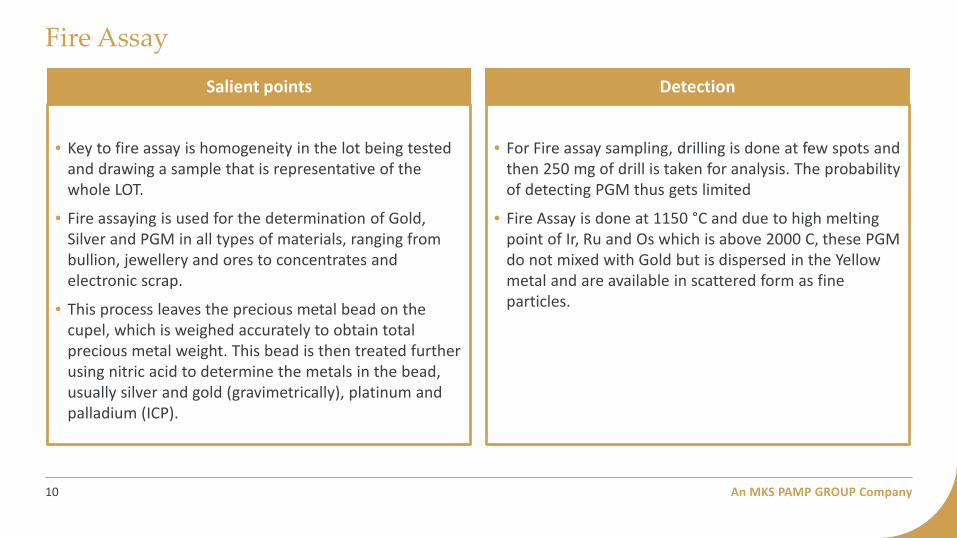
• Key to fire assay is homogeneity in the lot being tested and drawing a sample that is representative of the whole LOT.
• Fire assaying is used for the determination of Gold, Silver and PGM in all types of materials, ranging from bullion, jewellery and ores to concentrates and electronic scrap.
• This process leaves the precious metal bead on the cupel, which is weighed accurately to obtain total precious metal weight. This bead is then treated further using nitric acid to determine the metals in the bead, usually silver and gold (gravimetrically), platinum and palladium (ICP).
Salient points
• For Fire assay sampling, drilling is done at few spots and then 250 mg of drill is taken for analysis. The probability of detecting PGM thus gets limited
• Fire Assay is done at 1150 °C and due to high melting point of Ir, Ru and Os which is above 2000 C, these PGM do not mixed with Gold but is dispersed in the Yellow metal and are available in scattered form as fine particles.
Detection

An MKS PAMP GROUP Company
Fire Assay
11
1 2 3 4 5 6
7 8 9 10 11 12
An MKS PAMP GROUP Company
Fire assay gives only the qualitative evaluation
12
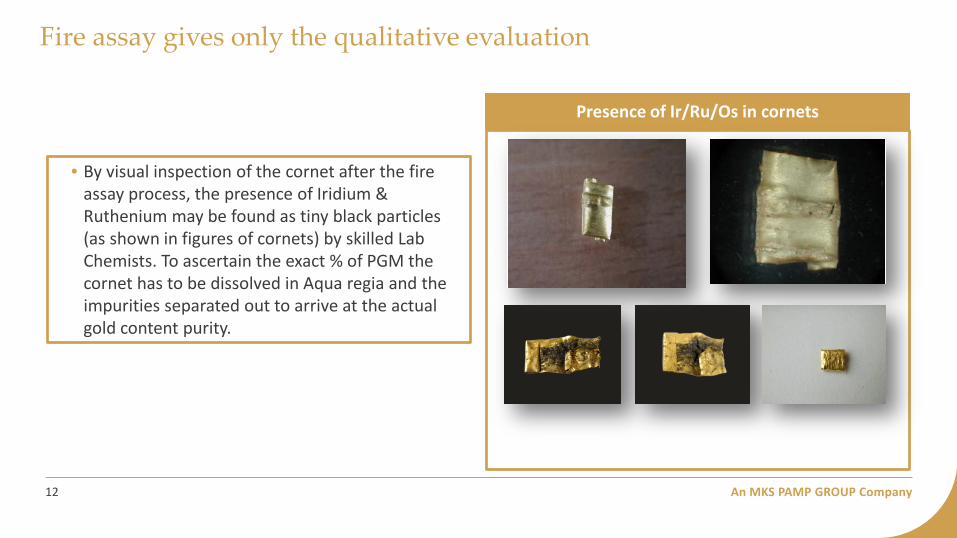
Presence of Ir/Ru/Os in cornets
• By visual inspection of the cornet after the fire assay process, the presence of Iridium & Ruthenium may be found as tiny black particles (as shown in figures of cornets) by skilled Lab Chemists. To ascertain the exact % of PGM the cornet has to be dissolved in Aqua regia and the impurities separated out to arrive at the actual gold content purity.
An MKS PAMP GROUP Company
XRF - X-ray Fluorescence
13
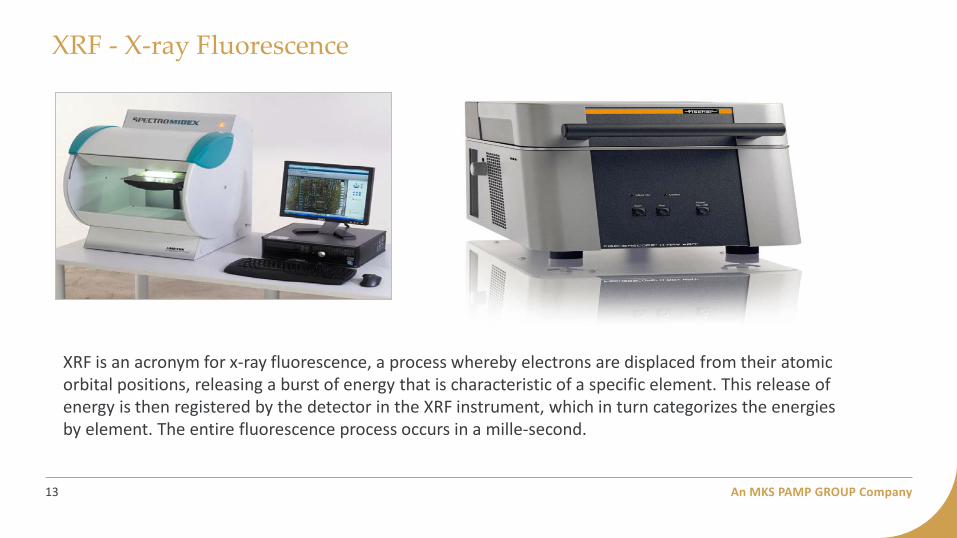
XRF is an acronym for x-ray fluorescence, a process whereby electrons are displaced from their atomic orbital positions, releasing a burst of energy that is characteristic of a specific element. This release of energy is then registered by the detector in the XRF instrument, which in turn categorizes the energies by element. The entire fluorescence process occurs in a mille-second.

An MKS PAMP GROUP Company
XRF Spectrometer – Equipment Details
14
Specification Spectro Fischer
Model XRF SPECTRO MIDEX LD XRF FISCHER XAN250
Measuring distance 0….4.4mm 0……10mm(0…..0.4in)
Detection system Si-drift detector with Peltier cooling: Si-drift detector with Peltier cooling
X-ray source X-ray tube with Mo anode Micro focus tube with tungsten target & Beryllium window
Detector position Upper chamber Lower chamber

An MKS PAMP GROUP Company
X-ray Fluorescence Spectrometry (XRF)
15
• Well suited technique for determination of trace elements as testing is carried out directly on the solid sample and not by acid digestion.
• The precision of the XRF technique is normally very high and is demonstrated by evaluation of replicate results.
• Accuracy on the other hand depends heavily on two factors: the attenuation-enhancement correction procedure used to correct matrix effects caused by concomitant elements, and reference standards used in calibration procedures.
• Laboratories analyzing samples with variable matrices require a high skilled professional along with proficiency in the XRF technique to produce accurate data.
Salient features
• XRF Spectrometer can be used to check/detect the presence of Iridium and Ruthenium impurities in Gold Alloys. The resolution of Semi-conductor Detector is 4 times (approx.) of the Gas-filled Proportional counter, and is thus able to resolve /separate the peaks of interest.
• XRF gives the purity at each spot, thereby increasing the probability of detection of these PGM which is very unevenly distributed in the ingot/sample.
• XRF usage is significant to detect lack of homogeneity, and is an invaluable tool for identifying locations for drawing samples from hand-made jewellery
Detection of PGM

An MKS PAMP GROUP Company
XRF
16
• XRF gives an accurate percentage of PGM with the tolerance level of +/- 0.1%
• The Gold, Iridium, Silver & Ru spectra using proportional counter detector and Silicon PIN Detector (SiPIN) are shown in the figures alongside.
X-ray Fluorescence Spectrometry (XRF)

An MKS PAMP GROUP Company
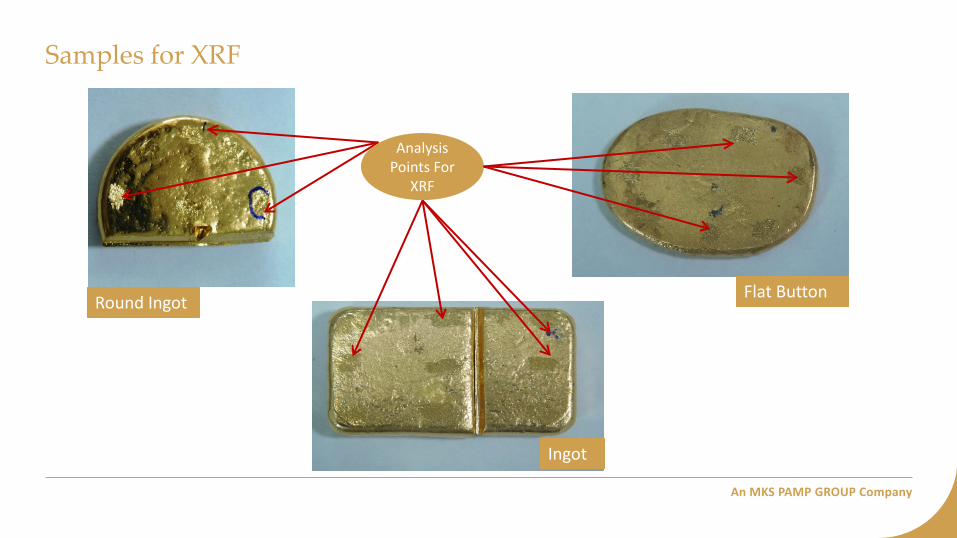
Round Ingot Flat Button
Ingot
Analysis Points For
XRF
Samples for XRF

An MKS PAMP GROUP Company
Scanning Electron Microscopy
18
• SEM uses a focused beam of high-energy electrons to generate a variety of signals at the surface of solid specimens.
• The signals that derive from electron-sample interactions reveal information about the sample including external morphology (texture), chemical composition, and crystalline structure and orientation of materials making up the sample.
• In most applications, data are collected over a selected area of the surface of the sample, and a 2-dimensional image is generated that displays spatial variations in these properties.
• Areas ranging from approximately 1 cm to 5 microns in width can be imaged in a scanning mode using conventional SEM techniques
Salient features
ZEISS EVO Series Scanning Electron Microscope EVO 50 and EVO 18
An MKS PAMP GROUP Company
Scanning Electron Microscopy
19
Salient features
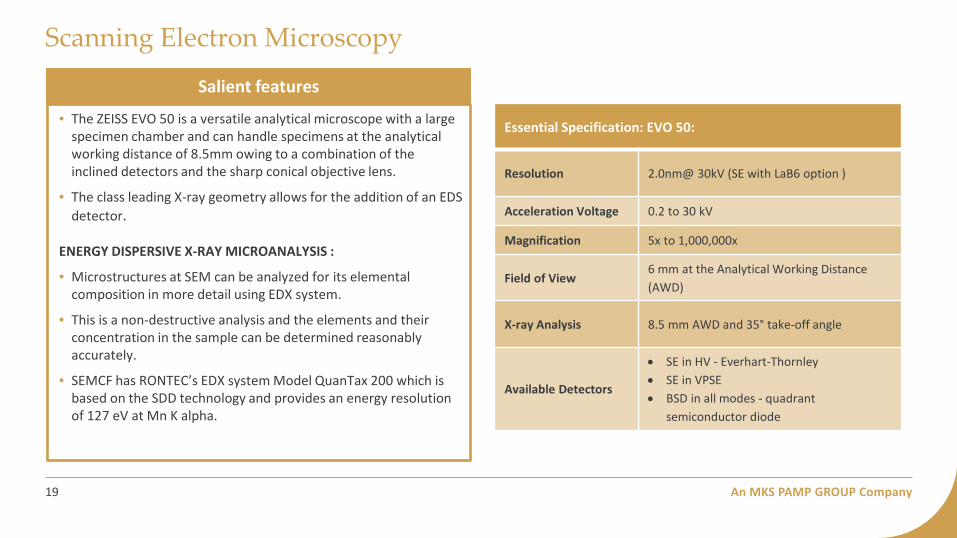
• The ZEISS EVO 50 is a versatile analytical microscope with a large specimen chamber and can handle specimens at the analytical working distance of 8.5mm owing to a combination of the inclined detectors and the sharp conical objective lens.
• The class leading X-ray geometry allows for the addition of an EDS detector.
ENERGY DISPERSIVE X-RAY MICROANALYSIS :
• Microstructures at SEM can be analyzed for its elemental composition in more detail using EDX system.
• This is a non-destructive analysis and the elements and their concentration in the sample can be determined reasonably accurately.
• SEMCF has RONTEC’s EDX system Model QuanTax 200 which is based on the SDD technology and provides an energy resolution of 127 eV at Mn K alpha.
Essential Specification: EVO 50:
Resolution 2.0nm@ 30kV (SE with LaB6 option )
Acceleration Voltage 0.2 to 30 kV
Magnification 5x to 1,000,000x
Field of View 6 mm at the Analytical Working Distance (AWD)
X-ray Analysis 8.5 mm AWD and 35° take-off angle
Available Detectors
• SE in HV - Everhart-Thornley • SE in VPSE • BSD in all modes - quadrant
semiconductor diode

An MKS PAMP GROUP Company 20
Samples for SEM
Top Surface Bottom Surface Cross Section
Top
Cross section
Bottom
0 - Centre 1 - Near centre 2 - Between centre and circumference 3 - Close to circumference

Various trials to determine the presence of Ru, Ir and Os using XRF as testing method
4.
21
An MKS PAMP GROUP Company
Round Ingot Flat Button
Ingot
Analysis Points For
XRF
Samples for XRF

An MKS PAMP GROUP Company
Trials with Iridium in 500 gms Shapet Furnace – Sample wt 100 gms
23
Element/Position Au (89.5%) Ir (0.5%) Au (89.5%) Ir (0.4%) Au (89.5%) Ir (0.3%) Au (89.5%) Ir (0.2%) Au (89.5%) Ir (0.1%)
Top
89.75 0.043
89.42 0.050
89.6 < 0.051
89.45 0.026
89.47 < 0.051 89.45 0.113 89.48 0.047 89.79 0.024 89.56 < 0.051 89.68 < 0.051 89.61 0.220 89.63 < 0.051 89.44 0.048 89.55 < 0.051 89.72 < 0.051 89.46 0.044 89.43 0.038 89.57 0.036 89.33 < 0.051 89.49 < 0.051 89.62 < 0.051 89.58 0.045 89.68 0.040 89.59 < 0.051 89.74 < 0.016 89.79 < 0.051 89.51 0.048 89.92 < 0.051 89.71 < 0.051 89.83 < 0.016 89.23 0.347 89.73 < 0.051 89.8 0.041 90.01 < 0.051 89.88 < 0.051 89.42 0.104 89.5 < 0.051 89.66 < 0.051 89.53 < 0.051 89.5 < 0.051 89.52 0.041 89.39 0.030 89.75 < 0.051 89.51 < 0.051 89.51 < 0.051 89.43 0.032 89.53 < 0.051 89.52 < 0.051 89.42 0.043 89.33 < 0.017 89.11 0.514 89.59 < 0.051 89.59 < 0.051 89.48 < 0.051 89.35 < 0.051 89.48 < 0.051 89.47 < 0.051 89.48 < 0.051 89.45 < 0.051 89.48 < 0.051 88.86 0.882 89.47 < 0.051 89.37 0.040 89.37 0.189 89.46 0.055 89.52 0.021 89.19 0.282 89.5 < 0.051 89.36 0.137 89.49 0.032
Centre 88.94 0.749
89.17 0.216
88.83 0.913
89.3 0.054
88.68 0.537 88.99 0.632 89.04 0.503 89.3 < 0.051 89.18 0.180 89.41 < 0.051 89.39 0.234 88.98 0.249 88.54 0.868 89.76 < 0.051 88.68 0.780 89.33 0.260 88.48 0.906 89.35 < 0.051 89.31 0.170 89.09 0.123
Bottom
89.5 < 0.051
89.6 0.028
89.36 0.069
89.32 0.068
89.5 < 0.051 89.41 < 0.051 89.21 0.277 89.29 0.121 89.58 < 0.051 89.51 < 0.051 89.25 0.124 89.23 0.285 89.47 < 0.051 89.37 0.179 89.55 < 0.051 89.09 0.414 89.4 0.166 89.44 < 0.051 89.53 < 0.051 89.42 0.127 89.31 0.198 88.93 0.580 89.57 < 0.051 89.54 0.094 89.23 0.106 89.45 0.104 89.37 0.084 89.45 0.037 89.53 0.089 89.51 < 0.051 89.41 < 0.051 89.39 0.176 89.38 0.054 89.41 0.148 89.59 < 0.051 89.45 < 0.051 89.04 0.466 89.34 0.211 89.52 0.060 89.52 < 0.051 89.54 < 0.051 89.42 0.192 89.49 < 0.051 89.46 < 0.051 89.39 < 0.051 89.37 0.240 89.41 0.170 89.48 < 0.051 89.34 0.118 89.44 < 0.051 89.48 0.094 89.29 0.211 89.11 0.397 89.81 < 0.051 89.43 < 0.051 89.11 0.462 89.05 0.409 89.39 0.092 89.84 < 0.051 88.7 0.617
Balance - Silver (5%) and Copper (5%)
An MKS PAMP GROUP Company
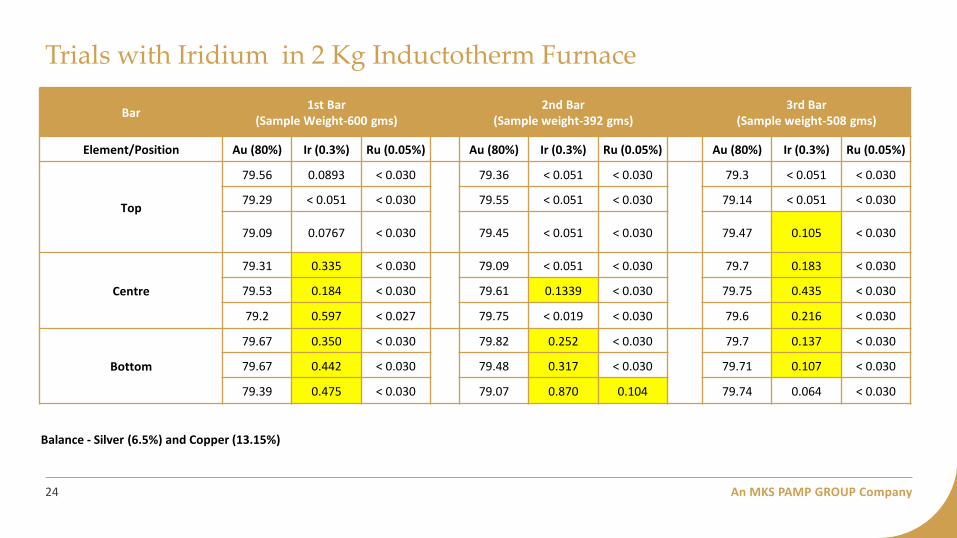
Trials with Iridium in 2 Kg Inductotherm Furnace
24
Bar 1st Bar (Sample Weight-600 gms) 2nd Bar
(Sample weight-392 gms) 3rd Bar (Sample weight-508 gms)
Element/Position Au (80%) Ir (0.3%) Ru (0.05%) Au (80%) Ir (0.3%) Ru (0.05%) Au (80%) Ir (0.3%) Ru (0.05%)
Top
79.56 0.0893 < 0.030
79.36 < 0.051 < 0.030
79.3 < 0.051 < 0.030
79.29 < 0.051 < 0.030 79.55 < 0.051 < 0.030 79.14 < 0.051 < 0.030
79.09 0.0767 < 0.030 79.45 < 0.051 < 0.030 79.47 0.105 < 0.030
Centre
79.31 0.335 < 0.030
79.09 < 0.051 < 0.030
79.7 0.183 < 0.030
79.53 0.184 < 0.030 79.61 0.1339 < 0.030 79.75 0.435 < 0.030
79.2 0.597 < 0.027 79.75 < 0.019 < 0.030 79.6 0.216 < 0.030
Bottom
79.67 0.350 < 0.030
79.82 0.252 < 0.030
79.7 0.137 < 0.030
79.67 0.442 < 0.030 79.48 0.317 < 0.030 79.71 0.107 < 0.030
79.39 0.475 < 0.030 79.07 0.870 0.104 79.74 0.064 < 0.030
Balance - Silver (6.5%) and Copper (13.15%)

An MKS PAMP GROUP Company
Trial with Iridium
25
Gold with addition of Iridium (at a range of 0.1 to 0.5% iridium) in 500 gm furnace with 100 gm metal
Furnace-1
Capacity: 500 g Frequency: Medium
Power consumption: 4.5 KW (max)
Temperature: 1150 °C
Gold with addition of Iridium (0.3% ONLY) in 2 kg furnace and with 100gm, 200 gm and 1600 gm metal
Furnace-3
Capacity: 2000 g Frequency: Medium
Power consumption: 5 KW
Temperature: 1150 °C
An MKS PAMP GROUP Company
Observation
26
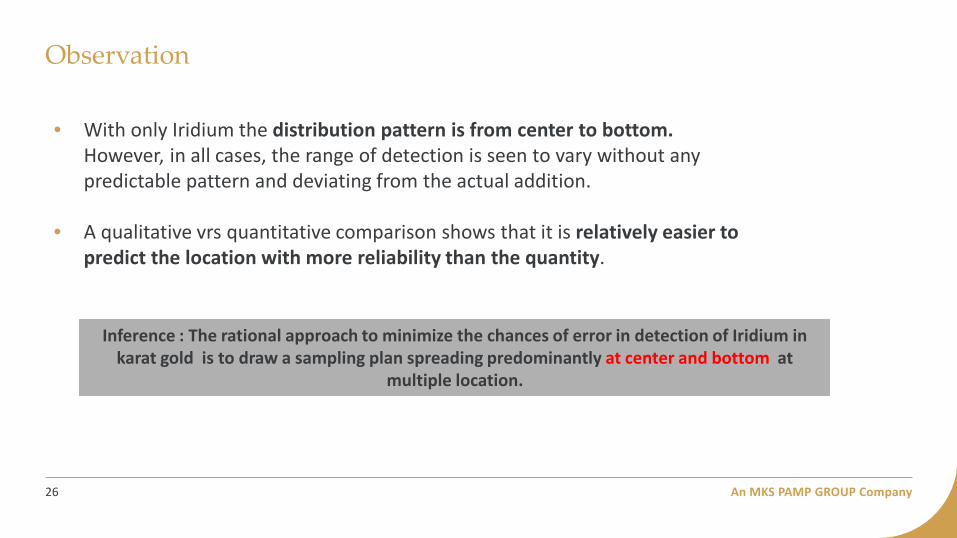
• With only Iridium the distribution pattern is from center to bottom. However, in all cases, the range of detection is seen to vary without any predictable pattern and deviating from the actual addition.
• A qualitative vrs quantitative comparison shows that it is relatively easier to predict the location with more reliability than the quantity.
Inference : The rational approach to minimize the chances of error in detection of Iridium in karat gold is to draw a sampling plan spreading predominantly at center and bottom at
multiple location.

An MKS PAMP GROUP Company
Trials With Iridium & Ruthenium in 500 gms Shapet furnace
27
Sample Weight - 100 gms (Ref4) Sample Weight - 1000 gms (Ref4)
Element/Position Au (86.1%) Ag (5%) Cu (8%) Ir (0.5%) Ru (0.4%) Element/Position Au (89.1%) Ag (5%) Cu (5%) Ir (0.3%) Ru (0.6%)
Top
82.34 4.939 10.6 0.538 1.583
Top
84.89 5.02 9.942 0.1366 < 0.030
83.05 4.841 10.44 0.605 1.057 84.43 5.012 9.898 0.1941 0.455
81.82 4.749 10.07 0.769 2.592 85.24 5.006 9.64 0.1177 < 0.030
81.85 4.859 10.77 0.496 2.021 85.17 5.098 9.615 0.0719 0.0406
78.96 4.779 9.462 1.148 5.643 85.44 5.093 9.453 < 0.051 < 0.030
81.74 4.67 9.788 0.854 2.933 80.52 4.777 9.894 1.429 3.37
79.32 4.749 9.741 1.328 4.851 84.95 5 9.852 0.1949 < 0.030
82.73 4.875 9.994 0.446 1.945 83.15 4.938 10.02 0.501 1.377
81.1 4.842 9.811 0.637 3.602 85.14 5.06 9.715 0.0763 < 0.030
Centre 83.93 4.952 10.21 0.421 0.462
Centre 84.28 4.902 10.07 0.447 0.298
84.06 4.847 10.08 0.451 0.545 84.22 4.938 9.951 0.505 0.377
Bottom
84.8 4.926 10.21 0.0529 < 0.030
Bottom
84.76 4.978 10.25 < 0.051 < 0.030
84.72 4.953 10.32 < 0.051 < 0.030 84.84 5.007 10.15 < 0.051 < 0.030
84.82 4.934 10.23 < 0.051 < 0.030 84.87 4.919 10.21 < 0.051 < 0.030
84.84 4.852 10.23 0.0743 < 0.030 84.5 5.007 10.33 0.1477 < 0.030
84.73 4.906 10.35 < 0.051 < 0.030 84.13 4.882 10.93 0.0474 < 0.030
84.18 4.891 10.93 < 0.051 < 0.030 84.63 5.037 10.32 < 0.051 < 0.030
84.85 4.944 10.2 < 0.051 < 0.030 84.62 5.077 10.29 < 0.051 < 0.030
84.84 5 10.15 < 0.051 < 0.030 84.8 4.998 10.19 < 0.051 < 0.030
84.89 4.826 10.27 < 0.051 < 0.030 84.76 4.992 10.24 < 0.051 < 0.030
An MKS PAMP GROUP Company
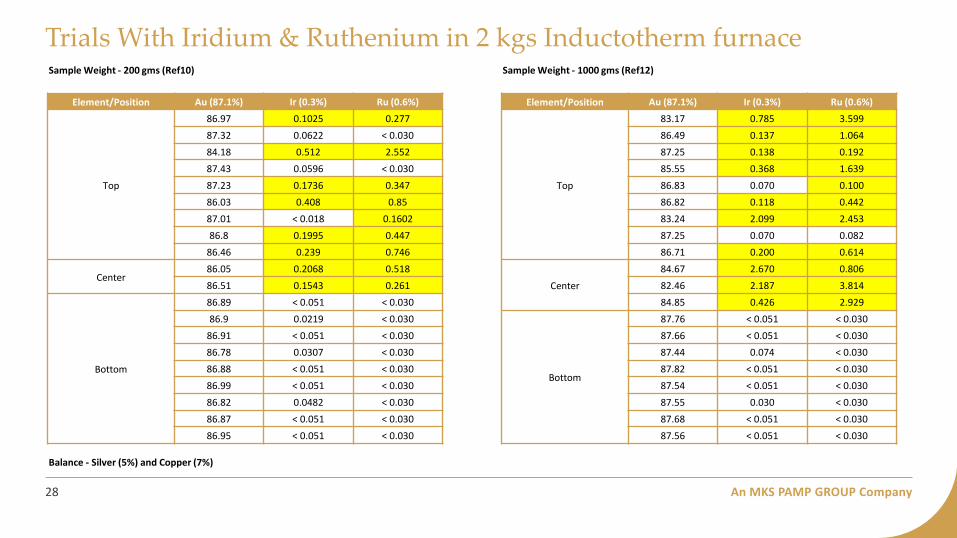
Trials With Iridium & Ruthenium in 2 kgs Inductotherm furnace
28
Sample Weight - 200 gms (Ref10) Sample Weight - 1000 gms (Ref12)
Element/Position Au (87.1%) Ir (0.3%) Ru (0.6%) Element/Position Au (87.1%) Ir (0.3%) Ru (0.6%)
Top
86.97 0.1025 0.277
Top
83.17 0.785 3.599 87.32 0.0622 < 0.030 86.49 0.137 1.064 84.18 0.512 2.552 87.25 0.138 0.192 87.43 0.0596 < 0.030 85.55 0.368 1.639 87.23 0.1736 0.347 86.83 0.070 0.100 86.03 0.408 0.85 86.82 0.118 0.442 87.01 < 0.018 0.1602 83.24 2.099 2.453 86.8 0.1995 0.447 87.25 0.070 0.082
86.46 0.239 0.746 86.71 0.200 0.614
Center 86.05 0.2068 0.518
Center 84.67 2.670 0.806
86.51 0.1543 0.261 82.46 2.187 3.814
Bottom
86.89 < 0.051 < 0.030 84.85 0.426 2.929 86.9 0.0219 < 0.030
Bottom
87.76 < 0.051 < 0.030 86.91 < 0.051 < 0.030 87.66 < 0.051 < 0.030 86.78 0.0307 < 0.030 87.44 0.074 < 0.030 86.88 < 0.051 < 0.030 87.82 < 0.051 < 0.030 86.99 < 0.051 < 0.030 87.54 < 0.051 < 0.030 86.82 0.0482 < 0.030 87.55 0.030 < 0.030 86.87 < 0.051 < 0.030 87.68 < 0.051 < 0.030 86.95 < 0.051 < 0.030 87.56 < 0.051 < 0.030
Balance - Silver (5%) and Copper (7%)
An MKS PAMP GROUP Company
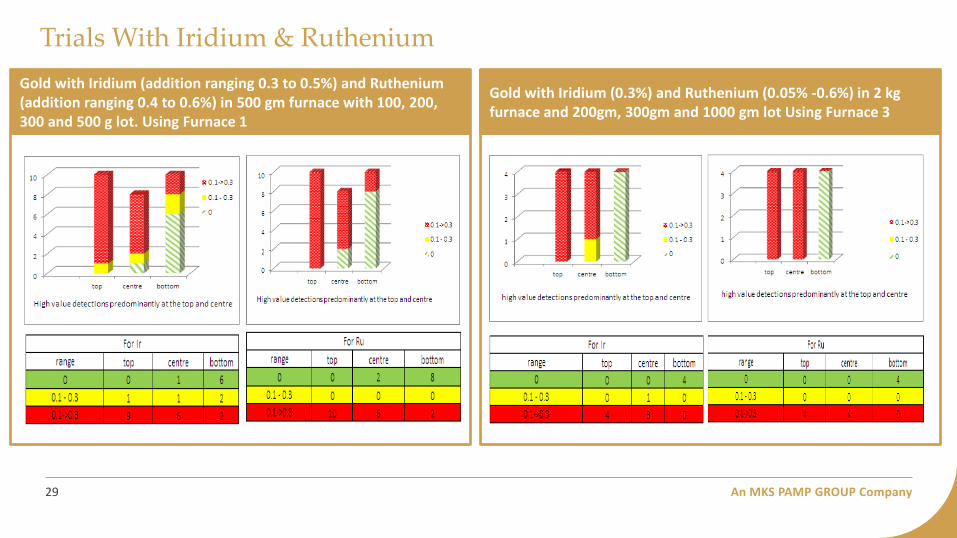
Trials With Iridium & Ruthenium
29
Gold with Iridium (addition ranging 0.3 to 0.5%) and Ruthenium (addition ranging 0.4 to 0.6%) in 500 gm furnace with 100, 200, 300 and 500 g lot. Using Furnace 1
Gold with Iridium (0.3%) and Ruthenium (0.05% -0.6%) in 2 kg furnace and 200gm, 300gm and 1000 gm lot Using Furnace 3
An MKS PAMP GROUP Company
Observation
30
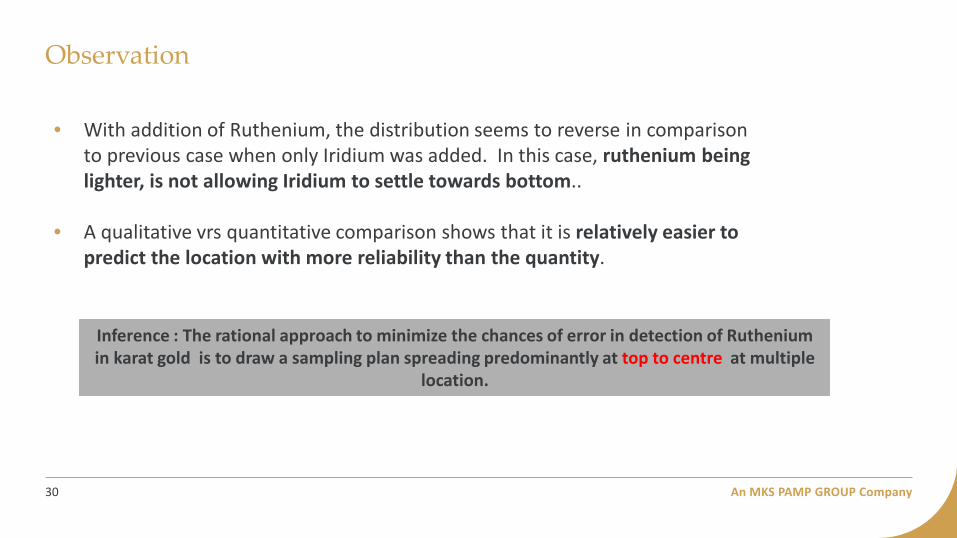
• With addition of Ruthenium, the distribution seems to reverse in comparison to previous case when only Iridium was added. In this case, ruthenium being lighter, is not allowing Iridium to settle towards bottom..
• A qualitative vrs quantitative comparison shows that it is relatively easier to predict the location with more reliability than the quantity.
Inference : The rational approach to minimize the chances of error in detection of Ruthenium in karat gold is to draw a sampling plan spreading predominantly at top to centre at multiple
location.

An MKS PAMP GROUP Company
Trials With Iridium & Osmium in 500 gm Shapet Furnace
31
Sample weight - 300 gms (Ref 4) Sample weight - 300 gms (Ref 17)
Element/Position Au (89.3%) Ag (5%) Cu (5%) Ir (0.3%) Os (0.4%) Element Au (89.3%) Ag (5%) Cu (5%) Ir (0.3%) Os (0.4%)
Top
89.5 5.296 5.195 < 0.010 < 0.010
Top
89.11 5.305 5.57 < 0.010 < 0.010 89.47 5.366 5.152 < 0.010 < 0.010 88.74 5.463 5.646 0.025 0.0613 89.23 5.459 5.213 < 0.010 < 0.010 89.57 5.381 5.045 < 0.010 < 0.010 89.48 5.279 5.226 < 0.010 < 0.010 88.83 5.336 5.667 < 0.010 < 0.010 89.49 5.346 5.161 < 0.010 < 0.010 88.65 5.406 5.764 < 0.012 < 0.050 89.37 5.419 5.199 < 0.010 < 0.010 88.99 5.304 5.604 < 0.010 0.0503
Centre 89.11 5.391 5.085 0.2085 0.202
Centre 87.01 5.351 5.148 0.4091 2.048
89.45 5.393 5.115 0.0247 < 0.049 88.45 5.441 5.19 0.446 0.467 87.87 5.368 5.063 0.76 0.934 89.13 5.472 5.175 0.0887 0.125
Bottom
89.47 5.42 5.097 < 0.010 < 0.010
Bottom
89.38 5.429 5.178 < 0.010 < 0.010 88.69 5.358 5.15 0.1972 0.597 89.27 5.461 5.257 < 0.010 < 0.010 88.58 5.349 5.016 0.0709 0.977 89.07 5.475 5.441 < 0.010 < 0.010 88.43 5.318 5.141 0.478 0.618 89.24 5.417 5.314 < 0.010 < 0.048 89.53 5.381 5.077 < 0.010 < 0.010 89.47 5.346 5.182 < 0.010 < 0.010 89.49 5.456 5.046 < 0.010 < 0.010 89.55 5.321 5.12 < 0.010 < 0.048
An MKS PAMP GROUP Company
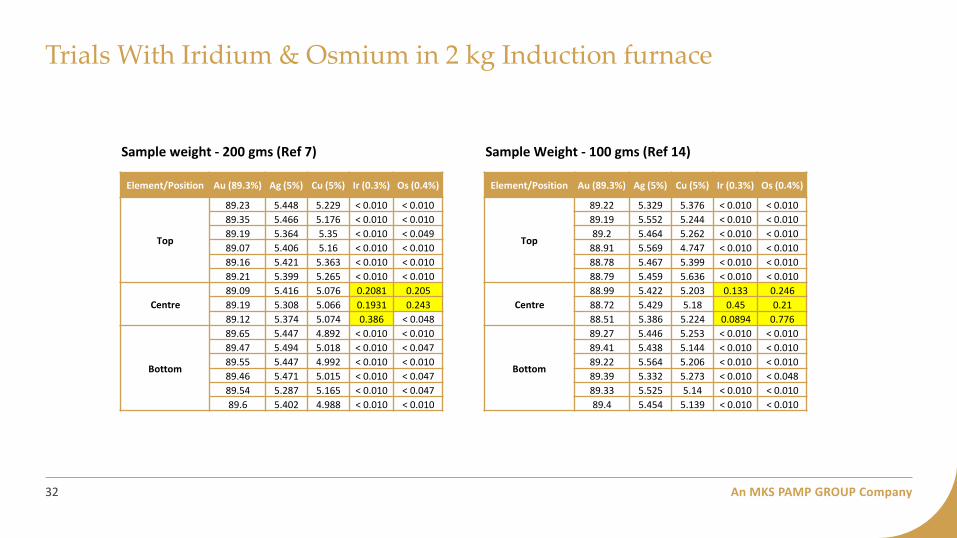
Trials With Iridium & Osmium in 2 kg Induction furnace
32
Sample weight - 200 gms (Ref 7) Sample Weight - 100 gms (Ref 14)
Element/Position Au (89.3%) Ag (5%) Cu (5%) Ir (0.3%) Os (0.4%) Element/Position Au (89.3%) Ag (5%) Cu (5%) Ir (0.3%) Os (0.4%)
Top
89.23 5.448 5.229 < 0.010 < 0.010
Top
89.22 5.329 5.376 < 0.010 < 0.010 89.35 5.466 5.176 < 0.010 < 0.010 89.19 5.552 5.244 < 0.010 < 0.010 89.19 5.364 5.35 < 0.010 < 0.049 89.2 5.464 5.262 < 0.010 < 0.010 89.07 5.406 5.16 < 0.010 < 0.010 88.91 5.569 4.747 < 0.010 < 0.010 89.16 5.421 5.363 < 0.010 < 0.010 88.78 5.467 5.399 < 0.010 < 0.010 89.21 5.399 5.265 < 0.010 < 0.010 88.79 5.459 5.636 < 0.010 < 0.010
Centre 89.09 5.416 5.076 0.2081 0.205
Centre 88.99 5.422 5.203 0.133 0.246
89.19 5.308 5.066 0.1931 0.243 88.72 5.429 5.18 0.45 0.21 89.12 5.374 5.074 0.386 < 0.048 88.51 5.386 5.224 0.0894 0.776
Bottom
89.65 5.447 4.892 < 0.010 < 0.010
Bottom
89.27 5.446 5.253 < 0.010 < 0.010 89.47 5.494 5.018 < 0.010 < 0.047 89.41 5.438 5.144 < 0.010 < 0.010 89.55 5.447 4.992 < 0.010 < 0.010 89.22 5.564 5.206 < 0.010 < 0.010 89.46 5.471 5.015 < 0.010 < 0.047 89.39 5.332 5.273 < 0.010 < 0.048 89.54 5.287 5.165 < 0.010 < 0.047 89.33 5.525 5.14 < 0.010 < 0.010 89.6 5.402 4.988 < 0.010 < 0.010 89.4 5.454 5.139 < 0.010 < 0.010

An MKS PAMP GROUP Company
Trials With Iridium & Osmium
33
Gold with Iridium (0.3%) and Osmium (0.4%) in 500 g furnace for 100, 200 and 300 g lot. Using Furnace 1
Gold with Iridium (0.3%) and Osmium (0.4%) in 2 kg furnace for 100, 200 and 300 g lot. Using Furnace 3
An MKS PAMP GROUP Company
Observation
34
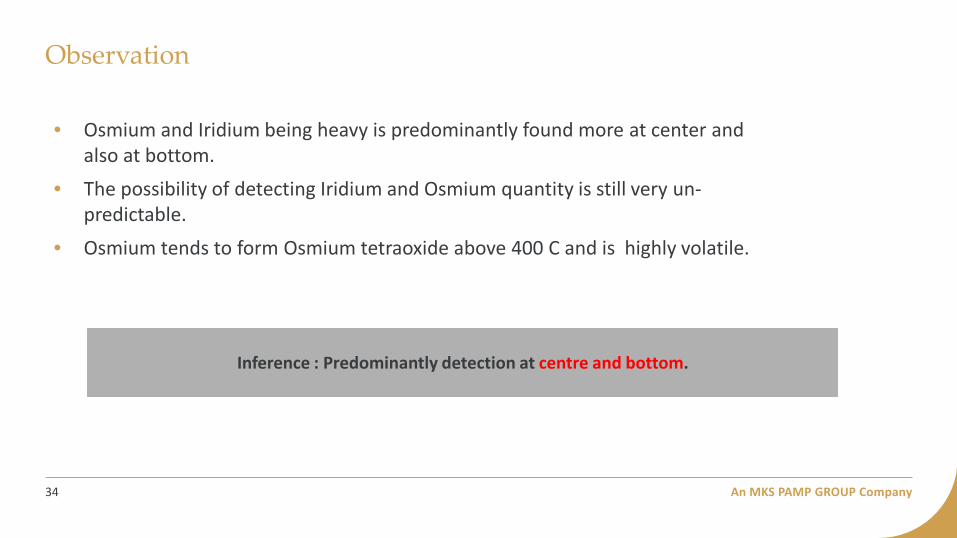
• Osmium and Iridium being heavy is predominantly found more at center and also at bottom.
• The possibility of detecting Iridium and Osmium quantity is still very un-predictable.
• Osmium tends to form Osmium tetraoxide above 400 C and is highly volatile.
Inference : Predominantly detection at centre and bottom.
Scanning Electron Microscope 5.
35
An MKS PAMP GROUP Company
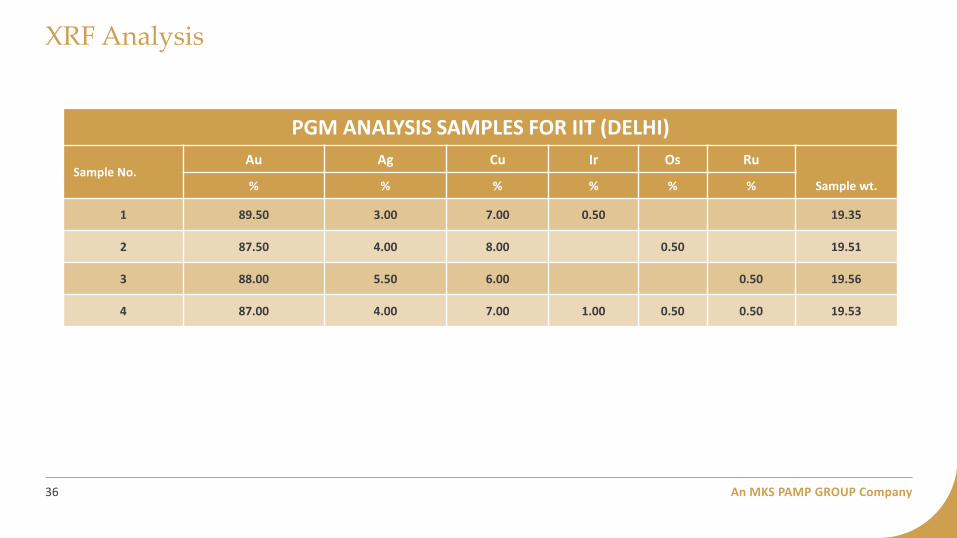
XRF Analysis
36
PGM ANALYSIS SAMPLES FOR IIT (DELHI)
Sample No. Au Ag Cu Ir Os Ru
Sample wt. % % % % % %
1 89.50 3.00 7.00 0.50 19.35
2 87.50 4.00 8.00 0.50 19.51
3 88.00 5.50 6.00 0.50 19.56
4 87.00 4.00 7.00 1.00 0.50 0.50 19.53

An MKS PAMP GROUP Company 37
Samples for SEM
Top Surface Bottom Surface Cross Section
Top
Cross section
Bottom
0 - Centre 1 - Near centre 2 - Between centre and circumference 3 - Close to circumference
An MKS PAMP GROUP Company
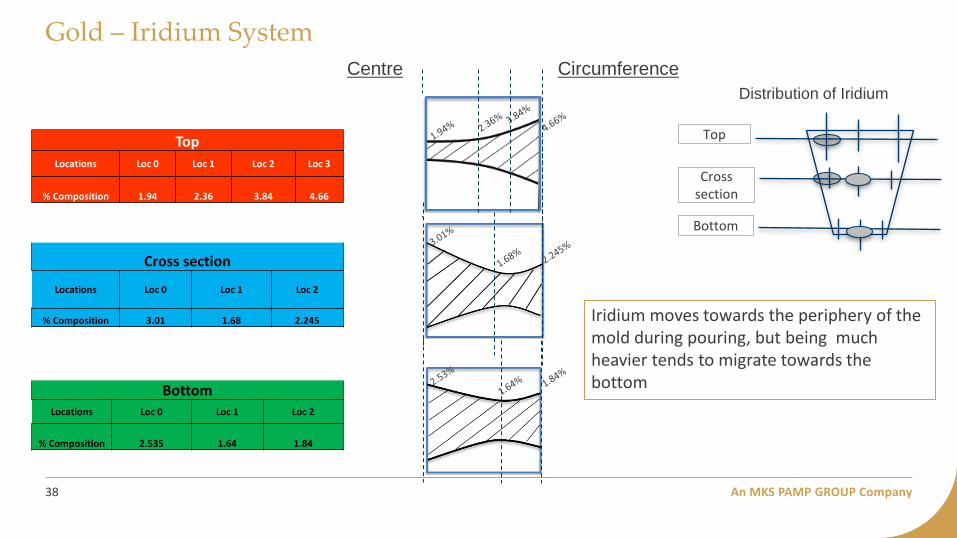
Gold – Iridium System
38
Top
Cross section
Bottom
Distribution of Iridium Circumference Centre
Top Locations Loc 0 Loc 1 Loc 2 Loc 3
% Composition 1.94 2.36 3.84 4.66
Cross section
Locations Loc 0 Loc 1 Loc 2
% Composition 3.01 1.68 2.245
Bottom Locations Loc 0 Loc 1 Loc 2
% Composition 2.535 1.64 1.84
Iridium moves towards the periphery of the mold during pouring, but being much heavier tends to migrate towards the bottom
An MKS PAMP GROUP Company
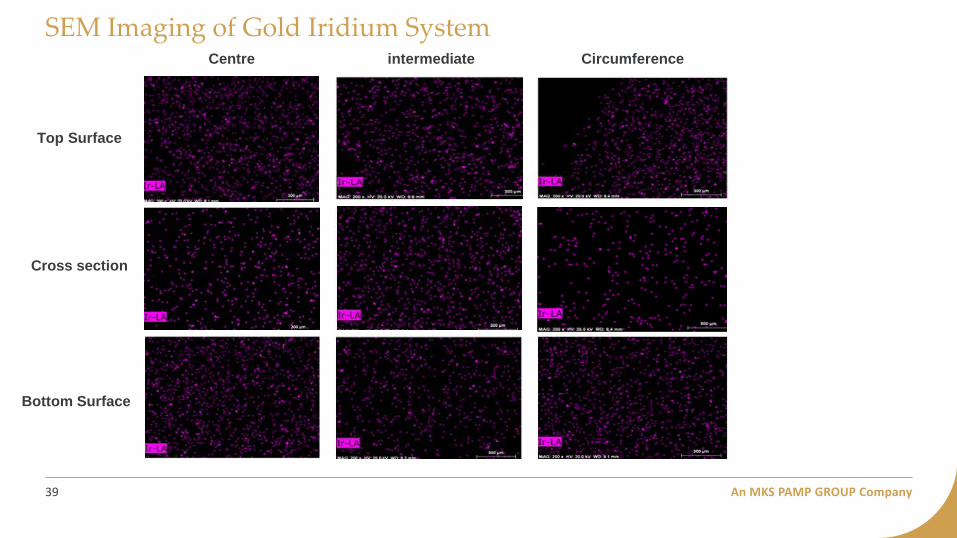
SEM Imaging of Gold Iridium System
39
Top Surface
Cross section
Bottom Surface
Centre Circumference intermediate

An MKS PAMP GROUP Company
SEM Imaging of Gold Iridium System
40
Bottom Surface Centre
Distributed uniformly but seems to form elongated clusters.
An MKS PAMP GROUP Company
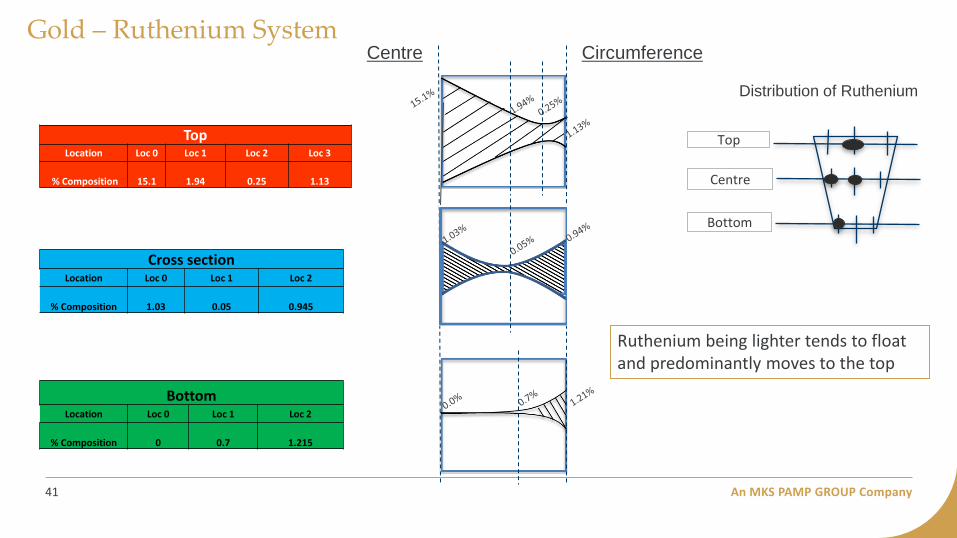
Gold – Ruthenium System
41
Top
Centre
Bottom
Distribution of Ruthenium
Circumference Centre
Top Location Loc 0 Loc 1 Loc 2 Loc 3
% Composition 15.1 1.94 0.25 1.13
Cross section Location Loc 0 Loc 1 Loc 2
% Composition 1.03 0.05 0.945
Bottom Location Loc 0 Loc 1 Loc 2
% Composition 0 0.7 1.215
Ruthenium being lighter tends to float and predominantly moves to the top
An MKS PAMP GROUP Company
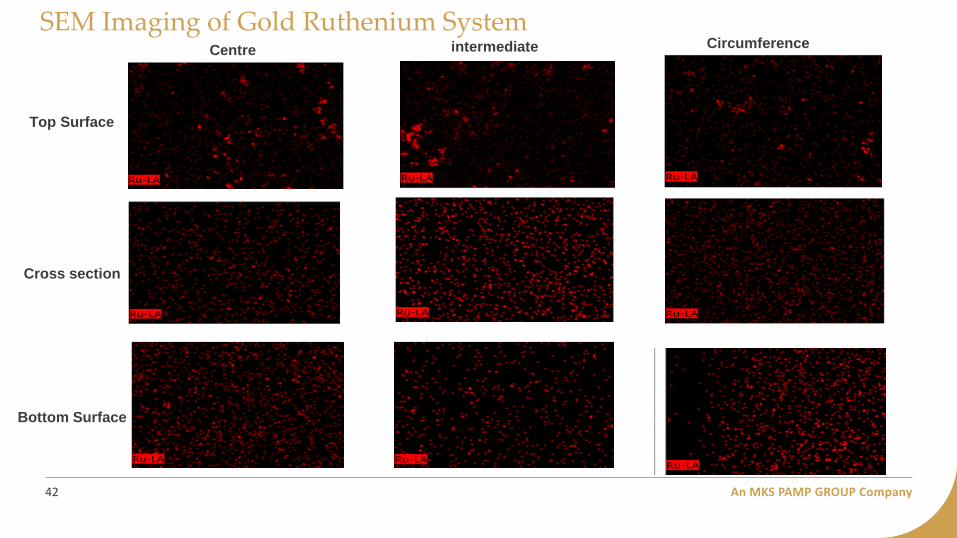
SEM Imaging of Gold Ruthenium System
42
Top Surface
Cross section
Bottom Surface
Centre Circumference intermediate
An MKS PAMP GROUP Company
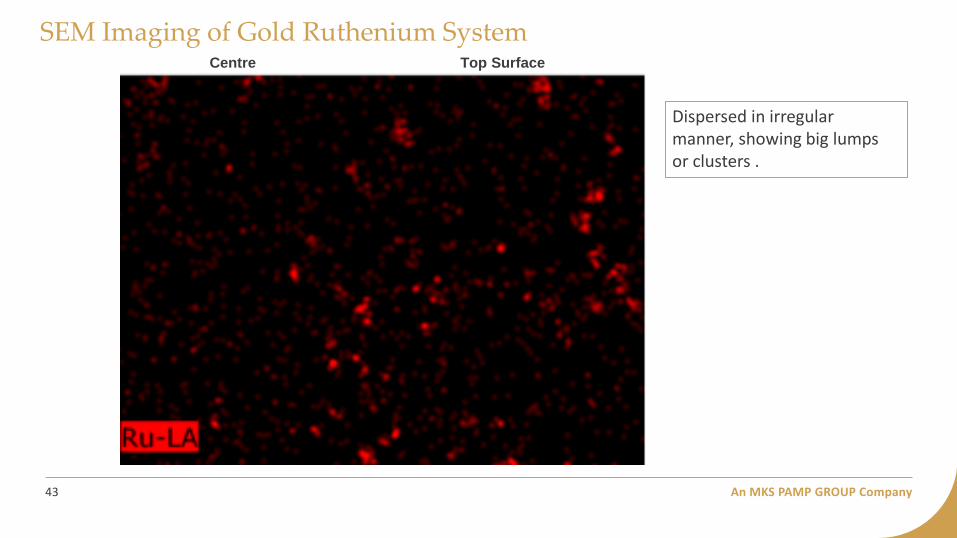
SEM Imaging of Gold Ruthenium System
43
Top Surface Centre
Dispersed in irregular manner, showing big lumps or clusters .

An MKS PAMP GROUP Company
Gold – Osmium System
44
Top
Centre
Bottom
Distribution of Osmium
Circumference Centre
Top Location Loc 0 Loc 1 Loc 2 Loc 3
% Composition 4.02 3.85 3.05 3.27
Cross section Location Loc 0 Loc 1 Loc 2
% Composition 3.48 3.17 2.915
Bottom Location Loc 0 Loc 1 Loc 2
% Composition 3.455 3.05 3.425
During pouring, Os aided with it’s high density propels it to drop down without much lateral movement It is pre-dominantly present at bottom and is more uniform in shape.

An MKS PAMP GROUP Company
SEM Imaging of Gold Osmium System
45
Top Surface
Cross section
Bottom Surface
Centre Circumference intermediate
An MKS PAMP GROUP Company
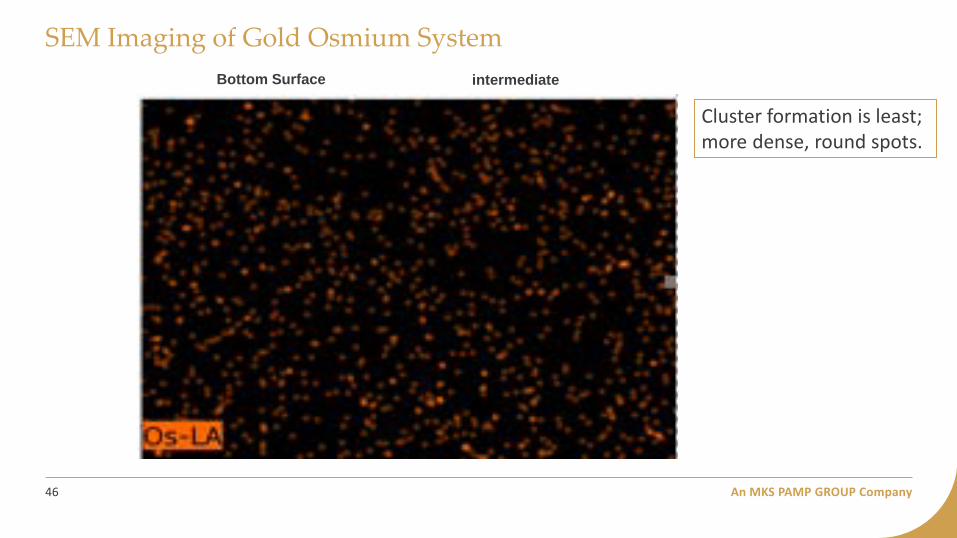
SEM Imaging of Gold Osmium System
46
Bottom Surface intermediate
Cluster formation is least; more dense, round spots.

An MKS PAMP GROUP Company
Gold – Iridium-Osmium-Ruthenium System
47
Top
Centre
Bottom
Distribution in multi-component system
Top Locations Loc 0 Loc 1 Loc 2 Loc 3
% Composition Os 3.78 3.58 3.83 3.78 % Composition
Ir 1.5 2.23 2.58 3.32 % Composition
Ru 0.41 0.62 0.72 0.73
Cross section Locations Loc 0 Loc 1 Loc 2
% Composition Os 3.04 3.69 4.115 % Composition
Ir 2.41 2.41 2.14 % Composition
Ru 0 0.55 0.8
Bottom Locations Loc 0 Loc 1 Loc 2
% Composition Os 2.28 2.22 2.71 % Composition
Ir 0.94 2.08 2.085 % Composition
Ru 2.67 0.63 0.005
Ir is present at periphery at top and settles at centre in bottom Ru is present at periphery at top and settles at centre in bottom Os seems to be present at all 3 locations
Osmium Iridium Ruthenium
An MKS PAMP GROUP Company
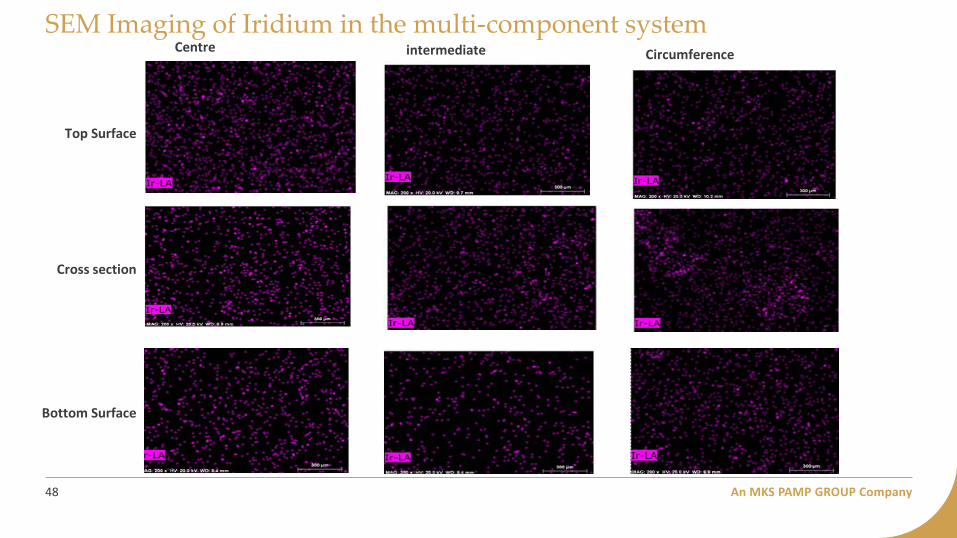
SEM Imaging of Iridium in the multi-component system
48
Top Surface
Cross section
Bottom Surface
Centre Circumference intermediate
An MKS PAMP GROUP Company
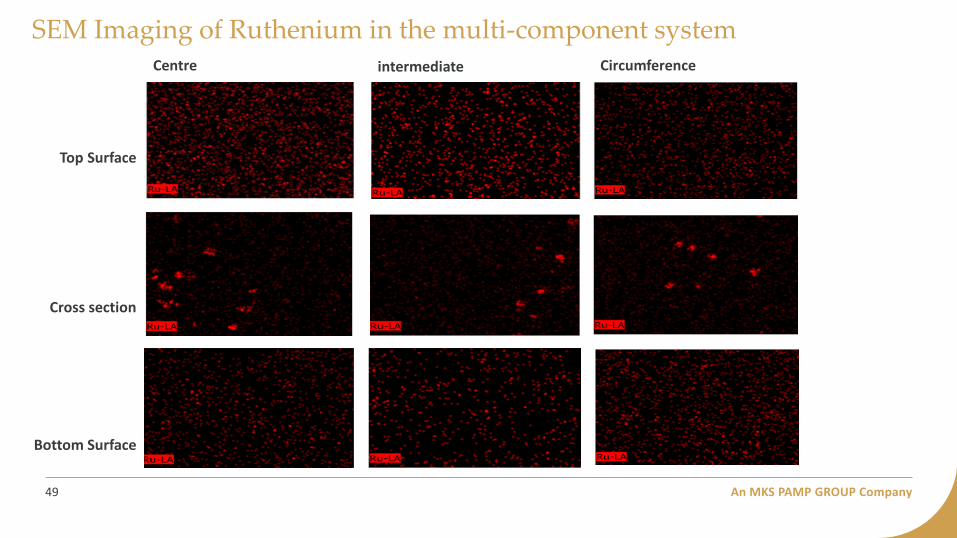
SEM Imaging of Ruthenium in the multi-component system
49
Top Surface
Cross section
Bottom Surface
Centre Circumference intermediate

An MKS PAMP GROUP Company
SEM Imaging of Osmium in the multi-component system
50
Top Surface
Cross section
Bottom Surface
Centre Circumference intermediate

Inferences 6.
51
An MKS PAMP GROUP Company
XRF spectrometer is the need of the hour
52
Using XRF by a suitable sampling procedure its possible to detect the presence of Ir, Ru and Os, though to accurately predict the percentage of these elements is still difficult as its dispersed in the metal and do not form a solid solution
In Fire Assay Method its difficult to have Qualitatively or quantitatively detect the presence of Iridium, Ruthenium and Osmium . The possibility of the catching these elements in sampling of Fire assay is very low.
An experienced and skilled assayer only can really identify the presence of these elements in cupellation or on beads or on cornet! But even after this, its tedious job to find out the concentration of these elements in sample by using chemical digestion and spectroscopic analysis!
When presence detected by XRF, aqua regia process must precede fire assay.
An MKS PAMP GROUP Company
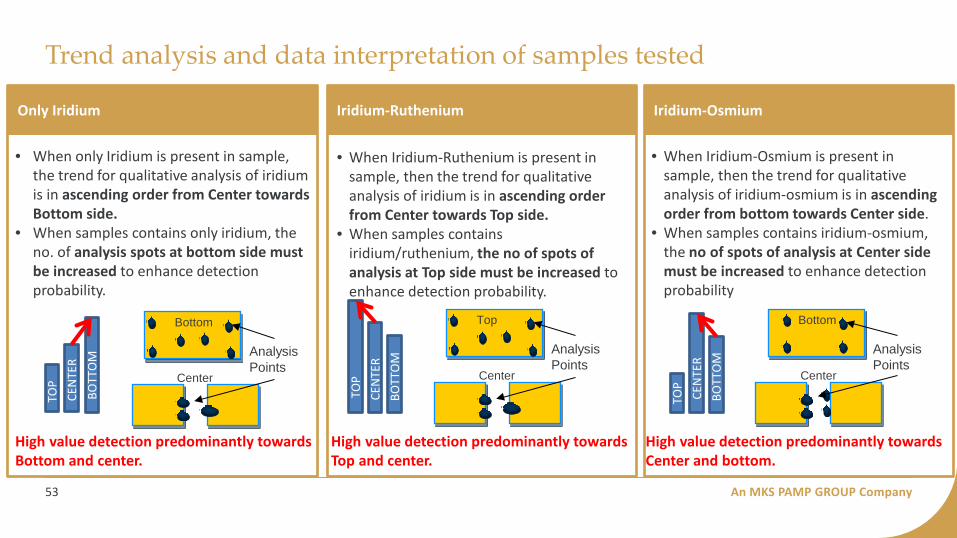
Trend analysis and data interpretation of samples tested
53
Only Iridium
• When only Iridium is present in sample, the trend for qualitative analysis of iridium is in ascending order from Center towards Bottom side.
• When samples contains only iridium, the no. of analysis spots at bottom side must be increased to enhance detection probability.
Iridium-Osmium • When Iridium-Osmium is present in
sample, then the trend for qualitative analysis of iridium-osmium is in ascending order from bottom towards Center side.
• When samples contains iridium-osmium, the no of spots of analysis at Center side must be increased to enhance detection probability
Iridium-Ruthenium
• When Iridium-Ruthenium is present in sample, then the trend for qualitative analysis of iridium is in ascending order from Center towards Top side.
• When samples contains iridium/ruthenium, the no of spots of analysis at Top side must be increased to enhance detection probability.
CEN
TER
TOP
BOTT
OM
Bottom
Analysis Points
Center
High value detection predominantly towards Bottom and center.
CEN
TER
BOTT
OM
TOP
Top
Analysis Points
Center
High value detection predominantly towards Top and center.
High value detection predominantly towards Center and bottom.
CEN
TER
TOP
BOTT
OM
Bottom
Analysis Points
Center

An MKS PAMP GROUP Company
Research team
54
Conceptualization of the paper
Ankur Goyal : Metallurgist
Debasish Bhattacharjee : Metallurgist
Pankaj Deshmukh : Analytical chemistry
Melting and Analysis by XRF
Jaideep : Chemist
Analysis by SEM
Prof Jayant Jain : Indian Institute of Technology Delhi
Compilation of the data
Praveen Kumar – Chemical Engineer
Special Thanks to Mr Rajesh Khosla to have guided us for this Research
27
THANK YOU