james c. franklin office of occupational statistics and employment projections division of industry...
TRANSCRIPT

James C. FranklinOffice of Occupational Statistics
and Employment ProjectionsDivision of Industry Employment
Employment Outlook: 2000-Employment Outlook: 2000-20102010
Employment Outlook: 2000-Employment Outlook: 2000-20102010
Overview of Methods and Results
The BLS Projections ProgramThe BLS Projections ProgramThe BLS Projections ProgramThe BLS Projections Program
Develop long term projections of labor market information– labor force trends by sex, race or Hispanic
origin, and age– employment trends by industry and
occupation
The BLS Projections ProgramThe BLS Projections ProgramThe BLS Projections ProgramThe BLS Projections Program
Assess implications for employment opportunities
Assess effects of changes in Federal programs and policies
Disseminate findings to aid– career planning– education planning– policy formulation
The BLS Projections ProgramThe BLS Projections ProgramThe BLS Projections ProgramThe BLS Projections Program
The projections are published in a wide variety of formats for varied audiences:
– Occupational Outlook Handbook
– Monthly Labor Review articles
– Occupation Outlook Quarterly articles
– Special analysis bulletins
Who Uses the BLS ProjectionsWho Uses the BLS ProjectionsWho Uses the BLS ProjectionsWho Uses the BLS Projections
Career counselors and students
Government agencies
Private consulting and research firms
Academic economists in U.S. and abroad
Politicians and the Media
BLS Projections SpecificsBLS Projections SpecificsBLS Projections SpecificsBLS Projections Specifics
Annual estimates
National level of detail
Medium term -- 10 years
Published every other year

Requirements for carrying out this Requirements for carrying out this type of projectionstype of projections
Large-scale economic data base Extensive computer support
– Statistical analysis capabilities– Data base management capabilities
An experienced staff

The BLS Projections Process:The BLS Projections Process:Component ModelsComponent ModelsThe BLS Projections Process:The BLS Projections Process:Component ModelsComponent Models
Labor force Macro economic activity Input-Output model and derivation of
industry output Labor model Occupational staffing pattern model
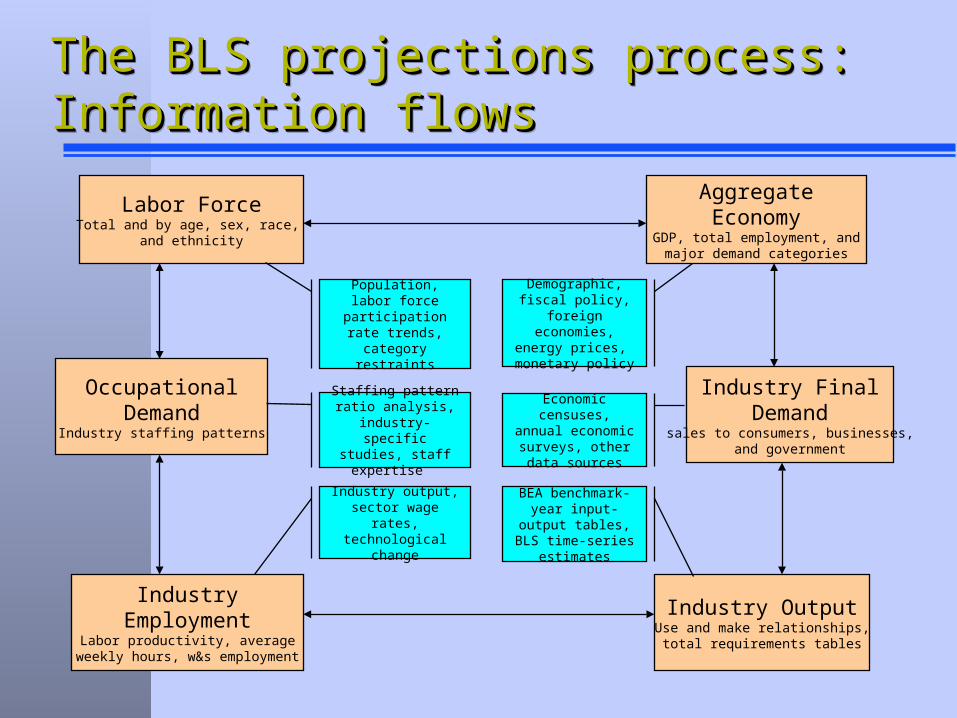
The BLS projections process: The BLS projections process: Information flowsInformation flowsThe BLS projections process: The BLS projections process: Information flowsInformation flows
Labor ForceTotal and by age, sex, race,
and ethnicity
AggregateEconomy
GDP, total employment, andmajor demand categories
OccupationalDemand
Industry staffing patterns
Industry FinalDemand
sales to consumers, businesses,and government
IndustryEmployment
Labor productivity, averageweekly hours, w&s employment
Industry OutputUse and make relationships,
total requirements tables
Demographic, fiscal policy, foreign
economies, energy prices, monetary
policy
Economic censuses, annual economic
surveys, other data sources
BEA benchmark-year input-output tables, BLS time-series estimates
Population, labor force participation rate trends, category
restraints
Industry output, sector wage rates,
technological change
Staffing pattern ratio analysis, industry-
specific studies, staff expertise
The Labor Force--What Is ItThe Labor Force--What Is ItThe Labor Force--What Is ItThe Labor Force--What Is It
The labor force is comprised of those age 16 and over who:
– are working at full- or part-time jobs, or
– are unemployed but are actively seeking work
Labor force participation rate:– labor force / noninstitutional population
The Labor Force--How it is ProjectedThe Labor Force--How it is ProjectedThe Labor Force--How it is ProjectedThe Labor Force--How it is Projected
Use Census forecasts of population by age, sex, race, and ethnicity
Calculate historical labor force participation rates
Extrapolate these rates to the target year Multiply the projected rates by population to
calculate the projected labor force of each category
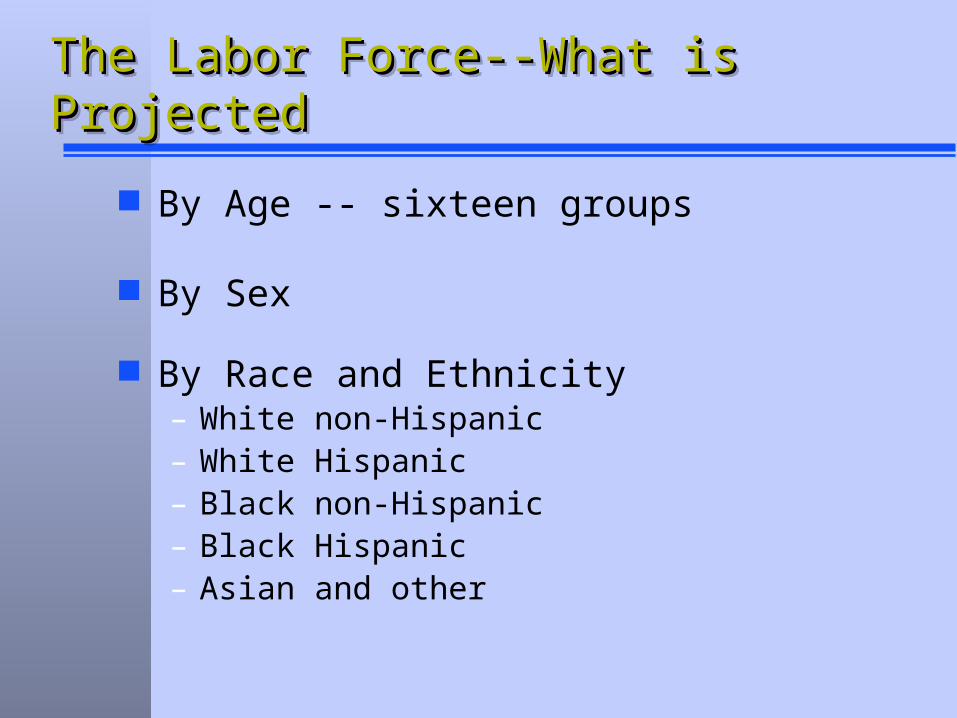
The Labor Force--What is ProjectedThe Labor Force--What is ProjectedThe Labor Force--What is ProjectedThe Labor Force--What is Projected
By Age -- sixteen groups
By Sex
By Race and Ethnicity– White non-Hispanic– White Hispanic– Black non-Hispanic– Black Hispanic– Asian and other
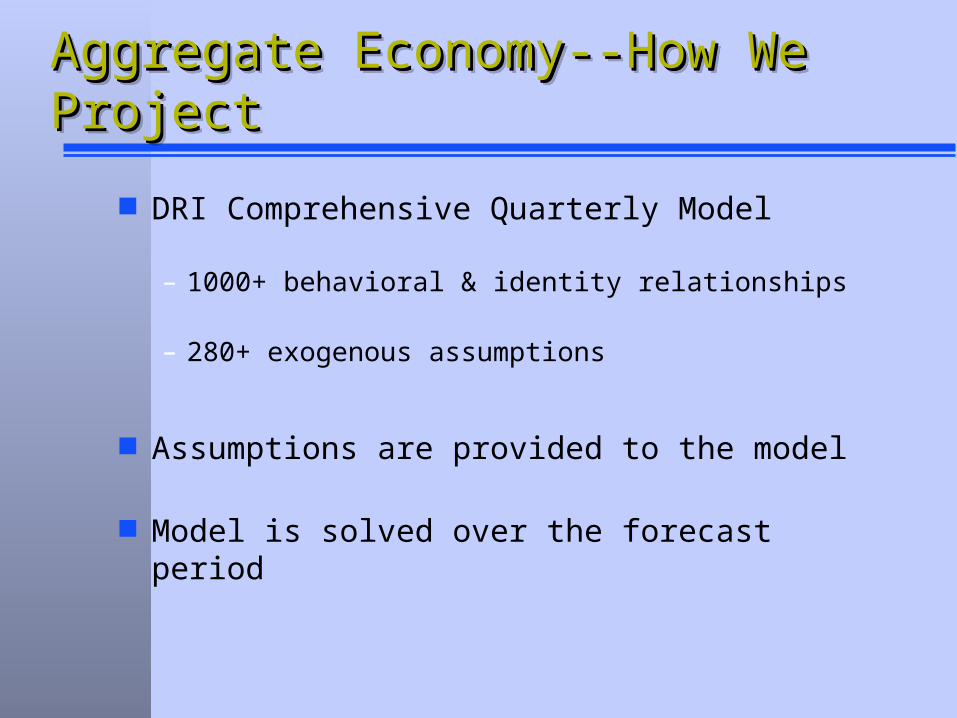
Aggregate Economy--How We Aggregate Economy--How We ProjectProjectAggregate Economy--How We Aggregate Economy--How We ProjectProject
DRI Comprehensive Quarterly Model
– 1000+ behavioral & identity relationships
– 280+ exogenous assumptions
Assumptions are provided to the model
Model is solved over the forecast period
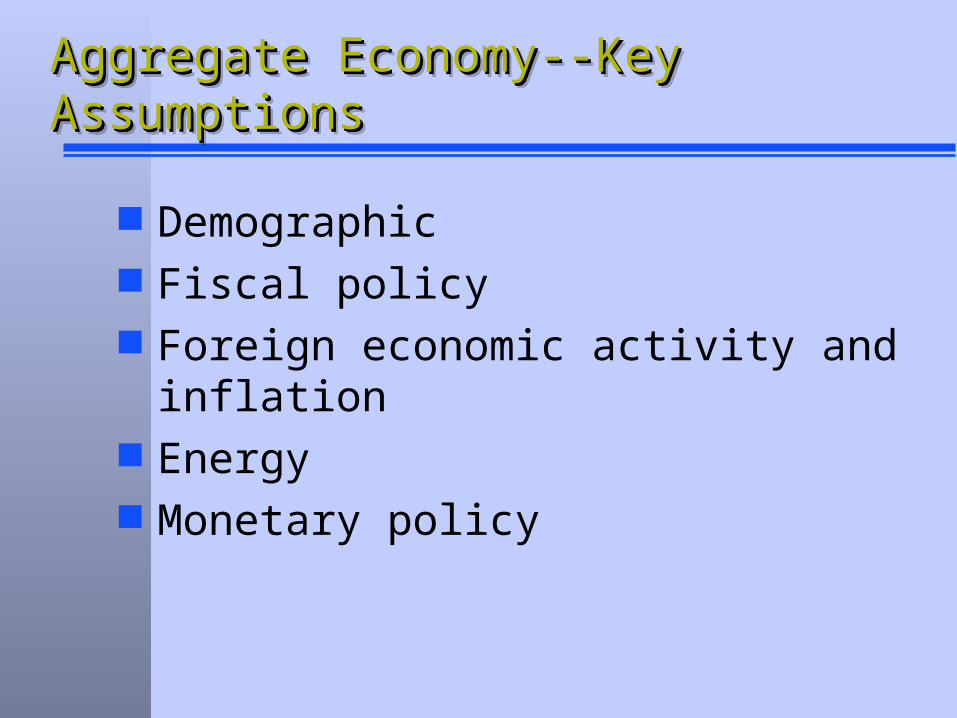
Aggregate Economy--Key Aggregate Economy--Key AssumptionsAssumptionsAggregate Economy--Key Aggregate Economy--Key AssumptionsAssumptions
Demographic Fiscal policy Foreign economic activity and inflation Energy Monetary policy
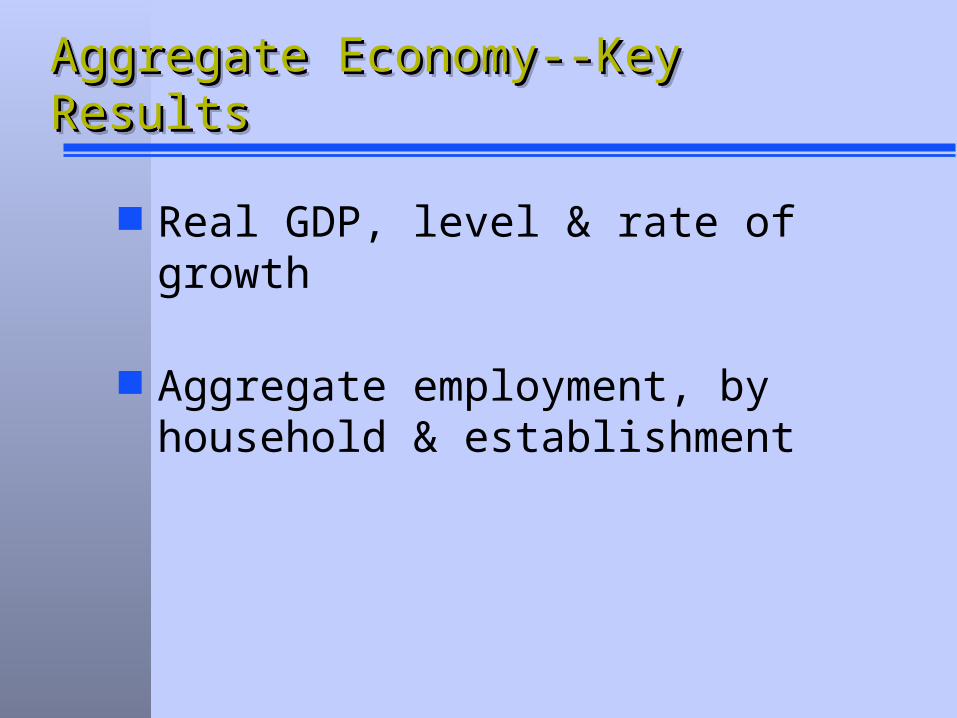
Aggregate Economy--Key ResultsAggregate Economy--Key ResultsAggregate Economy--Key ResultsAggregate Economy--Key Results
Real GDP, level & rate of growth
Aggregate employment, by household & establishment
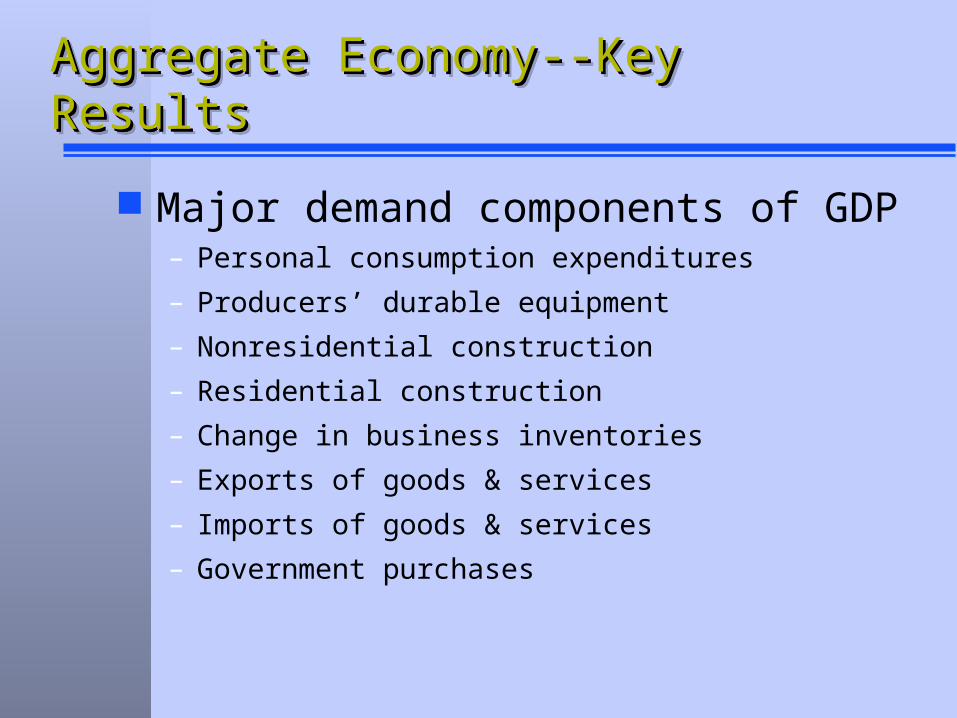
Aggregate Economy--Key ResultsAggregate Economy--Key ResultsAggregate Economy--Key ResultsAggregate Economy--Key Results
Major demand components of GDP– Personal consumption expenditures
– Producers’ durable equipment
– Nonresidential construction
– Residential construction
– Change in business inventories
– Exports of goods & services
– Imports of goods & services
– Government purchases
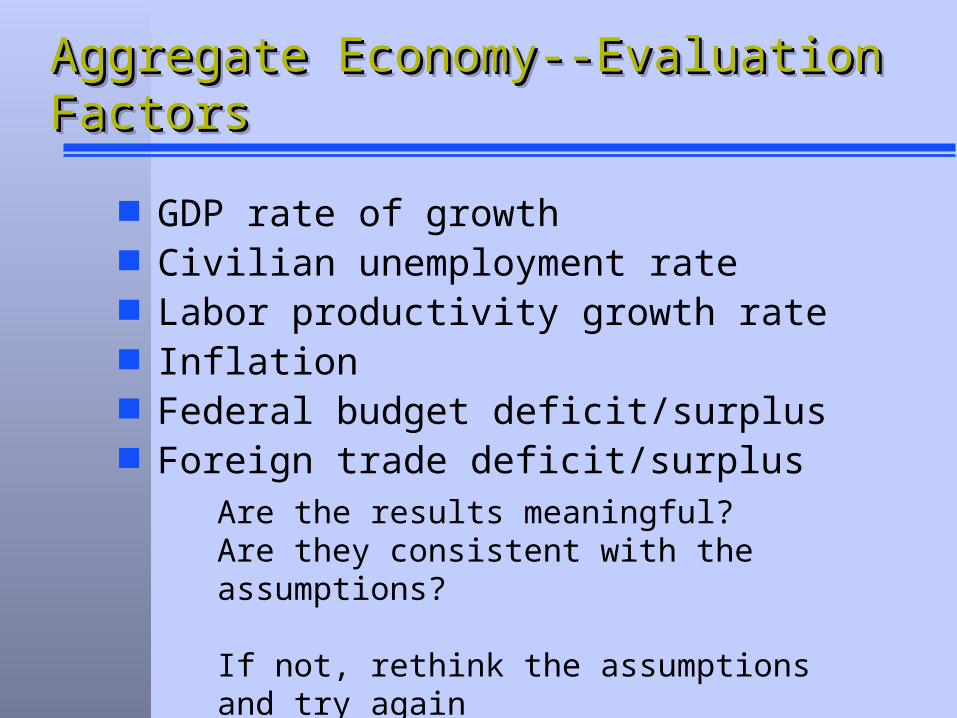
Aggregate Economy--Evaluation Aggregate Economy--Evaluation FactorsFactorsAggregate Economy--Evaluation Aggregate Economy--Evaluation FactorsFactors
GDP rate of growth Civilian unemployment rate Labor productivity growth rate Inflation Federal budget deficit/surplus Foreign trade deficit/surplus
Are the results meaningful?Are they consistent with the assumptions?
If not, rethink the assumptions and try again
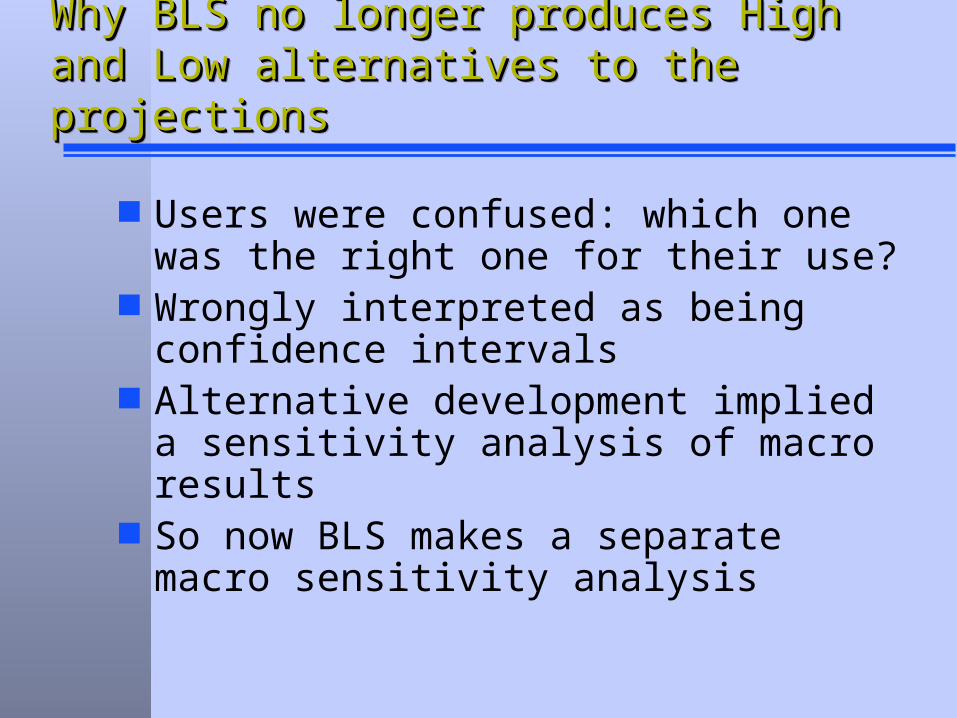
Why BLS no longer produces High and Why BLS no longer produces High and Low alternatives to the projectionsLow alternatives to the projectionsWhy BLS no longer produces High and Why BLS no longer produces High and Low alternatives to the projectionsLow alternatives to the projections
Users were confused: which one was the right one for their use?
Wrongly interpreted as being confidence intervals
Alternative development implied a sensitivity analysis of macro results
So now BLS makes a separate macro sensitivity analysis
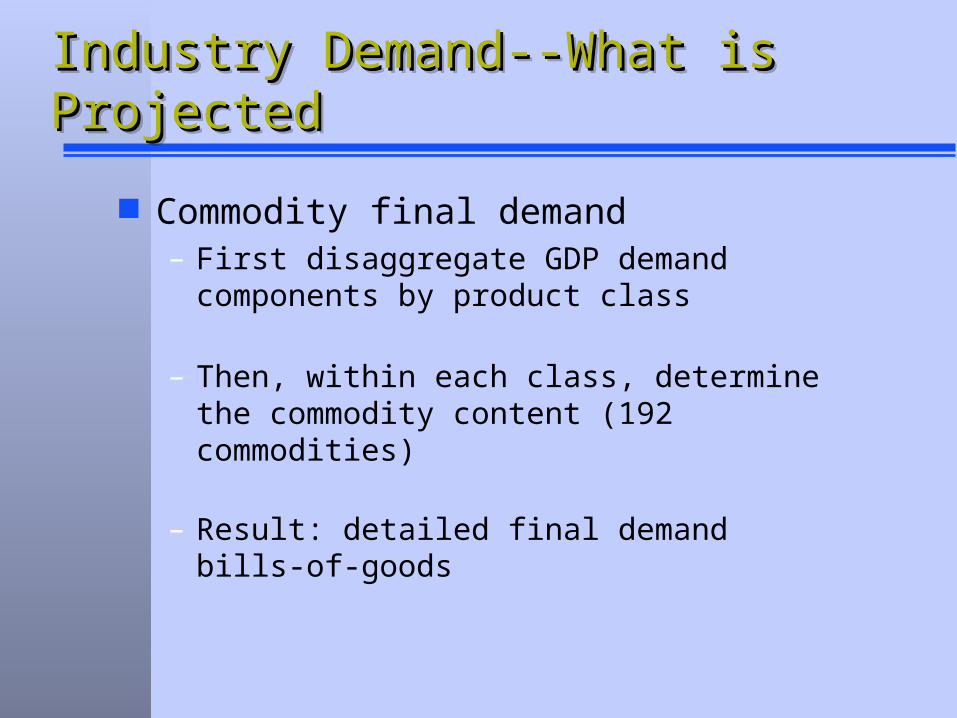
Industry Demand--What is Industry Demand--What is ProjectedProjectedIndustry Demand--What is Industry Demand--What is ProjectedProjected
Commodity final demand– First disaggregate GDP demand
components by product class
– Then, within each class, determine the commodity content (192 commodities)
– Result: detailed final demand bills-of-goods

Interindustry RelationshipsInterindustry RelationshipsInterindustry RelationshipsInterindustry Relationships
Y
X
q = Xe g = Ye
where: e = final demand vectorq = commodity outputg = industry output
UseTable
DirectRequirements
Total Requirements
Industry
Commodity
MakeTable
MarketShares
Total Requirements

Industry Demand--What is Industry Demand--What is ProjectedProjectedIndustry Demand--What is Industry Demand--What is ProjectedProjected
Total requirements coefficients
– Scale rows to affect product sales coefficients across all industries
– Modify columns to affect changes in material input requirements for specific industries
Recalculate industry & commodity total requirements tables
Industry Demand--What is Industry Demand--What is ProjectedProjectedIndustry Demand--What is Industry Demand--What is ProjectedProjected
Combining the estimates of intermediate and final demand results in the total output by industry and commodity necessary to produce a specific level of GDP
Industry output (rather than final demand) is the key determinant of employment needs

Projecting Industry EmploymentProjecting Industry EmploymentProjecting Industry EmploymentProjecting Industry Employment
Total hours for each industry derived as: Hi = (time, outputi, real wagej)
Average annual hours are well-behaved:AAHi = g(time, UR)
Industry employment determined by identity:Ei = Hi / AAHi
Initially controlled to aggregate employment control from macroeconomic model
Occupational Demand--WhatOccupational Demand--WhatOccupational Demand--WhatOccupational Demand--What
Industry by occupation staffing pattern matrix:– 260 industries– 513 occupations
Distributes wage & salary employment in each industry to all occupations used by that industry
Occupational Demand--WhatOccupational Demand--WhatOccupational Demand--WhatOccupational Demand--What
A separately determined distribution of self-employed and unpaid family workers by occupation completes the picture of occupational demand in the economy
Each occupation then assigned to a growth category
Occupational Demand--HowOccupational Demand--HowOccupational Demand--HowOccupational Demand--How
Staffing patterns are assembled from historical data then modified based on various factors:
– Technological changes
– Changing business practices
– Changes in industry activity
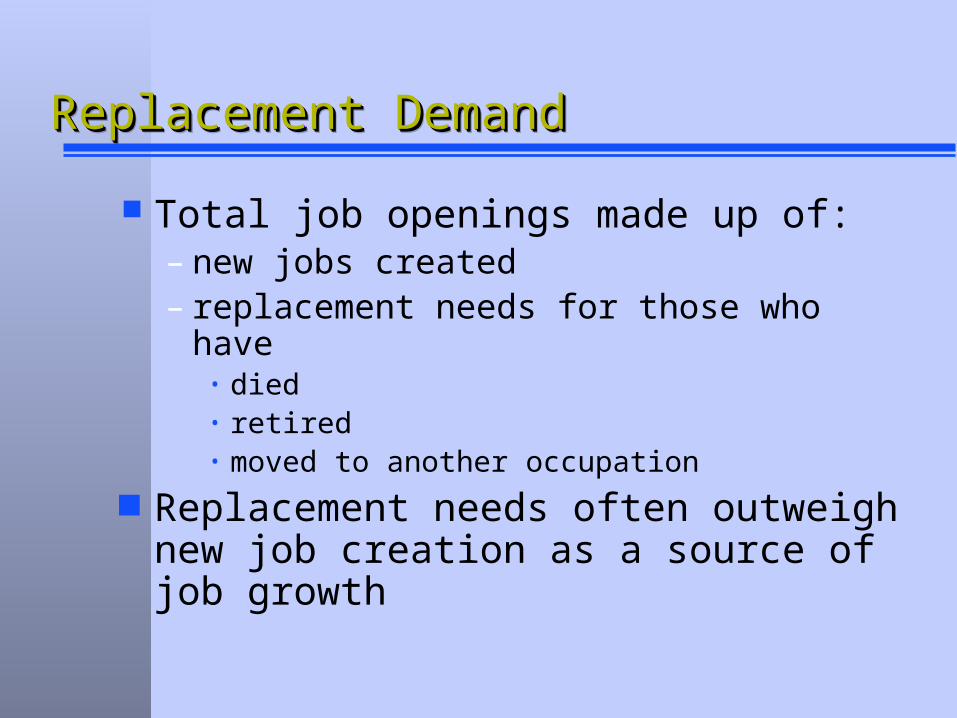
Replacement DemandReplacement DemandReplacement DemandReplacement Demand
Total job openings made up of:– new jobs created– replacement needs for those who have
• died• retired• moved to another occupation
Replacement needs often outweigh new job creation as a source of job growth
Reviewing the ProjectionsReviewing the ProjectionsReviewing the ProjectionsReviewing the Projections
Initial estimates are reviewed internally by the entire staff of OEP, resulting in bottom-up feedback to each stage of the process. This process has proven to be:– Analytical rather than mechanical
– Cost-effective
– Pragmatic
Reviewing the ProjectionsReviewing the ProjectionsReviewing the ProjectionsReviewing the Projections
Secondary review involves other program offices within the BLS:– Employment & Unemployment
Statistics
– Productivity & Technology
– Commissioner of BLS
Reviewing the ProjectionsReviewing the ProjectionsReviewing the ProjectionsReviewing the Projections
Result: a consistent set of projections at all levels of detail that has undergone extensive scrutiny by all analysts in the Office, as well as detailed review by other BLS offices
Sensitivity analyses allow the user to evaluate major assumptions
Employment Outlook: 2000-Employment Outlook: 2000-20102010
Employment Outlook: 2000-Employment Outlook: 2000-20102010
Labor force Economic growth Industry employment Occupational employment
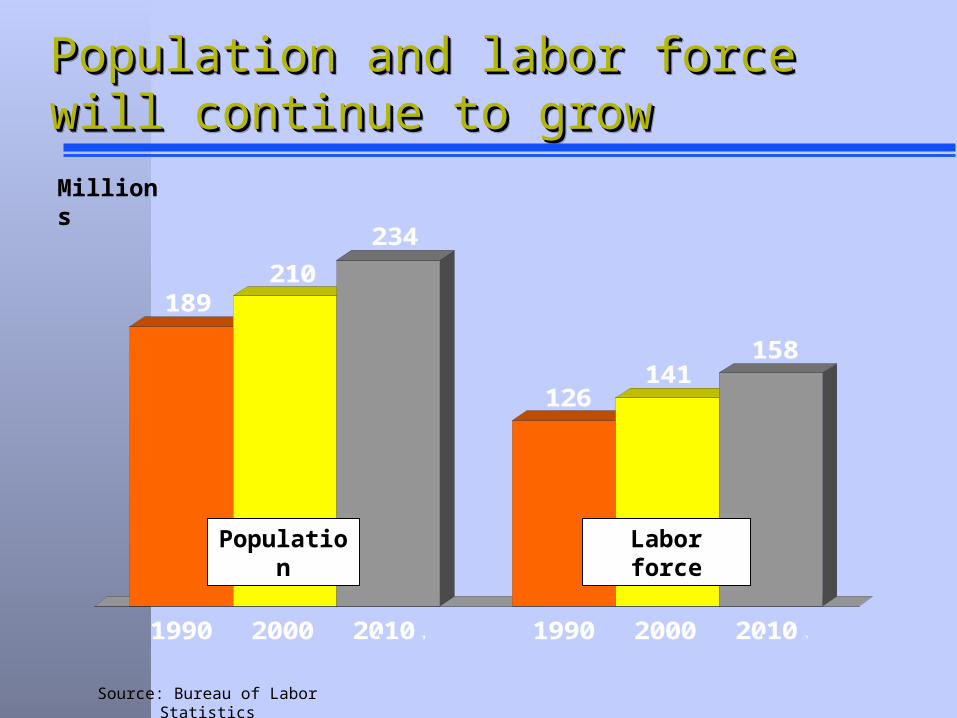
Population and labor force will Population and labor force will continue to growcontinue to growPopulation and labor force will Population and labor force will continue to growcontinue to growMillions
189210
234
126141
158
1990 2000 2010, 1990 2000 2010,
Population Labor force
Source: Bureau of Labor Statistics
projected projected
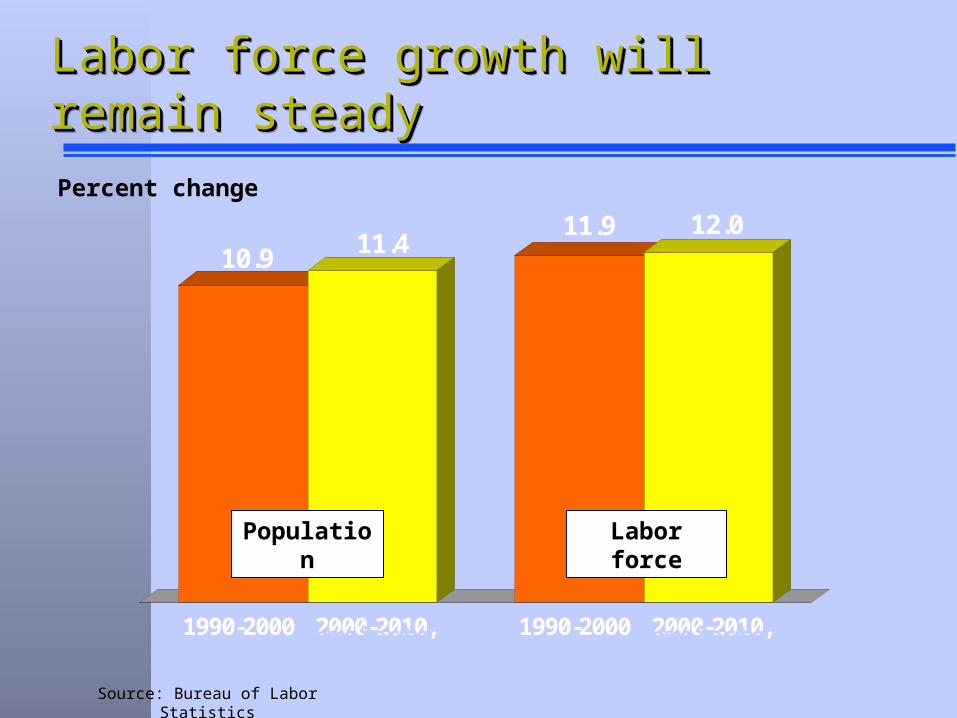
10.9 11.411.9 12.0
1990-2000 2000-2010, 1990-2000 2000-2010,
Labor force growth will remain Labor force growth will remain steadysteadyLabor force growth will remain Labor force growth will remain steadysteady
Population Labor force
Percent change
Source: Bureau of Labor Statistics
projected projected
Employment Outlook: 2000-Employment Outlook: 2000-20102010
Employment Outlook: 2000-Employment Outlook: 2000-20102010
Labor force Economic growth Industry employment Occupational employment
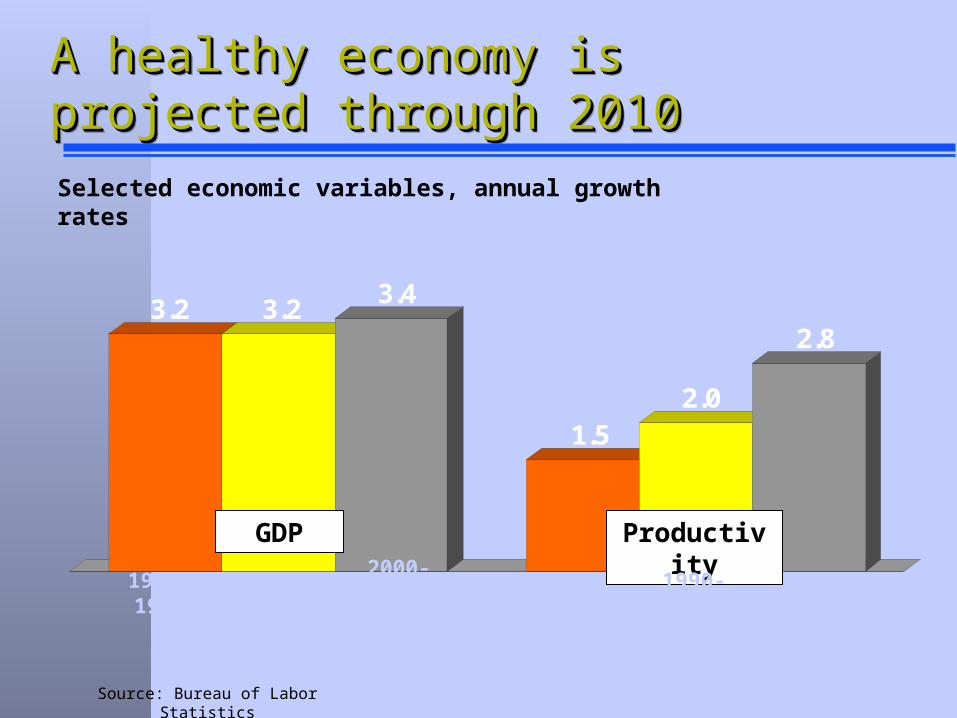
A healthy economy is projected A healthy economy is projected through 2010through 2010A healthy economy is projected A healthy economy is projected through 2010through 2010
3.2 3.23.4
1.52.0
2.8
Source: Bureau of Labor Statistics
Selected economic variables, annual growth rates
GDP Productivity
1980-1990 1990-2000 2000-2010, Projected
1980-1990 1990-2000 2000-2010, Projected
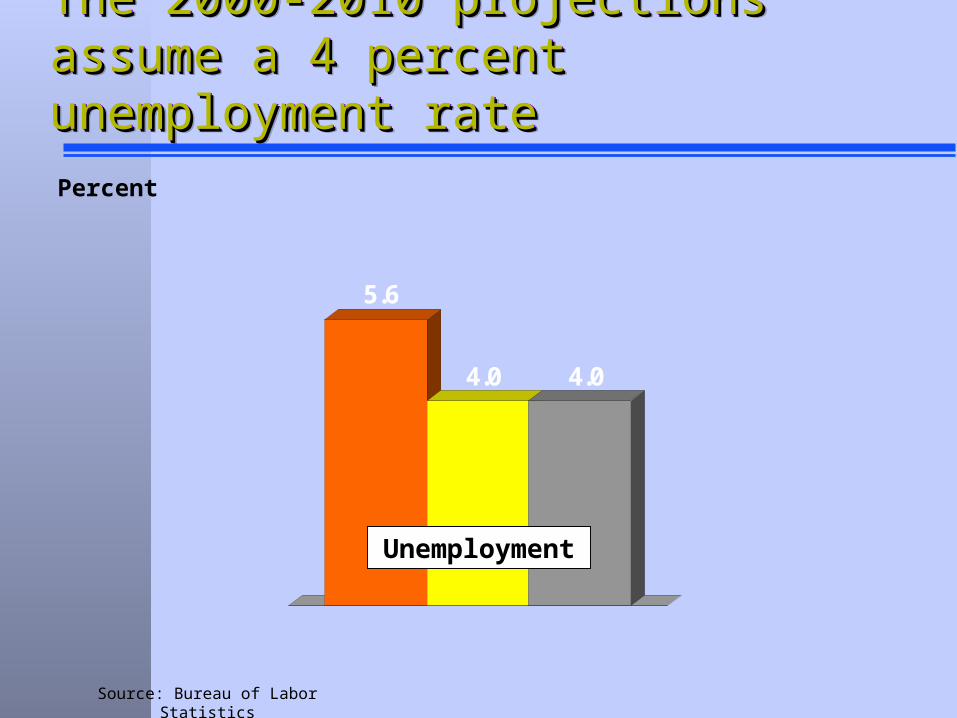
The 2000-2010 projections assume The 2000-2010 projections assume a 4 percent unemployment ratea 4 percent unemployment rateThe 2000-2010 projections assume The 2000-2010 projections assume a 4 percent unemployment ratea 4 percent unemployment rate
5.6
4.0 4.0
Source: Bureau of Labor Statistics
Percent
Unemployment
1990 2000 2010, assumed
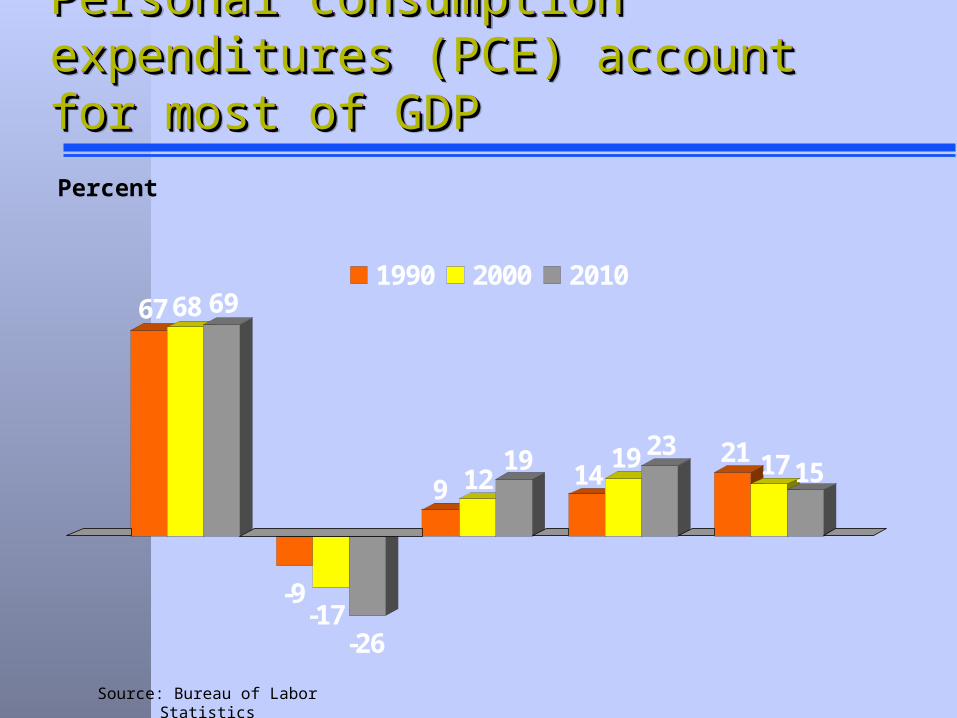
Personal consumption Personal consumption expenditures (PCE) account for expenditures (PCE) account for most of GDPmost of GDP
Personal consumption Personal consumption expenditures (PCE) account for expenditures (PCE) account for most of GDPmost of GDP
PCE
Imports
Exports Investment Government
Source: Bureau of Labor Statistics
Percent
67 68 69
-9-17
-26
9 1219 14
19 23 21 17 15
1990 2000 2010
Employment Outlook: 2000-Employment Outlook: 2000-20102010
Employment Outlook: 2000-Employment Outlook: 2000-20102010
Labor force Economic growth Industry employment Occupational employment
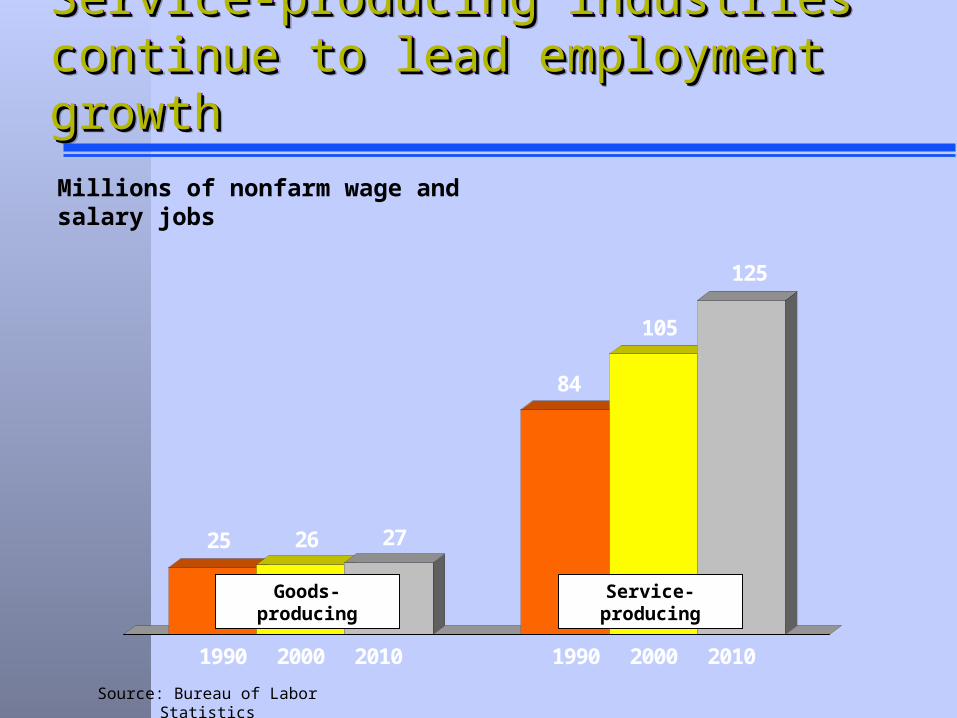
Service-producing industries Service-producing industries continue to lead employment continue to lead employment growthgrowth
Service-producing industries Service-producing industries continue to lead employment continue to lead employment growthgrowth
Source: Bureau of Labor Statistics
Millions of nonfarm wage and salary jobs
25 26 27
84
105
125
1990 2000 2010 1990 2000 2010
Goods-producing Service-producing
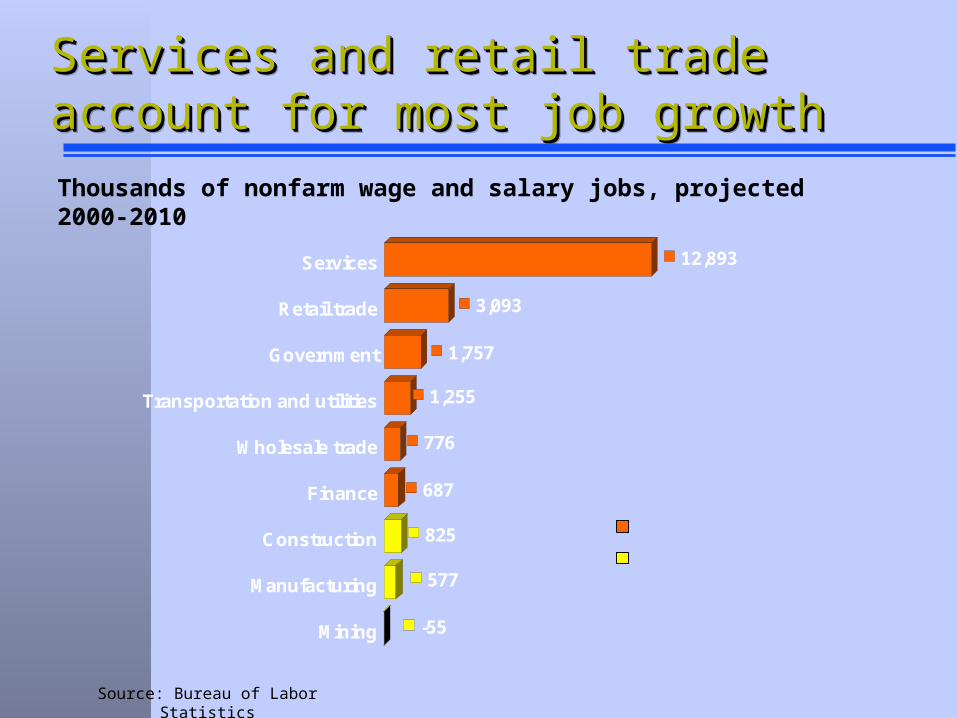
-55
577
825
687
776
1,255
1,757
3,093
12,893
Mining
Manufacturing
Construction
Finance
Wholesale trade
Transportation and utilities
Government
Retail trade
Services
Services and retail trade account Services and retail trade account for most job growthfor most job growthServices and retail trade account Services and retail trade account for most job growthfor most job growth
Source: Bureau of Labor Statistics
Thousands of nonfarm wage and salary jobs, projected 2000-2010
Service Producing
Goods Producing
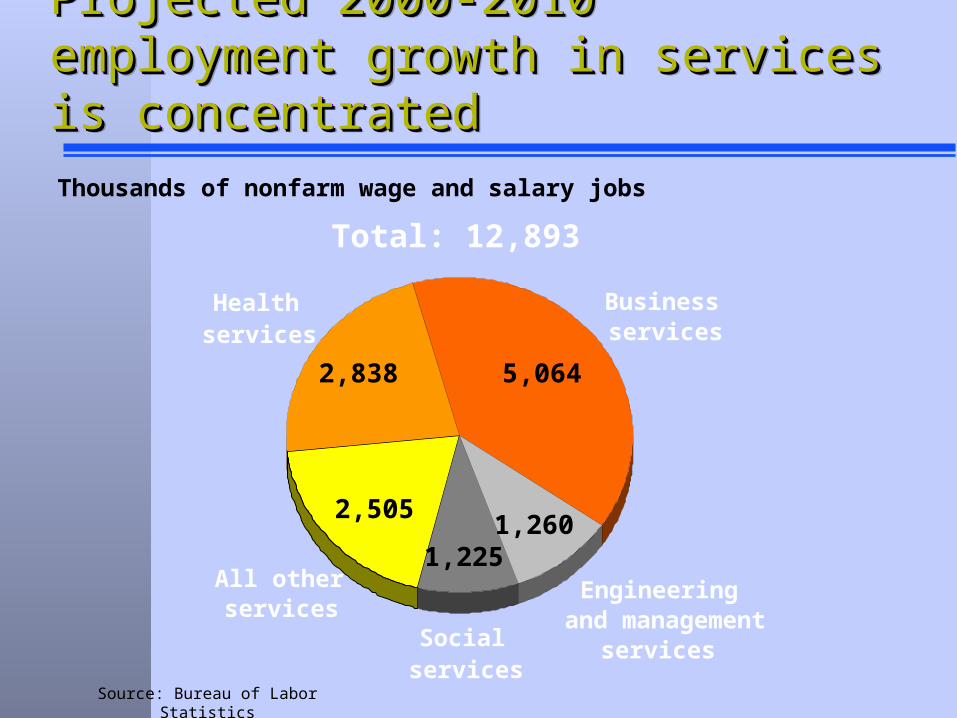
Projected 2000-2010 employment Projected 2000-2010 employment growth in services is concentratedgrowth in services is concentratedProjected 2000-2010 employment Projected 2000-2010 employment growth in services is concentratedgrowth in services is concentrated
Source: Bureau of Labor Statistics
Thousands of nonfarm wage and salary jobs
Engineering and management
services
Total: 12,893
Social services
All other services
Health services
Business services
5,064
1,2601,225
2,505
2,838
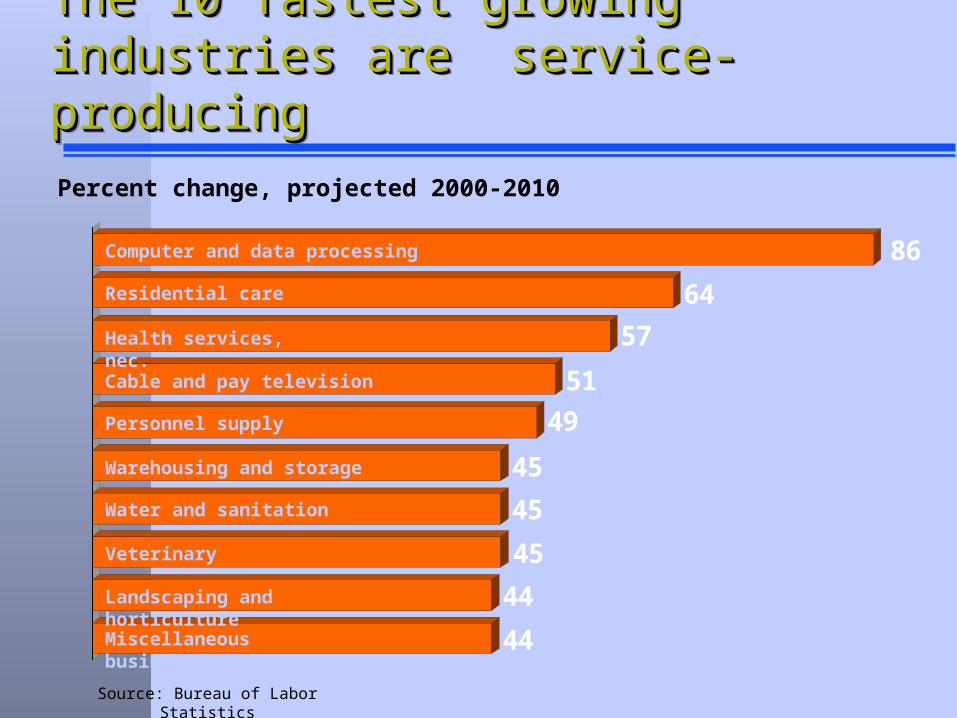
The 10 fastest growing industries The 10 fastest growing industries are service-producingare service-producingThe 10 fastest growing industries The 10 fastest growing industries are service-producingare service-producing
44
44
45
45
45
49
51
57
64
86Computer and data processing
Residential care
Health services, nec.
Cable and pay television
Personnel supply
Warehousing and storage
Water and sanitation
Veterinary
Landscaping and horticulture
Miscellaneous business
Source: Bureau of Labor Statistics
Percent change, projected 2000-2010
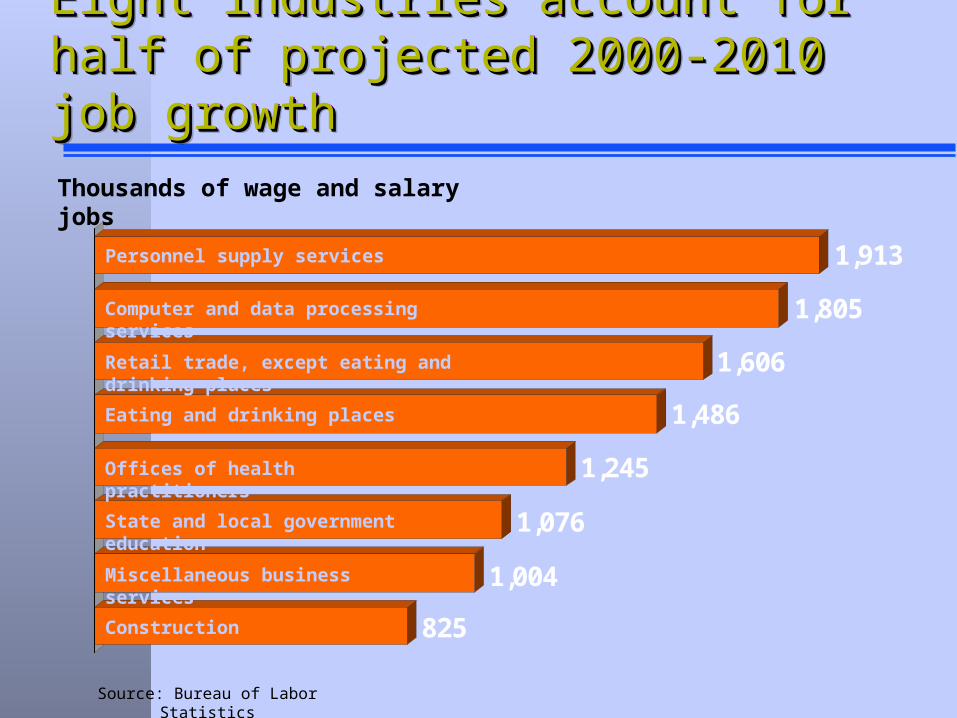
Eight industries account for half of Eight industries account for half of projected 2000-2010 job growthprojected 2000-2010 job growthEight industries account for half of Eight industries account for half of projected 2000-2010 job growthprojected 2000-2010 job growth
Source: Bureau of Labor Statistics
Thousands of wage and salary jobs
825
1,004
1,076
1,245
1,486
1,606
1,805
1,913Personnel supply services
Retail trade, except eating and drinking places
Offices of health practitioners
Miscellaneous business services
Construction
Eating and drinking places
Computer and data processing services
State and local government education
Employment Outlook: 2000-Employment Outlook: 2000-20102010
Employment Outlook: 2000-Employment Outlook: 2000-20102010
Labor force Economic growth Industry employment Occupational employment
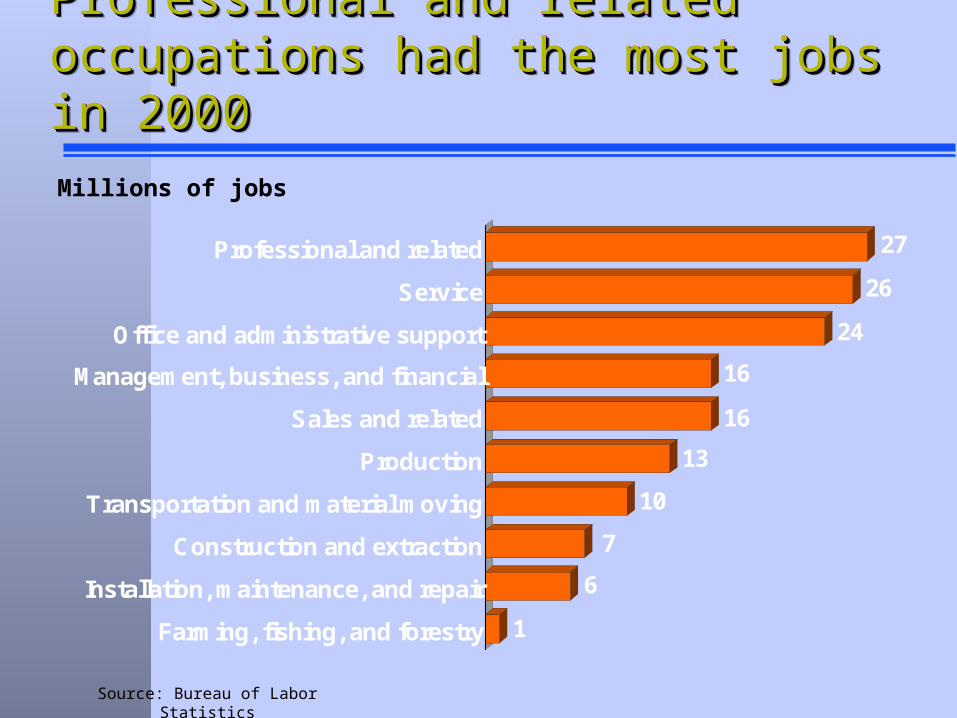
Professional and related Professional and related occupations had the most jobs in occupations had the most jobs in 20002000
Professional and related Professional and related occupations had the most jobs in occupations had the most jobs in 20002000
Source: Bureau of Labor Statistics
Millions of jobs
1
6
7
10
13
16
16
24
26
27
Farming, fishing, and forestry
Installation, maintenance, and repair
Construction and extraction
Transportation and material moving
Production
Sales and related
Management, business, and financial
Office and administrative support
Service
Professional and related
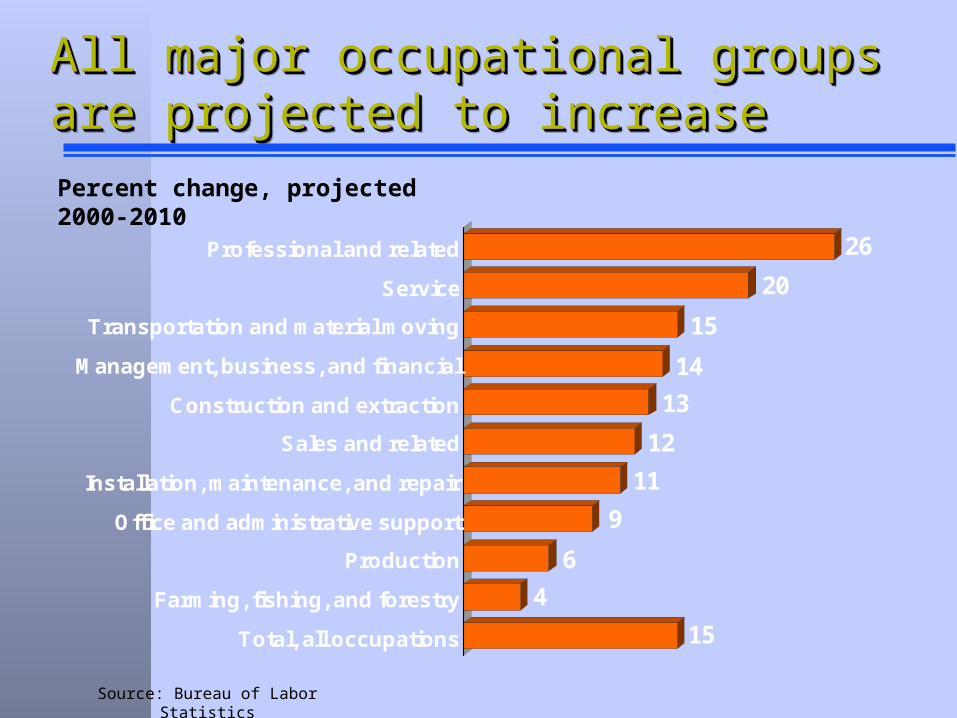
All major occupational groups are All major occupational groups are projected to increaseprojected to increaseAll major occupational groups are All major occupational groups are projected to increaseprojected to increase
15
4
6
9
11
12
13
14
15
20
26
Total, all occupations
Farming, fishing, and forestry
Production
Office and administrative support
Installation, maintenance, and repair
Sales and related
Construction and extraction
Management, business, and financial
Transportation and material moving
Service
Professional and related
Percent change, projected 2000-2010
Source: Bureau of Labor Statistics

Professional occupations account Professional occupations account for more than 3 out of 10 new jobsfor more than 3 out of 10 new jobsProfessional occupations account Professional occupations account for more than 3 out of 10 new jobsfor more than 3 out of 10 new jobs
Source: Bureau of Labor Statistics
Thousands of jobs, projected 2000-2010
51
662
750
989
1,530
1,852
2,115
2,171
5,088
6,952
Farming, fishing, and forestry
Installation, maintenance, and repair
Production
Construction and extraction
Transportation and material moving
Sales and related
Management, business, and financial
Office and administrative support
Service
Professional and related
Total: 22,160
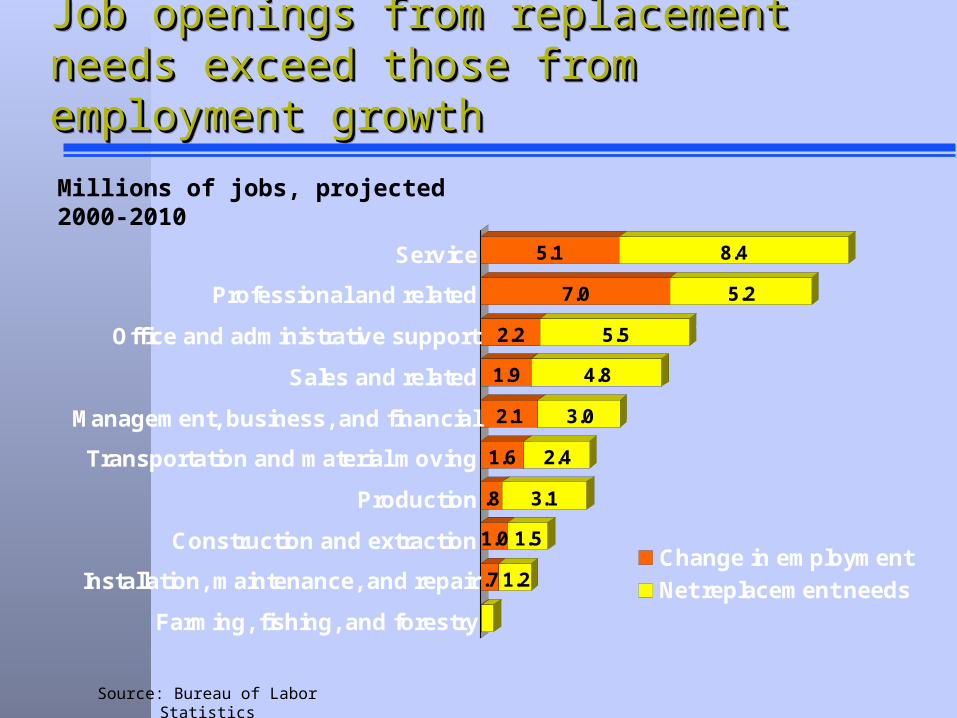
.7 1.2
1.0 1.5
.8 3.1
1.6 2.4
2.1 3.0
1.9 4.8
2.2 5.5
7.0 5.2
5.1 8.4
Farming, fishing, and forestry
Installation, maintenance, and repair
Construction and extraction
Production
Transportation and material moving
Management, business, and financial
Sales and related
Office and administrative support
Professional and related
Service
Change in employment
Net replacement needs
Job openings from replacement needs Job openings from replacement needs exceed those from employment growthexceed those from employment growthJob openings from replacement needs Job openings from replacement needs exceed those from employment growthexceed those from employment growth
Source: Bureau of Labor Statistics
Millions of jobs, projected 2000-2010
13.5
12.2
7.7
6.7
5.1
4.0
2.5
3.9
0.5
1.9