jonathan and sarah edwards - brentmark
TRANSCRIPT
FINANCIAL PLANNING REPORTJonathan and Sarah Edwards
Prepared by:
Mr. Sample Planner
A BC Financial Planners
123 M ain St.
Suite 100
Irmo, SC 29063
803-124-8752
Table of ContentsJonathan and Sarah Edwards
Client Profile
Client Information ....................................... 1
Summary of Goals and Objectives ............... 2
Key Factors ............................................... 3
F inancial Profile
Net W orth Information ................................. 1
3
Budget Information ..................................... 4
Net W orth Projections ................................ 6
Budget Project ions ..................................... 8
M ortgage Pay ment Computation .................. 10
13
Investment Profile
Portfolio A llocation W orksheet ..................... 1
Investment Portfolio .................................... 2
Retirement Plan
Retirement Income Requirements W orksheet 1
Retirement Planning W orksheet .................. 2
A sset Life Schedule ................................... 5
Y early Retirement Funding .......................... 9

Client ProfileJonathan and Sarah Edwards
Table of Contents
Client Information .................................. 1
Summary of Goals and Objectives .......... 2
Key Factors .......................................... 3
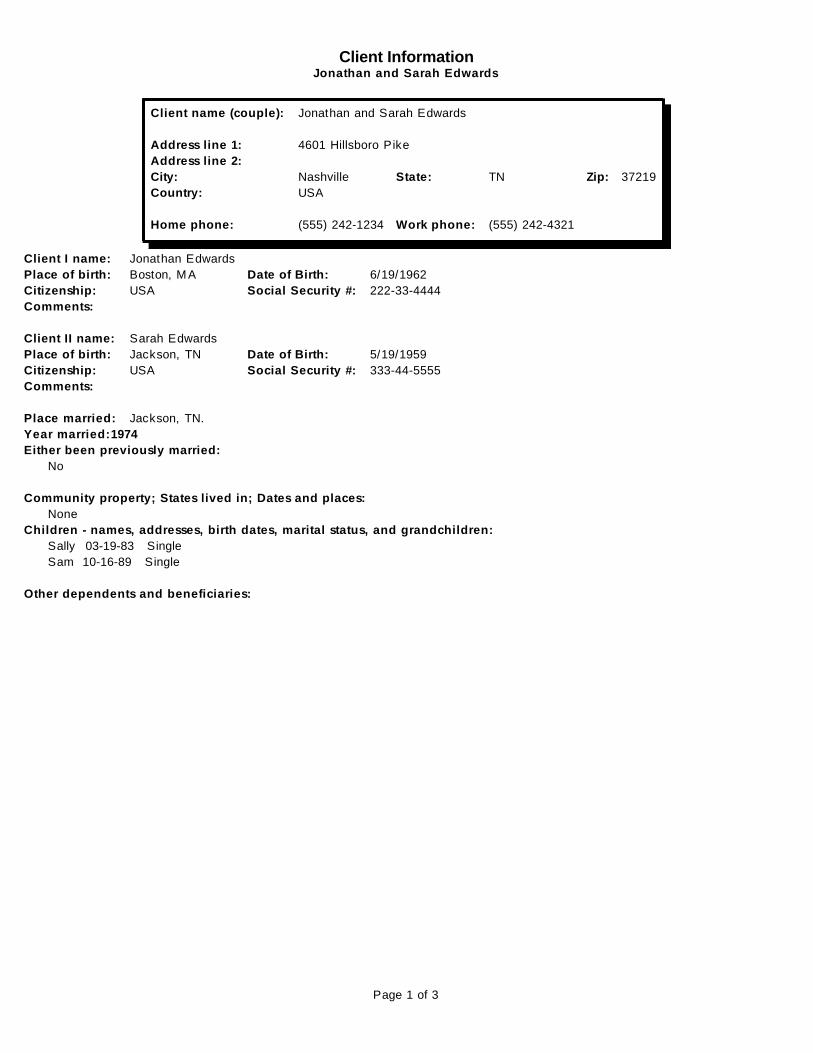
Client InformationJonathan and Sarah Edwards
Client name (couple): Jonathan and Sarah Edwards
Address line 1: 4601 Hillsboro Pike
Address line 2:
City: Nashville State: TN Zip: 37219
Country: USA
Home phone: (555) 242-1234 Work phone: (555) 242-4321
Client I name: Jonathan Edwards
Place of birth: Boston, M A Date of Birth: 6/19/1962
Citizenship: USA Social Security #: 222-33-4444
Comments:
Client II name: Sarah Edwards
Place of birth: Jackson, TN Date of Birth: 5/19/1959
Citizenship: USA Social Security #: 333-44-5555
Comments:
Place married: Jackson, TN.
Year married:1974
Either been previously married:
No
Community property; States lived in; Dates and places:
None
Children - names, addresses, birth dates, marital status, and grandchildren:
Sally 03-19-83 Single
Sam 10-16-89 Single
Other dependents and beneficiaries:
Page 1 of 3

Summary of Goals and ObjectivesJonathan and Sarah Edwards
Summary of goals and objectives.
1. Develop an investment strategy
2. Provide funds for y our children's college education
3. Develop a plan for disposit ion of family business
4. Plan for financial independence in 10 y ears
5. Provide a trust fund to provide for care of elderly parents
Page 2 of 3
Key FactorsJonathan and Sarah Edwards
Health History Cost of medical care will increase; Long Term Care may be necessary at some point.
Industry changes Relocation could be a factor. Liquidity may be serious requirement
Parents' health Uncertain parental needs require flex ibility .
Page 3 of 3
Financial ProfileJonathan and Sarah Edwards
Table of Contents
Net W orth Information ....................................... 1
Savings Bonds Summary 1/2/2007 - 1/2/07 16:24 3
Budget Information ........................................... 4
Net W orth Projections ...................................... 6
Budget Project ions ........................................... 8
M ortgage Pay ment Computation ........................ 10
Savings Bonds Portfolio 1/2/20 - 1/2/07 16:24 ..... 13

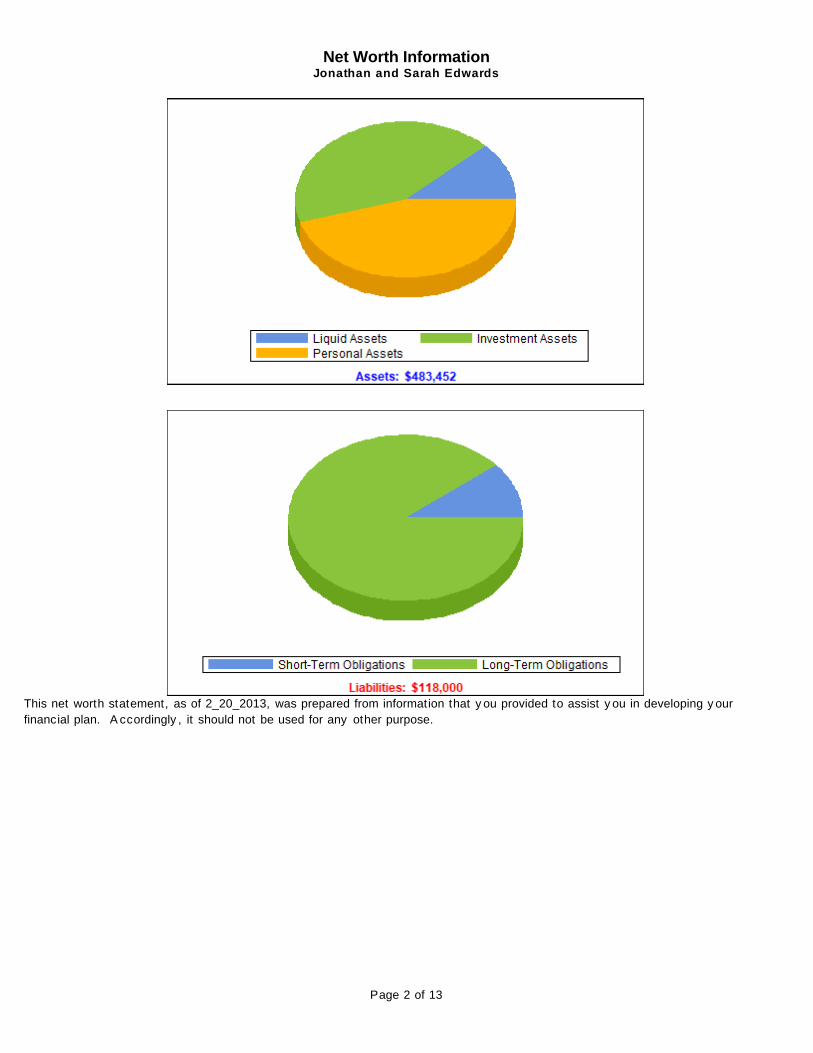
Net Worth InformationJonathan and Sarah Edwards
Jonathan Sarah Joint Total
Liquid Assets
Cash (Checking, Savings A ccts) $0 $0 $0 $0
Cash V alue of Life Insurance $22,600 $0 $0 $22,600
M oney M arket Funds $3 $0 $10,000 $10,003
Notes:Ownership = 51%
Basis = $1,200
Goal = $2,300
Joint = False
Savings Certificates $1,200 $600 $0 $1,800
Treasury Bills $2,000 $0 $0 $2,000
Savings Bonds $14,038 $8,292 $166 $22,496
Total Liquid Assets $39,841 $8,892 $10,166 $58,899
Investment Assets
M arketable Securit ies: Stocks $0 $0 $20,000 $20,000
M arketable Securit ies: Bonds $10,100 $5,836 $117 $16,053
M ortgage Receivable $0 $0 $70,000 $70,000
Other Investment A ssets $1,200 $0 $0 $1,200
Real Estate (Investment) $0 $0 $50,000 $50,000
Retirement Funds $48,000 $0 $0 $48,000
Total Investment Assets $59,300 $5,836 $140,117 $205,253
Personal Assets
Residence $0 $0 $100,000 $100,000
Household Furnishings $0 $0 $30,000 $30,000
Jewelry , A rt and A ntiques $0 $0 $17,500 $17,500
V acation Home $0 $0 $20,000 $20,000
Boats $0 $0 $12,000 $12,000
V ehicles $0 $0 $35,000 $35,000
Other Personal A ssets $1,800 $0 $3,000 $4,800
Total Personal Assets $1,800 $0 $217,500 $219,300
Total Assets $100,941 $14,728 $367,783 $483,452
Short-Term Obligations
Consumer Credit Obligat ions $0 $0 $3,000 $3,000
Installment Loans-A uto $0 $0 $10,000 $10,000
Total Short-Term Obligations $0 $0 $13,000 $13,000
Long-Term Obligations
M ortgage on Personal Residence $0 $0 $100,000 $100,000
M ortgage-V acation Home $0 $0 $5,000 $5,000
Total Long-Term Obligations $0 $0 $105,000 $105,000
Total Liabilities $0 $0 $118,000 $118,000
Net Worth $100,941 $14,728 $249,783 $365,452
Page 1 of 13
Net Worth InformationJonathan and Sarah Edwards
This net worth statement, as of 2_20_2013, was prepared from information that y ou provided to assist y ou in developing y our
financial plan. A ccordingly , it should not be used for any other purpose.
Page 2 of 13

Page 3 of 13
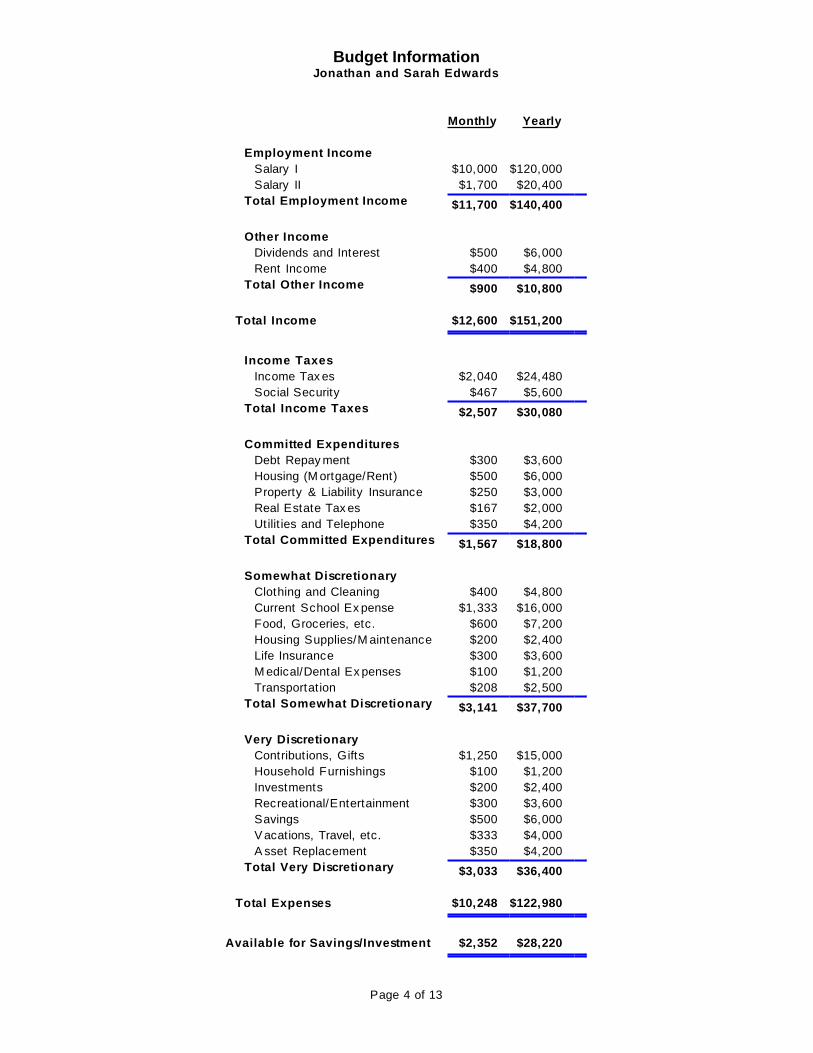
Budget InformationJonathan and Sarah Edwards
Monthly Yearly
Employment Income
Salary I $10,000 $120,000
Salary II $1,700 $20,400
Total Employment Income $11,700 $140,400
Other Income
Dividends and Interest $500 $6,000
Rent Income $400 $4,800
Total Other Income $900 $10,800
Total Income $12,600 $151,200
Income Taxes
Income Tax es $2,040 $24,480
Social Security $467 $5,600
Total Income Taxes $2,507 $30,080
Committed Expenditures
Debt Repay ment $300 $3,600
Housing (M ortgage/Rent) $500 $6,000
Property & Liability Insurance $250 $3,000
Real Estate Tax es $167 $2,000
Utilit ies and Telephone $350 $4,200
Total Committed Expenditures $1,567 $18,800
Somewhat Discretionary
Clothing and Cleaning $400 $4,800
Current School Ex pense $1,333 $16,000
Food, Groceries, etc. $600 $7,200
Housing Supplies/M aintenance $200 $2,400
Life Insurance $300 $3,600
M edical/Dental Ex penses $100 $1,200
Transportat ion $208 $2,500
Total Somewhat Discretionary $3,141 $37,700
Very Discretionary
Contributions, Gifts $1,250 $15,000
Household Furnishings $100 $1,200
Investments $200 $2,400
Recreational/Entertainment $300 $3,600
Savings $500 $6,000
V acations, Travel, etc. $333 $4,000
A sset Replacement $350 $4,200
Total Very Discretionary $3,033 $36,400
Total Expenses $10,248 $122,980
Available for Savings/Investment $2,352 $28,220
Page 4 of 13
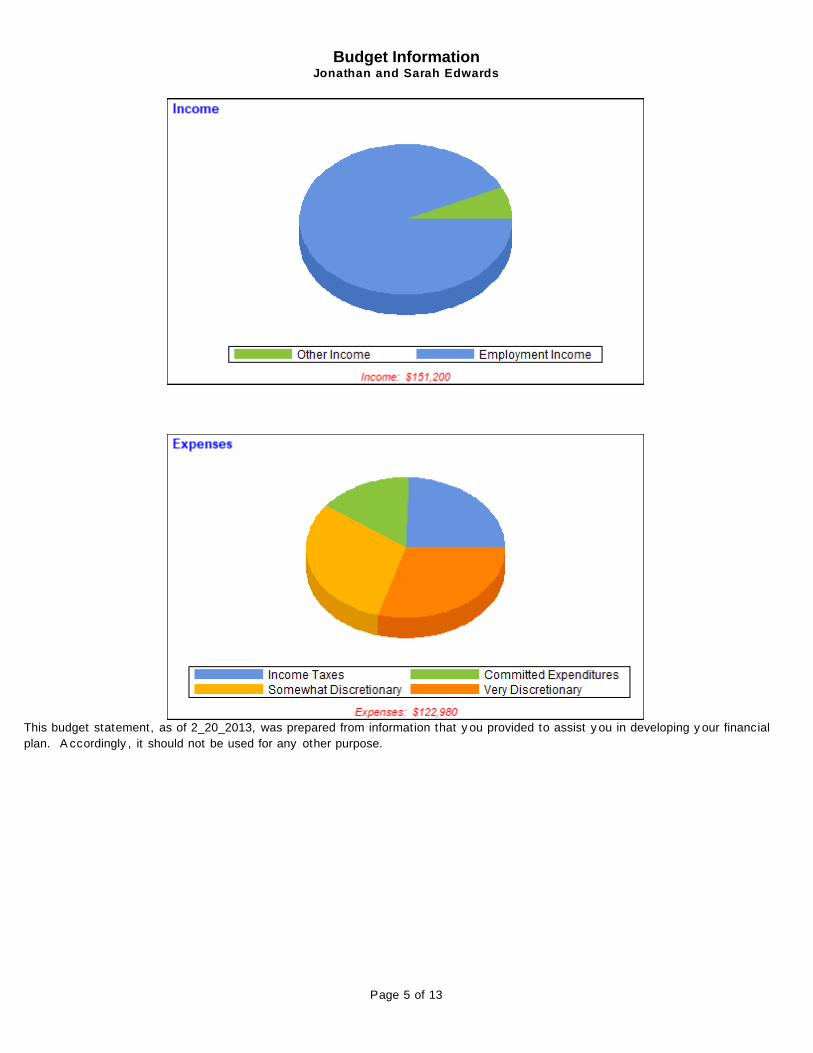
Budget InformationJonathan and Sarah Edwards
This budget statement, as of 2_20_2013, was prepared from information that y ou provided to assist y ou in developing y our financial
plan. A ccordingly , it should not be used for any other purpose.
Page 5 of 13
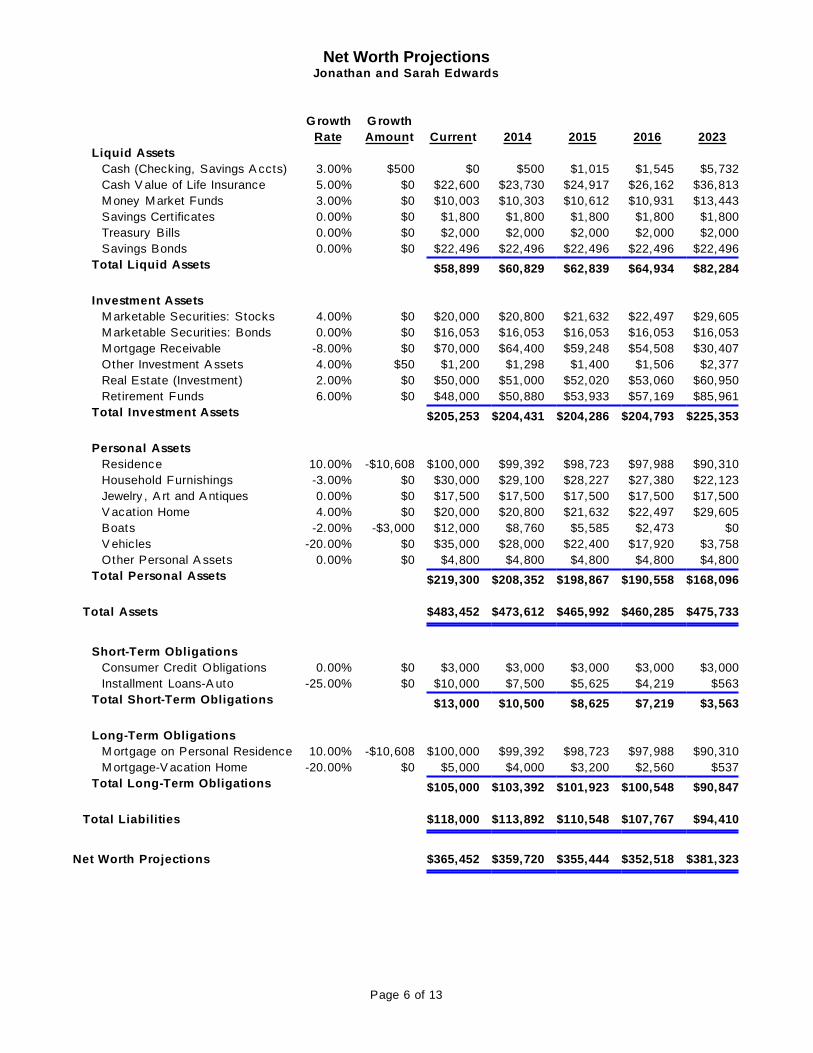
Net Worth ProjectionsJonathan and Sarah Edwards
Growth Growth
Rate Amount Current 2014 2015 2016 2023
Liquid Assets
Cash (Checking, Savings A ccts) 3.00% $500 $0 $500 $1,015 $1,545 $5,732
Cash V alue of Life Insurance 5.00% $0 $22,600 $23,730 $24,917 $26,162 $36,813
M oney M arket Funds 3.00% $0 $10,003 $10,303 $10,612 $10,931 $13,443
Savings Certificates 0.00% $0 $1,800 $1,800 $1,800 $1,800 $1,800
Treasury Bills 0.00% $0 $2,000 $2,000 $2,000 $2,000 $2,000
Savings Bonds 0.00% $0 $22,496 $22,496 $22,496 $22,496 $22,496
Total Liquid Assets $58,899 $60,829 $62,839 $64,934 $82,284
Investment Assets
M arketable Securit ies: Stocks 4.00% $0 $20,000 $20,800 $21,632 $22,497 $29,605
M arketable Securit ies: Bonds 0.00% $0 $16,053 $16,053 $16,053 $16,053 $16,053
M ortgage Receivable -8.00% $0 $70,000 $64,400 $59,248 $54,508 $30,407
Other Investment A ssets 4.00% $50 $1,200 $1,298 $1,400 $1,506 $2,377
Real Estate (Investment) 2.00% $0 $50,000 $51,000 $52,020 $53,060 $60,950
Retirement Funds 6.00% $0 $48,000 $50,880 $53,933 $57,169 $85,961
Total Investment Assets $205,253 $204,431 $204,286 $204,793 $225,353
Personal Assets
Residence 10.00% -$10,608 $100,000 $99,392 $98,723 $97,988 $90,310
Household Furnishings -3.00% $0 $30,000 $29,100 $28,227 $27,380 $22,123
Jewelry , A rt and A ntiques 0.00% $0 $17,500 $17,500 $17,500 $17,500 $17,500
V acation Home 4.00% $0 $20,000 $20,800 $21,632 $22,497 $29,605
Boats -2.00% -$3,000 $12,000 $8,760 $5,585 $2,473 $0
V ehicles -20.00% $0 $35,000 $28,000 $22,400 $17,920 $3,758
Other Personal A ssets 0.00% $0 $4,800 $4,800 $4,800 $4,800 $4,800
Total Personal Assets $219,300 $208,352 $198,867 $190,558 $168,096
Total Assets $483,452 $473,612 $465,992 $460,285 $475,733
Short-Term Obligations
Consumer Credit Obligat ions 0.00% $0 $3,000 $3,000 $3,000 $3,000 $3,000
Installment Loans-A uto -25.00% $0 $10,000 $7,500 $5,625 $4,219 $563
Total Short-Term Obligations $13,000 $10,500 $8,625 $7,219 $3,563
Long-Term Obligations
M ortgage on Personal Residence 10.00% -$10,608 $100,000 $99,392 $98,723 $97,988 $90,310
M ortgage-V acation Home -20.00% $0 $5,000 $4,000 $3,200 $2,560 $537
Total Long-Term Obligations $105,000 $103,392 $101,923 $100,548 $90,847
Total Liabilities $118,000 $113,892 $110,548 $107,767 $94,410
Net Worth Projections $365,452 $359,720 $355,444 $352,518 $381,323
Page 6 of 13
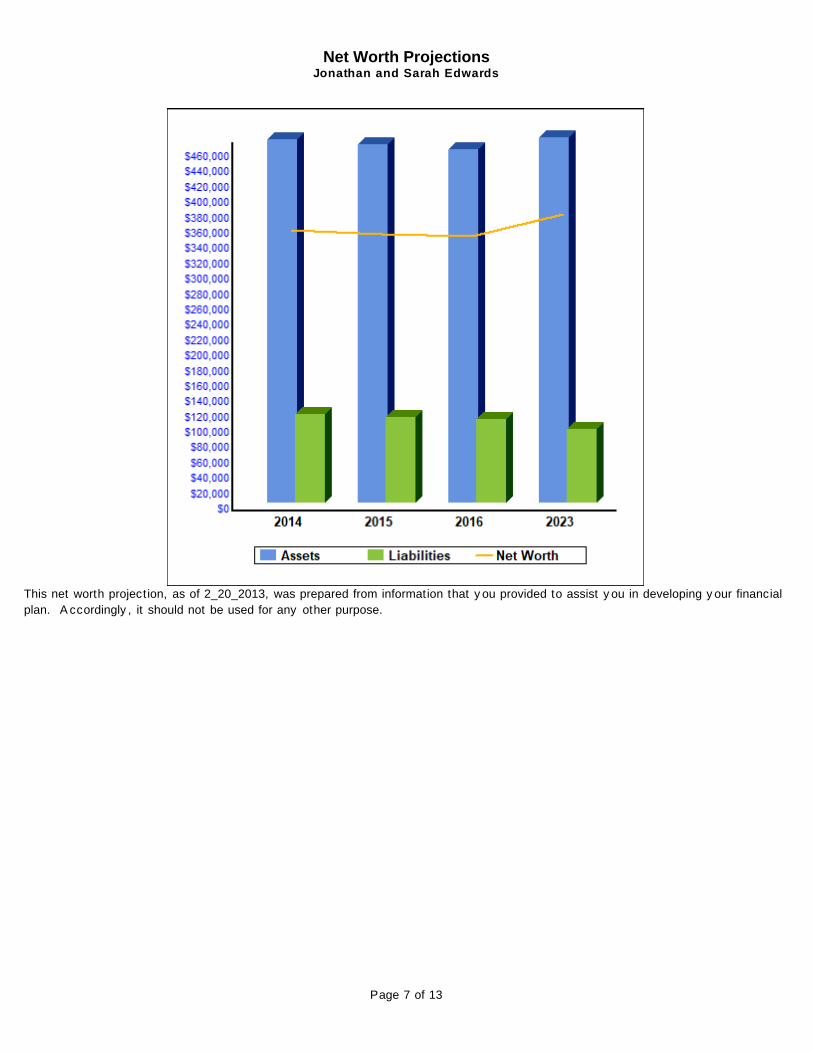
Net Worth ProjectionsJonathan and Sarah Edwards
This net worth projection, as of 2_20_2013, was prepared from information that y ou provided to assist y ou in developing y our financial
plan. A ccordingly , it should not be used for any other purpose.
Page 7 of 13
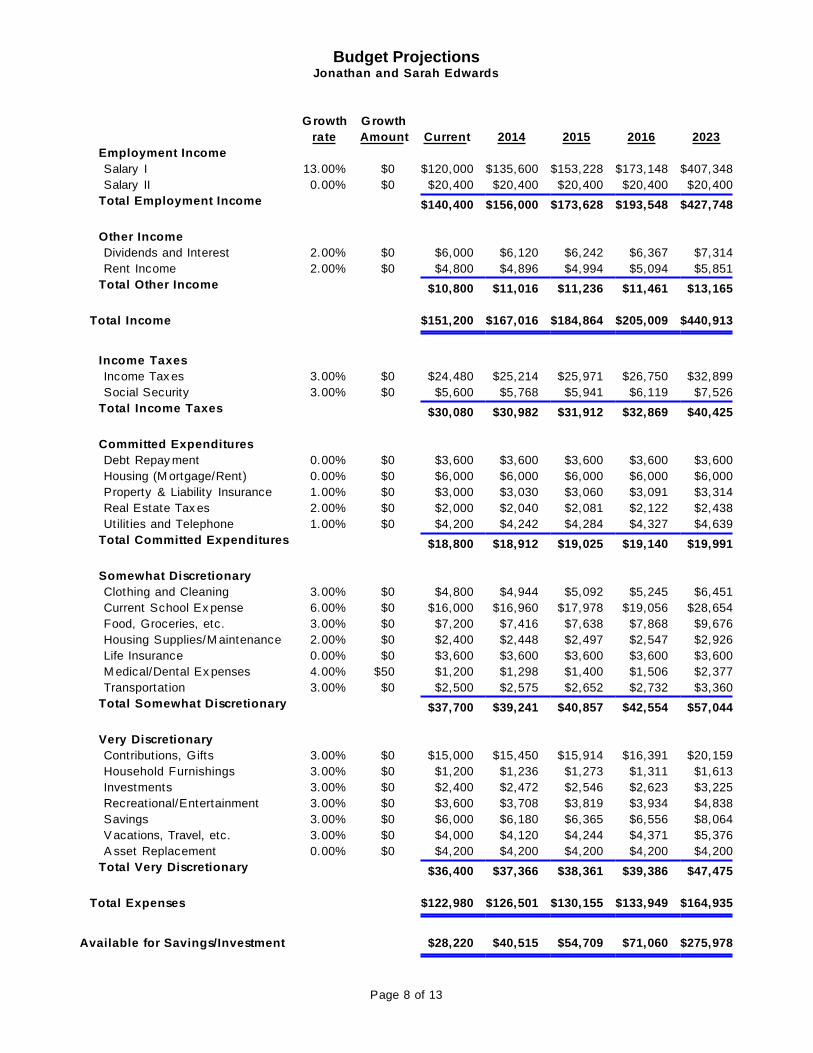
Budget ProjectionsJonathan and Sarah Edwards
Growth Growth
rate Amount Current 2014 2015 2016 2023
Employment Income
Salary I 13.00% $0 $120,000 $135,600 $153,228 $173,148 $407,348
Salary II 0.00% $0 $20,400 $20,400 $20,400 $20,400 $20,400
Total Employment Income $140,400 $156,000 $173,628 $193,548 $427,748
Other Income
Dividends and Interest 2.00% $0 $6,000 $6,120 $6,242 $6,367 $7,314
Rent Income 2.00% $0 $4,800 $4,896 $4,994 $5,094 $5,851
Total Other Income $10,800 $11,016 $11,236 $11,461 $13,165
Total Income $151,200 $167,016 $184,864 $205,009 $440,913
Income Taxes
Income Tax es 3.00% $0 $24,480 $25,214 $25,971 $26,750 $32,899
Social Security 3.00% $0 $5,600 $5,768 $5,941 $6,119 $7,526
Total Income Taxes $30,080 $30,982 $31,912 $32,869 $40,425
Committed Expenditures
Debt Repay ment 0.00% $0 $3,600 $3,600 $3,600 $3,600 $3,600
Housing (M ortgage/Rent) 0.00% $0 $6,000 $6,000 $6,000 $6,000 $6,000
Property & Liability Insurance 1.00% $0 $3,000 $3,030 $3,060 $3,091 $3,314
Real Estate Tax es 2.00% $0 $2,000 $2,040 $2,081 $2,122 $2,438
Utilit ies and Telephone 1.00% $0 $4,200 $4,242 $4,284 $4,327 $4,639
Total Committed Expenditures $18,800 $18,912 $19,025 $19,140 $19,991
Somewhat Discretionary
Clothing and Cleaning 3.00% $0 $4,800 $4,944 $5,092 $5,245 $6,451
Current School Ex pense 6.00% $0 $16,000 $16,960 $17,978 $19,056 $28,654
Food, Groceries, etc. 3.00% $0 $7,200 $7,416 $7,638 $7,868 $9,676
Housing Supplies/M aintenance 2.00% $0 $2,400 $2,448 $2,497 $2,547 $2,926
Life Insurance 0.00% $0 $3,600 $3,600 $3,600 $3,600 $3,600
M edical/Dental Ex penses 4.00% $50 $1,200 $1,298 $1,400 $1,506 $2,377
Transportat ion 3.00% $0 $2,500 $2,575 $2,652 $2,732 $3,360
Total Somewhat Discretionary $37,700 $39,241 $40,857 $42,554 $57,044
Very Discretionary
Contributions, Gifts 3.00% $0 $15,000 $15,450 $15,914 $16,391 $20,159
Household Furnishings 3.00% $0 $1,200 $1,236 $1,273 $1,311 $1,613
Investments 3.00% $0 $2,400 $2,472 $2,546 $2,623 $3,225
Recreational/Entertainment 3.00% $0 $3,600 $3,708 $3,819 $3,934 $4,838
Savings 3.00% $0 $6,000 $6,180 $6,365 $6,556 $8,064
V acations, Travel, etc. 3.00% $0 $4,000 $4,120 $4,244 $4,371 $5,376
A sset Replacement 0.00% $0 $4,200 $4,200 $4,200 $4,200 $4,200
Total Very Discretionary $36,400 $37,366 $38,361 $39,386 $47,475
Total Expenses $122,980 $126,501 $130,155 $133,949 $164,935
Available for Savings/Investment $28,220 $40,515 $54,709 $71,060 $275,978
Page 8 of 13
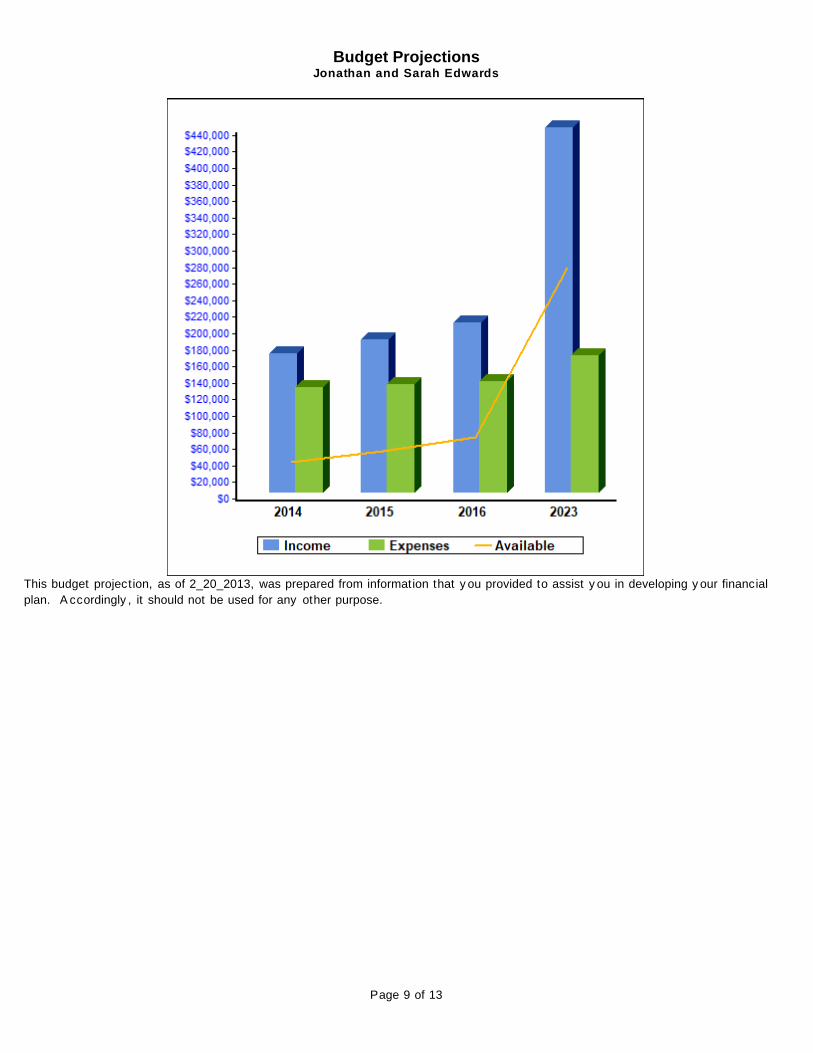
Budget ProjectionsJonathan and Sarah Edwards
This budget projection, as of 2_20_2013, was prepared from information that y ou provided to assist y ou in developing y our financial
plan. A ccordingly , it should not be used for any other purpose.
Page 9 of 13
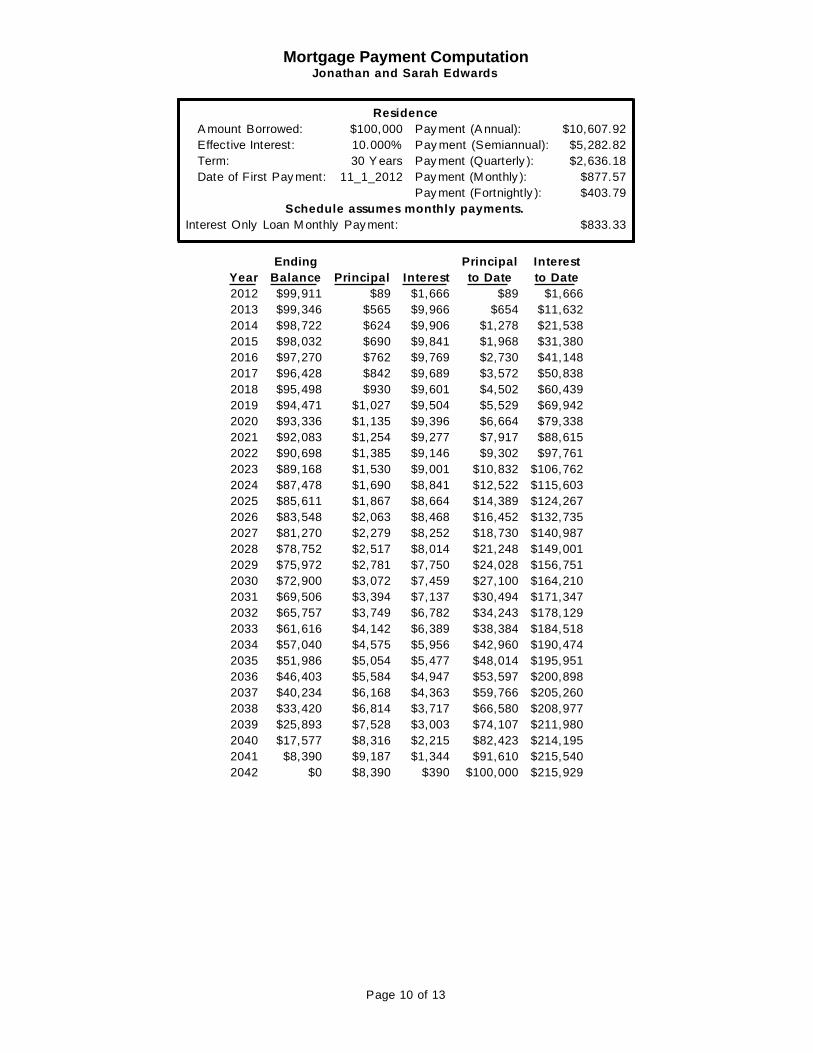
Mortgage Payment ComputationJonathan and Sarah Edwards
Residence
A mount Borrowed: $100,000 Pay ment (A nnual): $10,607.92
Effective Interest: 10.000% Pay ment (Semiannual): $5,282.82
Term: 30 Y ears Pay ment (Quarterly ): $2,636.18
Date of First Pay ment: 11_1_2012 Pay ment (M onthly ): $877.57
Pay ment (Fortnightly ): $403.79
Schedule assumes monthly payments.
Interest Only Loan M onthly Pay ment: $833.33
Ending Principal Interest
Year Balance Principal Interest to Date to Date
2012 $99,911 $89 $1,666 $89 $1,666
2013 $99,346 $565 $9,966 $654 $11,632
2014 $98,722 $624 $9,906 $1,278 $21,538
2015 $98,032 $690 $9,841 $1,968 $31,380
2016 $97,270 $762 $9,769 $2,730 $41,148
2017 $96,428 $842 $9,689 $3,572 $50,838
2018 $95,498 $930 $9,601 $4,502 $60,439
2019 $94,471 $1,027 $9,504 $5,529 $69,942
2020 $93,336 $1,135 $9,396 $6,664 $79,338
2021 $92,083 $1,254 $9,277 $7,917 $88,615
2022 $90,698 $1,385 $9,146 $9,302 $97,761
2023 $89,168 $1,530 $9,001 $10,832 $106,762
2024 $87,478 $1,690 $8,841 $12,522 $115,603
2025 $85,611 $1,867 $8,664 $14,389 $124,267
2026 $83,548 $2,063 $8,468 $16,452 $132,735
2027 $81,270 $2,279 $8,252 $18,730 $140,987
2028 $78,752 $2,517 $8,014 $21,248 $149,001
2029 $75,972 $2,781 $7,750 $24,028 $156,751
2030 $72,900 $3,072 $7,459 $27,100 $164,210
2031 $69,506 $3,394 $7,137 $30,494 $171,347
2032 $65,757 $3,749 $6,782 $34,243 $178,129
2033 $61,616 $4,142 $6,389 $38,384 $184,518
2034 $57,040 $4,575 $5,956 $42,960 $190,474
2035 $51,986 $5,054 $5,477 $48,014 $195,951
2036 $46,403 $5,584 $4,947 $53,597 $200,898
2037 $40,234 $6,168 $4,363 $59,766 $205,260
2038 $33,420 $6,814 $3,717 $66,580 $208,977
2039 $25,893 $7,528 $3,003 $74,107 $211,980
2040 $17,577 $8,316 $2,215 $82,423 $214,195
2041 $8,390 $9,187 $1,344 $91,610 $215,540
2042 $0 $8,390 $390 $100,000 $215,929
Page 10 of 13

Mortgage Payment ComputationJonathan and Sarah Edwards
Residence
A mount Borrowed: $100,000 Pay ment (A nnual): $10,607.92
Effective Interest: 10.000% Pay ment (Semiannual): $5,282.82
Term: 30 Y ears Pay ment (Quarterly ): $2,636.18
Date of First Pay ment: 11_1_2012 Pay ment (M onthly ): $877.57
Pay ment (Fortnightly ): $403.79
Schedule assumes fortnightly payments.
Interest Only Loan Fortnightly Pay ment: $384.62
Ending Principal Interest
Year Balance Principal Interest to Date to Date
2012 $99,898 $102 $1,917 $102 $1,917
2013 $99,335 $563 $9,936 $665 $11,853
2014 $98,714 $622 $9,877 $1,286 $21,730
2015 $98,027 $687 $9,812 $1,973 $31,542
2016 $97,269 $758 $9,740 $2,731 $41,282
2017 $96,431 $838 $9,661 $3,569 $50,943
2018 $95,506 $925 $9,573 $4,494 $60,516
2019 $94,484 $1,022 $9,476 $5,516 $69,992
2020 $93,309 $1,175 $9,727 $6,692 $79,720
2021 $92,056 $1,252 $9,246 $7,944 $88,966
2022 $90,673 $1,383 $9,115 $9,327 $98,081
2023 $89,145 $1,528 $8,970 $10,855 $107,052
2024 $87,457 $1,688 $8,811 $12,543 $115,862
2025 $85,592 $1,865 $8,634 $14,408 $124,496
2026 $83,532 $2,060 $8,439 $16,468 $132,935
2027 $81,257 $2,275 $8,223 $18,743 $141,158
2028 $78,744 $2,514 $7,985 $21,257 $149,143
2029 $75,967 $2,777 $7,722 $24,033 $156,865
2030 $72,900 $3,067 $7,431 $27,100 $164,296
2031 $69,512 $3,388 $7,110 $30,488 $171,407
2032 $65,617 $3,894 $7,008 $34,383 $178,415
2033 $61,467 $4,150 $6,348 $38,533 $184,763
2034 $56,882 $4,585 $5,914 $43,118 $190,677
2035 $51,818 $5,065 $5,434 $48,182 $196,111
2036 $46,223 $5,595 $4,904 $53,777 $201,015
2037 $40,043 $6,180 $4,318 $59,957 $205,333
2038 $33,216 $6,827 $3,672 $66,784 $209,005
2039 $25,675 $7,541 $2,957 $74,325 $211,962
2040 $17,344 $8,331 $2,168 $82,656 $214,130
2041 $8,142 $9,202 $1,296 $91,858 $215,426
2042 $0 $8,142 $348 $100,000 $215,774
Page 11 of 13
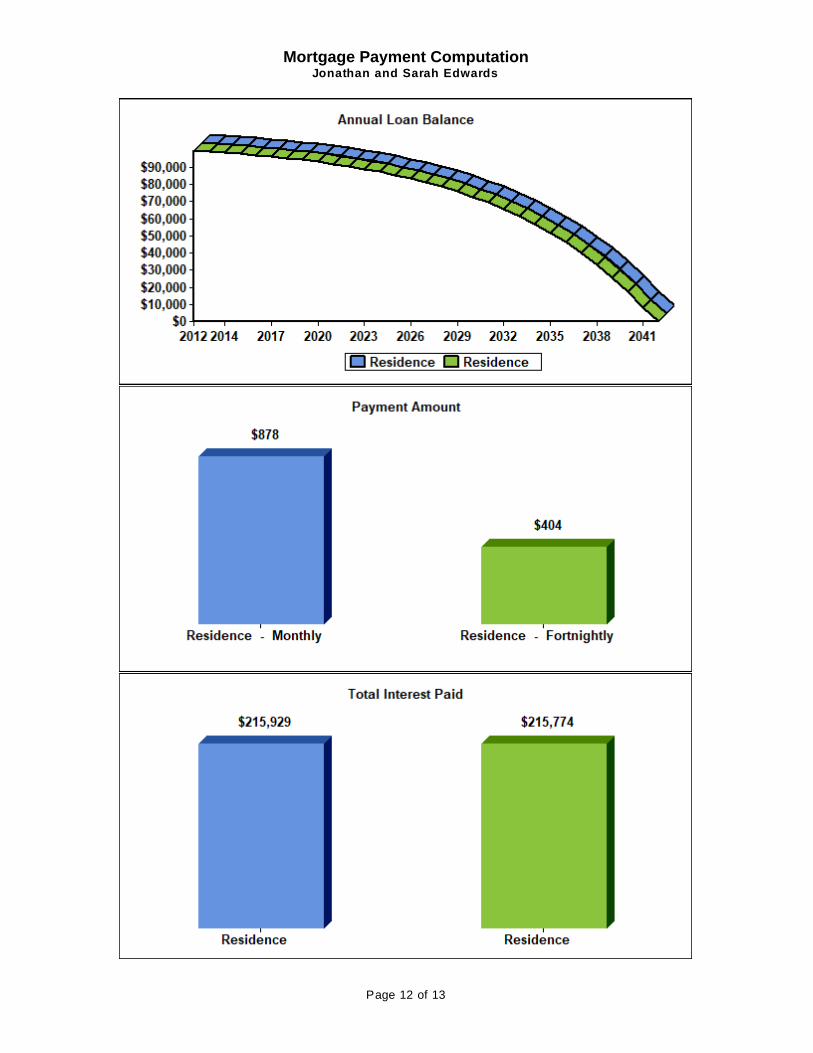
Mortgage Payment ComputationJonathan and Sarah Edwards
Page 12 of 13

Page 13 of 13

Investment ProfileJonathan and Sarah Edwards
Table of Contents
Portfolio A llocation W orksheet ................ 1
Investment Portfolio ............................... 2
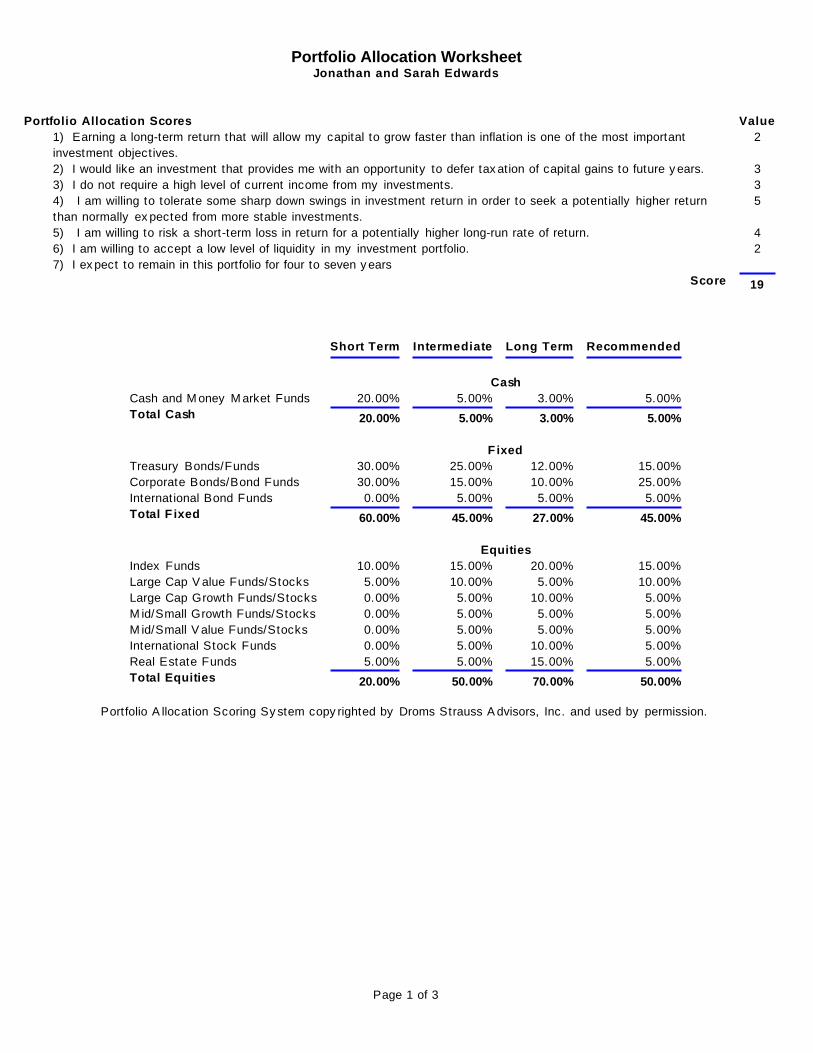
Portfolio Allocation WorksheetJonathan and Sarah Edwards
Portfolio Allocation Scores Value
1) Earning a long-term return that will allow my capital to grow faster than inflation is one of the most important
investment objectives.
2
2) I would like an investment that provides me with an opportunity to defer tax ation of capital gains to future y ears. 3
3) I do not require a high level of current income from my investments. 3
4) I am willing to tolerate some sharp down swings in investment return in order to seek a potentially higher return
than normally ex pected from more stable investments.
5
5) I am willing to risk a short-term loss in return for a potentially higher long-run rate of return. 4
6) I am willing to accept a low level of liquidity in my investment portfolio. 2
7) I ex pect to remain in this portfolio for four to seven y ears
Score 19
Short Term Intermediate Long Term Recommended
Cash
Cash and M oney M arket Funds 20.00% 5.00% 3.00% 5.00%
Total Cash 20.00% 5.00% 3.00% 5.00%
Fixed
Treasury Bonds/Funds 30.00% 25.00% 12.00% 15.00%
Corporate Bonds/Bond Funds 30.00% 15.00% 10.00% 25.00%
International Bond Funds 0.00% 5.00% 5.00% 5.00%
Total F ixed 60.00% 45.00% 27.00% 45.00%
Equities
Index Funds 10.00% 15.00% 20.00% 15.00%
Large Cap V alue Funds/Stocks 5.00% 10.00% 5.00% 10.00%
Large Cap Growth Funds/Stocks 0.00% 5.00% 10.00% 5.00%
M id/Small Growth Funds/Stocks 0.00% 5.00% 5.00% 5.00%
M id/Small V alue Funds/Stocks 0.00% 5.00% 5.00% 5.00%
International Stock Funds 0.00% 5.00% 10.00% 5.00%
Real Estate Funds 5.00% 5.00% 15.00% 5.00%
Total Equities 20.00% 50.00% 70.00% 50.00%
Portfolio A llocation Scoring Sy stem copy righted by Droms Strauss A dvisors, Inc. and used by permission.
Page 1 of 3
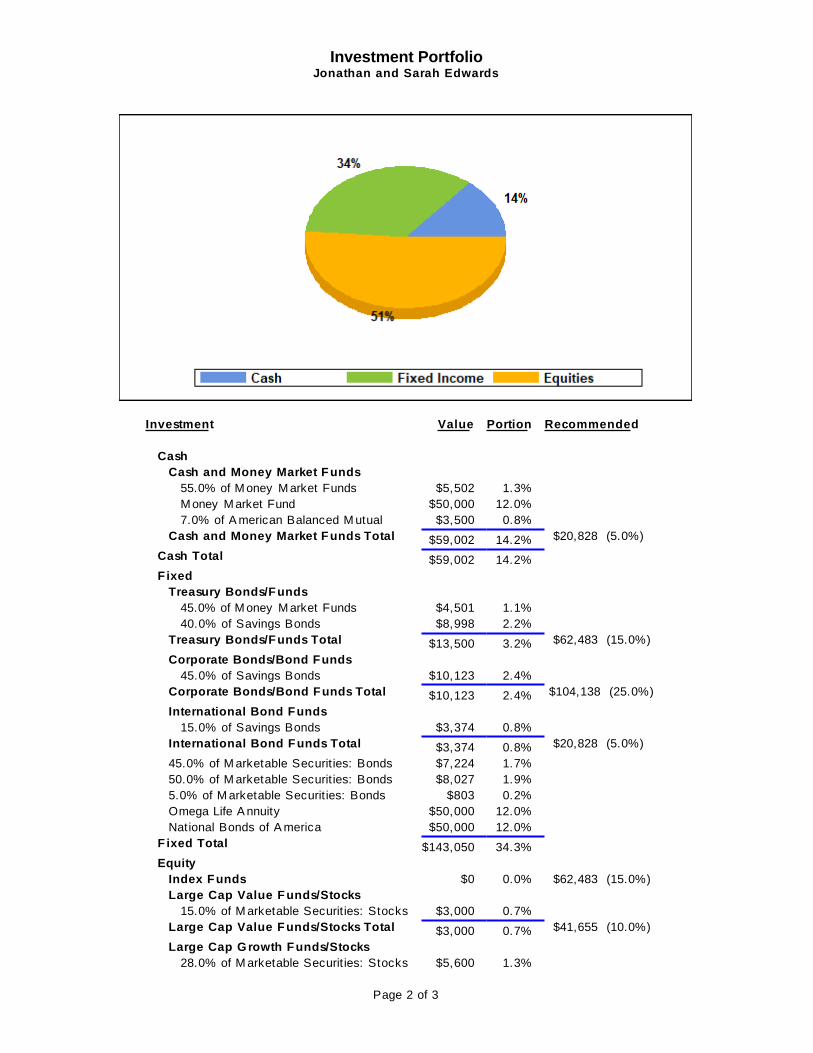
Investment PortfolioJonathan and Sarah Edwards
Investment Value Portion Recommended
Cash
Cash and Money Market Funds
55.0% of M oney M arket Funds $5,502 1.3%
M oney M arket Fund $50,000 12.0%
7.0% of A merican Balanced M utual $3,500 0.8%
Cash and Money Market Funds Total $59,002 14.2% $20,828 (5.0%)
Cash Total $59,002 14.2%
Fixed
Treasury Bonds/Funds
45.0% of M oney M arket Funds $4,501 1.1%
40.0% of Savings Bonds $8,998 2.2%
Treasury Bonds/Funds Total $13,500 3.2% $62,483 (15.0%)
Corporate Bonds/Bond Funds
45.0% of Savings Bonds $10,123 2.4%
Corporate Bonds/Bond Funds Total $10,123 2.4% $104,138 (25.0%)
International Bond Funds
15.0% of Savings Bonds $3,374 0.8%
International Bond Funds Total $3,374 0.8% $20,828 (5.0%)
45.0% of M arketable Securit ies: Bonds $7,224 1.7%
50.0% of M arketable Securit ies: Bonds $8,027 1.9%
5.0% of M arketable Securit ies: Bonds $803 0.2%
Omega Life A nnuity $50,000 12.0%
National Bonds of A merica $50,000 12.0%
Fixed Total $143,050 34.3%
Equity
Index Funds $0 0.0% $62,483 (15.0%)
Large Cap Value F unds/Stocks
15.0% of M arketable Securit ies: Stocks $3,000 0.7%
Large Cap Value F unds/Stocks Total $3,000 0.7% $41,655 (10.0%)
Large Cap Growth Funds/Stocks
28.0% of M arketable Securit ies: Stocks $5,600 1.3%
Page 2 of 3
Investment PortfolioJonathan and Sarah Edwards
Investment Value Portion Recommended
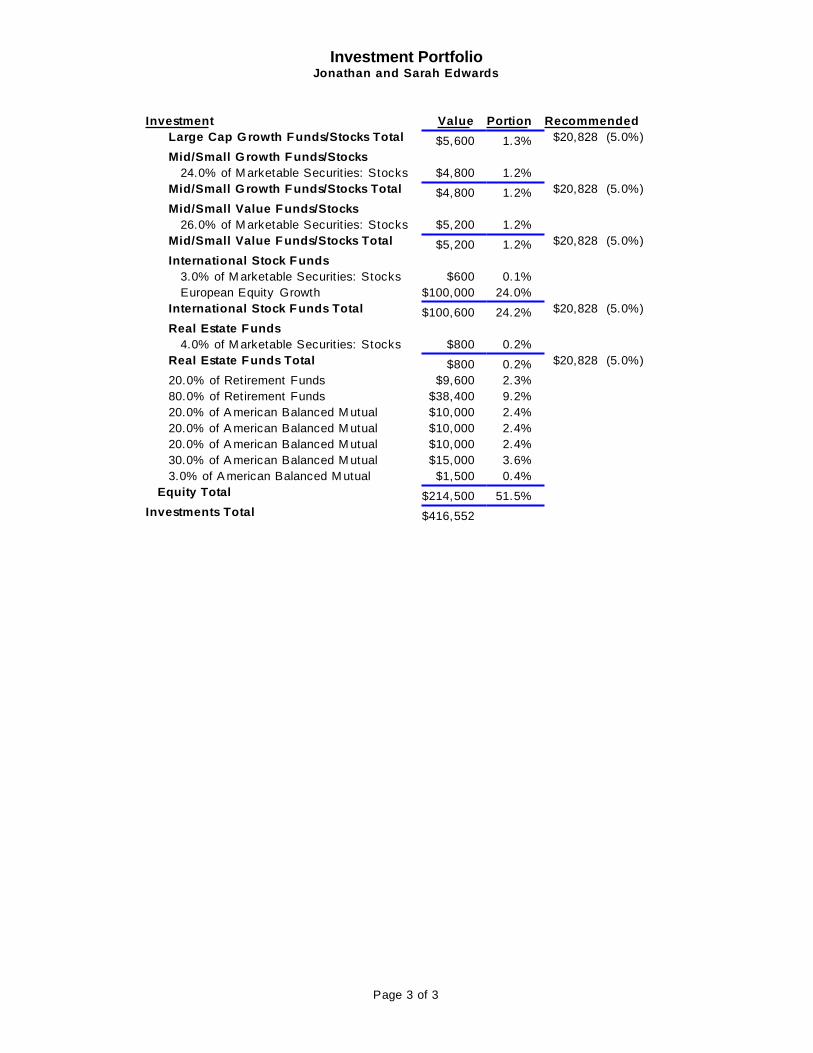
Large Cap Growth Funds/Stocks Total $5,600 1.3% $20,828 (5.0%)
Mid/Small Growth Funds/Stocks
24.0% of M arketable Securit ies: Stocks $4,800 1.2%
Mid/Small Growth Funds/Stocks Total $4,800 1.2% $20,828 (5.0%)
Mid/Small Value F unds/Stocks
26.0% of M arketable Securit ies: Stocks $5,200 1.2%
Mid/Small Value F unds/Stocks Total $5,200 1.2% $20,828 (5.0%)
International Stock F unds
3.0% of M arketable Securit ies: Stocks $600 0.1%
European Equity Growth $100,000 24.0%
International Stock Funds Total $100,600 24.2% $20,828 (5.0%)
Real Estate Funds
4.0% of M arketable Securit ies: Stocks $800 0.2%
Real Estate Funds Total $800 0.2% $20,828 (5.0%)
20.0% of Retirement Funds $9,600 2.3%
80.0% of Retirement Funds $38,400 9.2%
20.0% of A merican Balanced M utual $10,000 2.4%
20.0% of A merican Balanced M utual $10,000 2.4%
20.0% of A merican Balanced M utual $10,000 2.4%
30.0% of A merican Balanced M utual $15,000 3.6%
3.0% of A merican Balanced M utual $1,500 0.4%
Equity Total $214,500 51.5%
Investments Total $416,552
Page 3 of 3

Retirement PlanJonathan and Sarah Edwards
Table of Contents
Retirement Income Requirements W orksheet 1
Retirement Planning W orksheet .................. 2
A sset Life Schedule ................................... 5
Y early Retirement Funding .......................... 9
Retirement Income Requirements WorksheetJonathan and Sarah Edwards
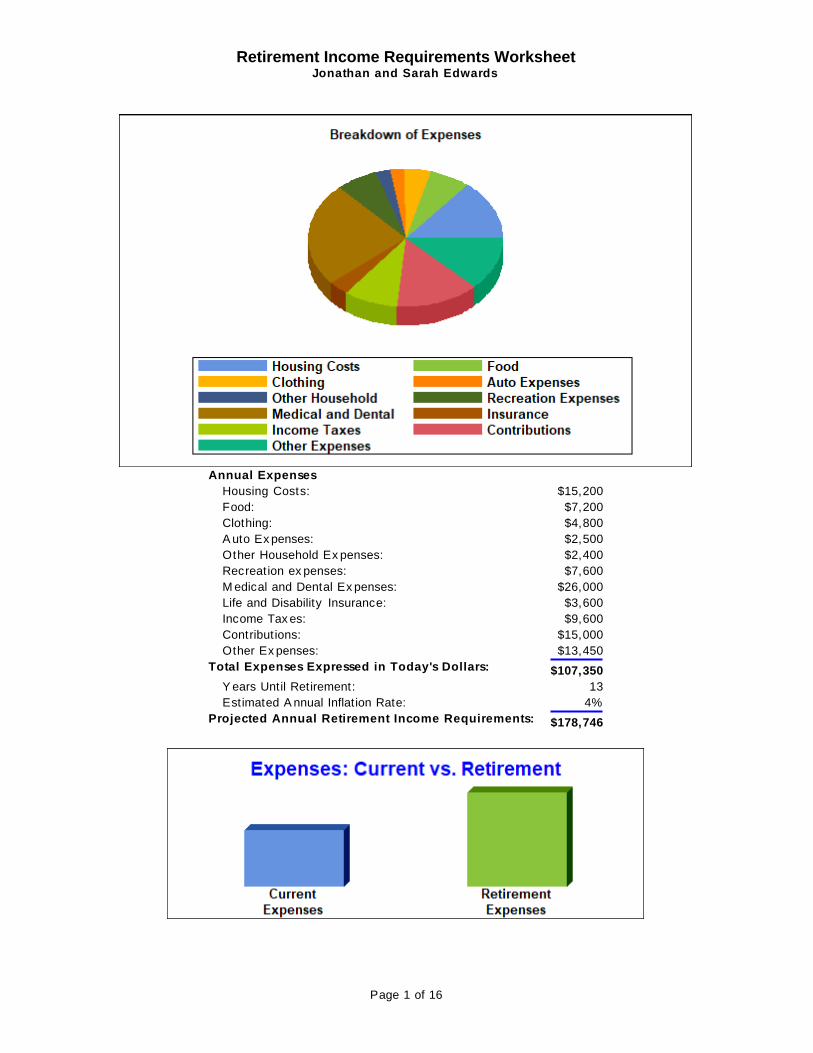
Annual Expenses
Housing Costs: $15,200
Food: $7,200
Clothing: $4,800
A uto Ex penses: $2,500
Other Household Ex penses: $2,400
Recreation ex penses: $7,600
M edical and Dental Ex penses: $26,000
Life and Disability Insurance: $3,600
Income Tax es: $9,600
Contribut ions: $15,000
Other Ex penses: $13,450
Total Expenses Expressed in Today's Dollars: $107,350
Y ears Until Retirement: 13
Estimated A nnual Inflation Rate: 4%
Projected Annual Retirement Income Requirements: $178,746
Page 1 of 16
Retirement Planning WorksheetJonathan and Sarah Edwards
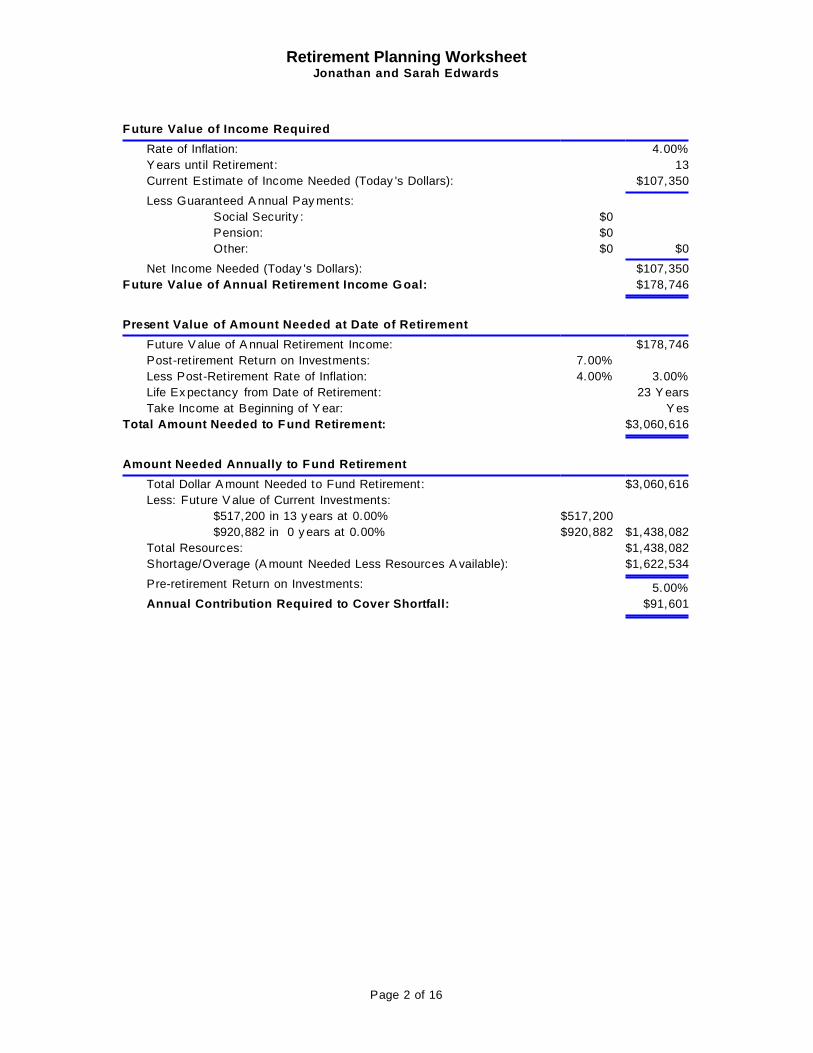
F uture Value of Income Required
Rate of Inflation: 4.00%
Y ears until Retirement: 13
Current Estimate of Income Needed (Today 's Dollars): $107,350
Less Guaranteed A nnual Pay ments:
Social Security : $0
Pension: $0
Other: $0 $0
Net Income Needed (Today 's Dollars): $107,350
Future Value of Annual Retirement Income Goal: $178,746
Present Value of Amount Needed at Date of Retirement
Future V alue of A nnual Retirement Income: $178,746
Post-retirement Return on Investments: 7.00%
Less Post-Retirement Rate of Inflat ion: 4.00% 3.00%
Life Ex pectancy from Date of Retirement: 23 Y ears
Take Income at Beginning of Y ear: Y es
Total Amount Needed to Fund Retirement: $3,060,616
Amount Needed Annually to Fund Retirement
Total Dollar A mount Needed to Fund Retirement: $3,060,616
Less: Future V alue of Current Investments:
$517,200 in 13 y ears at 0.00% $517,200
$920,882 in 0 y ears at 0.00% $920,882 $1,438,082
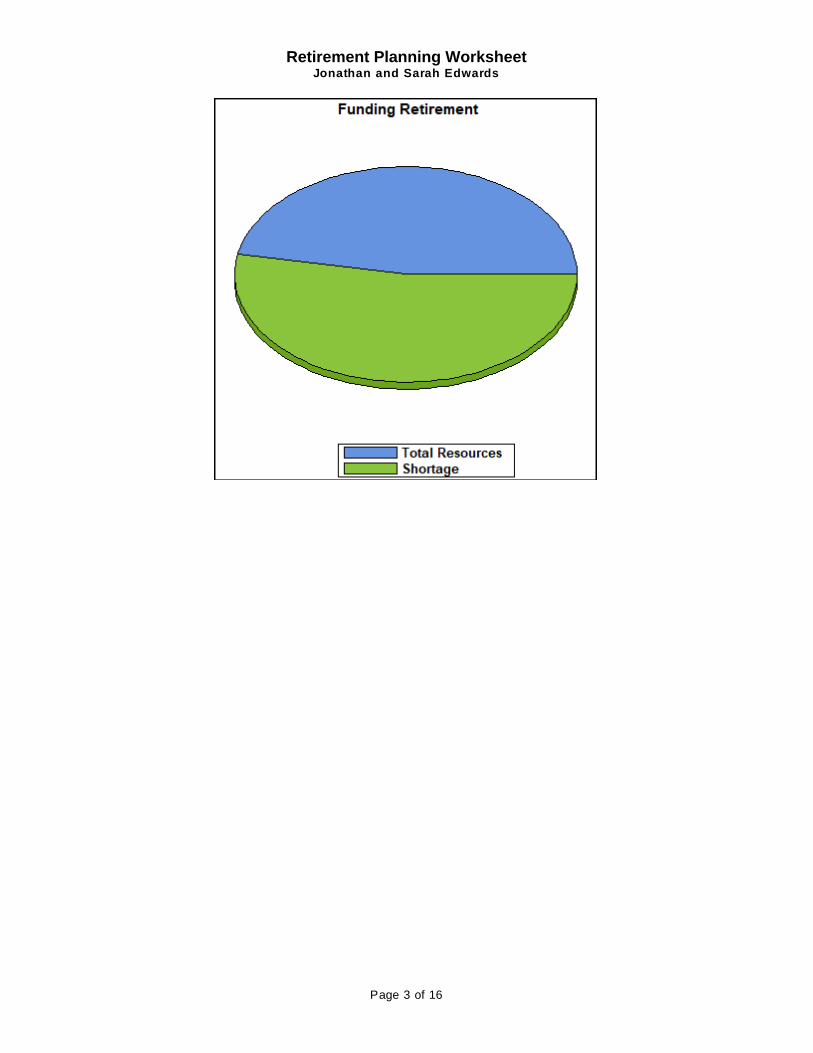
Total Resources: $1,438,082
Shortage/Overage (A mount Needed Less Resources A vailable): $1,622,534
Pre-retirement Return on Investments: 5.00%
Annual Contribution Required to Cover Shortfall: $91,601
Page 2 of 16
Retirement Planning WorksheetJonathan and Sarah Edwards
Page 3 of 16
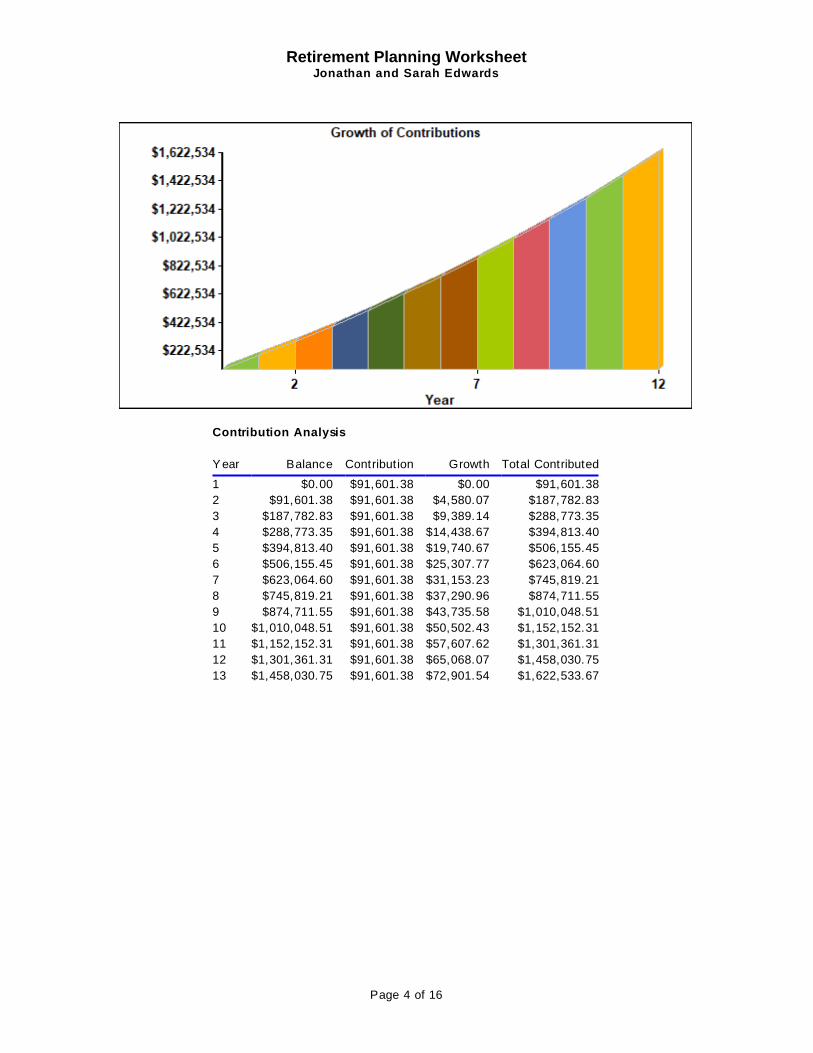
Retirement Planning WorksheetJonathan and Sarah Edwards
Contribution Analysis
Y ear Balance Contribution Growth Total Contributed
1 $0.00 $91,601.38 $0.00 $91,601.38
2 $91,601.38 $91,601.38 $4,580.07 $187,782.83
3 $187,782.83 $91,601.38 $9,389.14 $288,773.35
4 $288,773.35 $91,601.38 $14,438.67 $394,813.40
5 $394,813.40 $91,601.38 $19,740.67 $506,155.45
6 $506,155.45 $91,601.38 $25,307.77 $623,064.60
7 $623,064.60 $91,601.38 $31,153.23 $745,819.21
8 $745,819.21 $91,601.38 $37,290.96 $874,711.55
9 $874,711.55 $91,601.38 $43,735.58 $1,010,048.51
10 $1,010,048.51 $91,601.38 $50,502.43 $1,152,152.31
11 $1,152,152.31 $91,601.38 $57,607.62 $1,301,361.31
12 $1,301,361.31 $91,601.38 $65,068.07 $1,458,030.75
13 $1,458,030.75 $91,601.38 $72,901.54 $1,622,533.67
Page 4 of 16
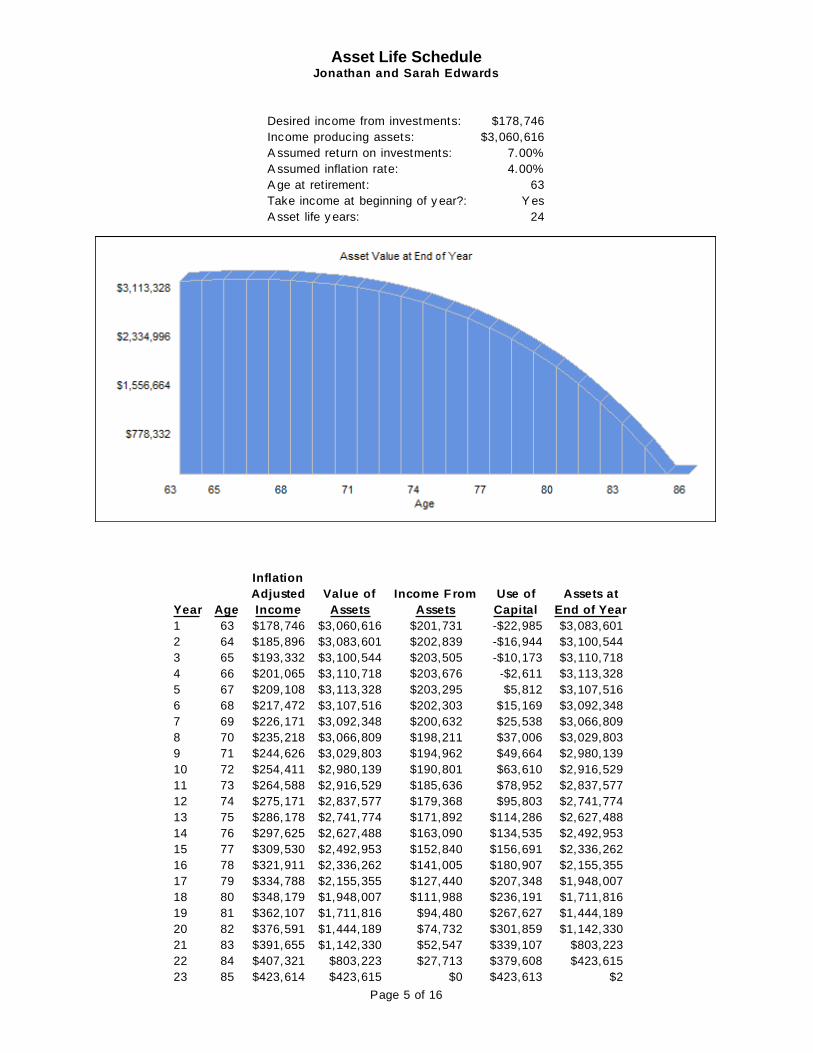
Asset Life ScheduleJonathan and Sarah Edwards
Desired income from investments: $178,746
Income producing assets: $3,060,616
A ssumed return on investments: 7.00%
A ssumed inflat ion rate: 4.00%
A ge at retirement: 63
Take income at beginning of y ear?: Y es
A sset life y ears: 24
Inflation
Adjusted Value of Income F rom Use of Assets at
Year Age Income Assets Assets Capital End of Year
1 63 $178,746 $3,060,616 $201,731 -$22,985 $3,083,601
2 64 $185,896 $3,083,601 $202,839 -$16,944 $3,100,544
3 65 $193,332 $3,100,544 $203,505 -$10,173 $3,110,718
4 66 $201,065 $3,110,718 $203,676 -$2,611 $3,113,328
5 67 $209,108 $3,113,328 $203,295 $5,812 $3,107,516
6 68 $217,472 $3,107,516 $202,303 $15,169 $3,092,348
7 69 $226,171 $3,092,348 $200,632 $25,538 $3,066,809
8 70 $235,218 $3,066,809 $198,211 $37,006 $3,029,803
9 71 $244,626 $3,029,803 $194,962 $49,664 $2,980,139
10 72 $254,411 $2,980,139 $190,801 $63,610 $2,916,529
11 73 $264,588 $2,916,529 $185,636 $78,952 $2,837,577
12 74 $275,171 $2,837,577 $179,368 $95,803 $2,741,774
13 75 $286,178 $2,741,774 $171,892 $114,286 $2,627,488
14 76 $297,625 $2,627,488 $163,090 $134,535 $2,492,953
15 77 $309,530 $2,492,953 $152,840 $156,691 $2,336,262
16 78 $321,911 $2,336,262 $141,005 $180,907 $2,155,355
17 79 $334,788 $2,155,355 $127,440 $207,348 $1,948,007
18 80 $348,179 $1,948,007 $111,988 $236,191 $1,711,816
19 81 $362,107 $1,711,816 $94,480 $267,627 $1,444,189
20 82 $376,591 $1,444,189 $74,732 $301,859 $1,142,330
21 83 $391,655 $1,142,330 $52,547 $339,107 $803,223
22 84 $407,321 $803,223 $27,713 $379,608 $423,615
23 85 $423,614 $423,615 $0 $423,613 $2
Page 5 of 16
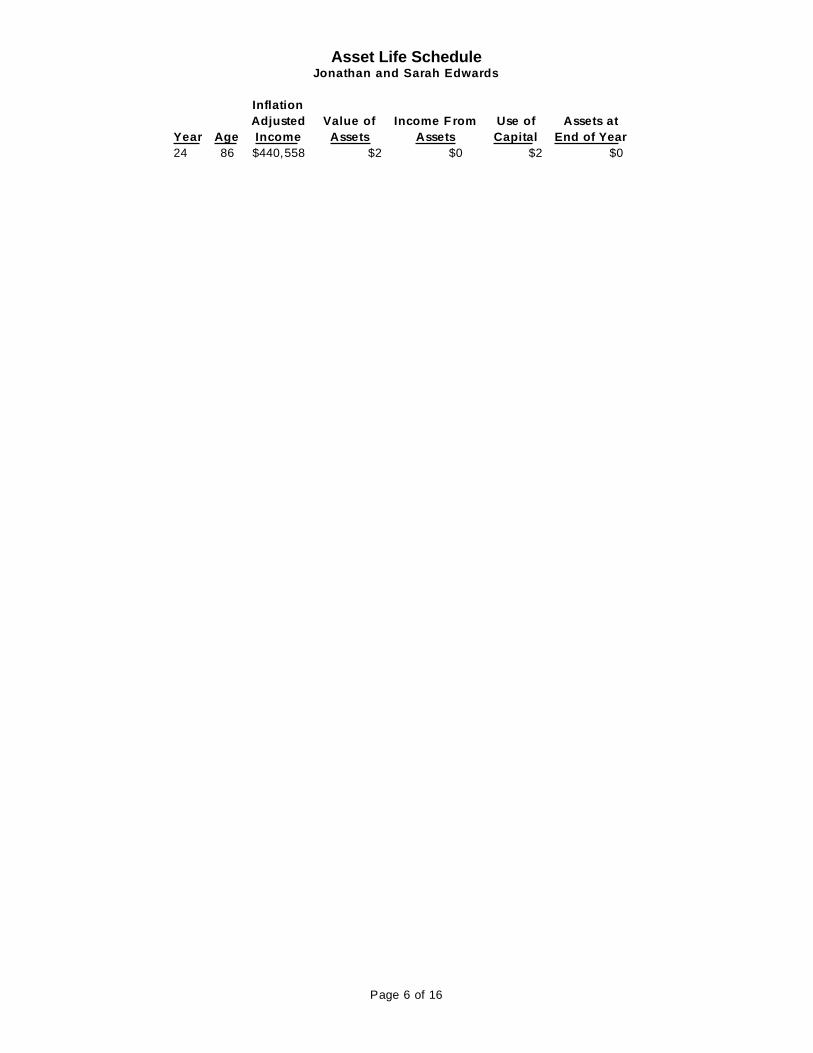
Asset Life ScheduleJonathan and Sarah Edwards
Inflation
Adjusted Value of Income F rom Use of Assets at
Year Age Income Assets Assets Capital End of Year
24 86 $440,558 $2 $0 $2 $0
Page 6 of 16
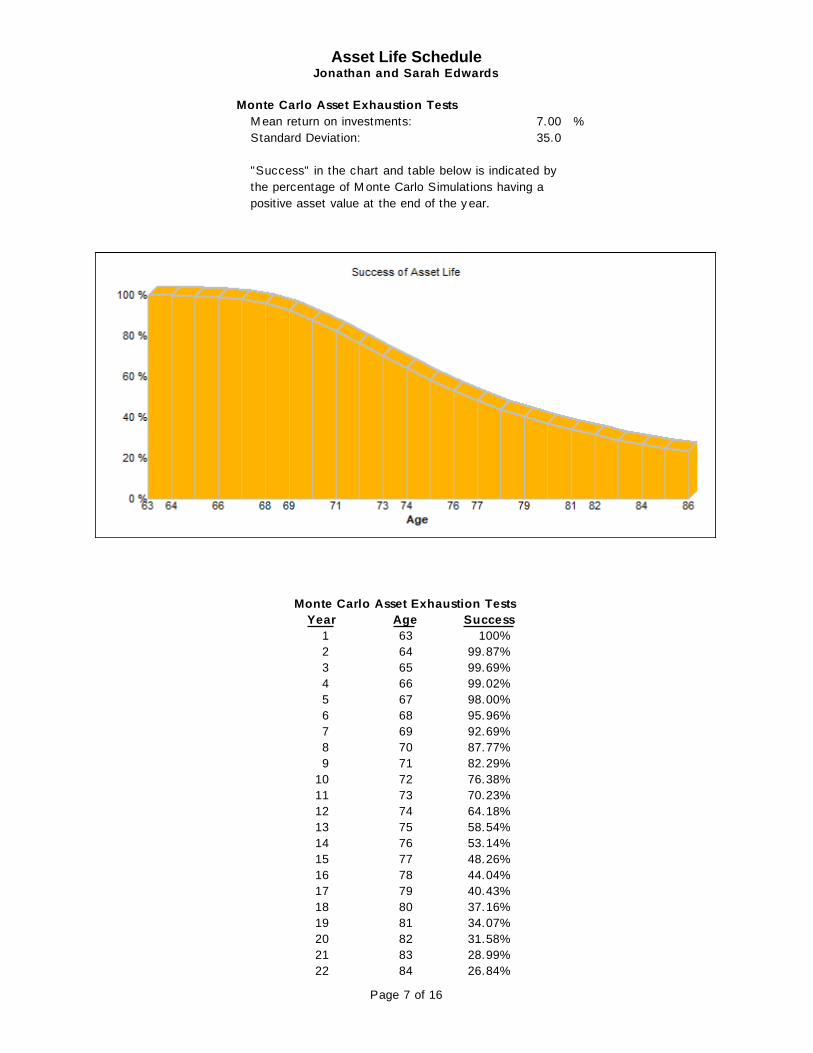
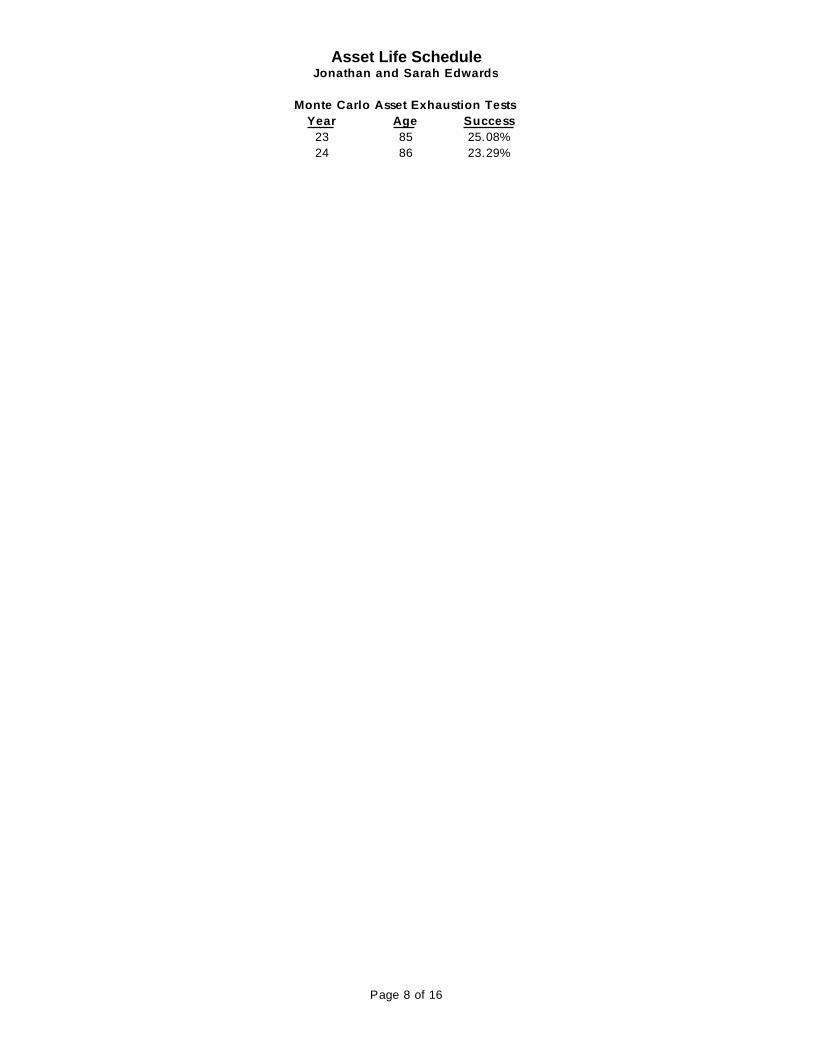
Asset Life ScheduleJonathan and Sarah Edwards
Monte Carlo Asset Exhaustion Tests
M ean return on investments: 7.00 %
Standard Deviation: 35.0
"Success" in the chart and table below is indicated by
the percentage of M onte Carlo Simulations having a
positive asset value at the end of the y ear.
Monte Carlo Asset Exhaustion Tests
Year Age Success
1 63 100%
2 64 99.87%
3 65 99.69%
4 66 99.02%
5 67 98.00%
6 68 95.96%
7 69 92.69%
8 70 87.77%
9 71 82.29%
10 72 76.38%
11 73 70.23%
12 74 64.18%
13 75 58.54%
14 76 53.14%
15 77 48.26%
16 78 44.04%
17 79 40.43%
18 80 37.16%
19 81 34.07%
20 82 31.58%
21 83 28.99%
22 84 26.84%
Page 7 of 16
Asset Life ScheduleJonathan and Sarah Edwards
Monte Carlo Asset Exhaustion Tests
Year Age Success
23 85 25.08%
24 86 23.29%
Page 8 of 16
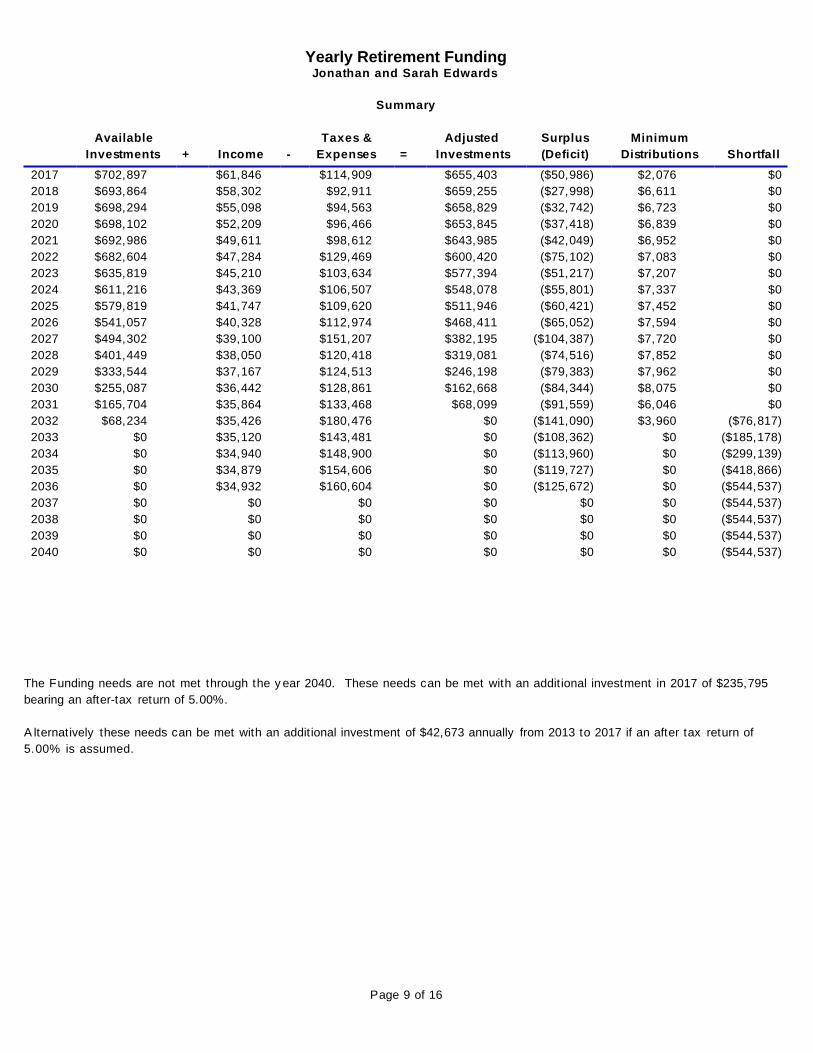
Yearly Retirement FundingJonathan and Sarah Edwards
Summary
Available Taxes & Adjusted Surplus Minimum
Investments + Income - Expenses = Investments (Deficit) Distributions Shortfall
2017 $702,897 $61,846 $114,909 $655,403 ($50,986) $2,076 $0
2018 $693,864 $58,302 $92,911 $659,255 ($27,998) $6,611 $0
2019 $698,294 $55,098 $94,563 $658,829 ($32,742) $6,723 $0
2020 $698,102 $52,209 $96,466 $653,845 ($37,418) $6,839 $0
2021 $692,986 $49,611 $98,612 $643,985 ($42,049) $6,952 $0
2022 $682,604 $47,284 $129,469 $600,420 ($75,102) $7,083 $0
2023 $635,819 $45,210 $103,634 $577,394 ($51,217) $7,207 $0
2024 $611,216 $43,369 $106,507 $548,078 ($55,801) $7,337 $0
2025 $579,819 $41,747 $109,620 $511,946 ($60,421) $7,452 $0
2026 $541,057 $40,328 $112,974 $468,411 ($65,052) $7,594 $0
2027 $494,302 $39,100 $151,207 $382,195 ($104,387) $7,720 $0
2028 $401,449 $38,050 $120,418 $319,081 ($74,516) $7,852 $0
2029 $333,544 $37,167 $124,513 $246,198 ($79,383) $7,962 $0
2030 $255,087 $36,442 $128,861 $162,668 ($84,344) $8,075 $0
2031 $165,704 $35,864 $133,468 $68,099 ($91,559) $6,046 $0
2032 $68,234 $35,426 $180,476 $0 ($141,090) $3,960 ($76,817)
2033 $0 $35,120 $143,481 $0 ($108,362) $0 ($185,178)
2034 $0 $34,940 $148,900 $0 ($113,960) $0 ($299,139)
2035 $0 $34,879 $154,606 $0 ($119,727) $0 ($418,866)
2036 $0 $34,932 $160,604 $0 ($125,672) $0 ($544,537)
2037 $0 $0 $0 $0 $0 $0 ($544,537)
2038 $0 $0 $0 $0 $0 $0 ($544,537)
2039 $0 $0 $0 $0 $0 $0 ($544,537)
2040 $0 $0 $0 $0 $0 $0 ($544,537)
The Funding needs are not met through the y ear 2040. These needs can be met with an addit ional investment in 2017 of $235,795
bearing an after-tax return of 5.00%.
A lternatively these needs can be met with an additional investment of $42,673 annually from 2013 to 2017 if an after tax return of
5.00% is assumed.
Page 9 of 16
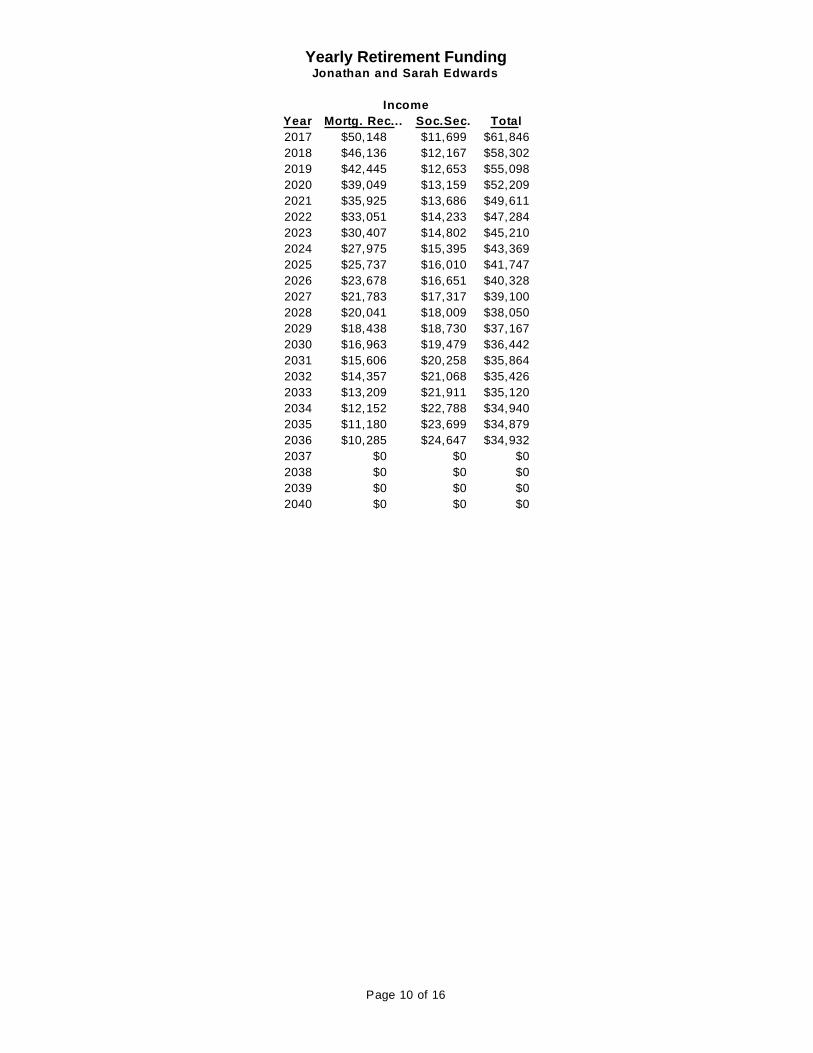
Yearly Retirement FundingJonathan and Sarah Edwards
Income
Year Mortg. Rec... Soc.Sec. Total
2017 $50,148 $11,699 $61,846
2018 $46,136 $12,167 $58,302
2019 $42,445 $12,653 $55,098
2020 $39,049 $13,159 $52,209
2021 $35,925 $13,686 $49,611
2022 $33,051 $14,233 $47,284
2023 $30,407 $14,802 $45,210
2024 $27,975 $15,395 $43,369
2025 $25,737 $16,010 $41,747
2026 $23,678 $16,651 $40,328
2027 $21,783 $17,317 $39,100
2028 $20,041 $18,009 $38,050
2029 $18,438 $18,730 $37,167
2030 $16,963 $19,479 $36,442
2031 $15,606 $20,258 $35,864
2032 $14,357 $21,068 $35,426
2033 $13,209 $21,911 $35,120
2034 $12,152 $22,788 $34,940
2035 $11,180 $23,699 $34,879
2036 $10,285 $24,647 $34,932
2037 $0 $0 $0
2038 $0 $0 $0
2039 $0 $0 $0
2040 $0 $0 $0
Page 10 of 16
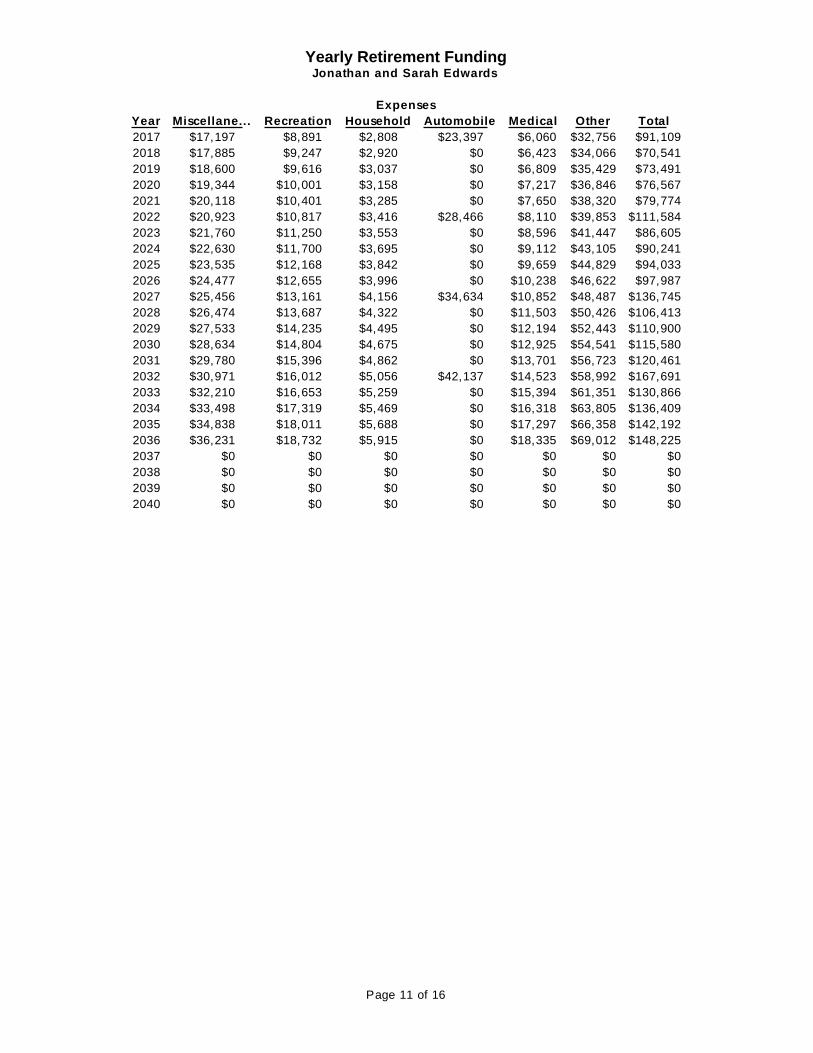
Yearly Retirement FundingJonathan and Sarah Edwards
Expenses
Year Miscellane... Recreation Household Automobile Medical Other Total
2017 $17,197 $8,891 $2,808 $23,397 $6,060 $32,756 $91,109
2018 $17,885 $9,247 $2,920 $0 $6,423 $34,066 $70,541
2019 $18,600 $9,616 $3,037 $0 $6,809 $35,429 $73,491
2020 $19,344 $10,001 $3,158 $0 $7,217 $36,846 $76,567
2021 $20,118 $10,401 $3,285 $0 $7,650 $38,320 $79,774
2022 $20,923 $10,817 $3,416 $28,466 $8,110 $39,853 $111,584
2023 $21,760 $11,250 $3,553 $0 $8,596 $41,447 $86,605
2024 $22,630 $11,700 $3,695 $0 $9,112 $43,105 $90,241
2025 $23,535 $12,168 $3,842 $0 $9,659 $44,829 $94,033
2026 $24,477 $12,655 $3,996 $0 $10,238 $46,622 $97,987
2027 $25,456 $13,161 $4,156 $34,634 $10,852 $48,487 $136,745
2028 $26,474 $13,687 $4,322 $0 $11,503 $50,426 $106,413
2029 $27,533 $14,235 $4,495 $0 $12,194 $52,443 $110,900
2030 $28,634 $14,804 $4,675 $0 $12,925 $54,541 $115,580
2031 $29,780 $15,396 $4,862 $0 $13,701 $56,723 $120,461
2032 $30,971 $16,012 $5,056 $42,137 $14,523 $58,992 $167,691
2033 $32,210 $16,653 $5,259 $0 $15,394 $61,351 $130,866
2034 $33,498 $17,319 $5,469 $0 $16,318 $63,805 $136,409
2035 $34,838 $18,011 $5,688 $0 $17,297 $66,358 $142,192
2036 $36,231 $18,732 $5,915 $0 $18,335 $69,012 $148,225
2037 $0 $0 $0 $0 $0 $0 $0
2038 $0 $0 $0 $0 $0 $0 $0
2039 $0 $0 $0 $0 $0 $0 $0
2040 $0 $0 $0 $0 $0 $0 $0
Page 11 of 16
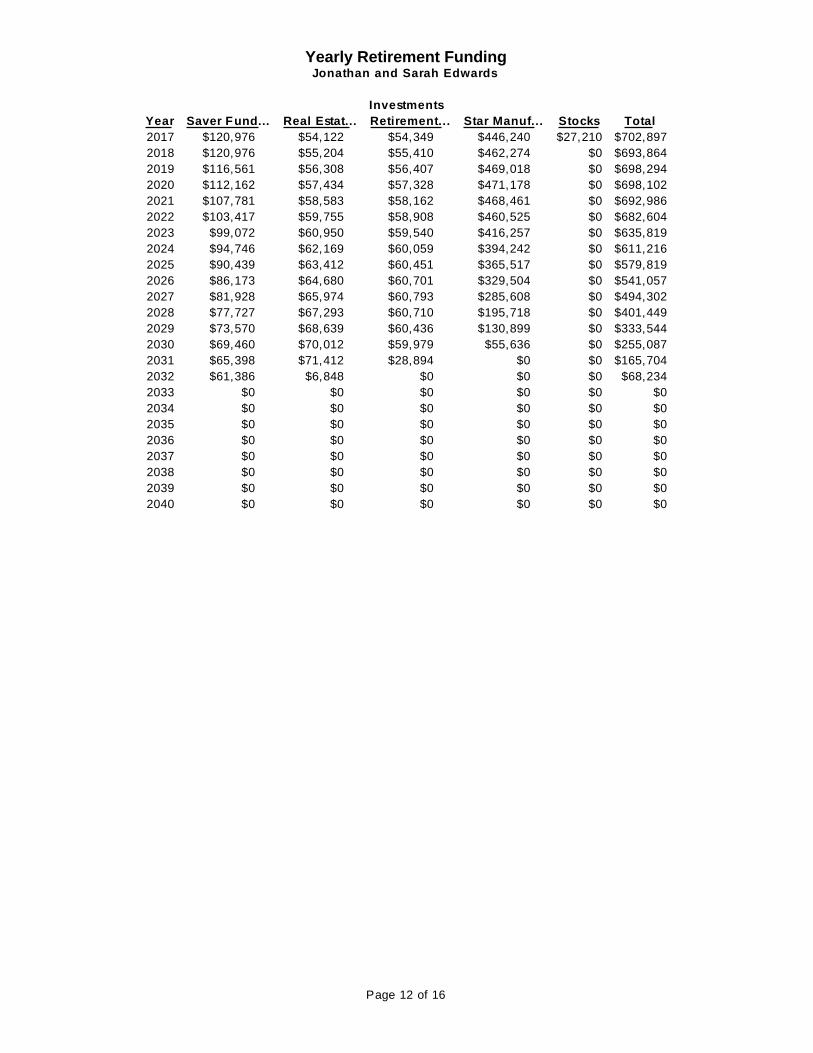
Yearly Retirement FundingJonathan and Sarah Edwards
Investments
Year Saver Fund... Real Estat... Retirement... Star Manuf... Stocks Total
2017 $120,976 $54,122 $54,349 $446,240 $27,210 $702,897
2018 $120,976 $55,204 $55,410 $462,274 $0 $693,864
2019 $116,561 $56,308 $56,407 $469,018 $0 $698,294
2020 $112,162 $57,434 $57,328 $471,178 $0 $698,102
2021 $107,781 $58,583 $58,162 $468,461 $0 $692,986
2022 $103,417 $59,755 $58,908 $460,525 $0 $682,604
2023 $99,072 $60,950 $59,540 $416,257 $0 $635,819
2024 $94,746 $62,169 $60,059 $394,242 $0 $611,216
2025 $90,439 $63,412 $60,451 $365,517 $0 $579,819
2026 $86,173 $64,680 $60,701 $329,504 $0 $541,057
2027 $81,928 $65,974 $60,793 $285,608 $0 $494,302
2028 $77,727 $67,293 $60,710 $195,718 $0 $401,449
2029 $73,570 $68,639 $60,436 $130,899 $0 $333,544
2030 $69,460 $70,012 $59,979 $55,636 $0 $255,087
2031 $65,398 $71,412 $28,894 $0 $0 $165,704
2032 $61,386 $6,848 $0 $0 $0 $68,234
2033 $0 $0 $0 $0 $0 $0
2034 $0 $0 $0 $0 $0 $0
2035 $0 $0 $0 $0 $0 $0
2036 $0 $0 $0 $0 $0 $0
2037 $0 $0 $0 $0 $0 $0
2038 $0 $0 $0 $0 $0 $0
2039 $0 $0 $0 $0 $0 $0
2040 $0 $0 $0 $0 $0 $0
Page 12 of 16
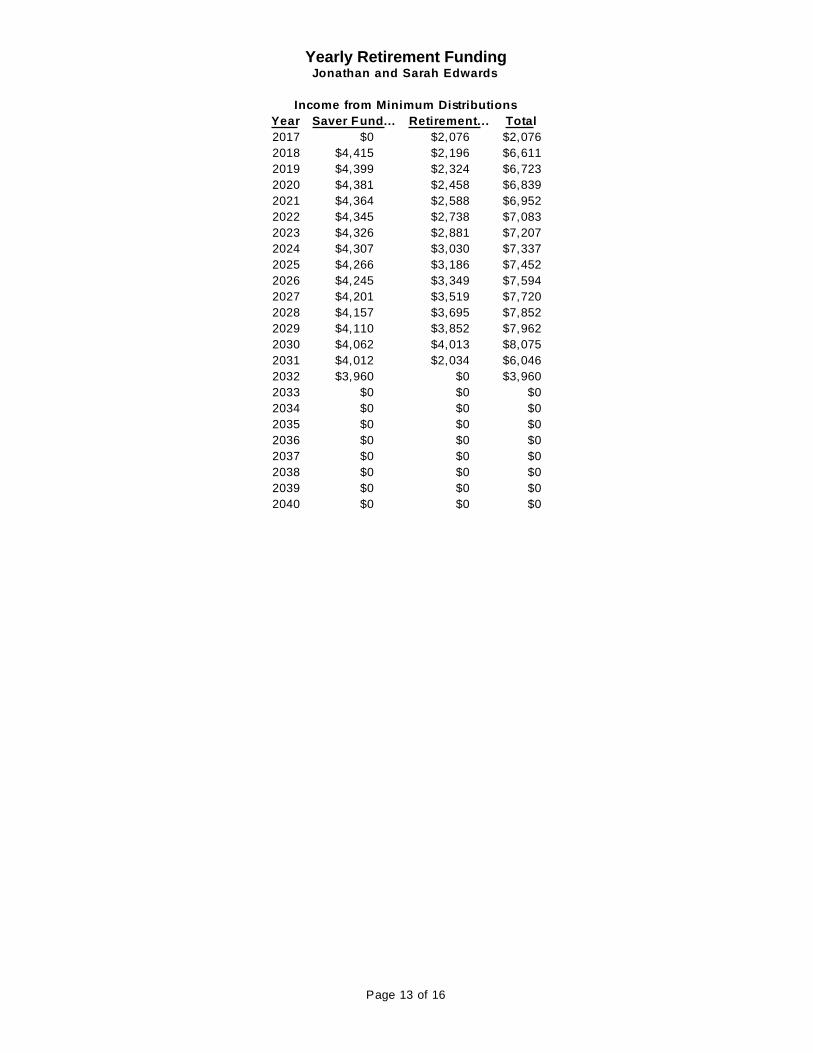
Yearly Retirement FundingJonathan and Sarah Edwards
Income from Minimum Distributions
Year Saver Fund... Retirement... Total
2017 $0 $2,076 $2,076
2018 $4,415 $2,196 $6,611
2019 $4,399 $2,324 $6,723
2020 $4,381 $2,458 $6,839
2021 $4,364 $2,588 $6,952
2022 $4,345 $2,738 $7,083
2023 $4,326 $2,881 $7,207
2024 $4,307 $3,030 $7,337
2025 $4,266 $3,186 $7,452
2026 $4,245 $3,349 $7,594
2027 $4,201 $3,519 $7,720
2028 $4,157 $3,695 $7,852
2029 $4,110 $3,852 $7,962
2030 $4,062 $4,013 $8,075
2031 $4,012 $2,034 $6,046
2032 $3,960 $0 $3,960
2033 $0 $0 $0
2034 $0 $0 $0
2035 $0 $0 $0
2036 $0 $0 $0
2037 $0 $0 $0
2038 $0 $0 $0
2039 $0 $0 $0
2040 $0 $0 $0
Page 13 of 16
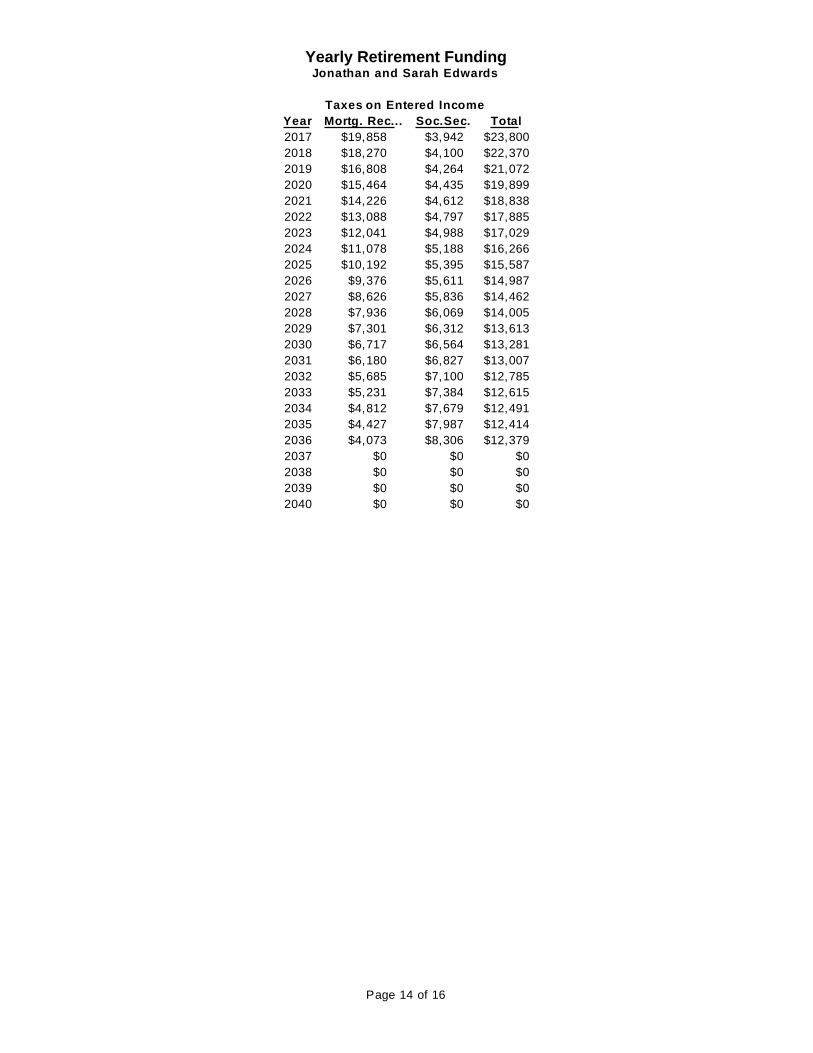
Yearly Retirement FundingJonathan and Sarah Edwards
Taxes on Entered Income
Year Mortg. Rec... Soc.Sec. Total
2017 $19,858 $3,942 $23,800
2018 $18,270 $4,100 $22,370
2019 $16,808 $4,264 $21,072
2020 $15,464 $4,435 $19,899
2021 $14,226 $4,612 $18,838
2022 $13,088 $4,797 $17,885
2023 $12,041 $4,988 $17,029
2024 $11,078 $5,188 $16,266
2025 $10,192 $5,395 $15,587
2026 $9,376 $5,611 $14,987
2027 $8,626 $5,836 $14,462
2028 $7,936 $6,069 $14,005
2029 $7,301 $6,312 $13,613
2030 $6,717 $6,564 $13,281
2031 $6,180 $6,827 $13,007
2032 $5,685 $7,100 $12,785
2033 $5,231 $7,384 $12,615
2034 $4,812 $7,679 $12,491
2035 $4,427 $7,987 $12,414
2036 $4,073 $8,306 $12,379
2037 $0 $0 $0
2038 $0 $0 $0
2039 $0 $0 $0
2040 $0 $0 $0
Page 14 of 16
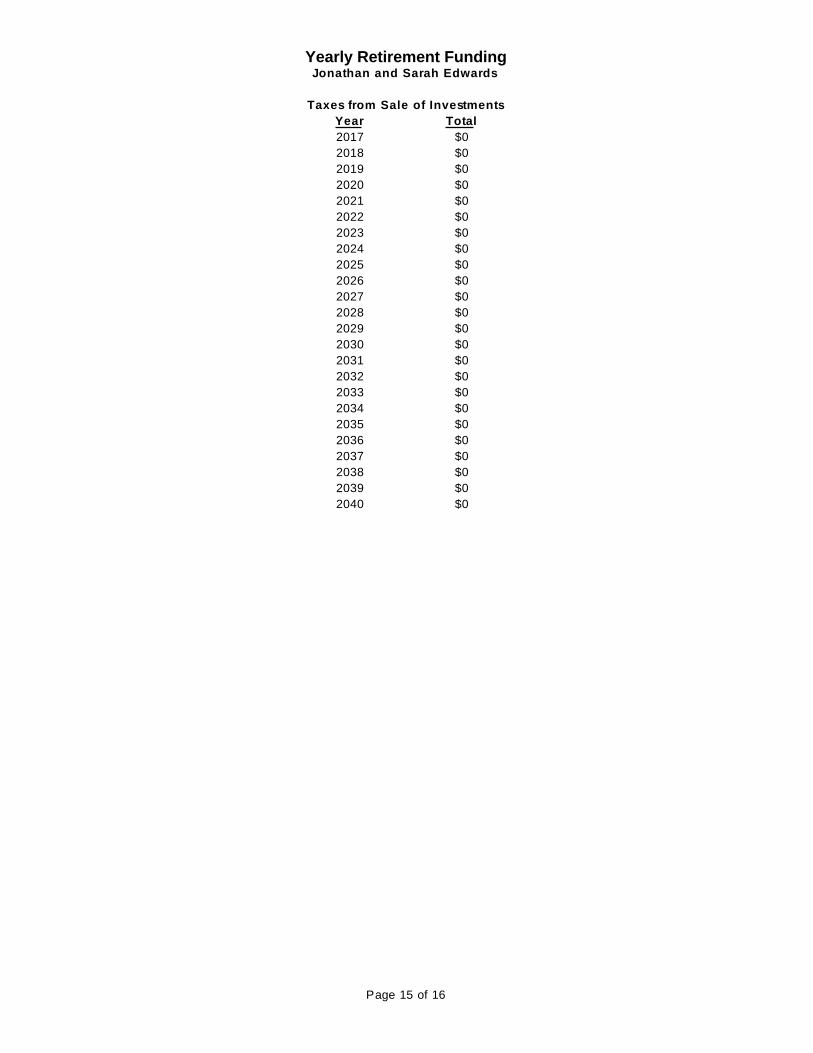
Yearly Retirement FundingJonathan and Sarah Edwards
Taxes from Sale of Investments
Year Total
2017 $0
2018 $0
2019 $0
2020 $0
2021 $0
2022 $0
2023 $0
2024 $0
2025 $0
2026 $0
2027 $0
2028 $0
2029 $0
2030 $0
2031 $0
2032 $0
2033 $0
2034 $0
2035 $0
2036 $0
2037 $0
2038 $0
2039 $0
2040 $0
Page 15 of 16

Yearly Retirement FundingJonathan and Sarah Edwards
Amounts Invested
Year Saver Fund... Real Estat... Retirement... Star Manuf... Stocks Total
2017 $0 $0 -$2,076 -$18,209 -$27,210 -$47,494
2018 -$4,415 $0 -$2,196 -$27,998 $0 -$34,609
2019 -$4,399 $0 -$2,324 -$32,742 $0 -$39,465
2020 -$4,381 $0 -$2,458 -$37,418 $0 -$44,257
2021 -$4,364 $0 -$2,588 -$42,049 $0 -$49,001
2022 -$4,345 $0 -$2,738 -$75,102 $0 -$82,185
2023 -$4,326 $0 -$2,881 -$51,217 $0 -$58,424
2024 -$4,307 $0 -$3,030 -$55,801 $0 -$63,138
2025 -$4,266 $0 -$3,186 -$60,421 $0 -$67,873
2026 -$4,245 $0 -$3,349 -$65,052 $0 -$72,646
2027 -$4,201 $0 -$3,519 -$104,387 $0 -$112,107
2028 -$4,157 $0 -$3,695 -$74,516 $0 -$82,368
2029 -$4,110 $0 -$3,852 -$79,383 $0 -$87,345
2030 -$4,062 $0 -$32,721 -$55,636 $0 -$92,419
2031 -$4,012 -$64,699 -$28,894 $0 $0 -$97,605
2032 -$61,386 -$6,848 $0 $0 $0 -$68,234
2033 $0 $0 $0 $0 $0 $0
2034 $0 $0 $0 $0 $0 $0
2035 $0 $0 $0 $0 $0 $0
2036 $0 $0 $0 $0 $0 $0
2037 $0 $0 $0 $0 $0 $0
2038 $0 $0 $0 $0 $0 $0
2039 $0 $0 $0 $0 $0 $0
2040 $0 $0 $0 $0 $0 $0
Page 16 of 16