journal of applied horticulture, vol 10(1)
TRANSCRIPT

Appl Hort
ISSN 0972-1045
THE SOCIETY FOR ADVANCEMENT OF HORTICULTURE
Journal of
Vol. 10, No. 1, January-June, 2008
Vol. 8, No. 1, January-June, 2006ISSN 0972-1045
Vol. 8, No. 2, July-December, 2006

JOURNAL OF APPLIED HORTICULTUREVol. 10, No. 1, January-June, 2008CONTENTSReduced ethylene production in transgenic carnations transformed with ACC oxidase cDNA in sense orientation -Takayuki Inokuma, Tomoyuki Kinouchi and Shigeru Satoh (Japan). 3
Effects of high temperature on fl oral development and fl owering in spray chrysanthemum-Kouju Nozaki and Seiichi Fukai (Japan). 8
Factors affecting fruit abortion in a gynoecious cucumber cultivar-A. Tazuke, P. Boonkorkaew, S. Hikosaka and N. Sugiyama (Japan). 15
Genetics of corolla colour in periwinkle: relationship between genes determining violet, orange-red and magenta corolla-R.N. Kulkarni, K. Baskaran and Y. Sreevalli (India). 20
Internal quality characterization and isolation of lycopene specifi c genes from tomato-E. Hemaprabha and R. Balasaraswathi (India). 24
Flowering time and concentration of secondary metabolites in fl oral organs of Hypericum perforatum are affected by spectral quality-Tetsuro Nishimura, Naoka Hashimoto, Sayed M. A. Zobayed and Eiji Goto (Japan). 30
Phenolics and parthenolide levels in feverfew (Tanacetum parthenium) are inversely affected by environmental factors-Jorge M. Fonseca, James W. Rushing, Nihal C. Rajapakse, Ronald L. Thomas and Melissa B. Riley (USA). 36
Improved plant regeneration in cowpea through shoot meristem-Muthusamy Manoharan, Sharmin Khan and James O. Garner (USA). 40
Rapid in vitro propagation of grapevine cv. Crimson Seedless-Infl uence of basal media and plant growth regulators-A. Nookaraju, S.M Barreto and D.C. Agrawal (India). 44
Effect of heavy manuring of phosphorous and its toxicity on growth, photosynthesis and photosynthetic pigments in Zn-effi cient genotype of spearmint MSS-5-A. Misra and P. Singh (India). 50
Evaluation of composted biosolid waste as an amendment to a standard horticultural nursery mix for container grown Callicarpa and Ilex production-Anthony W. Kahtz (USA). 54
Evaluation of seasonal nutrient status in the leaves of different olive varieties grown on calcareous soils-M.M. El-Fouly, S.H.A. Shaaban and A.A. El-Sayed (Egypt). 59
Evaluation of zinnia cultivars for fi eld grown cut fl ower production-R. Crofton Sloan and Susan S. Harkness (USA). 63
Growth and yield of grape as infl uenced by soil-site parameters in Nasik district of Maharashtra-H.S. Balpande, O. Challa and Jagdish Prasad (India). 67
In vitro propagation schedule of Picrorhiza kurroa: An endangered medicinal plant of Central Himalaya-Ruchi Bist, H. Punetha, A.K. Gaur and L.D. Bist (India). 70
A comparison of three mathematical models of response to applied nitrogen using lettuce-Sadeghi Pour Marvi Mahdi (Iran). 73
Comparison of conventional fertilization and vermicompost use for basil cultivation -Liliana Marbán, Lidia Giuffré, Marta Riat, Romina Romaniuk and Ernesto Giardina (Argentina). 77
Chilling requirement studies on fl ower buds in some male pistachio genotypes (Pistacia vera L.)-F. Nazoori, A. Talaie and A. Javanshah (Iran). 81

Forthcoming PapersCost effectiveness analysis for water allocation planning in large irrigation system-Thanet Somboon (Thailand).Effect of root zone cooling on fl ower development and fruit set of ‘Satohnishiki’ sweet cherry-Kenji Beppu, Makito Iino and Ikuo Kataoka (Japan).Effect of exogenous putrescine on postharvest life of sweet cherry (Prunus avium) fruit, cultivar “Surati-e Hamadan”-Mohammad Reza Zokaee Khosroshahi, Mahmood Esna-Ashari and Mohammad Fattahi (Iran).Effects of 1-methylcyclopropene on the postharvest life of ‘Eksotika’ papaya-Phebe Ding and Ng Swee Bee (Malaysia).Low cost hydroponics devices and use of harvested water for vegetable and fl ower cultivation-A. Das, and D. Sing Majhi (India).Suitability of autumnal hybrids of caulifl ower (Brassica olearacea var. Botrytis L.) to spring production in a southern Mediterranean area-M. Sciortino and G. Iapichino (Italy).Irrigation management in greenhouse tomato production on peat substrate-G.A. Peyvast and N. Mayer (Germany).A study on adaptation of tomato ecotypes from northern latitudes under southern Iran conditions-Naser Alemzadeh Ansari and Reza Mamghani (Iran).Effect of slow release multi-nutrient fertilizers on the yield and nutrient uptake in turmeric (Curcuma longa L.)-R. Jagadeeswaran, V. Murugappan and M. Govindaswamy (India).Effects of cultivar, root container size and temperature on the days to fl owering and the number of leaves to the fi rst infl orescence in tomato-Cyd Celeste Cagas, Miki Nakata, Mae Rose Sumugat and Nobuo Sugiyama (Japan).A simple and rapid extraction method to determine osmolar concentration of soluble carbohydrate from rose petals-Ryo Norikoshi,, Hideo Imanishi and Kazuo Ichimura (Japan).Sucrose synthase and acid invertase activities in relation to the fl oral structures abortion in pepper (Capsicum annuum L.) grown under low night temperature-Néji Tarchoun, Salah Rezgui and Abdelaziz Mougo (Tunesia).Effects of different preharvest treatments on yield and chemical quality of tomato-M. Melkamu, Tilahun Seyoum, Kebede Woldetsadik (Nigeria).Fungicide soil application effi ciency for the control of black scurf (Rhizoctonia solani) on three potato cultivars-Jorge D. Mantecón, (Argentina).Hydroponic cultivation of carrots using modifi ed rockwool blocks-A.F.M. Saiful Islam, Hiroaki Hirai and Yoshiaki Kitaya (Japan).Starch degradation characteristics in relation to physiological and biochemical properties during growth and maturation of apple fruit-Manasikan Thammawong and Osamu Arakawa (Japan).Variation in total phenols content of St. John’s Wort (Hypericum perforatum L.) from wild populations of northern Turkey-Cüneyt Çirak, Ali Kemal Ayan, Tevfi k Ozen, Kudret Kevseroglu (Turkey).Hydraulic resistance and water relations of bell pepper as affected by fertigation regimes-S.O. Agele (Nigeria).Occurrence of Pseudomonas syringae pv. syringae the causal agent of bacterial canker of stone fruits in Guilan Province of Iran-Mostafa Niknejad Kazempour, Fahimeh Jamie and Seyed Ali Elahinia (Iran).Performance of three cut fl ower crops in response to reclaimed wastewater irrigation-M.I. Safi , A. Bulad, A. Blawenah and I. Bashabsheh (Jordan).Morphological changes in the apex of Prunus persica L. during fl oral transition and effects of gibberellin on fl ower bud differentiation-L. Andreini and S. Bartolini (Italy).Use of plastic shades to regulate growth of korarima (Aframomum corrorima (Braun) P.C.M. Jansen)-S. Eyob and A. Tsegaye (Ethopia). Extraction and Determination of α-solanine in eggplant fruits-Zhiwen Li, Baoli Zhou, Yuwen Ding and Xiang Liu (China).Persian walnut (Juglans regia L.) grafting as infl uenced by different bench grafting methods and scion cultivars-Babak Dehghan, D. Kourosh Vahdati, Darab Hassani and Reza Rezaee (Iran).

Journal of Applied Horticulture, 10(1): 3-7, 2008
Reduced ethylene production in transgenic carnations transformed with ACC oxidase cDNA in sense orientation
Takayuki Inokuma1, Tomoyuki Kinouchi1 and Shigeru Satoh1, 2* 1Graduate School of Agricultural Sciences, Tohoku University, Sendai 981-8555, Japan. 2 Present address: GraduateSchool of Life and Environmental Sciences, Kyoto Prefectural University, Kyoto 606-8522, Japan. *E-mail: [email protected]
Abstract‘Lillipot’ carnation, which is usually cultivated as a potted ornamental, was transformed with a cDNA for carnation 1-aminocyclopropane-1-carboxylate (ACC) oxidase. Two lines, which harbor an sACO transgene, had a vase life of cut fl owers more than twice longer than that of the non-transformed (NT) control. Flowers of the long vase life lines senesced with discoloring and browning in petal margins, which is typical to ethylene-independent senescence in carnation fl owers. They produced negligible amount of ethylene for the fi rst 8 day, whereas fl owers of the NT control showed a climacteric ethylene production with a maximum on day 3. Transcripts for DC-ACS1 and DC-ACO1 were absent in petals of the long vase life fl owers undergoing senescence. The present study revealed that transformation with sACO transgene may be useful to generate potted carnation plants with a long display time.
Key words: ACC oxidase gene (DC-ACO1), Dianthus caryophyllus, ethylene biosynthesis, fl ower senescence, potted carnation
orientation (Savin et al., 1995; Kosugi et al., 2000, 2002; Iwazaki et al., 2004) and a line harboring an Arabidopsis thaliana etr1-1 allele capable of rendering ethylene insensitivity (Bovy et al., 1999) have been generated. Cut fl owers of the transgenic lines have a prolonged vase life compared with those of non-transgenic plants.
The preservatives described above are considered to be not applicable to potted plants, since they are usually administered to cut fl owers through vascular transport by immersing the cut stem end in solutions containing the preservative. Therefore, the generation of transgenic plants is a promising way to retard senescence of fl owers of potted carnations, i.e., to lengthen their display time. Kinouchi et al. (2006) recently generated potted carnation plants transformed with cDNAs for carnation ACC synthase (DC-ACS1, s/aACS transgenes) or ACC oxidase (DC-ACO1, s/aACO transgenes) in sense or antisense orientation or mutated carnation ethylene receptor cDNA (DC-ERS2’) by Agrobacterium-mediated gene transfer. They partly characterized the transformants by investigating the conversion of exogenously-applied ACC to ethylene in leafl et segments. A performance test of the transformants as potted plants remains to be carried out. However, we should fi rst know the synthesis and action of ethylene in fl owers in each transformant to select the best line for the large scale performance test. Therefore, in this study, we cultivated several lines of the transformants on soil until fl owering, and characterized their senescence, ethylene production and gene expression in cut fl owers.
Materials and methodsPlant materials: Plantlets of the transgenic lines of carnation (Dianthus caryophyllus L. cv. Lillipot), generated previously (Kinouchi et al., 2006), and the NT control were grown in vitro to about 5 cm in height, were transplanted into a commercial horticulture soil in a plastic container, under conditions described previously (Iwazaki et al., 2004) in a containment green house
IntroductionCarnations are used as ornamentals as potted plants and as cut fl owers. Ethylene is a primary plant hormone involved in the senescence of cut carnation fl owers (Reid and Wu, 1992). It is synthesized in a large amount, mostly from the petals, at a later stage of fl ower senescence (Borochov and Woodson, 1989; Abeles et al., 1992; Reid and Wu, 1992; Woodson et al., 1992). Increased ethylene production accelerates wilting of the petals. Inhibition of the synthesis or action of ethylene delays the onset of senescence and extends the vase life of fl owers.
In senescing carnation fl owers, ethylene is fi rst produced in the gynoecium, and the ethylene evolved acts on petals and induces autocatalytic ethylene production in the petals. This results in petal wilting (Jones and Woodson, 1997; Shibuya et al., 2000; ten Have and Woltering, 1997). Ethylene is synthesized through the pathway: L-methionine → S-adenosyl-L-methionine → ACC → ethylene. ACC synthase and ACC oxidase catalyze the last two reactions (Kende, 1993; Yang and Hoffman, 1984). So far, three genes encoding ACC synthase (DC-ACS1, DC-ACS2 and DC-ACS3) and one gene encoding ACC oxidase (DC-ACO1) have been identifi ed in carnations (Henskens et al., 1994; Jones and Woodson, 1999; Park et al., 1992; Wang and Woodson, 1991). Out of these genes, DC-ACS1 and DC-ACO1 have been shown to play a pivotal role in ethylene production in both the gynoecium and petals of senescing carnation fl owers (Nukui et al., 2004; Satoh and Waki, 2006).
Currently, prevention of senescence of carnation fl ower is being attained by treatment of the fl ower with chemical preservatives which inhibit the synthesis or action of ethylene (Veen, 1979; Midoh et al., 1996). Another option for preventing senescence is the generation of transgenic fl owers with suppressed production or action of ethylene. So far, the lines transformed with cDNAs for carnation 1-aminocyclopropane-1-carboxylate (ACC) oxidase (DC-ACO1) and ACC synthase (DC-ACS1) in sense or antisense
Journal
Appl

at Tohoku University. Out of 39 transgenic carnation lines generated previously (Kinouchi et al., 2006), 6 transgenic and the non-transformed (NT) control lines were used since these lines fl owered one year after transplanting to soil. Three transgenic lines studied were pMLH-sACO-2, -3 and -12, which were transformed with carnation DC-ACO1 cDNA in sense orientation (sACO transgene) in a pMLH2113 vector. Two other transgenic lines, pIG-sACS-1 and pIG-sACO-1, were transformed with carnation DC-ACS1 and DC-ACO1, respectively, in sense orientation (sACS and sACO transgenes) using the pIG121 vector. Finally, pIG-DC-ERS2’-2 was transformed with a mutated carnation ethylene receptor cDNA (DC-ERS2’) in the pIG121 vector. Flowering started around one year after transplanting. Flowers were harvested during the following 5-6 months. Only the fi rst and second fl owers opening on each stem were used.
Analysis of vase life of cut fl owers: Three to ten fl owers, depending on the line, of each of the transgenic and NT control lines were harvested at the full opening stage (day 0; their outermost petals were at right angles to the stem of fl ower). Stems were trimmed to 0.5 cm in length, and placed with their cut end in distilled water in 5-ml plastic vials. The fl owers were left at 23°C under a 16-h photoperiod using white fl uorescent light (20-30 μmol m-2 sec-1). The water was replaced daily. Senescing fl owers were observed and photographed daily to record in-rolling and subsequent wilting of petals, the desiccation, and discoloration of the petal margins. Vase life in days is expressed as the mean ± SE of given numbers of fl owers.
Assay of ethylene production: Ethylene production from carnation fl owers was monitored daily by enclosing individual fl owers in plastic vials in 140-mL glass containers (1 fl ower per container) for 1 h at 23°C. A 1-mL gas sample was taken with a hypodermic syringe from inside the container through a rubber septum of a sampling port on the container and injected into a gas chromatograph (Shimadzu GC-14A, Kyoto, Japan), equipped with an alumina column and a fl ame ionization detector to determine ethylene content.
Treatment with exogenous ethylene of fl owers of the transgenic lines: Two to fi ve cut fl owers each of the respective transgenic lines and the NT control were enclosed in a 60 L glass chamber and exposed to ethylene at 10 μl L-1 for 16 h at 23°C under white fl uorescent light (50 μmol m-2 s-1). After the treatment, the fl owers were held in open air for 1 h to let exogenous ethylene diffuse. They were subsequently encapsulated and their ethylene production was determined by gas-chromatography. The petals and gynoecia were immediately excised and prepared for total RNA extraction.
Northern blot analysis: Total RNA was isolated by the SDS-phenol method (Palmiter, 1974) from the petals and with RNeasy Plant Mini Kit (QIAGEN, Valencia, CA, USA) from gynoecium of cut fl owers of the respective transgenic lines and the NT control line at given time after the full opening of fl owers (day 0). Pistils and petals were detached form one to three fl owers, depending on lines, at the given time and combined to make one sample each. Also, total RNA was isolated from the gynoecium and petals of the fl owers treated with ethylene as described above. Ten μg of total RNA was denatured, separated on a 1.0% agarose gel, transferred onto nylon membranes (Hybond N+, Amersham Pharmacia Biotech, Tokyo, Japan) and hybridized with the DNA
probes for DC-ACS1 and DC-ACO1 transcripts. The DNA probe for DC-ACS1 transcript was 560 bp which corresponded to the position 1 bp to 560 bp of the coding region of DC-ACS1 cDNA (GenBank Accession No. M66619), and that for DC-ACO1 transcript 560 bp corresponded to the position 261 bp to 820 bp of the coding region of DC-ACO1 cDNA (GenBank Accession No. M62380). The DNA probes were labeled with HRP and hybridized with the blot by using ECL DirectTM (Amersham Pharmacia Biotech) according to the manufacturer’s instruction. Hybridization signals were detected by exposure to X-ray fi lm (RX-U, Fuji Photo Film, Tokyo, Japan).
Results Vase-life and senescence profi le of the transgenic fl owers: Cut fl owers of each of the transgenic lines had vase-life of various length varying from 3.0 ± 0.4 to 7.6 ± 0.4 days, whereas that of the NT control line was 2.8 ± 0.2 days (Table 1). Vase lives of the pMLH-sACO-2 and -12 lines were 7.6 ± 0.4 and 6.3 ± 0.5 days, respectively (signifi cantly different from the NT control, at P=0.001 by t test). Other transgenic lines had vase lives that were not signifi cantly different from that of the NT control, except for the pIG-DC-ERS2’-2 line. We did not investigate further the pIG-DC-ERS2’-2 line.
Flowers of the NT control remained turgid until day 3, showed in-rolling of petals on day 4, and completely wilted thereafter. On contrast, flowers of the pMLH-sACO-2 and -12 lines remained turgid without petal in-rolling until day 6 or more, but eventually began to show desiccation and discoloration in the rim of petals. Petal in-rolling at the onset of wilting is a well-known characteristic of ethylene-dependent senescence of carnation fl owers. Desiccation, discoloration, and browning of the rim of petals are characteristics of ethylene-independent senescence of carnation fl owers. These fi ndings suggested little or no function of ethylene during the senescence of petals of the pMLH-sACO-2 and -12 fl owers. In the following experiments, we characterized ethylene production, expression of genes for ethylene biosythesis and response to exogenous ethylene of fl owers of the pMLH-sACO-2 and -12 lines by comparison with those of the NT control.
Ethylene production of the transgenic fl owers: Flowers of the NT control showed a climacteric rise in ethylene production, attaining a maximal rate on day 3 (Fig. 1). Flowers of the pMLH-sACO-2 and -12 lines produced very small amounts of ethylene during senescence period of 8 days. Their maximum ethylene production rates were around 10% that of the NT control. The
Table 1. Senescence of flowers of the NT control and transgenic carnationsLines Number of
fl owers testedVase life a
(days)Senescence
patternb
NT control 6 2.8±0.2 WpMLH-sACO-2 7 7.6±0.4 DpMLH-sACO-3 6 3.2±0.4 WpMLH-sACO-12 4 6.3±0.5 DpIG-aACS-1 10 3.0±0.4 WpIG-aACO-1 3 3.3±0.9 WpIG-DC-ERS2’-2 4 4.5±1.0 Wa Each value is the mean ± SE.b W, in-rolling and wilting of the petals; D, desiccation, discoloration and necrosis of the petals.
4 Reduced ethylene production in carnations transformed with ACC oxidase cDNA in sense orientation

lack of petal in-rolling and prolonged vase-life in fl owers of the pMLH-sACO-2 and -12 lines coincided with a marked reduction in ethylene production.
Transcript levels for DC-ACS1 and DC-ACO1 in the gynoecium and petals of the transgenic fl owers: As described in introduction, DC-ACS1 and DC-ACO1 play a pivotal role in ethylene production in both the gynoecium and petals of senescing carnation fl owers (Nukui et al., 2004; Satoh and Waki, 2006). We examined the transcript levels for DC-ACS1 and DC-ACO1 in the gynoecium and petals of the transgenic fl owers undergoing senescence.
On day 0 (at the time of full opening of fl owers), DC-ACS1 and DC-ACO1 transcripts were absent in both the gynoecium and petals of carnation fl owers (Fig. 2). With the NT control fl owers, DC-ACS1 and DC-ACO1 transcripts accumulated abundantly in the gynoecium on day 2 (the day before petal in-rolling), and signifi cantly in the petals on day 3 when a maximum ethylene production from fl owers occurred (Fig. 1). In the pMLH-sACO-2 and -12 lines, tissue sampling was conducted on days 0, 3 and 6. In gynoecia of the pMLH-sACO-2 line, DC-ACS1 and DC-ACO1 transcripts accumulated, although to small amounts in the latter, on day 3. These transcripts diminished on day 6. Both transcripts were absent in the petals on days 3 and 6. Similarly, with pMLH-sACO-12 line, DC-ACS1 and DC-ACO1 transcripts accumulated abundantly in the gynoecium on day 3 and diminished on day 6, but they were absent in the petals on both days. Absence of DC-ACS1 and DC-ACO1 transcripts in the petals of pMLH-sACO-2 and -12 lines coincided with the negligible amount of ethylene production from fl owers of these lines (Fig. 1).
Responses to exogenous ethylene of fl owers of the transgenic lines: In carnation fl owers, the expression of DC-ACS1 and DC-ACO1 genes in petals can be induced by exogenously applied ethylene and by ethylene produced endogenously from the gynoecia (Shibuya et al., 2000). The response of the transgenic lines and the NT control to exogenously applied ethylene was investigated after treatment with ethylene at 10 μl L-1 for 16 h. Ethylene evolution was determined from fl owers at the beginning
0 1 2 3 4 0 3 6 0 3 6
NT pMLH
-sACO-2
pMLH
-sACO-1
2
(day)
DC-ACS1
DC-ACO1
rRNA
DC-ACS1
DC-ACO1
rRNA
Gynoecium
Petal
0 1 2 3 4 0 3 6 0 3 60 1 2 3 4 0 3 6 0 3 6
NT pMLH
-sACO-2
pMLH
-sACO-1
2
(day)
DC-ACS1
DC-ACO1
rRNA
DC-ACS1
DC-ACO1
rRNA
Gynoecium
Petal
0 16 0 16 0 16NT pMLH-sA
CO-2
pMLH-sACO-12
(h)
DC-ACS1
DC-ACO1
rRNA
DC-ACS1
DC-ACO1
rRNA
Gynoecium
Petal
0 16 0 16 0 160 16 0 16 0 16NT pMLH-sA
CO-2
pMLH-sACO-12
(h)
DC-ACS1
DC-ACO1
rRNA
DC-ACS1
DC-ACO1
rRNA
Gynoecium
Petal
Fig. 1. Ethylene production from cut carnation fl owers during the senescence period in the NT control and the transgenic lines. Flowers (numbers shown in Table 1) of three lines were harvested at full opening stage (day 0) and their ethylene production was monitored daily. Data are shown by the mean ± SE. O, NT control; ●, pMLH-sACO-2; ■, pMLH-sACO-12.
Fig. 2. RNA gel blot analysis of DC-ACO1 and DC-ACS1 transcripts in the gynoecium and petals of the NT control and in two transgenic lines during natural senescence. Gynoecium and petals were isolated from cut fl owers at given days after full opening of fl owers; days 0, 1, 2, 3, and 4 for the NT control, but days 0, 3 and 6 for pMLH-sACO-2 and -12 transgenic lines which did not show wilting. Ten μg of total RNAs isolated from respective fl ower tissues were separated on an agarose gel and hybridized to DIG-labeled DC-ACS1 and DC-ACO1 probes. Equal loading of total RNAs was checked by ribosomal RNAs visualized by ethidium bromide staining of the agarose gel. No data for the gynoecium of pMLH-sACO-2 on day 0.
Fig. 3. RNA gel blot analysis of DC-ACS1 and DC-ACO1 transcripts in gynoecium and petals of the NT control and two transgenic fl owers before and after ethylene treatment. Cut carnation fl owers of respective lines were treated with 10 μl L-1 ethylene for 16 h. Ethylene production from fl owers was measured before and after the ethylene treatment by enclosing them for 1 h and measuring ethylene produced. Numbers of fl owers used were 2, 5 and 3 for the NT, pMLH-sACO-2 and -12 in this order. After ethylene assay, the fl owers were subjected to analysis of amounts of DC-ACS1 and DC-ACO1 transcripts as described in the legend to Fig. 2.
Reduced ethylene production in carnations transformed with ACC oxidase cDNA in sense orientation 5E
thyl
ene
(nm
ol g
h)
-1-1
Day0
0.5
1 2 3 4 5 6 7 8
4.0
3.5
3.0
2.5
2.0
1.5
1.0
0

and end of ethylene treatment. We also determined transcript levels for DC-ACS1 and DC-ACO1 in the gynoecia and petals. Treatment with exogenous ethylene for 16 h caused petals of the transgenic lines and the NT control to wilt, indicating that fl owers of the transgenic lines were responsive to ethylene.
At the beginning of experiment, ethylene production from fl owers was not detected or negligible (< 0.2 nmol g-1 h-1). In fl owers of the NT control treated with ethylene for 16 h, ethylene production was 9.38 ± 0.27 nmol g-1 h-1. Ethylene evolution from the transgenic lines was less than that of the NT control; 1.96 ± 0.54 and 4.46 ± 1.34 nmol g-1 h-1 for the pMLH-sACO-2 and -12 lines, respectively. Exogenous ethylene treatment caused an accumulation of DC-ACS1 and DC-ACO1 transcripts in the gynoecium and petals of the NT control and the transgenic lines, although the level of DC-ACS1 and DC-ACO1 transcripts in pMLH-sACO-2 line was lower than that in the NT control (Fig. 3).
DiscussionIn this study we used six transgenic lines, which fl owered a year after transplanting and cultivation, in soil, out of 39 transgenic lines generated previously (Kinouchi et al., 2006). In the six transgenic lines, two lines transformed with pMLH2113-Hm/sACO construct, pMLH-sACO-2 and -12 lines, had a vase life more than twice longer than that of the NT control. The sACO transgene in the pMLH2113 vector effi ciently suppressed ethylene production, which resulted in longer-lasting fl owers.
Flowers of the pMLH-sACO-2 and -12 lines did not show petal in-rolling and wilting which are typical for ethylene-dependent senescence in carnation petals. Instead, the fl owers showed browning and drying in the rim of petals, which spread out to all the portion of the petals, and eventually the fl owers faded out at the late stage of vase life, which was about twice that of the NT control fl owers. These are typical of ethylene-independent senescence of carnation fl owers.
DC-ACS1 and DC-ACO1 transcripts were absent in the petals of both pMLH-sACO-2 and -12 fl owers undergoing natural senescence (Fig. 2). This explained the reduced ethylene production in fl owers of the two lines (Fig. 1). Previously, Kosugi et al. (2002) suggested that the sACO transgene integrated into carnation inhibited ethylene production in the fl owers by cosuppression of expression of endogenous DC-ACO1 gene in fl ower tissues. This seems also true in the present sACO transgenes with a long vase life. Kosugi et al. (2002) showed that the integrated sACO transgene might act fi rst in the gynoecium, inhibiting the expression of DC-ACO1 and suppressing ethylene production in the gynoecium and, subsequently, the expression of DC-ACO1 and DC-ACS1 in the petals. This was also found as an explanation for the absence of DC-ACS1 transcript in the petals of both pMLH-sACO-2 and -12 fl owers undergoing natural senescence.
The accumulation of DC-ACS1 and DC-ACO1 transcripts in fl ower tissues of the transgenic carnations (pMLH-sACO-2 and -12 lines) after treatment with exogenous ethylene (10 μl L-1 for 16 h), indicated that the integrated sACO transgene did not impair their responsiveness to ethylene. The accumulation of DC-ACO1 transcripts in the petals of the pMLH-sACO-2 and -12 fl owers
after exogenous ethylene treatment indicated that exogenous ethylene treatment overcame the effect of the integrated sACO transgene in these two lines. Kinouchi et al. (2006) tested in vivo ACC oxidase activity using leafl et segments of the transgenic plants harboring sACO transgene. The in vivo ACC oxidase activities of the pMLH-sACO-2 and -12 lines were similar to and lower than the NT control, respectively.
These results suggested that the integrated sACO transgene exerted its effect in the leafl et segments of pMLH-sACO-12 line, but not pMLH-sACO-2 line. In this study, however, DC-ACO1 transcript accumulated in low amounts in the gynoecium and was absent in the petals of pMLH-sACO-2 fl owers. It was present abundantly in the gynoecium but also absent in the petals of pMLH-sACO-12 fl owers on day 3. These differences suggest different action (expression) of the integrated sACO transgene between the leafl et and fl ower tissues, and also a difference between the two transgenic lines.
AcknowledgementsWe thank Sakata Seed Corp., Kakegawa Research Center, Kakegawa, Japan, for the use of ‘Lillipot’ carnation.
ReferencesAbeles, F.B., P.W. Morgan and M.E. Saltveit, Jr., 1992. Ethylene in Plant
Biology. 2nd ed. Academic Press, San Diego, CA.
Bovy, A.G., G.C. Angenent, H.J.M. Dons and A.C. van Altvorst, 1999. Heterologous expression of the Arabidopsis etr1-1 allele inhibits the senescence of carnation fl owers. Mol. Breed., 5: 301-308.
Borochov, A. and W.R. Woodson,1989. Physiology and biochemistry of fl ower petal senescence. Hort. Rev., 11: 15-43.
Henskens, J.A.M., G.J.A. Rouwendal, A. ten Have and E.J. Woltering, 1994. Molecular cloning of two different ACC synthase PCR fragments in carnation fl owers and organ-specifi c expression of the corresponding genes. Plant Mol. Biol., 26: 453-458.
Iwazaki, Y., Y. Kosugi, K. Waki, T. Yoshioka and S. Satoh, 2004. Generation and ethylene production of transgenic carnations harboring ACC synthase cDNA in sense or antisense orientation. J. Appl. Hort., 6: 67-71.
Jones, M.L. and W.R. Woodson, 1997. Pollination-induced ethylene in carnation. Role of styler ethylene in collolla senescence. Plant Physiol., 115: 205-212.
Jones, M.L. and W.R. Woodson, 1999. Differential expression of three members of the 1-aminocyclopropane-1-carboxylate synthase gene family in carnation. Plant Physiol., 119: 755-764.
Kende, H. 1993. Ethylene biosynthesis. Ann. Rev. Plant Physiol. Plant Mol. Biol., 44: 283-307.
Kinouchi, T., R. Endo, A. Yamashita and S. Satoh, 2006. Transformation of carnation with genes related to ethylene production and perception: towards generation of potted carnations with a longer display time. Plant Cell Tiss. Organ Cult., 86: 27-35.
Kosugi, Y., K. Shibuya, N. Tsuruno, Y. Iwazaki, A. Mochizuki, T. Yoshioka, T. Hashiba and S. Satoh, 2000. Expression of genes responsible for ethylene production and wilting are differently regulated in carnation (Dianthus caryophyllus L.) petals. Plant Sci., 158: 139-145.
Kosugi, Y., K. Waki, Y. Iwazaki, A. Mochizuki, N. Tsuruno, A. Mochizuki, T. Yoshioka, T. Hashiba and S. Satoh, 2002. Senescence and gene expression of transgenic non-ethylene-producing carnation fl owers. J. Japan. Soc. Hort. Sci., 71: 638-642.
6 Reduced ethylene production in carnations transformed with ACC oxidase cDNA in sense orientation

Midoh, N., Y. Saijou, K. Matsumoto and M. Iwata, 1996. Effects of 1,1- dimethyl-4-(phenylsulfonyl)semicarbazide (DPSS) on carnation fl ower longevity. Plant Growth Regul., 20: 195-199.
Nukui, H., S. Kudo, A.Yamashita and S. Satoh, 2004. Repressed ethylene production in the gynoecium of long-lasting fl owers of the carnation ‘White Candle’: role of the gynoecium in carnation fl ower senescence. J. Exp. Bot., 55: 641-650.
Palmiter, R.D. 1974. Magnesium precipitation of ribonucleoprotein complexes: Expedient techniques for the isolation of undegraded polysomes and messenger ribonucleic acid. Biochemistry, 13: 3606.
Park, K.Y., A. Drory and W.R. Woodson, 1992. Molecular cloning of an 1-aminocyclopropane-1-carboxylate synthase from senescing carnation fl ower petals. Plant Mol. Biol., 18: 377-386.
Reid, M.S. and M.J. Wu, 1992. Ethylene and fl ower senescence. Plant Growth Regul., 11: 37-43.
Satoh, S. and K. Waki, 2006. Repressed expression of DC-ACS1 gene in a transgenic carnation supports the role of its expression in the gynoecium for the onset of ethylene production in senescing fl ower. J. Japan. Soc. Hort. Sci., 75: 173-177.
Savin, K.W., S.C. Baudinette, M.W. Graham, M.Z. Michael, G.D. Nugent, C-Y. Lu, S.F. Chandler and D. Cornish, 1995. Antisense ACC oxidase RNA delays carnation petal senescence. HortScience, 30: 970-972.
Shibuya, K., T. Yoshioka, T. Hashiba and S. Satoh, 2000. Role of the gynoecium in natural senescence of carnation (Dianthus caryophyllus L.) fl owers. J. Exp. Bot., 51: 2067-2073.
ten Have, A. and E.J. Woltering, 1997. Ethylene biosynthetic genes are differentially expressed during carnation (Dianthus caryophyllus L.) fl ower senescence. Plant Mol. Biol., 34: 89-97.
Veen, H. 1979. Effects of silver on ethylene synthesis and action in cut carnations. Planta, 145: 467-470.
Wang, H. and W.R. Woodson, 1991. A fl ower senescence-related mRNA from carnation shares sequence similarity with fruit ripening-related mRNAs involved in ethylene biosynthesis. Plant Physiol., 96: 1000-1001.
Woodson. W.R., K.Y. Park, A. Drory, P.B. Larsen and H. Wang, 1992. Expression of ethylene biosynthetic pathway transcripts in senescing carnation fl owers. Plant Physiol., 99: 526-532.
Yang, S.F. and N.E. Hoffman, 1984. Ethylene biosynthesis and its regulation in higher plants. Ann. Rev. Plant Physiol., 35: 155-189.
Reduced ethylene production in carnations transformed with ACC oxidase cDNA in sense orientation 7

Journal of Applied Horticulture, 10(1): 8-14, 2008
Effects of high temperature on fl oral development and fl owering in spray chrysanthemum
Kouju Nozaki and Seiichi Fukai*
Horticultural Science, Faculty of Agriculture, Kagawa University, Miki, Kagawa 761-0795, Japan. *E-mail: [email protected]
AbstractDelayed fl owering of chrysanthemum under high temperature conditions is a serious obstacle for all year round cut chrysanthemum fl ower production in southern temperate and subtropical zones. To clarify the causes of fl owering delay in spray chrysanthemum, two different genotypes of spray chrysanthemum (Dendranthema grandifl orum (Ramat.) Kitam. syn. Chrysanthemum morifolium) were grown under high-temperature conditions: summer-to-autumn fl owering type (SA type, high temperature tolerant) and autumn fl owering type (A type, high temperature sensitive). Their fl ower-bud initiation and development were subsequently compared. Results clarify that two independent events caused by high temperatures occur in the shoot apex of spray chrysanthemum under short-day conditions. First, high temperatures slowed fl oral development in infl orescence, thereby increasing the number of fl orets in both SA and A chrysanthemum genotypes. Secondly, high temperatures slowed the developmental speed of infl orescence after the budding stage, and the time to reach the bud break stage was prolonged, thereby delaying fl owering, especially in A chrysanthemum genotypes.
Key words: Chrysanthemum (Dendranthema grandifl orum (Ramat.) Kitam. syn. Chrysanthemum morifolium), fl oral development, high temperature.
but they often show insufficient stem elongation in winter. Because of the defect of SA genotypes, year-round production of spray chrysanthemum is established by combining SA with A genotypes in Japan (Shibata et al., 1988; Koyama et al., 1996). It will be valuable to reveal differences in fl oral development of both SA and A types under high temperature conditions for breeding programs of heat tolerant year-round producible spray chrysanthemums.
This study was intended to elucidate the causes of fl owering delay under high temperature conditions in terms of fl oral initiation and development. In this study, both SA and A genotypes were grown under high temperature conditions. Their respective fl oral development characteristics were compared at various developmental stages.
Materials and methods Cultivation outline: This study used four genotypes of summer-to-autumn fl owering type (SA) and fi ve genotypes of autumn fl owering type (A) spray chrysanthemums. Mother plants were grown in a greenhouse maintained at a minimum temperature of 15°C under long day conditions (night break). Compost with a mixture of Masa soil (granite) and manure (3:1) was used for this study. All plants were fertilised with 1,000-times diluted Hyponex® (a complete soluble fertiliser, N:P2O5:K2O=6:10:5, Hyponex Co. Ltd., Japan, Osaka) once a week during the experiment. For daylength regulation, the short-day treatment (light period 8:00–18:00) (SD) was given by blacking-out to extend the daily dark period; the long-day treatment (LD) was made by a 4 h night break (22:00-2:00) with incandescent lamps at 3 μmol m-2 s-1. Budding was defi ned as visible terminal fl ower bud appearance. Bud break was defi ned as a developmental stage of infl orescence in which the top of involucres opened with 3-mm
IntroductionChrysanthemum (Dendranthema grandifl orum (Ramat.) Kitam. syn. Chrysanthemum morifolium) is one of the most globally important ornamental species. The effects of temperature, especially sub-optimal temperature, on growth and fl owering of chrysanthemum have been studied intensively (van der Ploeg and Heuvelink, 2006). However delayed fl owering of chrysanthemum as a result of high temperatures is still a serious problem, not only in southern temperature zones such as Japan, but also in tropical zone countries like Malaysia, Thailand and Indonesia, where production of cut chrysanthemum fl owers has increased recently. Chrysanthemum is a short-day plant; consequently, its fl owering can be controlled by changing the day length (Okada, 1963). Short-day treatment is essential to produce cut chrysanthemum fl owers in areas where the natural day length is longer than the critical day length in summer. The greenhouse often has high temperatures when it is shaded for this purpose. It has been reported that high temperatures engendered delayed fl owering in chrysanthemum (Cockshull, 1979; Cockshull and Kofranek, 1994; Nishio et al., 1988; Whealy et al., 1987). Nevertheless, a few studies have been done to clarify the relationship between fl oral development and fl owering delay. It remains unclear how the delay is refl ected in the development of infl orescence. Most genotypes of spray chrysanthemum grown in Europe have a critical day length of about 13.5 h. The genotypes are designated as autumn fl owering (A) type. Kawata et al. (1987) found the absolute short-day genotypes of chrysanthemum with longer critical day length (16-19 h), for fl owering in summer under natural day length in Japan. The genotypes are designated as summer-to-autumn fl owering (SA) type. Heat-tolerant cultivars were bred based on the SA genotypes (Shibata and Kawata, 1987). The SA genotypes show only a little fl owering delay in summer,
Journal
Appl

diameter in terminal infl orescence. The vertical petal was defi ned as a state in which petals of ray fl orets extended a vertical state. Flowering was defi ned as the state in which petals of ray fl orets opened completely to a horizontal state.
Effects of temperature on fl oral initiation and development (Experiment I): Two genotypes of spray chrysanthemum were used in this experiment: ‘Sei-Monako’ (SA type) and ‘Sei-Maria’ (A type). Cuttings were provided from these mother plants on 26 April in 2001. Eleven rooted cuttings of each genotype were planted in containers (20 x 60 x 15 cm); they were decapitated at the uppermost leaf on 14 May. All lateral shoots were allowed to grow. On 15 June, the plants were transferred to growth chambers that were controlled at a constant 20 or 30°C; SD was given until fl owering. For scanning electric microscopic observation (SEM, S-2150; Hitachi Ltd., Tokyo), four shoot apexes of each treatment (20 or 30°C) were collected at 5, 10, 15, 20, 25, 30 and 45 days after the start of SD. Collected samples were fi xed immediately with FAA (formalin: acetic acid: 70% ethanol, 5: 5: 90). After fi xation, leaves and bracts were removed from the shoot apex under a binocular microscope. The samples were then dehydrated in the ethanol – acetone – isoamyl acetate series and dried in a critical point drier (HCP-1; Hitachi Ltd.). After coating with Pt, the samples were observed using SEM. The remaining shoots (5 shoots per treatment) were allowed to continue cultivation until fl owering to provide a measurement of the number of fl orets.
Effects of high temperature exposed immediately after the start of SD on fl owering (Experiment II): Rooted cuttings of ‘Sei-Monako’ and ‘Sei-Maria’ were transplanted on 15 July in 2002 in 9 cm-diameter plastic pots. They were decapitated at the uppermost leaf on 29 July. After 4 weeks of growth in a greenhouse under LD, the plants were planted into 21 cm-diameter clay pots (fi ve plants per pot, two replications in each treatment). One lateral shoot per plant was allowed to grow; the others were removed. Then SD treatment started in the growth chambers that were controlled at a constant 20 or 30°C. Treatments consisted of fi ve groups: plants were exposed to 30°C in the period from the start of SD to 5, 10 or 15 days, and were then transferred and grown at 20°C until fl owering; plants of the other two groups were grown at 20 or 30°C from the start of SD to fl owering. The number of days from the start of SD to budding and fl owering, the number of leaves and fl orets, and the diameter of infl orescence at fl owering were recorded.
Genotype related difference in development of infl orescence (Experiment III): This experiment used eight genotypes of spray chrysanthemum: ‘Sei-Monako’, ‘Sei-Snow’, ‘Yellow-Shoes’ and ‘Sei-Suffl e’ (SA type), ‘Sei-Alps’, ‘Sei-Liese’, ‘Chatoo’ and ‘Sei-Pino’ (A type). Rooted cuttings of eight genotypes were transplanted on 5 May in 2003 in 9 cm-diameter plastic pots. They were decapitated at the uppermost leaf on 19 May. After 4 weeks
of growth under LD, the plants were planted into 21 cm-diameter clay pots (fi ve plants per pot) on 19 June. Then SD was given until fl owering in the growth chambers controlled at 20°C. One lateral shoot per plant was allowed to grow. For fi ve plants of each genotype, the days from the start of SD to budding, bud break and anthesis were determined, as were the respective diameters of infl orescence at budding, bud break and fl owering.
Effects of high temperature on fl owering after the visible bud stage (Experiment IV): This experiment used four genotypes of spray chrysanthemum: ‘Sei-Snow’ and ‘Sei-Suffl e’ (SA type), and ‘Sei-Alps’ and ‘Sei-Pino’ (A type). Rooted cuttings of four genotypes were planted on 7 April in 2004 in 9-cm-diameter plastic pots. They were decapitated at the uppermost leaf on 21 April. One lateral shoot per plant was allowed to grow. After 4 weeks of growth in a greenhouse that was maintained at minimum temperature of 15°C under LD, SD was begun on 22 May. They were transferred to growth chambers controlled at 20 or 30°C, and kept under SD until fl owering when the plants began the visible bud stage. The number of days from the start of SD to budding, bud break, vertical petal and anthesis, and the diameter of infl orescence at the fl owering of fi ve plants per genotype were recorded. The size of infl orescence in terminal infl orescence was measured every day for a period of budding to vertical petal.
ResultsEffects of temperature on fl oral initiation and development (Experiment I): Both ‘Sei-Monako’ and ‘Sei-Maria’ showed the same sequence of events in fl oral initiation and development at 20 and 30°C (Fig. 1). No genotypic differences were apparent in the time required from dome formation to complete fl oret formation. In both genotypes, however, infl orescences developed slowly at 30°C in comparison with those at 20°C. Each developmental stage of chrysanthemum infl orescence was defi ned according to Fukai et al. (1997). Shoot apexes were vegetative in both genotypes and temperatures until 5 days after start of SD (DASD). Shoot apexes of both genotypes at 20°C reached to the latter stage of involucre formation in 5-10 DASD. They reached the latter stage of fl oret formation, and corolla formation started in the fl orets at the bottom of the dome in 15 DASD. Shoot apexes of both genotypes at 20°C completed fl oret formation by 25 DASD. Flowering of ‘Sei-Monako’ and ‘Sei-Maria’ at 20°C was observed at 48 and 55 DASD, respectively. On the other hand, the shoot apexes of both genotypes at 30°C did not produce fl oret primordia until 15 DASD. Floret formation started in 15-20 DASD at 30°C, and a corolla appeared in the fl orets at the bottom of dome at 25 DASD. Shoot apexes of both genotypes at 30°C fi nished fl oret differentiation by 55 DASD. Flowers of ‘Sei-Monako’ and ‘Sei-Maria’ at 30°C were observed at 62 and 94 DASD, respectively.
Table 1. Effects of temperature on the number of fl orets in spray chrysanthemumTypes Cultivars Treatments Number of fl oretsz
Ray fl orets Disk fl oretsSummer-to-autumn fl owering type ‘Sei-Monako’ 20°C 23.5 ± 2.5** 253.5 ± 16.4**
30°C 33.8 ± 0.4 455.6 ± 47.2Autumn flowering type ‘Sei-Maria’ 20°C 21.6 ± 1.1 * 152.0 ± 7.1**
30°C 23.3 ± 1.0 360.0 ± 33.3zMean ± SD. ** and * denote signifi cant difference by t-test at P < 0.05 and P < 0.01, respectively.
Effects of high temperature on fl oral development and fl owering in spray chrysanthemum 9

The size of infl orescence at 20°C was much larger than that at 30°C in both genotypes. Infl orescences at 20°C had shorter petals of ray fl orets with pale colour and a larger central part consisting of disk fl orets (Fig. 2). Considerably more ray fl orets and disk fl orets were apparent in plants grown at 30°C than in those grown at 20°C in both genotypes (Table 1).
Effects of high temperature exposed immediately after start of SD on fl owering (Experiment II): The numbers of days to budding and flowering were slightly influenced by high temperature exposure immediately after the start of SD, whereas the number of fl orets increased considerably as a result of exposure to high temperature (Table 2). In ‘Sei-Monako’, no signifi cant differences in the number of days to budding and fl owering were apparent among the three treatments in which 5-15 days of high temperature were given during fl oral initiation to early development of infl orescence. All parameters of the three
Fig. 1. Effects of temperature on morphological changes in the shoot apex. A: 20°C ‘Sei-Monako’, B: 30°C ‘Sei-Monako’, C: 20°C ‘Sei-Maria’, D: 30°C ‘Sei-Maria’. These photographs represent the 5, 10, 15, 20, 25, 30 and 45 days after SD from the left of the line.
Fig. 2. Effects of temperature on the aspect of infl orescence at the flowering. A: 30°C ‘Sei-Monako’, B: 20°C ‘Sei-Monako’. This photograph was taken 68 days after SD.
Fig. 3. Effects of temperature after budding on the days to fl owering. 0 of the vertical axis denotes the budding day. Vertical bars represent SD.
10 Effects of high temperature on fl oral development and fl owering in spray chrysanthemum
30
25
20
15
10
5
0
Day
s
Sei Snow Sei Suffle Sei Alps Sei Pino
Budding to bud break
Bud break to vertical petal
Vertical petal to flowering
20 Co 20 Co 20 Co 20 Co30 Co 30 Co 30 Co 30 Co

Fig. 4. Development situation of infl orescence from budding to vertical petals in the terminal fl ower bud. Arrows show the bud break period for each temperature.
treatments, except for the number of fl orets, were nearly equivalent to those of plants at 20°C. ‘Sei-Maria’ showed identical tendencies to those of ‘Sei-Monako’, but the days to fl owering were slightly more in plants of the 15-day treatment. On the other hand, at 30°C, the days to budding were signifi cantly more than those of other treatments in ‘Sei-Maria’. In addition, the days to fl owering at 30°C were many more than those of other treatments in both genotypes. No signifi cant difference was found in the number of leaves, indicating that high temperatures had no effect on the transition from the vegetative phase to the reproductive phase. The infl orescence diameter was signifi cantly smaller at 30°C in both genotypes. The number of disk fl orets
increased in both genotypes when high temperatures were applied longer.
Genotypes difference in the development of infl orescence (Experiment III): All genotypes reached the budding stage in about 20 DASD, irrespective of fl owering type SA and A (Table 3). On the other hand, the number of days to bud break varied from 29 days in ‘Sei-Monako’ and ‘Chatoo’ to 43 days in ‘Sei-Alps’. ‘Sei-Alps’ and ‘Sei-Liese’ required more days to budding and showed more days to fl owering. Diameters of infl orescences at bud break and fl owering stage were signifi cantly different depending on genotypes (Table 4). No constant relationship was observed in the diameter of infl orescence between the bud break and fl owering stages.
Effects of high temperature after visible bud stage on fl owering (Experiment IV): Plants grown at 30°C from budding to fl owering showed delayed fl owering compared with plants grown at 20°C. The flowering delay was remarkable in A genotypes (Fig. 3). The time required from budding to bud break at 30°C was much longer than that at 20°C in A genotypes, but the difference was small in SA genotypes. The time from bud break to the vertical petal stage and from vertical petal to fl owering at 30°C was slightly longer than that at 20°C, except for ‘Sei-Snow’, for which the time from vertical petal to fl owering at 30°C was longer than that at 20°C.
The time course of infl orescence development revealed a difference in the infl orescence size between at 20 and 30°C from 5 days after the budding stage in all genotypes. Differences between temperatures were small in SA genotypes and were large in A genotypes, in which the speed of infl orescence development slowed around 10 days after budding at 30°C. However, no big differences were apparent in the infl orescence diameter at the bud break stage in all genotypes. Flowering of SA genotypes at 30°C was almost identical to that at 20°C, but fl owering at 30°C was particularly delayed in A genotypes.
DiscussionEffects of high temperature on chrysanthemum fl owering have already been studied in relation to fl oral initiation (phase transition), fl ower-bud development, and other environmental factors (Cockshull, 1979; Cockshull and Kofranek, 1994; Karlsson et al., 1989; Whealy et al., 1987; Wilkins et al., 1990). However, it remains unclear how the delay manifests itself in the processes of fl oral initiation and development in chrysanthemum. This study revealed that two independent phenomena occur in infl orescences under high temperature conditions: quantitative increase of fl orets and slow infl orescence development. Additionally, we emphasized the importance of the time required for development to a specific stage of inflorescence for fl owering delay in chrysanthemum.
No difference was found in the sequence of floral initiation and development between the two genotypes at either 20 or 30°C in this study. The morphological changes in the process of fl oral development were almost
Effects of high temperature on fl oral development and fl owering in spray chrysanthemum 11
0123456789
1011121314
Budding 5 10 15 20
20°C 30°C
0123456789
1011121314
Budding 5 10 15 20
20°C 30°C
‘Sei-Snow’
0123456789
101112131415
Budding 5 10 15 20 25 30 35
‘Sei-Alps’
0123456789
101112131415
Budding 5 10 15 20
‘Sei-Suffle’
0123456789
1011121314
Budding
Inflo
resc
ence
siz
e(m
m)
5 10 15 20 25 30Days
‘Sei-Pino’
Inflo
resc
ence
siz
e(m
m)
Inflo
resc
ence
siz
e(m
m)
Inflo
resc
ence
siz
e(m
m)

consistent with those of previous reports on fl oral development of chrysanthemums (Fukai et al., 1997; Lee et al., 2001; Okada, 1963; Yulian et al., 1996; Zhang et al., 1998). Present results showed that a morphological transition from a vegetative to reproductive shoot apex, i.e. dome formation, occurred during 5-10 DASD. Infl orescence development at 30°C was slower than that at 20°C, as described by Whealy et al. (1987). The period required from dome formation to completion of fl oret differentiation on the infl orescence was almost equal in both SA and A genotypes under identical temperature conditions. However, the number of days to fl owering at 30°C in A genotype increased more than 30 days in comparison with the SA genotype. Results indicate that no direct relationship exists between fl owering and completion of fl oret differentiation in infl orescence, suggesting that fl owering delay is the result of high temperature effects on the latter developmental stages of the infl orescence.
Increased number of fl orets, especially disk fl orets, were observed in both SA and A genotypes at 30°C. Furthermore, increase was recognised when high temperatures were applied for only 5-15
days immediately after the start of SD. These facts indicate that the high temperature given in the early developmental stage of infl orescence determines the direction of differentiation in the infl orescence apex. In all cases, the increase of ray fl orets occurred even though a fl owering delay did not take place, indicating that the increase of fl oret number and the delay of fl owering under high temperature conditions are independent phenomena. Cockshull and Kofranek (1994) also described the increased fl oret number in chrysanthemum under high temperature conditions, but they did not recognize the independency of the increased fl ower number and delayed fl owering. The reduced number of fl orets on the infl orescence or fl oral organs, particularly in petals, are recognised in many plants under high temperature conditions (Chimenti and Hall, 2001; Mito et al., 1980). The reduced numbers of fl orets is inferred to have occurred because of faster growth under high-temperature conditions. In case of chrysanthemums, the increased number of fl orets can be attributed not only to the decreased development speed of infl orescence under high temperature conditions, but also some physiological changes in the infl orescence shoot apex.
Table 2. Effects of high temperature during fl ower-bud initiation and development period on fl oweringCultivars Treatments Days to budding
from the start of SD
Days to anthesis from the start
of SD
Number of leaves
Diameter of inflorescence
(mm)
Number of fl oretsRay fl orets Disk fl orets
‘Sei-Monako’ 20°C 20.7abz 46.1a 19.1NSy 48.9b 27.5a 310.6a5 days 21.2ab 47.4a 18.1NS 49.8b 28.8a 316.3a10 days 20.1a 46.7a 17.7NS 49.4b 32.4b 386.7b15 days 21.9ab 48.8a 18.2NS 49.4b 32.9b 489.8c30°C 22.9b 60.5b 17.9NS 35.1a 33.8b 519.0c
‘Sei-Maria’ 20°C 20.8a 57.5a 23.2NS 60.7b 25.1NS 267.3ab5 days 21.4a 58.8ab 23.4NS 64.4b 25.6NS 258.1a10 days 21.1a 59.8ab 23.9NS 60.2b 23.3NS 262.6ab15 days 22.5a 61.8b 23.3NS 62.2b 25.4NS 287.2b30°C 25.6b 90.1c 23.3NS 35.9a 25.1NS 348.7c
z Different letters among treatments represent signifi cant difference by Tukey’s multiple range test (P < 0.05).y NS: Not signifi cant.
Table 3. Number of days from the start of SD to each development stage of infl orescenceTypes Cultivars Days to budding from
start of SD Days to bud break from
start of SDDays to anthesis from
start of SDSummer-to- autumn fl owering type ‘Sei-Monako’ 21.0abz 29.0a 45.3ab
‘Sei-Snow’ 19.6a 36.2b 46.4ab‘Yellow-Shoes’ 22.5b 34.0b 43.8a‘Sei-Suffl e’ 19.3a 33.5b 45.5ab
Autumn fl owering type ‘Sei-Alps’ 21.0ab 43.0c 51.8c‘Sei-Liese’ 19.4a 40.6c 50.6c‘Chatoo’ 20.8ab 29.0a 45.8ab‘Sei-Pino’ 19.2a 36.0b 48.0bc
Table 4. Diameter of infl orescence at different stagesTypes Cultivars Diameter of infl orescence (mm)
Budding Bud break FloweringSummer-to- autumn fl owering type ‘Sei-Monako’ 5.23abz 9.70ab 53.40bc
‘Sei-Snow’ 5.24ab 11.24bc 41.72a‘Yellow-Shoes’ 5.93b 12.90cde 41.13a‘Sei-Suffl e’ 5.48ab 13.10de 49.03b
Autumn fl owering type ‘Sei-Alps’ 5.10a 14.37e 52.13bc‘Sei-Liese’ 5.42ab 14.48e 59.30c‘Chatoo’ 5.04a 8.76a 49.64b‘Sei-Pino’ 4.80a 12.20cd 38.52a
12 Effects of high temperature on fl oral development and fl owering in spray chrysanthemum

The days to budding and fl owering in both genotypes were almost equal for those grown at 20°C when high temperature was given only 5-15 DASD (Table 2). That fact implies that inhibition of infl orescence development in early stages that is caused by exposure to high temperature recovered rapidly after transferral to 20°C. These results indicate that the developmental speed of infl orescence is temperature dependent. In the same experiment, the number of leaves did not change among all temperature treatments. The high temperature given immediately after the start of SD did not greatly affect the phase transition from vegetative to reproductive. Observation by SEM, which showed that fl oral initiation occurred in the period of 5-10 DASD at 30°C, also supported this inference. Therefore, the delay of phase transition under high temperature conditions is very small even if it existed in genotypes used in this study. Nishio et al. (1988) reported no changes in the number of leaves in two genotypes of chrysanthemum when maintained at 27-30°C during the day time and at a range of 20-35°C night temperature in the fi rst three weeks after start of SD. On the other hand, Wilkins et al. (1990) reported decreased leaf numbers from lower night temperatures when chrysanthemums were maintained at a minimum temperature of 21°C during the day and in a range of 13-21°C night temperatures in the fi rst three weeks after starting SD. Cockshull and Kofranek (1994) also showed that high night temperatures of 32°C in the fi rst 1-3 weeks after the start of SD increased the chrysanthemum leaf number. The differences of these results can be attributed to the fact that the phase transition from vegetative to reproductive phase is delayed under higher temperature conditions, but it is less delayed at night temperatures below 20°C (or mean daily temperature). Genotype differences in response to high temperature in terms of phase transition might also exist.
Infl orescence sizes at the budding stage were similar among genotypes used in this study when grown at 20°C, whereas differences in infl orescence size of genotype at the bud break stage were clear. The genotypes required a longer time to bud break at 20°C and required a longer time to fl owering. In a genotypes, showing great delay of fl owering under high temperature conditions, the time from budding to bud break stage was remarkably long at 30°C compared to that at 20°C (Fig. 3). The developmental speed of infl orescence in A genotypes at 30°C after the budding stage decreased considerably compared to those at 20°C, whereas the size of infl orescence at the bud break stage was not greatly different (Fig. 4). These results show that the infl orescence size at the bud break stage is genotype-dependent and that the time to reach this specifi c stage (size) is important to determine the fl owering time. The time to reach the bud break stage was longer at 30°C, especially in A genotypes, showing the delay of fl owering under high temperature conditions. The physiological explanation for such a phenomenon remains unclear. High photosynthetic capacity of SA genotypes under high temperature and high light intensity, as shown by Koyama et al. (2001), might be one reason for that difference. It can be concluded that high temperatures decreased the developmental speed of infl orescence in chrysanthemum after the budding stage. The time to reach the bud break stage was prolonged, engendering fl owering delay.
Results of this study revealed that two independent events caused by high temperature occurred in the shoot apex of
spray chrysanthemum under a short-day condition. First, the high temperatures decreased the fl oral development speed in infl orescence, thereby increasing the number of fl orets in both SA and A chrysanthemum genotypes. Secondly, as high temperatures decreased the developmental speed of infl orescence after budding stage, the time to reach the bud break stage was prolonged, thereby delaying fl owering, especially in A chrysanthemum genotypes.
AcknowledgementsThe authors thank SEIKOU-EN for providing chrysanthemum genotypes. This study was supported in part by a grant from the Ministry of Education, Culture, Sports, Science and Technology (No. 16580018).
ReferencesChimenti, C.A. and A.J. Hall, 2001. Grain number responses to
temperature during fl oret differentiation in sunfl ower. Field Crops Res., 72: 177-184.
Cockshull, K.E., 1979. Effects of irradiance and temperature on fl owering of Chrysanthemum morifolium Ramat. in continuous light. Ann. Bot., 44: 451-460.
Cockshull, K.E. and A.M. Kofranek, 1994. High night temperatures delay fl owering, produce abnormal fl owers and retard stem growth of cut-fl ower chrysanthemums. Sci. Hortic., 56: 217-34.
Fukai, S., W. Zhang, H. Uehara and M. Goi, 1997. Morphological changes in shoot apex during fl oral initiation and development in chrysanthemum (Dendranthema grandifl orum (Ramat.) Kitam.). Tech. Bull. Fac. Agr. Kagawa Univ., 49: 171-178.
Karlsson, M.G., R.D. Heins, J.E. Erwin and R.D. Berghage, 1989. Development rate during four phases of chrysanthemum growth as determined by preceding and prevailing temperatures. J. Amer. Soc. Hort. Sci., 114: 234-240.
Kawata, J., T. Toyoda, M. Uda, M. Okimura, M. Shibata, T. Kameno, M. Amano, Y. Nakamura and T. Matsuda, 1987. Factors controlling the fl owering time of chrysanthemums. Bull. Nat. Res. Inst. Veg. Orn. and Tea Ser. A, 1: 187-222 (In Japanese with English summary).
Koyama Y., O. Wada and M. Fujino, 2001. Comparison of photosynthetic rate in some spray type chrysanthemums under different temperature and light intensity conditions. Bull. Hyogo Pref. Agr. Res. Inst. (Agr. Sec.), 49: 21-24 (In Japanese with English summary).
Koyama Y., O. Wada, N. Miki and Y. Ikeda, 1996. Effects of day length control on growth and fl owering of spray-type chrysanthemum in high temperature season. Bull. Nat. Agr. Res. Cent. West. Reg., 92: 55-59 (In Japanese).
Lee, B.J., M.K. Won and D.G. Shin, 2001. Floral morphogenesis of the apex in chrysanthemum (Dendranthema grandifl ora Tzvelev) cv. Envy. J. Kor. Soc. Hort. Sci., 42: 492-496.
Mito, K., G. Hazu, S. Kimura and M. Iwasaki, 1980. The effect of winter night temperature on fl ower production in greenhouse roses. III. With special reference to split night temperature regimes. Bull. Shizuoka Agr. Exp. Stat., 25: 53-62 (In Japanese with English summary).
Nishio, J., T. Yamaguchi and K. Yonemura, 1988. Effects of temperature during fl ower buds initiation and development on shade culture of spray chrysanthemum. Res. Bull. Aichi Agr. Res. Cent., 20: 285-292 (In Japanese with English summary).
Okada, M., 1963. Studies on the fl ower bud differentiation and fl owering in chrysanthemum. Mem. Fac. Agr. Tokyo Univ. Ed., 9: 63-202 (In Japanese with English summary).
Shibata, M., M. Amano, J. Kawata and M. Uda, 1988. Breeding process and characteristics of ‘Summer Queen’, a spray-type chrysanthemum cultivar for summer production. Bull. Nat. Res. Inst. Veg. Orn. Tea Ser. A, 2: 245-255 (In Japanese with English summary).
Effects of high temperature on fl oral development and fl owering in spray chrysanthemum 13

Shibata, M. and J. Kawata, 1987. The introduction of heat tolerance for fl owering from Japanese summer-fl owering chrysanthemum into year-round chrysanthemums. Acta Hortic., 197: 77-83.
Whealy, C.A., T.A. Nell, J.E. Barrett and R.A. Larson, 1987. High temperature effects on growth and fl oral development of chrysanthemum. J. Amer. Soc. Hort. Sci., 112: 464-468.
Wilkins, H.F., W.E. Healy and K.L. Grueber, 1990. Temperature regime at various stages of production infl uences growth and fl owering of Dendranthema grandifl orum. J. Amer. Soc. Hort. Sci., 115: 732-736.
Yulian, Y. Fujime and N. Okuda, 1996. Morphological observations on capitulum initiation and floret development of garland chrysanthemum (Chrysanthemum coronarium L.). J. Japan. Soc. Hort. Sci., 64: 867-874.
Zhang, W., S. Fukai and M. Goi, 1998. Morphology of capitulum initiation and fl oret development of Dendranthema species native to Japan. J. Japan. Soc. Hort. Sci., 67: 347-351.
Van Der Ploeg, A. and E. Heuvelink, 2006. The infl uence of temperature on growth and development of chrysanthmeum cultivars: a review. J. Hort. Sci. & Biotech., 81: 174-182.
14 Effects of high temperature on fl oral development and fl owering in spray chrysanthemum

Journal of Applied Horticulture, 10(1): 15-19, 2008
Factors affecting fruit abortion in a gynoecious cucumber cultivar
A. Tazuke1, P. Boonkorkaew2, S. Hikosaka2 and N. Sugiyama2
1College of Agriculture, Ibaraki University, Ami, Ibaraki, 300-0393, Japan, 2Graduate School of Agricultural and Life Sciences, Bunkyo-ku, Tokyo, 113-8657, Japan. E-mail: [email protected]
AbstractFruit growth of the gynoecious cucumber ‘NK × AN8’ was measured non-destructively to clarify whether the presence of fruit at lower nodes caused the abortion of fruit at upper nodes. When only one fruit per plant was allowed to grow, fruit growth could be divided into two phases: slow exponential and fast exponential. Phase change from slow to fast occurred when cumulative temperatures (CTs) after anthesis reached 38 and 54ºC d for pollinated and parthenocarpic fruit, respectively. The CT was calculated as the sum of the differences between daily temperatures and 5ºC. When fruit at nodes 4 and above were allowed to grow, the fi rst growth phase was prolonged. Furthermore, parthenocarpic fruit aborted frequently when the sum of the relative growth rate (RGR) with respect to the CT (the sum of RGRs) for fruit at lower nodes exceeded 0.1 g g–1 (ºC d)–1. Pollination with pollen of the monoecious cucumber ‘028’ strongly suppressed fruit abortion; a large number of fruits could develop to a commercial size even when the sum of RGRs for fruit at lower nodes exceeded 0.1 g g–1 (ºC d)–1. These results suggested that fruit abortion is more related to the existence of actively growing fruit than to the absolute amount of dry mass accumulation in the fruit.
Key words: Cucumber, gynoecious cultivar, fruit growth, fruit abortion, pollination, relative growth rate
IntroductionA large number of pistillate fl owers are formed within a short period in gynoecious cucumber cultivars. Although the number of pistillate fl owers is about two times greater in gynoecious cultivars than in monoecious cultivars, the yield is only 10-20% higher in the former than in the latter cultivars. A higher percentage of fl owers abort in gynoecious cultivars compared with monoecious cultivars, leading to a lower yield than expected from the number of fl owers (Hikosaka and Sugiyama, 2004). Marcelis (1994) proposed a simulation model of cucumber fruit growth, but his model is not satisfactory for the precise estimation of fruit abortion.
Fruit abortion being an important factor determining fruit production, it has been studied extensively in many crops. However, an unequivocal conclusion has not yet been attained. Some authors have considered that the abortion of reproductive organs was affected by plant hormones. For example, ethylene production is suggested to cause the abortion of Hibiscus fl ower buds (Van Meeteren and Van Gelder, 1995) and pepper fruit and fl ower buds (Huberman et al., 1997; Wien et al., 1989). On the other hand, the inhibition of auxin transport is related to the abortion of pepper fruit and fl ower buds under high temperature (Huberman et al., 1997). Bangerth (1989) hypothesized that auxin exported from early-developed fruit inhibits auxin exported from later-developed fruit, causing fruit abortion.
In contrast, Marcelis et al. (2004) emphasized the importance of the source–sink relationship in the fruit abortion of sweet pepper. In tomato, fruit set was related to the source–sink ratio (Bertin, 1995). Guinn (1974) pointed out the importance of photoassimilate supply in preventing fruit abortion in cotton. Turner and Wien (1994a, b) considered that cultivar differences
in the abortion of pepper fruit and fl ower buds can be ascribed to differences in photosynthetic activity, respiratory activity, and photoassimilate partitioning.
In monoecious cucumber cultivars, nodes with pistillate fl owers are distributed at random on vines, while pistillate fl owers are formed regularly at each node in gynoecious cultivars. Therefore, it is possible that the rate of fl ower formation and increases in the fresh mass of the fruit (crop load) can be estimated precisely in gynoecious cultivars, but not in monoecious cultivars. In the present experiment, we grew gynoecious parthenocarpic cucumbers to conduct a systematic growth analysis of the fruit. From the analysis of growth data, we tried to clarify the factor that was dominant in fruit abortion, that is, the existence of fruit or the crop load.
Materials and methodsGynoecious parthenocarpic ‘NK × AN8’ cucumbers were sown on 5 April, 2004. Seeds were obtained from the Nihon Horticultural Production Institute (Matsudo, Chiba, Japan). On 30 April, plants with three fully expanded leaves were transplanted individually into plastic containers (20 L) fi lled with a growth medium (Soil Mix, Sakata Co., Yokohama, Japan) containing starter fertilizer (0.4 g kg–1 N, 0.9 g kg–1 P, and 0.5 g kg–1 K). Nodes were numbered acropetally, with the cotyledonary node designated as node 0. All lateral shoots were removed, while the apical portions of the main vines were not pinched. For all experiments, ten plants were used; fi ve plants were allocated to the parthenocarpic treatment and the other fi ve to the pollination treatment. In the parthenocarpic treatment, petals were clipped before anthesis to prevent pollination. In the pollination treatment, hand pollination was carried out using pollen from staminate
Journal
Appl

fl owers of the monoecious cultivar ‘028’. In Experiment 1, only one fruit per plant was allowed to grow (node 10) and the diameter and length of the fruit were measured every day. Flower buds at nodes 4–9 and above 11 were removed just after their appearance. In Experiment 2, fruit at nodes 4 and above were allowed to grow. The length and diameter of all fruit (ovaries) at nodes 4–15 were measured daily from anthesis to harvest using a digital calliper. In both experiments, the fresh weight (FW) of an ‘NK × AN8’ fruit (g) could be estimated precisely from fruit (ovary) length (FL, mm) and diameter (D, mm) as follows: FW = 8.09 × 10⁻⁴× (D/2)2π× (FL) +0.732 (n = 241, r2 = 0.993) (Hikosaka and Sugiyama, 2004). All fruit were harvested when they reached a commercial size, i.e., 150 mm in length.
The maximum and minimum temperatures in the glasshouse were controlled at 28/15ºC. Temperature and photosynthetically active radiation inside the greenhouse were monitored every minute with a datalogger (CR10X; Campbell Scientifi c Inc., Logan, UT, USA). Plants were irrigated with 1-2 L of nutrient solution every day to maintain suffi cient water and nutrient supply. The concentrations of ions in the nutrient solution were as follows: NO3
–, 16 mM; H2PO4
–, 4 mM; Ca2+, 4 mM; Mg2+, 2 mM; K+, 8 mM; and NH4+,
1.3 mM. The CT after anthesis was calculated as the sum of the differences between daily temperatures and 5ºC. This was because the RGR of the fruit of a typical Japanese cucumber cultivar is almost zero at 5ºC and increases linearly to 30ºC (Tazuke and Sakiyama, 1986). The RGR with respect to the CT (g g–1 (ºC d)–1) and the growth rate (GR, g d–1) of a fruit between n and n+1 days after anthesis (DAA) was calculated as:
RGR = (ln FWn+1 – ln FWn) / (Tn – 5)and
GR = FWn+1 – FWn,
where, FWn and FWn+1 are the estimated FWs of fruit at n and n+1 DAA, respectively, and Tn is the daily average temperature at n DAA.
ResultsFruit growth in abscence of competing fruit (Experiment 1): When only one parthenocarpic fruit was allowed to grow on a plant, increases in the logarithms of fruit FW (ln FWn – ln FW0, where FWn and FW0 are the FWs of fruit at n and 0 DAA, respectively) against the CT after anthesis can be depicted by two lines (Fig. 1a). These two lines intersected at 54ºC d, where FW reached about 3 g. In pollinated fruit, it appears that increases in the logarithm of fruit FW increased linearly with an increase in the CT. An exception was for fruit smaller than 3 g (fruit at 0-38ºC DAA). When the relationship between increases in the logarithm of fruit weight and the CT was calculated after fruit FW reached 3 g, no difference was found in the slopes between pollinated and parthenocarpic fruit. Therefore, the regression line in Fig. 2 was calculated for pooled data of both pollinated and parthenocarpic fruit. The relationships between increases in the logarithm of fruit FW and the number of days were diverse among fruit (data not shown), suggesting the rationality of expressing RGR based on CT.
Growth of parthenocarpic fruit in presence of competing fruit (Experiment 2): An example of the growth of parthenocarpic
fruit on a plant is shown in Fig. 3a, along with the sum of RGRs (Fig. 3b), GRs (Fig. 3c), and the number of fruit per plant (Fig. 3d). Fruit at node 4 usually grew almost exponentially, but several fruit at nodes 5 and above did not grow immediately. Fruit growth usually resumed thereafter. In severe cases, however, fruit growth did not resume, leading to fruit abortion. When the growth of fruits at nodes above 9 was completely suppressed at 130ºC d, the sum of RGRs and the number of fruit were very high: 0.1 g g–1 (ºC d)–1 and six fruits, respectively. However, the sum of GRs remained quite low.
Growth of pollinated fruit in presence of competing fruit (Experiment 2): When the pistillate fl owers were pollinated, the growth pattern of fruit changed markedly (Fig. 4a). A few fruit ceased growing for a while after anthesis. When fruit at nodes 5
Fig. 1. Growth of cucumber ‘NK × AN8’ fruit in absence of competing fruit. Increases in the logarithm of fruit fresh weight (FW) after anthesis were plotted against cumulative temperature after anthesis. The cumulative temperature was calculated as the sum of the differences between daily average temperatures and 5ºC. Circles, fruit whose FW is less than 3 g; triangles, fruit whose FW weight is greater than 3 g. (a) parthenocarpic fruit, (b) pollinated fruit.
Fig. 2. Growth of cucumber ‘NK × AN8’ fruit in absence of competing fruit after the onset of rapid exponential growth. Increases in the logarithm of fruit fresh weight (FW) were plotted against cumulative temperature after fruit reached 3 g. Closed circles, pollinated fruit; open circles, parthenocarpic fruit. The regression line was calculated by pooling the data of both pollinated and parthenocarpic fruits.
0 0 50 1 00 1 50 2 00
2
4
6
0
2
4
6
y = 0.0395x -1.077(r = 0.961**, n = 18)
y = 0.0186x + 0.051(r = 0.924**, n = 17)
y = 0.0402x -0.475(r = 0.994**, n = 20)
y = 0.0277x + 0.001(r = 0.948**, n = 13)
Cumulative temperature after anthesis ( d)oC
Incr
ease
in ln
(FW
) afte
r ant
hesi
s (a)
(b)
0
Incr
ease
in fr
uit l
n(FW
)
50 1000
2
1
3
4
afte
r fru
it re
ache
d 3g
y = 0.0414x -0.035(r = 0.996**, n = 38)
Cumulative temperature after fruit reached 3g ( C d)o
16 Factors affecting fruit abortion in a gynoecious cucumber cultivar

and above were compared, the period from anthesis to harvest was found to be shorter in pollinated fruit than in parthenocarpic fruit (Figs. 3 and 4). The competing potential of fruit at lower nodes against fruit at upper nodes, i.e., the sum of RGRs, the sum of GRs, and the number of fruit, did not differ between plants with pollinated fruit and those with parthenocarpic fruit until CT reached 250oC d (Figs. 4b-d vs. Figs. 3b-d, respectively).
Evaluation of the initial period of slow growth (Experiment 2): To evaluate the effect of the sum of RGRs, the sum of GRs, and the number of competing fruit on the period of initial slow growth, these values were plotted against the reciprocal of the CT (1/CT) necessary for the development of fruit weighing 2, 3, 4, or 5 g. The CT was infi nite (1/CT = 0) for fruit that did not reach 2, 3, 4, or 5 g. In the parthenocarpic treatment, some fruits reached 2-4 g despite the sum of RGRs being greater than 0.1 g g–1 (ºC d)–1 (Fig. 5). On the other hand, all fruits reached 5 g when the sum of RGRs was smaller than 0.1 g g–1 (ºC d)–1, but no fruit reached 5 g when the sum of RGRs was 0.1 g g–1 (ºC d)–1 or higher (Fig. 6a). In many pollinated fruits, however, the values of 1/CT were maintained at about 0.01 (ºC d)–1 even when the sum of RGRs was greater than 0.1 g g–1 (ºC d)–1 (Fig. 6a). In contrast, there was no relationship between 1/CT and the sum of GRs for parthenocarpic
fruits (Fig. 6b). Relationships between 1/CT and the number of competing fruit were similar to those between 1/CT and the sum of RGRs, although they were not as clear (Fig. 6c).
DiscussionPotential growth curve of a fruit: Marcelis (1994) estimated the ‘potential growth rate’ of a fruit by monitoring fruit growth when there was no competition for assimilates from other fruit. He found that fruit growth fi tted a Richards’ equation and that the potential growth rate could be estimated from this equation. We also assumed that potential fruit growth could be attained when only one fruit was left on a plant to avoid competition from other fruit. In the present experiment, pollinated and parthenocarpic fruit grew exponentially at the same RGR, which started from 38ºC d and 54 ºC d of CT after anthesis, respectively (Figs. 1 and 2). This result suggests that potential fruit growth is independent of pollination, but that pollination hastens the start of rapid exponential growth. It is interesting to note that fruit cells began to enlarge 2 DAA in pollinated fruit and 4 DAA in parthenocarpic fruit of this cultivar (Boonkorkaew, pers. comm.). As 2 and 4 d roughly corresponded to 35 and 70ºC d, respectively, it is likely that the potential growth rate could be accomplished in both parthenocarpic and pollinated fruit when fruit cells begin to enlarge. Furthermore, an initial slow growth period exists after anthesis even when only one fruit is allowed to grow on a
Fig. 4. Relationship between fruit growth and the sum of relative growth rates (∑RGRs), the sum of growth rates (∑GRs), and the number of fruit summed for all fruit from plants of the pollinated cucumber ‘NK × AN8’. Data of a plant are shown. All fruits at nodes 4-15 were allowed to grow and were harvested once they reached a marketable size. Pollen was obtained from plants of the monoecious cultivar ‘028’. ∑RGRs was calculated based on cumulative temperatures. Data from one plant are shown as an example.
Fig. 3. Relationship between fruit growth and the sum of relative growth rates (∑RGRs), the sum of growth rates (∑GRs), and the number of fruit summed for all fruit from plants of the parthenocarpic cucumber ‘NK × AN8’. Data of a plant are shown. All fruits at nodes 4-15 were allowed to grow and were harvested once they reached a marketable size. The data for the 14th node are missing because as a very rare case, male fl ower fl owered on the 14th node. The sum of RGRs was calculated based on cumulative temperatures. Data from one plant are shown as an example.
100
10
1
0.1
0.2
0.1
0
100
200
0
10
5
0 0
Cumulative temperature ( C d)o
(b)
(c)
(d)
(a)
100 200 300 400
FW(g
)Fr
uit n
umbe
rΣG
R (g
d)
-1ΣR
GR
[g
g(C
d)
]-1
-1o
ΣRG
R
[g g
(C d
)]
-1-1
o
100
10
1
0.1
0.1
0.2
0
100
200
010
5
0 0
Cumulative temperature ( C d)o
(b)
(c)
(d)
(a)
100 200 300 400
FW(g
)Fr
uit n
umbe
rΣG
R (g
d)
-1
Factors affecting fruit abortion in a gynoecious cucumber cultivar 17

plant. The discrepancy from the sigmoidal Richards’ equation in the present experiment can be ascribed to the fact that fruit was harvested much earlier in the present experiment than in the experiment of Marcelis (1994). Fruit abortion and competition between fruits: In absence of competing fruits, fruit FW reached 3 g at 54ºC d of the CT. However, the existence of competing fruits extended the initial slow growth period of parthenocarpic fruit from 54 to more than 100ºC d (Fig. 3). Furthermore, it appears that fruit FW at the end of the initial slow growth phase varied from 2 to 5 g when there was competing fruit. This makes the relationship between 1/CT and the sum of RGRs unclear if we assume that fruit FW reached 2-4 g at the end of the slow growth phase (Fig. 5). When the sum of RGRs was smaller than 0.1 g g–1 (ºC d)–1, all fruits reached 5 g by about 100ºC d. However, all fruits aborted when the sum of RGRs was larger than 0.1 g g–1 (ºC d)–1. These results suggested that (1) fruits that are not exposed to severe competition can complete the slow growth phase, (2) fruit FW at the end of the slow growth phase differs between individual fruits (2-5 g) and (3) fruits of which FW at the end of the slow growth phase was 2-4 g cease to growth and fi nally abort (1/CT=0). On the other hand, it is likely that fruit that can enter the fast growth phase do not abort because all fruit larger than 5 g would develop to
a commercial size. Takeno and Ise (1992) reported that in a gynoecious cucumber cultivar, fruit that reached 6 cm in length never aborted.
In cucumber fruits, RGRs were almost the same from the start of rapid exponential growth to harvest. Therefore, the sum of RGRs would be proportional to the total number of growing fruits, whereas the sum of GRs would be dependent on the number of large fruits. In the present study, the sum of GRs and the number of fruit did not relate closely with 1/CT; fruit FW did not reach 5 g even when the sum of GRs was very low. This suggests that growth suppression or fruit abortion is determined by the existence of the actively growing fruit, not by the size of the competing sink. Schapendonk and Brouwer (1984) reported that severe defoliation did not inhibit the normal development of cucumber fruit when only one fruit was allowed to grow. Thus, they hypothesized that factors other than the shortage of photoassimilates could cause fruit abortion. Stephenson et al. (1988) reported that seed number
Fig. 5. Relationships between the reciprocal of the cumulative temperatures (1/CT) necessary for the development of fruit weighing (a) 2, (b) 3, and (c) 4 g and the sum of relative growth rates (∑RGRs) of fruit at lower nodes of the parthenocarpic cucumber ‘NK × AN8’. ∑RGR was calculated on the day of anthesis of the fruit for which 1/CT was calculated.
Fig. 6. Relationships between the reciprocal of the cumulative temperatures (1/CT) necessary for the development of fruit weighing 5 g and (a) the sum of relative growth rates (∑RGR), (b) the sum of growth rates (∑GR), and (c) the number of fruit at lower nodes of both the parthenocarpic and the pollinated cucumber ‘NK × AN8’. In pollinated fruit, pollen was obtained from plants of the monoecious cultivar ‘028’. ∑RGR, ∑GR, and the number of fruit were calculated on the day of anthesis of the fruit for which 1/CT was calculated. Open circles, parthenocarpic fruit; closed circles, pollinated fruit. ∑RGRs was calculated based on cumulative temperature.
0.02
0.02
0.02
0.01
0.01
0.01
0
0
00 0.01 0.02
1/C
T [(
C d
)o
-1] (b)
(c)
(a)
ΣRGR [g g ( C d)-1 -1o ]
18 Factors affecting fruit abortion in a gynoecious cucumber cultivar
0.02
0.02
0.02
0.01
0.01
0.01
0
0
00
0
0
5 10
100
0.1 0.2 0.3 0.4
200 300
1/C
T [(
C d
)o
-1] (b)
(c)
(a)
RGR [g g ( C d)-1 -1o ]
Fruit number
GR (g d )-1

in the fi rst fruit determines whether later-developed zucchini fruit abort or not. The removal of old fruit decreased the abortion of young fruit by decreasing the ABA content of young fruit (Tamas et al., 1979). Unlike parthenocarpic fruits, many pollinated fruit reached 5 g even when the sum of RGRs was larger than 0.1 g g–1
(ºC d)–1. This suggests that pollination nullifi ed the effect of the sum of RGRs on fruit abortion. It is well known that pollination stimulates the synthesis of plant hormones such as auxin.
Although Marcelis et al. (2004) emphasized the importance of the source–sink relationship in the abortion of fl owers or fruit of sweet pepper, they also admitted the involvement of some dominance effect. It is well known that actively growing fruit produce plant hormones that might be involved in fruit retention (Huberman et al., 1997; Takeno and Ise, 1992; Wien et al., 1989). It is reported, however, that the availability of photoassimilates is associated with the occurrence of fruit abortion in plants other than cucumber (Aloni et al., 1996; Guinn, 1974; Kinet, 1977; Marcelis et al., 2004; Wien et al., 1989). Therefore, although the relationship between 1/CT and the sum of the GR was not clear, the possibility that fruit abortion is determined by the availability of photoassimilates could not be ruled out.
In parthenocarpic fruit that reached 5 g, 1/CT ranged from 0.0058 to 0.0134 (Fig. 6a). This indicates that fruit that did not reach 5 g by 74-171ºC d of the CT, aborted in the parthenocarpic treatment. Hikosaka and Sugiyama (2005) reported that parthenocarpic fruit whose growth was suppressed by up to 10 d (ca. 175ºC d) usually aborts. As such, it is likely that the value of 1/CT changed abruptly from 0.0058 to zero in the present experiment.
In conclusion, the initial slow growing period of cucumber can be completed if the competing potential of fruit that fl owered early was low. Also, the competing potential can be evaluated by the sum of RGRs of fruit at lower nodes, not by the sum of fruit weight.
ReferencesAloni, B., L. Karni, Z. Zaidman and A.A. Schaffer, 1996. Changes of
carbohydrates in pepper (Capsicum annuum L.) fl owers in relation to their abscission under different shading regimes. Ann. Bot., 78: 163-168.
Bangerth, F. 1989. Dominance among fruits/sinks and the search for a correlative signal. Physiol. Plant., 76: 608-614.
Bertin, N. 1995. Competition for assimilates and fruit position affect fruit set in indeterminate greenhouse tomato. Ann. Bot., 75: 55-65.
Guinn, G. 1974. Abscission of cotton fl oral buds and bolls as infl uenced by factors affecting photosynthesis and respiration. Crop Sci., 14: 291-293.
Hikosaka, S. and N. Sugiyama, 2004. Characteristics of fl ower and fruit development of multi-pistillate type cucumbers. J. Hortic. Sci. & Biotech., 79: 219-222.
Hikosaka, S. and N. Sugiyama, 2005. Effect of fruit-load on growth patterns of fruit at the middle node of gynoecious-type cucumbers. J. Hortic. Sci. & Biotech., 80: 130-134.
Huberman, M., J. Riov, B. Aloni and R. Goren, 1997. Role of ethylene biosynthesis and auxin content and transport in high temperature-induced abscission of pepper reproductive organs. J. Plant Growth Regul., 16: 129-135.
Kinet, J.M. 1977. Effect of light conditions on the development of the infl orescence in tomato. Sci. Hortic., 6: 15-26.
Marcelis, L.F.M. 1994. A simulation model for dry matter partitioning in cucumber. Ann. Bot., 74: 43-52.
Marcelis, L.F.M., E. Heuvelink, L.R. Baan Hofman-Eijer, J. Den Bakker and L.B.Xue, 2004. Flower and fruit abortion in sweet pepper in relation to source and sink strength. J. Exp. Bot., 55: 2261-2268.
Schapendonk, A.H.C.M. and P. Brouwer, 1984. Fruit growth of cucumber in relation to assimilate supply and sink activity. Sci. Hortic., 23: 21-33.
Stephenson, A.G., B. Devlin and J.B. Horton, 1988. The effects of seed number and prior fruit dominance on the pattern of fruit production in Cucurbita pepo (Zucchini squash). Ann. Bot., 62: 653-661.
Takeno, K. and H. Ise, 1992. Parthenocarpic fruit set and endogenous indole-3-acetic acid content in the ovary of Cucumis sativus L. J. Japan. Soc. Hort. Sci., 60: 941-946.
Tamas, I.A., D.H. Wallace, P.M. Ludford and J.L. Ozbun, 1979. Effect of older fruits on abortion and abscisic acid concentration of younger fruits in Phaseolus vulgaris L. Plant Physiol., 64: 620-622.
Tazuke, A. and R. Sakiyama, 1986. Effect of fruit temperature on the growth of cucumber fruits. J. Japan. Soc. Hort. Sci., 59: 745-750.
Turner, A.D. and H.C. Wien, 1994a. Dry matter assimilation and partitioning in pepper cultivars differing in susceptibility to stress-induced bud and fl ower abscission. Ann. Bot., 73: 617-622.
Turner, A.D. and H.C. Wien, 1994b. Photosynthesis, dark respiration and bud sugar concentrations in pepper cultivars differing in susceptibility to stress-induced bud abscission. Ann. Bot., 73: 623-628.
Van Meeteren, U. and H. Van Gelder, 1995. Role of fl ower buds in fl ower bud abscission in Hibiscus. Acta Hortic., 405: 284-289.
Wien, H.C., A.D. Turner and S.F. Yang, 1989. Hormonal basis for low light intensity induced fl ower bud abscission of pepper. J. Amer. Soc. Hort. Sci., 114: 981-985.
Factors affecting fruit abortion in a gynoecious cucumber cultivar 19

Journal of Applied Horticulture, 10(1): 20-23, 2008
Genetics of corolla colour in periwinkle: relationship between genes determining violet, orange-red and magenta corolla
R.N. Kulkarni*, K. Baskaran and Y. Sreevalli
Central Institute of Medicinal and Aromatic Plants, Resource Centre, Allalasandra, Bangalore 560 065, India. *E-mail: [email protected]
AbstractIn periwinkle (Catharanthus roseus), pink, white and red-eyed (white corolla with red centre) are three common corolla colours, which are due to epistatic interaction between two genes R and W. Violet corolla, which is not found commonly in natural populations, is reported to be due to another gene B which blues the pigment in pink genotypes (R- W-). Recently, another gene O and its allele Om have been reported to determine two uncommon corolla colours, orange-red and magenta corolla, respectively. Since, the relationship between genes determining violet, orange-red and magenta corolla was not known, a strain possessing violet corolla and white eye (VI) was crossed with strains possessing orange-red corolla and white eye (OR) and magenta corolla and white eye (MJ-1) to study: (i) the relationship between genes involved in the production of violet, orange-red and magenta corolla, (ii) to study the possibility of producing novel corolla colours and (iii) to determine the validity of the gene interaction models proposed earlier. The F1 plants of both crosses, VI x OR and VI x MJ-1, had violet corolla. The F2 generation of the cross VI x OR segregated into plants with (i) violet corolla, (ii) pink corolla, (iii) orange-red corolla, and (iv) white corolla in the ratio of 45:12:3:4, while the progeny of the backcross F1 x OR segregated into three types of plants, (i) violet corolla, (ii) pink corolla, and (iii) orange-red corolla in the ratio of 2:1:1. The F2 generation of the cross VI x MJ-1 segregated into fi ve kinds of plants viz., (i) violet corolla, (ii) pink corolla, (iii) magenta corolla, (iv) rose corolla, and (v) white corolla in the ratio of 144:48:12:36:16, while the progeny of the backcross, F1 x MJ-1 segregated into four types of plants viz., (i) violet corolla, (ii) magenta corolla, (iii) rose corolla and (iv) pink corolla in the ratio of 1:1:1:1. The results suggested that genes involved B, R, W, O/Om and J were inherited independently and that the gene B blued the corolla pigment in B-RRwwO- genotypes but not in B-RRwwOm-jj and B-RRwwOm-JJ genotypes. No new corolla colours were observed in the studied crosses due to the interaction between genes governing violet, orange-red and magenta corolla. The observed segregation for different corolla colours in the studied crosses was same as that expected from independent segregation and known interactions between the genes involved, validating the earlier proposed models.
Key words: Catharanthus roseus, ornamental plant, medicinal plant, corolla colour, inheritance
IntroductionPeriwinkle [Catharanthus roseus (L.) G. Don] is commercially grown for the extraction of highly valued anti-cancer and anti-hypertension alkaloids, which are present in its leaves and roots, respectively. It is also widely grown as a fl owerbed plant in gardens because of its coloured fl owers and hardy nature. The most commonly observed corolla colours in periwinkle are pink, red-eyed (white corolla with red eye), and white. Apart from these common corolla colours, uncommon corolla colours viz., violet, orange-red, scarlet-red, magenta and rose corolla colours have also been reported. These corolla colours pink, red-eyed, pale pink, white, violet, orange-red, scarlet-red, magenta and rose have been found to be determined by interactions between alleles at seven loci, A, R, W, B, I, O/Om, and J (Flory, 1944; Simmonds, 1960; Milo et al., 1985; Kulkarni et al., 1999; Sreevalli et al., 2002; Kulkarni et al., 2005). Genes A and R were reported to be basic complementary genes without both of which fl owers would have white corolla (Simmonds, 1960). The genotypes A-R-W- produce pink corolla. The R allele produces anthocyanin pigments in the center of the corolla and is epistatic to the W and I alleles, i.e. they function only in the presence of R allele. In the presence of the W allele, the pigment in the eye region spreads
into the corolla limb. The I allele also produces anthocyanin pigments but in smaller quantities, and produces pale pink corolla with red eye in the absence of the W allele (Milo et al., 1985). The gene B is a copigmentation gene which blues the pigment in R-W- genotypes resulting in violet corolla with purple eye and, probably, also in R-ww genotypes resulting in white corolla with purple eye (Simmonds, 1960). A newly identifi ed gene O was found to be responsible for the production of orange-red corolla even in the absence of R allele, the basic gene required for the production of coloured corolla. The gene O, however, did not express in the presence of the W allele. Another gene Om, allelic to the gene O, was found to be responsible for the production of magenta corolla. An inhibitory gene J, which by itself did not produce any corolla colour, partially inhibited gene Om to produce rose corolla. The allele Om, like the O allele, does not express in the presence of the W allele, but unlike the O allele produces magenta corolla only in the presence of the R allele. Heterozygotes O/Om were found to produce scarlet-red corolla (Kulkarni et al., 2005). Another gene E was found to determine the presence or absence of pigmentation in the eye region i.e., in the center of the corolla (Sreevalli et al., 2002).
Periwinkle plants with violet corolla colour are not common
Journal
Appl

in naturally growing populations of periwinkle. Although the genetics of violet corolla colour has been reported earlier (Simmonds, 1960), its relationship with the recently reported genes determining novel corolla colours viz., orange-red and magenta (Kulkarni et al., 2005), is not known. A knowledge of genes and gene interactions involved in the production of different corolla colours in ornamental plants is essential for understanding the biochemical basis of different corolla colours as well as for producing novel corolla colours either by conventional or molecular breeding. (Meyer et al., 1987; Forkmann, 1991; Davies et al., 2003; Zufall and Rausher, 2003). We recently obtained a strain, designated as VI, possessing violet corolla and white eye from a local dealer in horticultural plants and crossed it with strains possessing orange-red corolla and white eye (OR) and magenta corolla and white eye (MJ-1) to study (i) the relationship between genes involved in the production of violet, orange-red and magenta corolla, (ii) to study the possibility of producing novel corolla colours and (iii) to determine the validity of the gene interaction models proposed earlier.
Materials and methodsThree strains, with orange-red, magenta and violet corolla colours, were procured from a local dealer in horticultural plants and were designated as OR, MJ-1 and VI, respectively. All the three strains had white eye and were found to be true-breeding for their respective corolla colours and white eye. The strain VI was crossed reciprocally with strains OR and MJ-1 to determine the relationship between genes determining violet, orange-red and magenta corolla colours. Parental plants were raised in a glass house from seeds obtained by artifi cial self-pollination. Reciprocal crosses were also made as described earlier (Kulkarni et al., 2001). The F1 plants were selfed and also backcrossed to both the parents. Seedlings of parental, F1, F2 and backcross generations were raised from their respective seeds, in perforated plastic trays fi lled with sterilized soil. Three months old seedlings of all six generations were transplanted into perforated polythene bags containing a mixture of soil, sand and farm yard manure in the ratio of 1:1:1 and placed on the benches in the glass house. The plants were scored for corolla colour after they fl owered. Chi-square and G tests were used for testing the goodness of fi t of observed and expected frequencies of different phenotypic classes in the F2 and backcross generations (Sokal and Rohlf, 1981).
Results and discussionCross: VI (violet corolla and white eye) x OR (orange-red corolla and white eye): Since both parental strains had white eye, all plants of F1,
F2 and backcross generations also had white eye. Therefore, only corolla colours of plants of these generations are mentioned in the following. Also since both parental strains had coloured corolla they are expected to be homozygous for both A and R alleles and therefore, the genotype at A locus of different phenotypes observed in the F2 and backcross generations is not mentioned in the following.
The fl owers of F1 plants had violet corolla resembling the parent VI. There were no differences in the corolla colour of F1 plants of reciprocal crosses. The progeny of the F2 generation could be classifi ed into four classes based on their corolla colour, namely, (i) violet corolla, (ii) pink corolla, (iii) orange-red corolla, and (iv)
white corolla. The observed ratio of these four corolla colours fi tted a ratio of 45:12:3:4 both by Chi-square and G tests (Table 1).
The progeny of the backcross, F1 x OR, produced three types of plants namely those with (i) violet corolla, (ii) pink corolla, and (iii) orange-red corolla and their observed frequencies fi tted a ratio of 2:1:1 both by Chi-square and G tests (Table 1). The progeny of the backcross, F1 x VI, produced all plants with violet corolla.
From an earlier study, it was known that the genotype of the parental strain OR with orange-red corolla and white eye is eeRRwwOO and that the O allele produces orange-red corolla even in the absence of R allele but does not express in the presence of W allele (Sreevalli et al., 2002). According to Simmonds (1960), violet corolla is due to the interaction between R, W, and B genes i.e., the gene B blues the pink corolla colour in plants with R-W- genotypes. Therefore, the genotype of the strain VI with violet corolla and white eye should be eeRRBBWW. Thus, the genotypes of parental strains OR and VI with respect to B, R, O, W and E would be eebbRRwwOO and eeBBRRWWoo, respectively. With these genotypes of the parental strains OR and VI and above mentioned interactions between these genes and their independent segregation, the expected frequencies of different genotypes and their phenotypes in F2 and backcross generations are given in Table 1. The observed frequencies of plants with different corolla colours in both F2 and backcross generations fi tted the expected frequencies (Table 1). It was not known if the B gene would blue the orange-red corolla of B-RRwwO- genotypes. If the gene B did not blue the pigment to produce violet corolla colour in B-RRwwO- genotypes, then the expected ratio of different corolla colours in the F2 generation would be 36 violet: 12 pink: 12 orange-red: 4 white. This ratio, however, did not fi t the observed ratio of plants with these corolla colours (χ2
(d.f.3) =13.573, P = <0.01, G (d.f.3) = 17.962, P = <0.01). If the gene B did produce violet corolla in B-RRwwO- genotypes, the expected ratio of corolla colours in the F2 generation would be 45 violet: 12 Pink: 3 orange-red: 4 white. The observed ratio of corolla colours in the F2 generation, as already mentioned above, fi tted this expected ratio (Table 1).
Cross: VI (violet corolla and white eye) x MJ-1 (magenta corolla and white eye): Since the parental strains had white eye, all plants of F1, F2 and backcross generations also had white eye. Therefore, only corolla colours of plants of these generations are mentioned in the following. Also since both parental strains had coloured corolla they are expected to be homozygous for both A and R alleles and therefore, the genotype at A locus of different phenotypes in the F2 and backcross generations is not mentioned in the following.
The F1 plants of this cross also had violet corolla. There were no differences in the corolla colour of F1 plants of reciprocal crosses. In the F2 generation, plants could be classifi ed into fi ve classes, namely, (i) violet corolla, (ii) pink corolla, (iii) magenta corolla, (iv) rose corolla, and (v) white corolla. The observed frequencies of these fi ve kinds of plants fi tted a ratio of 144:48:12:36:16 (Table 2).
The progeny of the backcross, F1 x VI had violet corolla while the progeny of the backcross F1 x MJ-1 segregated into four types of plants viz., those with (i) violet corolla, (ii) magenta corolla, (iii) rose corolla and (iv) pink corolla in the ratio of 1:1:1:1 (Table 2).
Genetics of corolla colour in periwinkle 21

From an earlier study, it was known Om is allelic to O and does not express in the presence of W allele. Further, it was also known that unlike its allele O, it produces magenta corolla only in the presence of R allele, and that an independent gene J, which does not produce any corolla colour on its own, partially inhibits the gene Om to produce rose corolla (Kulkarni et al., 2005). Therefore, the presence of plants with rose corolla in the F2 and backcross (F1 x MJ-1) generations suggested the presence of gene J in the parent VI. Thus, the genotypes of parental strains VI and MJ-1 would be eeBBRRWWooJJ and eebbRRwwOmOmjj, respectively. With the already known interactions between genes R, W, B, Om and J mentioned above and their independent segregation, expected frequencies of different genotypes and their phenotypes in F2 and backcross generations are given in Table 2. The observed frequencies of plants with different corolla colours in both F2 and backcross generations fi tted the expected frequencies (Table 2). The allele B, however, did not appear to blue the magenta corolla colour in B-RRwwOm-jj genotypes. If it were to produce violet corolla colour in genotypes B-RRwwOm-jj, the expected ratio of different corolla colours in F2 would have been 153 violet: 48 pink: 3 magenta: 36 rose: 16 white, which however did not fi t the observed ratio (χ2
(d..f. =4)=80.756, P< 0.001; G(d.f. =4)=39.732 P< 0.001).
The results of the present study revealed that genes B, R, W, O/Om and J involved in the production of violet, pink, orange-red, magenta, rose and white corolla were inherited independently
and that only corolla colours, expected on the basis of the gene interaction models proposed earlier (Simmonds 1960, Kulkarni et al., 2005) for the production of these corolla colours were observed in the crosses VI (violet corolla) x OR (orange-red corolla), and VI (violet corolla) x MJ-1 (magenta corolla), validating the proposed genetic models. It was also evident that the gene B blued the corolla pigment in B-RRwwO- genotypes but not in B-RRwwOm-jj and B-RRwwOm-JJ genotypes and that no new corolla colours were produced due to the interactions between B, R, W, O and Om genes.
AcknowledgementAuthors thank the Director of the Institute for facilities. Financial assistance from Karnataka State Council for Science and Technology, Bangalore, to Ms. Y. Sreevalli, is gratefully acknowledged.
ReferencesDavies, K.M., K.E. Schwinn, S.C. Deroles, D.G. Manson, D.H. Lewis,
S.J. Bloor and J.M. Bradley, 2003. Enhancing anthocyanin production by altering competition for substrate between fl avonol synthase and dihydrofl avonol 4- reductase. Euphytica,131: 259-268.
Flory, W.S. 1944. Inheritance studies of fl ower colour in periwinkle. Proc. Amer. Soc. Hort. Sci., 44: 525-526.
Forkmann, G. 1991. Flavonoids as fl ower pigments: the formation of the natural spectrum and its extension by genetic engineering. Plant Breeding, 106: 1-26.
Table 1. Phenotypes, genotypes, expected proportions, and observed and expected frequencies of plants with different corolla colours in the parental, F1, F2 and backcross generations of the cross VI (violet corolla and white eye) x OR (orange-red corolla and white eye) in periwinkle, according to the proposed modelGeneration Phenotype Genotype Expected proportion Observed frequency Expected frequencyOR Orange-red corolla and white eye eebbRRwwOO 1 All AllVI Violet corolla and white eye eeBBRRWWoo 1 All AllF1 Violet corolla and white eye eeBbRRWwOo 1 All AllF2 Violet corolla and white eye eeB-RRW-O- 27/64
eeB-RRW-oo 9/64eeB-RRwwO- 9/64Total 45/64 70 71.7
Pink corolla and white eye eebbRRW-O- 9/64eebbRRW-oo 3/64Total 12/64 19 19.1
Orange-red corolla and white eye eebbRRwwO- 3/64Total 3/64 5 4.8
White corolla eeB-RRwwoo 3/64eebbRRwwoo 1/64Total 4/64 8 6.4
Total 1 102 102Σχ2
(d.f. 3) for the expected ratio of 45:12:3:4 = 0.448 (P = 0.95 – 0.90), G (d.f.3) = 0.422 (P = 0.95 – 0.90) BackcrossF1 x OR Violet corolla and white eye eeBbRRWwO- 1/4
eeBbRRwwO- 1/4Total 2/4 6 6.5
Pink corolla and white eye eebbRRWwO- 1/4Total 1/4 3 3.25
Orange-red corolla and white eye eebbRRwwO- 1/4Total 1/4 4 3.25
Total 1 13 13Σχ22(d.f. 2) for the expected ratio of 2:1:1 = 0.230 (P = 0.90 – 0.80), G(d.f. 2) = 0.216 (P=0.90-0.80)
22 Genetics of corolla colour in periwinkle

Table 2. Phenotypes, genotypes, expected proportions, and observed and expected frequencies of plants with different corolla colours in the parental, F1, F2 and backcross generations of the cross VI (violet corolla and white eye) x MJ-1 (magenta corolla and white eye) in periwinkle, according to the proposed modelGeneration Phenotype Genotype Expected proportion Observed frequency Expected frequency VI Violet corolla and white eye eeBBRRWWooJJ 1 All All MJ-1 Magenta corolla and white eye eebbRRwwOmOmjj 1 All All F1 Violet corolla and white eye eeBbRRWwOmoJj 1 All All F2 Violet corolla and white eye eeB-RRW-Om-J- 81/256
eeB-RRW-oo J- 27/256eeB- RRW-Om-jj 27/256eeB-RRW-oojj 9/256Total 144/256 156 165.4
Pink corolla and white eye eebbRRW-Om-J- 27/256eebbRRW-ooJ- 9/256eebbRRW-Om-jj 9/256eebbRRW-oojj 3/256Total 48/256 56 55.1
Magenta corolla and white eye eeB-RRwwOm- jj 9/256eebbRRwwOm-jj 3/256Total 12/256 20 13.8
Rose corolla and white eye eeB-RRwwOm-J- 27/256eebbRRwwOm-J- 9/256Total 36/256 40 41.3
White corolla eeB-RRwwooJ- 9/256eeB-RRwwoojj 3/256eebbRRwwooJ- 3/256eebbRRwwoojj 1/256Total 16/256 22 18.4
Total 1 294 294Σχ2
(d.f.4) for the expected ratio of 144:48:12:36:16 = 4.077 (P = 0.50 – 0.30), G(d.f. 4) = 3.706 (P=0.50 – 0.30).BackcrossF1 x MJ-1 Violet corolla and white eye eeBbRRWwOm-Jj 2/16
eeBbRRWwOm-jj 2/16Total 1/4 13 15
Pink corolla and white eye eebbRRWwOm-Jj 2/16eebbRRWwOm-jj 2/16Total 1/4 12 15
Magenta corolla and white eye eebbRRwwOm-jj 2/16eeBbRRwwOm-jj 2/16Total 1/4 16 15
Rose corolla and white eye eebbRRwwOm-Jj 2/16eeBbRRwwOm-Jj 2/16Total 1/4 19 15
Total 1 60 60Σχ2
(d.f.3) for the expected ratio of 1:1:1:1 = 1.998 (P = 0.70 – 0.50), G(d.f. 3) =1.970 (P=0.70 – 0.50)
Kulkarni, R.N., K. Baskaran and N. Suresh, 1999. Inheritance of characters in periwinkle: leaf pubescence and corolla colour. J. Herbs Spices Med. Plants, 6: 85-88.
Kulkarni, R.N., Y. Sreevalli, K. Baskaran and S. Kumar, 2001. The mechanism and inheritance of intrafl ower self-pollination in self-pollinating variant strains of periwinkle. Plant Breeding, 120: 247-250.
Kulkarni, R.N., K. Baskaran and Y. Sreevalli, 2005. Genetics of novel corolla colours in periwinkle. Euphytica, 144: 101-107.
Meyer, P., I. Heidmann, G. Forkmann and H. Saedler, 1987. A new petunia fl ower colour generated by transformation of a mutant with a maize gene. Nature, 330: 677- 678.
Milo, J., A. Levy, N. Akavia, A. Ashri and D. Palevitch, 1985. Inheritance of corolla colour and anthocyanin pigments in periwinkle (Catharanthus roseus [L.] G. Don). Z Pfl anzenzuchtg., 95: 352-360.
Simmonds, N.W. 1960. Flower colour in Lochnera rosea. Heredity,14: 253-261.
Sokal, R.R. and F.J. Rohlf, 1981. Biometry. W.H. Freeman, New York.Sreevalli, Y., R.N. Kulkarni and K. Baskaran, 2002. Inheritance of
fl ower colour in periwinkle: orange-red corolla and white eye. J. Hered., 93: 55-58.
Zufall, R.A. and M.D. Rausher, 2003. The genetic basis of a fl ower color polymorphism in the common morning glory (Ipomoea purpurea). J. Hered., 94: 442-448.
Genetics of corolla colour in periwinkle 23
Journal
ApplJournal of Applied Horticulture, 10(1): 24-29, 2008
Internal quality characterization and isolation of lycopene specifi c genes from tomato
E. Hemaprabha1 and R. Balasaraswathi2
1Department of Plant Molecular Biology and Biotechnology, Centre for Plant Molecular Biology, Tamil Nadu Agricultural University, Coimbatore-641 003, Tamil Nadu, India, (e-mail: [email protected]). 2Department of Biochemistry, Centre for Plant Molecular Biology, Tamil Nadu Agricultural University, Coimbatore-641 003,Tamil Nadu, India.
AbstractTomato (L. esculentum Mill), a popular vegetable in tropics is an excellent source for vitamin A, C, carotenoids and other health related components. It tops the list of industrial crops because of its outstanding processing qualities. It is valued for both its fresh and processed forms. Biochemical analysis in different wild species, varieties and hybrids of tomato showed the wild species, Lycopersicon pimpinellifolium LA 1593 to be a rich source for lycopene specifi c genes. Partial cDNA of lycopene specifi c Phytoene desaturase gene TNAU P was isolated from L. pimpinellifolium LA 1593 by RT-PCR technique. Sequence analysis of the partial cDNA showed 99.6% similarity with already available Phytoene desaturase gene from L. esculentum. Also, the sequence showed considerable homology with Phytoene dehydrogenase, Zeta carotene desaturase and Phytoene desaturase genes from Gentian, Oryza, Momardica, citrus and pea. The high intensity of the amplifi ed product in L. pimpinellifolium coupled with 99.6 % homology to L. esculentum inferred that the level of expression of Phytoene desaturase is more in L. pimpinellifolium. Isolation of Phytoene desaturase genes can be further exploited to produce transgenic plants with increased content of lycopene by transferring the genes from wild species to cultivars.
Key words: Lycopersicon pimpinellifolium, Phytoene desaturase, RT-PCR, lycopene
IntroductionTomato (Lycopersicon esculentum Mill.) is one of the most important vegetable crops grown throughout the world for fresh consumption as well as for processing. In terms of human health, tomato is a major component of daily meals in many countries and constitutes an important source of minerals, vitamins and antioxidant compounds. Tomato fruit quality for fresh consumption is determined by appearance (color, size, shape), fi rmness, texture, dry matter, organoleptic (fl avor) and nutraceutical (health benefi t) properties. The organoleptic quality of tomato is mainly attributed to its aroma volatiles, sugar and acid content, while the nutraceutical quality is defi ned by its mineral, vitamin, carotenoid and fl avonoid content.
Several works have established the role of soluble solid content (SSC), acids and sugars in the taste and fl avour intensity of tomato fruits. It is well known that sweetness has a high correlation with SSC, pH and reducing sugars, and sourness has a high correlation with pH and, to a lesser degree with titrable acidity (TA) (Baldwin et al., 1998). This happens because the major constituents of SSC content in Lycopersicon fruits are all soluble sugars. The pH and TA are good measures of free acid and H-ion concentrations, responsible for the sourness of a solution (Stevans et al., 1977). Moreover SSC, sugars and TA highly contribute to overall fl avour intensity (Baldwin et al., 1998). Nevertheless, SSC, pH and TA are ambiguous variables since the profi le and content of the substances that contribute to them can vary greatly between accessions. These variations can be large if accessions of different species related to cultivated and wild tomato are characterized.
The most abundant phytonutrients in tomatoes are the carotenoids
(Gann et al., 1999). Lycopene is the most prominent carotenoid followed by gamma carotene, zeta-carotene, phytofl uene, phytoene, neurosporene and lutein (Leonardi et al., 2000; Clinton, 1998). Research indicates that lycopene supplements and lycopene-rich foods such as tomato sauce support fertility, promote heart health, protect against Alzheimer’s disease and several types of cancer (Hadley et al., 2002). Tomato also contain other components that are benefi cial to human health including vitamin A, trace elements, fl avonoids, phytosterols, several water soluble vitamins and two other cancer-fi ghting phytochemicals, courmaric and chlorogenic acids (Campbell et al., 2004).
Although tomato is a source of phytonutrients, the levels are not suffi cient to meet out the daily requirements. Also, compared to wild varieties of tomato, current tomato cultivars are relatively low in the important phytochemical, lycopene. Among wild species of tomato L. pimpinellifolium is reported to be a potential source of genes for specifi c antioxidants like lycopene, total phenolics and beta carotene. L. pimpinellifolium, also known as the currant tomato, produces tiny fruits which contain over 40 times more lycopene than domesticated tomatoes (Grolier and Rock, 1998).
The objective of this work is to characterize and classify different tomato genotypes according to their usefulness for internal quality breeding programs of fresh tomato. The variables considered in this study are related to the nutritional and qualitative aspects, emphasizing the sugar, acid composition and carotenoids of the samples. Also isolation and characterization of lycopene specifi c genes was carried out from a wild species L. pimpinellifolium.

Internal quality characterization and isolation of lycopene specifi c genes from tomato 25
Materials and methodsPlant materials: The plant materials used in the present study includes young fruits of Lycopersicon spp. Wild species used in the study included L. peruvianum - EC 52071 obtained from NBPGR, New Delhi and L. pimpinellifolium – AC No LA 1593, LA 1582, LA 1586 obtained from AVRDC, Taiwan. Other local cultivars used in the study included CO 3, PKM 1 and hybrids, Ruchi, COLCRH 1, COLCRH 2, COLCRH 3 collected from Horticultural College and Research Institute, Tamil Nadu Agricultural University, Coimbatore.
Analytical methods: Fresh fruits were homogenized in a laboratory blender. Aliquots were taken to analyse pH, total soluble solids, titrable acidity, vitamin C, total sugars, carotenoids and lycopene. pH was determined by using ELICO LI 127 pH meter. Total soluble solids content was determined by using a ‘Zeiss’ hand refractometer and the results are reported as oBrix. Total sugars and reducing sugars were quantifi ed spectrophotometrically of soluble sugars and available carbohydrates, after hydrolysis of complex carbohydrates with hydrochloric acid using Nelson’s arseno molybdic reagent (Somogyi, 1952). Titrable acidity was measured by titration with 0.1N NaOH and phenolphthalein, and the results were expressed as percent citric acid (A.O.A.C, 1975). Ascorbic acid was measured by titration with 4% oxalic acid and 2,6, dichlorophenol indophenol dye solution and the results were expressed as mg/100g (A.O.A.C, 1975). Total carotenoids and lycopene were quantifi ed spectrophotometrically and expressed as mg/100 g of sample (Ranganna, 1979).
Statistical analysis: An analysis of variance (ANOVA) was performed on the data for different genotypes related to quality parameters, followed by mean separation with Fisher’s protected least significant difference test (PLSD, at P=0.05). All the statistical work were analyzed using AGRES Version 7.01 software to determine differences between means.
Gene isolation studies: For RNA isolation, the frozen pericarp tissues of different wild species/ cultivars/ hybrid tomato genotypes were ground to a fi ne powder in liquid nitrogen, homogenized and total RNA was isolated as described by Chomczynski and Sacchi (1987) using TRIzol reagent. mRNA was isolated separately from total fruit RNA using GenElute™ mRNA Miniprep Kit (Sigma Aldrich Chemicals Pvt. Ltd., USA).
For cloning the cDNA and determining the expression levels, reverse transcription of the isolated fruit mRNA was performed in a 20μl reaction mixture containing: 50 ng of mRNA, RNAse inhibitor 1.0 μL, 0.1 M DTT 1.0 μl, RT buffer (5X) 4.0 μL, 30 mM dNTP mix 2.0 μL, AMV reverse transcriptase 0.5 μL (Bangalore Genei). The samples were incubated at 42°C for 1 h and thereafter the reverse transcriptase was inactivated by heating at 97°C for 5 min.
Gene specifi c primers were designed based on the already available sequence for Phytoene desaturase gene from L. esculentum (Acc. No. X59948 ). The primer sequences were as follows:
TNAU P F : 5’ TGGAGGCAAGGGATGTTC 3’TNAU P R : 5’ GCTTCACCTCGCACTCTTCTTC 3 ‘PCR reactions were performed in a total volume of 50μL containing: First strand cDNA 3.0 μL, 10X PCR buffer 5.0 μL, 30 mM dNTP mix (7.5 mM each) 1.0μL, forward gene specifi c primer (10 pmol/μL) 1.5 μL, reverse gene specifi c primer (10 pmol/μl) 1.5 μL, Taq DNA polymerase (3 U/μL) (Genei) 1.0 μL, sterile water 37.0 μL in 0.2mL thin walled tubes, using thermal cycler (Epppendorf). The PCR cycling profi le was denaturation at 92°C for 1 min, annealing at 60°C for 1 min and an extension at 72°C for 1.5 min for 30 cycles. The amplifi cation products were separated by electrophoresis on 1% agarose gel containing ethidium bromide and photographed using Alpha Imager TM 1220 Documentation and Analysis Systems. The amplifi ed cDNA products obtained in PCR reactions were loaded separately on 1.5% low melting agarose gel, electrophoresed and eluted using GenElute™ Gel Extraction Kit (Sigma Aldrich Chemicals Pvt. Ltd., USA).
Cloning and sequencing of TNAU P cDNA: The eluted 1400 bp cDNA product obtained from RT-PCR using the above gene-specifi c primers were cloned in pTZ57R/T vector (InsT/A clone™ PCR Product Cloning Kit, MBI Fermentas Inc., USA) using T/A cloning strategy. Sequencing of the clone was done using the M13 primer sequences present in the pTZ57R/T vector in a automated sequencer model 3100 version 3.0 (ABI PRISM) at the DBT- supported DNA sequencing facility at University of Delhi South Campus, New Delhi.
Analysis of the sequence data of the cDNA clone was performed using various bioinformatics tools viz., BLAST, BLASTp, CLUSTALW, FASTA, GeneRunner and Treetop.
Sl. No.
Species pH Total soluble solids
(°Brix)
Titrableacidity
(%)
Ascorbic acid
(mg 100g-1)
Total sugars(mg 100g-1)
Reducing sugars
(mg 100g-1)
Carotenoids (mg 100g-1)
Lycopene (mg 100g-1)
1. COLCRH 1 4.18 4.7 0.51 23.38 4.14 3.96 3.91 6.392. COLCRH 2 4.29 4.69 0.52 23.29 4.18 3.43 3.72 6.843. COLCRH 3 4.28 4.65 0.54 22.68 4.16 3.20 3.94 6.614. Ruchi 4.18 4.9 0.52 23.84 4.22 3.06 3.52 6.545. CO 3 4.16 4.74 0.51 23.29 4.32 4.29 3.78 6.426. PKM 1 4.26 4.70 0.54 23.74 4.07 3.34 3.70 6.537. L. pimpinellifolium LA 1593 5.26 5.32 0.30 25.48 3.69 3.87 4.47 7.128. L. pimpinellifolium LA 1582 5.28 5.33 0.32 25.42 3.44 3.62 4.36 7.059. L. pimpinellifolium LA 1586 5.22 5.36 0.33 24.80 3.45 3.75 4.42 7.07 10. L. peruvianum EC 52071 5.38 5.28 0.34 25.97 3.86 3.79 4.54 6.85Grand Mean 4.65 4.97 0.44 24.19 3.93 3.63 4.04 6.74SEd 0.03 0.02 0.02 0.02 0.10 0.03 0.03 0.03CD (P=0.05) 0.06 0.03 0.04 0.05 0.02 0.06 0.08 0.06
Table 1. Quality parameters in different wild species/varieties/hybrid tomato

Results and discussionFruits of different wild species, varieties and hybrids were utilized for estimating different biochemical parameters and the results of the analysis are shown in Table 1.
The pH and titrable acidity (TA) are good measures of free H+ ion concentration responsible for the sourness of a solution (Stevans et al., 1977). A great pH variability was observed (4.16-5.38) and the results clearly separate L. peruvianum from L. pimpinellifolium accessions. Lower pH values were observed for cultivar CO 3 (4.16). Hybrids selected in this study showed pH values in the range of 4.18 - 4.29. Thangam (1998) reported pH values of 4.18 and 4.29 for hybrids Iswaraya Lakshmi and Sadabahar, respectively. However the wild species, L. peruvianum and L. pimpinellifolium species showed a higher pH range (5.22-5.38). Based on the pH values, the wild species, varieties and hybrids can be classifi ed for their acidic nature. All the varieties and hybrids were grouped under ‘acid I’ category (pH 4.6-3.7), as they had pH values between 4.3-4.2. The wild species L. pimpinellifolium was grouped under ‘semi acid’ (pH 5.3-4.6) as all the accessions studied had pH values in the range of 5.3-5.2. L. peruvinaum was grouped under ‘non-acidic’ pH 7.0-5.3 as it had a pH value of 5.4.
The total soluble solids (TSS) is an important trait for processing tomato. The fl avour of the tomato products depends upon the TSS content of the fruits (Ruiz et al., 2004). The TSS of different varieties and hybrids chosen for this study ranged from 4.65- 4.90 °Brix. Raghupathy (2004) reported a TSS of 4.7 °Brix in PKM 1. Thangam (1998) reported a TSS of 4.65 °Brix in the hybrid, IHR-709 and 4.90 in the hybrid, Avinash. Higher mean value of 5.36 °Brix were observed in the small fruited wild species L. pimpinillifolium LA 1586. Other wild species chosen in the study recorded a TSS in the range of 5.28 - 5.33 °Brix.
The nutritive quality of the tomato fruit is also assessed by the acidity and ascorbic acid content. A hybrid with low acid content is preferred for fresh market. But for processing purpose, varieties with high acid content (0.50 %) is desirable. In the present study all varieties and hybrids gave a titrable acidity greater than 0.50 %. Thamarai Selvan (2004) reported acidity values of 0.5 and 0.54 % for CO 3 and PKM 1, respectively.
Minimum level of ascorbic acid needed for processing is 23mg 100g-1 and for canning purposes is 17mg 100g-1. The varieties and hybrid chosen in the study recorded ascorbic acid contents in the range of 24–26 mg 100g-1 indicating their suitability for processing purposes.
Apart from nutritional benefi ts, ascorbic acid is reported to have a role in nematode resistance. The role of ascorbic acid, ascorbate oxidase, hydroxyproline containing proteins imparting root-knot resistance has been reviewed by Arrigoni (1979). It has been reported that increase in the concentration of ascorbic acid leads to enhanced synthesis of hydroxyl proline rich proteins which in turn is refl ected as resistance expression. In the present study, L. peruvianum had the highest ascorbic acid content of about 25.97 mg 100g-1. Also L. peruvianum was found to be resistant to root knot nematode. The increased ascorbic acid content of L. peruvianum may attribute to its increased nematode resistance.
The sugars make an important contribution to the fl avour of
Fig. 1. Amplifi ed Phytoene desaturase cDNA in different genotypes of tomato M- 1 Kb DNA ladder, 1- L. peruvianum EC 52071, 2- L. pimpinellifolium LA 1593,
Fig. 2(a). Confi rmation of recombinant clones by restriction digestion
M- 1 Kb DNA ladderP- Undigested plasmid with insertV- pTZ 57R/T vectorS- Restricted plasmid digested
Fig. 2(b). Confi rmation of recombinant clones by PCR
M- 1 Kb DNA ladder1- PCR amplifi ed products from recombinant plasmid
with Xba ID- Restricted plasmid digested with Xba I and BamH IArrows indicate released cDNA fragments after digestion
3- L. pimpinellifolium LA 1586, 4- L. pimpinellifolium LA 1582, 5- CO3, 6- PKM 1, 7- Ruchi
26 Internal quality characterization and isolation of lycopene specifi c genes from tomato

tomato and generally the reducing sugars contribute at least to 50% of total sugars. In the present study, a total sugar content of 4.32% and a reducing sugar content of 3.96% were observed in cultivar CO 3. High total sugar of 3.94% was reported by Khandaker et al. (1994) in a tomato variety, Pelican. There was not much difference between wild species and other cultivars with respect to total and reducing sugar contents.
Bright red colour of the fruit is one of the quality factors which is due to lycopene content. It is an important attribute for fresh market as well as for processing (Nicolle et al., 2004; Fraser et al., 1994; Ronen et al., 2000). In the present study, the wild species, L. pimpinellifolium LA 1593 had the highest lycopene content (7.12 mg) among all the samples studied. Besides imparting colour, lycopene is also reported to be an antioxidant which protects
against several types of cancer (Hadley et al., 2002; Canene-Adams et al., 2005).
Using fi rst strand cDNA obtained from fruit mRNA of wild species, variety and hybrid fruits as template and with phytoene desaturase specifi c forward (5’) and a reverse (3’) primers the second strand cDNA synthesis was carried out. A cDNA fragment of 1.4 Kb were obtained in all the samples analyzed (Fig. 1). The cDNA fragments were intense in all the L. pimpinellifolium accessions when compared to the varieties CO 3, PKM 1 and hybrid Ruchi lanes and the wild species L. peruvianum EC 52071. The cDNA fragment of 1.4 Kb obtained by RT-PCR using the gene specifi c primers from L. pimpinellifolium LA 1593 was cloned in pTZ57R vector (Invitrogen) using T/A cloning strategy. The recombinant cDNA clone was confi rmed for the presence of insert using restriction
Fig. 3. Multiple sequence alignment of TNAU P with other carotenoid genes
TNAU P -------------SRMHLDLEARDVLGGKVAAWKDDDGDWYETGLHIVFGAYPNIQNLFG 47 PHYTOENE DEHYDROGENASE LGGLSTAKYLADAGHKPILLEARDVLGGKVAAWKDDDGDWYETGLHIFFGAYPNIQNLFG 180GENTIAN PDS LAGLTTAKYLADAGHKPILLEARDVLGGKVAAWKDDDGDWYETGLHIFFGAYPNVQNLFG 176CITRUS PDS LAGLSTAKYLADAGHKPLLLEARDVLGGKVAAWKDGDGNWYETGLHIFFGAYPNIQNLFG 149ORYZA PDS LAGLSTAKYLADAGHKPILLEARDVLGGKIAAWKDEDGDWYETGLHIFFGAYPNIQNLFG 161MOMARDICA PDS LAGLSTAKYLADAGHKHVLLEARDVLGGKVAAWKDNDGDWYETGLHIFFGAYPNLQNLFG 173CAROTENE 7,8 DESATURASE LAGLSCAKYLADAGHTPFVYEARNVLGGKVAAWKDDDGDWYETGLHIFFGAYPNMLQLFK 69PEA PDS ------------------------------------------------------------ZETA CAROTENE DESATURASE VAGLSAAIELVDRGHTVELYEKRKVLGGKVSVWKDSDGDSIESGLHIVFGGYTQLQKYLD 69 TNAU P ELGINDRLQWKEHSMIFAMPSKPGEFSRFDFSEALPAPLNGILAILKNNEMLTWPEKVKF 107PHYTOENE DEHYDROGENASE ELGINDRLQWKEHSMIFAMPSKPGEFSRFDFSEALPAPLNGILAILKNNEMLTWPEKVKF 240GENTIAN PDS ELGINDRLQWKEHSMIFAMPNKPGEFSRFDFAEVLPAPLNGIWAILKNNEMLTWPEKVKF 236CITRUS PDS ELGINDRLQWKEHSMIFAMPNKPGEFSRFDFPEVLPAPLNGILAILRNNEMLTWPEKVKF 209ORYZA PDS ELGINDRLQWKEHSMIFAMPNKPGESSRFDFPETLPAPLNGIWAILRNNEMLTWPEKVKF 221MOMARDICA PDS ELGINDRLQWKEHSMIFAMPNKPGEFSRFDFPEVLPAPINGIWAILRNNEMLTWPEKVKF 233CAROTENE 7,8 DESATURASE ELDIEDRLQWKSHSMIFNQPEEPGTYSRFDFPD-LPAPINGVAAILSNNDMLSWPEKISF 128PEA PDS ----------KEHSMIFAMPSKPGQFSRFDFLEVLPSPLNGIWAILRNNEMLTWPEKIKF 50ZETA CAROTENE DESATURASE KIGAGDNYLWKDHSLIYAESD--GKQSFFKKAN-LPSPWAEVVGGLQADFLTMW-DKISL 125
TNAU P AIGLLPAMLGGQSYVEAQDGISVKDWMRKQGVPDRVTDEVFIAMSKALNFINPDELSMQC 167PHYTOENE DEHYDROGENASE AIGLLPAMLGGQSYVEAQDGISVKDWMRKQGVPDRVTDEVFIAMSKALNFINPDELSMQC 300GENTIAN PDS AIGLVPAILGGQPYVEAQDGITVKDWMRKQGVPDRVTEEVFIAMSKALNFINPDELSMQC 296CITRUS PDS AIGLLPAIIGGQAYVEAQDGLTVQEWMRKQGVPDRVTTEVFIAMSKALNFINPDELSMQC 269ORYZA PDS ALGLLPAMVGGQAYVEAQDGFTVSEWMKKQGVPDRVNDEVFIAMSKALNFINPDELSMQC 281MOMARDICA PDS AIGLLPAMLGGQPYVEAQDGLTVQEWMRNRGVPDRVTTEVFIAMSKALNFINPDELSMQC 293CAROTENE 7,8 DESATURASE GLGLVPAMLRGQNYVEDCDKYSWTEWLKKQNIPERVNDEVFIAMSKALNFIGPDEISSTV 188PEA PDS AIGLLPAILGGQAYVEAQDGVSVKEWMRKQGIPERVTDEVFIAMSKALNFINPDELSMQC 110ZETA CAROTENE DESATURASE IKGLWPALAGNEEYFRSQDHMTYSEWHRLHGASEHSLQKLWRAIALAMNFIEPNVISARP 185
TNAU P ILIALNRFLQEKHGSKMAFLDGNPPERLCMPIG--------------------------- 200
PHYTOENE DEHYDROGENASE ILIALNRFLQEKHGSKMAFLDGNPPERLCMPIVEHIESKGGQVRLNSRIKKIELNEDGSV 360
GENTIAN PDS ILIALNRFLQEKHGSKMAFLDGNPPERLCMPIADHIQSRGGEVRLNSRIQRIELNEDGSV 356
CITRUS PDS ILIALNRFLQEKHGSKMAFLDGNPPERLCLPIVEHIQSLGGEVRLNSRVQKIELNDDGTV 329
ORYZA PDS ILIALNRFLQEKHGSKMAFLDGNPPERLCMPIVDHVRSLGGEVRLNSRIQKIELNPDGTV 341
MOMARDICA PDS ILIALNRFLQEKHGSKMAFLDGNPPERLCEPVVEHIRSLGGEVRLNSRIQKIELNNDGTV 353
CAROTENE 7,8 DESATURASE LLTALNRFLQEKNGSKMAFLDGAPPERLCQPIVDHIRTLGGDVFLNSPLKKINLKEDGSV 248
PEA PDS ILIALNRFLQEKHGSKMAFLDGNPPERLCMPIVDHIQSLGGEVHLNSRIKSIELNDDSTV 170
ZETA CAROTENE DESATURASE ILTIFKYFGTDYAATKFAFFRKNPGDSMIEPMRQYIQSKGGRIFIDARLSRFELNDDKTI 245
Internal quality characterization and isolation of lycopene specifi c genes from tomato 27

digestion and PCR analysis (Fig. 2a, 2b). The confirmed recombinant clone was sequenced and named as TNAU P. The sequences were submitted in National Centre for Biotechnology Information (NCBI), New York, USA. The NCBI genebank accession number for the sequence corresponding to Phytoene desaturase gene, named TNAU P from L. pimpinellifolium is DQ911639. The high level of lycopene in the wild species, L. pimpinellifolium may be due to increased expression of the PDS gene. This view was also supported by the fact that the amplifi ed product of Phytoene desaturase gene on agarose gel was more intense in the wild species, L. pimpinellifolium compared to that of other varieties, hybrids and L. peruvianum.
The sequence annotation results and BLAST analysis of cDNA clone TNAU P from L. pimpinellifolium LA 1593 revealed 99.6% homology to that of the already reported sequence of L. esculentum, Phytoene desaturase gene using BLAST software.
The nucleotide sequence of TNAU P was translated to protein sequence. The protein sequence of TNAU P showed 99% identity with already available Lycopersicon esculentum Phytoene desaturase gene using NCBI-BLASTp software. The multiple sequence alignment of TNAU P showed considerable homology with Phytoene dehydrogenase, carotene 7, 8 desaturase, zeta carotene desaturase and other Phytoene desaturase genes from Gentian, Oryza, Momardica, citrus, pea using DBClustal software (Fig. 3). The results are in agreement with Li et al. (1996), Linden et al. (1994), Pecker et al. (1996) and Bartley (1991) who independently reported the homology and identity of available dicot and monocot Phytoene desaturase gene sequences. Phylogenetic tree constructed using Treetop software
with the multiple sequence alignment data showed two clusters with grouping of TNAU P as one cluster and other desaturase genes in another cluster (Fig. 4). The phylogenetic relationships between various carotene desaturases has been extensively reviewed by Sandmann (1994). Li et al. (1996) reported a similar phylogenetic relationship of maize PDS with available monocot and dicot amino acid sequences and concluded that they have some evolutionary relationships.
Through quality parameters and gene isolation studies, it could be concluded that L. pimpinellifolium LA 1593 is a potential source for lycopene and it could be further exploited for isolation of lycopene specifi c genes.
AcknowledgementAuthors thank Horticultural College and Research Institute (HC&RI), TNAU, for help rendered during biochemical analysis.
ReferencesA.O.A.C. 1975. Offi cial methods of Analysis. Association of offi cial
Analytical chemists, Washington, D.C., U.S.A. 12 th edition. 235 pp.
Arrigoni, O. 1979. A biological defence mechanism in plants. In: Systematics, Biology and Control. Lamberti, F. and Taylor, C. E. (Ed). Academic Press, London, 457-467 pp.
Baldwin, E.A., J.W. Scott, M.A. Einstein, T.M.M. Malundo, R.L. Shewfelt and K.S. Tandon, 1998. Relationship between sensory and instrumental analysis for tomato fl avor. J. Amer. Soc. Hort. Sci., 123: 906-915.
Bartley, G.E., P.V. Viitanen, I. Pecker, D. Chamovitz, J. Hirschberg and P.A. Scolnik, 1991. Molecular cloning and expression in photosynthetic bacteria of a soybean cDNA coding for phytoene desaturase, an enzyme of the carotenoid biosynthesis pathway. PNAS., 88: 6532-6536.
Campbell, J.K., K. Adams, B.L. Lindshield, T.W.M. Boileau, S.K. Clinton and J.W. Erdman, 2004. Tomato phytochemicals and prostate cancer risk. Journal of Nutrition, 134: 3486S-3492S.
Canene-Adams, K., J.K. Campbell, S. Zaripheh, E.H. Jeffery and J.W. Erdman, 2005. The tomato as a functional food. Journal of Nutrition, 135: 1226-1230.
Chomczynski, P. and N. Sacchi, 1987. Single step method of RNA isolation by acid guanidinium thiocyanate-phenol-chloroform extraction. Analytical Biochemistry, 162: 156-159.
Clinton, S. 1998. Lycopene: chemistry, biology and implication for human health and disease. Nutritional Reviews, 56: 35-51.
Fraser, P.D., M.R. Truesdale, C.R. Bird, W. Schuch and P.M. Bramley, 1994. Carotenoid biosynthesis during tomato fruit development. Plant Physiology, 1: 405-413.
Gann, P.H., J. Ma and E. Giovannucci, 1999. Lower prostate cancer risk in men with elevated plasma lycopene levels: results of a prospective analysis. Cancer Research, 59: 1225-30.
Grolier, P. and E. Rock, 1998. The composition of tomato in antioxidants: variations and methodology. Proceedings of Tomato and Health Seminar. Pamplona, Spain, 25-28 pp.
Hadley, C.W., C.M. Elizabeth, J.S. Steven and K.C. Steven, 2002. Tomatoes, lycopene, and prostate cancer: Progress and promise. Experimental Biology and Medicine, 227: 869-880.
Khandaker, M.S., G.D. Joshi, M.J. Salvi and B.B. Sapka, 1994. Comparative study on processing of different tomato (Lycopersicon esculentum Mill) varieties in the konkan region. Vegetable Science, 21: 59-64.
Fig. 4. Phylogenetic grouping of TNAU P with other carotenoid genesTNAU P – Phytoene destaurase gene from L. pimpinellifolium LA 1593Phytoene dehydrogenase Phytoene dehydrogenase from L. esculentumGentian PDS Phytoene desaturase gene from Gentian luteaCitrus PDS Phytoene desaturase gene from Citrus sinensisOryza PDS Phytoene desaturase gene from Oryza sativaMomardica PDS Phytoene desaturase gene from Momardica charantiaCarotene 7,8 desaturase Carotene 7,8 desaturase
TNAU P
Phytoenedehydrogenase
Gentain PDS
Citrus PDS
Momardica PDS
Oryza PDS
Carotene 7,8desaturase
Pea PDS
Zeta carotenedesaturase
0 0.1 0.2 0.3 0.4 0.5 0.6 0.7 0.8 0.9
28 Internal quality characterization and isolation of lycopene specifi c genes from tomato

Leonardi, C., P. Ambrosino, F. Esposito and V. Fogliano, 2000. Antioxidant activity, carotenoid and tomatine contents in different typologies of fresh consumption tomatoes. Journal of Agricultural and Food Chemistry, 48: 4723-4727.
Li, Z., P.D. Matthews, B. Burr and E.T. Wurtzel, 1996. Cloning and characterization of a maize cDNA encoding phytoene desaturase- an enzyme of the carotenoid biosynthetic pathway. Plant Molecular Biology, 30: 269-279.
Linden, H., N. Misawa, T. Saito and G. Sandmann, 1994. A novel carotenoid gene coding for zeta carotene desaturase– Functional expression, sequence and phylogenetic origin. Plant Molecular Biology, 24: 369-379.
Nicolle, C., G. Simon, E. Rock, P. Amouroux and C. Remesy, 2004. Genetic variability infl uences carotenoid, vitamin, phenolic, and mineral content in white, yellow, purple, orange and dark-orange carrot cultivars. Journal of American Society for Horticulture Science, 129: 523-529.
Pecker, I., R. Gubbay, F.X. Cunningham and J. Hirschberg, 1996. Cloning and characterisation of the cDNA for lycopene ß-cyclase from tomato reveals a decrease in its expression during tomato ripening. Plant Molecular Biology, 30: 806-819.
Raghupathy, 2004. Studies on yield and processing quality traits in tomato (L. esculentum Mill). MSc (Hort). TNAU, Coimbatore. 68 p.
Ranganna, S. 1979. Plant pigments. Manual of analysis of fruit and vegetable products. Tata Mc Graw Hill Publishing Company Ltd., New Delhi. 77-79 pp.
Ronen, G., L. Carmel-Goren, D. Zamir and J. Hirschberg, 2000. An alternative pathway to ß-carotene formation in plant chromoplast discovered by map-based cloning of beta and old-gold color mutations in tomato. PNAS., 97: 11102–11107.
Ruiz, F.V., M.C. Sanchez-Mata, M. Camara and M.E. Torija, 2004. Internal quality characterization of fresh tomato fruits. HortScience, 39: 339-345.
Sandmann, G. 1994. Carotenoid biosynthesis in microorganisms and plants. European Journal of Biochemistry, 223: 7-24.
Somogyi, M. 1952. Notes on sugar determination. Journal of Biological Chemistry, 195: 19-23.
Stevans, M.A., A.A. Kaders, A.H. Marjorie and A. Margert, 1977. Genotypic variation for fl avour and composition in fresh market tomato. South American Society of HortScience, 102: 680-689.
Thamarai Selvan, 2004. Studies on induced mutation in tomato (L. esculentum Mill). MSc (Hort). Thesis. TNAU, Coimabtore. 78 p.
Thangam, 1998. Effect of shade on growth, yield and quality of certain tomato (L. esculentum Mill) genotypes. MSc (Hort) thesis, TNAU, Coimabtore. 56p.
Internal quality characterization and isolation of lycopene specifi c genes from tomato 29

Journal of Applied Horticulture, 10(1): 30-35, 2008
Flowering time and concentration of secondary metabolites in fl oral organs of Hypericum perforatum are affected by spectral quality
Tetsuro Nishimura*, Naoka Hashimoto, Sayed M.A. Zobayed and Eiji Goto
Faculty of Horticulture, Chiba University, Matsudo, Chiba 271-8510, Japan. *Email: [email protected]
AbstractHypericin and pseudohypericin are the major bioactive constituents of fl oral parts of Hypericum perforatum L., mainly used for the treatment of neurological disorders and depression. The principle objective of the current study was to evaluate the effect of blue, blue and red mixed, and red light on fl owering time and concentration of hypericin, pseudohypericin and hyperforin in the fl oral tissues of H. perforatum plants. The results revealed that red light promoted fl owering and production of the three major medicinal components, indicating the infl uence of spectral characteristics of light on fl owering of H. perforatum plants. Spectral quality of light was found to be an important factor in controlling the fl owering of H. perforatum plants.
Key words: Hypericum perforatum L., artifi cial light, controlled environment, hyperforin, hypericin, long-day plant, St. John’s wort
capacity, 250 mL), fi lled with the commercial soil mixture. Plants were supported with commercial wires and threads. The plants were cut at the eighth node of the main stem 31 days after sowing to produce lateral branches. Thirty-six days old plants (fresh weight, 498.2 ± 23.0 mg; dry weight, 97.0 ± 5.1 mg) were used as the plant materials. The plants were grown in a controlled environment room with air temperatures of 27/24oC (light/dark period), relative humidity of 60%, and a 16 h d–1 light period provided by a combination of blue fl uorescent lamps (FLR40S-EB/M, Matsushita Electric Industrial Co., Ltd., Osaka, Japan) and red fl uorescent lamps (FLR40S-ER/M, Matsushita Electric Industrial Co., Ltd.). The CO2 concentration was 1000 μmol mol–1 and the photosynthetic photon fl ux (PPF) measured at the soil surface was 250 μmol m–2 s–1.
Treatments and growing conditions: The experiment was designed to evaluate the effects of different light qualities: blue light (B), mixture of blue and red light (BR), and red light (R). Blue and red fl uorescent lamps were used as light sources. The spectral characteristics of each light source are listed in Table 1. There was a notable difference in the red/far-red ratio (R/FR) for the three light sources; however the phytochrome photoequilibrium (Pfr/P) value, which is an indicator of phytochrome response to R/FR, was almost the same. The experiment was conducted in a closed transplant production system (Nae terasu, Taiyo-Kogyo Corp., Tokyo, Japan). Environmental conditions common to all treatments were 27/24oC air temperatures (light/dark period), a 16 h d–1 light period, 60% relative humidity, and 1000 μmol mol–1 CO2 concentration. As the seedlings grew, the distance between the lamps and the growing points of the plants was adjusted to maintain a constant PPF (250 μmol m–2 s–1). The positions of the seedlings within the treatments were rearranged to minimize the variation of PPF. Subirrigation with a nutrient solution (Otsuka hydoponic composition adjusted to EC 1.2 dS/m and pH6.0, Otsuka Chemical Co., Ltd., Osaka, Japan; 4.2 mmol L–1 NO3
–, 1.3 mmol L–1
H2PO4–, 1.0 mmol L–1 Ca2+, 0.38 mmol L–1 Mg2+, 2.2 mmol L–1 K+,
0.4 mmol L–1 NH4+) was applied once a day after germination.
Introduction Plants recognize changes in their light environment by sensing light quality using signal-transducing photoreceptors. Light signals detected by the photoreceptors directly or indirectly affect physiological, morphological, and anatomical features in plants (Goto, 2003). Light quality has been reported to infl uence the fl owering time of many long-day plants (Runkle and Heins, 2006). Under different light-quality cues the proportion of total phytochrome in the active form (phytochrome photoequilibrium) has been reported to regulate fl oral morphogenesis (Weinig, 2002) and fl owering time of several long-day plants (Downs and Thomas, 1990). In other studies, the ratio of R/FR has been shown to alter the fl owering time of many plant species including Antirrhinum majus, Campanula carpatica, Coreopsis grandifl ora, Petunia x hybrida, and Hyoscyamus niger (Runkle and Heins, 2006, and references therein).
Hypericum perforatum L. (St. John’s wort) has been used medicinally for thousands of years. It is a long-day fl owering plant as it fl owers in Europe around St. John’s Day (June 24) and its fl owering was promoted under 16-18 h d–1 light period in controlled environments (S.M.A. Zobayed, unpublished data). The major medicinally important metabolites, hypericin, pseudohypericin and hyperforin, are located mainly in the fl oral tissues of this plant. The current experiments were conducted to evaluate the infl uence of spectral characteristics of light on fl owering time and production of major metabolites in the fl oral tissues of H. perforatum plants.
Materials and methodsPlant material: Seeds of H. perforatum (cv. ‘Standard’, Murakami seed Co., Ltd., Yokohama, Japan) were sown in 128-cell plug seedling trays (Takii Seed Co., Ltd., Kyoto, Japan) fi lled with a commercial soil mixture (Yanmar Agricultural Equipment Co., Ltd., Osaka, Japan). Twenty-one days after sowing, plants were transplanted to individual pots (bore diameter, 7.5 cm;
Journal
Appl

Flowering: The defi nition of fl oral developmental stages was modifi ed from Murch et al. (2002) (Fig. 1). The time courses of the percentage of plants with fl ower buds (stage 1) and the percentage of plants with open fl owers (stage 6) 69 days after sowing were observed. The days from bearing of the fl ower bud (stage 1) to fl owering (defi ned as bud opening) (stage 6) were measured. The number of the fl ower buds, and the fresh and dry weights of fl ower buds were measured 69 days after sowing.
Extraction and determination of hypericin, pseudohypericin, and hyperforin concentrations: Samples representing seven distinct stages of fl ower development in BR treatment and stages 3 and 6 in B and R treatments were collected 69 days after sowing and stored at -85oC until used for the analysis of hypericin, pseudohypericin, and hyperforin as described by Mosaleeyanon et al. (2005). The concentrations of the medicinal components in the sampled fl ower buds were expressed as mg g–1 fl ower bud DW, and the total medicinal content of each fl ower bud (g/fl ower bud) was calculated by multiplying the concentrations of the medicinal components by bud dry weight. The medicinal content of total fl ower buds of each plant (g/plant) was calculated by multiplying
the concentrations of medicinal components in the sampled fl ower buds in BR treatment by the number of fl ower buds per plant in each treatment, assuming that the total medicinal contents of each fl ower bud (g/fl ower bud) during each treatment were same.
Statistical analysis: The experiment was conducted twice with 18 replications. Means and standard errors obtained from replicate experiments were subjected to an analysis of variance (ANOVA). The means were compared using the Tukey-Kramer test at a 5% level of signifi cance. The means of the percentage of plants with fl owers were compared using Fisher’s exact test with Bonferroni correction.
ResultsEffects of light quality on flowering, concentrations of medicinal components and medicinal content of fl ower buds: The percentages of plants with fl ower buds in all light quality treatments rapidly increased from 3 days after observation of the fi rst bud and were saturated within 9 days (Fig. 2). Plants grown in R light produced buds earlier than those grown in B or BR, while plants in the two latter treatments produced their fi rst fl ower buds on the same day. Fifty percent of plants grown in B, BR, and R had buds by 56, 54, and 52 days after sowing, respectively. The time between appearance of the fi rst fl ower bud and fl owering in B, BR, and R treatments was 13, 12, and 12 days, respectively. The percentage of plants with fl owers, 69 days after sowing was highest in R treatment, 1.2 and 2.0 times that of plants grown in BR and B (Fig. 3). The total number of fl ower buds per plant was almost the same under different light conditions (Table 2). At 69 days after sowing, the number of fl ower buds at stages 1, 4, and 6 was similar among the treatments; however the largest number of buds at stages 2, 3, and 5 was found in plants with BR treatment, and stage 7 buds were most abundant in R treatment.
Hypericin concentrations in stage 3 and 6 fl ower buds were similar under different light treatments (Fig. 4). Pseudohypericin concentration in stage 3 fl ower buds was signifi cantly higher in the B treatment than in BR and R treatments, but was similar among the treatments in stage 6 buds. Hyperforin concentration in stage 3 fl ower buds was higher in R treatment than B and BR treatments, but like pseudohypericin was almost the same among the treatments by stage 6.
Dry weight of stage 3 fl ower buds in R treatment was greater than that in B treatment, and almost the same as that in BR treatment
Fig. 1. Developmental stages of H. perforatum fl owers. At stage 1, fl ower buds were entirely green and about 1-3 mm in length. Stage 2 buds had the fi rst visible yellow petals, 3-4 mm. Stage 3 buds had exposed yellow petals with small dark glands on the exposed surface, 4–6 mm. Stage 4 buds were slightly larger with yellow petals and dark glands clearly visible, 6-8 mm. Stage 5 buds were the most mature closed buds with dark glands visible on petals and anthers, over 8 mm. Stage 6 buds consisted of newly open fl owers. Stage 7 fl owers withered.
Table 1. Spectral characteristics of each fl uorescent lampB BR R
Photon fl ux (μmol m– 2 s–1) 300-400 nm (UV) 1.4 1.4 1.3 400-500 nm (B) 198.0 102.1 17.4 500-600 nm (G) 41.8 46.2 50.2 600-700 nm (R) 10.2 101.7 182.4 700-800 nm (FR) 2.1 12.5 22.4B/R (400-500 nm/600-700 nm) 19.5 1.0 0.1R/FR (600-700 nm/700-800 nm) 4.9 8.1 8.1Phytochrome photoequilibrium (Pfr/P)* 0.8 0.8 0.8*The value of phytochrome photoequilibrium was calculated using the equation proposed by Hanyu et al. (1996).
Table 2. The number of fl ower buds of H. perforatum plants grown under different light quality for 33 days (69 days after sowing)
Light quality
Flower developmental stages1 2 3 4 5 6 7
B 4.6 a 3.1 a 3.0 b 1.5 a 0.8 b 0.3 a 1.0 bBR 6.3 a 4.0 a 5.1 a 2.3 a 2.1 a 0.8 a 2.1 bR 6.1 a 1.4 b 2.9 b 2.2 a 1.9 ab 0.8 a 5.1 a
The data are means from 29-31 plants and different letters indicate signifi cant difference at P<0.05 level according to Tukey-Kramer test.
Effects of spectral quality on fl owering and secondary metabolites of H. perforatum 31

(Fig. 5). Dry weight of stage 6 fl ower buds was highest in R treatment. Total content of hypericin and pseudohypericin in stage 3 fl ower buds was almost the same among the treatments (Fig. 6). The hyperforin content in R treatment was higher than that in B treatment, and was almost the same in BR treatment. The contents of the three medicinal components in stage 6 fl ower buds in R treatment were signifi cantly higher than those in B and BR treatments.
The total content of hypericin, pseudohypericin, and hyperforin in fl ower buds of plants 69 days after sowing (μg/plant) was highest in R treatment (Fig. 7).
Quantity and concentration of medicinal components in fl ower buds at different stages: The concentrations of major metabolites in fl oral tissues were explored in plants grown under BR. In this treatment, the dry weight of fl ower buds increased from stage 1-6, and then decreased (Fig. 8). The concentrations of the medicinal components in fl ower buds of plants 69 days after sowing are shown in Fig. 9 (A). Hypericin and pseudohypericin concentrations were highest in stage 2 flower buds, and subsequently declined. Hyperforin concentration was highest in stage 2 buds and subsequently decreased, was constant during
Fig. 4. The hypericin, pseudohypericin, and hyperforin concentrations of stage 3 and 6 fl ower buds of plants grown under different light conditions for 33 days (69 days after sowing). Different letters indicate signifi cant differences between the treatments at P < 0.05, determined by the Tukey-Kramer test. Each bar represents mean ± S.E. of 11-12 (stage 3) and 6-14 (stage 6) replicates.
B
BR
R
0
25
50
75
100
Days after sowing
Per
cent
age
of p
lant
s w
ith fl
ower
bud
45 50 55 60 65 70
Fig. 2. Time courses of the percentage of plants with stage 1 fl ower buds, n=36.
0
20
40
60
80
100
B
Per
cent
age
of th
e pl
ants
with
flow
ers
BR R
b
a b
a
Fig. 3. Percentage of plants with fl owers grown under different light conditions for 33 days (69 days after sowing). Different letters indicate signifi cant differences between the treatments at P < 0.05, determined by the Fisher’s Exact test with Bonferroni correction. Each bar represents mean ± S.E. of 36 replicates.
32 Effects of spectral quality on fl owering and secondary metabolites of H. perforatum
0.0
0.4
0.8
1.2
1.6
2.0B BR
R
0
5
10
15
20
25
30
0
10
20
30
40
50
60
70
80
3 6
Pse
udoh
yper
icin
con
cent
ratio
n (m
g g
flow
er b
ud D
W)
-1H
yper
icin
con
cent
ratio
n (m
g g
flow
er b
ud D
W)
-1
Flower developments stage
Hyp
erfo
rmin
con
cent
ratio
n (m
g g
flow
er b
ud D
W)
-1
aa
a
a
z
z
z
z
z
z
z
z
z
a
b
b
a
b
ab

stages 3-6, and then increased again. The medicinal contents 69 days after sowing in BR treatment are shown in Fig. 9 (B). Hypericin and pseudohypericin contents in stage 1-4 fl ower buds increased during fl ower development, and remained high in stages 4-7. Hyperforin content increased throughout fl ower development.
DiscussionThe present experiments were undertaken to evaluate the infl uence of spectral characteristics of light on fl owering of H. perforatum plants without altering the phytochrome photoequilibrium values, or the PPF at the growing points of plants. We found that R light promoted fl owering in H. perforatum: plants grown in R light developed fl ower buds earlier than those grown in B or BR, and the percentage of plants with fl owers in R treatment was higher than that in B and BR treatments. The number of days from appearance of the fi rst fl ower bud to fl owering in B, BR, and R treatments were almost the same; therefore we concluded that the pace of fl ower development was not infl uenced by light quality.
The fl oral transition in Arabidopsis, a quantitative long-day plant, is regulated by at least four fl owering pathways: the photoperiod response, the vernalization response, the autonomous pathway, and the gibberellin (GA)-dependent pathway (Mouradov et al., 2002). H. perforatum may be a long-day plant because it fl owers around St. John’s Day (June 24) in Europe, and its fl owering was promoted under a 16-18 h d–1 light period in a controlled environment (S.M.A. Zobayed, unpublished data). Furthermore, fl owering of H. perforatum plants does not require vernalization. Therefore, phytochrome may have a role in the fl owering time of H. perforatum plants. Many studies on the control of fl owering by light quality focus on promotion of fl owering by a decrease in R/FR, which in turn decreases the value of Pfr/P. In the current study, although R/FR was different among the three light quality treatments, the value of Pfr/P was the same; therefore the results of the current study cannot be explained by any fl owering pathway known to date. Therefore we deduced that proportions of blue
Fig. 6. The hypericin, pseudohypericin, and hyperforin contents of stage 3 and 6 fl ower buds of plants grown under different light conditions for 33 days (69 days after sowing). Different letters indicate signifi cant differences between the treatments at P < 0.05, determined by the Tukey-Kramer test. Each bar represents mean ± S.E. of 24-27 (stage 3) and 8-19 (stage 6) replicates, respectively.
Fig. 5. Dry weights of stage 3 and 6 fl ower buds of plants grown under different light conditions for 33 days (69 days after sowing). Different letters indicate signifi cant differences between the treatments at P < 0.05, determined by the Tukey-Kramer test. Each bar represents mean ± S. E. of 24-27 (stage 3) and 8-19 (stage 6) replicates, respectively.
Flower developmental stage
0
2
4
6
8
10
3 6
Dry
wei
ght (
mg/
flow
er b
ud) B
BRR
b
aa
x
y
z
Effects of spectral quality on fl owering and secondary metabolites of H. perforatum 33
0
2
4
6
8
10
12B
BR
R
0
20
40
60
80
100
120
200
400
600
800
03 6
Pse
udoh
yper
icin
con
tent
(g
flow
er b
ud)
-1H
yper
icin
con
tent
(g
flow
er b
ud)
-1H
yper
forin
con
tent
(g
flow
er b
ud)
-1
aa a
a a a
aa
b
x
x
y
y
y
y
z
z
z
Flower developmental stage

or red light to PPF and blue/red ratio (B/R) may affect several points in the fl owering pathway.
The hypericin, pseudohypericin and hyperforin concentrations of H. perforatum grown in a greenhouse were previously reported to be highest in yellow flower buds about 3-4 mm (flower developmental stage 2) with a subsequent decline (Murch et al., 2002). Our fi ndings (Fig. 9) were in agreement with the previous results. Hypericin and pseudohypericin accumulate in signifi cant quantities in dark glands. Stamens have higher concentrations of hypericin and pseudohypericin than any other organ of H.
Fig. 9. Hypericin, pseudohypericin, and hyperforin concentrations (A) and contents (B) in the fl ower buds of plants grown in BR treatment for 33 days (69 days after sowing). Each bar represents mean ± S.E. of 7-13 replicates.
Fig. 8. Dry weight of fl ower buds of plants grown in BR treatment for 33 days (69 days after sowing). Error bars represents ± S.E. of 13–27 replicates.
Fig. 7. The hypericin, pseudohypericin, and hyperforin contents of total fl ower buds of plants grown under different light conditions for 33 days (69 days after sowing). The contents of total fl ower buds were calculated by multiplying the medicinal content of each fl ower bud in BR treatment by the number of fl ower buds per plant in each treatment. Plants without fl ower buds were not included in the calculation. Different letters indicate signifi cant differences between the treatments at P < 0.05, determined by the Tukey-Kramer test. Each bar represents mean ± S.E. of 29-31 replicates.
perforatum plants and also contain a signifi cant number of dark glands (Zobayed et al., 2006). The stamen anthers are formed during fl oral stages 1 to 2. The concentrations of hypericin and pseudohypericin in stage 2 fl ower buds were relatively high because the dry weight of other fl oral organs than stamens may be smaller at stage 2 than at stages 3 to 7. Therefore, decreasing hypericin and pseudohypericin concentrations from stages 2 to 7 is attributable to the increase in dry weight of the fl ower organs other than the stamens through fl ower development.
The stamens of fl ower buds develop during stage 1 to 4, and then stop developing (Zobayed et al., 2006). Accordingly, the hypericin and pseudohypericin contents of fl ower buds increased during stages 1 to 4, and then were saturated. In contrast, the hyperforin content of fl ower buds continued to increase throughout fl ower development. The mechanism of hyperforin synthesis is little known, and differs from that of hypericin and pseudohypericin. Hyperforin may not accumulate in the dark glands; and hyperforin content of fl ower buds does not appear to be associated with stamen development.
34 Effects of spectral quality on fl owering and secondary metabolites of H. perforatum
0
20
40
60
80
100
0
200
400
600
800
1000
1200
0
1000
2000
3000
4000
5000
6000
7000
B BR R
Pse
udoh
yper
icin
con
tent
of
tota
l flo
wer
bud
s (
g pl
ant
)-1
Hyp
eric
in c
onte
nt o
f tot
al
flow
er b
uds
( p
lant
)g
-1H
yper
forin
con
tent
of
tota
l flo
wer
bud
s (
g pl
ant
)-1
ab
ab
b
a
a
a
a
a
b
0
2
4
6
8
10
1 2 3 4 5 6 7Flower developmental stage
Dry
wei
ght (
mg
flow
er b
ud)
-1
0
5
10
15
20
25
1 2 3 4 5 6 7
Hyp
eric
in an
d ps
eudo
hype
ricin
conc
.
(mg
g
flow
er bu
d D
W)
020406080100120140
Hyp
erfo
rinco
nc.
(mg
g–– 11
flow
erbu
dD
W)
0
20
40
60
80
100
1 2 3 4 5 6 7
Hyp
eric
in
and
pseu
dohy
peric
inco
nten
ts
0
200
400
600
800
1000
Hyp
erfo
rinco
nten
tg
flow
er b
ud)
-1
g flo
wer
bud
)-1
HypericinPseudohypericnHyperforin
Flower developmental stage
A
B

Although the concentration of medicinal components in stage 6 fl owers were almost the same under different light quality treatments; at stage 3, the hypericin and pseudohypericin concentrations were higher in B treatment, while the hyperforin concentration was higher in R treatment. The dry weight of stage 3 fl ower buds was higher in R treatment than in B treatment. The amount of anther tissue which accumulated hypericin and pseudohypericin in signifi cant quantities may be relatively low, and the amount of any other fl oral organs which accumulated hyperforin may be relatively high. Calculating the medicinal contents in flower buds (g/flower bud) by multiplying the concentrations of medicinal components by fl ower bud dry weight, we demonstrated that the medicinal contents were highest in R treatment compared to those in B and BR treatments (Fig. 6).
The hypericin, pseudohypericin, and hyperforin contents of total fl ower buds of plants 69 days after sowing were higher in R treatment than those in B and BR treatments. Therefore, red light promoted the development of fl ower buds and produced fl ower buds with a higher content of secondary metabolites compared to blue light under constant Pfr/P values. We also conclude that spectral quality of light is an important factor in controlling the fl owering of H. perforatum plants.
ReferencesDowns, R.J. and J.F. Thomas, 1990. Morphological and reproductive
development of soybeans under artifi cial conditions. Biotronics, 19: 19-32.
Goto, E. 2003. Effects of light quality on growth of crop plants under artifi cial lighting. Environ. Control Biol., 41: 121-132.
Hanyu, H., K. Shoji and S. Ji, 1996. Evaluation of light quality variation through supplement of far-red light and the difference in the effects on growth of a pole-type and a bush-type kidney bean, Phaseolus vulgaris L. Environ. Control Biol., 34: 267-275.
Mosaleeyanon, K., S.M.A. Zobayed, F. Afreen and T. Kozai, 2005. Relationships between net photosynthetic rate and secondary metabolite contents in St. John’s wort. Plant Sci., 169: 523-531.
Mouradov, A., F. Cremer and G. Coupland, 2002. Control of fl owering time: interacting pathways as a basis for diversity, Plant Cell, 14: S111-S130.
Murch, S.J., H.P.V. Rupasinghe and P.K. Saxena, 2002. An in vitro and hydroponic growing system for hypericin, pseudohypericin, and hyperforin production of St. John’s wort (Hypericum perforatum cv New stem). Planta Med., 68: 1108-1112.
Runkle, E.S. and R.D. Heins, 2006. Manipulating the light environment to control fl owering and morphogenesis of herbaceous plants. Acta Hortic., 711: 51-59.
Weinig, C. 2002. Phytochrome photoreceptors mediate plasticity to light quality in fl owers of the Brassicaceae. Am. J. Bot., 89: 230-235.
Zobayed, S.M.A., F. Afreen, E. Goto and T. Kozai, 2006. Plant-Environment Interactions: Accumulation of hypericin in dark glands of Hypericum perforatum. Ann. Bot., 98: 793-804.
Effects of spectral quality on fl owering and secondary metabolites of H. perforatum 35

Journal of Applied Horticulture, 10(1): 36-39, 2008
Phenolics and parthenolide levels in feverfew (Tanacetum parthenium) are inversely affected by environmental factors
Jorge M. Fonseca1*, James W. Rushing2, Nihal C. Rajapakse1, Ronald L. Thomas3 and Melissa B. Riley4
1&2Department of Horticulture, Clemson University, Clemson, SC 29634-0375 USA; Coastal Research and Education Center, Charleston, SC 29414-5332 USA; 3Department of Packaging Sciences, Clemson University. Clemson, USA; 4Department of Plant Pathology and Physiology, Clemson University, USA. *Current address: Jorge M. Fonseca: The University of Arizona, Yuma Agricultural Center, Yuma, AZ 85364-9623 US. Fax: 928 782 1940. Email: [email protected]
AbstractFeverfew (Tanacetum parthenium [L.] Schultz-Bip., Asteraceae) products have shown high variability in the market. The objective of this study was to determine whether environmental factors affect the composition of key phytochemicals in feverfew. Plants of feverfew were exposed to water stress in greenhouse and commercial fi eld conditions. The highest yield of parthenolide (PRT) was found in plants that received reduced-water regimes. Phenolics concentration was higher in plants grown under adequate-water conditions. The effect of time of harvest on PRT concentration and phenolics content was also investigated. Increased PRT was found during afternoon hours whereas total phenolic compounds decreased during the photoperiod and increased at night. When plants were exposed to artifi cial light during night hours, the phenolics content remained low. Our results revealed that manipulating the environment to favour increased accumulation of PRT resulted in a decline of phenolics content in feverfew. These fi ndings have implications on standardization of herbal products.
Key words: Asteraceae, feverfew, Tanacetum parthenium, time of harvest, water stress, parthenolide, phenolics
IntroductionProducts of feverfew (Tanacetum parthenium [L.] Schultz-Bip., Asteraceae), an herb regarded as an effective prophylactic treatment of migraine, rheumatoid arthritis and menstrual cramps (Grauds et al., 1995), have shown large variability of parthenolide (PRT) content, a sesquiterpene lactone commonly associated with the medicinal effects (Awang et al., 1991).
In addition to PRT, certain phenolics, notably tanetin, a lipophilic fl avonoid, contribute to the medicinal value of feverfew (Williams et al., 1995). The major fl avonols and fl avone methyl ethers found in feverfew have been shown to inhibit the arachidonic acid pathway (Williams et al., 1999). Phenolic content may be another criterion for assessment of commercial quality of feverfew.
Evidence indicating that pre-harvest factors infl uence fi nal quality of herbs has been reported. In various plants, environmental stress has increased the accumulation of phenolics (Keinanen, 1999). Secondary metabolites are prone to diurnal fl uctuation (Veit et al., 1996), a response likely due to the effects of light intensity on carbon partition (Stoker et al., 1998; Middleton et al., 1994). It is uncertain whether PRT or any other secondary metabolite in feverfew fl uctuates during the day. Water stress increases the production of jasmonic acid followed by increase of abscisic acid (ABA), which induces stomata closure (Wasttenack and Parthier, 1997) and sesquiterpene accumulation (Singh et al., 1998), and may interfere with tannin yields (Horner, 1998). Our early work showed that ABA and PRT biosynthesis are connected and both increase during or after a wilt event (Fonseca et al., 2005) prompted us to determine whether PRT and other secondary
metabolites of interest fl uctuate with environmental conditions in a similar fashion.
It is possible that pre-harvest conditions infl uence concentration of key metabolites in feverfew, however, research on PRT and phenolics dynamics as a response of changing environments is lacking. Thus, the objective of this study was to evaluate the effect of water stress and time of day of harvest on PRT and total phenolics content in feverfew.
Materials and MethodsEffect of water stress: Feverfew seeds (Richter’s Seed Co. Ontario, Canada) were germinated in 60 mL-cell trays under an intermittent mist and were transferred to 4 L pots six weeks after germination. Four months after germination, plants were divided in two groups, one continuing with daily watering, and the other group receiving water only after a wilt event. Typically, plants were allowed to dry for 4-6 days until they wilted (-4.47 to –8.65 MPa). After wilt, plants were watered daily to run off as the controls (-1.94 to -2.07 MPa) for fi ve days before exposing the plants to water withdrawal again. The plants were subjected to a total of three wilt events and harvested before the onset of the fourth water stress event. The experiment was repeated once and included treatments consisting of twelve plants, harvested during summer months. Maximum irradiance of visible light, measured with a LI-250 Quantum meter (Licor Inc. Lincoln, NE, USA), was 461.4 μmol s-1 m-2.
The effect of water stress on PRT and total phenolics content in feverfew was also evaluated in a grower’s fi eld. Feverfew plants
Journal
Appl

were grown for 5 months with and without drip irrigation at a commercial production site near Kingsburg, SC, USA, from November to April. Plants were harvested when approximately 5 percent of the plants had begun to bloom. Batches of 8 non-fl owering plants from each fi eld (non-irrigated and irrigated) were randomly selected and harvested four times during daytime. Water potential in soil and leaves, photosynthetic radiation (PAR) and temperature at the harvest site are provided in Table 1.
Effect of time of day of harvest: Plants were grown in greenhouse following cultural practices described earlier. Five months after planting, plants were harvested at four different times of the day (5 AM, 9 AM, 1 PM, 5 PM) during January and February. To evaluate the effect of light during night hours plants harvested at 5 AM were exposed to light (8 μmol s-1 m-2) for 8 hours (starting at 9 PM) and compared with non-irradiated plants. The trial included harvest of three plants per treatment per each of four different days. The experiment was arranged in a randomized complete block design and it was conducted twice.
Analysis of parthenolide and total phenolics: In preparation for PRT analysis, all plant tissue above ground were harvested and dried in a conventional oven at 50 °C until moisture content reached 4-6% and then ground with a coffee grinder. The powder was sieved and particles of <500 μm size were used for immediate analysis. Samples of 150 mg were combined with 10 mL 90% acetonitrile for 10 min and extracted using the bottle stirring method. Aliquots of each extraction solution were taken from supernatant, fi ltered through 0.45 PTFE μm membranes and 10 μL injected onto a RP-HPLC system (Waters ™ 1525 pump), equipped with a C-18, 5 μm column (Waters Symmetry ®) of 150 x 4.6 mm dimensions. The injections were performed in duplicate. Mobile phase was an isocratic 55% acetonitrile: 45% water per 8 min at 1.5 mL/min. The peaks were analyzed at 210 nm using an ultraviolet detector.
Total phenolic content was measured using the Folin Ciocalteau procedure (Singleton and Rossi, 1965) modifi ed by Kähkhönen et al. (1999). The extraction was performed by combining 50 mg feverfew powder samples with 10 ml 80% methanol with
stirring for 10 min. Samples were vortexed for 1 min before a 200 μL aliquot was taken from the supernatant. One mL of Folin-Ciocalteu reagent (2N, Sigma) was added to the 200 μL sample. After 3 minutes, 0.8 mL of sodium carbonate (7.5%) was added and the mixture was allowed to stand for 30 min. Absorption was measured at 765 nm using a Spec 20® spectrophotometer (Thermo Spectronic, Rochester, NY, USA). Total phenolics were expressed as gallic acid units. A multipoint linear curve was obtained with gallic acid standard (Sigma) ranging from 20 to 400 μg/mL. Two standards (20 and 100 μg) were included for comparison with each set of samples analyzed.
Statistical analysis: Experiments were arranged in a completely randomized design. Data were subjected to analysis of variance (ANOVA) at P ≤ 0.05 to determine statistical signifi cance. Mean comparisons were conducted using Fisher’s Protected LSD Method at P ≤ 0.05 (SAS Institute, Cary, NC).
Results and discussionPlants under water stress had higher PRT levels than plants receiving water daily regardless of the growing environment, greenhouse or commercial fi eld. Unlike the pattern observed with PRT, plants in greenhouse conditions under reduced-water conditions had lower phenolic content than plants that received continuous irrigation, but no difference was observed in plants grown in the fi eld (Table 2).
Unlike our previous work (Fonseca et al., 2005), in this study the plants were harvested after subjecting the plants for extended time to water stress, and the leaves were not fully turgid at the moment of the harvest. The results from this study revealed that water stress in commercial fi eld conditions enhance PRT content in feverfew, however, the plants showed 20-35% reduced dry weight (data not shown), discouraging fi eld production without irrigation systems. The dry weight of plants grown in pots, receiving only three wilt events, was reduced by less than 5% (data not shown) which encourages studies involving the evaluation of mild stress conditions. It is possible that regulated water stress programs increase metabolites concentration without changing quantities of phytochemicals per area. The total phenolics levels found in feverfew are similar to those reported for other herbs and medicinal plants (Kähkönen et al., 1999), however, to our knowledge this is the fi rst time that phenolics content variability in a medicinal plant is associated with a single agricultural practice.
Plants harvested during the afternoon contained signifi cantly more PRT than plants harvested in the morning. Plants harvested at 5 PM had the highest PRT. The 5 AM harvest had the lowest PRT
Table 1. Conditions at 11 am in a commercial trial that evaluated the effect of water stress on parthenolide concentration in feverfewFactors Non-Irrigated IrrigatedTemperature
Sunlight
Water potential soil
Water potential plant
26.00
1645.80
-70.46
-3.63
26.00
1645.80
-0.04
-1.11Units are °C for temperature, μmol s-1 m-2 for sunlight intensity and P Ma for water potential.
Table 2. Effect of water stress on parthenolide and phenolics content in feverfew grown in greenhouse and fi eld conditionsEnvironment Irrigation regime Parthenolide content
(g kg-1 dry weight)Phenolics content
(g GAC kg-1 dry weight)Greenhouse Daily watering 0.47 a 64.77 a
Reduced watering 1.89 b 33.45 bLSD (P ≤ 0.05) 1.36 24.15
Field – commercial production
Drip irrigation 5.38 a 110.50No irrigation 6.76 b 93.85LSD (P ≤ 0.05) 1.31 49.33
Values are the averages of 16 samples taken during the day of harvest. Different letters within the same column and environment indicate signifi cant differences between treatments.
Phenolics and parthenolide content in Feverfew 37

concentration. Although no signifi cant difference was detected, when 5 AM plants were exposed to light PRT levels averaged two fold higher than those in non-irradiated plants (Fig. 1). In contrast, the phenolic concentration was higher during night time, decreasing during daylight. At 5 AM harvest, the plants exposed to light had signifi cantly less concentration of phenolics (Fig. 2). These results show that light prior to harvest infl uences the levels of PRT and total phenolics in feverfew. The pattern observed with phenolic levels, increasing in the dark and decreasing during daylight or with artifi cial light irradiance, has been observed in other plants (Veit et al., 1996; Burns et al., 2002).
It is interesting that the concentration of PRT in plants grown during the winter (the fi eld experiment and the study of time of day), which are normally shorter and bushy, was markedly higher than in plants grown in the summer (experiment of water stress in greenhouse conditions). Moreover, it has been observed that vegetative plants accumulate higher PRT levels than reproductive plants (Hendriks et al., 1997), which normally bloom during the summer. There may be a synergistic interaction between long day conditions and environmental factors.
Overall results in this study showed that environmental factors may produce opposite effects among secondary metabolites in medicinal plants and this was clearly observed between PRT and phenolic content in feverfew. The accumulation of secondary metabolites is driven by the availability of excess carbon. When growth is reduced due to stress, more carbon becomes available
for secondary metabolism and, as the plant adjusts to the specifi c stress the accumulation of some metabolites is favored over others (Tuomi et al., 1998). Phenolics fl uctuate daily in part because the plant produces them in preparation to periods of high UV sunlight irradiance (Middleton and Teramura, 1994). Moreover, our results with artifi cial light revealed that visible light functions as an external signal that turns on and off the phenolic production mechanism in feverfew, regardless of UV light incidence.
The results obtained in this study demonstrate that medicinal or “commercial” quality of feverfew is affected by environmental factors. The visible light prior to harvest and the water regime during the plant growth are crucial in altering the content of PRT and phenolics in feverfew. Our results revealed however, that practices that increased PRT result in lower total phenolic content. The many interactions among phytochemicals, and the rapid adjustment of the plant to changing environments, involve a major decision of which key metabolites to target, knowing that this will potentially carry a “trade off” including a decrease in the content of other metabolites. Clearly, manipulation of production and handling protocols can alter secondary metabolism of feverfew but studies are needed to verify if this holds true for other medicinal plants as well. Such studies are crucial for the development of appropriate regulations for herbal product quality.
AcknowledgmentsThis work was partially supported by USDA, the Wade Stackhouse Foundation, Clemson, SC and CONICIT-MICIT, Costa Rica.
ReferencesAwang, D.V.C., B.A. Dawson and D.G. Kindack, 1991. Parthenolide
content of feverfew (Tanacetum parthenium) assessed by HPLC and H-NMR spectroscopy. Journal of Natural Products, 54: 1516-1521.
Burns, A.E., R.M. Gleadow and I.E. Woodrow, 2002. Light alters the allocation of nitrogen to cyanogenic glycosides in Eucaliptus cladocalyx. Oecologia, 133: 288-294.
Fonseca, J.M., J.W. Rushing, N.C. Rajapakse, R.L.Thomas and M.B. Riley, 2005. Parthenolide and abscisic acid synthesis in feverfew are associated but environmental factors affect them dissimilarly. Journal of Plant Physiology, 162: 485-494.
Grauds, C. 1995. Treating migraine and arthritis with feverfew. Pharmacy Times, 61: 32-34.
Hendriks, K., Y. Anderson-Wildeboer, G. Engels, R. Gos and H.J. Woerdenbag, 1997. The content of parthenolide and its yield per plant during the growth of Tanacetum parthenium. Planta Medica, 63: 356-359.
Horner, J.D. 1998. Nonlinear effects of water defi cits on foliar tannin concentration. Biochemical Systematics and Ecology, 18: 211-213.
Kähkönen, M.P., A.I. Hopia, H.J. Vuorela, J. Rauha, K. Pihlaja, T.S. Kujala and M. Heinonen, 1999. Antioxidant activity of plant extracts containing phenolic compounds. Journal of Agriculture and Food Chemistry, 47: 3954-3962.
Keinanen, M. 1999. Trade-offs in phenolic metabolism of silver birch: effects of fertilization, defoliation, and genotype. Ecology, 9: 1-27.
Middleton, E.M. and A.H.Teramura, 1994. Understanding photosynthesis, pigment and growth responses induced by UV-B and UV-A irradiances. Photochemistry and Photobiology, 60: 38-45.
Singh, G., J. Gavrieli, J.S. Oakey and W.R. Curtis, 1998. Interaction of methyl jasmonate, wounding and fungal elicitation during sesquiterpene induction in Hyoscyamus muticus in root cultures. Plant Reproduction, 17: 391-395.
0
1
2
3
4
5
6
5:00AM 9:00AM 1:00PM 5:00PM 5:00AM-LTime of day
Part
heno
lide(
gkg
-1d w
)
5:00AM 9:00AM 1:00PM 5:00PM 5:00AM-LTime of day
0
10
20
30
40
50
60
70
80
Tota
lPhe
nolic
s(g
GA
Ckg
-1dw
)
Fig. 1. Effect of time of day of harvest on parthenolide content in feverfew. “L” means plants exposed to artifi cial light during night hours (5 PM to 5 AM). Values are the average of 12 samples. Error bars indicate S.E.
Fig. 2. The effect of time of day of harvest on total phenolics content in feverfew. “L” means plants exposed to artifi cial light during night hours (5 PM to 5 AM). Values are the averages of 12 samples. Error bars indicate S.E.
38 Phenolics and parthenolide content in Feverfew

Singleton, V.L. and J.A. Rossi, 1965. Colorimetry of total phenolics with phosphomolybdicphosphotungstic acid reagents. American Journal of Enology and Viticulture, 16: 144-158.
Stoker, K.G., D.T. Cooke and D.J. Hill, 1998. Infl uence of light on natural indigo production from woad (Isatis tinctoria). Plant Growth Regulation, 25: 181-185.
Tuomi, J., P. Niemela, E. Haukioja, S. Siren and S. Neuvonen. 1998. Nutrient stress: an explanation for plant anti-herbivore responses to defoliation. Oecologia, 61: 208-210.
Veit, M., W. Bilger, T. Mulhlbauer, W. Brummet and K. Winter, 1996.
Diurnal changes in fl avonoids. Journal of Plant Physiology, 148: 478-482.
Wasttenack, C. and B. Parthier, 1997. Jasmonate-signalled plant gene expression. Trends in Plant Sciences, 2: 302-307.
Williams, C., J.R.S. Hoult, J.B. Harborne, J. Greenham and J. Eagles, 1995. A biologically active lipophilic fl avonol from Tanacetum parthenium. Phytochemistry, 38: 267-270.
Williams, C.A., J.B. Harborne and J. Eagles, 1999. Variations in lipophilic and polar fl avonoids in the genus Tanacetum. Phytochemistry, 52: 1301-1306.
Phenolics and parthenolide content in Feverfew 39

Journal of Applied Horticulture, 10(1): 40-43, 2008
Improved plant regeneration in cowpea through shoot meristem
Muthusamy Manoharan*, Sharmin Khan and James O. Garner
Department of Agriculture, University of Arkansas at Pine Bluff, Pine Bluff, AR 71601, USA.*E-mail: [email protected]
AbstractCowpea is a highly recalcitrant nutrient-rich leguminous vegetable crop. Efforts to genetically transform cowpea with insect-resistant genes remains a challenging task due to lack of an effi cient regeneration system. We have established an effi cient regeneration system in cowpea through shoot meristem. Shoot meristems were isolated from embryos that were precultured for 3-5 days on Murashige and Skoog (MS) medium containing 8.9 μM benzylaminopurine (BA). The isolated shoot meristems were cultured on MS medium containing 0.89 μM BA. After 3-4 weeks, multiple shoots were separated from the explant and cultured on half-strength MS medium for elongation and rooting. More than 90% of the regenerants formed roots. The rooted plantlets were transferred fi rst to peat pellets and subsequently to the greenhouse. The plants were allowed to fl ower and set seed. The effi ciency of regeneration in all four cultivars ranged from 76-87%, demonstrating a signifi cant improvement over the published protocols (1-32%). At least six to seven plantlets were obtained from each meristem. The protocol using shoot meristems is simple, effi cient, rapid and genotype-independent and may be amenable for transformation through particle bombardment.
Key words: Vigna unguiculata, shoot meristem, regeneration, transformation, legumes
IntroductionCowpea (Vigna unguiculata L. Walp.), an annual vegetable, is one of the world’s important legume food crops. Cowpea grain contains about 25% protein, especially rich in folate, potassium, iron, magnesium, and the essential amino acids lysine and tryptophan. Cowpea is also rich in phytochemicals that may help prevent chronic diseases such as cardiovascular disease, cancer and diabetes. In addition, cowpea is a good source of fi ber. A diet high in fi ber can help lower blood cholesterol levels, which can reduce risk of heart disease (www.mayoclinic.com/health/legumes/NU00260)
Cowpea is severely infected by insects such as thrips (Megalurothrips sjostedti), aphids (Aphis craccivora), curculio (Chalcodermus aeneus), pod borer (Maruca vitrata), weevils (Callosobruchus maculatus) etc. that cause signifi cant damage to crop production and yield (Singh et al., 1990). However, current cultivars do not offer protection against insect damage. Efforts to develop durable insect resistance did not succeed because the genome of cowpea may be devoid of major resistance genes to many insect pests that attack cowpea. Also, attempts to bring insect resistance into cowpea from wild Vigna species have failed because of high genetic barriers between wild Vigna and cultivated cowpea (Singh et al., 1997).
Cowpea is an ideal vegetable crop for the application of genetic engineering technologies for developing insect resistance. However, cowpea is highly recalcitrant to tissue culture and therefore genetic transformation is diffi cult to achieve. There have been a few reports of plant regeneration through organogenesis and somatic embryogenesis (Muthukumar et al., 1995; Pellegrineschi, 1997; Brar et al., 1999a, b; Anand et al., 2000, 2001; Ramakrishnan et al., 2005). The effi ciency of regeneration
in these reports is too low (1-32%) to reliably obtain transgenic plants. Consequently, efforts to transform cowpea were mostly unsuccessful or resulted in very few transgenic plants (Garcia et al., 1986, 1987; Penza et al., 1991; Muthukumar et al., 1996; Ikea et al., 2003). In recent years, regeneration of shoots from cotyledon nodes or from other meristematic explants has emerged as a rapid and relatively effi cient method of transformation in a number of legumes that are highly recalcitrant in tissue culture
(Oger et al., 1996; Trieu and Harrison, 1996; Larkin et al., 1996; Olhoft et al., 2001). In cowpea, transgenic plants were regenerated using cotyledon nodes containing axillary meristems (Popelka et al., 2006), although at low frequency (0.05-0.15%), demonstrating the feasibility of using meristems as an alternate source for genetic transformation.
In this report, we present a simple, effi cient, rapid and genotype-independent regeneration system for cowpea plants from four cultivars by using shoot meristems. The regeneration method has potential use in transforming cowpea with insect resistant genes.
Materials and methodsFour cowpea cultivars (Early Scarlet, Coronet, Quick Pick and AR87-435-68) were selected for regeneration. Mature seeds (kindly provided by Dr. S. Okiror, University of Arkansas at Pine Bluff, USA) were surface sterilized in 70% alcohol for 5 minutes, rinsed in sterile water and placed in 0.2% sodium hypochlorite solution. After 1 h, the seeds were rinsed thrice with sterile water. Finally, the seeds were allowed to soak in sterile water overnight. Murashige and Skoog (1962) medium (MS) supplemented with 3% (w/v) sucrose (Sigma, USA) and various concentrations of growth regulators were used for tissue culture and regeneration. The media were adjusted to pH 5.8 with 1 N NaOH or 1 N HCl,
Journal
Appl

solidifi ed with 3 g L-1 phytagel (Sigma, USA) and autoclaved at 1 kg cm-2 for 20 min. Media (50 mL) were dispensed into 20- by 100-mm sterile Petri dishes (Falcon, Becton Dickinson Labware, USA). The cultures were maintained at 25 ± 2 0C with a 16-h photoperiod (25-40 μmol cm-2 s-1). All growth regulators were fi lter sterilized before adding to the media. Embryos were isolated and precultured either on MS basal medium or MS medium containing BA (8.9 μM) (Table 1). After 3-5 days, the shoot meristems (0.5-1 mm) were carefully isolated and cultured on MS media with different concentrations of BA (0.4-22.2 μM) for three week. After three weeks, the regenerated multiple shoots were transferred to elongation and rooting medium (half-strength MS with no growth regulators). Plantlets with well-developed roots were removed from the culture medium, the roots washed thoroughly with tap water, and transferred to peat pellets [Jiffy-7, Jiffy Products (N.B.) Ltd., Shippagan, Canada] for initial acclimatization. The plantlets were covered with plastic wrap to maintain high humidity for fi rst few days. Gradually the humidity was reduced by slowly removing the plastic wrap and the hardened plants were transferred to the greenhouse [24-28ºC, 16/8 h (day/night) photoperiod supplemented by sodium halide lights]. Plants were allowed to fl ower and set seed. The root tips of the regenerated plants were collected in cold distilled water, kept at 40C for 24 h and then fi xed in Farmer’s fi xative (3:1 95% ethanol: glacial acetic acid). The root tips were squashed with carbol fuchsin and observed under a microscope.
Results Shoot meristems (0.5-1 mm) were carefully isolated from precultured embryos and cultured on different concentrations of BA (Table 1). After 3-5 d of culture, newly formed multiple
shoots could be seen from the cut end of the meristem. After 3-4 weeks, individual shoots were separated from each meristem and transferred to half-strength MS medium for elongation and rooting. Among the different concentrations tried, MS medium containing 0.89 μM BA produced more shoots (3.2 shoots per meristem) than other concentrations. To improve the number of multiple shoots, embryos were precultured on higher concentration of BA (8.9 μM) for 3-5 days and the isolated shoot meristems were cultured on different concentrations of BA (Table 1). Signifi cantly, more plants were regenerated after transfer to MS medium containing 0.89 μM BA from all four cultivars tested, indicating the positive effect of preculture in inducing multiple shoots (Fig. 1A). More than six shoots per meristem were regenerated from all four cultivars with the preculture on BA (8.9 μM) medium. Increasing the concentration of BA beyond 0.89 μM in the culture media resulted in callus growth that signifi cantly reduced the number of multiple shoots. The addition of other cytokinins such as zeatin and kinetin in the regeneration media also led to callus growth from shoot meristems, thereby signifi cantly reducing the number of shoots (data not shown). Shoots were separated and transferred to half-strength MS medium for elongation (Fig. 1B) and rooting. More than 90% of the regenerants formed roots in the half-strength MS medium (Fig. 1C). The regenerated plants with roots were initially transferred to peat pellets for hardening. Only 50% of the plants survived during hardening. After 10-12 days of hardening, the surviving plants were transferred to the greenhouse (Fig. 1D). No phenotypic and chromosomal abnormalities (2n = 22) were noticed.
Table 1. Effects of benzylaminopurine (BA, μM) on shoot regeneration from cultured meristems in cowpeaGenotype Preculture medium Culture medium Explants forming shoots (%) Number of shoots per explant†
Early Scarlet MS MS 56.25 1.16 jMS MS + 0.4 BA 59.37 2.62 f,g,h,i,jMS MS + 0.9 BA 60.94 3.24 c,d,e,f,gMS MS + 2.2 BA 59.37 2.83 e,f,g,h,iMS MS + 4.4 BA 51.28 2.37 f,g,h,i,jMS MS + 8.9 BA 69.58 2.16 g,h,i,jMS MS + 13.3 BA 60.35 1.89 h,i,jMS MS + 22.2 BA 68.71 1.22 jMS + 8.9 BA MS + 0.4 BA 70.89 4.87 b,cMS + 8.9 BA MS + 0.9 BA 72.33 6.73 aMS + 8.9 BA MS + 2.2 BA 76.82 5.45 bMS + 8.9 BA MS + 4.4 BA 74.02 4.21 c,d,e
Coronet MS MS 72.66 1.99 g,h,i,jMS MS + 0.9 BA 73.08 3.34 d,e,f,g,hMS + 8.9 BA MS + 0.9 BA 87.65 6.89 aMS + 8.9 BA MS + 2.2 BA 86.23 5.32 b
Quick Pick MS MS 81.23 1.89 h,i,jMS MS + 0.9 BA 83.78 3.87 c,d,e,fMS + 8.9 BA MS + 0.9 BA 86.66 6.46 aMS + 8.9 BA MS + 2.2 BA 85.62 5.12 b
AR87-43568 MS MS 75.83 1.71 i,jMS MS + 0.9 BA 79.21 3.43 c,dMS + 8.9 BA MS + 0.9 BA 84.02 6.29 aMS + 8.9 BA MS + 2.2 BA 82.17 5.18 b
† means followed by the same letters are not signifi cantly different based on Duncan’s multiple range test (P<0.05).
Improved plant regeneration in cowpea through shoot meristema 41

DiscussionCowpea is one of the most recalcitrant leguminous vegetable for regeneration and transformation (Popelka et al., 2004). Consequently, well known insecticidal genes such as those for Bacillus thuringiensis (Bt) toxin, alpha-amylase inhibitor, plant lectins etc. could not be introduced into cowpea due to the lack of a simple, routine and reproducible regeneration system. Previously, regeneration of cowpea plants was achieved through organogenesis and somatic embryogenesis using explants such as cotyledons, hypocotyls, primary leaves or embryonal axes (Muthukumar et al., 1995; Pellegrineschi, 1997; Brar et al., 1999a, b; Anand et al., 2000, 2001; Ramakrishnan et al., 2005). However, the frequency of plant regeneration was too low (1-32%) to establish a routine and reproducible transformation system in cowpea.
In recent years, use of meristems as a source of totipotent cells for regeneration and transformation has emerged in a number of plants including legumes (Somers et al., 2003). To date, the meristem-based transformation method has been successfully established in several species such as pea, sunfl ower, corn, tobacco, rice, and maize (Hussey et al., 1989; Bidney et al., 1992; Gould et al., 1991a, b; Zimmerman and Scorza, 1996; Park et al., 1996; Zhang et al., 2002). Because inducing organogenesis or somatic embryogenesis is diffi cult, meristem-based direct regeneration may overcome bottlenecks in cowpea transformation.
In our study, shoot meristem culture was fi rst established in the cultivar Early Scarlet. Embryos were cultured on MS basal medium for 3-5 days. Subsequently, shoot meristem was isolated and cultured on different concentrations BA. At least three shoots were regenerated from each meristem on medium containing 0.89 μM BA. Calli began to proliferate at the base of the meristems with increasing concentrations of BA (2.2-22.2 μM) thereby signifi cantly reducing the number of shoots regenerated. Further, the number of multiple shoots signifi cantly increased when shoot meristems were preconditioned on medium containing high BA (8.9 μM) before culturing on 0.89 μM BA, regenerating at least 6-7 shoots per meristem. The positive effect of preculturing
explants on media containing cytokinins like BA on shoot regeneration has been reported in other legumes such as grain legume (Vigna mungo), Phaseolus sp. and Cajanus cajan (Shiv Prakash et al., 1994; Santalla et al., 1998; Saini and Jaiwal, 2005). Once the regeneration system for the cultivar Early Scarlet was optimized, the system was applied to the cultivars Coronet, Quick Pick and AR87-43568. The shoot meristems from these cultivars were isolated from the embryos precultured on 8.9 μM BA and cultured on 0.89 μM BA. All three cultivars produced six to seven shoots per meristem, demonstrating the applicability of the shoot meristem-based protocol to different genotypes. The regeneration effi ciency of shoot meristems that produced multiple shoots ranged from 72-88% in the four cultivars compared to 1-32% obtained through organogenesis or somatic embryogenesis. In conclusion, we have successfully established a simple, rapid and effi cient regeneration system in cowpea using shoot meristems. The regenerated plants exhibited no phenotypic and genotypic abnormalities. Moreover, the regeneration response of four cultivars to the shoot meristem based system was similar, demonstrating the genotype-independent nature and applicability of this protocol. The regeneration procedure developed from this study may be used to transform cowpea with insecticidal genes through biolistics transformation.
ReferencesAnand, R.P., A. Ganapathi, V.R. Anbazhagan, G. Vengadesan and N.
Selvaraj, 2000. High frequency plant regeneration via somatic embryogenesis in cell suspension cultures of cowpea, Vigna unguiculata (L.) Walp. In Vitro Cell Dev. Biol.-Plant, 36: 475-480.
Anand, R.P., A. Ganapathi, G. Vengadesan, N. Selvaraj, V.R. Anbazhagan and Kulothungan, 2001. Plant regeneration from immature cotyledon-derived callus of Vigna unguiculata (L.) Walp (cowpea). Current Sci., 80: 671-674.
Brar, M.S., J.M. Al-Khayri, T.E. Morelock and E.J. Anderson, 1999a. Genotypic response of cowpea Vigna unguiculata (L.) to in vitro regeneration from cotyledon explants. In Vitro Cell Dev. Biol. – Plant, 35: 8-12.
Brar, M.S., M.J. Moore, J.M Al-Khayri, T.E. Morelock and E.J. Anderson, 1999b. Ethylene inhibitors promote in vitro regeneration of cowpea (Vigna unguiculata L.). In Vitro Cell Dev. Biol.-Plant, 35: 222-225.
Bidney, D., C. Scelonge, J. Martich, M. Burrus, L. Sims and G. Huffman, 1992. Microprojectile bombardment of plant tissues increases transformation frequency by Agrobacterium tumefaciens. Plant Mol. Biol., 18: 301-313.
Garcia, J.A., J. Hille and R. Goldbach, 1986. Transformation of cowpea Vigna unguiculata cells with an antibiotic resistance gene using a Ti-plasmid derived vector. Plant Sci., 44: 37-46.
Garcia, J.A., J. Hille, P. Vos and R. Goldbach, 1987. Transformation of cowpea Vigna unguiculata cells with a full-length DNA copy of cowpea mosaic virus m-RNA. Plant Sci., 48: 89-98.
Gould, J., S. Banister, O. Hasegawa, M. Fahima and R.H. Smith, 1991a. Regeneration of Gossypium hirsutum and G. barbadense from shoot-apex tissues for transformation. Plant Cell Rep., 10: 35-38.
Gould, J., M. Devey, E.C. Ulian, O. Hasegawa, G. Peterson and R.H. Smith, 1991b. Transformation of Zea mays L. using Agrobacterium tumefaciens and the shootapex. Plant Physiol., 95: 426-434.
Hussey, G., R.D. Johnson and S. Warren, 1989. Transformation of meristematic cells in the shoot-apex of cultured pea shoots by Agrobacterium tumefaciens and A. rhizogenes. Protoplasma, 148: 101-105
Ikea, J., I. Ingelbrecht, A. Uwaifo and G. Thottappilly, 2003. Stable gene transformation in cowpea (Vigna unguiculata L. Walp.) using particle gun method. Afr. J. Biotech., 2: 211-218.
Fig.1. In vitro regeneration of cowpea plants cv Early Scarlet from shoot meristem. A. Development of multiple shoots from precultured shoot meristems on BA medium (0.89 μM); B. Multiple shoots, separated and transferred to rooting medium; C. Rooted plants in half-strength MS medium; and D. Fully established plants in the greenhouse.
42 Improved plant regeneration in cowpea through shoot meristema

Larkin, P.J., J.M. Gibson, U. Mathesius, J.J. Weinman, E. Gartner, E. Hall, G.J. Tanner, B.G. Rolfe and M.A. Djordjevic, 1996. Transgenic white clover. Studies with the auxin-responsive promoter, GH3, in root gravitropism and lateral root development. Transgenic Res., 5: 325-335.
Muthukumar, B., M. Mariamma and A. Gnanam, 1995. Regeneration of plants from primary leaves of cowpea. Plant Cell Tissue Org. Cult., 42: 153-155.
Muthukumar, B., M. Mariamma, K. Veluthambi and A. Gnanam, 1996. Genetic transformation of cotyledon explants of cowpea (Vigna unguiculata L. Walp) using Agrobacterium tumefaciens. Plant Cell Rep., 15: 980-985.
Murashige, T. and F. Skoog, 1962. A revised medium for rapid growth and bioassays with tobacco tissue cultures. Physiol. Plant., 15: 473-497.
Olhoft, P.M. and D.A. Somers, 2001. L-Cysteine increases Agrobacterium-mediated T-DNA delivery into soybean cotyledonary-node cells. Plant Cell Rep., 20: 706-711.
Oger, P., A. Petit and Y. Dessaux, 1996. A simple technique for direct transformation and regeneration of the diploid legume species Lotus japonicus. Plant Sci., 116: 159-168.
Park, S.H., S.M. Pinson and R.H. Smith, 1996. T-DNA integration into genomic DNA of rice following Agrobacterium inoculation of isolated shoot apices. Plant Mol. Biol., 32: 1135-1148.
Pellegrineschi, A. 1997. In vitro plant regeneration via organogenesis of cowpea (Vigna unguiculata (L.) Walp). Plant Cell Rep., 17: 89-95.
Penza, R., P.F. Lurquin and E. Filioppone,1991. Gene transfer by cocultivation of mature embryos with Agrobacterium tumefaciens application to cowpea (Vigna unguiculata Walp.). J. Plant Physiol., 138: 39-42.
Popelka, J.C., N. Terryn and T.H.V. Higgins, 2004. Gene technology for grain legumes: can it contribute to the food challenge in developing countries? Plant Sci., 167: 195-206
Popelka, J.C., S. Gollasch, A. Moore, L. Molvig and T.H.V. Higgins, 2006. Genetic transformation of cowpea (Vigna unguiculata L.) and stable transmission of the transgenes to progeny. Plant Cell Rep., 25: 304-312.
Ramakrishnan, K., R. Gnanam, P. Sivakumar and A. Manickam, 2005. In vitro somatic embryogenesis from cell suspension cultures of cowpea [Vigna unguiculata (L.) Walp]. Plant Cell Rep., 24: 449-461.
Saini, R. and P.K. Jaiwal, 2005. Transformation of a recalcitrant grain legume, Vigna mungo L. Hepper, using Agrobacterium tumefaciens-mediated gene transfer to shoot apical meristem cultures. Plant Cell Rep., 24: 164-171.
Santalla, M., J.B. Power and M.R. Davey, 1998. Effi cient in vitro shoot regeneration responses of Phaseolus vulgaris and P. coccineus. Euphytica, 102: 195-202.
Shiv Prakash, N., D. Pental and N. Bhalla-Sarin, 1994. Regeneration of pigeonpea (Cajanus cajan) from cotyledonary node via multiple shoot formation. Plant Cell Rep., 13: 623-627.
Singh, S.R., L.E.N. Jackai, J.H.R. Dos Santos and G.B. Adalia, 1990. Insect pests of cowpea. In: Insect Pests of Tropical Food Legumes. S.R. Singh (ed), John Wiley & Sons, Chichester, p. 43-89.
Singh, B.B., D.R. Mohan, K.E. Dashiell and L.E.N. Jackai, 1997. Advances in cowpea research. IITA and JIRCAS, Ibadan, Nigeria and Ibaraki, Japan.
Somers, D.A., D.A. Samac and P.M. Olhoft, 2003. Recent advances in legume transformation. Plant Physiol., 131: 892-899.
Trieu, A.T. and M.J. Harrison,1996. Rapid transformation of Medicago truncatula: regeneration via shoot organogenesis. Plant Cell Rep., 16: 6-11.
Zhang, S., R.R. Williams-Carrier and P. Lemaux, 2002. Transformation of recalcitrant maize elite inbreds using in vitro shoot meristematic cultures induced from germinated seedlings. Plant Cell Rep., 21: 263-270
Improved plant regeneration in cowpea through shoot meristema 43

Journal of Applied Horticulture, 10(1): 44-49, 2008
Rapid in vitro propagation of grapevine cv. Crimson Seedless— Infl uence of basal media and plant growth regulators
A. Nookaraju, S.M Barreto and D.C. Agrawal*
Plant Tissue Culture Division, CSIR National Chemical Laboratory, Pune – 411 008, India *E-mail: [email protected]
AbstractGrapevine genotypes differ in tissue culture requirements and thus require optimized culture conditions for in vitro propagation. Single node segments of Crimson Seedless cultured on six different basal media i.e. Murashige and Skoog (MS), Eriksson (ER), Gamborg (B5), Nitsch and Nitsch (NN), Woody plant medium (WPM) and Chee and Pool (C2d) showed different percentage of shoot initiation and morphogenetic responses. The maximum shoot initiation (90.0%) was observed in MS medium. Except ER, all other media induced rooting at the base of nodal segments in varying percentages though number and quality of roots and their establishment on transfer to pots varied greatly. WPM induced the maximum rooting in nodal segments (69.1%) with establishment rate of 100.0%. Induction of multiple shoots in nodal segments was achieved on inclusion of 6-benzyl adenine (BA) (8.87 μM) and indole-3-butyric acid (IBA) (1.48 μM) in the MS medium. In second sub-culture i.e., at 90 days, shoot bud proliferation could be increased many fold on transfer of these initial shoot clumps to glass bottles instead of culture tubes. The maximum average number of primary shoots (19.5 per explant) was achieved on MS with BA (8.87 μM) and IBA (1.48 μM). Elongation of shoots was achieved on MS with BA (2.22 μM) + α-naphthalene acetic acid (NAA) (0.54 μM). Induction of ex vitro rooting and establishment of rooted shoots after transfer to pots was achieved in different effi ciencies when shoots were given pulse treatment of indole-3-acetic acid (IAA) or IBA or NAA at 57.08, 49.0 and 53.71 μM, respectively, for 5 or 10 min. Survival of in vitro and ex vitro-rooted shoots on potting was 90.0 and 100.0%, respectively.
Key words: Crimson Seedless, grapevine, micropropagation, Vitis.
et al., 1998). Retail trade over there has received the variety favorably due to its excellent eating characteristics like crisp and fi rm berries. In vitro propagation offers an advantage of clonal multiplication of desired material at faster rate and on a continuous basis. To the best of our knowledge, there is no report available for in vitro propagation of Crimson Seedless. The presernt paper deals with the Crimson Seedless specifi c micro propagation requirements.
Materials and methodsPlant material: Twigs of fi eld grown vines of Crimson Seedless were collected from the vineyard of National Research Centre for Grapes, Manjri, Pune, India. Single node segments (1.5-2 cm long) were used as explant for culture. Nodal segments were surface sterilized by soaking them in liquid soap solution for 10 min followed by thorough rinses with running tap water. The explants were then submerged in 0.1% fungicide solution (BavistinTM, BASF, India) for one hr followed by 2-3 washes with sterile distilled water. Then the explants were treated with 0.1% (w/v) mercuric chloride for 10 min followed by several rinses with sterile distilled water in a laminar fl ow hood. Excess water was removed by blotting dry the explants on a sterile fi lter paper.
Shoot initiation: For shoot initiation, nodal segments were inoculated in glass culture tubes containing following six different basal media: MS (Murashige and Skoog, 1962), ER (Eriksson, 1965), B5 (Gamborg et al., 1968), NN (Nitsch and Nitsch, 1969), WPM (Llyod and McCown, 1981) and C2d (Chee and Pool, 1987). Different workers have reported in vitro propagation of grapevine
Introduction In grapes, response of different cultivars to in vitro multiplication varies (Barlass and Skene, 1980; Botti et al., 1993). Hence, this necessitates the optimization of micropropagation procedure for different cultivars, clones or newly introduced varieties. Shoot apex as an explant was commonly used for micropropagation of herbaceous species (Murashige, 1977; Abbot, 1978) but to a lesser degree in woody species. Grapevine was among the fi rst woody plants, where the use of shoot apices and axillary buds for in vitro propagation of various species and cultivars of Vitis was reported. In vitro propagation of vines could be obtained by culture of shoot apices (Harris and Stevenson, 1979; Goussard, 1981) and adventitious shoot formation from fragmented apices (Barlass and Skene, 1978). Use of other explants like meristem in Vitis rotundifolia (Thies and Graves, 1992), microcutting and axillary buds in Vitis x Muscadania hybrids (Torregrosa and Bouquet, 1995) have also been documented. Despite a moderate multiplication rate, nodal segment remains a widely used explant in micropropagation of vines due to its operational feasibility and genotype stability (Torregrosa et al., 2001). In vitro propagation could be obtained by axillary shoot initiation in nodal cuttings (Galzy, 1969). Mhatre et al. (2000) used nodal segments as explants to propagate three vinifera varieties. Studies on in vitro culture and propagation of vines have recently been reviewed by Torregrosa et al. (2001).
Crimson Seedless, a red table grape variety was developed by Ramming and Tarailo of the USDA, Fresno, California, USA as a result of cross between Emperor and C33-199 (Dokoozlian
Journal
Appl

employing various basal media. Based on the earlier reports, these six media were selected to determine the optimum basal medium for shoot initiation and other morphogenetic processes for the cultivar Crimson Seedless.
To maximize the shoot initiation response, another experiment was set with MS basal medium supplemented with BA (0.44 μM-44.38 μM). Each culture tube had only single nodal segment.
Induction of multiple shoots: For induction of multiple shoots, primary nodal segments from field grown vines as well as secondary nodal segments excised from in vitro grown shoots from primary nodal segments were inoculated on MS basal medium supplemented with different growth regulators like BA (8.87 μM) alone or in combination with IAA (0.57-1.71 μM) or IBA (0.49-1.48 μM) or NAA (0.54-1.61 μM). Explants with induced multiple shoots were shifted to fresh media after every 4 weeks.
Elongation of multiple shoots: For elongation, shoots clumps were kept on MS basal medium supplemented with BA (2.22 μM) alone or in combination with IAA (0.57-1.71 μM) or IBA (0.49 -1.48 μM) or NAA (0.54-1.61 μM).
In vitro rooting of shoots: Elongated shoots were transferred to culture tubes containing half strength semi-solid or liquid MS basal medium supplemented with IAA (0.57-1.71 μM) or IBA (0.49-1.48 μM) or NAA (0.54-1.61 μM). Agar (0.65%) or gelrite (0.2%) were used as gelling agents.
Sucrose (2%) as a carbon source was added to all the media and pH adjusted to 5.8 before autoclaving at 1210C and 105 KPa for 20 min. All the growth regulators were added before autoclaving.
Ex vitro rooting: Three auxins, IAA, IBA and NAA at a concentration of 57.08, 49.0 and 53.71 μM, respectively, were used for pulse treatment. Elongated shoots (4.5-5.0 cm) were given pulse treatment for 5 or 10 min. After pulse treatment, shoots were transferred to plastic cups consisting of a mixture of sterile peat: soil: vermiculite (1:1:1). Plants were irrigated with ¼ strength of MS salts medium without sucrose and covered with thin and transparent polythene sachets and placed in growth room with 24h light with an intensity of 24.4 μ mol m-2 s–1 at 25 ± 20C. Untreated shoots, which served as control, were also transferred to the same potting mixture and growth conditions.
Hardening of plants: Shoots rooted under in vitro conditions and nodal segments with direct rooting in basal media were
transferred to plastic cups containing a mixture of soil and sand (1:1). Sachet technique followed by Ravindra and Thomas (1995) and Bharathy et al. (2003) was used for hardening of in vitro and ex vitro-rooted shoots and nodal segments with induced direct rooting in basal media. Plants were covered with thin, transparent polythene sachets and kept in growth room having 24h light with intensity of 24.4 μ mol m
-2 s –1 at 25 + 20C. After 2 weeks, plants were shifted to another room having ambient temperature. Here, sachets were cut at top corners and were removed completely after 2 weeks. After that plants were transferred to a polyhouse.
Observations of all the experiments were taken at 30 days interval. Data were analyzed using ANOVA (Spiegel, 1992).
Results and discussionShoot initiation: Shoot initiation in nodal segments commenced after 7 days of inoculation and continued up to 25 days. Out of six nutrient media tested, the maximum shoot initiation in explants was observed in MS basal medium (90.0%) followed by NN (89.4%) and WPM (87.2%) after 30 days of inoculation (Table 1). Percent of explants showing shoot induction was highest (85.7) in MS followed by 78.8 in NN and 78.7 in WPM.
Six different basal media had varying infl uence on induction of direct rooting in explants. With the exception of ER, all other basal media induced rooting at the basal end of nodal segments (Fig. 1A). The maximum response (69.1%) was observed in WPM followed by B5 (60.0%) though establishment of rooted nodal segments into plants on potting was 100.0 and 66.7%, respectively. Direct rooting in nodal segments has advantage in micropropagation, since explants rooted in this manner can directly be transferred to pots and hardened plantlets can be obtained after 2 months. Also use of single node cuttings in culture instead of 3-4 node cuttings used in vineyard can give larger number of plants if source of mother material is a serious limitation.
Induction of shoots in nodal segments could be increased to 100.0% on incorporation of BA at 4.44 μM in MS basal medium (data not shown). There was no rooting at the base of explants in any of the BA concentration unlike BA free MS basal medium. In a study with different grapevine cultivars and rootstocks, Roubelakis-Angelakis and Zivanovitc (1991) reported increased rhizogenic effect in single node segments on medium containing lower amounts of N, K, Ca and Mg. In our study, WPM contains
Table 1. Effect of different nutrient media on morphogenetic responses in Crimson Seedless
Nutrient Medium Number of explants
Inoculated
Explants showing shoot
initiation(%)
Explants developed
shoots(%)
Average length of shoots
(cm) ± SD
Explants showing
rooting at base(%)
Average number of roots per
explant ± SD
Plants established on
potting(%)
MS 70 90.0 85.7 1.36±0.26 25.0 3.67±0.26 33.3ER 45 75.6 66.7 1.54±0.50 00.0 0.00±0.00 00.0B5 69 60.9 53.7 1.75±1.00 60.0 6.03±0.67 66.7NN 47 89.4 78.8 1.30±0.47 55.8 6.75±0.67 00.0WPM 47 87.2 78.7 1.57±0.74 69.1 6.52±1.70 100.0C2d 46 84.8 78.3 1.36±0.16 22.0 2.11±0.08 25.0LSD (P=0.05) 15.2 11.4 0.49 5.60 1.30 8.1
* ** ** ** * *** Signifi cant at 5%; ** signifi cant at 1%.Explant: Primary single node segment. Observations recorded after 30 days of inoculation.
Rapid in vitro propagation of grapevine cv. Crimson Seedless 45

46 Rapid in vitro propagation of grapevine cv. Crimson Seedless
lower amount of nitrogen compared to other fi ve media tested and hence could be a reason for increased rooting response in nodal segments. Similarly, maximum amount of nitrogen present in ER medium compared to all other media tested could be a reason for absence of rooting in the ER medium.
Multiple shoot induction: In preliminary trials conducted to optimize the ideal concentration of BA for multiple shoot induction, BA concentration 8.87 μM was found to be better for inducing multiple shoots in higher percent of explants. In further experiments, various auxins were tried along with BA at this concentration to maximize multiple shoot induction. In two separate experiments; both primary as well as secondary nodal segments were used to induce multiple shoots. An average of 2.71 shoots per primary nodal segment could be induced on MS medium with BA (8.87 μM) and IBA (0.98 μM) in 37.0% of explants after 30 days of inoculation (data not shown). More or less similar observations were recorded for secondary nodal segments too (Table 2). Out of 3 auxins tested, IBA at 0.98 μM added to MS medium containing BA (8.87 μM) induced multiple shoots in 25.0% of the explants. Results with BA (8.87 μM) and
IAA at all three levels varied marginally. Inclusion of NAA in the medium not only induced lower response of multiple shoots but also resulted into heavy callusing at basal end of explants and shoots were hyperhydric.
On further subculture of these explants onto their respective media in test tubes did not improve multiple shoot number in majority of the media. It was observed that node region swelled and enlarged in size. When these explants were subcultured to glass bottles instead of test tubes, a dramatic increase in number of multiple shoots was observed at the end of 30 days. On an average 19.5 shoots per explant were recorded on MS basal medium supplemented with BA (8.87 μM) and IBA (1.48 μM) (Table 2). Also, a large number of shoot buds were observed in axils of multiple shoots (Fig. 1B, C and D). The poorest response was recorded on MS supplemented with BA (8.87 μM). MS alone without any growth regulator (control) did not show multiple shoot induction.
Due to its favorable response, BA has been the most commonly used cytokinin in grape tissue culture. BA in the range of 5-10 μM was found to be an effective growth regulator for induction of
Fig. 1. Direct rooting in single node explants (A); Multiple shoots in secondary nodal segment (B); Proliferation of multiple shoots (C); Shoot buds in axils (D); Elongated shoots (E); Rooted shoot in medium with agar (F); Rooted shoot in medium with gelrite (G); Rooted shoot on fi lter paper bridge in liquid medium (H); Ex vitro rooted shoots (I & J).

also reported that proportion of small (<1 cm) shoots increased with increased BA levels and cultures at higher BA levels had dense, unexpanded shoots with high mortality. Thomas (1997) obtained multiple shoots with poor elongation at BA (5 μM) in Vinifera cultivar ‘Arka Neelamani’. He also observed that BA at higher level (10-20 μM) resulted into condensed shoots or undifferentiated growth. Chee and Pool (1985) reported that shoot proliferation of Vitis hybrid Remaily Seedless increased with increased concentration of BA (0-80 μM) reaching maximum at 5 μM. Hence optimization of BA concentration in the present study was considered a necessary step.
Elongation of multiple shoots: Since multiple shoots induced were stunted in growth and were in form of clumps, it was necessary to defi ne a medium for shoot elongation. MS basal medium supplemented with lower concentration of BA (2.22 μM) alone or in combination with IAA (0.57-1.71 μM) or IBA (0.49-1.48 μM) or NAA (0.54-1.61 μM) was tested (Table 3). The least elongation was obtained on MS basal medium without any growth regulator (control). The maximum number of shoots (8.1 per clump) elongated (Fig. 1E) on MS with BA at 2.22 μM followed by 7.85 shoots per clump on MS with BA (2.22 μM) + NAA (1.61 μM). On these media, shoots grown could be separated easily from each other. Though comparatively higher elongation was achieved on media with NAA at all the three levels, however there was excessive callusing at base with adventitious roots, an effect undesirable for plant establishment. Similar to our fi ndings, Mhatre et al. (2000) reported enhanced shoot elongation with addition of 1.14 μM IAA to the MS medium containing BA (2.22 μM) compared to the medium containing BA (2.22 μM) alone. From the published reports, it can be inferred that no fi xed BA concentration was applicable for different stages of in vitro multiplication of different grapevine cultivars and concentrations need to be optimized for each cultivar.
In vitro rooting: Since different auxins are documented to exhibit varying rooting response depending on cultivars, we investigated rooting response in shoots using MS half strength semi-solid medium gelled with agar (Fig. 1F) or gelrite (Fig. 1G) and also liquid medium with fi lter paper supports (Fig. 1H) with supplement of IAA (0.57-1.71 μM) or IBA (0.49-1.48 μM) or NAA (0.54-1.61 μM). Though rooting of in vitro shoots could be observed in varying percentages in agar or gelrite solidifi ed or liquid media without auxins (control), however number of roots induced was fewer compared to media with auxins. It was also observed that with NAA, the number of roots was higher compared to media with IBA at same concentrations, which is in
Table 2. Effect of growth regulators and subculture on induction and proliferation of multiple shoots in secondary nodal segments of Crimson Seedless
Medium composition(concentration, μM)
Explants showing multiple
shoots (%)
Number of shoots per explant ± SD
(30 days)1 (90 days)2
MS+BA (8.87) 18.8 2.33±0.20 2.33±0.00MS+BA (8.87)+IAA (0.57) 18.8 2.50±0.25 13.00±6.02MS+BA (8.87)+IAA (1.14) 18.8 2.50±0.17 15.20±5.35MS+BA (8.87)+IAA (1.71) 15.6 2.00±0.00 11.80±6.83MS+BA (8.87)+IBA (0.49) 9.3 2.00±0.00 8.67±6.65MS+BA (8.87)+IBA (0.98) 25.0 2.13±0.07 16.17±8.92MS+BA (8.87)+IBA (1.48) 15.6 2.60±0.50 19.50±4.94MS+BA (8.87)+NAA (0.54) 9.9 2.00±0.00 9.50±3.62MS+BA (8.87)+NAA (1.07) 9.4 2.33±0.17 6.33±4.93MS+BA (8.87)+NAA (1.61) 12.5 2.00±0.00 8.60±2.07MS 0.0 0.00 0.00LSD (P=0.05) 2.16 0.27 8.17
* * *** Signifi cant at P=0.05; ** signifi cant at P=0.01. 1 Explants - shoot clumps in test tubes; 2 Shoot clumps in bottles.
Table 3. Effect of BA and auxins on elongation of multiple shoots in Crimson Seedless
Medium composition (concentration, μM)
Number of shoots elongated per
clump
Average height of elongated shoots
(cm)
MS 3.60±2.73 1.70±1.85MS+BA (2.22) 8.10±2.91 3.28±1.69MS+BA (2.22) + IAA (0.57) 6.70±2.76 3.70±1.38MS+BA (2.22) + IAA (1.14) 4.30±2.15 4.20±1.72MS+BA (2.22) + IAA (1.71) 6.00±1.98 3.50±0.81MS+BA (2.22) + IBA (0.49) 6.50±3.90 2.99±0.90MS+BA (2.22) + IBA (0.98) 5.85±2.81 3.27±1.81MS+BA (2.22) + IBA (1.48) 5.14±3.79 3.22±0.99MS+BA (2.22) + NAA (0.54) 7.85±4.93 4.53±1.26MS+BA (2.22) + NAA (1.07) 3.43±3.56 4.71±2.01MS+BA (2.22) + NAA (1.61) 3.00±2.36 4.97±2.86CD (P=0.05) 5.64 2.32
** **** Signifi cant at P=0.01. Culture vessels used: Glass bottles. Observations recorded after 30 days of inoculation.
Table 4. Effect of auxin pulse treatment on ex vitro rooting of shoots and plantlet establishment in Crimson SeedlessTreatment Percentage of
shoots rootedNumber of roots per shoot ± SD
Root length (cm) ± SD
Shoot length (cm) ± SD
Plants established (%)
Control 62.5 10.17±0.19 3.65±0.59 11.28±0.39 56.3IAA 57.08 μM for 5 min 73.7 9.60±0.58 4.65±1.50 9.20±1.92 52.6IAA 57.08 μM for 10 min 100.0 11.42±0.95 4.34±0.87 11.16±0.29 100.0IBA 49.00 μM for 5 min 84.2 11.29±1.55 3.24±1.11 9.75±0.42 73.9IBA 49.00 μM for 10 min 84.2 11.63±0.35 4.70±1.25 10.60±2.89 79.0NAA 53.71 μM for 5 min 94.7 8.66±0.35 2.43±0.52 8.13±0.02 84.2NAA 53.71 μM for 10 min 94.7 16.59±2.54 4.60±1.15 9.59±2.40 94.8LSD (P=0.05) 17.8 1.86 1.70 2.60 12.4
** ** ** * *** Signifi cant at P=0.05; ** signifi cant at P=0.01. Observations recorded after 40 days of transfer to cups.
shoots in grapevine cultures (Harris and Stevenson, 1982; Mhatre et al., 2000). Lee and Wetzstein (1990) reported that higher BA levels (20, 30 and 40 μM) strongly inhibited shoot elongation, with few or no larger shoots in Vitis vinifera cv. Summit. They
Rapid in vitro propagation of grapevine cv. Crimson Seedless 47

agreement with the fi ndings of Helior et al. (1997). In the present study, the higher dose of auxin induced callusing and lead to poor establishment of the plants during hardening. Among the 3 auxins tested, NAA at 1.07 μM induced 100.0% rooting of shoots in all three conditions mentioned above and was found to be a better auxin for Crimson Seedless (data not shown). Survival of rooted shoots after hardening was 90.0%. Similar to our studies, Gray and Benton (1991) demonstrated that NAA at 1 μM incorporated in the media signifi cantly increased the percentage of rooting, number of roots per shoot, and root length in three muscadine cultivars of grapevine. IBA is reported to be a better auxin for in vitro rooting of various clones of grapevine (Novak and Juvova, 1983) and in vinifera cv. Pinot noir (Helior et al., 1997). Harris and Stevenson (1982) obtained better rooting with IAA (0.57 μM) in different clones of grapevines.
Though half strength MS medium devoid of growth regulators induced rooting in 84.1% shoots with an average of 5.2 roots per shoot, addition of auxin in the medium signifi cantly improved the percent rooting, number of roots per shoot and survival percentage on potting.
Ex vitro rooting: Experiments were carried out with ex vitro rooting to circumvent the in vitro stage, which takes about 3-4 weeks in culture. Elongated shoots were given pulse treatment of IAA (57.08 μM) or IBA (49.0 μM) or NAA (53.71 μM) for 5 or 10 min. Roots became visible through the transparent plastic cups (Fig. 1I) after 15 days of potting of shoots. Though rooting of shoots was observed in all the treatments, effi ciency of response varied. The maximum response (100.0%) in terms of induction of roots and establishment of rooted shoots after potting was recorded with pulse treatment of IAA (57.08 μM) for 10 min (Table 4) (Fig. 1J). Gray and Benton (1991) in cultivars of muscadine grapes (Vitis rotundifolia) demonstrated that more shoots rooted in vitro than in ex vitro (77% vs. 46%), however, ex vitro technique was preferred, since acclimation of plants was achieved in lesser time and a major in vitro step was eliminated.
Hardening of plantlets: In vitro as well ex vitro rooted shoots and primary nodal segments with direct rooting could be hardened successfully by following Sachet technique. It was observed that covering of plantlets with polythene sachets for minimum of 4 weeks was very essential. Though top corners of bags could be cut after 2 weeks, however, complete removal of bags before 4 weeks caused scorching and drying of in vitro leaves.
From the present studies, it can be demonstrated that Crimson Seedless can successfully be propagated in vitro culturing single node segments on WPM without growth regulators where explants induced direct rooting at the base, initiated shoots and showed survival on potting. By this technique, hardened plantlets could be produced in 2 months. Another method is to induce multiple shoots in primary or secondary nodal segments and its proliferation on transfer to glass bottles after 60 days of culture in test tubes. By second route, plant production could be increased by many fold. Shoots could be rooted ex vitro by pulse treatment of auxins. This bypass one major in vitro stage and cuts down the cost and time of production. Hardening of plantlets could be achieved in a simple set up by Sachet technique. Thus, present procedure would be of immense help in commercial production of planting stock of this exotic variety of grapevine.
AcknowledgementsFinancial support by the Department of Biotechnology (DBT), Govt. of India, New Delhi; Senior Research Fellowship (SRF) to Mr. Nookaraju and Ms. Barreto by the Council of Scientifi c & Industrial Research (CSIR), New Delhi, and supply of plant material of Crimson Seedless by National Research Centre for Grapes (NRCG), Pune are gratefully acknowledged.
ReferencesAbbot, A.J. 1978. Practice and promise of micropropagation of woody
species. Acta Hortic., 79: 113-127. Barlass, M. and K.G.M. Skene, 1978. In vitro propagation of grapevine
(Vitis vinifera L.) from fragmented shoot apices. Vitis, 17: 335-340.
Barlass, M. and K.G.M. Skene, 1980. Studies on fragmented shoot apex of grapevine. II. Factors affecting growth and differentiation in vitro. J. Exp. Bot., 31: 489-495.
Bharathy, P.V., G.S. Karibasappa, A.B. Biradar, D.D. Kulkarni, A.U. Solanke, S.G. Patil and D.C. Agrawal, 2003. Infl uence of pre-bloom sprays of benzyladenine on in vitro recovery of hybrid embryos from crosses of Thompson Seedless and 8 seeded varieties of grape (Vitis spp.). Vitis, 42(4): 199-202.
Botti, C., L. Gray and G. Reginato, 1993. The infl uence of culture dates, genotype and type of shoot apices on in vitro shoot proliferation of Vitis vinifera cvs. Thompson Seedless, Ribier and Black Seedless. Vitis, 32: 125-126.
Chee, R. and R.M. Pool, 1985. In vitro propagation of Vitis: The effect of organic substances on shoot multiplication. Vitis, 24: 106-118.
Chee, R. and R.M. Pool, 1987. Improved inorganic media constituents for in vitro shoot multiplication of Vitis. Sci. Hortic., 32: 85-95.
Dokoozlian, N., B. Peacock and D. Luvisi, 1998. Crimson Seedless production practices. The University of California Co-operative Extension, Tulare County. Publ. TB# 5-93: 1-3.
Ericksson, T., 1965. Studies on the growth measurements of cell cultures of Haplopappus gracilis. Physiol. Plant., 18: 976-993.
Galzy, R. 1969. Remarques sur la croissance de Vitis rupestris cultvee in vitro sur differents milieux nutritifs. Vitis, 8: 191-205.
Gamborg, O.L., R.A. Miller and K. Ojima, 1968. Nutrient requirements of suspension cultures of soybean root cells. Exp. Cell Res., 50: 151.
Goussard, P.G. 1981. Effects of cytokinin on elongation, proliferation and total mass of shoots derived from shoot apices of grapevine cultured in vitro. Vitis, 20: 228-234.
Gray, D.J. and C.M. Benton, 1991. In vitro micropropagation and plant establishment of muscadine grape cultivars (Vitis rotundifolia). Plant Cell Tiss.Org. Cult., 27: 7-14.
Harris, R.E. and H. Stevenson, 1979. Virus elimination and rapid propagation of grapes in vitro. Proc. Int. Plant. Sci., 63: 311-316.
Harris, R.E. and H. Stevenson, 1982. In vitro propagation of Vitis. Vitis, 21: 22-32.
Helior, M.C., J.C. Fournioux, L. Oziol and R. Bessis, 1997. An improved procedure for the propagation in vitro of grapevine (Vitis vinifera cv. Pinot noir) using axillary bud cuttings. Plant Cell Tiss. Org. Cult., 49: 223-225.
Lee, N. and H. Wetzstein, 1990. In vitro propagation of muscadine grape by axillary shoot proliferation. J. Am. Soc. Hort. Sci., 115: 324-329.
Llyod, G. and B. McCown, 1981. Commercially feasible micropropagation of mountain laurel, Kalmia latifolia, by use of shoot tip culture. Int. Plant. Prop. Soc. Proc., 30: 421-427.
Mhatre, M., C.K. Salunke and P.S. Rao, 2000. Micropropagation of Vitis vinifera L: towards an improved protocol. Sci. Hortic., 84: 357-363.
48 Rapid in vitro propagation of grapevine cv. Crimson Seedless

Murashige, T. 1977. Plant cell and organ cultures as horticultural practices. Acta Hortic., 78: 17-30.
Murashige, T. and F. Skoog, 1962. A revised medium for rapid growth and bioassays with tobacco tissue culture. Physiol. Plant., 15: 473.
Nitsch, J.P. and C. Nitsch, 1969. Haploid plants from pollen grains. Science, 163: 85-87.
Novak, F.J. and Z. Juvova, 1983. Clonal propagation of grapevine through in vitro axillary bud culture. Sci. Hortic., 18: 231-240.
Ravindra, M.B. and P. Thomas, 1995. Sachet technique – an effi cient method for the acclimatization of micropropagated grapes (Vitis vinifera L.). Curr. Sci., 68(5): 546-548.
Roubelakis-Angelakis, K.A. and S.B. Zuvanovitc, 1991. A new culture medium for in vitro rhizogenesis of grapevine (Vitis spp.) genotypes. HortScience, 26: 1551-1553.
Spiegel, M.R., 1992. Theory and Problems of Statistics. 2nd. Edition. Schaum’s Outline Series, McGraw – Hill Book Company, London, 341 pp.
Thomas, P. 1997. Increase in clonal propagation of ‘Arka Neelamani’ grape (Vitis vinifera L.) through induction of axillaries in in vitro layering technique. Ind. J. Agri. Sci., 67(12): 594-596.
Thies, K.L. and C.H. Jr. Graves, 1992. Meristem micropropagation protocols for Vitis rotundifolia Michx. HortScience, 27: 447-449.
Torregrosa, L. and A. Bouquet, 1995. In vitro propagation of Vitis x muscadinia hybrids by microcuttings or axillary budding. Vitis, 34: 237-238.
Torregrosa, L., A. Bouquet and P.G. Goussard, 2001. In vitro culture and propagation of grapevine. In: Molecular Biology and Biotechnology of the Grapevine. Roubelakis-Angelakis, K.A. (ed.) Netherlands, Kluwer Academic Publishers. p. 281-326.
Rapid in vitro propagation of grapevine cv. Crimson Seedless 49

Journal of Applied Horticulture, 10(1): 50-53, 2008
Effect of heavy manuring of phosphorous and its toxicity on growth, photosynthesis and photosynthetic pigments in Zn-effi cient genotype of spearmint MSS-5
A. Misra and P. Singh
Central Institute of Medicinal and Aromatic Plants, Lucknow-226015, India. E-mail: [email protected]
AbstractChanges in growth attributes, photosynthesis (Pn), photosynthetic pigments with γ-Glu.cys peptidase peptide and Zn accumulation in a Zn-effi cient genotype of spearmint MSS-5 were investigated. Effect of phosphorus toxicity on MSS-5 were signifi cantly different than the other genotypes; Arka, Neera and control (the local strain), in terems of phenotypic changes in height and a decrease in chlorophyll contents and CO2 exchange rate. Heavy P manuring lead to the tolerance of Zn accumulation in MSS-5 with γ-Glu.cys.peptidase peptide with high protein contents and Pn. Hence, the P toxicity induced a differential utilization of γ-Glu.cys.peptidase peptide for higher accumulation of Zn in MSS-5 spearmint with higher photosynthetic rate for increasing the height and essential monoterpene oil(s). The study also indicated that accumulation of toxic heavy metal-Zn with γ-Glu.cys.peptidase peptide made protein synthesis easier with antioxidants Zn cofactor enzymes.
Key words: Spearmint, Mentha spicata, Zn-effi cient genotype MSS-5, protein, photosyntheis, photosynthetic pigments, Zn toxicity.
IntroductionThe heavy and unmanaged fertilization of major nutrients viz., N, P & K for the improvement of crop yields, leads to the defi ciency of micronutrients. Heavy doses of P and its precipitation to phosphate salts makes Zn unavailable to the plant (Marschner, 1986). Zn shows the toxicity in medicinal and aromatic plants cultivation (Misra and Ramani, 1991). Furthermore, the acidic soil of hills bears the Fe toxicity in rose cultivation. One way or other, the toxicity of Zn and Fe especially in micronutrients usage affects the productivity and secondary plant products. The phytoremediation is a technique that plants uses to cleanup contaminated soil and water. No work has been reported so far on the cultivation of medicinal and aromatic plants on Fe effi cient genotypes to cleanup the contaminated soil with heavy metal Zn.
Spearmint (Mentha spicata L.) is widely cultivated to obtain the essential monoterpene oil(s). Zn effi cient genotype, MSS-5 has been taken up for the complete exploitation of monoterpene oil(s), with the aim of phytoremediation and to extract out Zn from Zn toxic fi elds. The aim to use this Zn effi cient genotype MSS-5 was to know the physiology and growth behaviour in the wake of phytoremediation processes. In phytoremediation some plants tolerate high levels of toxic micronutrient metals by a variety of mechanisms such as reduced uptake, active effl ux and intracellular and/or extracellular sequestration. The most predominant molecules in intracellular detoxifi cation, widely prevalent in eukaryotes are thiol tripeptides, γ-Glu-Cys peptides or phytochelatins. These are synthesized by phytochelatin synthase which is activated by subleathal metal concentrations and play a crucial role in cytosolic metal detoxifi cation (Steffens, 1990; Zenk, 1996). The physiological concentrations of these intracellular metal binding ligands have sometimes been used
as a specifi c indicator of metal tolerance in plants (Grill et al., 1988), and the role of heavy metals in decline and damage to forest ecosystem (Gawell et al., 1996). Zinc is potentially toxic metal when transferred from plants via food chain to human. Agriculture system is also the principle sources of Zn, includes the heavy P fertilization for crops (Misra and Sharma, 1991).
Possibly Zn tolerant spearmint efficient genotypes MSS-5 cultivation in fi elds leads, for the removal of toxic heavy metal Zn, from heavily phosphorous fertilized soil, for the establishments of tolerant varieties capable of synthesizing more γ-Glu-cys peptides or phytochelatins. The essential monoterpene oil(s) of this effi cient genotypes is commercially important for pharmaceutical and aromatic industries. The effi cient genotype MSS-5 due to toxicity of heavy metals produces the Zn induced Fe defi ciency symptoms. Therefore, a detailed study on the growth and physiology of an effi cient genotype MSS-5 alongwith Arka and Neera was conducted to compare Zn accumulation and tolerance against the phosphorous toxicity and to show the Zn induce Fe defi ciency in genotypes with primary plant products –photosynthetic pigments and Pn, and simultaneously the essential monoterpene oil(s)in spearmints, in heavly phosphorus fertilized crops.
Materials and methodsThe experiment was conducted in controlled glasshouse condition from December to March at an ambient temperature of 27+3oC and with 11 h day length. Uniform suckers of spearmint cultivars viz., MSS-5, Arka, Neera and a local strain (control) were grown in 5,000 cm3 plastic containers containing nutrient solution (Hoagland and Arnon, 1950). Each 2.8 Fe μg mL-1 treatment and mint strain were replicated 6 times and put in completely randomized block design with complete 5.6 Fe μg mL-1 strength, nutrient solution, were taken under the existing
Journal
Appl

studies. The composition of nutrient solution was (as mg L-1): 102 K, 100 Ca, 70 N-NO3, 16 S, 12 Mg, 9 Cl, 5 P, 0.52 B, 0.33 Mn, 0.33 Mo, 0.10 Zn, 0.02 Cu and Fe was as Fe-EDTA (Ferric ethylinediamine tetraacetate). During the study, instead of 5 mg L-1, 10 mg L-1 phosphorous was added in nutrient solution for toxicity in each treatments of 2.8 and 5.6 μg Fe mL-1. Initial pH of the nutrient solution was 6.7 to 6.8, which was monitored and adjusted periodically Zn with 1.0 m M KOH or 2.0 m M H2SO4 to maintain a value of 7.2.
MSS-5, Arka and Neera genotypes when subjected to Fe defi ciency stress (2.8 mg Fe mL-1 treatment), resulted in root exudation, which decrease the pH of the nutrient medium and showed the chlorosis of younger leaves whereas older one remains green. The root exudation and their ability to absorb and utilize iron in the ferrous form vary, with the genotypes of the crop plants. The effi cient genotype of spearmint MSS-5 only turned green after the Fe defi ciency visualizes characters, where as the severe chlorotic Arka and Neera did not turn green. Chlorosis in terms of total chlorophyll were estimated for the cultivar MSS-5 genotype which behaves as a Fe effi cient genotype with more root exudation which was measured with the method of Arnon (1949).
The cultivar MSS-5 genotype behaves as a Fe effi cient genotype with more root exudation of phenolic compounds, especially the caffeic acids. The phenolic compounds, the caffeic acids were estimated in root exudation by the method of Singh et al. (2001). The plan tissue Fe and Zn contents were estimated with 1 N HCl extracts on atomic absorption Pye Unichem, 2900 (Misra, 1992). The lignin was estimated by the Kalson method of Browning (1967), 5 g samples were digested with 72% H2SO4, then diluted with acid; to hydrolize and solubilize the polysachharides. The insoluble residue was dried and weighed as lignin on % basis. This partially solubilized as acid soluble lignin from spearmint, were further quantifi ed on UV absorbance at 410 nm.
HPLC analysis of γ-Glu-cys peptides or phytochelatins (PCs): For the separation of PCs, HPLC analysis was performed in crude extracts of plant tissue following the method of Grill et al. (1991). Frozen plant tissue (1 g FW) was homogenized in 0.5 ml 1 N NaOH containing 1 mg mL-1 sodium borohydride. Alter centrifugation at 13,000 g at 4oC, the supernatants were acidifi ed
by adding 3.6 N HCl and precipitated protein was removed by centrifugation. The protein was estimated by the method of Lowry et al. (1951). Separation of PC peptides was done on a reverse phase C-18 column (μ Bondapack, RP 4 μm) with a linear gradient 0.1% Trifl uoro acetic acids at a fl ow rate 0.5 ml min-1 using the applied biosystem HPLC (model No. 783A) at 220 nm. Experiments were done and HPLC in triplicates, and repeated thrice.
Pn and essential monoterpene oil(s): Initially, Pn of the third leaf was measured in a closed system using a poratable computerized photosynthesis model Li-6000(Licor, Lincoln, USA), as described in Singh et al.(1999) and total essential monoterpene oil(s) were extracted by 100 g fresh chopped leaves in Clevenger’s apparatus (Clevenger, 1928).
All measurements were taken in triplicate and the results are given as means±SE. The data were analyzed statistically by two way ANOVA followed by ‘t-test’ for comparing the means following Armitage (1971). The correlation coeffi cient among the characters were also analyzed further the values are statistically analysed by paired t-test.
ResultsThe effi cient genotype of spearmint cv MSS-5 exudes more root exudates in the nutrient medium (0.54 mg g-1) followed by more acidic medium than the Arka and Neera Chlorosis of younger leaves were more pronounced in MSS-5 with more and more root exudates the older leaves became green, then the Arka and Neera cultivars (Table 1). Results showed that the most Fe effi cient genotype is MSS-5, where the iron uptake is 1440 μg g-1 in roots tissues of spearmint with further more the recovery of chlorotic younger leaves. Converting more Fe for Fe uptake in an effi cient genotype by the help of maximum production of 0.82 mg g-1 phenolic compounds and root exudates -Fe+++ reductants chelation to produce more Fe++ availability to the plant. Table 2 indicates more toxic Zn uptake in tissue concentrations in MSS-5 cultivars (94 μg Zn g-1), with maximum production of protein 1.49 mg g-1 and phytochelatins 45.79 m mol g-1 FW. The role of Zn excess in spearmint is to behave as an antioxidant, as a scavenger to the excess free radicals removal during the
Table 1. Effects of different genotypes of spearmint in defi cient Fe nutrition in younger leaves (at 2.8 μg Fe ml-1) in phosphorous excessGenotype Chlorophyll
(mg g-1)Phenolic
compounds (mg g-1)
Caffeic acid(mg g-1)
Fe uptake (μg g-1)
Lignin (g g-1)
P value
Defi cient RecoveredArka 2.01 2.07 0.65 0.41 1109 1.1 0.01Neera 1.99 2.01 0.68 0.47 1163 1.2 NSMSS-5 1.85 3.11 0.82 0.54 1448 1.4 0.01Control 1.89 3.01 0.71 0.51 1437 1.1 0.01
Table 2. Effect of different genotype of spearmint in defi cient Fe nutrition in younger leaves (at 2.8 μg Fe ml-1) in phosphorous excessGenotype Height
(cm)Zn
accumulation(mg g-1)
Pn(mg (CO2)
m-2s-1 )
Protein (mg g-1)
Oil(%)
γ-Glu Cys peptide
(m mol g-1 FW)
P value
Arka 31 70 124±7* 1.01 0.42 6.48±0.3 0.01Neera 25 82 239±4 1.24 0.49 33.49±1.5 NSMSS-5 42 94 249±2** 1.49 0.56 45.79±2.1 0.01Control 32 90 241±3* 1.37 0.47 41.62±2.1 0.01
*, ** mean values signifi cant at P=0.05 and P=0.01, respectively (Paired t test); NS - nonsignifi cant
Phosphorous and its toxicity on growth, photosynthesis and photosynthetic pigments in spearmint 51

metabolism of essential monoterpene oil(s).
Table 3 indicated the γ-Glu Cys. peptidase peptide for signifi cantly associated with toxic Zn-accumulation (r=0.871, P< 0.01). Zn accumulation and lignin (r=679, P< 0.01) and Zn accumulation with protein (r=747, P< 0.01), respectively.
DiscussionResults indicated the most effi cient and ineffi cient genotype of all the existing cultivars viz., Arka, Neera and MSS-5. The most Fe-effi cient genotype is MSS-5. The root exudation of phenolic compounds (10.87 mg g-1) and caffeic acid (0.54 mg g-1), is more in MSS-5 cultivar where as Arka and Neera had lesser amount. Greening in the form of chlorophyll formation (3.11 mg g-1) and Fe uptake (1448 μg g-1) was found in MSS-5 genotype, whereas it was very less in Arka and Neera. Other workers also reported the same root exudation, and greening of the chlorosis of the genotypes, in different crops (Marschner, 1996; Brown and Jolly, 1986; Kannan, 1982).
Fe effi cient genotype MSS-5 showed the Zn (94 μg Zn g-1) and γ-Glu-cys peptide phytochelatin (45.79 n mol g F.wt.) then lesser concentrations of Zn and phtochelatins in Arka and Neera (Table 2). The heavy P fertilization produced Zn induced Fe-defi ciency (Table 1). This Zn induced Fe defi ciency was reported in Mentha arvensis (Misra and Ramani, 1991). Furthermore, the Zn toxicity facilitates the proteins metabolism due to the antioxidants usage of Zn (Table 2). Phytochelatins and Zn accumulation were more pronounced in spearmint MSS-5.
Plants tolerate high levels of toxic micronutrients – Zn, by a variety of mechanism, such as reduced uptake of Fe, active effl ux and intracellular on extracllular sequestration of Zn. Predominant molecules in intracellular detoxifi cation are γ-Glu-cys peptides or the phtochelatins. These phytochelatins are activated by sublethal metal concentrations and play a crucial role in cytosolic metal detoxifi cation (Steffens, 1990; Zenk, 1996). These intracellular metal binding ligands are being used as a specifi c indicators of metal tolerance (Grill et al., 1988). Zinc is potentially toxic metal when transferred from plants via a food chain to human and then to agriculture systems and vice-versa. Sometimes as an antioxidant dosages, in facilitating the protein synthesis in plants and also make them the Zn tolerant spearmint crops which thus leads to the phytoremediation process for excess Zn removal from the contaminated water and soil.
Moreover, the correlation coeffi cient in Table 3 indicated the Zn accumulation with phytochelatins (r=0.871, P <0.01) and Zn accumulation with lignin (r=679, P<0.05). The above signifi cant
association showed that the phytoremediation processes remove the toxic Zn from the heavily P fertilized fi elds by the Fe-effi cient MSS-5 genotype. The lignin association with Zn accumulation further support for increased insect resistance in spearmint genotype MSS-5.
AcknowledgementThe authors are thankful to the Director, Central Institute of Medicinal and Aromatic Plants, Lucknow for encouragement and facilities provided.
ReferencesArmitage, P. 1971. Statistical Methods in Medical Research. Blackwell
Publication, London, U.K.Arnon, D.I. 1949. Copper enzymes in isolated chloroplasts polyphenol
oxidase in Beta vulgaris. Plant Physiol., 24: 1-15.Browning, B.L. 1967. Methods in wood chemistry. Vol. 11. Wiley
(Interscince), New York USA.Brown, J.C. and Van D. Jolly, 1986. An evaluation of concepts related
to Fe-defi ciency chlorosis. J. Plant Nutr., 7: 175-178.Clevenger, J.F. 1928. Apparatus for determination of essential oils. J.
Amer. Pharm. Assoc.,17: 346-347.Gawell, J.E., B.A. Ahner, A.J. Friedland and F.M.M. Morel, 1996.
Role for heavy metal in forest decline indicated by phytochelatin measurements. Nature, 381: 64-65.
Grill, E., E.L. Winnacker and M.H. Zenk, 1988. Occurrence of heavy metal fi nding phytochelation in plants growing in mining refuse area. Experientia, 44: 539-540.
Grill, E., E.L. Winnacker and M.H. Zenk, 1991. Phytochelatins, In: Methods in Enzymology (Eds. Riordan, J.F. and Valle, B.L.) 205: 333-341.
Hoagland, D.R. and D.I. Arnon, 1950. The water culture method for growing plants without soil. Calif. Agr. Exp. Station. Circ., 347: 32.
Kannan, S. 1982. Genotypic differences in iron uptake and utilization in some crop cultivars. J. Plant Nutr., 5: 531-542.
Lowery, O.H., N.J. Rosenbrogh, A.L. Farr and R.J. Randall, 1951. Protein measurement with folin phenol reagent. J. Biol. Chem., 193: 265.
Merschner, H. 1986. Effect of external and internal factors on root growth and development. In: Mineral nutrition of higher plants. Marschner, H. (ed) Academic Press., New York, USA. pp. 429-446.
Misra, A. and S. Ramani, 1991. Inhibition of iron absorption by Zn-induced Fe-defi ciency in Japanese mint. Acta Physiol. Plant., 13: 37-42.
Misra, A. and S. Sharma, 1991. Critical Zn concentration for essential oil yield and methanol concentration of Japanese mint. Fertilizer Res., 29: 261-265.
Misra, A. 1992. Effect of Zn stress in Japanese mint as related to growth, photosynthesis, chlorophyll contents and secondary plant products
Table 3. Correlation coeffi cients between different characters viz., phenolic compounds, caffeic- acids, Fe uptake, Zn accumulation in M. spicata Characters Phenolic
compoundCaffeic
acidZn
accumulationFe
ptakeLignin Protein
γ-Glu.-Cys.-peptide 0.719** 0.712** 0.871** 0.641* 0.179 0.971**Phenolic compound 0.699* 0.811** 0.821** 0.827** 0.642**Caffeic acid 0.749** 0.714** 0.912** 0.617Zn-accumulation -0.497 0.679* 0.747**Fe uptake 0.579 0.621*Lignin 0.639*
*, ** values are signifi cant P=0.05 or P=0.01, respectively
52 Phosphorous and its toxicity on growth, photosynthesis and photosynthetic pigments in spearmint

on the monoterpene. Photosynthetica, 26: 225-234.Singh, P., S.K. Srivastava and A. Misra, 2001. Extraction of butyl
hydrogen phthalate by iron effi cient Mentha spicata L. var MSS-5 under iron stress. J. Plant Biol., 28: 111-114.
Singh Preety, N.K. Srivastava, A. Mishra and A Sharma, 1991. Infl uence of ethereal and gibberelic acid on carbon metabolism, growth
and essential oil accumulation in spearmint (Mentha spicata). Photosynthetica, 36:509-517.
Steffens, J.C. 1990. The heavy metal binding peptides of plants. Ann. Rev. Plant Physiol. Plant Mol. Biol., 41: 535-574.
Zenk, M.H. 1996. Heavy metal detoxifi cation in higher plants-a review. Gene, 179: 21-30.
Phosphorous and its toxicity on growth, photosynthesis and photosynthetic pigments in spearmint 53

Journal of Applied Horticulture, 10(1): 54-58, 2008
Evaluation of composted biosolid waste as an amendment to a standard horticultural nursery mix for container grown Callicarpa and Ilex production
Anthony W. Kahtz
University of Illinois Extension, Mt. Vernon, Illinois, e-mail: [email protected]
AbstractGrowth of Callicarpa dichotoma (Lour.) ‘Early Amethyst’ and Ilex glabra (L.) ‘Compacta’ liners were evaluated in substrate containing 20, 40, 60, 80 and 100% composted biosolids as compared to a 3:2:1 (v:v:v) pine bark:peat:sand horticultural mix. Biosolid waste substrate amended with biosolids had higher pH, EC, nitrate, bulk density and container capacity compared to a standard horticultural nursery mix. Total porosity and air-fi lled capacity were greater for the control compared to substrate amended with biosolids. The effects of substrate amended with composted biosolids on growth varied for each species. Callicarpa dichotoma “Early Amethyst’ liners grown in substrate amended with 20, 40 and 60% biosolid waste had greater shoot and root dry weight and a better visual evaluation compared to the control. Ilex glabra ‘Compacta’ liners grown in the control (standard nursery mix) had greater shoot and root dry weight and a better visual evaluation compared to any biosolid amended substrate. It was concluded that substrate amended with biosolid waste can be utilized for the container production of plants, however, its usage may be species specifi c.
Key words: Biosolids, sewage sludge, Callicarpa, Ilex, pH, electrical-conductivity, nitrate.
such as municipal leaf waste (Bugbee et al., 1991) and yard waste (Wilson et al., 2003; Wilson et al., 2001b) has also been explored. The utilization of biosolids in this manner could aid in the conservation of peatlands, and reduce land needed for the disposal of biosolids while providing the nursery industry with an inexhaustible alternative substrate amendment.
Several potential benefi ts of biosolids as a substrate amendment are recognized. Biosolids are a source of nutrients (Rosen et al., 1993; Falahi-Ardakani et al., 1987), improve the qualities of substrate (EPA, 1999) and may be a substitute for moss peat (Rosen et al., 1993). Composted biosolids decompose at a slow rate, therefore releasing nutrients at a steadier rate compared to non-composted biosolids (USDA, 1998). Root rot diseases are also suppressed in substrates that are amended with biosolids (Hoitink et al., 1997). In addition, composted biosolids are potentially economically feasible (Bugbee and Frink, 1989; Vega-Sanchez et al., 1987).
Potential barriers in benefi cial usage of biosolids include public reluctance based upon potential health and environmental concerns (US EPA, 1999). These concerns are based upon disease causing pathogens which can be found in untreated wastewater and biosolids. In addition, odors are also a potential problem.
Biosolid stabilization is achieved typically by the addition of quicklime (CaO) or hydrated lime (Ca[OH]2), which is added to either liquid biosolids before dewatering or mixed with dewatered biosolids (US EPA, 1999). These types of lime stabilization procedures meet 40 CFR Part 503 rules governing land application of biosolids.
The primary objectives of this study were to evaluate incorporation of biosolids upon 1) substrate electrical-conductivity (EC), pH and nitrate over a four-month period, 2) examine physical
IntroductionSphagnum peat is a major organic component of container substrate utilized in the nursery industry. Due to the physical and chemical qualities of peat, it is a valuable component in container substrate for the production of ornamental plants. Peat is extracted from peatlands, which are a vital part of a healthy environment. Peat vegetation rids water of heavy metals, pollutants, pathogens, excess nutrients, and stores atmospheric carbon dioxide. It also provides a natural habitat for several animal and bird species. The excavation of peat can be harmful to the biodiversity, hydrological cycle, and purifi cation of water in the area of harvest (Grundling and Dada, 1999). Furthermore, the cost of peat has risen over the past several years (Wilson et al., 2001a).
Given these factors, the nursery industry has increased its interest toward exploring alternative amendments to utilize in traditional potting media (Wilson et al., 2002). Some of the amendments tested include coconut coir (Evans, 2002; Meerow, 1994), rubber tire chips (Jarvis et al., 1996), recycled paper (Craig and Cole, 2000), poultry litter (Fulcher et al., 2002), kenaf stem core (Wang, 1994), spent mushroom compost (Chong et al., 1991) and recycled municipal waste (Kahtz and Gawel, 2004). 2.2 million tons of biosolids (sewage sludge) is incinerated or buried in landfi lls each year in the United States, while at the same time new environmental regulations are making space in landfi lls a scarcity (Rosen et al., 1993). Biosolids are the treated solid organic matter comprised of private or community wastewater that can be benefi cially utilized as a substrate amendment in the nursery industry (US EPA, 1999).
Plants have been shown to successfully grow in substrate that incorporates composted biosolids (Wootton et al., 1981). The usage of biosolids separately and mixed with other components
Journal
Appl

characteristics, and carbon (C) and nitrogen (N) ratios of substrate amended with differing volumes of biosolids and 3) to examine the fi nal shoot and root total dry weights of two different species grown in the substrate. These factors were monitored in order to develop a horticultural nursery mix amended with composted biosolids suitable for containerized shrub production.
Materials and methodsBiosolids produced by Waste Water Treatment Plant of Cookeville, Tennessee was utilized in this project. Biosolids utilized in this study underwent a lime-envessel pasteurization process and met the United States Environmental Protection Agency Federal Register Rules and Regulations Part 503; standards for the use or disposal of sewage sludge (US EPA, 1999). The biosolids were dewatered and quicklimed (CaO) to raise the pH to 12 or above, and pasteurized to produce class A biosolids. The biosolids were then allowed to compost under outdoor conditions for 75 days. A primary goal of composting biosolids is to produce a more stable, less-odorous source of organic matter (Rosen et al., 1993).
Uniform Callicarpa dichotoma ‘Early Amethyst’ and Ilex glabra ‘Compacta’ liners (approximately 7.5 cm tall) were potted in 1-gallon (2.19 L) containers fi lled with 3:2:1 (v:v:v) pine bark:peat : sand mix with composted biosolids. For purposes of this study each species was evaluated as a separate experiment. The biosolids were screened to 3.0 cm and incorporated at rates of 0 (control), 20, 40, 60, 80 and 100% by volume. C and N values were determined before the addition of six grams of 14N-4.2P-11.6K (14-14-14) Osmocote with micronutrients, topdressed on all containers. Plants were grown under a 30 % shadecloth. Three-hundred milliliters of water was supplied twice daily via individual spray emitters. The study was conducted at the Tennessee State University Otis L. Floyd Nursery Crop Research Center in McMinnville, Tennessee.
The Virginia Tech pour-through method was used to collect leachate solution from the container substrate (Wright, 1986). EC and pH readings of leachate samples were taken 15, 30, 45, 60, 75 and 90 days after treatment (DAT). Leachate EC and pH were measured with a Myron Ultrameter™ Model 6P (Myron L Company, Carlsbad, California). Nitrate readings and a visual assessment of each plant were taken 30, 60 and 90 DAT. An Accumet AR 25 and electrode were used to record nitrate readings. The visual assessment was given a scale of 1-5 as follows: 1) plant died, 2) plant was near death or lost many leaves, 3) average looking plant, moderate growth, 4) good growth, few if any problems and, 5) Excellent growth, healthy leaves, no signs of chlorosis or nutrient problems. At the end of the project plants were harvested at the soil level. Container medium was washed from the roots. Dry shoot and root weights were recorded after drying at 70 ˚C for 72 h.
Three replications of each substrate treatment (0, 20, 40, 60, 80 and 100%) were evaluated for total bulk density, container capacity, total porosity, percent moisture and air-fi lled porosity. The North Carolina State University Porometer was utilized to determine the above mentioned substrate physical properties. Percent moisture was determined by drying a known amount of substrate at 105˚C for 24 h and weighing before and after. Container capacity was calculated by dividing the weight of the wet substrate by the
volume of the pot. Standard procedures were utilized to determine bulk density, total porosity, and air-fi lled porosity (North Carolina State University and Fonteno and Bilderback, 1993). Total C and N concentrations were determined by a CNS analyzer (Carlo-Erba NA-1500;BICO, Burbank, California).
The experimental design was a randomized complete block design. Each treatment was replicated 6 times. All data within each experiment were subjected to an analysis of variance (ANOVA). Dunnett’s test were utilized to compare treatments with the control (0% biosolids). The control was a standard horticultural nursery mix.
ResultsInitial pH readings 15 DAT for the C. dichotoma ‘Early Amethyst’ liners revealed that as greater percentages of biosolids were added to the substrate the alkalinity level increased, with the 80 and 100% treatments being signifi cantly greater than the control at 7.8 and 8.9, respectively (Table 1). pH levels generally decreased linearly throughout the duration of the project. pH results were virtually identical for the I. glabra ‘Compacta’ liners (Data not shown).
The C. dichotoma ‘Early Amethyst’ EC of substrate amended with composted biosolids was signifi cantly higher for all treatments compared to the control beginning 15 DAT until conclusion of the project (Table 2). EC reading for the 100% treatment was four and half times greater than the control 15 DAT. However, the EC reading was never above recommended levels for any treatment of either species. The general trend, for all treatments except the control, was for the EC levels to decline or remain relatively constant from 15 DAT until the fi nal reading 90 DAT. The control
Table 1. pH readings by days after treatment for Callicarpa. Values presented for the 20, 40, 60, 80 and 100% treatments are the relative increase or decrease as compared to the non-treated (0%) control
Treatment (% by volume)
pH reading by days after treatment15 30 45 60 75 90
0 7.2z 7.1z 7.4z 7.1z 7.1z 7.0z
20 0.2 0.1 0.2** 0.1 0.1* 0.040 0.1 0.1 0.2** 0.2* 0.2** 0.2*60 0.2 0.2 0.2** 0.2** 0.2** 0.2**80 0.6** 0.2 0.2** 0.2** 0.2** 0.2**100 1.7** 0.7** 0.4** 0.3** 0.3** 0.2**zActual pH reading of treatment.*, ** Dunnett’s test signifi cant at P=0.05 or P=0.01, respectively when compared to 0 % treatment.Table 2. EC readings by days after treatment for Callicarpa. Values presented for the 20, 40, 60, 80 and 100% treatments are the relative increase or decrease as compared to the non-treated (0%) control
Treatment (% by volume)
EC reading by days after treatment (dS m-1)15 30 45 60 75 90
0 0.21z 0.23z 0.24z 0.24z 0.26z 0.27z
20 0.28 0.15** 0.25** 0.19** 0.12** 0.18**40 0.44* 0.34** 0.39** 0.33** 0.20** 0.29**60 0.52** 0.41** 0.51** 0.45** 0.40** 0.40**80 0.47* 0.45** 0.47** 0.42** 0.36** 0.41**100 0.75** 0.40** 0.41** 0.39** 0.43** 0.39**zActual EC reading of treatment.*, ** Dunnett’s test signifi cant at P=0.05 or P=0.01, respectively when compared to 0 % treatment.
Evaluation of composted biosolid waste as an amendment to a standard horticultural nursery mix for container 55

EC levels slowly increased from 15 DAT until 90 DAT. EC results were virtually identical for the I. glabra ‘Compacta’ liners (Data not shown). Nitrate levels for C. dichotoma ‘Early Amethyst’ were signifi cantly greater for the 60, 80 and 100% treatments compared to the control, 30 and 60 DAT (Table 3). At 90 DAT the 100% treatment was signifi cantly greater than the control. Nitrate levels were greatest with increased amounts of incorporated biosolids. Nitrate levels for I. glabra ‘Compacta’ were statistically similar (Data not shown).
Generally, as the percentage of incorporated biosolids increased the bulk density, container capacity and moisture signifi cantly while the total porosity and air-fi lled porosity decreased (Table 4). Treatments that had greater amounts of incorporated biosolids signifi cantly contained more N and less C resulting in lower C/N ratios (Table 5).
C. dichotoma ‘Early Amethyst’ grown in 40 and 60% biosolid amended substrate had the greatest shoot and root weight of any of the treatments, respectively (Table 6). The initial visual evaluation 30 DAT showed the control was the most marketable
of all treatments (Table 7). However, upon conclusion of the project, at 90 DAT, the 40 and 60% treatments had the best visual evaluation. In contrast, I. glabra ‘Compacta’ grown in the 0% (control) had the greatest shoot and root weight compared to the treatments that had incorporated biosolids (Table 6). The control also received the best visual evaluation 30, 60 and 90 DAT (Table 7). Five replications grown in each of the 80 and 100% biosolids died during the fi rst 10 days of the project. Therefore, the 80 and 100% treatment that involved I. glabra ‘Compacta’ were excluded from the data analysis.
DiscussionThe addition of quicklime during the dewatering process greatly contributed to the increased pH levels. Fitzpatrick et al. (1998) reported that stabilized biosolids typically had a high pH due to the chemical stabilizers, such as lime, utilized before composting. In addition, they state that the pH of most commercially produced
Table 3. Nitrate readings by days after treatment for Callicarpa. Values presented for the 20, 40, 60, 80 and 100% treatments are the relative increase or decrease as compared to the non-treated (0%) controlTreatment (% by volume)
Nitrate readings (ppm) by days after treatment30 60 90
0 9.7z 11.9z 5.8z
20 0.5 4.3 1.340 9.2 15.1 2.960 18.2** 27.4** 4.780 11.0* 26.4** 10.5100 13.6** 29.3** 21.0**z Actual ppm of treatment.; ** Dunnett’s test signifi cant at P=0.05 or P=0.01, respectively when compared to 0 % treatment.Table 4. Physical properties of composted substrate amended with biosolids. Values presented for the 20, 40, 60, 80 and 100% treatments are the relative increase or decrease as compared to the non-treated (0%) controlTreatment (% by volume)
Bulk density (g cm3)
Container capacity
(% by vol)
Total porosity
(% by vol)
Air-fi lled Porosity
(% by vol)
Moisture (% )
0 0.21z 56.0z 78.8z 21.1z 25.1z
20 0.08** 5.5* -0.9 -4.6* 11.2*40 0.16** 7.8** -2.1 -10.0** 12.5*60 0.27** 10.6** -3.5 -14.2** 11.5*80 0.37** 10.3** -4.4 -15.1** 9.2100 0.46** 12.4** -5.4* -15.9** 10.7*z Actual measurement of treatment; *, ** Dunnett’s test signifi cant at P=0.05 or P=0.01, respectively when compared to 0 % treatment.Table 5. Nitrogen and carbon concentrations of composted substrate amended with biosolids. Values presented for the 20, 40, 60, 80 and 100% treatments are the relative increase or decrease as compared to the non-treated (0%) controlTreatment (% by volume)
N(%) C(%) C/N ratio
0 0.65z 49.9z 76z
20 0.31* -13.0* -39*40 0.47* -19.9* -50*60 0.64* -25.7* -58*80 0.77* -29.4* -62*100 0.83* -31.7* -64*z Actual measurement of treatment; *, ** Dunnett’s test signifi cant at P=0.05 or P=0.01, respectively when compared to 0 % treatment.
Table 6. Growth characteristics of Callicarpa and Ilex liners grown for four months in composted substrate amended with biosolids. Values presented for the 20, 40, 60, 80 and 100% treatments are the relative increase or decrease as compared to the non-treated (0%) control Treatment (% by volume)
Shoot dry wt (g)
Root dry wt (g)
Shoot: root ratio
Callicarpa0 22.85z 13.31z 1.73z
20 6.73 5.30* -0.1240 11.61** 5.60* 0.1060 16.96** 5.73* 0.4080 -7.43 -5.61* 0.32100 -17.87** -10.83** 0.23Ilex0 8.70z 2.22z 3.87z
20 -4.22 -0.80 -0.7240 -5.63** -1.26** -0.6760 -5.05* -0.95* -1.0080 - - -100 - - -z Actual weight of treatment; *, ** Dunnett’s test signifi cant at P=0.05 or P=0.01, respectively when compared to 0 % treatment.
Table 7. Visual evaluation ratings of Callicarpa and Ilex liners. Values presented for the 20, 40, 60, 80 and 100% treatments are the relative increase or decrease as compared to the non-treated (0%) controlTreatment(% by volume)
Visual evaluation by days after treatment30 60 90
Callicarpa0 5.00z 4.16z 4.08z
20 -0.16 0.41 0.3340 -0.66 0.50 0.5860 -0.91* 0.25 0.5880 -3.00** -1.16** -0.18100 -3.90** -2.06** -0.48Ilex0 4.25z 4.50z 4.58z
20 0.33 -0.33 -0.83*40 -0.41 -1.00** -1.16**60 -0.41 -1.00** -1.16**80 - - -100 - - -z Actual measurement of treatment; *, ** Dunnett’s test signifi cant at P=0.05 or P=0.01, respectively when compared to 0% treatment.
56 Evaluation of composted biosolid waste as an amendment to a standard horticultural nursery mix for container

compost ranges from 6.7 to 7.7. The pH recommended for optimum nutrient uptake by plants ranges from 5.0 to 6.0 (Southern Nursery Assoc., 1997) to 5.2 to 6.2 (Ruter and Garber, 1993). However, depending upon the crop and method of fertilization, variations will exist. Therefore, the substrate with 80 and 100% biosolids volumes may have had a detrimental impact upon C. dichotoma ‘Early Amethyst’ root growth and subsequent foliar and overall plant development. Mortality in I. glabra ‘Compacta’ planted in 80 and 100% sewage sludge appears to be due to an excessively alkaline pH. C. dichotoma ‘Early Amethsyt’ appears to be more tolerant of alkaline substrate than I. glabra ‘Compacta’. The pH values of the 80 and 100% treatments for both plant species were greater than the pH of most commercially produced compost (Fitzpatrick et al., 1998). Furthermore, the control had the lowest pH of any of the treatments for both species.
High soluble salt content has been observed with many substrates that had incorporated biosolids (Chaney et al., 1980). Results revealed that EC levels were higher with greater amounts of sewage sludge incorporated into the substrate. However, EC levels at no point during the project were above recommendations for the best management and growth of either species. This is in contrast to Chaney et al. (1980) reporting that soluble salt levels may be problematic in biosolid compost. Research has shown that compost comprised of biosolids and yard waste resulted in the greatest plant growth compared to other composted materials (Fitzpatrick and Verkade, 1991).
Increased growth of C. dichotoma ‘Early Amethyst’ may be attributed to increased NO3-N, which is presumably derived from nitrifi cation of NH4-N. Decreased plant growth may be attributable to excessive amounts of NH4-N and excessively alkaline substrate (Bugbee and Frink, 1989). Excessive levels of NH4-N and pH may become more favorable to plant growth by further modifying the composting process. The addition of sawdust, for example, during the composting process may help to reduce substrate pH.
Greater bulk densities and container capacities of the biosolid amended substrate compared to the standard nursery mix are attributed to increased amounts of incorporated biosolids. Reduced total porosity and air-fi lled capacity are also attributed to increased amounts of biosolids. Due to the physical density of biosolid material it tends to reduce air-fi lled porosity, thus reducing drainage.
Composts with a C/N ratio less than 20 are considered to be optimal for the growth and development of plants (Davidson et al., 1994). Compost with C/N ratios higher than 30 may be immature or lacking stability, which may promote plant phytotoxicity and mineral immobilization (Zucconi et al., 1981). Hue and Sobieszczyk (1999) reported that N immobilization was minimal if C/N ratios are maintained between 15 to 20. Given these results, the composted substrate utilized in the study was considered stable and benefi cial for the release of N.
Depending upon the plant species, a standard nursery mix amended with biosolids up to 60% or less (by volume) provided an adequate substitute for moss peat for containerized production of C. dichotoma ‘Early Amethyst’. However, the growth of I. glabra ‘Compacta’ in substrate amended with biosolids was detrimental to the plants’ growth and development with the standard nursery mix yielding the best plant growth and development. All C.
dichotoma ‘Early Amethyst’ treatments were visually considered marketable. In contrast, only the control and 20% biosolid treated I. glabra ‘Compacta’ plants were visually considered marketable. However, the results demonstrate that there is a potential usage for biosolids in the container production of plants. These results reveal that the use of dewatered biosolids as a substrate amendment for increased plant production is species specifi c.
AcknowledgementsThe author thanks the WasteWater Treatment Plant of Cookeville, Tennessee. This research was conducted at Tennessee State University.
ReferencesBugbee, G.J. and C.R. Frink,1989. Composted waste as a peat
replacement in peat-lite media. HortScience, 24(4): 625-627.Bugbee, G.J., C.R. Frink and D. Migneault, 1991. Growth of perennials
and leaching of heavy metals in media amended with a municipal leaf sewage sludge and street sand compost. J. Environ. Hort., 9(1): 47-50.
Chaney, R.L., J.B. Munns and H.M. Cathey, 1980. Effectiveness of digested sewage compost in supplying nutrients for soiless potting media. J. Amer. Soc. Hort. Sci., 105(4): 485-492.
Chong, C., R.A. Cline, D.L. Rinker and O.B. Allen, 1991. Growth and mineral nutrient status of containerized woody species in media amended with spent mushroom compost. J. Amer. Soc. Hort. Sci., 116(2): 242-247.
Craig, P.B. and J.C. Cole, 2000. Recycled paper as a growth substrate for container spirea prodcution. HortScience, 35(7): 1253-1257.
Davidson, H., R. Mecklenburg and C. Peterson, 1994. Nursery management: Administration and culture. 3rd ed. Prentice Hall, Englewood Cliffs, N.J.
Evans. M.R. 2002. Getting to the coir of your media. NM Pro. March. 75,76,78.
Falahi-Ardakani, A., J.C. Bouwkamp, F.R. Gouin and R.L. Chaney, 1987. Growth response and mineral uptake of vegetable transplants grown in a composted sewage sludge amended medium. I. Nutrient supplying power of the medium. J. Environ. Hort., 5(3): 107-111.
Fitzpatrick, G.E., E.R. Duke and K.A. Klock-Moore, 1998. Use of compost products for ornamental crop production: Research and grower experiences. HortScience, 33(6): 941-944.
Fitzpatrick, G.E. and S.D. Verkade, 1991. Substrate infl uence on compost effi cacy as a nursery growing medium. Proc. Fla. State Hort. Soc., 104: 308-310.
Fonteno, W.C. and T.E. Bilderback,1993. Impact of hydrogel on physical properties of coarse-structured horticultural substrates. J. Amer. Soc. Hort. Sci., 118(2): 217-222.
Fulcher, A., C. Finneseth and W.C. Dunwell, 2002. Use of pelletized poultry litter as a container substrate. Proc. Southern Nursery Assn. Res. Conf., 47: 73-76.
Grundling, P.L. and R. Dada, 1999. Peatlands of South Africa. http: //www.psybergate.com/wetfi x/ShareNet/Sharenet3/Share.htm
Hoitink, A.J., M.A. Rose and R.A. Zondag, 1997. Composted biosolids: an ideal organic amendment for container media supplying both nutrients and natural suppression of root rots. Ohio State Univ. Bulletin. Special Circular 154.
Hue, N.V. and B.A. Sobieszczyk,1999. Nutritional values of some biowastes as soil amendments. Compost Sci. Utilization, 7(1): 34-41.
Jarvis, B.R., J.B. Calkins and B.T. Swanson, 1996. Compost and rubber tire chips as peat substitutes in nursery container media: effects on chemical and physical media properties. J. Environ. Hort., 14(3): 122-129.
Evaluation of composted biosolid waste as an amendment to a standard horticultural nursery mix for container 57

Kahtz, A.W. and N.J. Gawel, 2004. Growth of barberry liners in media amended with noncomposted recycled waste. HortTechnology, 14(2): 22-25.
Meerow, A.W. 1994. Growth of two subtropical ornamentals using coir (coconut mesocarp pith) as a peat substitute. HortScience, 29(12): 1484-1486.
North Carolina State University Horticultural Substrates Lab. <http: //www2.ncsu.edu: 8010/unity/lockers/ project/hortsublab/>.
Rosen, C.J., T.R. Halbach and B.T. Swanson, 1993. Horticultural uses of municipal solid waste composts. HortTechnology, 3(2): 167-173.
Ruter, J.M. and M.P. Garber, 1993. Ornamental Horticulture Facts, Extension Horticulture Department, The Univ. of Georgia. Fact Sheet H-93-0105, Measuring soluble salts and pH with the pour-through method.
Southern Nursery Assoc., 1997. Best management practices guide for producingcontainer-grown plants. Southern Nurserymen’s Assoc., Marietta, Ga.
United States Environmental Protection Agency, 1999. Biosolids generation, use and disposal in the United States. EPA 530-R-99-009, <http: //www.epa.gov/ epaoswer/non-hw/compost/biosolid.pdf.>
United States Department of Agriculture, 1998. Agricultural uses of municipal, animal and industrial byproducts. Agricultural Research Service: Conservation Research Report, Number 44. January.
Vega-Sanchez, F.E., F.R Gouin and G.B. Wilson, 1987. Effects of curing time on physical and chemical properties of composted sewage sludge and on the growth of selected bedding plants. J. Environ. Hort., 5(2): 66-70.
Wang, Y.T. 1994. Using ground kenaf core as a major component of container media. J. Amer. Soc. Hort. Sci., 119(5): 931-935.
Wilson, S.B., P.J. Stoffella and D.A. Graetz, 2003. Compost amended media and irrigation system infl uence containerized perennial salvia. J. Amer. Soc. Hort. Sci., 128(2): 260-268.
Wilson, S.B., P.J. Stoffella and D.A. Graetz, 2002. Development of compost-based media for containerized perennials. Scientia Hortic., 93: 311-320.
Wilson, S.B., P.J. Stoffella and D.A. Graetz, 2001a. Evaluation of compost as an amendment to commercial mixes used for container-grown golden shrimp plant production. HortTechnology, 11(1): 31-35.
Wilson, S.B., P.J. Stoffella and L.A. Krumfolz, 2001b. Containerized perennials make good use of compost. BioCycle, August 2001.
Wright, R.D. 1986. The pour-through nutrient extraction procedure. HortScience, 21(2): 227-229.
Wootton, R.D., F.R. Gouin and F.C. Stark, 1981. Composted, digested sludge as a medium for growing fl owering annuals. J. Amer. Soc. Hort. Sci., 106(1): 46-49.
Zucconi, F., A. Pera and M. Forte. 1981. Evaluating toxicity of immature compost. Biocycle, 22: 54-57.
58 Evaluation of composted biosolid waste as an amendment to a standard horticultural nursery mix for container

Journal of Applied Horticulture, 10(1): 59-62, 2008
Evaluation of seasonal nutrient status in the leaves of different olive varieties grown on calcareous soils
M.M. El-Fouly*, S.H.A. Shaaban and A.A. El-Sayed
Department of Fertilization Technology, National Research Centre, Dokki, Egypt. *Email: [email protected]
AbstractThe study was conducted for two successive years at a private farm in El-Saf, Giza, Egypt on 19 years old trees of olive cultivars, Picual, Aggizi and Manzanillo, grown in calcareous soils. Leaf nutrients were measured bi-monthly during the 2001-2002 growing season. The study revealed that most of nutrients in the soil were at inadequate level. Nutrient concentrations in the leaves of the three cultivars were nearly the same. Results revealed that leaf N ranged between low to satisfactory. P contents were adequate in spring while inadequate in summer. K leaf contents were adequate. Peaks of Mg were found to be the highest during winter. Ca peaks were observed during March-June. Fe and Zn were inadequate while Mn was adequate. The concentrations of Fe, Mn and Zn peaked during June, which could be due the repeated foliar application of these nutrients during this period. The seasonal nutrient changes (N, P, K, Ca, Mg, Fe, Mn, Zn and Cu) of the olive leaves are supposed to be used as a guide for proper fertilization. Nutrients should be added as acidic fertilizer to the soil, which is useful in calcareous and high pH conditions.
Key words: Olive, Olea europaea L., leaf nutrients, seasonal variations.
IntroductionDuring recent years Egypt, calcareous soil under cultivation in was estimated to reach about one million feddans (1 feddan= 0.42 ha). The programs of agricultural development in Egypt aim to increase the cultivated areas with olive trees in these soils. Soils in El-Saf area are highly calcareous. These soils contain about 3% to more than 20% CaCO3 with pH values in the range of 8.0 to 9.0. Their inherited fertility is low. Olive is extensively grown in these calcareous soils. Proper nutrient management is required to grow olive successfully on such soils. Olive trees do much better with changes to their nutritional status through good nutrition. Controlled nutrient supply during different seasons can produce higher yield.
Few data are available concerning seasonal nutrient status. Soil and leaf analysis have been developed over the years to help growers to diagnose tree nutrient status and soil nutrient availability and make adjustments on fertilization programs accordingly. The purpose of the present investigation was to detect seasonal changes in the nutrient status of some olive varieties grown in calcareous soils, to be used as a tool to optimize fertilizers use.
Materials and methods The study was conducted at an olive orchard established on calcareous soil located in El-Saf, (Giza, Egypt) during two successive years (2001-2002). The orchard contained nineteen years old olive trees (Olea europaea L.) of three different varieties namely, Picual, Manzanillo (dual purpose) and Aggizi (table olives), the three most common olive varieties grown in this area. Trees were uniform in growth and cultivated at 6 x 6 m distance (278 tree/ha). The trees were in good physical condition, free from insect damage and diseases and were subjected to the same management treatments. The trees received the following
agricultural practices during the period of the study:
Fertilization: (1) 28 m3 cattle manure ha-1, in January; (2) 278 kg N ha-1, as ammonium nitrate (33.5% N), added in 4 equal doses in March, May, July, and August. (3) 74 kg P2O5 ha-1, as single super phosphate (15.5% P2O5) in 1 dose in February; (4) 228 kg K2O ha-1. as potassium sulfate (48% K2O) in 3 equal splits in March, May and July; (5) concerning micro nutrient fertilizers, the trees were sprayed three times in March, May and June using a compound containing 6.5% Zn-EDTA, 4.5% Mn-EDTA and 2.25% Fe-EDTA in concentrations of 1.5 g L-1 in the spray solution.
The trees were drip irrigated from deep well of water containing 838 ppm total soluble solids with pH 8.24 for 8 hours every 2 days from the beginning of June till the end of September. Then the irrigation period extended to 4 days during the rest eight months. Total amount of water used was 5450 m3/year/ha. Plant protection treatments were applied when required. The average yield/tree was 8.33 kg in non-bearing year (2001), and 35.57 kg, in bearing year (2002).
Sampling
Soil samples: Samples were taken from the root tip zone of the trees in May. Soil samples were air dried then sieved to pass a 2 mm sieve.
Leaf samples: Leaves from the selected trees were collected from the fully mature leaves of spring fl ush in the fi rst week of every month. The 2nd and the 3rd leaves from the fruit bearing branches of about 20 trees, 5-10 leaves from each, were randomly taken around the tree. During the two years, the number of samples were 36 for each variety. The samples were washed with tap water, 0.01 N HCL and distilled water, respectively, then dried at 70 oC and ground in a stainless steel mill.
Analysis: Soil samples were analyzed for texture with a hydrometer (Kilmer and Alexander, 1949), for pH and electric
Journal
Appl

conductivity (EC) using water extract (1:2.5) method, (Jackson, 1973), for total calcium carbonate (CaCO3%) by calcimeter method as described by Alison and Moodle (1965) and organic matter (OM%) content according to Walkley and Black (1934) using potassium dichromate (Chapman and Pratt, 1978). Nitrogen calculated from soil organic matter due to its quick changes, depending on environmental factors. Phosphorus was extracted using sodium bicarbonate (Olsen et al., 1954). Potassium (K+) and Magnesium (Mg+2) were extracted using ammonium acetate. Iron (Fe+2), Manganese (Mn+2), Zinc (Zn+2) and Copper (Cu+2) were extracted using DPTA (Lindsay and Norvell, 1978).
The plant material was digested using an acid mixture consisting of nitric, perchloric and sulfuric acids in the ratio of 8:1:1 (v/v), respectively (Chapman and Pratt, 1978). Nitrogen (N) was determined in the dry plant material using the boric acid modifi cation described by Ma and Zuazaga (1942), and distillation was done using a Buechi 320-N2-distillation unit. Phosphorus was photometrically determined using the molybdate vanadate method according to Jackson (1973). Potassium was determined using fl ame photometer Eppendorf. Mg2+, Fe+2, Mn+2, Zn+2 and Cu+2 were determined using the atomic absorption spectrophotometer PMQ3. The soil data were evaluated using the criteria published by Ankerman and Large (1974) and Lindsay and Norvell (1978), whereas the leaf analysis data were evaluated according to the criteria suggested by Bouat (1964), Hartmann et al. (1966) and Recalde and Chaves (1975).
Results and discussionSoil properties and nutrient status of soils: From Table 1, it can be noticed that soil pH had high value (8.33). Under such high alkaline conditions, availability of some nutrients is expected to be low. Electric conductivity (EC) was high. The soil samples were found to be high in CaCO3; contained greater than 10% CaCO3 which is expected to have an adverese effect on the nutrient availability (Ankerman and Large, 1974). The soil of the orchard was very poor in organic matter content (0.31%).
Table1. Soil characteristicsCharacteristic Nutrient contentSand % 93 N (mg/100g) 15.50 VLSilt % 04 P (mg/100g) 4.55 HClay % 03 K (mg/100g) 8.26 VLTexture Sandy Mg (mg/100g) 20.00 LpH 8.33H Ca (mg/100g) 270.00 HE.C dS/m 0.68H Na (mg/100g) 37.20 HCaCO3 % 10.8H Fe (mg/kg) 15.57 MOM% 0.31VL Mn (mg/kg) 3.33 VL
Zn (mg/kg) 0.80 LCu (mg/kg) 0.83 L
VL= very low L= low M= medium H= high
Table 1 also depicts the average values of the major nutrient concentration in the soil samples, total nitrogen was very low and available P-content was 4.55mg/100 g soil. According to (Ankerman and Large, 1974), this P-concentration is considered to be high. However, under the conditions of such soil (high CaCO3 and high pH), the availability of P is expected to be reduced, and plants might suffer from P- defi ciency. Extracted potassium levels seem to be very low. Therefore, potassium fertilizers were added
to compensate the K defi ciency in the soil, especially those soils of high sand content as the soil under investigation. The extractable Ca was high, while the extractable Mg was low. In this context, Mengel and Kirkby (1987) mentioned that Mg+2 uptake by plants can be restricted by the high levels of Ca+2 in the root medium, which might lead to Mg defi ciency in plants, in spite of its high levels in the soil.
Calcareous soils may contain medium levels of total Fe, but in unavailable forms to plants. The extractable Fe2+ level of the present soil samples was in the medium range and Mn+2 was very low, and it tends to form Mn – organic matter complexes under such high pH conditions, which makes it less available to trees. Available Zn+2 can be reduced due to formation of Zn-carbonates. The values of Zn in this study were low. Also, Cu was low in the soil, as it’s known in most calcareous soils, which contain inadequate levels of available copper. In addition, the uptake of micronutrients is depressed by increasing P contents in the soil.
Nutrient status of olive leaves: It is well known that olive trees are very effi cient in absorption of nutrients from the soil. Nutrient concentration in the leaves followed the same behaviour in the cultivars under study. Nitrogen concentration in the leaves ranged between 1.0-2.6% (on dry matter basis) (Fig. 1), which tends to be low. This may be due to high leaching of ammonium nitrate in such soil with 93% sand. It is recommended to add nitrogen as ammonium sulphate, which is less leached and more effi cient in calcareous and high pH conditions. Johnston (2004) reported that when ammonium sulphate is applied one pH unit can be decreased and this pH change is important for P supply and also for micronutrient supply. P-concentrations in the mature spring leaves ranged between 0.10-0.20% (Fig. 1) which are adequate, while in summer, they were less than 0.10%.
Potassium concentrations in the leaves ranged between 1.0-2.2% (Fig.1), which, is in the adequate range. Some researchers mentioned that low concentrations of K in olive leaves are not uncommon in olive groves planted on calcareous soils. Higher magnesium concentration peaks were found during winter (November-January), while calcium concentrations were high during March-June.
Fig. 2 illustrates the micronutrient concentrations in the leaves of olive trees throughout the year. Fe concentrations can be higher than, equal to, or lower than those in normal trees. Thus, this disorder on calcareous is not always attributable to Fe defi ciency; a high concentration of calcium in the soil is likely to make iron defi ciency more severe, a condition known as lime-induced Fe chlorosis. The severity of the disorder increases at high pH. In general, Fe-concentrations were inadequate and peaked in May-June to reach about 200-300 ppm. Mn2+ concentrations followed the same trend in the three cultivars under study. Concentrations of Mn were adequate and peaked in June to reach the range between 70-80 ppm. Olive trees are known to be very sensitive to Zn defi ciency. Marschner (1993) found that in soils with very high pH and CaCO3 and very low in organic matter, availability of Zn to plant roots is extremely low. As a result of factors described above most Zn concentrations in this study were low. Zn concentration was less than 25 ppm except in June when it reached to about 60 ppm. The concentrations of Fe, Mn, and Zn (peaked during June), were affected by the repeated foliar application of these nutrients
60 Evaluation of seasonal nutrient status in the leaves of different olive varieties grown on calcareous soils

050
100150200250300350
1/5 1/6 1/7 1/8 1/9 1/10
1/11
1/12 1/1 1/2 1/3 1/4
Tota
liron
(ppm
)
01020304050607080
1/5 1/6 1/7 1/8 1/9 1/10
1/11
1/12 1/1 1/2 1/3 1/4
Man
gane
ss(p
pm)
0
10
20
30
40
50
1/5 1/6 1/7 1/8 1/9 1/10
1/11
1/12 1/1 1/2 1/3 1/4
Zinc
(ppm
)
0
10
20
30
40
50
1/5 1/6 1/7 1/8 1/9 1/10
1/11
1/12 1/1 1/2 1/3 1/4
Cop
per(
ppm
)
Picual Aggazie Manzanillo
to trees after fruit setting during this period.
The peak of Fe, Mn and Zn in June, could be due to foliar application of these nutrients, which improved its concentrations in leaves. Boaretto et al. (2002) and Sanchez and Righetti (2002) found that when severe Zn defi ciency symptoms appear, early spring foliar sprays could increase the micronutrient concentration in the targeted organs. Also, Swietlik (2002) mentioned that it could stimulate vegetative growth. Similar results were found by Shaaban and El-Fouly (2005).
It is well known in calcareous soil that Cu-availability and
consequently its concentration in leaves of grown plant are expected to be low due to high soil pH. In this study Cu-concentration was found to be less than the adequate range in most samples. In some samples Cu-concentration was found to be high. This might be due to use of Cu-containing pesticides.
It could be concluded that nutrient concentration in olive leaves is greatly affected by soil characteristics as well as farm management.Soil characterstics and plant nutrient requirement should be considered when preparing a fertilizer recommendations.
AcknowledgmentsThis work was conducted as a part of the Egyptian-German project “Micro-nutrients and Other Plant Nutrition Problems in Egypt” executed by the National Research Center (NRC) (Coordinator, Prof. Dr. M.M. El-Fouly) and the Institute for Plant Nutrition, Technical University, Munich (Prof. Dr. A. Amberger). Authors are thankful to the Egyptian Academy of Scientifi c Research and Technology (ASRT), and the German Federal Ministry of Technical Cooperation for support and technical cooperation.
Fig. 2. Monthly concentrations of micronutrients in the leaves of different olive cultivars (Each value is the mean +SE of three replicates)
Fig. 1. Monthly concentrations of macronutrients in the leaves of different olive cultivars (Each value is the mean + SE of three replicates)
Evaluation of seasonal nutrient status in the leaves of different olive varieties grown on calcareous soils 61
00.5
11.5
22.5
3
1/5 1/6 1/7 1/8 1/9 1/10 1/11 1/12 1/1 1/2 1/3 1/4
Nitr
ogen
(%)
0
0.05
0.1
0.15
0.2
0.25
1/5 1/6 1/7 1/8 1/9 1/10 1/11 1/12 1/1 1/2 1/3 1/4
Phos
phor
us(%
)
0
0.5
1
1.5
2
2.5
1/5 1/6 1/7 1/8 1/9 1/10 1/11 1/12 1/1 1/2 1/3 1/4
Pota
ssiu
m(%
)
0
0.20.4
0.6
0.81
1.2
1/5 1/6 1/7 1/8 1/9 1/10 1/11 1/12 1/1 1/2 1/3 1/4
Mag
nesi
um(%
)
0
1
2
3
4
1/5 1/6 1/7 1/8 1/9 1/10 1/11 1/12 1/1 1/2 1/3 1/4
Cal
cium
(%)
Picual Aggizi Manzanillo

ReferencesAlison, L.E and C. D. Moodle, 1965. Carbonate. In: C. A. Black (ed.),
“Methods of Soil Analysis”. Amer. Soc. Agron. Inc., Madison, Wisc. USA, pp. 1379-1396.
Ankerman, D. and R. Large, 1974. Soil and plant analysis. Tech. Bull. A & L. Agricultural laboratories. Inc., New York, USA, pp. 42-44 and 74-76.
Boaretto, A.E., R.M. Boaretto, T. Muraoka, V.F. Nascimento Filho, C.S. Tiritan and F.A.A. Mourão Filho, 2002. Foliar micronutrient effects on citrus fruit yield, soil and leaf Zn concentrations and 65Zn mobilization within the plant. Acta Hortic., 594: 203-209.
Bouat, A. 1964. L’analyse foliaire et l’olivier. (Foliar analysis in olive trees.) Colloque Européen sur le Controle de la Nutrition Mineral et de la Fertilization. Montpellier, France. 28 September-3 October.
Chapman, H.D. and P.F. Pratt, 1978. Methods of analysis for soils, plants and waters. Division of Agric. Sci., Univ. California, Berkeley, USA, 309 p.
Hartmann, H.H., K. Uriu and O. Lilleland, 1966. Olive nutrition. In:Nutrition of fruit Crops. (Ed.N.F.Childers.), Hortic.Publs: New Brunswick, N.J., pp. 252-261..
Jackson, M.L. 1973. Soil Chemical Analysis, Prentice-Hall of India Private Limited, New Delhi, India.
Johnston, A.E. 2004. Micronutrients in soil and agro systems: occurrence and availability. Proceedings No. 544, International Fertilizer Society, York, UK.pp1-32
Kilmer,V.J. and L.T. Alexander, 1949. Methods of making mechanical analysis of soils. Soil Sci., 68: 15-24.
Lindsay, W.L. and W.A. Norvell, 1978. Development of a DTPA soil test for zinc, iron, manganese and copper. Soil. Science Society of America, 42: 421-428.
Ma, T.S. and C. Zuazaga, 1942. Micro-kjeldahl determination of nitrogen, a new indicator and an improved rapid method. Indust. Eng. Chem. Anal., Ed., 14, 280-286
Marschner, H. 1993. Zinc uptake from soils, In: Zinc in Soils and Plants. (A.D. Robson, ed.), Kluwer Academic Publishers, Dordrecht, The Netherlands, pp.59-77.
Mengel, K. and E.A. Kirkby, 1987. Principles of plant nutrition. International Potash Inst. Bern. Switzerland, 650 p.
Olsen, S.R., C.W. Cole, SS. Watanabe and L.A. Dean, 1954. Estimation of available phosphorus in soil by extraction by sodium bicarbonate. USDA Agric. Cricular, 939, 19p.
Recalde, L. and M. Chaves, 1975. La fertilisation de l’olivier. Seminaire Oleicole International Cordoue (Espagne), 25pp.
Sanchez, E.E. and T.L. Righetti, 2002. Misleading zinc defi ciency diagnoses in pome fruit and inappropriate use of foliar zinc sprays. Acta Hortic., 594: 363-368.
Shaaban, S.H.A. and M.M. El-Fouly, 2005. Distribution of nutrients in the active root area of olive trees under a drip irrigation system in a sandy soil. Acta Agronomica Hungarica, 53(3): 339-347.
Swietlik, D. 2002. Zinc nutrition of fruit trees by foliar sprays. Acta Hortic., 594: 123-130.
Walkley, A. and I.A. Black, 1934. An examination of the Degtjareff method for determining soil organic matter and a proposed modifi cation of the chromic acid titration method. Soil Sci., 37: 29-38.
62 Evaluation of seasonal nutrient status in the leaves of different olive varieties grown on calcareous soils

Journal of Applied Horticulture, 10(1): 63-66, 2008
Evaluation of zinnia cultivars for fi eld grown cut fl ower production
R. Crofton Sloan and Susan S. Harkness
North Mississippi Research and Extension Center, P.O. Box 1690, Verona, MS, 38879, USA. E-mail: [email protected]
AbstractThe objective of the study was to evaluate the effects of cultivar and planting date on zinnia (Zinnia elegans) cut fl ower production. Parameters evaluated were the number of days to harvest, duration of harvest period for each planting date, number of stems per plant, stem length and diameter. Plants from the May planting date produced stems over a longer period of time compared to plants from the June and July plantings with the exception of ‘Scarlet Splendor’ from the July planting. Within each of the three planting dates, there were no statistically signifi cant differences in the number of stems produced per plant due to the cultivar effect for 10 of the 13 cultivars evaluated. A trend of increasing stem and bloom size from the May planting date to the July planting was observed. The median number of stems produced by the zinnia cultivars in this study from the May, June, and July planting dates were respectively 21.6, 10.8 and 14.5 stems per plant for plants spaced one foot apart in the row. The potential stem yield for a single 100 ft row of the zinnia cultivars included in this trial was 2160, 1080 and 1450 stems for the production life of May, June, and July plantings, or 4690 stems for the three plantings combined. The cut fl ower zinnias evaluated in this study were very productive during the summer growing season.
Key words: Zinnia elegans, zinnia, cut fl ower, fi eld production
IntroductionFloriculture and ornamental crop production has grown to be one of the largest segments of U.S. agriculture, and in 2003 with a farm value of $14.4 billion, trailed only corn and vegetables in value among crops (Jerardo, 2004). Cut fl ower production, a segment of the fl oriculture industry, in the U.S. in 2006 had an estimated value of $385 million. This was about half the value of imported cut fl owers in 2006, $750 million (Jerardo, 2006). These production fi gures are for ‘mainstream’ fl orist fl owers that are produced in ideal microclimates around the world and then transported to distant markets.
In US, there is growing interest in producing specialty cut fl owers that are not considered ‘traditional’ cut fl owers but are still in demand by fl orists, designers, and consumers (Armitage, 1993). Research efforts have identifi ed fl oral crops that can be produced in Mississippi that meet the quality criteria of local fl orists who have indicated a willingness to purchase these crops if supply and quality were available (Sloan and Harkness, 2002; Sloan et al., 2003). Other studies indicated that zinnia has excellent fi eld production potential (Starman et al., 1995). The Association of Specialty Cut Flower Growers conducted on-farm trials to identify superior cut fl ower cultivars, including zinnia, for fi eld production (Dole, 2005). The ‘Benary’s Giant’ series of zinnia was awarded the Association of Specialty Cut Flower Growers Cut Flower of the Year in 1999 (ASCFG, 1999). The ‘Benary’s Giant’ series has been an industry standard for cut fl ower zinnia since then. An inclination by consumers to purchase locally produced fl owers has been identifi ed. Hudson and Griffi n (2004) reported that consumers responding to survey indicated a willingness to
Mention of trademark or proprietary product does not constitute a guarantee or warranty of the product and does not imply its approval to the exclusion of other products that may also be suitable.
pay a premium price for fl owers grown in Mississippi compared to those fl owers grown outside of Mississippi. The objective of this study was to evaluate the effects of cultivar and planting date on zinnia cut fl ower production.
Materials and methodsThirteen zinnia cultivars were seeded into 1204 cells containing Metro Mix 366 media on three dates: April 25, May 27, and June 30, 2003. The seedlings were fertilized with 100 ppm (mg L-1) N using Peter’s Peat Lite Special 20-10-20 water soluble fertilizer (20N-4.3P-16.7K; The Scotts Company, Marysville, OH) until the fi rst leaf emerged after which they were fertilized with 250 ppm (mg L-1) N from Peter’s 20-10-20. The seedlings were drenched with Banrot (etridiazole + thiophanate methyl) at a rate of 59.15 mL / 3.78 L prior to transplanting to the plant beds. The seedlings were transplanted to raised fi eld beds on a Savannah sandy clay loam soil at the North Mississippi Research & Extension Center in Verona, Miss. (lat. 34.2° N, long. 88.8° W) on three dates; May 19, June 20, and July 27, 2003. Raised beds were formed with a three-point hitch bed shaper. The beds were 0.76 m across the top and were spaced 1.52 m center to center. A single drip tape was placed in the center of the bed and buried 2.54 cm below the bed surface. The beds were fertilized before planting with 8-8-8 (8N-3.5P-6.6K IMC Rainbow Agribusiness, Florence, AL) at a rate of 0.45 kg 9.29 m-2 of bed. Beds were fertigated weekly at the rate of 0.25 kg of Peter’s 20-20-20 (20N-8.8P-16.5K) per 92.90 m2 during the growing season. Irrigation was supplied as needed through the drip tape to provide 1892.70 L/92.90 m2 of row per irrigation. The experimental design was a split plot with the planting date being the whole plot factor, and the cultivar being the sub-plot factor with four replications. The experimental unit consisted of two plants of each cultivar that were planted in
Journal
Appl

pairs, one plant on each of two parallel rows that were spaced 30.5 cm apart; the plants within each row were spaced 30.5 cm apart. Zinnia stems were harvested as soon as the blooms were completely opened. Stems were not harvested unless they were at least 45.7 cm long. The data collected during the trial were analyzed by SAS PROC MIXED (SAS Institute Inc, Cary, NC). Means separation were conducted with Fisher’s Protected LSD at P=0.05. The data recorded in this experiment were date of harvest, stem length, stem diameter, bloom diameter, and number of stems per plant.
Results and discussionThere was an interaction between planting date and cultivar in the analysis of days to fi rst harvest. Within the May planting date, ‘Envy’, ‘Sun Red’, ‘Benary’s Giant Crimson’, ‘Benary’s Giant Carmine Rose’, ‘Yoga’, and ‘Cactus Jewels Mix’ needed more time to produce the fi rst mature stems, 44.7–42.2 days, compared to ‘Benary’s Giant Scarlet’, ‘Scarlet Splendor’, and ‘State Fair Mix’, 38.0 days (Table 1). ‘Scarlet Splendor’ took longer to grow to maturity, 45.1 days, than the other cultivars in the June planting except ‘Envy’ and ‘Benary’s Giant White’. ‘Benary’s Giant Carmine Rose’ required longer, 51.0 days, than the other cultivars in the July planting to grow to maturity while ‘Scarlet Splendor’ and ‘Sun Red’ required the least amount of time, 27.0 days. There were no statistical differences between the May and July planting dates in the time required to produce mature stems for ‘Benary’s Giant Crimson’, ‘Benary’s Giant Deep Red’, ‘Benary’s Giant Mix’, ‘Benary’s Giant White’, ‘Cactus Jewels Mix’, ‘Envy’, ‘Ruffl es Scarlet’, ‘State Fair Mix’, and ‘Yoga’. These fi ndings disagree with those of Young et al. (2003) where zinnias planted in June took longer to grow to harvest compared to those planted in May. Within the ‘Benary’s Giant’ series, there were biologically inconsequential, but statistically signifi cant, differences in the time required to grow to maturity due to planting date for 5 of the 6 cultivars, but ’Benary’s Giant Carmine Rose’ was the notable exception.
Multiple stems are generally harvested from zinnia plants over a period of time. Cultivars that keep producing stems over long periods would be desirable for cut fl ower growers. There was an interaction between planting date and cultivar for the duration of the harvest period. ‘Benary’s Giant Deep Red’ produced stems over a longer period of time than the other cultivars in this trial for plants from the May and June plantings, 85.0 and 55.0 days, respectively (Table 2). The June planting date of ‘State Fair Mix’ had a shorter harvest period, 41.7 days, than ‘Benary’s Giant Deep Red’, but longer than the other cultivars. ‘Scarlet Splendor’ and ‘Sun Red’ produced stems over a longer period, 56.0 and 52.0 days, compared to the other cultivars in the July planting. The duration of harvest period was shorter for plants from the June and July plantings compared to the May planting for all cultivars except ‘Scarlet Splendor’ in July. This suggests that the plants from the May planting were stronger compared to those from the other planting dates.
Plants of ‘Benary’s Giant Deep Red’ from the May planting date produced more stems per plant (34.6) during the life of the plant than the other cultivars in the May planting. ‘Benary’s Giant Deep Red’ followed only ‘Sun Red’ in production in the June planting, and was in the top statistical grouping for cultivars in the July
planting for number of stems per plant (Table 3). Comparisons within each cultivar across planting dates showed that plants from the May planting produced more stems for 10 of the 13 cultivars compared to the June planting. However, comparisons between the May and July planting dates with regard to the number of stems produced per plant show that 9 of the 13 cultivars showed no signifi cant difference due to planting date. Within each of the
Table 1. Effects of cultivar and planting date on the number of days required to grow stems to fi rst harvest maturity for zinnia cultivarsz
Cultivar Days required to fi rst harvest Planting date
May 19 June 20 July 27Benary’s Giant Carmine Rose 43.7 b Ax 39.0 c B 51.0 a ABenary’s Giant Crimson 44.0 a A 38.5 b B 44.0 a BBenary’s Giant Deep Red 41.0 ab AB 39.0 b B 44.0 a BBenary’s Giant Mix 41.0 a AB 39.0 a B 40.0 a BBenary’s Giant Scarlet 38.0 b B 39.0 b B 43.9 a BBenary’s Giant White 40.7 a AB 41.2 a AB 40.0 a BCactus Jewels Mix 42.2 ab AB 39.0 b B 44.0 a BEnvy 44.7 a A 42.7 a AB 44.0 a BRuffl es Scarlet 40.7 ab AB 39.0 b B 44.0 a BScarlet Splendor 38.0 b B 45.1 a A 27.0 c CState Fair Mix 38.0 b B 39.7 ab B 43.0 a BSun Red 44.7 a A 40.0 a B 27.0 c CYoga 42.5 a A 39.7 a B 40.5 a BLSD (cultivar) = 4.4299w, LSD (date) = 4.7578y
zThere was an interaction between cultivar x planting date (P<0.0001) in the analysis of the number of days required to fi rst harvest of cultivars. Two comparisons; one within the cultivar and across planting dates, and the other within planting date and across cultivars; were needed for the analysis. yLSD within cultivar and across planting datesxMeans compared by Fisher’s Protected LSD at P=0.05. Means with the same-upper case letter in a column do not differ at the 5% signifi cance level. Means with the same lower-case letter in a row do not differ at the 5% signifi cance level. wLSD within planting date and across cultivarsTable 2. Effects of cultivar and planting date on the duration of the harvest period of zinnia cultivarsz
Cultivar Duration of harvest periodPlanting date
May 19 June 20 July 27Benary’s Giant Carmine Rose 54.2 a Cx 25.2 b C 32.0 b CDBenary’s Giant Crimson 54.0 a C 23.5 c CD 39.0 b BCBenary’s Giant Deep Red 85.0 a A 55.0 b A 28.0 c DBenary’s Giant Mix 57.0 a BC 15.2 c DE 43.0 b BBenary’s Giant Scarlet 63.0 a B 25.2 c C 38.9 b BCBenary’s Giant White 55.5 a BC 19.0 c CD 41.2 b BCactus Jewels Mix 55.7 a BC 21.9 c CD 39.0 b BCEnvy 53.2 a C 17.5 c C-E 38.5 b BCRuffl es Scarlet 57.2 a BC 21.9 c CD 35.5 b B-DScarlet Splendor 54.7 a BC 9.2 b E 56.0 a AState Fair Mix 63.0 a B 41.7 b B 40.0 b BCSun Red 56.2 a BC 24.2 b C 52.0 a AYoga 57.7 a BC 22.5 c CD 42.5 b BLSD (cultivar) = 8.5975w, LSD (date) = 9.2875y
zThere was an interaction between cultivar x planting date (P<0.0001) in the analysis of the number of days required to fi rst harvest of cultivars. Two comparisons; one within the cultivar and across planting dates, and the other within planting date and across cultivars; were needed for the analysis. yLSD within cultivar and across planting datesxMeans compared by Fisher’s Protected LSD at P=0.05. Means with the same-upper case letter in a column do not differ at the 5% signifi cance level. Means with the same lower-case letter in a row do not differ at the 5% signifi cance level. wLSD within planting date and across cultivars
64 Evaluation of zinnia cultivars for fi eld grown cut fl ower production

three planting dates, there were no statistical differences in the number of stems produced per plant for 10 of the 13 cultivars.
For stem length there was no planting date x cultivar interaction (Table 4). The stem length ranged from 49.2-47.6 cm. ‘Ruffl es Scarlet’ produced the shortest stem 47.6 cm. The decision of not to harvest and record stems that were less than 45.7 cm in length reduced the possibility for differences to be observed in stem length. Differences in productivity were refl ected in the number of stems harvested per plant. The May and June planting dates produced statistically longer stems compared to the July planting date.
‘State Fair Mix’ produced larger diameter stems (0.99 cm) than the other cultivars in this trial except ‘Benary’s Giant Deep Red’ while ‘Envy’ and ‘Ruffl es Scarlet’ produced the smallest diameter stems (0.67 cm) (Table 5). The June and July planting dates produced larger diameter zinnia stems on an average than the May planting date.
The bloom diameter of ‘State Fair Mix’ was larger within each of the three planting dates compared to the other cultivars except for ‘Cactus Jewels Mix’ and ‘Benary’s Giant Crimson’ from the June planting date (Table 6). ‘Envy’ and ‘Ruffl es Scarlet’ produced smaller blooms than the other cultivars except ‘Sun Red’ in May. The trend in bloom diameter across planting dates
Table 3. Effects of cultivar and planting date on the number of stems produced per plant by zinnia cultivarsz Cultivar Stems produced per plant
Planting dateMay 19 June 20 July 27
Benary’s Giant Carmine Rose 20.1 a B-Ex 8.7 b C 13.4 ab C-EBenary’s Giant Crimson 21.7 a B-D 11.9 b C 21.5 a ABBenary’s Giant Deep Red 34.6 a A 22.2 b B 25.7 b ABenary’s Giant Mix 17.0 a C-E 8.7 b C 14.1 a C-EBenary’s Giant Scarlet 21.6 a B-E 13.6 b C 15.3 ab B-EBenary’s Giant White 16.2 a DE 9.9 a C 10.8 a ECactus Jewels Mix 26.1 a B 8.8 b C 14.0 b C-EEnvy 18.4 a C-E 9.1 b C 14.5 ab B-ESun Red 22.4 b B-D 29.7 a A 26.0 ab ARuffl es Scarlet 21.9 a B-D 10.8 b C 11.9 b DEScarlet Splendor 14.6 a E 15.5 a BC 20.1 a A-CState Fair Mix 19.4 a B-E 8.9 b C 12.0 b DEYoga 23.2 a BC 12.1 b C 17.9 ab B-DLSD (cultivar) = 7.0753w , LSD (date) = 7.300y
zThere was an interaction between cultivar x planting date (P=0.05) in the analysis of the number of days required to fi rst harvest of cultivars. Two comparisons; one within the cultivar and across planting dates, and the other within planting date and across cultivars; were needed for the analysis. xLSD within cultivar and across planting datesyMeans compared by Fisher’s Protected LSD at P=0.05. Means with the same-upper case letter in a column did not differ at the 5% signifi cance level. Means with the same lower-case letter in a row did not differ at the 5% signifi cance level. wLSD within planting date and across cultivars
Table 4. Effects of cultivar and planting date on zinnia stem lengthCultivar Stem length (cm)Benary’s Giant Carmine Rose 49.05 aby
Benary’s Giant Crimson 48.68 abcdBenary’s Giant Deep Red 48.18 dBenary’s Giant Mix 48.89 abcBenary’s Giant Scarlet 48.39 cdBenary’s Giant White 49.16 abCactus Jewels Mix 49.05 abcEnvy 48.5 bcdSun Red 48.96 abcRuffl es Scarlet 47.56 eScarlet Splendor 48.51 bcdState Fair Mix 49.23 aYoga 49.12 abLSD 0.7025Planting Date Stem length (cm)May 19 48.95 aJune 20 48.97 aJuly 27 48.22 bLSD 0.4313yMeans compared by Fisher’s Protected LSD at P = 0.05. Means within a column with the same letter did not differ at the 5% signifi cance level.
Table 5. Effects of cultivar and planting date on zinnia stem diameter
Cultivar Stem diameter (cm)Benary’s Giant Carmine Rose 0.83 cdy
Benary’s Giant Crimson 0.82 deBenary’s Giant Deep Red 0.93 abBenary’s Giant Mix 0.81 deBenary’s Giant Scarlet 0.88 bcdBenary’s Giant White 0.79 eCactus Jewels Mix 0.81 eEnvy 0.67 fSun Red 0.79 eRuffl es Scarlet 0.67 fScarlet Splendor 0.90 bcState Fair Mix 0.99 a Yoga 0.83 deLSD 0.0719Planting Date Stem diameter (cm)May 19 0.79 bJune 20 0.85 aJuly 27 0.83 aLSD 0.0497yMeans compared by Fisher’s Protected LSD at P = 0.05. Means within a column with the same lower-case letter do not differ at the 5% signifi cance level.
Table 6. Effect of cultivar and planting date on bloom diameter of zinnia cultivarsz Cultivar Bloom diameter (cm)y
Plant dateMay 19 June 20 July 27
Benary’s Giant Carmine Rose 8.01 ab BCw 7.79 b C-E 8.50 a C-EBenary’s Giant Crimson 7.77 b B-D 8.15 ab A-C 8.64 a C-EBenary’s Giant Deep Red 7.27 b D 7.28 b EF 8.12 a EBenary’s Giant Mix 7.55 b CD 7.71 b C-E 8.94 a CDBenary’s Giant Scarlet 7.83 a B-D 7.10 b FG 8.40 a DEBenary’s Giant White 7.52 b CD 7.24 b EF 8.32 a ECactus Jewels Mix 8.07 b BC 8.49 b AB 9.59 a BEnvy 6.74 a E 6.56 a G 6.68 a FSun Red 7.27 b DE 7.48 b D-F 8.30 a ERuffl es Scarlet 5.54 b E 5.56 b H 6.34 a FScarlet Splendor 8.22 b B 8.00 b B-D 9.02 a BCState Fair Mix 9.01 b A 8.66 b A 10.09 a AYoga 7.51 b CD 6.91 c FG 8.32 a ELSD (cultivar) = 0.5837v, LSD (date) = 0.5915x
wThere was an interaction between cultivar x planting date (P=0.0297) in the analysis of bloom diameter. Two comparisons; one within cultivar across planting dates and the other within planting date across cultivars; were needed for the analysis. vLSD within cultivar and across planting dates wMeans compared by Fisher’s Protected LSD at P=0.05. Means with the same upper-case letter in a column do not differ at the 5% signifi cance level. Means with the same lower-case letter in a row do not differ at the 5% signifi cance level. xLSD within planting date across cultivars
Evaluation of zinnia cultivars for fi eld grown cut fl ower production 65

was the same for stem diameter. Nine of the 13 cultivars produced larger diameter blooms in the June and July plantings compared to the May planting.
The May planting of zinnia cultivars in this trial produced plants that yielded stems for a longer period of time. Many of the zinnia cultivars within the June planting date had a shorter harvest period, probably due to stressful, hot weather conditions at transplanting. While, ‘Benary’s Giant Deep Red’ produced fl ower stems over the longest period of time in the May and June plantings, it was at the bottom of the list for duration of stem production for the July planting. Within each planting date, there were no statistical differences in harvest duration for 8 of the 13 cultivars, which could indicate that there was little difference between the cultivars for this response. While there was little difference in stem length due to planting date or cultivar, there was a trend for increased stem and bloom diameter from May to the July planting date. ‘Benary’s Giant Deep Red’ and ‘Sun Red’ were consistently the top producers of fl ower stems across the 3 planting dates. For each planting date, there was relatively little difference between the other cultivars regarding the number of stems produced per plant. However, the median number of stems produced by all cultivars from the May, June, and July planting dates were respectively 21.6, 10.8, and 14.5 stems per plant that were planted 30.5 cm apart in the row. This would result in a potential stem yield for a single 30.4m row of zinnia cultivars included in this trial of 2160, 1080 and 1450 stems for the production life of May, June, and July plantings, or 4690 stems for the three plantings combined.
AcknowledgementsThe authors gratefully acknowledge the donations, cooperation and help from late Mr. Tom Bonfi glio of The Fred C. Gloeckner & Co.
ReferencesArmitage, A.M. 1993. Specialty Cut Flowers: The Production of Annuals,
Perennials, Bulbs and Woody Plants for Fresh and Dried Cut Flowers. Varsity Press/Timber Press. Portland, OR. ASCFG Picks Top Cut Flowers. 1999. Florist, 32(11): 70.
Dole, J. 2005. 2004 ASCFG cut fl ower seed trials. The Cut Flower Quarterly, 17(1): 10-31.
Jerardo, A. 2004. Volume Production Keeps Floriculture Prices Low. Amber Waves the Economics of Food, Farming, Natural Resource, and Rural America. USDA. Economic Research Service. http://www.ers.usda.gov/amberwaves/February04/Findings/VolumeProduction.htm
Jerardo, A. 2006. Higher Production Costs Get No Relief from Dampened Demand. Floriculture and Nursery Crops Outlook/FLO-05/September 22, 2006. Economic Research Service, USDA. http://www.ers.usda.gov/publications/fl o/2006/09Sep/FLO05.pdf
Hudson, D. and E. Griffi n, 2004. Market Potential for “Mississippi Grown” Cut Flowers. Miss. AFES Bull., 1140.
Sloan, R.C. and S.S. Harkness, 2002. Cut flower production in Mississippi. Annu. Res. Rep. of the North Miss. Res. & Ext. Ctr. Miss. AFES Info. Bull. 386: 314-336.
Sloan, R.C., S.S. Harkness and K.W. Hood, 2003. Cut fl ower production in Mississippi. Annu. Res. Rep. of the North Miss. Res. & Ext. Ctr. Miss. AFES Info. Bull., 398: 372-463.
Starman, T.W., T.A. Cerny and A.J. MacKenzie, 1995. Productivity and profi tability of some fi eld-grown specialty cut fl owers. HortScience, 30(6): 1217-1220.
Young, J.B., J.S. Kuehny and P.C. Branch, 2003, Scheduling of Gladiolus, Celosia, Helianthus and Zinnia. Acta Hortic., 624: 373-378.
66 Evaluation of zinnia cultivars for fi eld grown cut fl ower production

Journal of Applied Horticulture, 10(1): 67-69, 2008
Growth and yield of grape as infl uenced by soil-site parameters in Nasik district of Maharashtra
H.S. Balpande, O. Challa and Jagdish Prasad
National Bureau of Soil Survey and Land Use Planning, Amravati Road, Nagpur-440 010, Maharashtra, India.
AbstractSix grape growing typical pedons in Nasik district, Maharashtra were characterised and soil-site parameters were correlated with yield and yield attributes of the crop. These soils were very shallow (Darana), moderately deep (Mahiravani, Kothure), shallow (Shivdi), deep (Talegaon) and very deep (Andersool) and characterised by well drained (Darana, Mahiravani, Shivdi) and moderately well drained (Talegaon, Kothure, Andersool). The height, stem girth, spread volume, bunch per plant, berries per bunch were very much related with soil depth, drainage, pH, available water content and DTPA extractable micronutrient cations.
Key words: Grape, soil characterstics, growth, yield, drainage, depth, available water content
Materials and methods Nasik district falls under sub region AER 6.2 associated with dry sub-humid to semi-arid ecosystem in the grape growing areas. The mean minimum and maximum temperatures are 25.9 and 30.9oC, respectively and represent Ustic moisture and Isohyperthermic temperature regimes. To ascertain the variability in grape yield vis-à-vis the soil-site characteristics, six typical soils in the villages of viz. Darana (P1), Talegaon (P2), Mahiravani (P3), Shivdi (P4), Kothure (P5), and Andersool (P6) under grape orchards of 5-7 yrs old were investigated (Soil Survey Division Staff, 1995) from Satana, Dindori, Nasik, Niphad and Yeola tehsils of Nasik district.
The growth and growth parameters viz., height, stem girth (15 cm above ground), canopy (spread volume), average number of bunches/plant and berries/bunch were recorded (mean value of 5 plants). The horizon-wise soil samples were analysed for soil properties (coarse fragments, sand, silt, clay, bulk density, water retention, pH, EC, organic carbon, CaCO3, exchangeable Ca, Mg, Na, K, micronutrient cations and CEC) following the standard procedures and soils were taxonomically classifi ed (Soil Survey Staff, 1998).
Results and discussion The climate, landscape and soil characteristics and their range reported by different research workers against resources available (yield also) in present study (Table 1) were considered
IntroductionThe grape (Vitis vinifera L.) is one of the important commercial export oriented horticultural crop mostly grown in the state of Maharashtra, Andhra Pradesh, Karnataka, Tamilnadu, Haryana and Punjab in India under varied pedo-edaphic environments of sub-tropical to hot tropical regions. The hot tropical region is major viticulture region accounting for 70 per cent of the area under grape in the country. It occupies 44.3 thousand hectares of area associated with production of 1137.8 thousand MT and productivity of 25.7 MT/ha. About 85 per cent of the total production, irrespective of the variety, is consumed fresh. In Maharashtra, grape cultivation is mostly confi ned to Nasik, Ahemadnagar, Pune, Satara, Sangli and Osmanabad districts which contribute major share in grape production of the country., although a signifi cant variation in productivity was observed among districts. Nasik district emerged as a grape district in Maharashtra with large area and high productivity. However, there is a wide variation in productivity of grape, owing to varied landscape, soil characteristics (Jagdish Prasad et al., 1995) and agro-managements.
Through present study, an attempt has been made to characterize the typical grape growing soils of Nasik district to understand their potential and constraints in grape production. The relationship between plant characterstics and soil parameters like soil depth, drainage, pH, available water content and DTPA extractable micronutrient cations have been worked out.Table 1. Growth and yield parameters in selected vineyards
Pedon/ P1 P2 P3 P4 P5 P6
Location Darana village(Satana)
Talegaon village(Dindori)
Shivdi village(Niphad)
Mahiravani village(Nasik)
Kothure village(Niphad)
Andersool village(Yeola)
Height (m) 1.52 1.64 1.49 1.74 1.40 1.40Stem girth (cm) 18.20 18.00 20.00 14.40 20.30 18.50Spread (m2) 2.26 3.33 3.14 2.65 3.93 4.00Average bunches plant-1 35.00 52.00 46.00 45.00 43.00 40.00Average berries bunch-1 68.00 115.00 68.00 86.00 122.00 85.00Yield plant-1 (kg) 7.14 17.90 9.30 11.60 15.70 10.20Yield (t ha-1) 12.50 36.80 14.89 23.80 21.50 23.60
Journal
Appl

for grouping the soils/sites into different suitability classes for growing grape in these sites.
These soil pedons had their development over basalt or basaltic alluvium (P3) and occur at an elevation of 550 to 700 m above MSL but within a similar climatic zone. These soil pedons were very shallow (P1), shallow (P4), moderately deep (P3 & P5), deep (P2) and very deep (P6) and were endowed with well drained (P1, P3 and P4) and moderately well drained (P2, P5 & P6) environment. These soil pedons exhibited dark grayish brown (10YR) matrix colour barring two pedons (P1 & P4) that had brown (7.5YR) matrix colour.
Soil properties and grape yield: Pedon 1 soil being very shallow, strongly alkaline (pH 8.7) associated with ESP 5.0 had vine height of 1.52 m, stem girth 18.2 cm, number of bunches 35 per plant and number of berries 68 per bunch. It seems that soil constraints particularly of depth and ESP are managed by manure/agro management which has been refl ected in high organic carbon content of the soil (Table 3) also. The height, stem girth, spread volume, bunches per plant, berries per bunch were 1.64 m, 18cm, 3.33 m3, 52 and 115, respectively in vineyard of pedon 2 which clearly demonstrates the effect of soil solum, favourable DTPA -extractable micronutrients, pH than the soil of pedon 1. Shallow solum, sandy substratum, low AWC are the factors, which caused low yield in pedon 3, but girth was more than the pedon 1 and 2. Although pedon 4 had lower values with respect to stem girth and spread volume per plant, yield was better than pedon 1 and 3 owing to well drained soil, neutral to slightly alkaline pH favouring availability of nutrients and more particularly of DTPA-extractable micronutrients.
The very-fi ne (more than 60 % clay) Vertisols (pedons 5 & 6) associated with moderately well drained drainage and sodicity impairing the hydraulic conductivity (Kadu et al., 2003) and CaCO3 (pedon 6) seems to be the factors (Table 2 and 3) responsible for lower yield of grape expressed through other growth factors.
The correlation study indicated that the plant height had signifi cant negative relationship with pH and ESP. Negative correlations were also observed between stem girth and AWC, however, spread volume and berries/bunch had signifi cant negative correlation with DTPA- extractable Cu but positive with DTPA-Mn. CaCO3 content adversely affected bunch per plant owing to its adverse effect on nutrient availability (Kadao et al., 2002). The multiple regression analysis related with plant parameters had the following relationship with different soil parameters.
Plant height (m) = 60.54 + (-9.523 x depth) + (-0.546 x pH) + (-0.31 x EC) + (0.209 x CaCO3 + (-120 x C4) + (-0.009 x Mn) + (0.017 x CEC) + (0.306 x ESP) + (-0.014 x clay) R2 = 86
Stem girth (cm) = -42.181 + (-0.013 x depth) + (8.030 x pH) + (13.642 x EC) + (-0.052 x Mn) + (-0.192 x Cu) + (-1.421 x ESP) + (0.124 x clay) R2= 0.69
Spread (m2) = 12.097 + (0.004 x depth) + (-1.055 x pH) + (3.763 x EC) + (-0.018 x CaCO3) + (-0.036 x Cu) + (0.066 x Mn) + (0.054 x CEC) + (0.017 x ESP) + (-0.075 x clay) R2 = 0.68
Bunches per plant = -139.902 + (0.165 x depth) + (-11.36 x pH) + (56.24 x EC) + (1.629 x CaCO3) + (-0.68 x Cu) + (-0.913 x Mn) + (0.892 x EC) + (-2.325 x ESP) + (-9.556 x clay) R2 = 0.80
Table. 2. Physical properties of soilsHorizon Depth (cm) Coarse
fragments (%) v/v
Particle-size distribution(%)
Bulk density
(mg m-3)
Water retention
AWC(%)
AWC(mm)
Sand Silt Clay 33 kPa 1500 kPaPedon 1:Clayey, smectitic (calcareous) Typic Ustorthents
Ap 0-10 9.44 25.9 21.6 52.5 1.62 31.56 29.4 12.16 197.0Pedon 2: Fine, smectitic (calcareous) Typic Haplustepts
Ap 0-20 6.3 20.0 25.5 54.5 1.53 38.08 15.54 22.50 377.2Bw1 20-49 4.7 24.4 23.6 52.0 1.65 34.30 17.75 16.50 272.2Bw2 49-91 12.8 21.3 25.2 53.5 1.70 34.70 16.01 18.69 217.7BC 91-150+ 10.7 48.4 20.1 31.5 1.72 22.46 9.81 12.65 217.5
Pedon 3: Loamy over sandy, mixed (calcareous) Typic UstorthentsAp 0-15 4.3 41.4 18.7 39.9 1.23 24.34 11.28 13.06 160.6AC 15-30 9.8 45.0 26.5 28.5 1.26 19.56 10.64 8.92 112.3
Pedon 4: Clayey, smectitic (calcareous) Typic HaplusteptsAp 0-11 8.3 22.6 24.9 52.5 1.36 31.98 21.35 10.63 144.5Bw 11-29 8.4 19.3 26.7 54.0 1.39 39.95 28.94 13.10 182.0
Pedon 5: Very- fi ne smectitic (calcareous) Leptic Haplusterts Ap 0-16 9.8 12.2 21.8 66.0 1.59 46.19 30.94 15.25 242.4Bw 16-36 11.7 10.2 25.3 64.5 1.69 39.6 29.36 10.21 172.5Bss 36-69 3.2 9.8 26.2 64.0 1.72 40.6 29.93 10.67 183.5
Pedon 6: Very- fi ne smectitic (calcareous) Typic HaplustertsAp 0-14 2.7 19.6 22.9 58.5 1.57 40.47 25.09 15.38 241.4Bw 14-43 3.2 10.2 28.3 61.5 1.64 38.77 25.71 13.06 241.1
Bss1 43-83 1.2 10.4 28.6 61.0 1.69 45.98 22.47 22.51 397.3Bss2 83-125 1.4 8.4 27.1 64.5 1.73 51.23 32.60 18.83 325.7Bss3 125-155 - 7.7 25.3 67.0 1.73 50.22 21.22 29.00 501.7
68 Growth and yield of grape as infl uenced by soil-site parameters
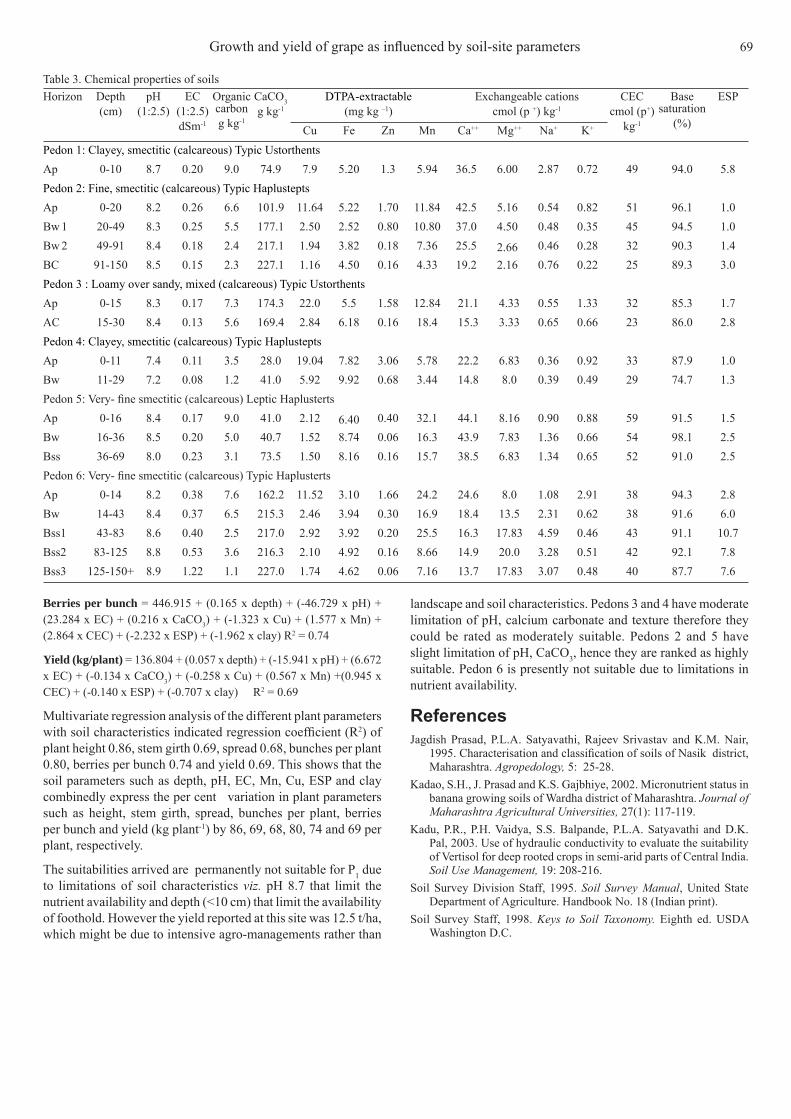
landscape and soil characteristics. Pedons 3 and 4 have moderate limitation of pH, calcium carbonate and texture therefore they could be rated as moderately suitable. Pedons 2 and 5 have slight limitation of pH, CaCO3, hence they are ranked as highly suitable. Pedon 6 is presently not suitable due to limitations in nutrient availability.
References Jagdish Prasad, P.L.A. Satyavathi, Rajeev Srivastav and K.M. Nair,
1995. Characterisation and classifi cation of soils of Nasik district, Maharashtra. Agropedology, 5: 25-28.
Kadao, S.H., J. Prasad and K.S. Gajbhiye, 2002. Micronutrient status in banana growing soils of Wardha district of Maharashtra. Journal of Maharashtra Agricultural Universities, 27(1): 117-119.
Kadu, P.R., P.H. Vaidya, S.S. Balpande, P.L.A. Satyavathi and D.K. Pal, 2003. Use of hydraulic conductivity to evaluate the suitability of Vertisol for deep rooted crops in semi-arid parts of Central India. Soil Use Management, 19: 208-216.
Soil Survey Division Staff, 1995. Soil Survey Manual, United State Department of Agriculture. Handbook No. 18 (Indian print).
Soil Survey Staff, 1998. Keys to Soil Taxonomy. Eighth ed. USDA Washington D.C.
Berries per bunch = 446.915 + (0.165 x depth) + (-46.729 x pH) + (23.284 x EC) + (0.216 x CaCO3) + (-1.323 x Cu) + (1.577 x Mn) + (2.864 x CEC) + (-2.232 x ESP) + (-1.962 x clay) R2 = 0.74
Yield (kg/plant) = 136.804 + (0.057 x depth) + (-15.941 x pH) + (6.672 x EC) + (-0.134 x CaCO3) + (-0.258 x Cu) + (0.567 x Mn) +(0.945 x CEC) + (-0.140 x ESP) + (-0.707 x clay) R2 = 0.69
Multivariate regression analysis of the different plant parameters with soil characteristics indicated regression coeffi cient (R2) of plant height 0.86, stem girth 0.69, spread 0.68, bunches per plant 0.80, berries per bunch 0.74 and yield 0.69. This shows that the soil parameters such as depth, pH, EC, Mn, Cu, ESP and clay combinedly express the per cent variation in plant parameters such as height, stem girth, spread, bunches per plant, berries per bunch and yield (kg plant-1) by 86, 69, 68, 80, 74 and 69 per plant, respectively.
The suitabilities arrived are permanently not suitable for P1 due to limitations of soil characteristics viz. pH 8.7 that limit the nutrient availability and depth (<10 cm) that limit the availability of foothold. However the yield reported at this site was 12.5 t/ha, which might be due to intensive agro-managements rather than
Table 3. Chemical properties of soilsHorizon Depth
(cm)pH
(1:2.5)EC
(1:2.5)dSm-1
Organic carbong kg-1
CaCO3g kg-1
DTPA-extractable(mg kg –1)
Exchangeable cationscmol (p +) kg-1
CECcmol (p+)
kg-1
Base saturation
(%)
ESP
Cu Fe Zn Mn Ca++ Mg++ Na+ K+
Pedon 1: Clayey, smectitic (calcareous) Typic UstorthentsAp 0-10 8.7 0.20 9.0 74.9 7.9 5.20 1.3 5.94 36.5 6.00 2.87 0.72 49 94.0 5.8Pedon 2: Fine, smectitic (calcareous) Typic HaplusteptsAp 0-20 8.2 0.26 6.6 101.9 11.64 5.22 1.70 11.84 42.5 5.16 0.54 0.82 51 96.1 1.0Bw 1 20-49 8.3 0.25 5.5 177.1 2.50 2.52 0.80 10.80 37.0 4.50 0.48 0.35 45 94.5 1.0Bw 2 49-91 8.4 0.18 2.4 217.1 1.94 3.82 0.18 7.36 25.5 2.66 0.46 0.28 32 90.3 1.4BC 91-150 8.5 0.15 2.3 227.1 1.16 4.50 0.16 4.33 19.2 2.16 0.76 0.22 25 89.3 3.0Pedon 3 : Loamy over sandy, mixed (calcareous) Typic UstorthentsAp 0-15 8.3 0.17 7.3 174.3 22.0 5.5 1.58 12.84 21.1 4.33 0.55 1.33 32 85.3 1.7AC 15-30 8.4 0.13 5.6 169.4 2.84 6.18 0.16 18.4 15.3 3.33 0.65 0.66 23 86.0 2.8Pedon 4: Clayey, smectitic (calcareous) Typic HaplusteptsAp 0-11 7.4 0.11 3.5 28.0 19.04 7.82 3.06 5.78 22.2 6.83 0.36 0.92 33 87.9 1.0Bw 11-29 7.2 0.08 1.2 41.0 5.92 9.92 0.68 3.44 14.8 8.0 0.39 0.49 29 74.7 1.3Pedon 5: Very- fi ne smectitic (calcareous) Leptic Haplusterts Ap 0-16 8.4 0.17 9.0 41.0 2.12 6.40 0.40 32.1 44.1 8.16 0.90 0.88 59 91.5 1.5Bw 16-36 8.5 0.20 5.0 40.7 1.52 8.74 0.06 16.3 43.9 7.83 1.36 0.66 54 98.1 2.5Bss 36-69 8.0 0.23 3.1 73.5 1.50 8.16 0.16 15.7 38.5 6.83 1.34 0.65 52 91.0 2.5Pedon 6: Very- fi ne smectitic (calcareous) Typic HaplustertsAp 0-14 8.2 0.38 7.6 162.2 11.52 3.10 1.66 24.2 24.6 8.0 1.08 2.91 38 94.3 2.8Bw 14-43 8.4 0.37 6.5 215.3 2.46 3.94 0.30 16.9 18.4 13.5 2.31 0.62 38 91.6 6.0Bss1 43-83 8.6 0.40 2.5 217.0 2.92 3.92 0.20 25.5 16.3 17.83 4.59 0.46 43 91.1 10.7Bss2 83-125 8.8 0.53 3.6 216.3 2.10 4.92 0.16 8.66 14.9 20.0 3.28 0.51 42 92.1 7.8Bss3 125-150+ 8.9 1.22 1.1 227.0 1.74 4.62 0.06 7.16 13.7 17.83 3.07 0.48 40 87.7 7.6
Growth and yield of grape as infl uenced by soil-site parameters 69

Journal of Applied Horticulture, 10(1): 70-72, 2008
In vitro propagation schedule of Picrorhiza kurroa: An endangered medicinal plant of Central Himalaya
Ruchi Bist1, H. Punetha1, A.K. Gaur1 and L.D. Bist2
1Department of Biochemistry, 2Department of Horticulture, G.B. Pant University of Agriculture & Technology, Pantnagar-263 145, Uttarakhand, India.
AbstractPicrorhiza kurroa Royle ex Benth (Kutki) has traditionally been used to treat disorders of the liver and upper respiratory tract, fever, and to treat dyspepsia, chronic diarrhoea and scorpion sting in Ayurveda medicine owing to the presence of active principles in root and rhizomes. The plant is self-regenerating but unregulated over-harvesting has caused it to be threatened to near extinction. The current research describes a protocol of micro propagation of this important medicinal plant from establishment to hardening in fi eld conditions. Multiple shoots were induced in apical and axillary meristems derived from mature explants on Murashige and Skoogs (1962) medium supplemented with 0.25 mg L-1 6-benzylaminopurine (BA), 0.25 mg L-1 kinetin (KN), 0.5 mg L-1 ascorbic acid and 3% (w/v) sucrose. Optimal rooting (86.6%) and growth of microshoots were observed on a medium containing 0.25 mg L-1 indole-3-butyric acid (IBA) with 2 % (w/v) sucrose. Micropropagated plantlets were acclimatized and successfully grown in soil.
Key words: Picrorhiza kurroa, axillary bud, In vitro multiplication, micropropagation
fi eld grown plants from Herbal Research and Development Institue, Mandal, Gopeshwar in the month of July, 2003. These plants were established in earthen pots at controlled environment containment facility, College of Basic Sciences and Humanities, GBPUA&T, Pantnagar. After establishment, explants (axillary and apical shoot tips 4-5cm in length) were collected at weekly intervals from two elite survived plants. These explants (4-5) were washed with 2% (v/v) detergent ‘Tween 20’ and rinsed several times with running tap water. The explants were surface sterilized in 0.1 % (w/v) aqueous mercuric chloride solution for 15 min followed by four washings with sterile distilled water. The apical and axillary meristems were inoculated on media (25-30 mL) containing different sets of phytohormones with single explant in each culture vessel (Jam Bottle of 500 mL capacity) for in vitro establishment.
Culture medium and growth conditions: The meristems (apical and axillary) were placed on semi-solid basal MS (Murashige and Skoog, 1962) medium supplemented with different concentrations and combinations of 6-benzylaminopurine (BA: 0.0, 0.25, 0.5 and 1.0 mg L-1), kinetin (KN: 0.0, 0.25, 0.5 and 1.0 mg L-1), indole-3-acetic acid (IAA) or indole-3-butyric acid (IBA) (0.0, 0.10, 0.25 and 0.5 mg L-1) for shoot proliferation and multiplication. The pH of the media was adjusted to 5.8 using 0.1N NaOH or 0.1N HCl before autoclaving at 1210C and 1.06 kg cm-2 pressure for 20 min for sterilization. The cultures were maintained at 25±20C under 14h photoperiod (55 mmol m-2s-1) from cool, white fl uorescent tube lights. The cultures were maintained by regular subcultures at 4-week intervals on fresh medium with the same compositions. To avoid blackening, the medium was supplemented with 0.5 mg L-1 ascorbic acid.
Induction of rooting and acclimatization: For root induction, excised microshoots (1-2 cm length) were transferred to MS basal medium supplemented with different concentrations of IAA or IBA (0.0, 0.1, 0.25 and 0.5 mg L-1) and 2% (w/v) sucrose. One
IntroductionPicrorhiza kurroa Royle ex Benth (Scrophulariaceae) commonly known as kutki is an important medicinal plant which occurs at higher altitude, between 3000-4500m, in Himalayas. It is a perennial herb with elongated stout and creeping stolon (Semwal et al., 1983). It secretes a large quantity of glucosidal bitter principle named kutkosides and picrosides which are the constituents of kutkin (Rastogi et al., 1949). The drug Picrorhiza is obtained from dried stolon and roots. Its herbal preparation is antiperiodic, stomachic, laxative in small doses and cathartic in large doses and useful in dropsy (Kirtikar and Basu, 1933). However there are many problems that restrict its multiplication on a large scale.
Propagation through seed is unreliable because of disease and pest problems, short viability and heavy rains during the seeding season in the natural habitat. Pharmaceutical companies largely depend upon materials procured from naturally occurring stands raising concern about possible extinction and providing justifi cation for development of in vitro techniques for mass propagation of P. kurroa. Conservation of genetic stability in germplasm collections and micropropagation of elite plants is of the utmost importance and propagation of plants through apical or axillary meristem culture allows recovery of genetically stable and true to type progeny (Hu and Wang, 1983). The present study describes an optimized protocol upto hardening and acclimatization in fi eld conditions in its natural habitat for mass propagation of homogenous and elite material of P. kurroa for increased production and improving the socio economic status of hill farmer community.
Materials and methodsPlant material and explant source: Actively growing young plants of P. kurroa were collected from greenhouse as well as
Journal
Appl

excised shoot was placed in each culture vessel having 25-30 mL of the culture media. All the cultures were incubated at 25±20 C under 16h photoperiod with cool, white fl uorescent light. Rooted micro-propagules were thoroughly washed to remove the adhering gel and planted in 2.5 cm plastic pots (250mL) containing a sterile mixture of sand, soil and cow-dung manure in the ratio of 1: 1: 1 (v/v) and kept in the greenhouse for acclimatization.
Results and discussionMeristem proliferation and multiplication: Meristem proliferation and multiplication was initiated from apical and axillary explants of P. kurroa within 8-10 days of inoculation onto MS basal medium supplemented with BA, KN and 0.5 mg L-1 ascorbic acid. Of the different cytokinins tested, BA + KN was the most effective for shoot proliferation and multiplication. The maximum shoot proliferation and multiplication was observed both in apical and axillary meristems cultured on MS medium supplemented with 0.25 mg L-1 BA, 0.25 mg L-1 KN and 0.5 mg L-1 ascorbic acid within 4 weeks of culture under 14h photoperiod (Table 1). The apical and axillary shoots proliferated and elongated to 1.0-1.5 cm within 4 weeks of culture. There was no sign of shoot proliferation when explants were cultured in media devoid of cytokinin. At higher concentrations of BA or kinetin, the rate of shoot proliferation declined. Inclusion of either IAA or IBA in the culture medium did not help in proliferation and multiplication of shoot. In most of the cases, the growth was inhibited and only 1-2 shoots elongated; some produced compact callus at the base of the explants. Prolonged culture on the proliferation and multiplication media resulted in the blackening of the basal ends of the developing shoots. There were differences among the treatments for both the percentage of cultures with multiple shoots and the mean number of shoots/culture. The axillary meristems produced more number of shoots (4.57) than the apical meristems (3.25). The highest percentage of cultures with multiple shoots was observed on media containing 0.25 mg L-1 BA, 0.25 mg L-1 KN and 0.5 mg L-1 ascorbic acid when the cultures were incubated in the continuous light for 4 weeks (Table 1). The frequency of multiple shoots per culture varied from 1.24 to 4.42 in case of the 14h photoperiod. The rate of multiplication was high and stable upto 5th subculture and declined in subsequent subcultures.
Induction of root from microshoots: Elongated shoots (1-2 cm long) were rooted on MS basal medium supplemented with various concentrations of either IAA or IBA. The rooting in the microshoots was inhibited in the medium devoid of growth regulator. Root initiation took place within 10-12 days of transfer to MS basal medium supplemented with 0.1-0.5 mg L-1 IAA or IBA. However, optimal rooting (70.6%) and growth of microshoots was observed on medium containing 0.25 mg L-1 IBA with 2% (w/v) sucrose (Table 2). The rooting ability was reduced with the increase in the concentration of IAA or IBA in the culture medium. The percentage of shoots forming roots and days to rooting signifi cantly varied with different concentrations of IAA or IBA.
Acclimatization and fi eld establishment: About 96% of the rooted plantlets established in the greenhouse within 2-3 weeks of transfer. The plant grew well and attained 6-8 cm height within 4 weeks of transfer. The whole plant regeneration and acclimatization has been depicted in Fig. 1.
Present study showed that it was possible to explore the morphogenetic potential of P. kurroa by modifi cation of growth regulators and light conditions. The use of different combinations of cytokinins for the induction and multiplication of shoots derived from apical and axillary meristems and the regulatory action of cytokinin and apical dominance in shoot induction and multiplication in vitro is well documented (Wickson et al., 1958). The higher shoot induction and multiplication was observed both in apical and axillary meristems cultured on MS medium supplemented with 0.25 mg L-1 BA, 0.25 mg L-1 kinetin and 0.5 mg L-1 ascorbic acid within 4 weeks of culture under 14h photoperiod. At higher concentrations of BA or kinetin, the rate of shoot proliferation declined. The axillary meristems produced more number of shoots than the apical meristems. The results demonstrated that inclusion of either IAA or IBA in the culture medium did not help in shoot multiplication. Prolonged culture on the proliferation and multiplication media containing IAA or IBA resulted in the blackening of the basal ends of the developing shoots. The results are consistent with earlier reports indicating cytokinins and auxins effect on shoot multiplication in other plants using shoot tip or axillary bud explants (Rout et al., 1999). With the increase in the concentration of either BA or KN, the percentage of shoot multiplication declined. The results also implies that there were differences among the treatments for
Table 2. Effect of IAA and IBA on rooting from excised shoots of P. kurroa cultured on MS basal medium supplemented with 2% (w/v) sucroseMS + Growth regulators
(mg L-1)Percentage of rooted
shoot(Mean ± S.E)*
Days to rooting
IAA IBA0 .10 0.0 30.6+0.20 10-110.25 0.0 45.4±0.6 10-130.50 0.0 50.2±0.4 11-120.0 0.10 57.20±0.70 100.0 0.25 70.60±0.30 120.0 0.50 54.83±0.50 11 *Data represent mean of 20 cultures/treatment, repeated thrice
In vitro propagation schedule of Picrorhiza kurroa: An endangered medicinal plant of Central Himalaya 71
Table 1. Effect of BA, kinetin and 2 mg L-1 ascorbic acid on shoot growth from apical (A) and axillary (B) meristems of Picrorhiza kurroa after 4 weeks of culture under 14h photoperiod
MS + Growth regulators (mg L-1)
Percent of cultures with multiple shoots (Mean ± S.E.)*
Number of shoots/explant
(Mean ± S.E.)*
Kinetin BA A B A B
0.0 0.0 0.0 0.0 0.0 0.00.0 0.25 38.7 ± 0.3 46.7 ± 0.3 2.72 ± 0.5 2.31 ± 0.2 0.0 0.50 40.2 ± 0.5 43.3 ± 0.7 1.25 ± 0.4 1.73 ± 0.5 0.0 1.0 17.7 ± 0.4 21.3 ± 0.6 1.87 ± 0.3 1.34 ± 0.6 0.25 0.0. 31.6 ± 0.4 41.4 ± 0.3 2.40 ± 0.2 2.93 ± 0.5 0.25 0.25 61.8 ± 0.5 73.7 ± 0.3 3.25 ± 0.2 4.57 ± 0.4 0.25 0.50 50.7 ± 0.4 57.6 ± 0.5 3.15 ± 0.4 3.20± 0.7 0.50 0.0 41.2 ± 0.5 43.8 ± 0.6 2.19 ± 0.4 2.30 ± 0.4 0.50 0.25 51.3 ± 0.6 56.4 ± 0.3 2.20 ± 0.7 2.17 ± 0.6 0.50 0.50 40.4 ± 0.4 41.8 ± 0.5 1.80 ± 0.6 1.88 ± 0.5 0.5 1.0 20.6 ± 0.4 23.4 ± 0.5 1.17± 0.5 1.13 ± 0.3 1.0 0.0 28.6 ± 0.7 23.5 ± 0.4 1.12 ± 0.5 1.30 ± 0.6 1.0 0.5 22.7 ± 0.5 25.5 ± 0.4 1.17 ± 0.6 1.27 ± 0.6 * Mean of 20 cultures per treatment, repeated thrice

both the percentage of culture developing multiple shoots and the mean numbers of shoots per culture. The rate of multiplication was high and stable upto 5th subculture and declined in subsequent subcultures. This might be due to the balancing of the endogenous and exogenous growth regulators and the ionic concentration of nutrient salts as reported earlier in other plants (Zimmermann, 1985). Elongated shoots rooted better in MS basal medium supplemented with 0.25 mg L-1 IBA and 2% sucrose. The rooting ability was reduced with the increase in the concentration of IAA or IBA in the medium. The percentage of shoots forming roots and days to rooting signifi cantly varied with different concentrations of IAA or IBA. The rooted plantlets were established in the fi eld and grew normally.
In conclusion, an attempt was made to develop an in vitro protocol for mass multiplication of P. kurroa by manipulating the nutrient salts, growth regulators and culture conditions. This investigation may be useful for conservation of this economically important medicinal plant species.
AcknowledgementsThe authors acknowledge the Dean, College of Basic Sciences & Humanities and Medicinal Research and Development Centre, GBPUA&T, Pantnagar, U.S. Nagar, Uttarakhand for providing the necessary facilities.
ReferencesHu, C.Y. and P.J. Wang, 1983. Techniques for propagation and breeding.
In: Handbook of Plant Cell Culture. Mac Millan Inc., New York, 177-277.
Kirtikar, K.R. and B.D. Basu, 1933. Indian Medicinal Plants. Vol 3. Lalit Mohan Basu, Leader Road, Allahabad.
Murashige, T. and F. Skoog, 1962. A revised medium for rapid growth and bioassays with tobacco tissue cultures. Physiol. Plant., 15: 473-497.
Rastogi, R.P., V.N. Sharma and S. Siddiqui, 1949. Chemical examination of Picrorhiza kurroa Benth. Part 1. J. Scient. Ind. Res., 8: 173-178.
Rout, G.R., C. Saxena, P. Das and S. Samantaray, 1999. Rapid clonal propagation of Plumbago zeylanica Linn. Plant Growth Regul., 28: 1-4.
Semwal, J.K., A.N. Purohit and R.D. Gaur, 1983. Seed germination in some Himalayans alpine plants. Seed Research, 11: 42-46.
Wickson, M. and Kenneth V. Thimann, 1958. The antagonism of auxin and kinetin in apical dominance. Physiol. Plant., 11: 63-74.
Zimmermann, R.H. 1985. Application of tissue culture propagation to woody plants. Tissue culture in Forestry and Agriculture. N.Y. 165-177.
Fig. 1. Micropropagation of kutki (P. kurroa) (A) Establishment stage, (B & C) Shoot proliferation, (D) Rooting. Hardening and acclimatization (E) in pot (F) in fi eld.
72 In vitro propagation schedule of Picrorhiza kurroa: An endangered medicinal plant of Central Himalaya

Journal of Applied Horticulture, 10(1): 73-76, 2008
A comparison of three mathematical models of response to applied nitrogen using lettuce
Sadeghi Pour Marvi Mahdi
Department of Soil and Water Research, Varamin Agricultural Research Center, Ghodosi Blvd. Varamin, 3371616738, Iran. Email: [email protected]
AbstractModern fertilization recommendation must optimize crop yield and quality and minimize chances of negative environmental effects due to over fertilization. Data from fertilizer studies can be fi tted to several mathematical models to determine optimum fertilizer rates, but resulting recommendations can vary depending on the model chosen. In this research, lettuce (Lactuca sativa L.) was used as a case study vegetable crop to compare models for estimating fertilizer N requirements. Field studies were conducted to measure yield response to applied N. The area was located at 25°21΄ E longitude and 51˚38΄ N latitude in the North of Varamin city, (Tehran province, Iran) in the alluvial plain of Varamin. Soil family was fi ne, mixed, active, thermic, typic haplocambids based on Soil Taxonomic system (USDA, 1999). Plants were grown in Central Research Station of Varamin and received fi ve rates of N (0, 150, 200, 250 and 300 kg ha-1) as a urea in split applications. Data for plant fresh mass and N uptake were recorded. Logistic, linear-plateau and quadratic models were compared for the fi eld data. The logistic model described the data for cultivar quite well, with correlation coeffi cients of 0.90 and above. Coeffi cients for the linear-plateau model were derived from the logistic model. All three models for lettuce production were compared graphically and analytically. The model coeffi cients were used to make improved estimates of fertilizer recommendations for fi eld production of lettuce.
Key words: Lactuca sativa, logistic equation, nitrogen
IntroductionRecommendations for fertilization of crops are derived from fi eld studies in which crop yield and quality responses to a range of fertilizer rates are measured. Responses are often modeled to determine optimum fertilizer rate. Today, the relationship of nutrient management to environmental pollution is also an important aspect of any fertilization recommendation. There are many mathematical models for fi tting crop response data. The research seeks to fi nd a model that describes the data well and aids in defi ning reasonable fertilization recommendations that result in optimum crop yield and quality without the risk of over fertilization.
Quadratic models have been very popular for describing crop response to fertilization but tend to overestimate response if the maximum point on the curve is taken as the best fertilization rate. Often, fertilization rates less than the function maximizing rate are statistically similar to the single function maximizing rate (Cerrato and Blackmer, 1990; Hochmuth et al., 1993a). Models other than quadratic functions have been used to describe crop response to fertilizer. Plateau models, such as linear-plateau (Dahnke and Olson, 1990; Nelson and Anderson, 1977), have been used with agronomic crops (Bullock and Bullock, 1994; Cerrato and Blackmer, 1990; Fageria et al., 1997) and vegetables (Abdul-Baki et al., 1997; Hochmoth et al., 1993a, 1993b; Sanchez et al., 1991) and logistic models with agronomic crop (Overman, 1995; Overman et al., 1990, 1993). More research with vegetable crops to test functions such as the logistics model is need. Vegetables such as lettuce that require fertilization for optimum yield and quality is ideal crop for such research.
Lettuce is an important vegetable crop that is grown widely throughout the Iran, with much of the commercial production in Varamin, Tehran, Gilan and Mazandaran regions. Most of Varamin,s lettuce is produced on Aridisols soils of northern Varamin. Varamin is a major supplier of lettuce for Tehran.
Because of the high proportion of leaf tissue in lettuce, yields are greatly impacted by N fertilization. Research in Varamin with lettuce grown on loamy soils showed that N fertilization requirements were from 150 to 200 kg ha-1. Sources of N fertilizer did not differ in their effects on lettuce yield or head quality (Gardner and Pew, 1979). Low levels of N result in small head size and poor yields. Even short periods of N defi ciency can have a long-lasting negative effect on lettuce yield (Burns, 1988). Current N recommendation is 200 kg ha-1 for lettuce grown on loamy soils in Varamin. Yield and N uptake tend to increase linearly with N application rate. At high levels of N, plant yields and N uptake asymptotically approach maximum values. Decisions concerning optimum rates of fertilization usually involve fi tting some type of model to yield data in response to several rates of fertilizer application. Regression analyses have been conducted on numerous data sets for response of agronomic forage crops to applied nutrients (Overman and Evers, 1992; Overman and Wilkinson, 1992; Overman et al., 1990, 1991, 1992, 1993, 1994a, 1994b, 1995). In all these studies, the logistic equation accurately described data for dry-matter yields of forages and corn. In several studies, the extended logistic model also described plant N uptake as well as yield (Overman and Evers, 1992; Overman et al., 1994a, 1994b, 1995). In the latter case, a common N response coeffi cient, c, existed between yield and plant N uptake. As a consequence, yield could be expressed as
Journal
Appl

a hyperbolic function of plant N uptake. Willcutts et al. (1998) studied models of response to applied nitrogen using lettuce. They found the logistic model offers a useful tool for evaluation of lettuce response to applied N.
The objective of this study was to demonstrate the utility of the logistic model to describe response of lettuce to applied N. A comparison was made with the linear-plateau and quadratic models for data obtained in fi eld. Coeffi cients of the linear-plateau model were obtained as approximations from the logistic model. Both the linear-plateau and quadratic model predicted negative yields at very low N levels, whereas the logistic equation shows asymptotic approach to zero. The general characteristic and a rational basis for the logistic equation have been given by Overman (1995). Output (yield or plant N uptake) remains positive for all applied N, which must be true of the system by defi nition. Linear-plateau and quadratic models do not meet this constraint.
Materials and methods Field experiments: Field experiments were conducted in spring with lettuce (L. sativa L.) on Aridisols soils and soils family with fi ne, mixed, active, thermic, typic haplocambids based on Soil taxonomic system (USDA. 1999). The area was located between 25° 21΄ E longitude and 51˚ 38΄ N latitude in the North of Varamin city (Tehran province, Iran) in the alluvial plain of Varamin. After soil was prepared by ploughing and disking, plots were formed. Irrigation method was furrow irrigation. Lettuce seeds were planted on 9 March. Plots were 15 m long and 5 m wide and consisted of fi ve rows on 40 cm spacing × 20 cm between plants, for a total of 93 plants per plot (62000 plant ha-1). Plants were grown in fi eld of Central Research Station (Varamin Agricultural Research Center) and received fi ve rates of N (0, 150, 200, 250 and 300 kg ha-1) as urea in split applications. Treatments were replicated three times, with irrigation and pest control following recommended cultural practices (Hochmuth and Maynard, 1996). Lettuce heads were harvested on 4 June and fresh mass of marketable lettuce was recorded. N uptake with plant was measured in laboratory (Bremner and Mulvaney. 1982).
Model description: Data were analyzed using several models for comparison. The logistic models for yield and plant uptake are given by equations [1] and [2].
Y=A/[1+exp(b-cN)] [1]Nu=A΄/[1+exp(b΄-cN)] [2]
Where Y= yield in fresh, mass, kg plant-1; Nu=nitrogen uptake by lettuce, g plant-1; N=nitrogen applied, g plant-1 or kg ha-1; A=maximum yield in fresh mass, kg plant-1; b= intercept parameter for yield; b΄= intercept parameter for nitrogen uptake; c= N response coeffi cient, plant g-1 or ha kg-1. Following Overman et al. (1994a), Eqs. [1] and [2] can be combined to give the hyperbolic phase relation between yield and plant uptake,
Y=YmNu/(K΄+Nu) [3]
Where, parameters Ym and K΄are defi ned in terms of the logistic parameters by,
Ym=A/[1-exp(b-b΄)] [4]K΄=A΄/[exp(b΄-b)-1] [5]
Note that Ym represents maximum potential yield and that Nu=K΄ produces Y=Ym/2, or one- half of maximum potential yield. Calculus techniques show that maximum incremental response to applied N occurs at an application rate N1/2= b/c, where Y=A/2. This is the point of maximum slope T vs N. Similarly, maximum incremental response of plant N to applied N occurs at N΄/2 =b΄/c, with Nu=A΄/2. The N response coeffi cient can be redefi ned as characteristic N given by N΄=1/c, which converts units to more familiar g plant-1 or kg ha-1.
The linear-plateau model is given by,
Ylp=Blp+ClpN for N<Nx [6]Ylp =Alp for N>Nx [7]
Where for Ylp= linear-plateau estimate of yield in fresh mass, kg plant-1; Alp= plateau or maximum freshyield, kg plant-1; Blp= intercept parameter, kg plant-1; Clp= slope parameter, ha plant-1; and Nx= N application rate for intersection between Eqs. [6] and [7]. The linear-plateau parameters can be approximated from the logistic parameters as,
Alp=A [8]Blp =A/2(1-b/2)
=A/4N’(2N΄-N1/2)
[9]
Clp= Ac/4= A/4N΄ [10]
This occurs because the logistic model approximates a straight line in the midrange of response. It follows that the intersection of the linear and plateau portions occurs at,
Nx= (Alp-Blp)/Clp
=(b+2)/c= N1/2+2N΄[11]
The quadratic model can be written as,
Yq= Aq+bqN+CqN2 [12]
Where, Yq= quadratic estimate of yield in fresh mass, kg plant-1; Aq= intercept parameter, kg plant-1; Bq= linear response coeffi cient, ha plant-1; and Cq= quadratic response coeffi cient, ha2 kg-1 per plant. Peak production can be estimated from the maximum where the derivative, dYq/dn=0, which occurs at,
Npeak= Bq/2cq [13]And gives peak production of,
Ypeak= Aq+Bq2/4Cq
=Aq+Bq/2Npeak
[14]
Fertilization rates of Npeak may be optimal for production because of diminishing returns obtained as N approaches Npeak. Therefore, optimum applied N rates would tend to be below Npeak (i.e., Nopt<Npeak).
Results and discussionField experiments: Response of fi eld lettuce to applied N is shown in Fig. 1. Logistic, linear-plateau, and quadratic models were fi tted to the data with parameters listed in Table 1. The logistic model provides a reasonable basis for the linear-plateau model (Fig. 1). The intersection point can be calculated from Eq. [11], and peak N values for the quadratic model were calculated from Eq. [13]. A summary of critical values of model parameters is listed in Table 2. At N=N1/2yield is 505 of the plateau, whereas
74 A comparison of three mathematical models of response to applied nitrogen using lettuce

at N=Nx, yield is 88% of plateau. For N=Npeak yields are well out on the plateau, beyond the region of signifi cant response to applied N. Fig. 2 show dependence of fresh mass on plant N uptake for fi eld lettuce.
From these results, the logistic model apparently provides an adequate description fi eld results for response of lettuce to applied N. From analysis of the fi eld data, Nx appears to give the most reasonable level for a nitrogen fertilizer recommendation, viz., 150 kg ha-1 for these conditions. This is considerably below the current Varamin recommendation of 200 kg ha-1.
The logistic model offers a useful tool for evaluation of lettuce response to applied N. Parameters A, b, and c in Eq. [1] can be estimated from data by nonlinear regression. One can also use the following simple alternative procedure. Parameter A (the plateau) can be estimated by visual inspection of the data for yield vs. applied N (such as Fig. 1). Then parameter b follows from,
B=ln(A/Y◦-1) [15]
Where Y◦= estimated intercept yield at N=0. Finally, parameter c is calculated from,
C=b/N1/2[16]
Where N1/2 is estimated as the value of N corresponding to y=A/2 (50% of the plateau) on the graph of yield response to applied N. With parameters b and c in hand, Nx can then be estimated from Eq. [11]. Estimates of yield at given applied N levels are easily made with Eq. [1] using a calculator with an equation writer.
Present study revealed that the logistic model contains the right characteristics to describe fi eld data and is relatively simple to use in practice.
ReferencesAbdul-Baki, A.A., J.R. Teasdale and R.F. Koreak, 1997. Nitrogen
requirements of fresh- market tomatoes on hairy vetch and black polyethylene mulch. HortScience, 32: 217-221.
Bremner, J.M. and C.S. Mulvaney, 1982. Methods of Soil Analysis. Part 2: Chemical and microbiological properties. Second edition. Soil Sci. Soc. Am. Inc., pp245-256.
Bulock, D.G. and D.S. Bullock, 1994. Quadratic and quadratic-plateau models for predicting optimum nitrogen rate of corn: A comparison. Agron. J., 86: 191-195.
Burns, I.G. 1988. Effect of interruptions in N, P, or K supply on the growth and development of lettuce. J. Plant Nutr., 11: 1627-1634.
Cerrato, M.E and A.M. Blackmer, 1990. Comparison of models for describing corn yield response to nitrogen fertilizer. Agron. J., 82: 138-143.
Dahnke, W.C. and R.A. Olson, 1990. Soil test correlation, calibration, and recommendation. In: R.L. Westerman (ed). Soil testing and plant analysis, 3rd ed. Soil Sci. Soc. Amer., Madison, Wis, p.45-71.
Fageria, N.K., A.B. Santos and C. Baligar, 1997. Phosphorus soil test calibration for lowland rice on an Inceptisols. Agron. J., 89: 737-742.
Gardner, B.R. and W.D. Pew, 1979. Comparison of various nitrogen sources for fertilization of winter-grown head lettuce. J. Amer. Soc. Hort. Sci., 104: 534-536.
Hochmuth, G.J. and G.A. Clark, 1991. Fertilizer application and management for micro (or drip) irrigated vegetables in Florida Coop. Ext. Serv. Special Rpt. SS- VEC-45.
Hochmuth, G.J., E.A. Hanlon and J. Cornell, 1993a. Watermelon phosphorus requirements in soils with low Mehlich-1 extractable phosphorus. HortScience, 28: 630-632.
Hochmuth, G.J., R.C. Hochmuth, M.E. Donley and E.A. Hanlon, 1993b. Eggplant yield response to potassium fertilization on sandy soil. HortScience, 28: 1002-1005.
Hochmuth, G.J. and D.N. Maynard (eds.). 1996. Commercial vegetable production guide for Florida. Florida Coop. Ext. Serv. Circ., SP-170.
Table 1. Model parameters for fi eld lettuce at Varamin, IranModel Parameters Value
Logistic
Y=A/[1+exp(b-cN)]
Nu=A΄/[1+exp(b’-cN)]
A, kg plant-1
b
c, ha kg-1
A΄b΄
0.48
0.64
0.028
490.00
30.00Linear-plateau
Ylp=Blp+ClpN for N<Nx
Ylp =Alp for N>Nx
Alp, kg plant-1
Blp, kg plant-1
Clp, ha plant-1
0.48
0.163
0.00336
Quadratic
Yq= Aq+bqN+CqN2
Aq, kg plant-1
Bq, ha plant-1
Cq, ha2 kg-1 plant-1
0.1984
0.0021
0.000004
Table 2. Critical N value (kg ha-1) for the models for fi eld-grown lettuce in Varamin, Iran.
N1/2 Nx Npeak
23 94 202
0 100Applied nitrogen (kg ha )-1
LogisticQuadraicLinear plateau
Ave
rage
hea
d m
ass
(kg
head
)-1
200 300 400
0.6
0.5
0.4
0.3
0.2
0.1
0
0
100
200
300
400
500
0 0.2 0.4 0.6 0.8 1.0N uptake (g/plant)
Fres
hm
ass
(g/p
lant
)
Fig. 1. Comparison of logistic, linear plateau and quadratic models for response of fi eld grown lettuce to N application at Varamin. Model values calculated with parameters from Table 1.
Fig. 2. Dependence of fresh mass on plant N uptake for fi eld grown lettuce at Varamin. Curve drawn from Eq. 3 with parameters calculated by Eqs. 4 and 5 using logistic parameters from Table 1.
A comparison of three mathematical models of response to applied nitrogen using lettuce 75

Nelson, L.A. and R.L. Anderson, 1997. Partitioning of soil-test response probability. In: T.R. Peck, J.T. Cope and D.A. Whitney (eds.). Soil testing: Correlation and interpreting the analytical results. Amer. Soc. Agron., Madison, Wis. Publ. 29, p. 19-38.
Overman, A.R. 1995. Ratonal basis for the logistics model for forage grasses. J. Plant Nutr., 18: 995-1012.
Overman, A.R., A. Dagan, F.G. Martin and S.R. Wilkinson, 1991. A nitrogen- phosphorus-potassium model for forage yield of bermudagrass. Agron. J., 83: 254-258.
Overman, A.R. and G.W. Everts, 1992. Estimation of yield and nitrogen removal by bermudagrass and bahiagrass. Trans. Amer. Soc. Agr. Eng., 35: 207-210.
Overman, A.R., G.W. Everts and S.R. Wilkinson, 1995. Coupling of dry matter and nutrient accumulation in forage grass. J. Plant Nutr., 18: 2629-2642.
Overman, A.R., F.G. Martin and S.R. Wilkinson, 1990. A logistic equation for yield response of forage grass to nitrogen. Commu. Soil Sci. Plant Anal., 21: 595- 609.
Overman, A.R., A.A. Sanderson and R.M. Jones, 1993. Logistic response of bermudagrass and bunchgrass cultivars to applied nitrogen. Agron. J., 85: 541-545.
Overman, A.R. and S.R. Wilkinson, 1992. Model evaluation for perennial grasses in the southern United States. Agron. J., 84: 523-529.
Overman, A.R., S.R. Wilkinson and G.W. Everts, 1992. Yield response of bermudagrass and bahiagrass to applied nitrogen and overseeded clover. Agron. J., 84: 998-1001.
Overman, A.R., S.R. Wilkinson and D.M. Wilson, 1994a. An extended model of forage grass response to applied nitrogen. Agron. J., 86: 617-620.
Overman, A.R., D.M. Wilson and E.J. Kamprath, 1994b. Estimation of yield and nitrogen removal by corn. Agron. J., 86: 1012-1016.
Sanchez, C.A., M. Lockhart and P.S. Porter, 1991. Response of radish to phosphorus and potassium fertilization on Histosols. HortScience, 26: 30-30.
USDA. 1999. Horizons and characteristics diagnostic for the higher categories. Soil Taxonomy: A basic system of soil classifi cation for making and interpreting soil surveys. United States Department of Agriculture. Natural Resources Conservation Service. Washington DC, USA, p.21-114.
Willcutts, J.F., A.R. Overman, G.J. Hochmuth, D.J. Cantliffe and P. Soundy, 1998. A comparison of three mathematical models of response to applied nitrogen using lettuce. HortScience, 33(5): 833-836.
76 A comparison of three mathematical models of response to applied nitrogen using lettuce

Journal of Applied Horticulture, 10(1): 77-80, 2008
Comparison of conventional fertilization and vermicompost use for basil cultivation
Liliana Marbán1, Lidia Giuffré2, Marta Riat2, Romina Romaniuk2 and Ernesto Giardina2
1Ingeis-Conicet Pabellón Ingeis. Ciudad Universitaria (1428), Buenos Aires, Argentina. E-mail: [email protected], 2Facultad de Agronomía, UBA, Av. San Martín 4453 (1417), Buenos Aires, Argentina. E-mail: [email protected]
AbstractThe effect of conventional fertilization was compared with a vermicompost that was mixed with substrate for sweet basil (Ocimum basilicum L.) in a greenhouse experiment. The study was conducted in a completely randomized block design with 4 replications. Eight treatments were compared: a control treatment of a substrate mixture (T0: with no vermicompost added), fi ve treatments with increasing percentages of vermicompost added to the substrate mixture (H1 to H5), and two treatments using two application rates of a chemical fertilizer (F1 and F2). Both fertilizer and vermicompost presented very low levels of heavy metals, which assured agronomical suitability. Vermicompost from SS-MSW (Source-Separated Municipal Solid Waste) and slaughterhouse sludge, presented signifi cant value as soil conditioner and biofertilizer and produced increased levels of C and N (P<0.05). The phosphorus addition by vermicompost was high, with a decrease of zinc absorption by plants and potential contamination risk. Mixtures including more than 50% of the vermicompost and the highest rate of fertilizer showed statistically signifi cant differences for dry weight, leaf length, plant survival and P-Zn antagonism (P<0.05).
Key words: Fertilization, vermicompost, Ocimum basilicum L., basil
IntroductionThere is a controversy concerning the use of inorganic and organic fertilizers. Inorganic fertilizers are easy to manage and hygienic, but organic ones present the advantage of lower costs and environmental benefi ts (Ghosh, 2004). Environmental problems related with heavy metal contamination should be considered, as organic manures are generated by urban and industrial developments (Marbán et al., 1999). Organic wastes of a different nature and environmental risks are generated as consequence of such activities, and their recycling can offer an ecological solution for waste treatment and disposal, and could be an effi cient and economic alternative for conventional waste disposal procedures (Govil, 2001).
Composting is a biological process that produces a stable organic matter, free of pathogens and toxins: “compost” (Polo, 1997). Usually, in agriculture, the most important restrictive factors to use composts as soil amendments have been human pathogenic content, the presence of heavy metals, nutrient excesses, high salt concentrations, organic pollutants and immaturity (Madrid et al., 2000). Vermicomposts, which are produced by the fragmentation of organic wastes by earthworms, have a fi ne particulate structure and contain nutrients in forms that are readily available for plant uptake. In greenhouse trials, they have shown to enhance growth of different seedlings and cultivations (Atiyeh et al. 2000). After the thermophilic stage of composting, the material is inoculated with earthworms and a commercial biofertilizer (vermicompost) is obtained as the fi nal result. The organic matter of this biofertilizer contains a high percentage of humic and fulvic acids and a benefi cial microbial load. Vermicompost incorporation increases soil aggregation, structure, water retention, cation exchange capacity, and releases nutrients required by plants, in a balanced way. It adsorbs pollutants such as heavy metals due to its high
adsorption capacity and protects soil from erosion (Movahedi and Cook, 2000). It also contains phytohormones such as indolacetic and gibberellic acid, together with other biologically active substances (Ruiz et al., 1999) and as a consequence of the high microbial load contributes to the protection of roots from bacterial and parasitic nematode attacks. Enough evidence exists to ensure that human pathogens do not survive the vermicomposting process (Eastman et al., 2001), but special attention should be paid to heavy metal contents, since they could be dangerous in the food chain.
Sweet basil (Ocimum basilicum L.) is grown commercially as a cultivated herb plant in many parts of the world, and used both as a fresh and a dried food spice, for the commercial production of essential oil and in traditional medicine. Research has also shown that it may be a good indicator of the adverse effect of various environmental signals to plants, including high concentrations of trace metals in composts (Zheljazkov and Warman, 2003).
In the present study, soil and plant characterstics were evaluated with biofertilizer (vermicompost) and inorganic fertilization for basil cultivation.
Materials and methodsThe urban solid wastes from Chivilcoy town were classifi ed, by manual separation for the inert materials (glass, plastic, cardboard and metals), from the organic ones. These urban organic residues, also denominated SS-MSW: Source-Separated Municipal Solid Waste (Zheljazkov and Warman, 2004), were mixed with reduced fat slaughterhouse sludge prior to being composted. When the fi rst thermophilic stage was fi nished, the material was inoculated with earthworms (Eisenia andrei).
Sweet basil was sown in conventional 60 x 30 cm trays. After
Journal
Appl

twenty days, 3-4 cm plants were transplanted to 1 kg pots. Substrate (peat) was sterilized with methyl bromide and mixed with different quantities of vermicompost. Three plants per pot were left in each pot, and the study was conducted in greenhouse conditions, with pots moisture maintained near fi eld capacity.
The experiment was conducted in a completely random block design with 4 replications for each treatment. In the experiment, eight treatments were compared: a control treatment of a substrate mixture (T0: with no vermicompost added), fi ve treatments with increasing percentages of vermicompost added to the substrate mixture (H1 to H5), and two treatments using two application rates of a chemical fertilizer (F1 and F2). Treatments were: T0: substrate mixture (peat without vermicompost), H1: 95 % mixture + 5% vermicompost, H2: 90 % mixture + 10% vermicompost, H3: 80 % mixture + 20% vermicompost, H4: 50 % mixture + 50% vermicompost, H5: 100 % vermicompost, F1: substrate + chemical fertilizer: 3 g KEMIRA NPK 12-5-11 per pot, F2: substrate + chemical fertilizer: 30 g of KEMIRA NPK 12-5-11 per pot.
Agronomic variables that were evaluated in substrate mixture were: pH: water extraction 1: 2.5, total organic carbon (%C): Walkley –Black technique (Nelson and Sommers, 1982), total nitrogen (%N): microKjeldahl procedure; available phosphorus (P, mg kg-1): Bray 1 method (Bray and Kurtz, 1945); electrical conductivity (EC, dS m-1): saturation extract. (Rhoades, 1996).
Heavy metals, cadmium (Cd), lead (Pb), zinc (Zn), nickel (Ni), copper (Cu), chromium (Cr) and mercury (Hg) were quantifi ed in both the fertilizer and vermicompost with an aqua regia extraction and quantifi ed by ICP Baird 2070 (Page, 1982).
The greenhouse study was concluded when the basil reached the commercial pre-bloom stage. Plant variables considered were dry matter weight and leaf size. Phosphorus (%P) and zinc (Zn mg kg-1) concentrations were measured in leaves. Data were statistically analysed for ANOVA using Statistix 4.0 software.
Results and discussionThe composition of the vermicompost was: 1.2 %N, 184 mg kg -1 P-Bray, and K 1.1 cmolc kg -1, and the fertilizer contained: 12.8% N, 4.5% P2O5 and 11.3 % K. Toxic metals, Cd, Pb, Zn, Ni, Cu, Cr and Hg, were evaluated in chemical fertilizer and biofertilizer; both compounds had lower levels of inorganic toxics than the maximum acceptable concentrations for biosolids of high quality according to the United States Environmental Protection Agency (US-EPA), and did not present limitations for European Union (EU). Fig. 1 shows the comparison between levels of metals and soil quality criteria for Argentine Law 24051, to remark the agricultural suitability of the materials.
Total organic carbon was associated to the highest rate of vermicomposts (50 and 100%), with a statistically signifi cant difference from the control (P < 0.05). The inorganic fertilizers did not show any variation in the total organic carbon content.The total nitrogen levels also increased (Fig. 2) and H4, H5, F1 and F2 differed signifi cantly from the control (P < 0.05). The C/N relationship was nearly 10/1 in all treatments. This relationship indicated that the vermicompost could be considered mature for use, without causing any nitrogen problems in the crop (Madrid
et al., 2000). Stability is an important property of compost as its application as soil conditioner or part of a growing medium requires a stable product characterized by odour, water content, pH and other parameters (Eggen, 2001). The results agree with those presented by Smith et al. (1999), about benefi cial effect of composted materials in increasing soil carbon and nitrogen content.
The evolution of Bray-available phosphorus with higher rates of vermicompost showed a great increase, with particularly large values in H5 (800 mg kg-1), such levels could cause contamination and nutritional imbalance in plants (Fig. 3).
The pH values were nearly neutral for the control and all doses of vermicompost, while those for inorganic fertilizers F1 and F2 were 5.6 and 5.3, respectively. Electrical conductivity values were higher in vermicompost (H4 and H5) and maximum in fertilizer (F2), with statistically signifi cant differences (P<0.05) compared with control (T0).The elevated electric conductivity values indicated importance of contents of soluble salts, which could increase the osmotic pressure in the system and produce nutritional problems that could be associated with damage and death of plants. Zheljazkov and Warman (2003) also recorded the same tendency of increasing pH and EC of the growth medium with an increased addition of vermicompost.
Results of plant analysis are shown in Table 1. Dry matter yield weights of basil plants showed a signifi cant decrease (P < 0.05) between the control (T0) and the higher rates of the vermicompost and fertilizer (H4, H5, F2), and growth of plants was similar for the rest of the treatments (H1, H2, H3 and F1) , with non signifi cant differences (P < 0.05).
The size of the basil leaf is very important for commercial use. The treatment H2 (10 % vermicompost) produced the greatest leaf length (10.74 cm) followed by H1 and H3. These three treatments behaved as a statistically homogeneous group. The treatments producing lower leaf sizes were H4 and H5 (50 and 100 % vermicompost added).
The percentage survival of plants was in general 100%, but amending the soil with 100% of vermicompost and the highest rate of the fertilizer produced signifi cant plant mortality.
The treatment that had adverse effects on growth, measured as reduction in dry weight and reduced development of the leaf and plant mortality, occurred when the vermicompost was used more than 50% and with highest rate of fertilizer, that could have a phytotoxic effect.
78 Comparison of conventional fertilization and vermicompost use for basil cultivation
Table 1. Effect of different treatments on plant charactersticsTreatment Dry
weight (g)Leaf length
(cm)Survival
(%)P
(%)Zn
(mg kg-1)T0 3.16b 8.43b 100b 0.38a 152.2bH1 2.94b 9.55c 100b 0.44a 138.2bH2 3.90b 10.74c 100b 0.50b 153.6bH3 3.86b 8.96c 100b 0.51b 119.6abH4 1.55a 6.19a 100b 0.53b 72.2abH5 0.38a 4.20a 65a 0.55b 44.0aF1 3.40b 8.49 b 100b 0.38a 159.2bF2 1.41a 8.41b 65a 0.38a 277.0bColumn values followed by the same letter are not signifi cantly different at P<0.05

The P content of basil leaf varied from 0.386 % P in T0 to 0.550 % P in H5. The inverse situation was observed with the Zn content, which decreased with the rate of vermicompost application. Zn levels varied between 152.2 mg kg-1 of Zn in T0 to 44.0 mg kg-1 of Zn in H5 (Table 1). The antagonism between P and Zn is a well-known interaction. As the content of P increased in the media, a decrease in the absorption and transport of the Zn from the roots could take place, and in some cases, it could cause nutritional problems and yield decrease (Malavolta, 1994). An antagonism P-Zn was manifested in treatments H3, H4 and H5.
Our results showed that vermicompost has agronomic value if used as an amendment, and also for leaf growth with commercial application, but possible negative effects must be kept in mind that could result from large doses, as well as in the case of fertilizers. Vermiculture to process organic waste and generate fertilizer can be a useful tool to promote sustainable development on a local scale in Latin-American cities (Spiaggi et al., 2001). As it was proposed by EPA (2001), we followed key factors contributing to vermicompost project success: comparison with other scientifi c research; comparative tests with different application rates of vermicompost, fertilizer and control plots; and a good trial design with statistically comprable results.
Zheljazkov and Warman (2004) reported that mature composts could be safely used as soil conditioners for agricultural crops, as addition of compost reduced bioavailability and transfer factors for micronutrients as Cu and Zn. It had also been demonstrated that soil amendment with compost is an effective non-chemical, environment-friendly means to prevent or to reduce the damage caused by Fusarium oxysporum f. sp. basilici that causes wilt in sweet basil plants (Zheljazkov and Warman, 2003).
A relevant agronomic application could be the exploitation of integrated nutrition. Jeyabal and Kuppuswamy (2001) showed that the integrated application of vermicompost, fertilizer N, Azospirillum and phosphobacteria increased rice yield by 15.9% over application with N fertilizer alone.
Fortuna et al. (2003) also suggested that it could play a role in optimizing nutrient availability and potential carbon sequestration in an agroecosystem. They reported a comparison of compost and chemical fertilizer, for corn–corn–soybean–wheat rotation compared to continuous corn. Compost applications over 6 years increased the resistant pool of C by 30% and the slow pool of C by 10%. The compost treatment contained 14% greater soil organic C than the fertilizer management. Proper management of nutrients from compost, cover crops and rotations can maintain soil fertility and increase C sequestration.
Vermicompost was as useful as fertilizer to obtain a product with commercial value. Both materials presented low toxic metals content, and the maturity of vermicompost was appropriated (C/N relationship was near 10). The restrictive factors for large rates of both materials were soluble salts content, which increased electrical conductivity, and produced plant mortality and P-Zn antagonism in plant. Vermicompost acted as organic amendment which presented a signifi cant increase in C and N levels. It should be taken into account that the application of vermicompost could hardly increase the amounts of available phosphorus, with a risk of nutritional imbalance and potential environmental problems. Mixture including more than 50% of the vermicompost and the highest rate of fertilizer showed statistically signifi cant differences for dry weight, leaf length, plant survival and P-Zn antagonism (P<0.05).
Comparison of conventional fertilization and vermicompost use for basil cultivation 79
0
20
40
60
80
100
120
140
160
Pb Zn Ni Cu Cr Hg*100 Cd*100
Hea
vym
etal
s(m
g/g)
Vermicompost Fertilizer
a
b
a
b
a
ba b
a
ba
b
a b
0123456789
10
T0 H1 H2 H3 H4 H5 F1 F2
Nt
C
a
a a
a
aaa
a ba
a
a
a
b b b
Perc
ent
0200400600800
1000T0a
H1a
H2a
H3b
H4b
H5b
F1b
F2b
P mg/kg
0
0.51
1.5
2
2.53
3.5
T0 H1 H2 H3 H4 H5 F1 F2
EC
(ds/
m)
Fig. 4. Evaluation of electrical conductivity for all treatments. Different characters designate statistical signifi cant differences ( P<0.05)
Fig. 3. P evaluation for all treatments. Different characters designate statistical signifi cant differences ( P<0.05)
Fig. 1. Heavy metals in fertilizer and vermicompost compared to argentinian soil quality criteria (SQ criteria). Different characters designate statistical signifi cant differences ( P<0.05)
Fig. 2. Evaluation of C and N for all treatments. Different characters designate statistical signifi cant differences ( P<0.05)
bbbb
b
aa
a

ReferencesAtiyeh, R.M., S. Subler, C.A. Edwards, G. Bachman, J. D. Metzger and
W. Shuster, 2000. Effects of vermicomposts and composts on plant growth in horticultural container media and soil. Pedobiologia, 44: 79-590.
Bray, R.H. and L.T. Kurtz, 1945. Determination of total, organic and available forms of phosphorus in soils. Soil Sci., 59: 39-45.
Eastman, B.R., P.N. Kane, C.A. Edwards and L. Trytrek, 2001. The effectiveness of vermiculture in human pathogen reduction for USEPA biosolids stabilization. Compost Science and Utilization., 9: 38-49.
Eggen,T. and O. Vethe, 2001. Stability indices for different composts. Compost Science and Utilization, 9: 19-26.
EPA (Environmental Protection Agency). 2001. Vermicompost to improve agricultural soils. www.epa.nsw.gov.au/waste.
Fortuna, A., R. Harwood, K. Kizilkaya and E.A. Paul, 2003. Optimizing nutrient availability and potential carbon sequestration in an agroecosystem. Soil Biology & Biochemistry, 35: 1005-1013
Govil, A. 2001. Biotechnological approaches for waste treatment. Standards India, 15(9): 5-9.
Ghosh, C. 2004. Integrated vermi-pisciculture— an alternative option for recycling of solid municipal waste in rural India. Bioresource Technology, 93: 71-75.
Jeyabal, A. and G. Kuppuswamy, 2001. Recycling of organic wastes for the production of vermicompost and its response in rice-legume cropping system and soil fertility. European Journal of Agronomy, 15: 153-170
Madrid, F., J.M. Murillo, R. López and F. Goatherd, 2000. Use of urea to correct immature urban composts for agricultural purposes. Commun. Soil Sci. Plant Analysis, 31(15&16): 2635-2649.
Malavolta, E. 1994. Relationship between the match and the agronomic zinc. Informaciones INPOFOS, 15: 5-7.
Marbán, L., L. Giuffré, S. Ratto and A. Agostini, 1999. Contaminación con metales en un suelo de la cuenca del río Reconquista. Ecología Austral, 9: 15-19.
Movahedi, N. and H.F. Cook, 2000. Infl uence of municipal waste compost amendment on soil water and evaporation. Commun. Soil Sci. Pl. Anal., 31: 3147-3161.
Nelson, D.W. and L.E. Sommers, 1982. Total carbon, organic carbon and organic matter. In: Methods of soil analysis. Page A.L. (Ed). Part 2. American Society of Agronomy, USA, Agronomy 9: 539-579
Page, L. 1982. Methods of soil analysis. Chemical and microbiological properties. American Society of Agronomy, Soil Science Society of America, Madison, Wisconsin. 1159p.
Polo, A. 1997. Residuos orgánicos urbanos. Consejo Superior de Investigaciones Científicas. Centro de Edafología y Biología Aplicada del Segura, España. 181p.
Rhoades, J.D. 1996. Salinity: Electrical Conductivity and Total dissolved Solids. In DL. Sparks et al. (ed.) Methods of soil analysis. Part 3. Chemical methods. SSSA and ASA, Madison, WI. p417-435.
Ruiz, A., N. Garcés and F. Guridi, 1999. Propiedades de vermicompost obtenidos en Cuba. 14 Congreso Latinoamericano de Ciencia del Suelo. Pucón, Chile. Actas: 410.
Smith, C.J., W.J. Bond and W. Wang, 1999. Vermicompost to improve Agricultural Soils. CSIRO Land and Water Technical Report, 23.
Spiaggi, E., R. Biasatti and M. Guillén, 2001. Urban Agriculture and local sustainable development: evaluation and monitoring tools. www.ruaf.org/conference/methods/papers/background/Spiaggi%2520Biassatti%2520and%2520Guillen
Zheljazkov, V. and P.R. Warman, 2003. Application of high Cu compost to Swiss chard and basil. The Science of the Total Environment, 302: 13-26
Zheljazkov, V. and P.R. Warman, 2004. Phytoavailability and fractionation of copper, manganese, and zinc in soil following application of two composts to four crops. Environmental Pollution, 131: 187-195.
80 Comparison of conventional fertilization and vermicompost use for basil cultivation

Journal of Applied Horticulture, 10(1): 81-84, 2008
Chilling requirement studies on fl ower buds in some male pistachio genotypes (Pistacia vera L.)
F. Nazoori1*, A. Talaie2 and A. Javanshah3
1Rafnajan’s Payam Nor University; 2Department of Horticultural Science, University of Tehran; 3Pistachio Research Institute, Rafsanjan-Iran. *E-mail: [email protected]
AbstractEffects of different chilling periods were evaluated on growth and development of fl oral buds of male seedling trees (Pistacia.vera L.) for chilling requirements of male genotypes helpful in predicting overlapping of fl owering with female trees and escape from spring cold damage. The chilling requirement and responses of male genotypes to chilling treatment were determined by applying eight levels of chilling to shoots (i.e. 600-1300 h) at 3±1 oC. Based on the effect of chilling hours on bud break on four male pistachio genotypes were grouped to early (P1 and P6) and late fl owering (P7 and P10) types. Percentage and rate of bud break, duration of fl owering, growth and development of bud (length and width) were evaluated. The results indicated that genotypes had different chilling requirement. Among the male pistachio genotypes, the adequate chilling hours (bud break >80%) for P1, P6, P7 and P10 genotypes were 800, 700, 1100, and 1300 hours, respectively. P1 and P6 had low chilling requirement (700 hours) for 50% bud break compared to P7 and P10 (900 and 800 hours). Increased chilling led to decreased heat unit requirements for sprouting, resulting in greater overall growth and development. Chilling was a determining factor in fl oral bud break for all the genotypes, increasing chilling also produced greater bud break percentages. All genotypes required fewer heat units for bud break as chilling increased. Increasing the chilling hours also increased the length and width of fl ower buds and reduced duration of fl owering.
Key words: Dormancy, bud break, cold storage, chilling requirement, bud development
IntroductionDormancy in plants has been described as a state in which visible growth is temporarily suspended (Samish, 1954), a phase in plant development allowing it to survive under winter conditions (Saure, 1985) and a state in which deciduous plants are without leaf or are lacking visible growth (Westwood, 1993). Endodormancy released from within plant parts, as controlled by chilling temperatures, is a major factor in determining a plant’s performance in a given climate or hardiness zone (Westwood, 1993). Temperate zone plants must be exposed to a certain period of chilling temperatures above freezing (Westwood, 1993) or a minimum number of hours below 7°C (45°F) (Saure, 1985) for dormancy break. This exposure period is referred as the chilling requirement. Dormancy requirements of landscape trees are of particular interest to the arborist and urban forester. Trees noted to perform well in northern climates, such as fl owering cherries, spruce, or beech, may perform poorly or fl ower not at all in southern climates. In other cases, trees noted to perform well in the south may leaf out too early in the north, resulting in cold and frost damage (Lechowicz, 1984).
Much work has been reported on fruit species with respect to dormancy and chilling requirements. In a study with peaches, once chilling requirement was satisfi ed, prolonged chilling induced enhanced leafi ng over blooming (Citadin et al., 2001). There are also cultivar differences in heat requirement for bloom. In a study with several fruit tree species, once chilling requirement was satisfi ed, prolonged chilling led to a decreased need for heat units for bud break (Couvillon and Erez, 1985).
The chilling optimum of temperate latitude forest trees varies
between 0 and 2,000 h of below 5oC (Jensen and Gatherum, 1965; Steinhhoff and Hoff 1972; Van den Driessche, 1975; Burr et al., 1989). Differences in chilling optimal within species may be caused by genetic variability, perhaps related to the different elevations and geographic regions in which the seed source was found (Rehfeldt, 1990). This genetic variation could in turn lead to the differences in chilling requirements between and within species. Most pistachios have a chilling requirement of 600-1200 hours. Not all buds of a plant have equal chilling requirements. Generally fl ower buds require less chilling than lateral buds. This is because fl ower buds often appear several days earlier than vegetative buds. Similarly, terminal buds have a lower chilling requirement than lateral buds. Therefore, in moderate climates (without severe cold in winters), terminal buds can begin to grow soon enough to establish apical dominance over laterals. In areas of severe winters, by the time the growing season begins both the apical and axillary’s buds may have all of the chilling requirements met. Therefore when spring fi nally arrives, the plant will begin to grow from both lateral and terminal buds simultaneously.
Samish and Lavee (1962) indicated about the lack of standardized method to evaluate the depth of dormancy. To properly evaluate the depth of dormancy in the entire plant, it should be exposed to temperature for growth as in a greenhouse, but this is diffi cult with large plants. In a series of experiments, Erez and Lavee (1979) used rooted cutting of peach to study the effect of alternating temperature in breaking bud dormancy. One might ask whether the presence of roots in close proximity to the buds might affect response; however, Couvillon and Erez (1985) had previously demonstrated that bud break on rooted cutting paralleled that
Journal
Appl

of mature trees. Therefore, cuttings bearing many buds will be the better choice for researchers wishing to predict the fi eld response. The larger cutting has better expected response. The source of cutting is also important, especially for theoretical studies; previous year’s shoots are normally used, but their vigor could affect response. Therefore, selected shoots should be similar in length and taken from similar position on the plant (Dennis, 2003).
Investigators often speak of the ‘end of rest’ when evaluating bud dormancy. This is usually defi ned as the time when 50% of the buds on excised shoots are capable of growth within a given period of time when held at an appropriate temperature with their bases in water. Greening of the bud scales is some times taken as evidence of bud break. The bases of cutting must be cut frequently to prevent vessel occlusion. Another problem is the danger of desiccation unless they are kept under high humidity, as in a mist bed. Growing cutting and/or bubs in vitro can prevent this (Dennis, 2003). Not much information is available about the chilling requirements of pistachio during the winter to ensure adequate bloom and pollination in the following spring (Crane and Iwakiri, 1981; Crane and Takeda, 1979).
The aim of this study was to evaluate the chilling requirement of male genotypes by exposing shoots to varying degree of chilling hours. The study will be helpful in the understaning of overlapped fl owering with female trees and resistance to spring cold damage.
Materials and methodsThe experiment was carried out during 2005-2006 using four male pistachio genotypes (P1, P6, P7, and P10) growing in Pistachio Research Institute at Rafsanjan, Iran. Their chilling requirements were calculated according to the chill unit. Temperatures between 0-7oC in winter of past year was 800-900 hours, latitude and longitude; 30º 25´N, 55º 45´E, respectively. To determine chilling requirement of mentioned genotypes, after leaf fall in the early November, 96 shoots of 30 -35 сm length from each genotype were picked up. After treating with Benomyl (2%) to protect from fungi, the shoots were warped in humid cloth and plastic then placed at temperature 3±1oC in referegerator.
The shoots were taken out from referegerator after chilled for desirable time (600 to 1300 h). These shoots were placed in
buckets with half Hoagland medium. At 100-hours interval bud sticks were removed from the referegerator and placed in nutrient solution in the growth chamber of Horticulture Department of Tehran University. The growth chamber at the laboratory, programmed to simulate a typical day in mid April (9 hour night with 11oC and15 hour light with 19oC), these parameters were based on the average of the past seven years. Fresh cuts were made in the shoot bases and the water was changed every 4 days. The experiment had a factorial design with two factors including chilling hours at 8 levels and four genotypes (early fl owering (P1, P6) and late fl owering (P7, P10) in base of randomized complete block. The fl ower bud breaking percentage was determined in each treatment and the data were analyzed by SAS software.
Results and discussionThere were signifi cant differences among genotypes for chilling requirements (Table 1). The adequate chilling hours for P1, P6, P7, P10 genotypes were 800, 700, 1100, and 1300, respectively. P1, P6 and P10, had minimum chilling hour requirement (700, 700, 800 hours) to initiate 50% bud break than P7 (800 h). None of the genotypes responded to 600 hours treatment, except P7. (Table 1).
Compared to early fl owering genotypes, late fl owering types required less chilling hours. In all genotypes, increasing the level of chilling accelerated the rate of fl ower bud break (Table 1). Differences in the number of heat units required to reach bud break at every chilling level were determined for each genotype. The level of chilling exposure required for fl ower bud break was inversely related to heat unit accumulation. The higher chilling treatments also generally exhibited the highest mean percentage bud break over the course of the experiment (Fig. 2). These observations were similar to those recorded by Ashby et al.(1991) and Couvillon and Erez (1985).
Increasing the chill hours also increased the length and width of fl ower buds (Fig. 3) which is in accordance to the fi ndings of Ferguson et al. (2003). Duration of fl owering decreased from 26 days (in 700 hour treatments) to 11 days (in 1300 hour treatments) (Fig. 4).
Information from the present and future studies may be used to facilitate the development of models for regional planting recommendations based on the amount of chilling received
Table1. Effect of chilling on mean fl ower bud opening percentage and its rate in different genotypes
Chill hours P1 P6 P7 P10
Flower bud opened
(%)
Rate of fl ower bud opening
Flower bud opened
(%)
Rate of fl ower bud opening
Flower bud opened
(%)
Rate of fl ower bud opening
Flower bud opened
(%)
Rate of fl ower bud opening
600 0.00 0.00 0.00 0.00 57.9cde 1.73i 0.00 0.00700 69.33bcd 2.47hig 85.913ab 4.92d 56.44cde 2.25hig 87.05ab 2.375ghi800 86.235ab 3.35efg 85.53ab 3.32efg 39.27e 3.03efgh 71.48bc 2.09ih900 88.77ab 3.61ef 51.083de 3.01efgh 49.25e 1.77i 85.02ab 5.34d1000 84.49ab 2.83fgh 76.3abc 3.05efgh 42.51e 2.78fgh 80.93ab 3.4e1100 81.493ab 3.95e 89.76ab 5.282d 89.92de 5.01d 73.02bc 5.31d1200 83.46ab 8.37b 88.65ab 3.65ef 74.1bc 2.982efgh 75.42bc 3.3efg1300 80.2ab 8.05b 97.72a 9.77a 44.9e 3.94e 83.77ab 6.4c*Means followed by different letters are signifi cantly different by Duncan’s Multiple Range Test at P=0.01
82 Chilling requirement studies on fl ower buds in some male pistachio genotypes

at a given location. More research will be needed to develop regional planting models for adequate pollination. The processes that lead to dormancy and bud break within a plant consist of many interacting factors (temperature, light, physiological and chronological age of plant, apical dominance, provenance, hormonal balances, environmental conditions, drought, fertility, etc.). These factors are related to chilling and heat unit accumulation and must be studied to present a accurate picture of specifi c chilling requirements in individual cultivars. Finally, one of the most critical concerns yet to be addressed is a determination of the optimal temperatures for break dormancy.
The present study assumed ambient temperatures below 7°C and constant at 3°C as adequate to accomplish chilling requirement and maintaining the greenhouse environment above 22°C was ideal for fl ushing. Perhaps lower or higher temperatures could be considered more effective for breaking dormancy. Also, differences between constant versus fl uctuating temperatures in a natural or simulated environment are the areas of additional study.
ReferencesAshby, W.C., D.F. Bresnan, C.A. Huetteman, J.E. Preece and P.L. Roth,
1991. Chilling and bud break in silver maple. J. Environ. Hort., 9: 1-4.
Burr, K.E., R.W. Tinus, S.J. Wallner and R.M. King, 1989. Relationships among cold-hardiness, root growth and bud dormancy in three conifers. Tree Physiol., 5: 291-306.
Carne, J.C. and B.T. Iwakiri, 1981. Morphology and reproduction of pistachio. Hort. Rev., 3: 375- 393.
Carne, J.C. and F. Takeda, 1979. The unique response of the Pistachio tree to inadequate winter chilling. HortScience,14(2): 135-137.
Citadin, I., M.C.B. Raseria., F.G. Herter and J. Baptista daSilva, 2001. Heat requirement for blooming and leafi ng in peach. HortScience, 36: 305-307.
Couvillon, G.A. and A. Erez, 1985. Infl uence of prolonged exposure to chilling temperatures on bud break and heat requirement for bloom of several fruit tree species. J. Am. Soc. Hort. Sci., 110: 47-50.
Dennis, F.G. 2003. Problem in standardizing methods for evaluating the chilling requirements for the breaking of dormancy in buds of woody plants. HortScience, 38 (3): 347-350.
Erez A. and S. Lavee, 1979. The effect of climatic conditions on dormancy development of peach buds. J. Amer. Soc. Hort. Sci., 96: 711-714.
Ferguson, L., G.F. Driever., T. Michalides and A.H. Hassan, 2003. Chill requirement of pistachios California pistachio industry. Ann. Rept., 90-91.
Fig.1. Infl uence of chilling hours on bud opening
Fig. 2. Effect of chilling hours on the fl ower bud opening rate
Fig. 3. Chilling effect on dimension of fl owering buds of pistachio male genotypes in growth chamber.
Fig. 4. Effect of chilling hours on the fl owering duration
Fig. 5. Shoot bud showing anthesis under growth chamber conditions
Chilling requirement studies on fl ower buds in some male pistachio genotypes 83
Chilling hours
b b a a a a a a
cc
ddc
b a bc
0
5
10
15
20
25
600
LengthWidth
700 800 900 1000 1100 1200 1300
Dim
ensi
on o
f bud
(mm
)
Chilling hours
a ab b
c
b
d
a
5
10
15
20
25
30
35
0600 700 800 900 1000 1100 1200 1300
Flow
erin
g du
ratio
n (d
ays)
a
bb
cccc
d012345678
600 700 800 900 1000 1100 1200 1300Chilling hours
Flow
er b
ud o
peni
ng ra
te
aaababbabab
c
0102030405060708090
700600Chilling hours
800 900 1000 1100 1200 1300
Bud
ope
ning
(%)

Jensen, K.F. and G.E. Gatherum, 1965. Effects of temperature, photoperiod, and provenance on growth and development of Scotch pine seedling. For. Sci., 11(2): 189-199.
Lechowicz, M.J. 1984. Why do temperate deciduous trees leaf out at different times? Adaptation and ecology of forest communities. Am. Natural., 124: 821-842.
Rehfeldt, G.E. 1990. Genetic differentiation among population of Pinus ponderosa from the upper Colorado river basin. Bot. Gaz., 151(1): 125-137.
Samish, R.M. 1954. Dormancy in woody plants. Ann. Rev. Plant Physiol., 5: 183-204.
Samish, R.M and S. Lavee, 1962. The chilling requirement of fruit trees. Proc. 16th Intl. Hort, Congr., 5: 239-299.
Saure, M.C. 1985. Dormancy release in deciduous fruit trees. Hort. Rev., 7: 239-300.
Steinhhoff, R.J and R.J. Hoff, 1972. Chilling requirement for breaking dormancy of western white pine seedlings. USDA For. Serv. Res. Note INT-153.
Van den Driessche, R. 1975. Flushing response of Douglas-fi r buds to chilling and to different air temperatures after chilling. BC For. Serv. Res. Div. Res. Note, 72. 22p.
84 Chilling requirement studies on fl ower buds in some male pistachio genotypes