journal of rock mechanics and geotechnical engineering · c. lambert, c. coll / journal of rock...
TRANSCRIPT
D
Ca
b
a
ARR2A
KRSDS
1
mscaasm
cPA
1Sh
Journal of Rock Mechanics and Geotechnical Engineering 6 (2014) 1–12
Journal of Rock Mechanics and Geotechnical Engineering
Journal of Rock Mechanics and GeotechnicalEngineering
journa l homepage: www.rockgeotech.org
iscrete modeling of rock joints with a smooth-joint contact model
. Lamberta,∗, C. Collb
Department of Civil and Natural Resources Engineering, University of Canterbury, Private Bag 4800, Christchurch 8140, New ZealandGolder Associates, Christchurch, New Zealand
r t i c l e i n f o
rticle history:eceived 14 May 2013eceived in revised form0 November 2013ccepted 8 December 2013
eywords:ock jointhear strengthEM simulationsmooth-joint model
a b s t r a c t
Structural defects such as joints or faults are inherent to almost any rock mass. In many situations thosedefects have a major impact on slope stability as they can control the possible failure mechanisms. Havinga good estimate of their strength then becomes crucial. The roughness of a structure is a major contributorto its strength through two different aspects, i.e. the morphology of the surface (or the shape) and thestrength of the asperities (related to the strength of the rock). In the current state of practice, roughnessis assessed through idealized descriptions (Patton strength criterion) or through empirical parameters(Barton JRC). In both cases, the multi-dimensionality of the roughness is ignored. In this study, we proposeto take advantage of the latest developments in numerical techniques. With 3D photogrammetry and/orlaser mapping, practitioners have access to the real morphology of an exposed structure. The derivedtriangulated surface was introduced into the DEM (discrete element method) code PFC3D to create asynthetic rock joint. The interaction between particles on either side of the discontinuity was describedby a smooth-joint model (SJM), hence suppressing the artificial roughness introduced by the particle dis-cretization. Shear tests were then performed on the synthetic rock joint. A good correspondence between
strengths predicted by the model and strengths derived from well-established techniques was obtainedfor the first time. Amongst the benefits of the methodology is the possibility offered by the model to beused in a quantitative way for shear strength estimates, to reproduce the progressive degradation of theasperities upon shearing and to analyze structures of different scales without introducing any empiricalrelation.© 2013 Institute of Rock and Soil Mechanics, Chinese Academy of Sciences. Production and hosting by
cwo2c(artss
. Introduction
The presence of discontinuities is inherent to almost any rockass and is a major contributor to strength and deformation of rock
tructures (natural or engineering). The characteristics of those dis-ontinuities not only control structurally controlled failures butlso greatly influence the shear strength of the rock mass. Beingble to describe the structure of a rock mass is critical to an under-tanding of its potential behavior. The development of variousapping techniques leads to a higher level of confidence on crucial
∗ Corresponding author.E-mail addresses: [email protected] (C. Lambert),
[email protected] (C. Coll).eer review under responsibility of Institute of Rock and Soil Mechanics, Chinesecademy of Sciences.
674-7755 © 2013 Institute of Rock and Soil Mechanics, Chinese Academy ofciences. Production and hosting by Elsevier B.V. All rights reserved.ttp://dx.doi.org/10.1016/j.jrmge.2013.12.003
r2rsir
ofrop
Elsevier B.V. All rights reserved.
haracteristics such as location, orientation and persistence fromhich stochastic discrete fracture network (DFN) representations
f the rock fabric are developed (Dershowitz, 1995; Rogers et al.,007). Based on numerical methods, equivalent rock mass can bereated and tested in order to characterize its constitutive behaviorPierce et al., 2007; Pine et al., 2007; Deisman et al., 2010). Thesepproaches are now able to model the engineering responses ofock and rock masses using some basic measured properties ofhe rock and the rock mass geometry as inputs. Offering a widerpectrum of predictions than the classical empirically-based clas-ification schemes (anisotropy, heterogeneous, etc.), the syntheticock mass approach and equivalents (Pierce et al., 2007; Pine et al.,007; Deisman et al., 2010) are turning to be a step forward forock mechanics practitioners. However, the question of the sheartrength of the discontinuities is in many cases poorly addressedn engineering practice despite having a significant impact on theock mass strength (Lambert, 2008).
The shear behavior of discontinuities is a combination of vari-us complex phenomena and interactions, such as dilation, asperity
ailure, deformation and interaction. Direct shear tests on naturalock discontinuities quickly enhanced the influence of roughnessn the mechanical behavior of discontinuities. Barton (1973) pro-osed to assess roughness with an empirical parameter, joint
2 ics and Geotechnical Engineering 6 (2014) 1–12
rdpJertHs(ct3eagwciioaHara
ndfi(u(a(ojK(ptemshei(pldnsriuind(sbcpr
Table 1Target (laboratory) and calibrated (calculation) bulk properties of the granite.
Method Uniaxial compressive strength (MPa) Young’s modulus (GPa)
oa
2
2
pUcptfgappptsfamcm
mapsaaaso(sdabm
aihbiafcc
t
C. Lambert, C. Coll / Journal of Rock Mechan
oughness parameter (JRC), from which the shear strength of theiscontinuity can be established. Initially estimated by visual com-arison with standard roughness profiles, correlations between
RC and various statistical parameters or fractal dimension werestablished (Tse and Cruden, 1979; Carr and Warriner, 1989). Moreecently, laser scanner and photogrammetry were used to definehe surface topography and estimate its roughness (Grasselli, 2001;ans and Boulon, 2003; Haneberg et al., 2007). The dependence of
hearing on the location and distribution of the three-dimensional3D) contact area was demonstrated (Gentier et al., 2000) and newonstitutive relations were developed based on a general descrip-ion of roughness (Grasselli and Egger, 2003). Laser scanning andD photogrammetry techniques were applied in the field (Fardint al., 2004) for large-scale surface measurements. Asperity shapend distribution on a discontinuity can now be measured with areat detail and potentially incorporated in any analysis. Howeverith the complexity of the interaction between the two walls, a
omplete analytical formulation remains a hard task. Since the firstdealized “saw-tooth” description proposed by Patton (1966), var-ous constitutive models were developed that accommodate effectf asperities (Barton and Choubey, 1977; Saeb and Amadei, 1992)nd their progressive degradation during shearing (Plesha, 1987;utson and Dowding, 1990; Lee et al., 2001; Misra, 2002) to name
few. Despite being each time more advanced, these models stillely on empirical relations or simplified descriptions of the surfacesperities.
In an attempt to address this problem, many authors usedumerical tools to assess the shear strength of discontinuities. Two-imensional DEM (discrete element method) simulations wererst presented as they offer a provision for asperity degradationCundall, 2000; Lambert et al., 2004). They have been successfullysed to investigate gouge formation and evolution upon shearingZhao et al., 2012; Zhao, 2013). However these simulations weret this stage limited to qualitative observations. Hybrid FEM/DEMKarami and Stead, 2008) and FEM (Giacomini et al., 2008) meth-ds proved their ability to reproduce typical behavior of rockoints including dilation and asperity degradation. Using 3D DEM,ulatilake et al. (2001) showed that realistic macroscopic friction
i.e. at the joint level) could be obtained combining very smallarticles at the joint interface and extremely low contact fric-ion. However this approach appears to be not very practical forngineering purposes. No formulation is available to calibrate theicro-properties of the joint model material against a given macro-
copic behavior and the macroscopic friction targeted was quiteigh (friction coefficient of 0.7). In the field, discontinuities oftenxhibit a much lower strength. The particle size required may hencencrease the computational cost to unpractical levels. Park and Song2009) performed numerical shear tests on standard roughnessrofiles using the DEM code, PFC3D. This work once again high-
ighted the current limitations of particulate description as theiscrete nature of the medium can introduce an artificial rough-ess to the discontinuity. The apparent roughness of the numericalpecimen is higher than the introduced roughness (i.e. the initialoughness of the introduced surface or profile). The consequences a slight overestimation of the strength and most importantlynrealistic predictions of dilation. The later point can be of major
mportance as joint aperture controls fluid flow in the disconti-uities (Hans and Boulon, 2003; Buzzi et al., 2008). The recentevelopment of a new contact model named “smooth-joint model”SJM) (Pierce et al., 2007) in PFC3D where particles are allowed tolide past one another without over-riding one another was a major
reakthrough to represent discontinuities as planar surfaces asso-iated to a realistic behavior for structural defects. In this study, weropose to develop in PFC3D a synthetic rock joint where a digitalepresentation of a surface is introduced and described as a serieswcim
Laboratory 142.5 48.4Calculation 143.8 48.6
f SJMs. The mechanical behavior of the synthetic rock joint is thennalyzed performing numerical direct shear tests.
. DEM simulations of constant normal stress shear tests
.1. The discrete element method
The commercially available PFC3D (Itasca, 2008) softwareackage was used for the 3D DEM simulations presented here.nlike continuum codes, materials are described in PFC3D as a dis-ontinuous medium as a collection of spherical rigid particles. Thearticles displace independently of one another following New-on’s second law and interact with each other through contactorces that are generated at each contact point. Rock and moreenerally cohesive materials are represented as a bonded particlessembly, adding parallel bonds to create a synthetic material. Aarallel bond acts like a conceptual cementitious material betweenarticles. It has a finite dimension defined as a fraction of thearticle diameter, a tensile and shear strength and a normal andangential stiffness. When the contact force exceeds either ten-ile or shear strength, the parallel bond breaks and a micro-crackorms between the particles. Micro-cracks can eventually coalesces external loading is applied and form fractures that can split theaterial into clusters. The location and the failure mode of the
racks are recorded. A detailed description of contact and bondodels is provided in the user manual (Itasca, 2008).The mechanical response of such assemblies, observed at a
acroscopic level, is an emergent property of the complex inter-ctions between the particles. Input parameters of the bondedarticle model are micro-properties, contact properties and bondtrength, and are not measurable with conventional laboratorypparatus. They are calibrated through an iterative process. Once
particle size distribution has been selected, cylindrical particlessemblies are generated and unconfined compression tests areimulated varying micro-properties until the mechanical responsef the synthetic material conforms to the mechanical propertiesi.e. uniaxial compressive strength, UCS; Young’s modulus; Pois-on’s ratio) of the physical material (measured in the lab). A detailedescription of the calibration procedure can be found in Potyondynd Cundall (2004). Once properly calibrated, such bonded assem-lies proved their ability to reproduce typical behavior of rock-likeaterials (Kulatilake et al., 2001; Potyondy and Cundall, 2004).Properties of the granite considered for the scope of this study
re given in Table 1. The micro-properties were calibrated accord-ngly. Normal and shear stiffnesses for contact and parallel bondsave impact on elastic properties of the particle assembly whereasond shear and normal strengths mainly control UCS values. Var-
ous studies by Cundall (2000), Kulatilake et al. (2001) and Parknd Song (2009) illustrated the necessity to introduce low particleriction to reproduce the shearing behavior of fracture planes inohesive materials. In this study, bond strengths were calibratedonsidering zero friction between particles (�p = 0◦).
Besides Potyondy and Cundall (2004) showed that particle fric-ion impacts mainly on the post peak behavior of bulk material
ith little effect on peak strength. The influence of �p will be dis-ussed with more detail in Section 3.3. The result of the calibrations given in Table 2 and the emergent bulk properties of the synthetic
aterial are listed in Table 1.

C. Lambert, C. Coll / Journal of Rock Mechanics and Geotechnical Engineering 6 (2014) 1–12 3
Table 2Material micro-properties for the granite sample.
Particle properties
Particle mean radius(mm)
Particle radius ratio Particle contactmodulus (GPa)
Particle normal toshear stiffness ratio
Particle frictioncoefficient
1.5 1.66 56.1 2.5 0.0
Parallel-bond properties
Parallel-bond radiusmultiplier
Parallel-bond modulus(GPa)
Normal to shearstiffness ratio
Bond normal strength (MPa) Bond shear strength (MPa)
Mean value Standarddeviation
Mean value Standarddeviation
1.0 56.1 2.5 191 19.1 191 19.1
2
asaTwa(s
Z
wo�
r
J
oJo
F2
faaigaCr
2
1ld
whftdtafea1t(
Fig. 1. Morphology of the granite surface. All dimensions are in mm.
.2. Description of the interface
The interface morphology used in the simulations is based on natural discontinuity in granite studied by Grasselli (2001). Theurface is 140 mm × 140 mm and the maximum amplitude of thesperities is around 9 mm. Fig. 1 shows a general view of the surface.he 3D surface was triangulated using a Kriging gridding methodith a horizontal spacing of 1.4 mm between the grid points (in X-
nd Y-directions). Ninety nine profiles along the sliding directionX-direction) were extracted for which the coefficient Z2 (root meanquare of the first derivative of the profile) was estimated:
2 =
√√√√ 1(N − 1)�x2
n∑i=1
(zi+1 − zi)2 (1)
here zi and zi + 1 are the elevation of two consecutive grid pointsn a profile, N is the total number of grid points on a profile, andx is the horizontal spacing.For each profile, a value of JRC was derived using the empirical
elation proposed by Yang et al. (2001):
RC = 32.69 + 32.98 log10(Z2) (2)
The profiles of the triangulated surface exhibited an average JRCf 10.4, varying from 4.9 to 13.9. Grasselli et al. (2002) estimated aRC of 12.5 using a quantitative 3D surface description. The valuebtained by Grasselli et al. (2002) is in the range of variation of JRC
mrfs
ig. 2. Smooth joint contact model between ball 1 and ball 2. Surface 1 and surface denote either side of the joint lying at a dip angle of �p (after Itasca, 2008).
or individual profiles but appears to be slightly higher than theverage value. However, the value of Z2 and hence the derived JRCre sensitive to sampling intervals (Yu and Vayssade, 1991). Apply-ng the same approach varying the horizontal spacing between therid points of the triangulated surface, the average JRC increases to
value of 11.6 for a horizontal spacing of 0.56 mm (Lambert andoll, 2009). The average JRC value of 10.4 was considered to be aeasonable estimate of the surface roughness used for this study.
.3. The synthetic rock joint model
The numerical rock joint consists of a 140 mm ×40 mm × 50 mm (respectively X-, Y-, and Z-directions) paral-
elepiped particle assembly. The specimen genesis procedure isescribed in detail in Potyondy and Cundall (2004).
For the first series of simulations, three particle assembliesere generated, each one containing around 98,000 particlesaving a radius ranging from 0.5 mm (in the vicinity of the inter-
ace) to 2.4 mm. These specimens differ from one another only inheir packing. A discontinuity is usually represented in PFC3D byebonding contacts along a surface. However, the particle geome-ry is still present and the discrete nature of the medium generatesn artificial roughness that is added to one of the introduced sur-aces, thus creating a particle size dependent joint behavior. Forxample, the DEM model presented by Park and Song (2009) using
standard profile with a JRC of 11.49 exhibited an apparent JRC of7.55. To overcome the problem, an alternate scheme, termed ashe “smooth-joint model” or SJM, initially proposed by Pierce et al.2007), was implemented in PFC3D (Itasca, 2008). A smooth-joint
odel is a contact model that simulates the behavior of an interface,egardless of the local particle contact orientation along the inter-ace. A typical smooth-joint is shown in Fig. 2. It allows particles tolide past one another without over-riding one another. A smooth

4 ics and Geotechnical Engineering 6 (2014) 1–12
jtTttTri(tisitAcst
gaTcoctatTc(dlo1p
coo�j(F
aandanoostdmfara(tdt
Fig. 3. Visualization of the synthetic rock joint sample (upper wall in orange andlower wall in brown): (a) general 3D view; (b) horizontal cross-section throughm
Mssictsssda
C. Lambert, C. Coll / Journal of Rock Mechan
oint is created by assigning this new contact model to all the con-acts between particles that lie upon opposite sides of the surface.he SJM defines the tangential and normal directions accordingo the local orientation of the surface (by opposition to the ini-ial normal and tangential directions of the contact, see Fig. 2).he joint normal and tangential force increments (�Fnj and �Ftj,espectively) are derived from normal and tangential displacementncrements (�Unj and �Utj), multiplying by the joint stiffnesses�Fnj = knj�Unj and �Ftj = ktj�Utj). The joint force is then adjustedo satisfy the force-displacement relationship and mapped backnto the global system. This new formulation accommodates thetandard shear behavior of a joint (friction, cohesion and dilation)ndependently of particle induced roughness. A complete descrip-ion of the formulation can be found in the manual (Itasca, 2008).n initial study by Lambert et al. (2010) on the behavior of a rock-oncrete interface suggested that realistic shear behavior, sheartrength and dilation, could be obtained associating the SJM with arue morphology.
An algorithm was developed for the importation of the trian-ulated surface presented in Section 2.2 into a bonded particlessembly. The same surface was used for each wall of the joint.o be assigned a smooth-joint model, a contact must satisfy twoonditions: (1) the two contacting balls must lie on opposite sidef the plane containing the triangle; and (2) the projection of theontact location onto this plane must lie within the bounds ofhe triangle. The orientation of the smooth joint, defined by a dipngle and a dip direction, corresponds to the orientation of theriangle. The process is repeated for every triangle of the surface.he joint surface is hence modeled as a collection of smooth-jointontacts. The discontinuity was considered to be purely frictionali.e. no bond is introduced) with a friction angle set to 20◦. Noilation was introduced as macroscopic dilation (i.e. at the joint
evel) is expected to be an emergent property of the surface topol-gy. The SJM parameters are given in Table 3. The output is a40 mm × 140 mm synthetic rock joint sample (SRJ) whose mor-hology corresponds to the natural rock joint that is being analyzed.
In this paper, “synthetic rock joint” or SRJ will refer to the dis-rete element model of a rock joint. Its properties such as strengthr stiffness will be macro-properties (i.e. computed at the scalef sample) and are denoted using an uppercase letter (e.g. ˚peak,peak). The SJM on the other hand refers to a local contact on the
oint surface. Lowercase letters will be used for micro-propertiese.g. �j, knj). A full 3D view of the numerical sample can be seen inig. 3.
During the direct shear tests, specimens are firstly subjected to compression along axis Z (Fig. 3) and then to a shearing alongxis X at constant normal stress. During the compression stage, theormal load is applied to the upper wall of the specimen whileisplacements of the lower wall are restraint. The required load ispplied in five incremental stages. For each stage, the incrementalormal force is equally shared between the particles of the top layerf the specimen (i.e. between the particles whose centers are withinne average diameter from the top of the specimen) and progres-ively applied in 100 time steps. The system is then dynamically seto equilibrium before proceeding to the next stage. During shearing,isplacements along Y-axis are restrained whereas shear displace-ents along X-axis are applied to the lower wall. The sum of contact
orces on the periphery of the upper wall is used to compute theverage normal stress and shear stress on the interface whereaselative normal and tangential displacements are monitored, aver-ging particle displacements on the periphery of the lower wall
Z-displacements and X-displacements, respectively). Joint aper-ure is defined as the relative normal displacement. A particle isefined as belonging to the periphery if the distance from its centero the closest specimen boundary is lower than average diameter.nfaa
ean fracture plane; (c) vertical cross-section.
icro-cracks due to bond breakage, contact force distribution andtress–strain path are monitored during the shear tests. The directhear tests are run in a large strain mode. As shear displacementncreases, new contacts are created along the discontinuity. Theseontacts are assigned a smooth-joint contact model and the orien-ation of the smooth joint depends on the location of the contact. Apecial algorithm was developed to determine which triangle of theurface morphology is intersected by the newly created contact. Ashearing occurs, the mirror surface associated with the upper walloes not match the lower surface. Each contact intersects two tri-ngles with possibly different orientations. The orientation of eachew contact could be associated in reality with any of the two sur-
aces or be a combination of the two surfaces. In this study, the
ssumption was made to consider only the surface morphologyssociated with the upper wall.
C. Lambert, C. Coll / Journal of Rock Mechanics and Geotechnical Engineering 6 (2014) 1–12 5
Table 3Smooth-joint model contact parameters.
Friction angle, �j (◦) Dilation angle, j (◦) Radius multiplier, � Bond mode, M Bond cohesion, cj
(MPa)
20 0 1 0 0
Bond tensile strength, Bond friction angle, �bj Joint normal stiffness,/m)
Joint tangentialstiffness, ktj (GPa/m)
Large strain flag, Bl
12.5 1
2
fssomsbnpowmmpntitw0rl1
Fnmis
oe�sd
stIt˚
�
w
ttoT(
�cj (MPa) (◦) knj (GPa
0 0 50.0
.4. Mechanical behavior of the discrete interface
Numerical shear tests under constant normal stress were per-ormed on the SRJ for three values of normal confinement. Normaltress values of 0.5 MPa, 1 MPa and 1.5 MPa were applied to theample which correspond approximately to 0.35%, 0.7% and 1.05%f the intact rock UCS, respectively. Those low values of nor-al stress corresponding to the order of magnitude of normal
tress practitioners usually have to be dealt with for slope sta-ility problems. Fig. 4 shows the evolution of shear stress andormal displacement with shear displacement for one particularacking. It can be seen that the classical elasto-plastic responsef rock joints is well captured, thus confirming a good agreementith typical behaviors that can be observed experimentally. Theobilized shear stress increases to a peak value as roughness isobilized and then decreases due to asperity degradation. The
eak value defines the shear strength of the SRJ (the higher theormal stress, the higher the shear strength). It can be noted thathe peak is reached after 1.5 mm of tangential displacement whichs on the upper limit of what is usually observed. The stiffness ofhe smooth joint was probably underestimated and this questionill be discussed in Section 3.2. The peak shear strengths were
.51 MPa, 0.9 MPa and 1.21 MPa. The friction calculated from theatio of peak shear stress to applied normal stress was higher atower normal stresses (1.01, 0.90 and 0.81 at 0.5 MPa, 1 MPa and.5 MPa, respectively), enhancing a nonlinear strength envelope.
Normal displacement versus tangential displacement curves inig. 4 show that overall dilation of the rock joint is reduced asormal stress increases. As shearing takes place and roughness isobilized, the dilation angle defined as �un/�us increases to a max-
mum value �peak (peak dilation angle) at the peak of the sheartress.
Three different specimens were generated varying the packingf the particle assembly. The same shear tests were simulated onach specimen. Peak shear strengths �peak and peak dilation anglespeak are reported in Fig. 5. Peak shear strength shows a limited
ensitivity to particle packing whereas significant variation of peakilation angle is observed.
The numerical shear tests performed under increasing normaltress define the strength envelope of the model from which a Bar-on failure criterion (Barton and Choubey, 1977) can be expressed.n Barton’s formulation, the shear strength is expressed as a func-ion of the JRC, joint compressive strength (JCS) and base friction
b:
p = �ntan[JRC log10
(JCS
�n+ ˚b
)](3)
here �p is the peak shear stress and �n the normal stress.Barton’s failure criterion was applied to predict the strength of
he SRJ. ˚b refers to the base friction of the joint which corresponds
o the friction a perfectly smooth joint would have. The base frictionf the SRJ corresponds to the friction angle of the SJM (�j = 20◦).he JCS corresponds to the UCS of the synthetic material, 143 MPaTable 1), and the JRC of the triangulated surface was estimated toFig. 4. Stress and displacement curves of direct shear tests under constant normalstress (ranging from 0.5 MPa to 1.5 MPa) on a 140 mm × 140 mm surface. (a) Shearstress versus tangential displacement. (b) Normal displacement versus tangentialdisplacement.

6 C. Lambert, C. Coll / Journal of Rock Mechanics an
Fjl
1u
�
trTtBtrpd
Amb
3
sgi
rspossptssacfimtteEp
3
tpoms1sn(tdd
Adbw
s˚bvba˚ran asperity component as suggested by Barton and Bandis (1982)
ig. 5. Comparison of peak shear strength and dilation angles of the synthetic rockoint (diamond) with their respective predicted values from Eqs. (3) and (4) (dashine).
0.4. In Barton’s formulation, the dilation angle can be estimatedsing the following empirical relation:
peak = JRC log10
(JCS
�n
)(4)
The predictions of shear strength and peak dilation angle ofhe SRJ with Eqs. (3) and (4) were compared with the numericalesults obtained from the simulations and can be seen in Fig. 5.he measured strength appears to be in very good agreement withhe prediction obtained with a widely used relationship such asarton’s failure criterion. Fig. 5 shows some differences between
he measured dilation angles and Barton’s predictions. If for theange of normal stress applied in this study, the measured andredicted values are of the same order, the general trend in theecrease of dilation with normal stress is significantly different.ais
d Geotechnical Engineering 6 (2014) 1–12
n overestimation of the dilation can be expected at high nor-al stress. However, the SRJ seems to well capture the mechanical
ehavior of a natural rock joint.
. Parametric study
The SRJ, as described in Section 2, does not rely on any empiricalcheme or any particular assumption on surface roughness. It isenerated using a 3D measurement of the surface morphology andntact rock properties.
Such discrete model seems to well capture the effect of surfaceoughness on the mechanical behavior of rock joints. Results ofhear test simulations show a very good agreement with Barton’srediction, based on JRC. This suggests that predictive estimationsf shear strength should be possible combining 3D surface mea-urements with a smooth-joint contact model. A number of SRJamples were generated varying the properties of the SJM and thearticle friction angle to enhance the relation between some con-act properties and the emergent macroscopic behavior. The sameurface morphology (140 mm × 140 mm) was introduced and theame particle size distribution was used to generate the particlessembly representing the rock. Scale dependency and particle dis-retization will be discussed in Section 4. A SJM is defined throughve parameters, i.e. friction, cohesion, dilation and stiffness (nor-al and tangential). Only purely frictional joint was considered at
his stage. No local dilation (i.e. at the contact level) was introducedhrough the SJM as macroscopic dilation (i.e. at the joint level) isxpected to be an emergent property of the surface’s roughness.ffects of joint friction angle �j, joint stiffnesses knj and ktj, andarticle friction �p were analyzed.
.1. Effect of joint friction angle
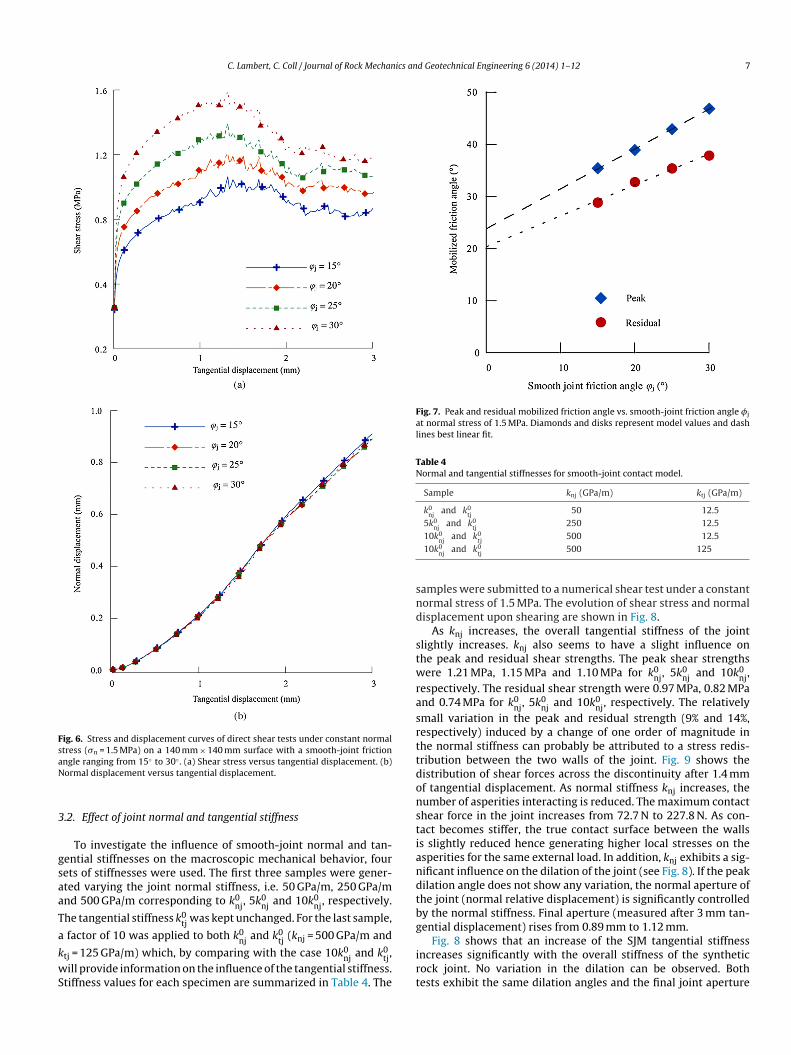
Four 140 mm × 140 mm joints were generated with a joint fric-ion angle �j ranging from 15◦ to 30◦. Direct shear tests wereerformed at a constant normal stress of 1.5 MPa. The evolutionf shear stress and normal displacement with tangential displace-ent is shown in Fig. 6. As joint friction increases, peak shear
trength and residual shear strength increase from 1.06 MPa to.60 MPa and from 0.82 MPa to 1.16 MPa, respectively. The residualhear strength can be characterized by relatively stable shear andormal stresses with degradation on joint surfaces still occurringGentier et al., 2000). Direct shear tests by Grasselli (2001) showhat residual strength is reached slightly before 3 mm of tangentialisplacement. In this study, however, residual shear strength wasefined as the shear stress after 3 mm of tangential displacement.
As �j increases, the mechanical behavior becomes more brittle.s expected, dilation remains unchanged and emerges as indepen-ent of the smooth-joint friction angle. In comparison simulationsy Park and Song (2009) exhibited a significant increase in dilationhen friction coefficient increased from 0 to 0.3 (from 0◦ to 16.7◦).
Mobilized peak friction angles ˚peak (ratio between peak sheartress and normal stress) and mobilized residual friction angles
res (ratio between residual shear stress and normal stress) cane seen in Fig. 7. ˚peak varies from 35.4◦ to 46.8◦ whereas ˚res
aries from 28.8◦ to 37.8◦. A very good linear relation can be drawnetween the mobilized friction angles and the smooth-joint frictionngle (coefficient of determination of 0.999 for ˚peak and 0.987 forres). This result is consistent with the idealized decomposition of
ock joint strength as the addition of a frictional component and
nd confirms that the smooth-joint friction angle �j should be cal-brated according to base friction (i.e. friction angle of a planarurface).
C. Lambert, C. Coll / Journal of Rock Mechanics and Geotechnical Engineering 6 (2014) 1–12 7
Fig. 6. Stress and displacement curves of direct shear tests under constant normalstress (�n = 1.5 MPa) on a 140 mm × 140 mm surface with a smooth-joint frictionaN
3
gsaa
T
a
kwS
Fig. 7. Peak and residual mobilized friction angle vs. smooth-joint friction angle �j
at normal stress of 1.5 MPa. Diamonds and disks represent model values and dashlines best linear fit.
Table 4Normal and tangential stiffnesses for smooth-joint contact model.
Sample knj (GPa/m) ktj (GPa/m)
k0nj
and k0tj
50 12.55k0
njand k0
tj250 12.5
snd
stwrasrttdonstiandtbg
ngle ranging from 15◦ to 30◦ . (a) Shear stress versus tangential displacement. (b)ormal displacement versus tangential displacement.
.2. Effect of joint normal and tangential stiffness
To investigate the influence of smooth-joint normal and tan-ential stiffnesses on the macroscopic mechanical behavior, fourets of stiffnesses were used. The first three samples were gener-ted varying the joint normal stiffness, i.e. 50 GPa/m, 250 GPa/mnd 500 GPa/m corresponding to k0
nj, 5k0nj and 10k0
nj, respectively.
he tangential stiffness k0tj was kept unchanged. For the last sample,
factor of 10 was applied to both k0 and k0 (knj = 500 GPa/m and
nj tjtj = 125 GPa/m) which, by comparing with the case 10k0nj and k0
tj,ill provide information on the influence of the tangential stiffness.
tiffness values for each specimen are summarized in Table 4. The
irt
10k0nj
and k0tj
500 12.510k0
njand k0
tj500 125
amples were submitted to a numerical shear test under a constantormal stress of 1.5 MPa. The evolution of shear stress and normalisplacement upon shearing are shown in Fig. 8.
As knj increases, the overall tangential stiffness of the jointlightly increases. knj also seems to have a slight influence onhe peak and residual shear strengths. The peak shear strengthsere 1.21 MPa, 1.15 MPa and 1.10 MPa for k0
nj, 5k0nj and 10k0
nj,espectively. The residual shear strength were 0.97 MPa, 0.82 MPand 0.74 MPa for k0
nj, 5k0nj and 10k0
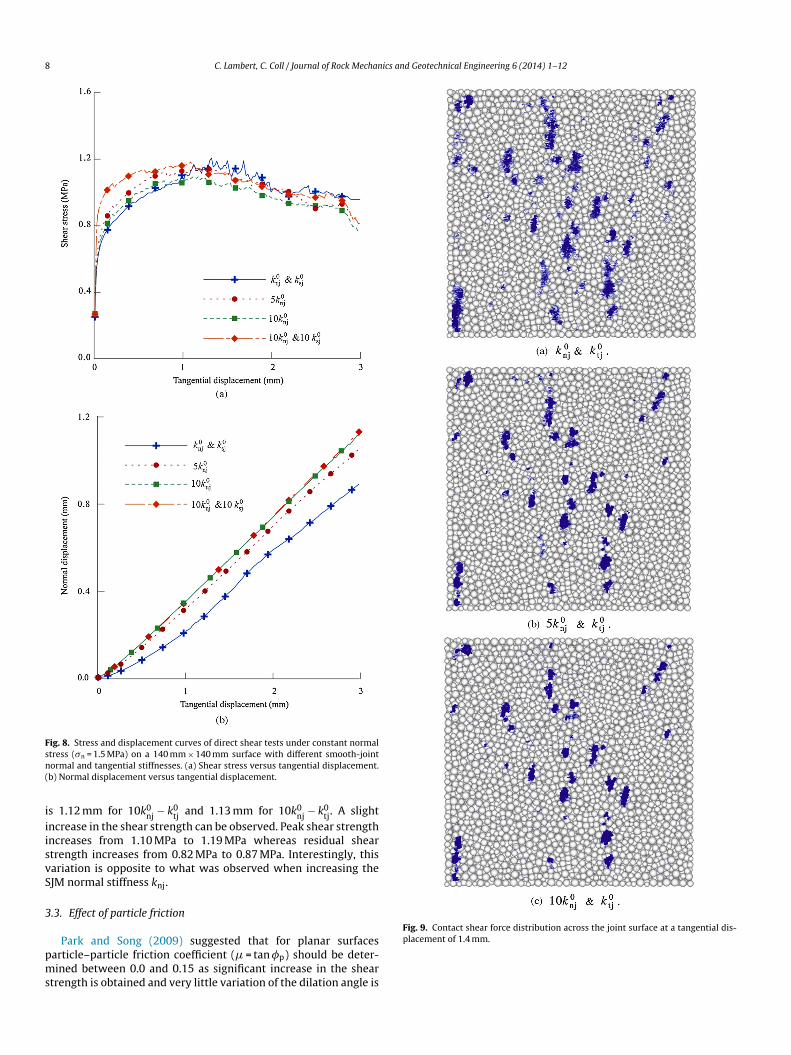
nj, respectively. The relativelymall variation in the peak and residual strength (9% and 14%,espectively) induced by a change of one order of magnitude inhe normal stiffness can probably be attributed to a stress redis-ribution between the two walls of the joint. Fig. 9 shows theistribution of shear forces across the discontinuity after 1.4 mmf tangential displacement. As normal stiffness knj increases, theumber of asperities interacting is reduced. The maximum contacthear force in the joint increases from 72.7 N to 227.8 N. As con-act becomes stiffer, the true contact surface between the wallss slightly reduced hence generating higher local stresses on thesperities for the same external load. In addition, knj exhibits a sig-ificant influence on the dilation of the joint (see Fig. 8). If the peakilation angle does not show any variation, the normal aperture ofhe joint (normal relative displacement) is significantly controlledy the normal stiffness. Final aperture (measured after 3 mm tan-ential displacement) rises from 0.89 mm to 1.12 mm.
Fig. 8 shows that an increase of the SJM tangential stiffnessncreases significantly with the overall stiffness of the syntheticock joint. No variation in the dilation can be observed. Bothests exhibit the same dilation angles and the final joint aperture
8 C. Lambert, C. Coll / Journal of Rock Mechanics and Geotechnical Engineering 6 (2014) 1–12
Fig. 8. Stress and displacement curves of direct shear tests under constant normalsn(
iiisvS
3
pms
Fig. 9. Contact shear force distribution across the joint surface at a tangential dis-
tress (�n = 1.5 MPa) on a 140 mm × 140 mm surface with different smooth-jointormal and tangential stiffnesses. (a) Shear stress versus tangential displacement.b) Normal displacement versus tangential displacement.
s 1.12 mm for 10k0nj − k0
tj and 1.13 mm for 10k0nj − k0
tj. A slightncrease in the shear strength can be observed. Peak shear strengthncreases from 1.10 MPa to 1.19 MPa whereas residual sheartrength increases from 0.82 MPa to 0.87 MPa. Interestingly, thisariation is opposite to what was observed when increasing theJM normal stiffness knj.
.3. Effect of particle friction
Park and Song (2009) suggested that for planar surfacesarticle–particle friction coefficient ( = tan �p) should be deter-ined between 0.0 and 0.15 as significant increase in the shear
trength is obtained and very little variation of the dilation angle is
placement of 1.4 mm.

C. Lambert, C. Coll / Journal of Rock Mechanics and Geotechnical Engineering 6 (2014) 1–12 9
Fig. 10. Stress and displacement curves of direct shear tests under constant normal stress (�n = 1.5 MPa) on a 140 mm × 140 mm surface for different particle friction angles( ◦ ◦ rmalt ment
ojPietbtu
ts1
bcptabsia
�p ranging from 0 to 10 ). (a) Shear stress versus tangential displacement. (b) Noangential displacement. (d) Number of clusters in the gouge vs. tangential displace
bserved. In this study, direct shear tests on rough synthetic rockoints were performed under a constant normal stress of 1.5 MPa.article friction angles of 0◦, 5◦ and 10◦ were used, correspond-ng to friction coefficients of 0.0, 0.087 and 0.176, respectively. Forach particle friction angle, the micro-properties were calibratedo generate particle assemblies exhibiting the same mechanicalehavior (deformation and strength) on unconfined compressionest. The evolutions of the shear stress and normal displacementpon shearing are shown in Fig. 10.
Peak and residual shear strengths increase with particle fric-ion (�j kept constant). No significant difference materializes on thehear stress curves before a tangential displacement of 1 mm. After
mm, micro-cracking (i.e. bond breakage) in the particle assembly
cfirn
displacement versus tangential displacement. (c) Number of micro-cracks versus.
ecomes significant as can be seen in Fig. 10. The increase of micro-racks leads to the formation of a gouge (materialized as singlearticles or clusters of several particles) between the two walls ofhe joint. Differences in the number of clusters forming the gougeppear after a tangential displacement of 1 mm (see Fig. 10d). It cane noted that significant degradation occurs long after the peakhear stress. The rate of degradation however is maximal at ormmediately after the peak. With the formation of a gouge, forcescross the interface are transmitted not only through smooth-joint
ontacts but also through clusters of particles. Shear strength oflled joints is highly influenced by the strength of the infill mate-ial. As the particle friction angle is increased, the strength of theewly formed gouge is increased. The dilation shows little variation
10 C. Lambert, C. Coll / Journal of Rock Mechanics and Geotechnical Engineering 6 (2014) 1–12
FB
fni
4
sn
atteRNdp
J
J
btrtc
4
gs4tbdtesps
asaca
Fig. 12. Variation of peak shear stress and peak dilation angle with joint size(� = 1.5 MPa): mean value (diamond) and variability (plain line). Comparison withca
rfeapp
4
ig. 11. Scale effects in the shear strength components of non-planar defects (afterandis et al. (1981)).
or the range of particle friction angles studied here. However sig-ificant increase can be expected for higher values of �p as stated
n Park and Song (2009).
. Large-scale discontinuities
Bandis et al. (1981) identified two contributors to rock jointtrength: a basic frictional component (base friction) and a rough-ess component (Fig. 11).
Geometry (or morphology) of the discontinuity (shape of thesperities) and asperity failure (the strength of the asperities) arehe basis of the roughness component. When base friction appearso be scale-independent and can be estimated on laboratory-scalexperiments, the roughness component is highly scale-dependent.oughness decreases as scale increases (Bandis et al., 1981).umerous studies were carried out trying to quantify the scaleependence of joint strength from which empirical relations wereroposed (Barton and Bandis, 1982):
RCn = JRC0
(Ln
L0
)−0.02 JRC0(5)
CSn = JCS0
(Ln
L0
)−0.03 JRC0(6)
Because of the scale dependency observed in the mechanicalehavior of discontinuities, their properties should be assessed athe relevant scale. In a rock mass, the scale of the discontinuitiesanges from meters to hundreds of meters (and more). Labora-ory methods, where scale is usually restricted to meter and below,annot be directly extended for field estimates.
.1. Scale dependency of SRJ behavior
In this study, scale dependency of the model was investi-ated performing numerical shear tests on samples of variousizes. Two smaller scales were tested, 70 mm × 70 mm and6.7 mm × 46.7 mm, splitting the initial surface into respec-ively four and nine sub-surfaces which were imported into aonded-particle assembly. Same micro-properties and particle sizeistribution were used to represent the intact rock. Direct shearests under a constant normal stress of 1.5 MPa were performed onach of the four + nine newly created synthetic rock joints. Fig. 12hows peak shear stress (mean value and range of distribution) andeak dilation angle (mean value and range of distribution) versusample size for all the tests.
Peak shear strength and peak dilation decrease significantly for sample size increasing from 46.7 mm to 140 mm. Mean peak
hear stress dropped from 1.67 MPa to 1.37 MPa, corresponding to17.8% decrease. Peak dilation angle dropped from 25.4◦ to 19.9◦,orresponding to a 21.8% decrease. Variability in peak and dilationngles is reduced as sample size increases. Combining the empirical
ptTs
n
ombined empirical relations (Eqs. (3)–(6)) (after Barton and Choubey, 1977; Bartonnd Bandis, 1982).
elations Eqs. (3)–(6), predictions on the scale dependency of peakriction angle and peak dilation angle are shown in Fig. 12. The SRJxhibits a scale dependency of its mechanical properties in goodgreement with predictions based on empirical relations. However,eak dilation angles of the SRJ appear slightly lower than thoseredicted with Barton and Bandis’ relations.
.2. Effect of particle size
With the development of laser measurement systems and 3D
hotogrammetry techniques, practitioners can now have access toopological descriptions of large discontinuities (meter and above).hese large-scale morphologies could be used to generate largeynthetic rock joints. Estimates of their shear strengths could hence
C. Lambert, C. Coll / Journal of Rock Mechanics an
Fp
bwcDlfi(fvsau
vsostrvibitoia
4
ttn“cBcYto
lmapmpilitso
sHjtc
5
psljataocbpr
aTjcassu
abcspcgwmt
spuof
ig. 13. Evolution of peak shear stress �p and peak dilation angle peak with averagearticle diameter. 70 mm × 70 mm sample and �n = 1.5 MPa.
e derived without the need for any empirical relations. Howeverith the current computer limitations, a limited number of parti-
les can be used, and testing these large-scale discontinuities withEM would require the use of larger particles. As particles become
arger than the smallest asperities, surface roughness can be arti-cially reduced. Direct shear tests under constant normal stress1.5 MPa) were performed on 70 mm × 70 mm samples using dif-erent particle size distributions, with an average diameter in theicinity of the interface ranging from 1.29 mm to 2.56 mm. Thehape of the particle size distribution (ratio between minimumnd maximum radius of 1.66) and micro-properties were keptnchanged.
Fig. 13 shows the peak shear stress and the peak dilation angleersus the average particle diameter. Dilation is reduced as particleize increases which tends to confirm that the surface roughnessf the joint is reduced as particles becomes larger. The horizontalpacing between two grid points of the surface is 1.4 mm whereashe lowest average diameter used for these simulations is 1.29 mm,esulting in approximately one particle per interval. No asymptoticalue appears when decreasing the particle diameter, thus suggest-ng that a minimum of two (or more) particles per interval shoulde introduced to capture the full roughness of the surface. Interest-
ngly, shear strength exhibits no such trend. In comparison, shearest simulations by Park and Song (2009) show no conclusive effectn peak friction angle and peak dilation angle. A full understand-ng of the effect of particle size with the SJM requires additionalnalyses.
.3. Significance for large discontinuities
The surface shape or topology of a discontinuity is seen athe micro-scale level as a series of asperities and results fromwo different components of surface texture, roughness and wavi-ess (Belem et al., 2009). The roughness component is termedsecondary” or second order surface roughness, and the wavinessomponent is termed “primary” or first order surface roughness.oth orders of asperities have to be taken into consideration when
onsidering joint roughness and thus joint strength (Plesha, 1987;ang et al., 2001; Haneberg et al., 2007). The second order asperi-ies exhibit high angles and narrow base lengths (or wave length) inpposition to the first order asperities that have lower angles andeipa
d Geotechnical Engineering 6 (2014) 1–12 11
onger base lengths. The behavior of rock joints is controlled pri-arily by the second order asperities during small displacements,
nd first order asperities govern the shearing behavior for large dis-lacements. Barton and Choubey (1977) first stated that at low nor-al stress levels, the second order asperity controls the shearing
rocess. With increasing normal stress, the second order asperitys sheared off and the first order asperity takes over as the control-ing factor. Fardin et al. (2001) suggested that a resolution of 0.2 mmn the roughness measurement was required to correctly capturehe second order asperities whereas a resolution of 20 mm seemsufficient to capture the first order asperities. Yang et al. (2001)btained similar conclusions using analytical decompositions.
With the current computer capacities, capturing the effect of theecond order asperities for large joints is currently not achievable.owever, the first order asperities could be accurately described for
oint surfaces of 1 m2 and above. Strength characterizations wouldhen be restrained to situations where primary asperities are theontrolling factor.
. Conclusions
In this paper, a new DEM representation of rock joints wasresented. Numerical joints were generated combining a real 3Durface morphology and the smooth-joint contact model. Particlesying on opposite side of the joint surface were assigned a smooth-oint contact. At macro-scale level, the behavior of a natural joint is
combination of surface roughness, intact rock properties and fric-ional contact behavior. The behavior of the synthetic rock joint isn emergent property of the surface morphology, micro-propertiesf the particle assembly and micro-properties of the smooth-jointontact model. The surface morphology introduced was measuredy Grasselli (2001) using a laser scanner. Micro-properties of thearticle assembly were calibrated on the basis of measured intactock properties (UCS, Young’s modulus).
Direct shear tests under constant normal stress were simulatednd the mechanical response of the discrete model was analyzed.he shear behavior was compared to the expected behavior of aoint with the same morphology, the latter being assessed withonventional JRC based estimation methods. A relatively goodgreement could be established. The effect of roughness was con-istently captured throughout the simulations, for various normaltresses, though the model appears to slightly overestimate dilationnder high normal stresses.
Surface morphology was responsible for surface roughnessnd micro-properties of the particle assembly defined intact rockehavior; sensitivity analyses were presented to assist with thealibration of the smooth-joint micro-properties. As expected, themooth-joint friction angle exhibited a direct influence only oneak friction angle and residual friction angle only and should bealibrated according to base friction angle. Dilation was an emer-ent property of the surface roughness only whereas apertureas influenced by the normal stiffness of the smooth joint. Theacroscopic shear stiffness was related to the shear stiffness of
he smooth joint.The main benefit of this approach is the possibility to assess the
hear strength of a discontinuity on the basis of directly measurableroperties such as rock mechanical properties (UCS, Young’s mod-lus), planar surface friction and surface morphology. The modelffers the perspective of considering the 3D effect of roughnessor strength assessment. Such approach could provide a means of
stablishing a constitutive behavior that is not reliant on any empir-cal formulation or classification scheme and defining strengtharameters for rock joints that can be used in more conventionalnalyses.
1 ics an
C
a
A
tnpW
R
B
B
B
B
B
B
C
C
D
D
F
F
G
G
G
G
G
H
H
H
I
K
K
L
L
L
L
L
M
P
P
P
P
P
P
R
S
T
Y
Y
Z
Z
the Division Exploration and Mining at the Common-wealth Scientific and Industrial Research Organisation(CSIRO) as a postdoctoral fellow. He joined the Univer-sity of Canterbury in 2010 as a lecturer in geotechnicalengineering and rock mechanics.
2 C. Lambert, C. Coll / Journal of Rock Mechan
onflict of interest
We wish to confirm that there are no known conflicts of interestssociated with this publication.
cknowledgements
The authors would like to thank Itasca Consulting Group Inc. forheir technical advice and Dr. Giovanni Grasselli for providing theatural morphology of a discontinuity in granite whose work waserformed with funding provided by the Swiss Federal Office forater and Geology.
eferences
andis S, Lumsden A, Barton N. Experimental study of scale effects on the shearbehavior of rock joints. International Journal of Rock Mechanics and MiningSciences & Geomechanics Abstracts 1981;18(1):1–21.
arton N, Choubey V. The shear strength of rock joints in theory and practice. RockMechanics 1977;10(1–2):1–54.
arton N. Review of a new shear strength criterion for rock joints. EngineeringGeology 1973;7(4):287–332.
arton N, Bandis SC. Effect of block size on the shear behavior of jointed rocks. In: The23rd US Symposium on Rock Mechanics. Berkeley: American Rock MechanicsAssociation; 1982. p. 732–60.
elem T, Souley M, Homand F. Method for quantification of wear of sheared jointwalls based on surface morphology. Rock Mechanics and Rock Engineering2009;42(6):883–910.
uzzi O, Hans J, Boulon M, Deleruyelle F, Besnus F. Hydromechanical study ofrock-mortar interfaces. Physics and Chemistry of the Earth 2008;32(8–14):820–31.
arr JR, Warriner JB. Relationship between the fractal dimension and jointroughness coefficient. Bulletin of the Association of Engineering Geologists1989;26(2):253–63.
undall P. Numerical experiments on rough joints in shear using a bonded parti-cle model. In: Lehner FK, Urai JL, editors. Aspects of Tectonic Faulting. Berlin:Springer-Verlag; 2000. p. 1–9.
eisman N, Ivars MD, Darcel C, Chalaturnyk RJ. Empirical and numerical approachesfor geomechanical characterization of coal seam reservoirs. International Jour-nal of Coal Geology 2010;82(3–4):204–12.
ershowitz W. Interpretation and synthesis of discrete fracture orientation, size,shape, spatial structure and hydrologic data by forward modeling. In: CookNGW, Goodman RE, Myer LR, Tsang CF, editors. Fractured and Jointed RockMasses. Netherlands: A.A. Balkema; 1995. p. 579–86.
ardin N, Stephansson O, Jing L. The scale dependence of rock joint sur-face roughness. International Journal of Rock Mechanics & Mining Sciences2001;38(5):659–69.
ardin N, Feng Q, Stephansson O. Application of a new in situ 3D laser scanner tostudy the scale effect on the rock joint surface roughness. International Journalof Rock Mechanics & Mining Sciences 2004;41(2):329–35.
entier S, Riss J, Archambault G, Flamand R, Hopkins D. Influence of fracture geom-etry on shear behavior. International Journal of Rock Mechanics & MiningSciences 2000;37(1–2):161–74.
iacomini A, Buzzi O, Krabbenhoft K. Modelling the asperity degradation of shearrock joint using FEM. In: The 8th World Congress on Computational Mechanics(WCCM8) and the 5th European Congress on Computational Methods in AppliedSciences and Engineering (ECCOMAS 2008); 2008.
rasselli G. Shear strength of rock joints based on quantified surface descrip-tion. PhD thesis. Switzerland: Ecole Polytechnique Federale de Lausanne;2001.
rasselli G, Wirth J, Egger P. Quantitative three-dimensional description of a roughsurface and parameter evolution with shearing. International Journal of RockMechanics & Mining Sciences 2002;39(6):789–800.
rasselli G, Egger P. Constitutive law for the shear strength of rock joints based onthree-dimensional surface parameters. International Journal of Rock Mechanics& Mining Sciences 2003;40(1):25–40.
aneberg WC. Directional roughness profiles from three-dimensional photogram-metric or laser scanner cloud points. In: Rock Mechanics: Meeting Society’s
Challenges and Demands, Proceedings of the 1st Canada-US Rock MechanicsSymposium. Vancouver, Canada: Taylor & Francis; 2007. p. 101–6.ans J, Boulon M. A new device for investigating the hydromecanical propertiesof rock joints. International Journal for Numerical and Analytical Methods inGeomechanics 2003;27(6):513–48.
d Geotechnical Engineering 6 (2014) 1–12
utson R, Dowding C. Joint asperity degradation during cyclic shear. InternationalJournal of Rock Mechanics and Mining Sciences & Geomechanics Abstracts1990;27(2):109–19.
tasca Consulting Group Inc. . Particle flow code in 3 dimensions version 4.0: Usermanual. Minneapolis, MN: Itasca Consulting Group Inc; 2008.
arami A, Stead D. Asperity degradation and damage in the direct shear test: a hybridFEM/DEM approach. Rock Mechanics and Rock Engineering 2008;42(2):229–66.
ulatilake P, Malama B, Wang J. Physical and particle flow modeling of jointed rockblock behavior under uniaxial loading. International Journal of Rock Mechanics& Mining Sciences 2001;38(5):641–57.
ambert C, Darve F, Nicot F. Rock slope stability from microscale to macroscalelevel. In: Pietruszczak P, editor. Numerical Models in Geomechanics. Ottawa:A.A. Balkema; 2004. p. 115–20.
ambert C. Variability and uncertainty on rock mass strength via a synthetic rockmass approach. In: 1st Southern Hemisphere International Rock MechanicsSymposium. Perth, Australia: Australian Centre for Geomechanics; 2008. p.355–66.
ambert C, Coll C. Santiago A DEM approach to rock joint strength estimates Santi-ago. In: Rock Slope Stability in Open Pit Mining and Civil Engineering; 2009.
ambert C, Buzzi O, Giacomini A. Influence of calcium leaching on the mechanicalbehavior of a rock mortar interface: a DEM analysis. Computers and Geotechnics2010;37(3):258–66.
ee H, Park Y, Cho T, You K. Influence of asperity degradation on the mechanicalbehavior of rough rock joints under cyclic shear loading. International Journalof Rock Mechanics & Mining Sciences 2001;38(7):967–80.
isra A. Effect of asperity damage on shear behavior of single fracture. EngineeringFracture Mechanics 2002;69(17):1997–2014.
ark JW, Song JJ. Numerical simulation of a direct shear test on a rock joint usinga bonded-particle model. International Journal of Rock Mechanics & MiningSciences 2009;46(8):1315–28.
atton FD. Multiple modes of shear failure in rock. In: Proc. 1st Int. Cong. Rock Mech.Lisbon: International Society for Rock Mechanics; 1966. p. 509–13.
ierce M, Cundall P, Potyondy D, Ivars MD. A synthetic rock mass model forjointed rock. In: Rock Mechanics: Meeting Society’s Challenges and Demands,Proceedings of the 1st Canada-US Rock Mechanics Symposium. Vancouver,Canada: Taylor & Francis; 2007. p. 341–9.
ine R, Owen D, Coggan J, Rance J. A new discrete fracture modelling approach forrock masses. Geotechnique 2007;57(9):757–66.
lesha M. Constitutive models for rock discontinuities with dilatancy and surfacedegradation. International Journal for Numerical and Analytical Methods inGeomechanics 1987;11(4):345–62.
otyondy DO, Cundall PA. A bonded-particle model for rock. International Journalof Rock Mechanics & Mining Sciences 2004;41(8):1329–64.
ogers S, Kennard D, Dershowitz W, van As A. Characterising the in situ fragmen-tation of a fractured rock mass using a discrete fracture network approach. In:Rock Mechanics: Meeting Society’s Challenges and Demands, Proceedings ofthe 1st Canada-US Rock Mechanics Symposium. Vancouver, Canada: Taylor &Francis; 2007. p. 137–43.
aeb S, Amadei B. Modelling rock joints under shear and normal loading. Interna-tional Journal of Rock Mechanics & Mining Sciences 1992;29(3):267–78.
se R, Cruden C. Estimating joint roughness coefficients. International Jour-nal of Rock Mechanics and Mining Sciences & Geomechanics Abstracts1979;16(5):303–7.
ang ZY, Di CC, Yen KC. The effect of asperity order on the roughness of rock joints.International Journal of Rock Mechanics & Mining Sciences 2001;38(5):745–52.
u X, Vayssade B. Joint profiles and their roughness parameters. InternationalJournal of Rock Mechanics and Mining Sciences & Geomechanics Abstracts1991;28(4):333–6.
hao Z, Jing L, Neretnieks I. Particle mechanics model for the effects of shear onsolute retardation coefficient in rock fractures. International Journal of RockMechanics & Mining Sciences 2012;52:92–102.
hao Z. Gouge particle evolution in a rock fracture undergoing shear: a microscopicDEM study. Rock Mechanics and Rock Engineering 2013;46(6):1461–79.
C. Lambert received his ME in Hydraulic Engineering(2000) and PhD in Geomechanics (2005) from InstitutNational Polytechnique de Grenoble. In 2006, he joined