journal of sciences heavy metals (cd, cu, fe, mn and zn ... · ... mn and zn,) assessment of ......
TRANSCRIPT

International Journal of Science and Technology Volume 4 No. 2, February, 2015
IJST © 2015– IJST Publications UK. All rights reserved. 49
Heavy Metals (Cd, Cu, Fe, Mn and Zn,) Assessment of Groundwater, In
Kaltungo LGA, Gombe State, Nigeria
Casimir E. Gimba, George I. Ndukwe, Elaoyi D. Paul, James D. Habila, Lamis A. Madaki
Department of Chemistry, Ahmadu Bello University Zaria, Nigeria.
ABSTRACT
The groundwater quality was determined in the district of Kaltungo Local Government Area of Gombe State, Nigeria. Groundwater
samples were collected in April 2012 (dry season), water samples from twenty five hand-dug wells, fifteen bore holes in the district and
two away from the district in Biliri which served as the control were analyzed using the Atomic Absorption Spectrophotometer after
digestion to assess the suitability of the water for human consumption and domestication purposes. The selected heavy metals cadmium,
copper, iron, manganese and zinc which may be toxic in excess when present in drinking water were determined. The results obtained for
the heavy metals concentrations range from Copper (0.03-0.60 mg/L), iron (0.395-22.90 mg/L), zinc (0.073-1.670 mg/L), manganese
(0.046-1.85 mg/L) and cadmium (0.009-0.446 mg/L). Cadmium, manganese, and iron in most samples exceeded the World Health
Organization (WHO) and Standard Organization of Nigeria (SON) standard guideline for potable water usage. The result reflects high
pollution of groundwater with heavy metals. Analyses of variance (ANOVA) and Pearson correlation analysis were used to describe the
data.
Keywords: Heavy metals, Boreholes, hand-dug well, WHO and AAS
1. INTRODUCTION
Groundwater is considered among the healthiest source of
drinking water, but domestic, agricultural and industrial
activities have led to the degradation of groundwater quality in
different parts of the world. Groundwater contamination is
responsible for water related and water borne diseases in
developing countries like Nigeria, evaluation of groundwater
quality for human consumption is essential to human existence.
The source of ground water contamination could be natural
through ground water-rock interaction or through anthropogenic
which involve human activities that can affect groundwater
quality. Groundwater pollution which is man-made is worse than
natural pollution as it eventually renders water unsuitable for use
than its original state (Abimbola et al., 2005).The provision of
good quality water is needed as an urgent step that will ensure
groundwater quality, protection and conservation. Ground water
is an important source of drinking water for humankind, it
contains over 90% of the fresh water resources and it is an
important reserve of good quality water. Groundwater, like any
other water resource, is not just of public health and economic
value (Armon et al., 1994). The water pollution by heavy metals
has become a question of considerable public and scientific
concern in the light of the evidence of their toxicity to human
health and biological systems (Anazawa et al., 2004). Heavy
metals receive particular concern considering their strong
toxicity even at low concentrations (Marcovecchio et al., 2007).
They exist in water in colloidal, particulate and dissolved phases
(Adepoju - Bello et al., 2009) with their occurrence in water
bodies being either of natural origin (e.g. eroded minerals within
sediments, leaching of ore deposits and volcanism extruded
products) or of anthropogenic origin (i.e. solid waste disposal,
industrial or domestic effluents) (Marcovecchio et al., 2007).
Some of the metals are essential to sustain life calcium,
magnesium, potassium and sodium must be present for normal
body functions. Also, cobalt, copper, iron, manganese,
molybdenum and zinc are needed at low levels as catalyst for
enzyme activities (Adepoju-Bello et al., 2009).
2. DESCRIPTION OF THE STUDY AREA
Gombe state occupies part of the central position of North-
eastern part of Nigeria (with Gombe town as its capital) and
shares common borders with Bauchi, Borno, Yobe, Adamawa
and Taraba States. The study area which is Kaltungo LGA in
Gombe state is located between latitude 9048’00N to 9050’38N
and longitudes 11016’00E to 11019’45’E It is accessible through
the Bauchi-Gombe-Kaltungo and the Numan-Cham-Kaltungo
Federal Highway. The study area forms part of the Gongola arm
of the Benue Trough. The area has a mean maximum temperature
of 310C and average annual rainfall of 1550.7mm.
The area is characterized by moderate to high relief which stands
out within the general elevation, among which is the famous
Tangale peak (Carter et al., 1963). The topography of the area
rises from 402 meters to 702 meters above mean sea level. The
area is drained by the River Kaltungo which flows from the north
east towards the southwest. The population of the area is about
183,000 (NPC, 2006), and the people are predominately farmers,
and also rear cattle. The major sources of water supply in the area
are surface waters including Rivers, streams ponds and ground

International Journal of Science and Technology (IJST) – Volume 4 No. 2, February, 2015
IJST © 2015– IJST Publications UK. All rights reserved. 50
water which is obtained from hand dug wells and boreholes.
Most residents in the area use pit latrines and waste disposal is
indiscriminately carried out. These practices could be
responsible for degradation of ground water quality, and thus
renders its unsuitable for human consumption.
Table 1 Sampling Locations and Coordinates for Sampling Sites 1 and 2
S/NO Groundwater
type
Site 1 Coordinates Groundwater
type
Site 2 Coordinates
1 BH GSSS
Lakanje
9048’05.0”N
11019’02.4”E HW Termana
9049’07.4”N
11018’24.5”E
2 HW Aya
extension
9048’01.3”N
11018’49.3”E BH Termana
9048’52.2”N
11018’20.5”E
3 HW Aya 9047’46.2”N
11018’41.9”E HW Sabon Layi
9049’00.3”N
11018’44.7”E
4 HW Okra 9047’59.2”N
11018’50.6”E BH Sabon Layi P.
9049’01.2”N
11018’43.7”E
5 BH Poshereng 9047’33.5”N
11018’36.2”E BH Lapan dintai
9048’56.9”N
11018’50.1”E
6 HW Poshereng
Ka'awe
9047’27.6”N
11018’30.5”E HW Baganje
9049’20.4”N
11018’29.1”E
7 HW Kalaring 9048’35.2”N
11018’49.3”E BH Baganje 2
9049’23.6”N
11018’36.7”E
8 HW Kalaring 2 9043’36.1”N
11018’43.5”E BH Kasar Waje
9048’58.3”N
11018’59.8”E
9 BH Kalaring
Maternity
9048’34.8”N
11018’40.9”E HW Tasha
9049’31.5”N
11018’41.1”E
10 HW Kasuwa 9048’55.3”N
11018’29.7”E HW Sabon Layi 2
9049’05.2”N
11018’41.1”E
Table 2 Sampling Locations and Coordinates for Sampling sites 3, 4 and Control
S/NO Groundwater
type
Sites 3 Coordinates Groundwater
type
Sites 4 Coordinates
1 BH Jewel Hotel 9049’34.6”N
11018’19.2”E BH
GGASS
KTL
9049’39.0”N
11019’04.6”E
2 HW First Bank 9049’35.9”N
11018’48.1”E
HW Poam dindin 9049’05.4”N
11018’25.0”E
3 HW Millionaire
QRTS
9049’55.4”N
11018’43.1”E BH
Poam
dindin 2
9049’05.8”N
11018’26.6”E
4 HW Millionaire
QRTS
9049’55.9”N
11018’36.1”E HW
Lambu
Area
9049’01.5”N
11018’27.7”E
5 BH Millionaire
QRTS
9049’42.8”N
11018’39.6”E BH
Lambu
Area
9049’04.5”N
11018’29.0”E
6 HW Ladur 9049’40.8”N
11018’10.5”E HW
L.D
Crawford
9049’38.7”N
11018’48.5”E
7 HW Kalargu 9049’33.9”N
11017’51.3”E BH
Ture
Ballam
9049’14.3”N
11022’44.9”E

International Journal of Science and Technology (IJST) – Volume 4 No. 2, February, 2015
IJST © 2015– IJST Publications UK. All rights reserved. 51
8 HW Kangkubo 9049’26.7”N
11018’12.6”E BH
Ture
Mai
9049’48.4”N
11022’30.9”E
9 HW Ladur 2 9049’46.7”N
11018’01.8”E BH
Ture
Pandi
9049’46.5”N
110’21'48.8”E
9049’50.4”N
11018’46.1”E 10
HW Kalargu
9049’46.7”N
11018’01.8”E HW
M.Qrts
Extension
11 *HW Biliri 1 9053'49.8"N
11013'10.8"E *HW Biliri 2
9053'27.5"N
11013'15.2"E
Key: * Control Sites
International Journal of Science and Technology (IJST) – Volume 4 No. 2, February, 2015
IJST © 2015– IJST Publications UK. All rights reserved. 52
3. MATERIALS AND METHODS
Water sampling techniques and preservation
Groundwater samples were collected in April, 2013, according
to standard procedures by (APHA, 1998) from four quaternary
sections. Ten Samples each were collected from different
boreholes and hand-dug wells from each quaternary section; two
samples were also collected from hand-dug wells in Biliri LGA
which served as control. This gave a total of forty two samples,
twenty five water samples from hand-dug wells, fifteen water
samples from boreholes all within Kaltungo and two from Biliri
in Gombe State, Nigeria. The samples were collected in
pre-cleaned 1 litre polyethylene plastic bottle and acidified with
Analar grade concentrated nitric acid to < pH 2.0 and
respectively labeled. Groundwater samples were obtained
directly from the water pump after allowing the water to run for
at least five minutes and each sample bottle and its cap rinsed
three times with the water sample. These samples were
subsequently stored at 4°C for as short a time as possible before
analysis to minimize physicochemical changes (Anonymous,
1996).
Parameters with extremely low stability such as pH, electrical
conductivity, and temperature, were measured on the field using
field kit. Thereafter the samples were transported to the
laboratory for further analysis of other parameters.
DIGESTION OF WATER SAMPLES
100 ml of well mixed acid preserved water sample was
transferred into a beaker and 5 ml of concentrated nitric acid was
added. The beaker was placed on a heater and allowed to
evaporate to about 5 ml without boiling. This took about 35 min,
diluted to 100 ml in a volumetric flask and was ready for analysis.
These procedures were adopted for all water samples (Nouri et
al., 2006). Thereafter, metals of interest (Cd, Cu, Fe, Mn and Zn)
were assayed using Varian AA240FS Atomic Absorption
Spectrophotometer.
Reagent and instrumentation
All reagents used were of analytical grade. Thermometer, pH
meter; Varian AA240FS Atomic Absorption Spectrophotometer
was used respectively for the sample analysis.
4. RESULTS AND DISCUSSIONS
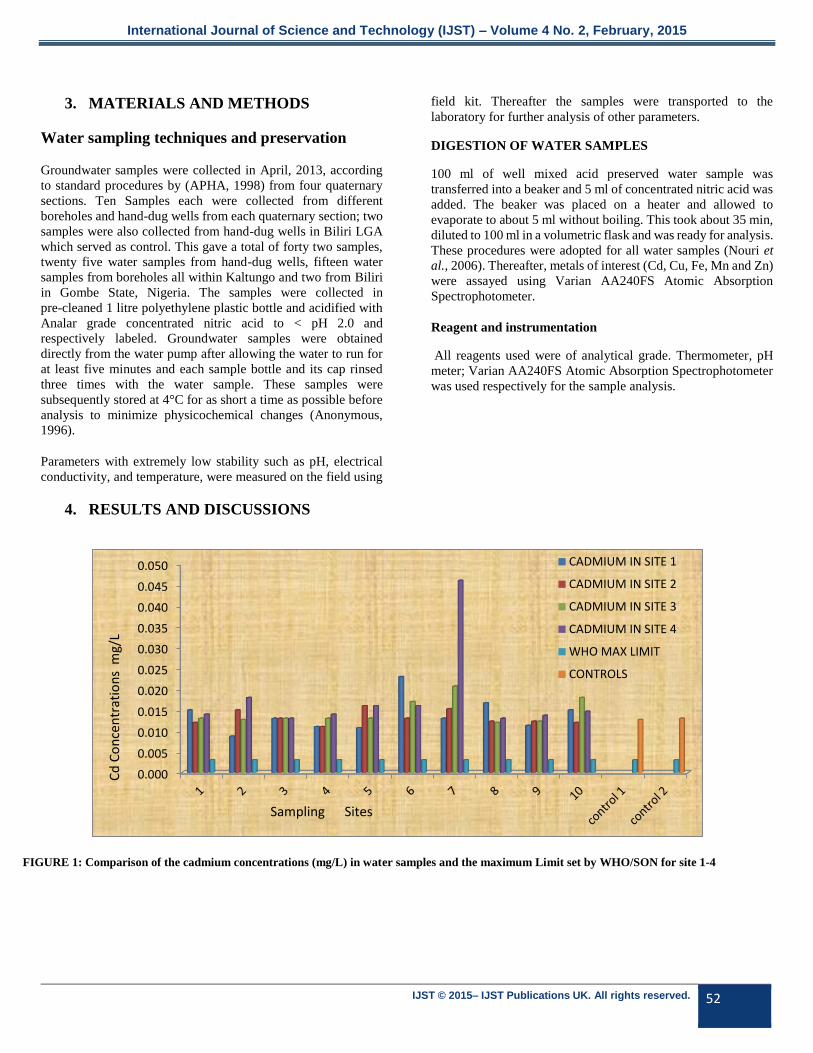
FIGURE 1: Comparison of the cadmium concentrations (mg/L) in water samples and the maximum Limit set by WHO/SON for site 1-4
0.000
0.005
0.010
0.015
0.020
0.025
0.030
0.035
0.040
0.045
0.050 CADMIUM IN SITE 1
CADMIUM IN SITE 2
CADMIUM IN SITE 3
CADMIUM IN SITE 4
WHO MAX LIMIT
CONTROLS
Sampling Sites
Cd
Co
nce
ntr
atio
ns
mg/
L
International Journal of Science and Technology (IJST) – Volume 4 No. 2, February, 2015
IJST © 2015– IJST Publications UK. All rights reserved. 53
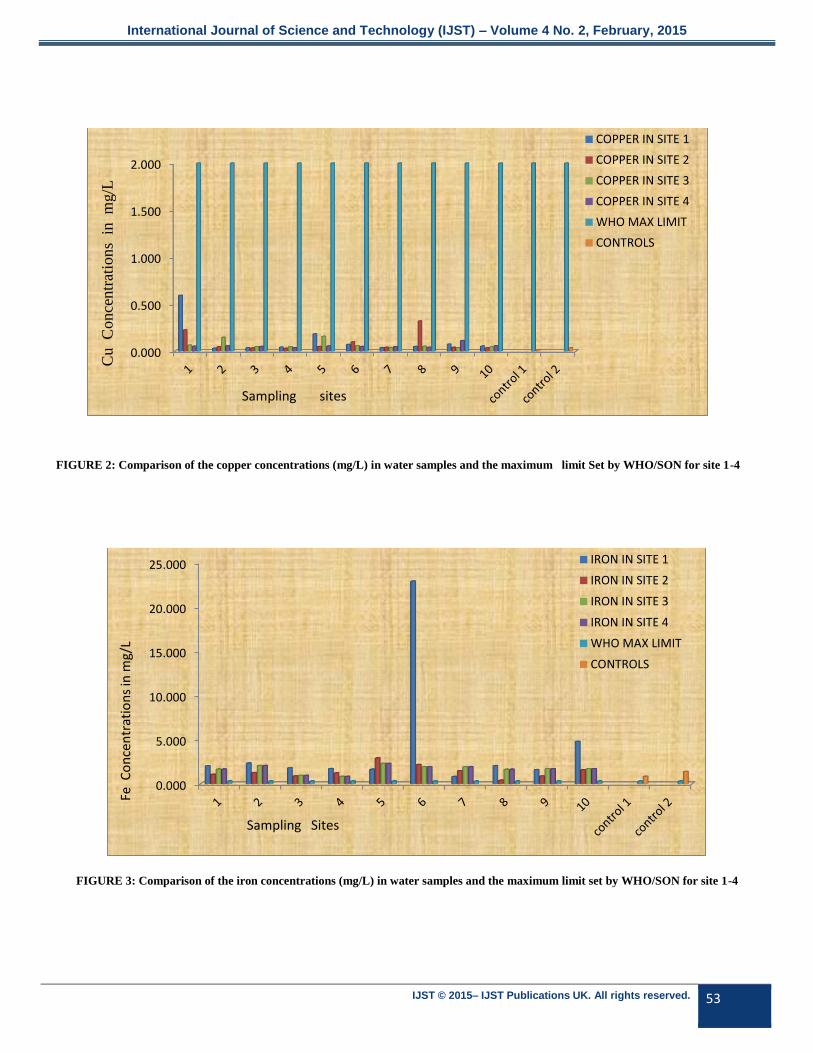
FIGURE 2: Comparison of the copper concentrations (mg/L) in water samples and the maximum limit Set by WHO/SON for site 1-4
FIGURE 3: Comparison of the iron concentrations (mg/L) in water samples and the maximum limit set by WHO/SON for site 1-4
0.000
0.500
1.000
1.500
2.000
COPPER IN SITE 1
COPPER IN SITE 2
COPPER IN SITE 3
COPPER IN SITE 4
WHO MAX LIMIT
CONTROLS
Sampling sites
Cu C
on
centr
atio
ns
in
m
g/L
0.000
5.000
10.000
15.000
20.000
25.000 IRON IN SITE 1
IRON IN SITE 2
IRON IN SITE 3
IRON IN SITE 4
WHO MAX LIMIT
CONTROLS
Sampling Sites
Fe C
on
cen
trat
ion
s in
mg/
L

International Journal of Science and Technology (IJST) – Volume 4 No. 2, February, 2015
IJST © 2015– IJST Publications UK. All rights reserved. 54
FIGURE 4: Comparison the manganese concentrations (mg/L) in water samples and the maximum limit set by WHO/SON for site 1-4
FIGURE 5: Comparison of the zinc concentrations (mg/L) in water samples and the maximum limit set by WHO/SON for site 1-4
0.000
0.200
0.400
0.600
0.800
1.000
1.200
1.400
1.600
1.800
2.000
1 2 3 4 5 6 7 8 9 10 control1
control2
MANGANESE IN SITE 1
MANGANESE IN SITE 2
MANGANESE IN SITE 3
MANGANESE IN SITE 4
WHO MAX LIMIT
CONTROLS
Sampling Sites
Mn
Co
nce
ntr
atio
ns
in m
g/L
0.000
0.500
1.000
1.500
2.000
2.500
3.000
3.500
4.000 ZINC IN SITE 1
ZINC IN SITE 2
ZINC IN SITE 3
ZINC IN SITE 4
WHO MAX LIMIT
CONTROLS
Sampling Sites
Zn C
on
cen
trat
ion
s in
mg/
L

International Journal of Science and Technology (IJST) – Volume 4 No. 2, February, 2015
IJST © 2015– IJST Publications UK. All rights reserved. 55
Table 1: Correlation matrix of the metal ions variables in water (hand dug wells and boreholes)
Cadmium Copper Manganese Iron Zinc
Cadmium 1.000
Copper -0.055 1.000
Manganese -0.077 0.108 1.000
Iron 0.004 -0.002 0.005 1.000
Zinc 0.085 0.196* -0.082 0.137 1.000
*. Correlation is significant at the 0.05 level (2-tailed).
5. DISCUSSIONS
The results obtained for the concentrations of metals ions (Cd
Cu, Mn Fe, and Zn) in the water samples collected from different
hand-dug wells and boreholes, was compared with the
WHO/SON maximum permissible limit. The results are
presented as a bar chart above.
CADMIUM: The minimum and maximum concentrations of
cadmium metal ions obtained from the hand-dug wells and
borehole water samples at the four different sampling sites in
Kaltungo as shown in fig (1) range from 0.009 mg/L in the
sample from Aya extension and 0.446 mg/L in the sample from
Ture ballam. The maximum tolerance limit by WHO is (0.003
mg/L). Cadmium metal ion in all the samples including the two
controls collected from Biliri LGA were observed to be above
the maximum permissible limit set by the world health
organization.(WHO) /SON for drinking water.
COPPER: The minimum and maximum concentrations of
copper obtained from the hand-dug wells and borehole water
samples at the four different sampling sites in Kaltungo as shown
in fig (4), range from 0.031 mg/L in the sample from Aya
extension, sabon Layi, poam dindin and 0.596 mg/L in the
sample from GSSS Lakanje. The maximum permissible limit by
WHO is (2.0 mg/L). All the samples including the two controls
collected from Biliri LGA were observed to be below the
maximum permissible limit set by the world health organization.
(WHO)/ SON for drinking water. Copper is an essential nutrient,
but at high doses it has been shown to cause stomach and
intestinal distress, liver, kidney damage, and anemia (US EPA,
2003)
IRON: Most groundwater contains some iron because it is
common in many aquifers and it is found in trace amounts in
practically all sediments and rock formations. The minimum and
maximum concentrations of iron obtained from the hand-dug
wells and borehole waters at the four different sampling sites in
Kaltungo as shown in fig (3) range from 0.395 mg/L in the
sample from (Kasar Waje) and 22.912 mg/L in the sample from
Poshereng Ka’awe. The maximum permissible limit by
WHO/SON is 0.3mg/L for iron, all samples including the two
controls collected from Biliri LGA were observed to be above
the maximum permissible limit set by the world health
organization.(WHO) for drinking water. This indicates that the
local mineral deposit in the studied area may have high levels of
iron.
ZINC: Zinc imparts an undesirable astringent taste to water at a
taste threshold concentration of about 4mg/L (as zinc sulfate).
The minimum and maximum level of zinc metal ion obtained
from the hand-dug wells and boreholes water samples at the four
different sampling sites in Kaltungo as shown in Fig (5) range
from 0.073 mg/L in the sample from Lambu Area and 1.672
mg/L in the sample from Lambu Area two. The maximum
permissible limit by WHO/SON is (4.0 mg/L), for zinc metal
ions all samples including the two controls collected from Biliri
LGA were observed to be below the maximum permissible limit.
MANGANESE: The minimum and maximum concentration of
Manganese metal ions obtained from the hand-dug wells and
borehole waters at the four different sampling sites in Kaltungo
as shown in fig (4), range from 0.046 mg/L in sample from
Termana well and 1.850 mg/L in the sample from Sabon Layi
Poam dindin. The maximum permissible limit by WHO/SON is
0.1mg/L, for manganese metal ions all samples excluding those
from (Termana HW, Biliri control 1 and Baganje borehole) were
observed to be above the maximum permissible limit set by the
world health organization.(WHO) for drinking water.
6. CONCLUSION
The results of the above work showed that copper and zinc were
within the acceptable limits respectively for the heavy metals
measured. However, cadmium, manganese and iron were mostly

International Journal of Science and Technology (IJST) – Volume 4 No. 2, February, 2015
IJST © 2015– IJST Publications UK. All rights reserved. 56
found to exceed the maximum permissible limit as recommended
by WHO/SON at some study sites. Dissolution of rock minerals
with the groundwater is a possible reason for pollution. All the
above results confirmed the high pollution of ground water
sources and hence, they are not suitable for consumption without
any prior treatment.
REFERENCES
Abimbola, A. F., Laniyan, T. A., Okunola, O.W., and Odewande.
(2005).Water quality test surrounding selected refuse dumps in
Ibadan, southwestern Nigeria. WATER RESOURCESs-Journal of
Nigerian Association of Hydro geologists (NAH) Volume 16, pp 39-
48
Adepoju-Bello, A. A., Ojomolade O. O., Ayoola G. A., and Coker H.
A. B (2009). Quantitative analysis of some toxic metals in domestic
water obtained from Lagos metropolis. The Nig. J. Pharm.; 42 (1):57-
60
Anazawa, K., Kaido, Y., Shinomura, Y., Tomiyasu, T., and
Sakamoto, H. (2004). Heavy-metal distribution in River waters and
sediments around a “Fireflyillage´e, Shikoku, Japan: Application of
multivariate analysis. Analytical Sciences; 20:79-84
APHA. (1998) Standard Method for the examination of Water and
Wastewater 18th edition, American Public Health Association,
Washington, DC pp45-60.
Armon, R., and Kitty, B. (1994). The Health Dimension of
Groundwater Contamination. In: Groundwater Contamination and
Control, Holler (Ed.). Marcel Dekker, Inc., New York, USA
Carter, J.D., Barber, W., and Tait, E.A. (1963).The Geology of parts
of Adamawa, Bauchi and Borno Provinces in Northeastern Nigeria.
Geol. Surv. of Nig. Bull. No. 30,
Ezeribe, A. I., Oshieke, K. C., and Jauro, A., (2012). Physico-
chemical properties of well water samples from some villages in
Nigeria with cases of stained and mottle teeth. Science World Journal
Vol 7 (No 1)
Marcovecchio J. E., Botte S. E. and Freije R. H. (2007). Heavy
Metals, Major Metals, Trace Elements. In: Handbook of Water
Analysis. L.M. Nollet, (Ed.). 2nd Edn. London: CRC Press; pp. 275-
311.
National Population Commission (NPC). (2006). Population of the
Federal Republic of Nigeria Gombe State Statistical table. National
population commission final results of population census of Nigeria
Nouri . J., Mahvi A. H., Babaei A. A., Jahed G. R., Ahmadpour E
(2006). Investigation of Heavy Metals in Ground water. Int. J. Phys.
Sci. 9 (3):377- 384.
Szpunar, S.M., and Burt, B.A. (1988) Dental caries, fluorosis, and
fluoride exposure in Michigan school children. Journal of Dental
research, v. 67, n. 5, p. 802-6.
WHO (2006). Guideline for Drinking Water quality (electronic
Resource). Incorporating first Addendum 1, Recommendations 3rd
retrieved June 4, 2008 from
hhttp://www.whglibdoc.who.int/publications/2006/9241546-
964.eng.pd