landscape patterns of ocelot–vehicle collision sites
TRANSCRIPT
RESEARCH ARTICLE
Landscape patterns of ocelot–vehicle collision sites
AnnMarie Blackburn . C. Jane Anderson . Amanda M. Veals .
Michael E. Tewes . David B. Wester . John H. Young Jr. . Randy W. DeYoung .
Humberto L. Perotto-Baldivieso
Received: 15 May 2020 / Accepted: 6 November 2020
� Springer Nature B.V. 2020
Abstract
Context Road networks can negatively impact wild-
life populations through habitat fragmentation,
decreased landscape connectivity, and wildlife-vehi-
cle collisions, thereby influencing the spatial ecology
and population dynamics of imperiled species. The
ocelot (Leopardus pardalis) is a federally endangered
wild felid in South Texas, with a high mortality rate
linked to vehicle collisions.
Objectives Using a multi-scale approach, we quan-
tified and examined landscape spatial structure at
ocelot roadkill locations, and between roadkill loca-
tions of male and female ocelots.
Methods We quantified the spatial distribution of
land cover types at 26 ocelot–vehicle collision sites in
South Texas that occurred from 1984–2017. We
compared landscape metrics of woody, herbaceous,
and bare ground cover types across multiple spatial
scales at roadkill locations to those from random road
locations, and between male and female ocelots.
Results Roadkill sites consisted of 13–20% more
woody cover than random locations.Woody patches at
roadkill sites were 7.1–11% larger (2.4 ha) closer to
roads and spaced 10–16 m closer together farther
away from roads compared to random locations.
Percent woody cover was the best indicator of
ocelot–vehicle collision sites; there were no differ-
ences in woody cover between male and female road
mortality locations.
Conclusion These findings suggest that ocelots are
likely struck by vehicles while crossing between
habitat patches. Roads that bisect areas of woody
cover have negative impacts on ocelots by increasing
habitat fragmentation and vulnerability to vehicle
collisions. Crossing structures should be placed in
areas with C 30% woody cover and 3.5 ha woody
patches.
Keywords Landscape ecology � Multi-scale spatial
analyses � Ocelot � Wildlife-vehicle collisions �Wildlife crossing structures
Introduction
Roads can negatively impact survival and movements
of wildlife, including reptiles and amphibians (Marsh
et al. 2005; Shephard et al. 2008), birds (Laurance
et al. 2005), and mammals (Oxley et al. 1974; Groot
Bruinderink and Hazebroek 1996). Negative impacts
A. Blackburn (&) � C. J. Anderson �A. M. Veals � M. E. Tewes � D. B. Wester �R. W. DeYoung � H. L. Perotto-BaldiviesoCaesar Kleberg Wildlife Research Institute, Texas A&M
University-Kingsville, 700 University Boulevard, MSC
218, Kingsville, TX 78363, USA
e-mail: [email protected]
J. H. Young Jr.
Environmental Affairs Division, Texas Department of
Transportation, 125 E. Street, Austin,
TX 78701, USA
123
Landscape Ecol
https://doi.org/10.1007/s10980-020-01153-y(0123456789().,-volV)( 0123456789().,-volV)
may be direct, due to vehicle collisions and physical
barriers to movement, or indirect, when roads act as
functional barriers reducing gene flow and reproduc-
tive success (Harris and Scheck 1991; Forman and
Alexander 1998; Smith and Dodd 2003; Riley 2006;
Litvaitis et al. 2015). Roads are often the principal
threat to successful dispersal of wildlife within urban
areas (Forman and Alexander 1998), and vehicle
collisions have become an increasing source of
wildlife mortality as transportation infrastructure
increases because of urban sprawl (Forman et al.
2003). Road mortality has been shown to impact
population demographics of species of conservation
concern (e.g., Kerley et al. 2002; Cypher et al. 2009),
and population sizes of threatened or endangered
species, including the Florida panther (Puma concolor
coryi) and Key deer (Odocoileus virginianus clavium)
(Evink et al. 1996; Land and Lotz 1996). Landscape
structure and habitat suitability are leading predictors
of vehicle collision locations for mammals, passeri-
nes, and herpetofauna worldwide (Carvalho and Mira
2011; Roger et al. 2012; Medinas et al. 2013).
Understanding the relationship between landscape
structure and wildlife-vehicle collisions is critical for
the conservation of populations that are negatively
affected by roadways.
Spatial structure of land cover types can dictate
animal space use, movement, and abundance (Thorn-
ton et al. 2011; Baigas et al. 2017; Marchand et al.
2017). For example, an evaluation of landscape spatial
structure is useful in the assessment of habitat
fragmentation for wild felids (Jackson et al. 2005;
Zemanova et al. 2017). However, the relationship
between landscape structure and road mortality pat-
terns remains largely unknown for many species,
particularly those threatened or endangered. Studies
suggest wildlife-vehicle collisions are often spatially
aggregated (Main and Allen 2002) and occur along
roadways near natural vegetation cover (Romin and
Bissonette 1996; Clevenger et al. 2003). Further, many
ecological patterns are influenced by elements acting
at multiple spatial scales (Wieins 1989; Bauder et al.
2018). The spatial scale at which a landscape feature
has the strongest effect on species response (e.g.,
movement, abundance) is termed the ‘‘scale of effect,’’
and although the ‘‘scale of effect’’ varies with the
response variable, it does not always vary in a
predictable manner (Jackson and Fahrig 2012; Moraga
et al. 2019). Without previous multi-scale studies to
base analyses of the effects of landscape structure on
wildlife behavior, it is recommended to estimate the
‘‘scale of effect’’ empirically using a multi-scale study
design (Moraga et al. 2019). Understanding landscape
patterns and scale associated with wildlife-vehicle
collisions can inform mitigation strategies for sensi-
tive species within a fragmented landscape.
The ocelot (Leopardus pardalis) is a medium-sized
neotropical felid that is widely distributed from South
America through Mexico, with only remnant popula-
tions in the United States (U.S.) in the southern portion
of Texas (Caso et al. 2008). Though ocelots are of least
concern throughout much of their geographic range,
Texas represents their northern distribution limit
where they are listed as state and federally endangered
(USFWS 1982; TPWD 2018). Fewer than 80 ocelots
remain in the U.S. (Tewes 2019), divided between 2
isolated breeding populations in the eastern Coastal
Sand Plain and the Lower Rio Grande Valley of Texas
(Janecka et al. 2011, 2016).
Ocelots in this region are habitat specialists with
spatial patterns strongly linked to dense thornshrub
(Harveson et al. 2004). Ocelots select for areas
with C 75% thornshrub canopy cover with a strong
preference for habitat with[ 95% canopy cover
(Horne et al. 2009). This dense thornshrub cover type
used by ocelots is uncommon throughout the south-
ernmost 13 counties of Texas, as an estimated\ 1%
of this area presently contains suitable ocelot habitat
(Tewes and Everett 1986). Native woodland in the
Lower Rio Grande Valley declined 91% between the
1930s–1980s due to the expansion of agriculture and
urban development and human population growth
(Tremblay et al. 2005; Lombardi et al. 2020a). The
challenge for ocelots to survive in an increasingly
fragmented landscape is further exacerbated by the
development and expansion of road networks, as
vehicle collisions represent the highest source of direct
mortality for ocelots in this region (Haines et al. 2005).
Few studies have examined the spatial structure of
land cover of South Texas that may influence ocelot
movement and dispersal (Harveson et al. 2004;
Jackson et al. 2005). Schmidt et al. (2020) conducted
a broad scale analysis to identify predictors of ocelot
road mortality in South Texas. However, the identi-
fication of spatial patterns in the landscape associated
with ocelot–vehicle collisions at the appropriate scale
can help precisely determine critical locations where
ocelots may be vulnerable to vehicle mortality. This
123
Landscape Ecol
information can then be integrated into mitigation
strategies. The goal of this study was to understand the
scale of effect of landscape structure associated with
ocelot–vehicle collisions and aid conservation plan-
ners in the development of mitigation strategies. Our
main objectives were: (i) to quantify the spatial
distribution of land cover types at ocelot–vehicle
collision locations, (ii) to determine the scale at which
spatial patterns of land cover at ocelot–vehicle colli-
sion locations differ from landscape spatial structure
across our study area, and (iii) to compare spatial
structure of landscape features at vehicle collision
sites between male and female ocelots.
Methods
Study area
Our study area is located in the 3 southernmost coastal
counties of Texas: Cameron, Kenedy, and Willacy.
Ocelots reside in 2 isolated breeding populations
within these counties (Tewes and Everett 1986;
Janecka et al. 2016). The southernmost ocelot popu-
lation, the ‘‘Refuge Population’’, occurs in and around
the Laguna Atascosa National Wildlife Refuge
(26.2289� N, 97.3467� W), a federally protected area
in Cameron County. The northernmost population, the
‘‘Ranch Population’’, occurs on private lands primar-
ily in Kenedy and Willacy counties (Tewes 2017;
Lombardi et al. 2020b). Cameron and Willacy coun-
ties lie within the Lower Rio Grande Valley, which has
been substantially modified by urban development and
agriculture over the past century (Leslie 2016). Urban
expansion in this region has increased anthropogenic
infrastructure, including housing developments, shop-
ping centers, and road networks (Tiefenbacher 2001;
Lombardi et al. 2020a).
Our study area represents a transition zone between
temperate and tropical conditions, with humid sub-
tropical and semiarid climates resulting in hot sum-
mers and mild winters (Leslie 2016). Rainfall
fluctuates seasonally and among years with an annual
average of 660 mm (Norwine and John 2007). This
region is in the Tamaulipan Biotic Province, consti-
tuting of hardwood and dense thornshrub forest.
Dominant woody vegetation includes Texas ebony
(Ebenopsis ebano), honey mesquite (Prosopis glan-
dulosa), spiny hackberry (Celtis pallida), live oak
(Quercus virginianus), lime prickly ash (Zanthoxylum
fagara), huisache (Acacia farnesiana), and Texas
lantana (Lantana horrida; Harveson et al. 2004; Leslie
2016).
Data collection
There were 50 recorded (U.S. Fish and Wildlife
Service; Texas Department of Transportation) ocelot–
vehicle collisions in the Lower Rio Grande Valley
during 1982–2017. Of those records, 32 had docu-
mented geographic coordinates. The spatial accuracy
of 2 road mortality locations did not fall on a road and
were removed from analysis. Four ocelot–vehicle
collisions were within completely urbanized areas;
initial data analysis indicated these were aberrations
compared to other mortality locations, thus were not
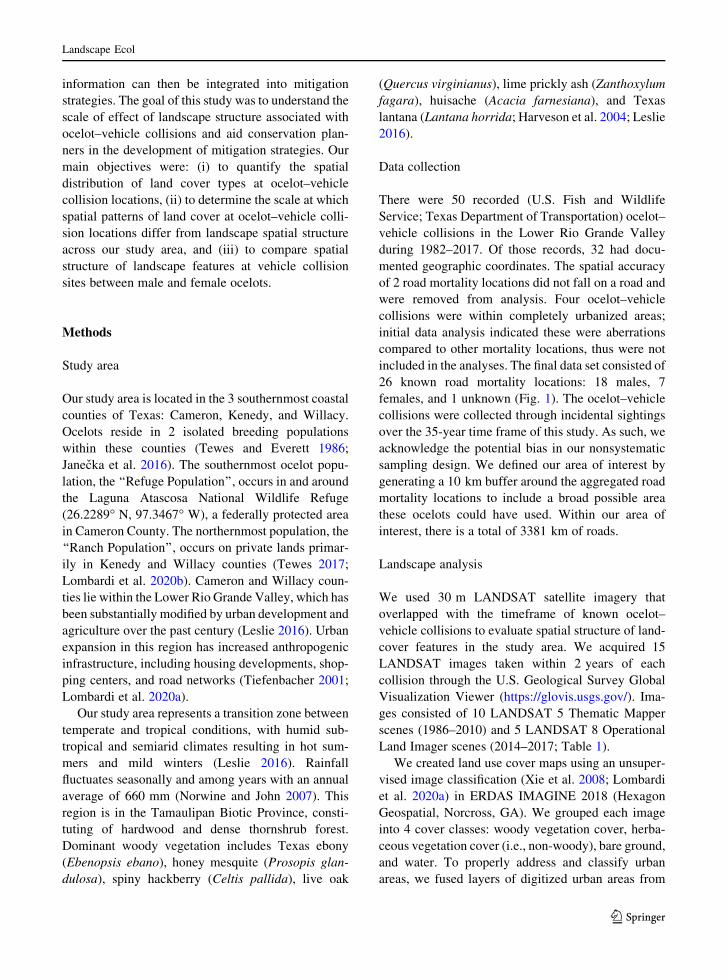
included in the analyses. The final data set consisted of
26 known road mortality locations: 18 males, 7
females, and 1 unknown (Fig. 1). The ocelot–vehicle
collisions were collected through incidental sightings
over the 35-year time frame of this study. As such, we
acknowledge the potential bias in our nonsystematic
sampling design. We defined our area of interest by
generating a 10 km buffer around the aggregated road
mortality locations to include a broad possible area
these ocelots could have used. Within our area of
interest, there is a total of 3381 km of roads.
Landscape analysis
We used 30 m LANDSAT satellite imagery that
overlapped with the timeframe of known ocelot–
vehicle collisions to evaluate spatial structure of land-
cover features in the study area. We acquired 15
LANDSAT images taken within 2 years of each
collision through the U.S. Geological Survey Global
Visualization Viewer (https://glovis.usgs.gov/). Ima-
ges consisted of 10 LANDSAT 5 Thematic Mapper
scenes (1986–2010) and 5 LANDSAT 8 Operational
Land Imager scenes (2014–2017; Table 1).
We created land use cover maps using an unsuper-
vised image classification (Xie et al. 2008; Lombardi
et al. 2020a) in ERDAS IMAGINE 2018 (Hexagon
Geospatial, Norcross, GA). We grouped each image
into 4 cover classes: woody vegetation cover, herba-
ceous vegetation cover (i.e., non-woody), bare ground,
and water. To properly address and classify urban
areas, we fused layers of digitized urban areas from
123
Landscape Ecol

123
Landscape Ecol
1987, 1992, 2000, 2008, and 2016 based on spatial
data from the U.S. Census Urban Area from the Texas
Natural Resource Information System (TNRIS, Aus-
tin, TX). Cropland varied by year and season and often
had similar spectral signatures to woody cover, which
led to inaccurate images. Therefore, we manually
digitized crop fields for each image and fused these
layers to our classified imagery in addition to the
digitized urban layers. Final imagery included 6 cover
classes: woody, herbaceous, bare ground, water,
cropland, and urban. We conducted accuracy assess-
ments on each image by generating 200 random points
across each satellite image, assigning each random
point to 1 of the 6 classes, and compared the observed
cover class to the expected cover class from the
classified image. We used a threshold of C 85%
accuracy for image classifications (Jensen 2016;
Pulighe et al. 2016).
We quantified landscape characteristics within
multiple spatial extents surrounding ocelot road
mortality locations to estimate the potential scale of
effect. To evaluate land cover variation by spatial
scale, we measured landscape variables within each of
11 nested extents surrounding road mortality locations
from 150–1650 m in radii at 150 m increments. The
largest spatial extent (1650 m) encompassed the
maximum average daily movement length of radio-
marked ocelots (M. Tewes, Texas A&M University-
Kingsville, unpub. data). Increments of 150 m were
used to create fine-scale spatial increments while
incorporating enough pixels in each new spatial extent
to accurately quantify land cover patterns. To evaluate
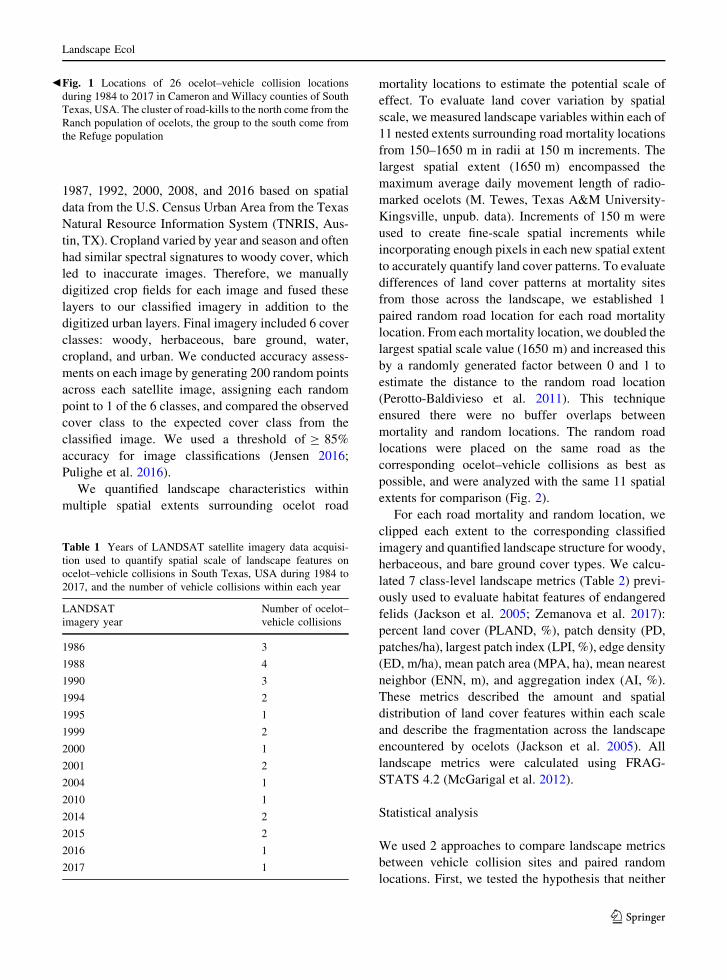
differences of land cover patterns at mortality sites
from those across the landscape, we established 1
paired random road location for each road mortality
location. From each mortality location, we doubled the
largest spatial scale value (1650 m) and increased this
by a randomly generated factor between 0 and 1 to
estimate the distance to the random road location
(Perotto-Baldivieso et al. 2011). This technique
ensured there were no buffer overlaps between
mortality and random locations. The random road
locations were placed on the same road as the
corresponding ocelot–vehicle collisions as best as
possible, and were analyzed with the same 11 spatial
extents for comparison (Fig. 2).
For each road mortality and random location, we
clipped each extent to the corresponding classified
imagery and quantified landscape structure for woody,
herbaceous, and bare ground cover types. We calcu-
lated 7 class-level landscape metrics (Table 2) previ-
ously used to evaluate habitat features of endangered
felids (Jackson et al. 2005; Zemanova et al. 2017):
percent land cover (PLAND, %), patch density (PD,
patches/ha), largest patch index (LPI, %), edge density
(ED, m/ha), mean patch area (MPA, ha), mean nearest
neighbor (ENN, m), and aggregation index (AI, %).
These metrics described the amount and spatial
distribution of land cover features within each scale
and describe the fragmentation across the landscape
encountered by ocelots (Jackson et al. 2005). All
landscape metrics were calculated using FRAG-
STATS 4.2 (McGarigal et al. 2012).
Statistical analysis
We used 2 approaches to compare landscape metrics
between vehicle collision sites and paired random
locations. First, we tested the hypothesis that neither
bFig. 1 Locations of 26 ocelot–vehicle collision locations
during 1984 to 2017 in Cameron and Willacy counties of South
Texas, USA. The cluster of road-kills to the north come from the
Ranch population of ocelots, the group to the south come from
the Refuge population
Table 1 Years of LANDSAT satellite imagery data acquisi-
tion used to quantify spatial scale of landscape features on
ocelot–vehicle collisions in South Texas, USA during 1984 to
2017, and the number of vehicle collisions within each year
LANDSAT
imagery year
Number of ocelot–
vehicle collisions
1986 3
1988 4
1990 3
1994 2
1995 1
1999 2
2000 1
2001 2
2004 1
2010 1
2014 2
2015 2
2016 1
2017 1
123
Landscape Ecol

vehicle collision sites nor random locations were
likely to have larger values of a given metric using a
sign test (Conover 1999). This approach considers
only whether a given metric is larger at 1 site or the
other but does not consider the magnitude of the
difference. Second, our landscape metrics were highly
skewed in their distributions, thus we compared
medians of each of the 7 landscape metrics at all
spatial extents at road mortality locations to random
road locations using a Wilcoxon signed-rank test
(Conover 1999). Although this is formally a test of
median equality, given the skewed distributions,
differences between locations may occur at other
quantiles. Differences can be assessed with effect size
and p-values. Therefore, we calculated effect size for
the Wilcoxon signed-rank test following Field (2009),
where small, moderate, and large effect sizes are
Fig. 2 Example of multi-buffer system used to analyze
landscape structure surrounding ocelot–vehicle collision loca-
tions in South Texas, USA during 1984 to 2017. Each road
mortality and random road location consists of 11 buffers
increasing in size by a radius of 150 m
123
Landscape Ecol
indicated by values of 0.1, 0.3, and 0.5, respectively
(Cohen 1988, 1992).
We also compared differences in landscape struc-
ture around male and female ocelot–vehicle collision
locations. We analyzed PLAND, ENN, LPI, and MPA
for woody vegetation, herbaceous vegetation, and bare
ground. Because initial data analysis indicated these
metrics were skewed, we compared distributions of
each metric at each extent between male and female
locations with Kolmogorov–Smirnov tests (Conroy
2012). Kolmogorov–Smirnov tests are sensitive to
differences between distributions (e.g., related to
variances) that other tests (e.g., a Mann–Whitney test)
may not detect (Conroy 2012). We report the maxi-
mum difference between the empirical distribution
functions (Dmax) as a measure of effect size, which
ranges from 0 to 1.
The Wilcoxon signed-rank test, with 7 landscape
metrics, 11 spatial extents, and 3 cover types for
comparisons between mortality and random sites
involved 231 hypothesis tests. The Kolmogorov–
Smirnov test, with 4 landscape metrics, 11 spatial
extents and 3 cover types between male and female
mortality sites involved an additional 132 tests of
hypotheses for each test statistic. The Kolmogorov–
Smirnov test does not have an omnibus test (analogous
to an overall F-test in the analysis of variance) that
controls for comparison-wise error rates. Thus, we
also applied Bonferroni’s adjustment to p-values
(Miller 1981) for each set of comparisons among the
11 spatial extents. All statistical analyses were
performed using SAS version 9.4 (SAS Institute,
Cary, NC, USA).
Results
Woody vegetation cover values for PLAND, LPI, ED,
and MPA were more likely to be greater at ocelot–
vehicle collision sites than at random road locations
(sign test: p B 0.01; Table 3), whereas ENN values
were marginally more likely to be larger for random
locations (sign test: p\ 0.07). Values of PD and AI
were similar between location type (sign test:
p\ 0.55). Median percent woody cover varied from
30–38% at ocelot–vehicle collision sites. The Wil-
coxon test indicated median woody PLAND was
13–20% greater at ocelot–vehicle collision sites
compared to random road locations at all extents
(effect size 0.28–0.40, p B 0.05; Fig. 3) except
150 m. Median LPI was 7.1–11% greater only at the
450 and 600 m extents, respectively (Wilcoxon test:
effect size 0.23–0.32, p\ 0.05). Median MPA was
3.5 ha at vehicle collision sites at the 450 m spatial
extent, which was 2.4 ha larger than at random sites
(Wilcoxon test: effect size 0.32, p B 0.02) and
1.2–1.4 ha larger at 750–1050 m (Wilcoxon test:
effect size\ 0.19, p B 0.10). Nearest neighbor med-
ian values were 10.2–16 m shorter at collision sites for
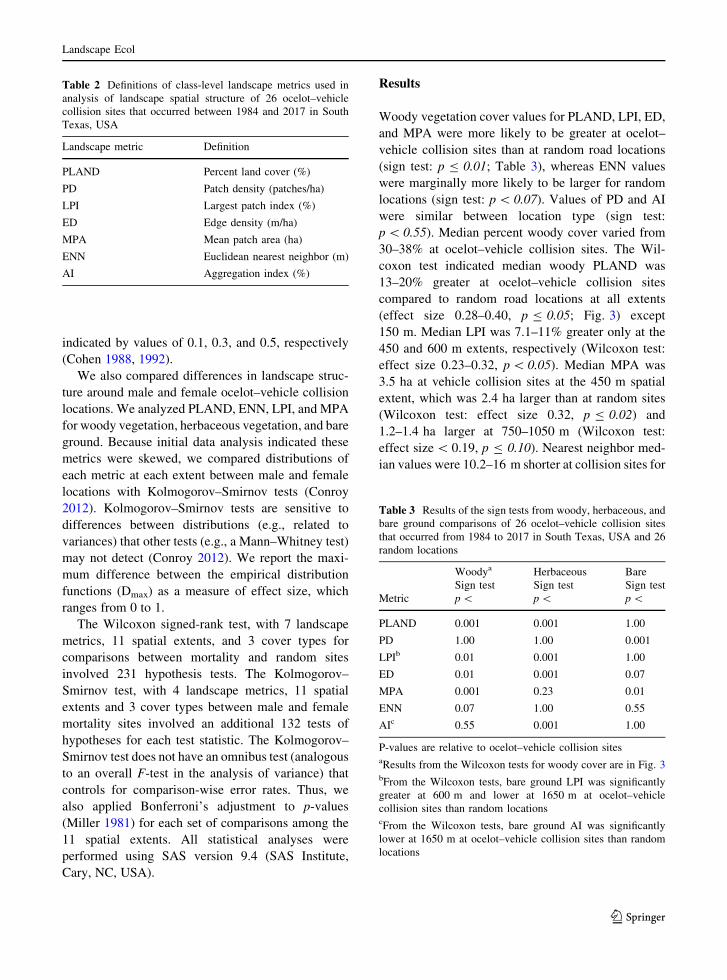
Table 2 Definitions of class-level landscape metrics used in
analysis of landscape spatial structure of 26 ocelot–vehicle
collision sites that occurred between 1984 and 2017 in South
Texas, USA
Landscape metric Definition
PLAND Percent land cover (%)
PD Patch density (patches/ha)
LPI Largest patch index (%)
ED Edge density (m/ha)
MPA Mean patch area (ha)
ENN Euclidean nearest neighbor (m)
AI Aggregation index (%)
Table 3 Results of the sign tests from woody, herbaceous, and
bare ground comparisons of 26 ocelot–vehicle collision sites
that occurred from 1984 to 2017 in South Texas, USA and 26
random locations
Woodya
Sign test
Herbaceous
Sign test
Bare
Sign test
Metric p\ p\ p\
PLAND 0.001 0.001 1.00
PD 1.00 1.00 0.001
LPIb 0.01 0.001 1.00
ED 0.01 0.001 0.07
MPA 0.001 0.23 0.01
ENN 0.07 1.00 0.55
AIc 0.55 0.001 1.00
P-values are relative to ocelot–vehicle collision sitesaResults from the Wilcoxon tests for woody cover are in Fig. 3bFrom the Wilcoxon tests, bare ground LPI was significantly
greater at 600 m and lower at 1650 m at ocelot–vehicle
collision sites than random locationscFrom the Wilcoxon tests, bare ground AI was significantly
lower at 1650 m at ocelot–vehicle collision sites than random
locations
123
Landscape Ecol
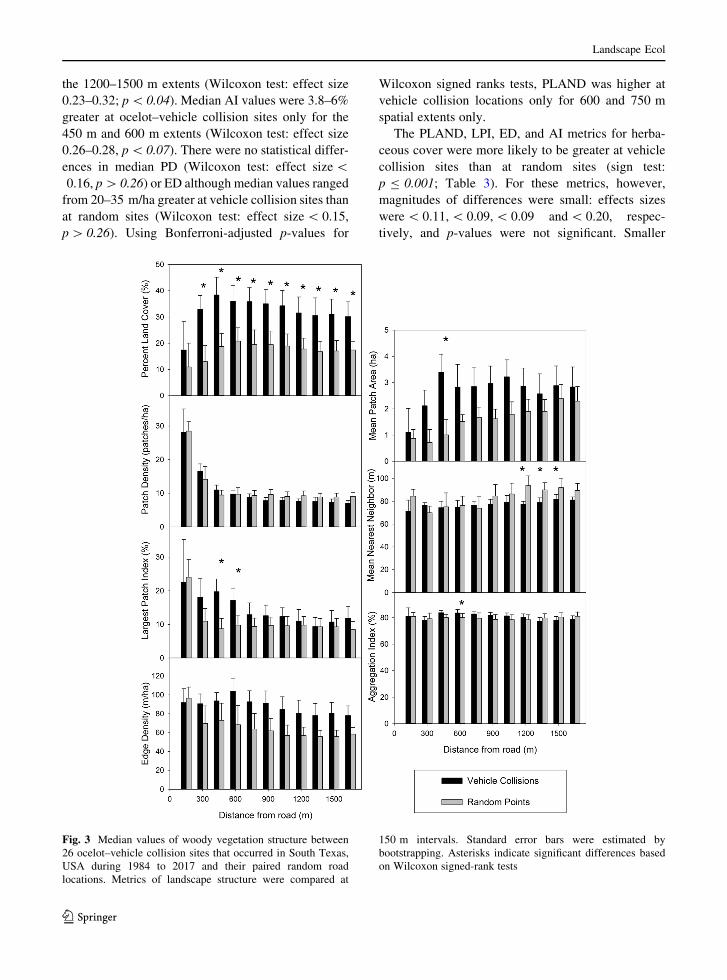
the 1200–1500 m extents (Wilcoxon test: effect size
0.23–0.32; p\ 0.04). Median AI values were 3.8–6%
greater at ocelot–vehicle collision sites only for the
450 m and 600 m extents (Wilcoxon test: effect size
0.26–0.28, p\ 0.07). There were no statistical differ-
ences in median PD (Wilcoxon test: effect size\0.16, p[ 0.26) or ED although median values ranged
from 20–35 m/ha greater at vehicle collision sites than
at random sites (Wilcoxon test: effect size\ 0.15,
p[ 0.26). Using Bonferroni-adjusted p-values for
Wilcoxon signed ranks tests, PLAND was higher at
vehicle collision locations only for 600 and 750 m
spatial extents only.
The PLAND, LPI, ED, and AI metrics for herba-
ceous cover were more likely to be greater at vehicle
collision sites than at random sites (sign test:
p B 0.001; Table 3). For these metrics, however,
magnitudes of differences were small: effects sizes
were\ 0.11,\ 0.09,\ 0.09 and\ 0.20, respec-
tively, and p-values were not significant. Smaller
Fig. 3 Median values of woody vegetation structure between
26 ocelot–vehicle collision sites that occurred in South Texas,
USA during 1984 to 2017 and their paired random road
locations. Metrics of landscape structure were compared at
150 m intervals. Standard error bars were estimated by
bootstrapping. Asterisks indicate significant differences based
on Wilcoxon signed-rank tests
123
Landscape Ecol
effect sizes were observed for the other metrics, which
were no more likely to be greater at either location
type. The above effects were not significant following
Bonferroni adjustment.
For bare ground cover, PLAND, LPI, MPA, and AI
were greater at random road locations than at vehicle
collision locations (sign test: p\ 0.07; Table 3),
whereas PD and ED were greater at vehicle collision
sites (sign test: p\ 0.07). Nearest neighbor did not
differ between location types (sign test: p[ 0.23).
Median values of PLAND, ED, MPA, and ENN were
not different between location types (Wilcoxon tests:
effect sizes\ 0.23, p\ 0.12). Median values of PD
were only marginally different at the 150 m extent,
associated with a large arithmetic difference of 14
more patches/ha at vehicle collision sites (Wilcoxon
test: effect size 0.25, p B 0.12). Median LPI values
were 1% larger for vehicle collision locations at the
600 m extent, whereas values for random locations
were 12.1% larger at the 1650 m extent (Wilcoxon
test: effect size 0.27 and 0.26, respectively, p B 0.05).
Median AI was 7.3% greater at random locations at the
1650 m extent (Wilcoxon test: effect size 0.27,
p B 0.05). The above effects were not significant
following Bonferroni adjustment.
The Kolmogorov–Smirnov (KS) tests indicated
woody cover PLAND and ENNwere similar at female
and male mortality locations (sign test: p = 1.00;
Table 4). Values of LPI were marginally greater at
female mortality sites than male (sign test: p B 0.07),
and values of MPA were greater at female locations at
all spatial extents (sign test: p B 0.001). Median
woody PLANDwas 15.8% greater at female mortality
sites at 450 m (KS test: Dmax = 0.56, p B 0.05;
Fig. 4). Greater differences were observed at spatial
extents[ 450 m, but these were also associated with
smaller effect sizes and larger p-values (KS test:
Dmax\ 0.50, p[ 0.11). We detected no significant
differences in median LPI values between sexes at any
spatial extent (KS test: Dmax\ 0.42, p[ 0.28).
Median values of ENN were 12.3 and 20.2 m larger
for male mortality sites at 900 m and 1050 m,
respectively (Dmax[ 0.56, p B 0.05). Although med-
ian ENN was 28 m greater for females at 300 m, the
difference was associated with a smaller effect size
and larger p-value (Dmax = 0.40, p = 0.63). There was
no difference in median values of MPA (KS test:
Dmax B 0.50, p[ 0.13). The above effects were not
significant following Bonferroni adjustment.
For herbaceous cover, PLAND, LPI, and MPA
were more likely to be greater at female road mortality
sites than male (sign test: p B 0.01; Table 4). How-
ever, there were no differences in median values
between male and female mortality locations for
PLAND (KS test: Dmax\ 0.46, p[ 0.16; Fig. 5), LPI
(KS test: Dmax\ 0.52, p[ 0.09), and MPA (KS test:
Dmax[ 0.46, p[ 0.17). Values of ENN were margin-
ally greater at male mortality sites than male (sign test:
p B 0.07), and median ENN was 4.8–6.7 m larger at
male road mortality sites from 1200–1650 m (KS test:
Dmax\ 0.61, p\ 0.03). The above effects were not
significant following Bonferroni adjustment.
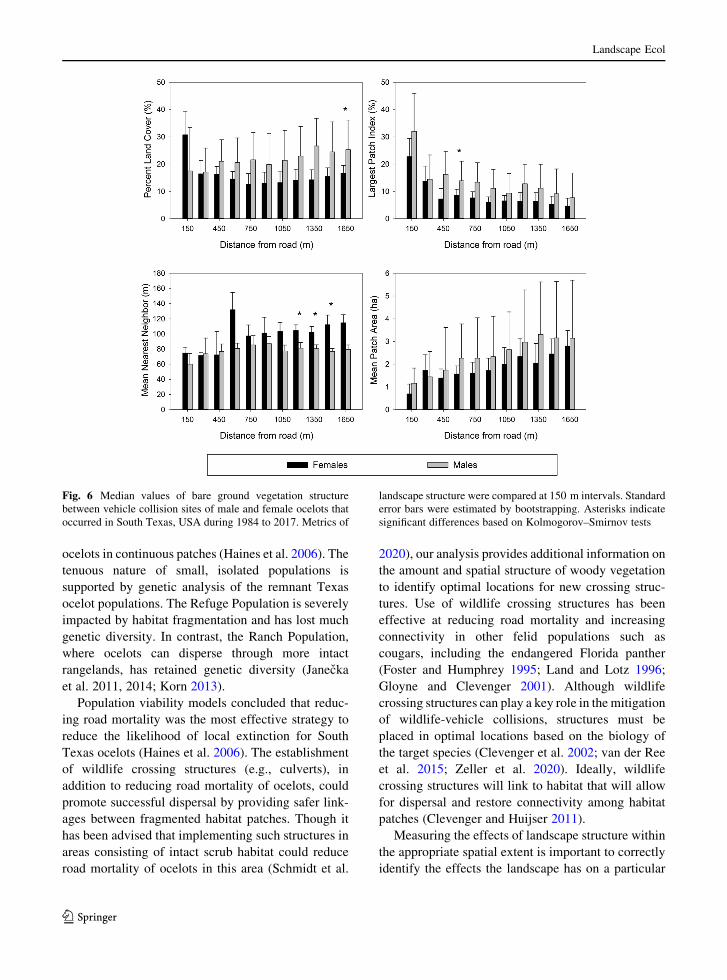
The PLAND, LPI, and MPA metrics for bare
ground cover were more likely to be greater at male
mortality locations (sign test: p B 0.01; Table 4),
while ENN was more likely to be greater at female
mortality locations (sign test: p, 0.07). Median
PLAND values were 8.6% greater at male mortality
sites at 1650 m (Dmax = 0.56, p B 0.05; Fig. 6).
Additionally, PLAND was 13.3% smaller and 12.4%
larger at 150 and 1350 m, respectively, for male
mortality locations, which were associated with
smaller effect sizes and larger p-values (KS test:
Dmax[ 0.5, p[ 0.11). Median LPI values were 5.3%
larger at male mortality sites at 600 m (KS test:
Dmax = 0.56, p B 0.05). Larger differences in LPI
(9%) were found at 150 and 450 m but were associated
with smaller effect sizes and larger p-values (KS test:
Dmax\ 0.47, p[ 0.35). Median values of ENN were
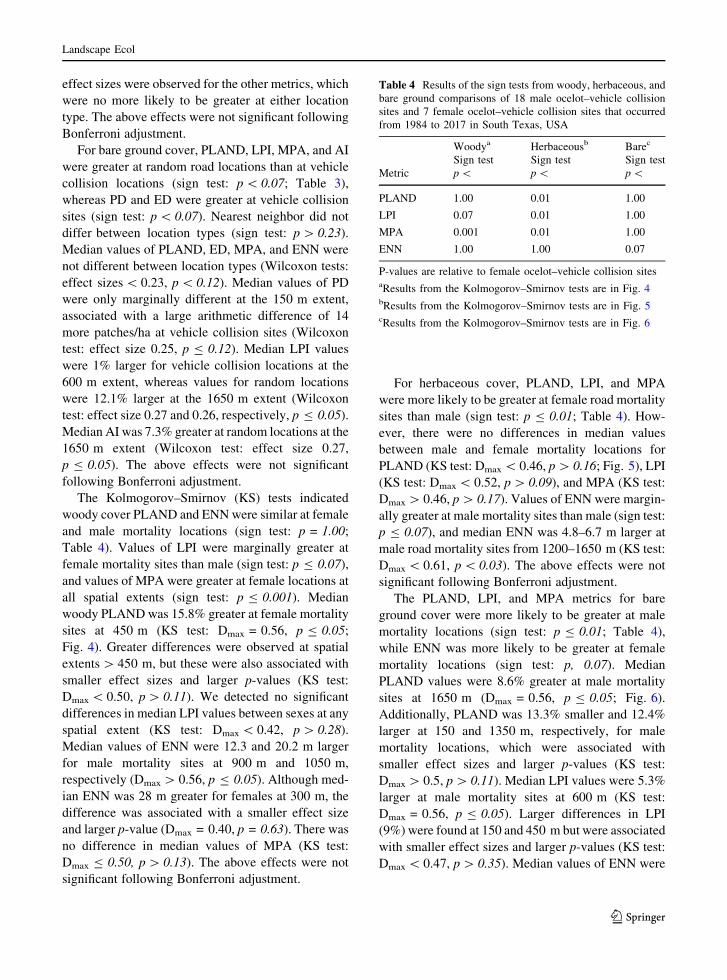
Table 4 Results of the sign tests from woody, herbaceous, and
bare ground comparisons of 18 male ocelot–vehicle collision
sites and 7 female ocelot–vehicle collision sites that occurred
from 1984 to 2017 in South Texas, USA
Woodya
Sign test
Herbaceousb
Sign test
Barec
Sign test
Metric p\ p\ p\
PLAND 1.00 0.01 1.00
LPI 0.07 0.01 1.00
MPA 0.001 0.01 1.00
ENN 1.00 1.00 0.07
P-values are relative to female ocelot–vehicle collision sitesaResults from the Kolmogorov–Smirnov tests are in Fig. 4bResults from the Kolmogorov–Smirnov tests are in Fig. 5cResults from the Kolmogorov–Smirnov tests are in Fig. 6
123
Landscape Ecol
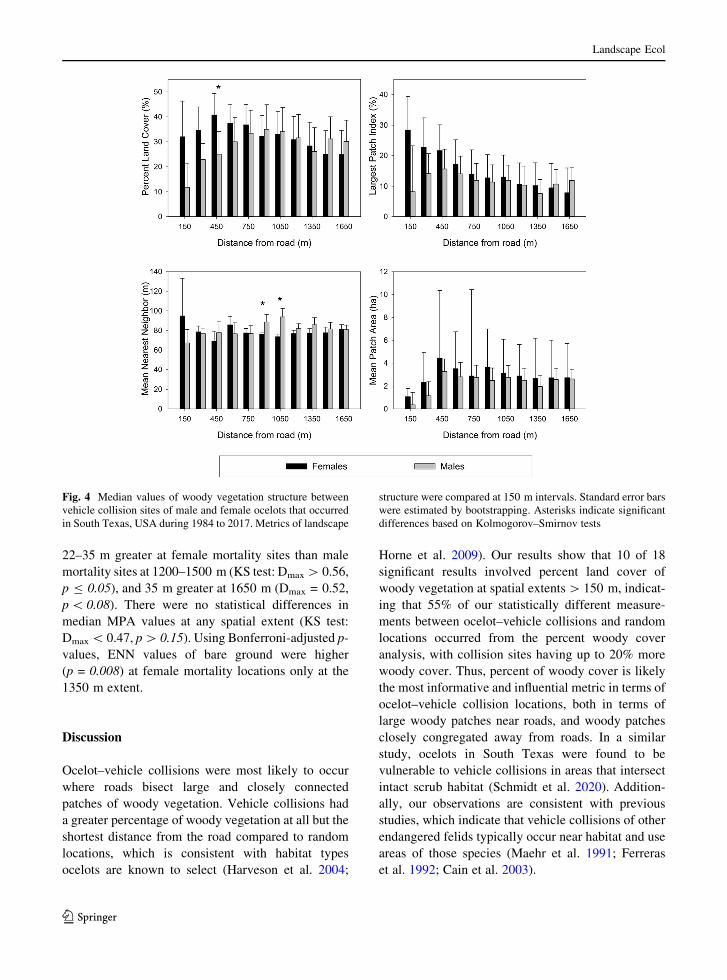
22–35 m greater at female mortality sites than male
mortality sites at 1200–1500 m (KS test: Dmax[ 0.56,
p B 0.05), and 35 m greater at 1650 m (Dmax = 0.52,
p\ 0.08). There were no statistical differences in
median MPA values at any spatial extent (KS test:
Dmax\ 0.47, p[ 0.15). Using Bonferroni-adjusted p-
values, ENN values of bare ground were higher
(p = 0.008) at female mortality locations only at the
1350 m extent.
Discussion
Ocelot–vehicle collisions were most likely to occur
where roads bisect large and closely connected
patches of woody vegetation. Vehicle collisions had
a greater percentage of woody vegetation at all but the
shortest distance from the road compared to random
locations, which is consistent with habitat types
ocelots are known to select (Harveson et al. 2004;
Horne et al. 2009). Our results show that 10 of 18
significant results involved percent land cover of
woody vegetation at spatial extents[ 150 m, indicat-
ing that 55% of our statistically different measure-
ments between ocelot–vehicle collisions and random
locations occurred from the percent woody cover
analysis, with collision sites having up to 20% more
woody cover. Thus, percent of woody cover is likely
the most informative and influential metric in terms of
ocelot–vehicle collision locations, both in terms of
large woody patches near roads, and woody patches
closely congregated away from roads. In a similar
study, ocelots in South Texas were found to be
vulnerable to vehicle collisions in areas that intersect
intact scrub habitat (Schmidt et al. 2020). Addition-
ally, our observations are consistent with previous
studies, which indicate that vehicle collisions of other
endangered felids typically occur near habitat and use
areas of those species (Maehr et al. 1991; Ferreras
et al. 1992; Cain et al. 2003).
Fig. 4 Median values of woody vegetation structure between
vehicle collision sites of male and female ocelots that occurred
in South Texas, USA during 1984 to 2017. Metrics of landscape
structure were compared at 150 m intervals. Standard error bars
were estimated by bootstrapping. Asterisks indicate significant
differences based on Kolmogorov–Smirnov tests
123
Landscape Ecol
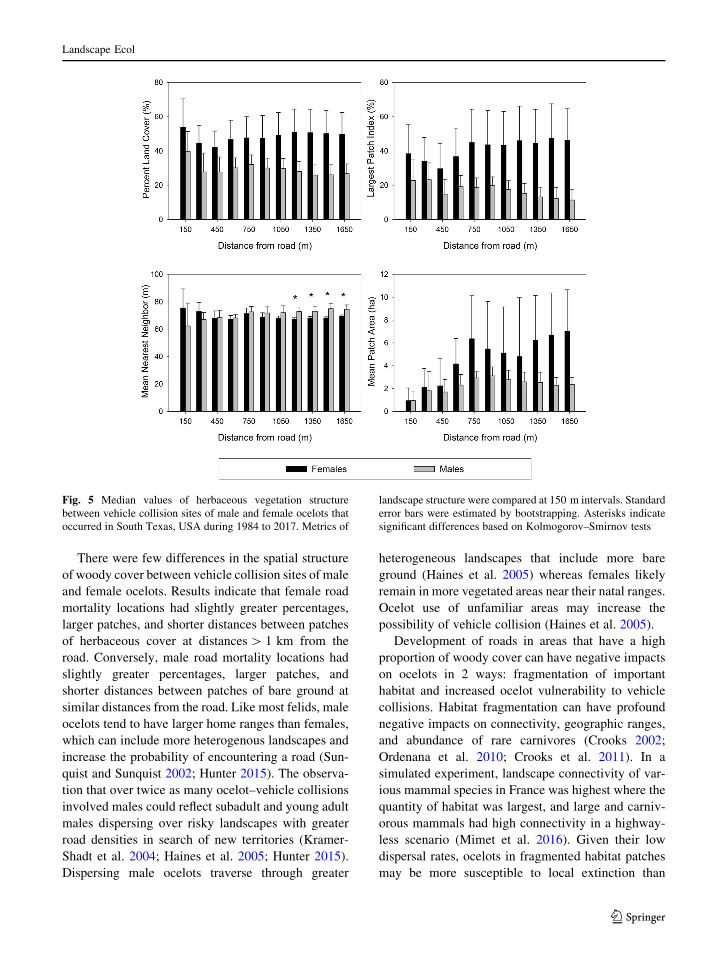
There were few differences in the spatial structure
of woody cover between vehicle collision sites of male
and female ocelots. Results indicate that female road
mortality locations had slightly greater percentages,
larger patches, and shorter distances between patches
of herbaceous cover at distances[ 1 km from the
road. Conversely, male road mortality locations had
slightly greater percentages, larger patches, and
shorter distances between patches of bare ground at
similar distances from the road. Like most felids, male
ocelots tend to have larger home ranges than females,
which can include more heterogenous landscapes and
increase the probability of encountering a road (Sun-
quist and Sunquist 2002; Hunter 2015). The observa-
tion that over twice as many ocelot–vehicle collisions
involved males could reflect subadult and young adult
males dispersing over risky landscapes with greater
road densities in search of new territories (Kramer-
Shadt et al. 2004; Haines et al. 2005; Hunter 2015).
Dispersing male ocelots traverse through greater
heterogeneous landscapes that include more bare
ground (Haines et al. 2005) whereas females likely
remain in more vegetated areas near their natal ranges.
Ocelot use of unfamiliar areas may increase the
possibility of vehicle collision (Haines et al. 2005).
Development of roads in areas that have a high
proportion of woody cover can have negative impacts
on ocelots in 2 ways: fragmentation of important
habitat and increased ocelot vulnerability to vehicle
collisions. Habitat fragmentation can have profound
negative impacts on connectivity, geographic ranges,
and abundance of rare carnivores (Crooks 2002;
Ordenana et al. 2010; Crooks et al. 2011). In a
simulated experiment, landscape connectivity of var-
ious mammal species in France was highest where the
quantity of habitat was largest, and large and carniv-
orous mammals had high connectivity in a highway-
less scenario (Mimet et al. 2016). Given their low
dispersal rates, ocelots in fragmented habitat patches
may be more susceptible to local extinction than
Fig. 5 Median values of herbaceous vegetation structure
between vehicle collision sites of male and female ocelots that
occurred in South Texas, USA during 1984 to 2017. Metrics of
landscape structure were compared at 150 m intervals. Standard
error bars were estimated by bootstrapping. Asterisks indicate
significant differences based on Kolmogorov–Smirnov tests
123
Landscape Ecol
ocelots in continuous patches (Haines et al. 2006). The
tenuous nature of small, isolated populations is
supported by genetic analysis of the remnant Texas
ocelot populations. The Refuge Population is severely
impacted by habitat fragmentation and has lost much
genetic diversity. In contrast, the Ranch Population,
where ocelots can disperse through more intact
rangelands, has retained genetic diversity (Janecka
et al. 2011, 2014; Korn 2013).
Population viability models concluded that reduc-
ing road mortality was the most effective strategy to
reduce the likelihood of local extinction for South
Texas ocelots (Haines et al. 2006). The establishment
of wildlife crossing structures (e.g., culverts), in
addition to reducing road mortality of ocelots, could
promote successful dispersal by providing safer link-
ages between fragmented habitat patches. Though it
has been advised that implementing such structures in
areas consisting of intact scrub habitat could reduce
road mortality of ocelots in this area (Schmidt et al.
2020), our analysis provides additional information on
the amount and spatial structure of woody vegetation
to identify optimal locations for new crossing struc-
tures. Use of wildlife crossing structures has been
effective at reducing road mortality and increasing
connectivity in other felid populations such as
cougars, including the endangered Florida panther
(Foster and Humphrey 1995; Land and Lotz 1996;
Gloyne and Clevenger 2001). Although wildlife
crossing structures can play a key role in the mitigation
of wildlife-vehicle collisions, structures must be
placed in optimal locations based on the biology of
the target species (Clevenger et al. 2002; van der Ree
et al. 2015; Zeller et al. 2020). Ideally, wildlife
crossing structures will link to habitat that will allow
for dispersal and restore connectivity among habitat
patches (Clevenger and Huijser 2011).
Measuring the effects of landscape structure within
the appropriate spatial extent is important to correctly
identify the effects the landscape has on a particular
Fig. 6 Median values of bare ground vegetation structure
between vehicle collision sites of male and female ocelots that
occurred in South Texas, USA during 1984 to 2017. Metrics of
landscape structure were compared at 150 m intervals. Standard
error bars were estimated by bootstrapping. Asterisks indicate
significant differences based on Kolmogorov–Smirnov tests
123
Landscape Ecol

species or behavior (Moraga et al. 2019). This is
because landscape features may influence a species
response or behavior at varying spatial scales, termed
the ‘‘scale of effect’’ (Jackson and Fahrig 2012). The
limited information provided by single scale analyses
can be strengthened by multi-scale analyses that allow
more detailed understanding of fine-scale patterns in
selection and behavior, which may make conservation
planning more effective. Landscape-based analyses
that incorporate multiple scales and landscape metrics
provide a useful framework to evaluate space use by
wildlife and select sites for wildlife crossing structures
(Weins 1989; Snow et al. 2014). The multi-scale
method used in this study provided critical informa-
tion on landscape similarities at ocelot roadkill
locations which will be beneficial in mitigation
measures such as crossing structures. This method
allows the integration of wildlife behavior, habitat
selection, and movement patterns at finer scales often
missed by single-scale analyses (Martin and Fahrig
2012).
Vehicle collisions likely occur as ocelots attempt to
cross between woody habitat patches. Therefore,
crossing structures designed for ocelots should be
placed where roads bisect areas of 30–38% woody
cover, with woody patches of about 3.5 ha in size,
preferably in areas with woody cover on both sides of
the road. Additionally, crossing structures should
avoid open areas such as grasslands, coastal prairies,
and agricultural fields. Crossing structure locations
should facilitate safe passage to a viable destination
and avoid leading to habitat sinks or population sinks.
Our study demonstrates how coupling animal move-
ment ecology with landscape analyses can efficiently
guide the placement of road crossing structures
designed to facilitate safe movement of ocelots in
South Texas. We encourage conservation planners to
prioritize properly sited crossing structures in the near
future, as reduction of road mortality and restoration
connectivity are critical to the persistence of ocelots in
the US.
Acknowledgements Research funding was provided by the
Texas Department of Transportation, Environmental Affairs
Division. Ocelot–vehicle collision data were provided by the US
Fish and Wildlife Service and Texas Department of
Transportation, Environmental Affairs Division. We thank
Aaron M. Foley and Masahiro Ohnishi and the 2 anonymous
reviewers whose comments helped improve this manuscript.
This is manuscript number 20-119 from the Caesar Kleberg
Wildlife Research Institute at Texas A&M University-
Kingsville.
References
Baigas PE, Squires JR, Olson LE, Ivan JS, Roberts EK (2017)
Using environmental features to model highway crossing
behavior of Canada lynx in the Southern RockyMountains.
Landsc Urban Plann 157:200–213
Bauder JM, Breininger DR, Bolt MR, Legare ML, Jenkins CL,
Rothermel BB, McGarigal K (2018) Multi-level, multi-
scale habitat selection by a wide-ranging, federally
threatened snake. Landsc Ecol 33:743–763
Cain AT, Tuovila VR, Hewitt DG, Tewes ME (2003) Effects of
highway and mitigation projects on bobcats in southern
Texas. Biol Conserv 114:198–197
Carvalho F, Mira A (2011) Comparing annual vertebrate road
kills over two time periods, 9 years apart: a case study in
Mediterranean farmland. Eur J Wildl Res 57:157–174
Caso A, Lopez-Gonzalez C, Payan E, Eizirik E, de Oliveira T,
Leite-Pitman R, Kelly M, Valderrama C (2008) Leopardus
pardalis. The IUCN Red List of Threatened Species 2008:
e.T11509A3287809
Chen HL, Koprowski JL (2016) Differential effects of roads and
traffic on space use and movements of native forest-de-
pendent and introduced edge-tolerant species. PLoS ONE
11:e0148121
Clevenger AP, Chruszcz B, Gunson KE (2003) Spatial patterns
and factors influencing small vertebrate fauna road-kill
aggregations. Biol Conserv 109:15–26
Clevenger AP, Huijser MP (2011) Wildlife crossing structure
handbook: design and evaluation in North America. Report
FHWA-CFL/TD-11-003.
Clevenger AP, Wierzchowski J, Chruszcz B, Gunson K (2002)
GIS-generated, expert-based models for identifying wild-
life habitat linkages and planning mitigation passages.
Conserv Biol 16:503–514
Cohen J (1988) Statistical power analysis for the behavioral
sciences, 2nd edn. Academic Press, New York
Cohen J (1992) A power primer. Psychol Bull 112:155–159
Conover WJ (1999) Practical nonparametric statistics, 3rd edn.
Wiley, New York
Conroy RM (2012) What hypotheses do ‘‘nonparametric’’ two-
group tests actually test? Stata J 12:182–190
Crooks KR (2002) Relative sensitivities of mammalian carni-
vores to habitat fragmentation. Conserv Biol 16:488–502
Crooks KR, Burdett CL, Theobald DM, Rondinini C, Boitani L
(2011) Global patterns of fragmentation and connectivity
of mammalian carnivore habitat. Philos Trans R Soc B
366:2642–2651
Cypher BL, Bjurlin CD, Nelson JL (2009) Effects of roads on
endangered San Joaquin kit foxes. J Wildl Manag
73:885–893
Evink GL, Garret P, Zeigler D, Berry J (1996) Trends in
addressing transportation related wildlife mortality. In:
Evink GL, Garret P, Zeigler D, Berry J (eds) Proceedings of
the transportation related wildlife mortality seminar.
Florida Department of Transportation, Tallahassee, No.
FL-ER-58-96.
123
Landscape Ecol
Ferreras P, Aldama JJ, Beltran JF, Delibes M (1992) Rates and
causes of mortality in a fragmented population of Iberian
lynx Felis pardina Temmink, 1824. Biol Conserv
61:197–202
Field A (2009) Discovering statistics using SPSS, 3rd edn. Sage,
London, p 854
Forman RTT, Alexander LE (1998) Roads and their major
ecological effects. Annu Rev Ecol Syst 29:207–301
Forman RTT, Sperling D, Bissonette JA, Clevenger AP, Cut-
shall CD, Dale VH, Fahrig L, France R, Goldman CR,
Heanue K, Jones JA, Swanson FJ, Turrentine T, Winter TC
(2003) Road ecology: science and solutions. Island Press,
Washington
Foster ML, Humphrey SR (1995) Use of highway underpasses
by Florida panthers and other wildlife. Wildl Soc Bull
23:95–100
Gloyne CG, Clevenger AP (2001) Cougar Puma concolor use ofwildlife crossing structures on the Trans-Canada highway
in Banff National Park, Alberta. Wildlife Biol 7:117–124
Groot Bruinderink GWTA, Hazebroek E (1996) Ungulate traffic
collisions in Europe. Conserv Biol 10:1059–1067
Haines AM, Tewes ME, Laack LL (2005) Survival and sources
of mortality in ocelots. J Wildl Manag 69:255–263
Haines AM, Tewes ME, Laack LL, Horne JS, Young JH (2006)
A habitat-based population viability analysis for ocelots
(Leopardus pardalis) in the United States. Biol Conserv
136:326–327
Harris LD, Scheck J (1991) From implications to applications:
the dispersal corridor principle applied to the conservation
of biological diversity. In: Saunders DA, Hobbs RJ (eds)
Nature Conservation 2: the role of corridors. Surrey Beatty
& Sons, Chipping Norton, pp 189–220
Harveson PM, Tewes ME, Anderson GL, Laack LL (2004)
Habitat use by ocelots in South Texas: implications for
restoration. Wildl Soc Bull 32:948–954
Horne JS, Haines AM, Tewes ME, Laack LL (2009) Habitat
partitioning by sympatric ocelots and bobcats: implications
for recovery of ocelots in southern Texas. Southwest Nat
54:119–126
Hunter L (2015) Wild cats of the world. Bloomsbury, London
Jackson HB, Fahrig L (2012)What size is a biologically relevant
landscape? Landsc Ecol 27:929–941
Jackson VL, Laack LL, Zimmerman EG (2005) Landscape
metrics associated with habitat use by ocelots in South
Texas. J Wildl Manag 69:733–738
Janecka JE, Davis I, Tewes ME, Haines AM, Caso A,
Blankenship TL, Honeycutt RL (2016) Genetic differences
in the response to landscape fragmentation by a habitat
generalist, the bobcat and a habitat specialist, the ocelot.
Conserv Genet 17:1093–1108
Janecka JE, Tewes ME, Laack L, Caso A, Grassman LI, Hon-
eycutt RL (2014) Loss of genetic diversity among ocelots
in the United States during the 20th century linked to
human induced population reductions. PLoS ONE
9(2):e89384
Janecka JE, Tewes ME, Laack LL, Caso A, Grassman LI Jr,
Haines AM, Shindle DB, Davis BW, Murphy WJ, Hon-
eycutt RL (2011) Reduced genetic diversity and isolation
of remnant ocelot populations occupying a severely frag-
mented landscape in southern Texas. Anim Conserv
14:608–619
Jensen JR (2016) Introductory digital image processing: remote
sensing perspective, 4th edn. Prentice Hall, Upper Saddle
River
Kerley LL, Goodrich JM, Miquelle DG, Smirnov EN, Quigley
HB, Hornocker MG (2002) Effects of roads and human
disturbance on Amur Tigers. Conserv Biol 16:97–108
Korn JM (2013) Genetic pedigree and prey dynamics of ocelot
and fine-scale movement patterns of bobcat in south Texas.
Dissertation, Texas A&M University-Kingsville, Kings-
ville, Texas
Kramer-Schadt S, Revilla E,Wiegand T, Breitenmoser U (2004)
Fragmented landscapes, road mortality and patch connec-
tivity: modelling influences on the dispersal of Eurasian
lynx. J Appl Ecol 41:711–723
Land D, Lotz M (1996) Wildlife crossing designs and use by
Florida panthers and other wildlife in southwest Florida. In:
Evink G, Ziegler D, Garret P, Berry J (eds) Highways and
movement of wildlife: improving habitat connections and
wildlife passageways across highway corridors. Florida
Department of Transportation, Tallahassee, pp 323–328
Laurance SG, Gomez MS (2005) Clearing width and move-
ments of understory rainforest birds. Biotropica
37:149–152
Leslie Jr. DM (2016) An international borderland of concern:
conservation of biodiversity in the Lower Rio Grande
Valley. US Geological Survey No. 2016-5078, Stillwater,
Oklahoma
Litvaitis JA, Reed GC, Carol RP, Litvaitis MK, Tash J, Mahard
T, Broman DJA, Callahan C, Ellingwood M (2015) Bobcat
(Lynx rufus) as a model organism to investigate the effects
of roads on wide-ranging carnivores. Environ Manag
55:1366–1376
Lombardi JV, Perotto-Baldivieso HL, Tewes ME (2020) Land
cover trends in South Texas (1987–2050): potential
implications for wild felids. Remote Sens 12:659
Lombardi JV, Tewes ME, Perotto-Baldivieso HL, Mata JM,
Campbell TA (2020) Spatial structure of woody cover
affects habitat use patterns of ocelots in Texas. Mamm Res
65:555–563
Maehr DS, Land ED, Roelke ME (1991) Mortality patterns of
panthers in southwest Florida. Proc Annu Conf Southeast
Assoc Fish Wildl Agencies 45:201–207
Main MB, Allen GM (2002) Landscape and seasonal influences
on roadkill of wildlife in southwest Florida. Fla Sci
65:149–158
Marchand P, Garel M, Bourgoin G, Duparc A, Dubray D,
Mailard D, Loison A, Borger L (2017) Combining famil-
iarity and landscape features helps break down the barriers
between movements and home ranges in a non-territorial
large herbivore. J Anim Ecol 86:371–383
Marsh DM,MilamGS, GorhamNP, BeckmanNG (2005) Forest
roads as partial barriers to terrestrial salamander move-
ment. Conserv Biol 19:2004–2008
Martin AE, Fahrig L (2012) Measuring and selecting scales of
effect for landscape predictors in species-habitat models.
Ecol Appl 22:2277–2292
Marzluff JM, Ewing K (2008) Restoration of fragmented land-
scapes for the conservation of birds: a general framework
and specific recommendations for urbanizing landscapes.
Restor Ecol 9:280–292
123
Landscape Ecol
McGarigal K, Cushman SA, Neel MC, Ene E (2012) FRAG-
STATS v4: Spatial pattern analysis program for categorical
and continuous maps. University of Massachusetts, http://
www.umass.edu/landeco/research/fragstats/fragstats.html
McGarigal K, Zeller KA, TimmBC, Cushman SA (2016)Multi-
scale habitat selection modeling: a review and outlook.
Landsc Ecol 31:1161–1175
Medinas D, Marques JT, Mira A (2013) Assessing road effects
on bats: the role of landscape, road features, and bat
activities on road-kills. Ecol Res 28:227–237
Miller RG Jr (1981) Simultaneous statistical inference. Springer
series in statistics, 2nd edn. Springer, New York
Mimet A, Clauzel C, Foltete JC (2016) Locating wildlife
crossings for multispecies connectivity across linear
infrastructures. Landsc Ecol 31:1955–1973
Moraga AD, Martin AE, Fahrig L (2019) The scale of effect of
landscape context varies with the species’ response vari-
able measured. Landsc Ecol 34:703–715
Norwine J, John K (2007) The changing climate of south Texas,
1900–2100: problems and prospects, impacts and impli-
cations. CREST-RESSACA, Texas A&M University-
Kingsville, Kingsville, TX
Ordenana MA, Crooks KR, Boydston EE, Fisher RN, Lyren
LM, Siudyla S, Haas CD, Harris S, Hathaway SA, Tur-
schak GM, Miles AK, Van Vuren DH (2010) Effects of
urbanization on carnivore species distribution and richness.
J Mamm 91:1322–1331
Oxley DJ, FentonMB, Carmody GR (1974) The effects of roads
on populations of small mammals. Appl Ecol 11:51–59
Perotto-Baldivieso HL, Wu XB, Peterson MJ, Smeins FE, Silvy
NJ, Schwertner TW (2011) Flooding-induced landscape
changes along dendritic stream networks and implications
for wildlife habitat. Landsc Urban Plan 99:115–122
Pulighe G, Baiocchi V, Lupia F (2016) Horizontal accuracy
assessment of very high resolution Google Earth images in
the city of Rome, Italy. Int J Digit Earth 9:342–362
Riley SP (2006) Spatial ecology of bobcats and gray foxes in
urban and rural zones of a national park. J Wildl Manag
70:1425–1435
Roger E, Bino G, Ramp D (2012) Linking habitat suitability and
road mortalities across geographic ranges. Landsc Ecol
27:1167–1181
Romin LA, Bissonette JA (1996) Deer-vehicle collisions: status
of state monitoring activities and mitigation efforts. Wildl
Soc Bull 24:276–283
Schmidt GM, Lewison RL, Swarts HM (2020) Identifying
landscape predictors of ocelot road mortality. Landsc Ecol
35:1651–1666
Shephard DB, Kuhns AR, Dreslik MJ, Phillip CA (2008) Roads
as barriers to animal movement in fragmented landscapes.
Anim Conserv 11:288–296
Smith LL, Dodd CK (2003) Wildlife mortality on US highway
441 across Paynes Prairie, Alachua County, Florida. Fla
Sci 66:128–140
Snow NP, Williams DM, Porter WF (2014) A landscape-based
approach for delineating hotspots of wildlife-vehicle col-
lisions. Landsc Ecol 29:817–829
Sunquist ME, Sunquist F (2002) Wild cats of the world.
University of Chicago Press, Illinois
Tewes ME (2017) Clinging to survival in the borderlands:
ocelots face dwindling habitat and growing isolation. The
Wildl Prof, Sept/Oct, 26–29
Tewes ME (2019) Conservation status of the endangered ocelot
in the United States: a 35-year perspective. In: 37th Annual
Faculty Lecture, Texas A&M University-Kingsville,
Kingsville, TX
Tewes ME, Everett DD (1986) Status and distribution of the
endangered ocelot and jaguarundi in Texas. In: Miller SD,
Everett DD (eds) Cats of the world: biology, conservation,
and management. National Wildlife Federation, Wash-
ington, DC, pp 147–158
Texas Parks and Wildlife Department [TPWD]. Ocelot (Leop-ardus pardalis). https://tpwd.texas.gov/huntwild/wild/
species/ocelot/. Accessed 16 Sept 2018
Tiefenbacher JP (2001) A Rio Grande ‘‘brew’’—agriculture,
industry, and water quality in the Rio Grande Valley. In:
Miller C (ed) Fluid arguments—five centuries of western
water conflict: University of Arizona Press, Tucson,
pp 178–200
Thornton DH, Branch LC, Sunquist ME (2011) The influence of
landscape, patch, and within-patch factors on species
presence and abundance: a review of focal patch studies.
Landsc Ecol 26:7–18
Tremblay TA, White WA, Raney JA (2005) Native woodland
loss during the mid-1900s in Cameron County, Texas.
Southwest Nat 50:479–519
U. S. Fish and Wildlife Service [USFWS] (1982) Endangered
and threatened wildlife and plants; endangered status for
U.S. population of the ocelot. Fed Reg 47:31670–31672
van der Ree R, Smith DJ, Grilo C (2015) The ecological effects
of linear infrastructure and traffic: challenges and oppor-
tunities of rapid global growth. In: van der Ree R, Smith
DJ, Grilo C (eds) Handbook of road ecology. Wiley, West
Sussex, pp 1–9
Wiens JA (1989) Spatial scaling in ecology. Funct Ecol
3:385–397
Xie Y, Sha Z, Yu M (2008) Remote sensing imagery in vege-
tation mapping: a review. J Plant Ecol 1:9–23
Zeller KA, Wattles DW, Destefano S (2020) Evaluating meth-
ods for identifying large mammal road crossing locations:
black bears as a case study. Landsc Ecol 35:1799–1808
Zemanova MA, Perotto-Baldivieso HL, Dickins EL, Gill AB,
Leonard JP, Wester DB (2017) Impact of deforestation on
habitat connectivity thresholds for large carnivores in
tropical forests. Ecol Proc 6:21–32
Publisher’s Note Springer Nature remains neutral with
regard to jurisdictional claims in published maps and
institutional affiliations.
123
Landscape Ecol