laser sensor motion control system with application to engine
TRANSCRIPT

Laser sensor motion control system with application to engine valve seat metrology
Final Report
Project 5
Elizabeth Coon
Ryan Doss
Fletcher McCombie
Helen Sun
Mechanical Engineering 450, Fall 2007
Section 6: Professor Kurabayashi
December 11, 2007

2
Abstract
Auto-makers wish to improve the quality of newly assembled engine valve seats without
sacrificing time and production levels. Currently, they use dial gauges to manually
measure seat geometry. This process is time consuming and does not offer sufficient
accuracy (due to human error in measurements). In response, we will use a laser sensor
capable of making high accuracy measurements of seat geometry. Our main task will be
to design and fabricate a mechanism that positions the sensor around the valve seats
quickly and accurately. The intended outcome will be an automated, accurate, and quick
way of ensuring 100% seat inspection.

3
Contents Introduction ................................................................................................................................ 4
Information search ...................................................................................................................... 5
Customer Requirements ............................................................................................................. 8
Customer identification ........................................................................................................... 8
Customer requirement determination ....................................................................................... 9
Evaluation and comparison of existing methods ....................................................................... 9
Engineering Specifications ......................................................................................................... 10
Correlation of engineering specifications ............................................................................... 10
Establishment of engineering targets...................................................................................... 11
Concept Generation .................................................................................................................. 11
Functional Decomposition- FAST Diagram ........................................................................... 12
Concept Generation ............................................................................................................... 12
Concept Evaluation and Selection ............................................................................................. 14
Selected Concept ...................................................................................................................... 24
Engineering Analysis.................................................................................................................. 25
Positional Analysis ............................................................................................................ 29
Final Design ............................................................................................................................... 49
Manufacturing and Assembly .................................................................................................... 52
Testing ...................................................................................................................................... 59
Future Improvements ............................................................................................................... 62
Conclusion ................................................................................................................................ 64
References ................................................................................................................................ 65
Bios ........................................................................................................................................... 66
Appendix A: Quality Function Deployment (QFD) Diagram ........................................................ 68
Appendix B: Gantt Chart ............................................................................................................ 69
Appendix C: Smart ConoProbe Laser Sensor Technical Specifications........................................ 70
Appendix D: Fast Diagram ......................................................................................................... 73
Appendix E: Morphological Chart .............................................................................................. 74
Appendix F: Pugh Chart ............................................................................................................ 76

4
Appendix G: Bill of Materials ..................................................................................................... 77
Appendix H: Computer Aided Drawings of Selected Design Concept ......................................... 78
Appendix I: Engineering Drawings ............................................................................................. 80
Appendix J: Matlab code for vibration analysis .......................................................................... 88
Appendix K: Motion stage specifications ................................................................................... 89
Appendix L: Ensemble CP 10 Code and Technical Specifications ................................................ 95
Appendix M: Si Programmer Code and 3540i Driver Manual Website ........................................ 96
Appendix N: Selected Stepper Motor Specifications ................................................................. 97
Introduction
Automotive engine valve seats are the surfaces that intake and exhaust valves sit against
when the valves are closed during combustion. Valve seat position and orientation are
critical to determining engine life, performance, efficiency, and emissions. Improper
position and orientation causes leakage of heat and gases, degrading engine performance.
Therefore, thorough seat inspections are required before an engine is further assembled.
Currently, valve seat inspection is a time-consuming, costly process for auto-
manufacturers due to the conventional inspection device used: dial gauges. Dial gauges
are manually operated and therefore time consuming to use. They are not accurate
enough to ensure valve seats are of the proper geometry due to human error. Finally,
though the devices are inexpensive relative to the manufacturing process, the labor costs
are too high. In response, Dr. Vijay Srivatsan from the National Science Foundation
Engineering Research Center for Reconfigurable Manufacturing Systems (ERC/RMS)
has found that an existing non-contact laser sensor, the Smart ConoProbe (Appendix C),
has the ability to measure geometry accurately and quickly at a low cost. In order to
utilize the sensor’s accuracy and speed of data acquisition, Dr. Srivatsan asked us to
design and build a mechanism to quickly and accurately move the sensor around the
valve seat. Our system provides transverse motion of the sensor along the length of the
engine head and rotational motion of the sensor about the length of the engine head so
that the sensor can align its laser orthogonal to the valve seat (Figure 1). In addition, our
design had to compensate for external and internal disturbances such as vibrations from
the manufacturing floor and friction in mechanical parts. Our resulting prototype will be
a demonstrator to show to automakers.
To get an idea of how to design our mechanism around the sensor, we researched the
specifications from the ConoProbe manufacturer (Appendix C). To operate correctly, the
ConoProbe sensors must be located at an appropriate distance (75 + 8.5mm) from the
engine head. To ensure precision, the sensor must make multiple passes along both rows
of valve seats, which are oriented +26o from the vertical.

5
Figure 1: Isometric view of engine head and Smart ConoProbe sensor. The X-axis
is the translation direction of the Conoprobe laser sensor, and θx is the rotation of
the sensor about the X-axis.
Information search
Previous valve seat inspection techniques offer particular combinations of measurement
error, measurement time, motion range, and machine price. However, none of them have
the combination required for valve seat inspection: very low precision error (less than
one µm), short measurement time (less than one minute), and no excessive costs and
features (such as pressure regulation). The method proposed by our sponsor, moving a
single non-contact sensor around the valve seats, has the promise to achieve this
combination. Previous valve seat inspection methods include an air gauge mechanism, a
dial gauge mechanism to measure the concentricity, and a coordinate-measuring machine
(CMM). We include their benefits and drawbacks and compare them to our proposed
design.
One existing measurement machine, the air gauge system, uses a nozzle that discharges a
jet of air perpendicular to the measured surface to measure the distance between the
nozzle and a surface [1]. An amplifier reads the back pressure and the signal processing
tools converts the reading to an analog output, from which the valve seat radius and
runout can be extracted. United States patent 5533384 uses this measuring technique and
includes a mount (datum plane) for the nozzle and alignment and signal processing
devices (Figure 1) [2].
Engine head with eight valve seats Engine head with eight valve seats

6
Figure 2: Air gauge measuring device mounted on the engine head. The device uses
a nozzle which discharges air and measures the back pressure, which indicates the
object’s distance from the nozzle.
Benefits of the air gauge system are ease of use, ease of calibration, and low device cost
[3]. However, its low repeatability, caused by nozzle deflections during air discharges
and pressure fluctuations inside the nozzle, is not sufficient for high precision valve
applications, and its low measurement range does not span the valve seat outer diameter.
Also, measurement time for 16 valves is on the magnitude of minutes which is too high
to enable 100% in-line valve inspection.
Another existing measurement machine, the dial gauge system, uses a dial indicator to
measure displacements from its equilibrium position [4]. A probe indicator typically
consists of a spring-loaded tip which moves perpendicular to the body being measured.
The needle’s linear displacement in compression is converted to the angular displacement
of the dial needle. United States patent 4630377 uses this indicator to measure the seat
runout [5]. It is comprised of a rotating plunger that allows the probe to translate along
the valve seat axis and rotate 360° in order to measure the seat radius [Fig. 2]. This is
most widely used method for in-line valve seat inspection [6].
Benefits of the dial gauge method are ease of use (manual measurements), built-in
calibration with adjustable zeros, and low cost. Drawbacks are contact requirements for
measurements, low repeatability (human error is introduced to measurements due to the
dial readout), and long measurement time due to manual measurements.
The last existing machine, the CMM, measures in extreme detail the positions of an
object’s features on an XYZ grid so that a 3D image of the object can be created [7]. A
typical machine consists of many measuring probes/sensors (up to 48), a heavy granite
worktable, and guiderails and spindles for sensor motion [Fig. 3]. CMMs also come with
pressure and temperature maintenance capabilities. No CMM patents specifically for
valve seat inspection have been obtained [8].
Nozzle
Mount
Engine
head

7
Figure 3.a: Left, probe indicator has a spring loaded probe with a displacement
that is linear to the dial needle rotation. Right, the indicator with its mount on the
engine block.
Benefits of the CMM are high repeatability, quick measurements, and high measurement
ranges. Drawbacks are its large size, large weight, high relative device cost from the high
number of parts and capabilities/benefits, and the requirement that the measured object
must be transported to the worktable. In general, CMM’s are used for image generation
(such as reverse engineering CAD models of complex objects) while our design will be
used only for measuring seat angle and roundness. Thus, our design will be much
simpler, less costly, and more feasible for seat inspection.
Figure 3.b: Table-top coordinate measuring machine (CMM) uses a
guiderail, carriage, and spindle to move the sensor around an object and measures
its position.
The previous machines presented do not satisfy the current project application’s
requirements. For automated valve seat geometry inspection, the machine must have high
precision (less than 10 µm), be non-contact, and must be quick enough to ensure 100%
inspection of valves. Furthermore, it should not require engine head transport. Our
proposed valve seat inspection method would fulfill all of these requirements. It uses a
holographic laser sensor to measure the distance the light travels to the valve seat [9].

8
These measurements can be used to analyze angle and roundness of the valve seats. The
laser sensor is proprietary technology and functionality details are unavailable.
The sensor was provided by the customer and has performance specifications that are
suitable for the project application. It has sub-10 µm precision so that all valves are
consistently evaluated. Its high data acquisition rate of 3000 Hz enables quick
measurement, its measurement range of 17mm is adequate for measuring the diameter of
the valve, and its cost is almost one order of magnitude below that of the CMM.
Compared to the available technologies, only the sensor does not contact the engine head
and maintains high accuracy.
A summary of the performance benefits and drawbacks of the previously described
machines and the proposed machine sensor is shown in Table 1.
Table 1: Our proposed motion control mechanism using the Smart ConoProbe will
provide the most desirable performance for valve seat inspection.
Technique Precision
(µm)
Measurement
Rate (min/16
valves)
Measurement
Range (mm)
Cost
($)
Implementable
In-Line
Air gauge 127 1-5 up to 0.08
15-
100 No
Dial gauge 200 1-5 up to 12
20-
200 No
Coordinate measuring
machine <10 <1 up to 500 80,000 No Our motion
control design
using Smart
ConoProbe sensor <6 <1 up to 17 10,000 Yes
Customer Requirements
This section describes who our customers are, how we obtained their requirements, and
what the engineering requirements are for our motion control design.
Customer identification
Our direct customer, Dr. Vijay Srivatsan, is the sponsor and overseer of our project, and
has set the performance targets for our design. Our indirect customers are the automakers
(General Motors, Daimler Chrysler, and Cummins) who will be reviewing the design
prototype and concept. Though we do not have direct contact with them, their needs are

9
our most important requirements since they ultimately decide whether to use our motion
control concept in line.
Customer requirement determination
The customer requirements for our valve seat inspection design were created based on a
meeting with Dr. Srivatsan and Dr. Katz, Chief Engineer of ERC/RMS; the information
search; and our knowledge of the automotive manufacturing process. Most important to
Dr. Srivatsan are the system’s abilities to measure valve seat geometry accurately and
quickly, and to achieve 100% in-line inspection of seats. These requirements received
the highest importance weights in our QFD (Appendix A).
The next three customer requirements are of moderate importance. First, our system must
use only one sensor. Second, the system’s product life must be long enough to offset its
total capital cost. Third, the design must perform well under a variety of operating
conditions, including changes in vibration and temperature.
Our four final customer requirements focus primarily on our system’s ease of use. The
machine must be powered by a convenient power source for demonstration purposes,
preferably by a 110 Volt source. Second, to give our system flexibility to measure
different kinds of seats, our design must incorporate a user interface that allows
adjustments to our control settings by technical and nontechnical users. Third, the design
should be easily implementable into an assembly line. Fourth, we must be conscious of
cost during our design to make the proposal attractive to our automaker customers.
Following the definition of our customer’s requirements, the requirements were weighted
quantitatively by assigning a numerical value based on relative importance; these weights
are recorded in the QFD diagram (Appendix A)
Evaluation and comparison of existing methods
The benchmark products to which we compared to our customer requirements are those
that are currently in use for valve seat inspection: air gauges, dial gauges, and coordinate-
measuring machines (CMMs). They are evaluated in the QFD diagram (right-most
columns) against customer requirements on a scale of one to five, one meaning “does not
satisfy” and five meaning “satisfies perfectly.”
QFD results showed that the air and dial gauge mechanisms are not cost prohibitive, but
their accuracy, measurement speed, and compensation for disturbances are insufficient
for the valve seat inspection application. The CMM is accurate and quick but is costly,
not easily implementable into an assembly line, and overdesigned with too many
capabilities (3D images convertible to CAD files, pressure compensation, etc.) that are
not used for our application.

10
Engineering Specifications
Once all customer requirements were identified, we defined engineering specifications
that quantify them. The most important specifications (those that are the main targets of
our design) are the maximum measurement errors of our electromechanical mechanism
for both translational position and rotational position about the translational axis (Table
2). These errors are detrimental to the accuracy of the overall seat geometry
measurements, which is the main concern of our sponsor. In addition, we must design the
motion control mechanism positions the sensor as per the technical specifications of the
ConoProbe Sensor (Appendix C).
Three engineering specifications influence the design of the engine head support (used to
lock the block into place) during inspection, specifically, the maximum reference
displacement error between the sensor control output and the base reference, the damping
ratio of the fixture material, and the movement (play) of the engine head once the block
has been fixed. These properties will influence the machine’s accuracy of operation under
a variety of conditions and the precision of the system’s measurements.
Also of great importance is the time required for our system to move the sensor over all
sixteen valves at least once. This will influence the inspection time. Our target is for the
inspection of all sixteen valves to take less than one minute so that our design will be
faster than the conventional, dial gauge measurement method. In addition, the concept
needs to be capable of completing an adjustable number of passes in order to achieve
acceptable seat roundness estimates for in-line inspection.
In addition, the flexibility of our controller, quantified by the step size of the sampling
rate and the range of control over the translational speed, will impact the speed of our
sensor movements and the ease of use of our system to users who may wish to adjust our
original settings.
Finally, we will design our system to operate within a given temperature range (18~35
°C) during demonstration and future in-line use.
Correlation of engineering specifications
For each pair of customer specifications and engineering requirements, a correlation
value was entered into the QFD diagrams to indicate the strength of the dependence
between the specification and the requirement. Correlation values were assigned based on
a scale from one to nine, one meaning weakly related, nine meaning strongly related.
Once the correlation matrix was completed, the importance of each specification was
evaluated based on its weighted importance of the specifications it impacts. The
specifications are shown in Table 2 below.

11
In addition to correlation between specifications and requirements, we also cross-
correlated engineering specifications in the “roof” of the QFD diagram (Appendix A).
The correlations accounted for specifications that are complimentary and competing,
exposing indirect relationships between engineering specifications and customer
requirements.
Establishment of engineering targets
Once the specifications were defined for our subsystem, targets for each specification
were defined either directly by our sponsor or by the ConoProbe technical sheet
(Appendix C). These values are listed in Table 2 below and in the QFD diagram
(Appendix A). Parallel values for benchmark products are also listed in the “basement” of
the QFD diagram.
Table 2: Importance Ranking of Engineering Targets
Rank (1 =
most
important)
Engineering Specification Engineering
Target
1 Error for translational position (x) <1 μm
2 Error for rotational position (θ) <1 degree
3 Reference displacement error <1 μm
4 Cycle Time <30 sec
5 Control of translational speed 1E-6,000 mm/min
6 Damping coefficient of fixture material > 1
7 Number of passes sensor capable of making 1-16
8 Movement of engine head in x, y, and z directions once "fixed" <1 μm
9 Error for translational velocity (dx/dt) <1 mm/min
10 Sensor distance from engine head 51.5-68.5 mm
11 Step size of sensor sampling rate 1 Hz
12 Operational Temperature 18~35 °C
13 Input Voltage 110 Volts
Concept Generation
After we identified the customer requirements and engineering specifications, we created
a functional analysis system technique, or FAST, diagram (Appendix D) to define and
organize the functions our design needs to accomplish to meet the customer
requirements. We then created concepts that served the most specific functions in the
FAST diagram and listed them in a morphological chart (Appendix E) in order to
illustrate our options for accomplishing each function. These concepts were then broken
down into categories (e.g. mechanical and electrical) to help us identify the components
that can be used in our system.

12
Functional Decomposition- FAST Diagram
We generated a FAST diagram for our motion control mechanism design (located in
Appendix D). The diagram allows us to understand what our mechanism needs to
achieve to serve its main task, which is positioning the laser sensor relative to the valve
seats quickly and accurately. From the main task, we branched off basic and supporting
functions, where basic functions are essential to the performance of the main task and
supporting functions enhance product appeal to customers. These four basic functions
are:
1. Move the sensor
2. Record the sensor position
3. Record the sensor’s distance measurements
4. Secure the engine head
Moving the sensor relative to the engine head so that it scans across the valve seats is
necessary to allow the sensor to record position data at the valve seat locations.
Recording the sensor position is required for the post-processing algorithms our sponsor
is creating to calculate the valve seat geometry from the sensor output. Recording the
sensor’s distance measurements is also required to gather the data about seat angle and
roundness. Finally, securing the engine head is required to ensure that the valve seats are
at the same reference points relative to the mechanism’s base for all engine heads.
The supporting functions are focused on making the product reliable, easy to use, and
aesthetically pleasing. These can be achieved through robustness of performance in
varying environments, a simple user interface, conventional power plugs, methods to
increase measurement precision, and quickness of measurements.
Concept Generation
Once we determined the specific functions that our design must meet to measure seat
geometry, we devised high-level design concepts that perform those functions using a
Morphological chart (Appendix E). In the Morphological chart, each row represents a
function; columns are divided into electrical, mechanical, and other systems for ease of
comparison. Groups of rows are classified into several categories, based on the higher-
level functions to which they contribute. The classification groups are the following:
• Secure engine block
• Move sensor
• Record and control sensor position
• Record distance measurements
• Operate accurately in variable environment
• Easy-to-operate user interface
• Convenient to power
• Increase precision
• Decrease measurement cycle time

13
Representative concepts from each of these categories are described in the following
paragraphs, while illustrations of the rest are also included in Appendix E with the text
version of the Morphological chart. For many of these categories, one concept stood out
as the clear choice for our design, in which case this function-level concept was the one
chosen for all five of our final, system-level concepts.
Secure Engine Block: To secure the engine block, our most promising concept was a set
of pins attached to the base. The pin is not as expensive as other concepts like the
magnet, which is made of more rare material, or the clamp, which consists of a more
complicated geometry. Most of the pin’s cost comes from manufacturing its shape and
ensuring a strong attachment to the engine block. It is accurate because it is a rigid
attachment, it is easy to implement since the engine head already contains holes that the
pins can use to secure it, and it is easy to procure because pins are a universally available
part.
Move Sensor: To move the sensor in the linear direction, our most promising concept
was a linear motion stage. The motion stage is very expensive compared to the other
concepts, but provides the sub-micron accuracy that we need for our valve seat inspection
application. It requires some assembly for implementation into the whole system such as
screwing bolts into support structures and wiring for power and communication with a
controller, but these are not complex procedures that require many steps or special skills.
Motion stages are easy to buy online from companies like Aerotech and Danaher Motion.
Motion of the sensor in the rotational direction did not yet have a clear choice, although
one example is a stepper motor attached directly to the sensor.
Record and Control Sensor Position: In order to record and control sensor position, the
optimal concept was the stand-alone controller. It is more expensive than simple brush
motors but has multiple additional capabilities like speed control, multiple axis control,
and built in interfaces for computers. These capabilities allow for higher accuracy in
valve measurements by letting the sensor make more efficient and complex motion paths.
It is much easier to implement than other concepts since it has USB ports that connect
directly to the computer and to the stage. Finally, it is easy to procure online from
companies like Aerotech.
Record Distance Measurements: For recording the distance measurements, the optimal
concept was the laser sensor because its capabilities are suitable for valve seat inspection
- it is non-contact, has a very high sampling frequency (around 3000 Hz), and has a
moderate measurement range (17 mm). It is much more expensive than other concepts
like the Hall Effect sensor but its capabilities override those costs. Its accuracy error is on
the order of microns, compared to more than ten times higher error from Hall Effect
sensors. It is easy to implement because it comes with its own software that has a user
interface. The software allows you to gather data using the software or other programs
like LabView. Finally, it is easy to procure online and our sponsor has provided one.
Operate Accurately in Variable Environment: The most promising concept for
allowing our design to operate in a variable environment is done by accounting for

14
variations in vibrations, as this is the environmental change most detrimental to
measurement accuracy that our product will experience (as opposed to fluctuations in
temperature and air particulate levels). The best concept we devised to combat this is
using a granite or cast iron mounting block to support the engine head. This is cheaper
than using a fluid cushion, while at the same time providing reasonable compensation for
the damping that the engine head might experience. Furthermore, this concept would be
relatively easy-to-implement given its simple construction, and also easy to procure since
such a block is available from our sponsor.
Easy-to-Operate User Interface: The most promising concept for an easy-to-operate
user interface is a computer interface, with special attention being paid to making this
interface easy to read and understand. This is a relatively low-cost solution given that
LabView software is readily available in the computers that we are allowed to use. It is
accurate because it uses electric signals that have little response delay, and it is easy to
implement since the LabView integrates easily with data acquisition devices.
Convenient to Power: The best concept for powering our design conveniently is using a
conventional three-prong cable that is compatible with a 110V AC power source. Such a
connection is low-cost, given that it is so common. It is also very reliable and convenient
to procure, given that 110V is easily provided from a conventional wall outlet.
Support / Integrate assembly: Support of the assembly does not have a clear best option
and is explored in the system-level concepts later in this report, however one option is to
position the linear stage horizontally above the engine head and then mount the rotational
motion mechanism containing the sensor below it.
Follow Efficient Motion Path: The direct back and forth method (illustrated in the
pictorial Morphological Chart, Appendix E) is the fastest and therefore best option, as the
accuracy of all the models is the same. This method is the fastest because the linear
motion can be faster and better controlled than the rotational motion, and making as
many passes as possible with as few rotational movements as possible, which this method
accomplishes, is best.
Concept Evaluation and Selection
Once we generated concepts for each individual function, we combined these function-
level concepts into five concepts for the overall system. Once the system-level concepts
were generated, we compared their ability to complete each individual function with a
Pugh chart, which was used to determine one final concept that we will use for our
design.
For many of the functions, one function-level concept was clearly the best option, as was
described in the previous section. In these cases, all five system-level concepts contain
the same function-level concept. In addition, our sponsor has recently approved the
purchase of a linear motion stage with micro-precision due to the fact that the time and
level of difficulty associated with building such a motion stage ourselves is too great for

15
this project (given our machining skills and the machines that are available to us). For
this reason, all of our concepts assume the use of both the linear motion stage and the
ConoProbe sensor. Because of these constraints, the concepts primarily focus on two
functions: the integration and support of the linear motion stage and the control of the
rotational motion of the sensor.
Finally, these five concepts were generated at different points during the design process,
during which our requirements given by our sponsors were changing. Specifically, some
concepts were generated at a time in which our sponsor required only rotational motion
that would be manually locked into a few positions. For this reason, some concepts are
able to rotate the sensor with a motor and some concepts are only able to manually rotate
the sensor to discrete locations.
Of the five system-level concepts, three (Concepts # 2, 3, And 5) use the same general
assembly to support the linear motion stage horizontally above the engine head (shown in
Figure 4 below). The descriptions for these concepts then focus primarily on the
mechanism that will be attached to the stage in order to achieve rotational motion of the
sensor, and thus the individual concepts differ from the assembly concept is this fashion.
In contrast, Concepts # 1 and 4 have their own method for supporting the linear motion
stage.
Figure 4: Concept for the assembly of the overall system, including base, engine
head mount, and support of motion stage, used for concepts # 2, 3, and 5

16
System-level Concepts
Figure 5: System-level concept # 1
Concept # 1, used as the datum concept on the Pugh Chart (Appendix F) is shown in
Figure 5. This concept mounts the motion stage below the engine head, rather than above
it as the assembly in Figure 4 shows. The sensor is mounted onto a linkage that contains a
spring-loaded pin; the other end of the linkage is mounted onto the faceplate using a
crank and a bolt. The crank is used to rotate the sensor into two predetermined positions,
those of the two position holes. The sensor is unlocked from position by pushing in the
spring-loaded pin and then can be rotated with the crank. The major advantages of this
design are that it allows for continuous height adjustment (rather than height adjustment
in intervals) and an easy-to-use rotation mechanism. The major disadvantages are that is
can only provide rotational motion in discrete steps and that it is bulky, which means it
requires more power to operate and is not very aesthetically pleasing.
Figure 6: System-level concept # 2

17
Concept # 2 is shown in Figure 6. It consists of a T-bar bolted onto the motion stage
slider. The T-bar has a vertical slot and three series of holes following the path of three
arcs that are at different vertical positions on the bar. Attached to the bar is an L-shaped
linkage that can move in the slot vertically and can rotate about the pivot point at the
bottom of the linkage. This concept is easy to manufacture since there are no
complicated geometries. It is simple because it only has two main parts, it is easily
assembled onto the slider using just four bolts and nuts, and adjustment of the rotational
position is quick and easy with the spring loaded clamp. Two drawbacks are that, like
Concept #1, the rotational motion of the sensor can only be set at discrete steps and with
the circular arcs, the sensor can only be positioned at pre-prescribed focal lengths.
Figure 7: System-level concept # 3
Concept # 3 is shown in Figure 7 and consists of a motion stage mounted above the
engine head. It also consists of a T-bar bolted onto the motion stage slider. However, this
T-bar contains a slot and knob, which allows for continuous height adjustment of the
rotation mechanism. Mounted onto the t-bar is a sleeve that contains two positioning
holes. Inside this sleeve is a shaft that includes a spring-loaded pin. On one end of the
shaft there is a crank; on the other end of the shaft, the plate to which the sensor is
mounted is connected. The rotational position of the sensor can be adjusted by pushing in
the spring-loaded pin and turning the crank. The main advantages of this design are that it
is compact, easy-to-use, easily automated (the crank can be easily replaced with a motor),
and aesthetically pleasing. A benefit of its compact design is relatively low measurement
error due to vibrations. The disadvantages of this design are that the sleeve and shaft have
complicated geometries that are difficult to build and assemble.

18
Figure 8: System-level concept # 4
Concept # 4 is shown in Figure 8, and consists of a swivel-locking mechanism. The
engine head is oriented to stand up vertically. The swivel-locking mechanism consists of
two plates, each with machined slots which allows one plate to be bolted down to the
motion stage platform and one plate to the sensor. The plate on top, supporting the
sensor, is then allowed to rotate with respect to the plate on bottom by means of a
bearing. As shown in the figure, the inside of the bearing includes a locking mechanism
that allows the rotation of the sensor to be locked in one of three positions. In addition,
the machined slots in the plates allow both the axis of rotation and the distance of the
sensor to the engine head to be adjusted. Advantages of this design are its ease of use,
especially for rotating the sensor since it is not acting against the direction of gravity. In
addition, it consists of few parts that are simple to make. However, the design has many
drawbacks. With the sensor cantilevered out, and linear motion being in the vertical
position, micro-accuracy will be difficult to attain. The large moment of inertia of the
mechanism would be detrimental to its ability to resist vibrations. In addition, the locking
mechanism would be difficult to assemble, and the rotational component is not easily
implementable with a motor.
Figure 9: System-level concept # 5

19
Concept # 5 (shown in Figure 9) features an arch type track to guide the rotational motion
of the sensor and a linear motion stage held above the engine head. By constraining the
motion of the sensor with the track, it can be controlled by a stepper motor that drives a
lead screw. The lead screw is threaded through an internal thread on the plate supporting
the sensor. This entire mechanism is mounted on a plate that is attached to the linear
motion stage; thus, the entire mechanism is positioned by the linear stage, and the angle
the sensor makes with the engine head is controlled by the mechanism. The advantage of
this concept is that it allows for rotational motion about a non-physical point in front of
the sensor origin, the importance of which is described in the section below. The only
disadvantage of this system is the relative complexity of the design in terms of the
number of parts involved.
Comparison of System-Level Concepts: Once five concepts had been created, they
were then compared in terms of their ability to perform the functions required for our
overall design in a Pugh chart (Appendix F). These functions were weighted for
importance and these weights, combined with each concept’s ability to complete each
function, were used to compare the system-level concepts to each other. Each design’s
ability to accomplish a specific function was compared to Design #1 and then scored with
either a “+” if it was better at accomplishing the task than Design #1 was, a “–“ if it was
not as good, and an “s” if it was similar.
The most important function was the concept’s ability to control the motion of the sensor.
As stated earlier, one major requirement for this design is its ability to position the sensor
laser orthogonal to the surface containing the valve seat, as this provides the greatest
accuracy. However, due to the constraints on the distance between the sensor and the
surface (which must be ~60mm) and the geometry of the engine head itself, the sensor
must rotate about an axis that is not on the actual sensor body (as demonstrated in Figure
10). Thus, a concept’s ability to have an axis of rotation in front of the sensor has a
heavily weighted score. In addition, it was fairly important for this axis of rotation to be
non-physical, that is, to have no actual structure at the pivot point as the pivot point is
very close to the engine head and thus a physical pivot could interfere with the engine
head during motion.
Two more important functions for our design are the ability to rotate continuously
(instead of being locked into discrete positions) and the ability to easily incorporate a
motor to control the rotational motion, as our sponsor currently requires both. Although
our sponsors did not require these functions at the time that many of our concepts were
produced, these are currently highly desirable for our indirect customers, the automakers,
because the system’s ability to be entirely automated is its critical advantage over the
current inspection method, manual use of the dial gauge. Thus, the ability of each design
to complete these functions is weighted highly.
Many of the other functions are fairly straight-forward and involve other functions
required of our design having to do with the ability to focus the sensor and adjust its
position apart from the two controlled degrees of freedom, the ease of manufacturing of

20
the design, its cost, its aesthetic properties, its ability to maintain micro-precision, and its
robustness.
Once theses designs were compared with the Pugh chart (Appendix 6), Design #5 was
found to be the clear winner based on score. Design #5 was initially the best choice for
our design because it has several stand-out features:
1. High measurement accuracy due sensor orthogonality relative to valve seat
midpoints
2. Low risk of sensor interference with engine head due to non physical pivot
point/rotational axis
3. Controllability using a motor
4. Adjustability for different engine heads
5. Achievement of rotation range for given engine head without adjustments
6. Simplicity of parts
7. Robustness due to structural geometry
High Measurement Accuracy Due to Sensor Orthogonality Relative to Valve Seat
Midpoint: The first feature, maintaining sensor orthogonality relative to the valve seat
midpoint, optimizes the accuracy of the sensor’s measurements. The valve seat
dimensions measured by the sensor are extracted by geometry from the sensor’s focal
length measurements; therefore, angles closer to 90 deg between the sensor and the
measured surface requires fewer calculations to extract the measured dimensions.
Because the sensor beam is rotated about the point rather than translated through the
valve seat cross sections, the angle at which the beam hits each point on the valve seat
changes during rotation. Therefore, maintaining orthogonality between the beam and the
seat midpoint allows for angles closer to 90 degrees between the sensor and seat surfaces.
Low Risk of Sensor Interference with Engine Head: The second feature, using the
arch type track, allows the sensor to not only rotate about a point that is not on the sensor
body, but to rotate about an non-physical axis, that is, an axis without structure at the
location of the rotational axis (Figure 10). This is important because the axis of rotation is
close to the engine head and so a physical axis may interfere with the engine head itself
while the sensor moves.

21
Sensor focus
length
Engine head surfaces containing valve seats
Pivot point
(axis of rotation)
Sensor laser
paths
Arc path sensor origin
must follow in order to
scan both rows of valve
seats at 90º angles
Sensor (not to scale)
Figure 10: Schematic of non-physical pivot point.
Controllability using a Motor: The chosen design’s use of a lead screw through an
internal thread on the sensor support allows for easy control of the rotational motion of
the sensor with a motor. A stepper motor can be used to drive the lead screw with open
loop control. The same plate that contains the arch tracks provides a convenient location
to mount the motor.
Adjustability to Accommodate Different Engine Heads: The chosen design offers
adjustability of the sensor focal length and the vertical position of the pivot point to
accommodate measurements of different engine heads. Figure 11 demonstrates how the
focal length can be changed without changing the position of the pivot point. This can be
done by allowing the sensor to be moved with respect to its support. The effect of this
feature is that with an engine head that has valve seats oriented closer to the horizontal
plane, the sensor will be able to be moved closer to the seat surface to keep it within its
measurement range. At the same time, the pivot point location remains the same and
therefore, no clearance is sacrificed between the sensor and the surface.

22
Engine head surfaces
containing valve seats
Pivot point does
not change
laser
paths
Sensor Sensor motion when
focus length is adjusted
Adjustable
focal length
Figure 11: Schematic of adjustable focal length.
Figure 12 presents how the pivot point can be moved vertically. This is accomplished by
moving the plate containing the entire mechanism up and down with respect to the linear
stage it is mounted on. This feature’s effect is that with an engine head that has more
inclined valve seats, the entire plate holding the sensor can be moved up, allowing for
maximum clearance between the sensor and the surface and reducing risks of the sensor
interfering with the engine head.
Engine head surfaces
containing valve seats
Adjustable
pivot point
laser
paths
Sensor
Sensor motion when
pivot point is adjusted
Figure 12: Schematic of adjustable pivot point.
Achievement of Rotation Range for Given Engine Head without Adjustments: The
given engine head’s geometry was checked to ensure that the optical path length variation
during the rotational scan will not exceed the sensor’s measurement range (± 8.5 mm).
23
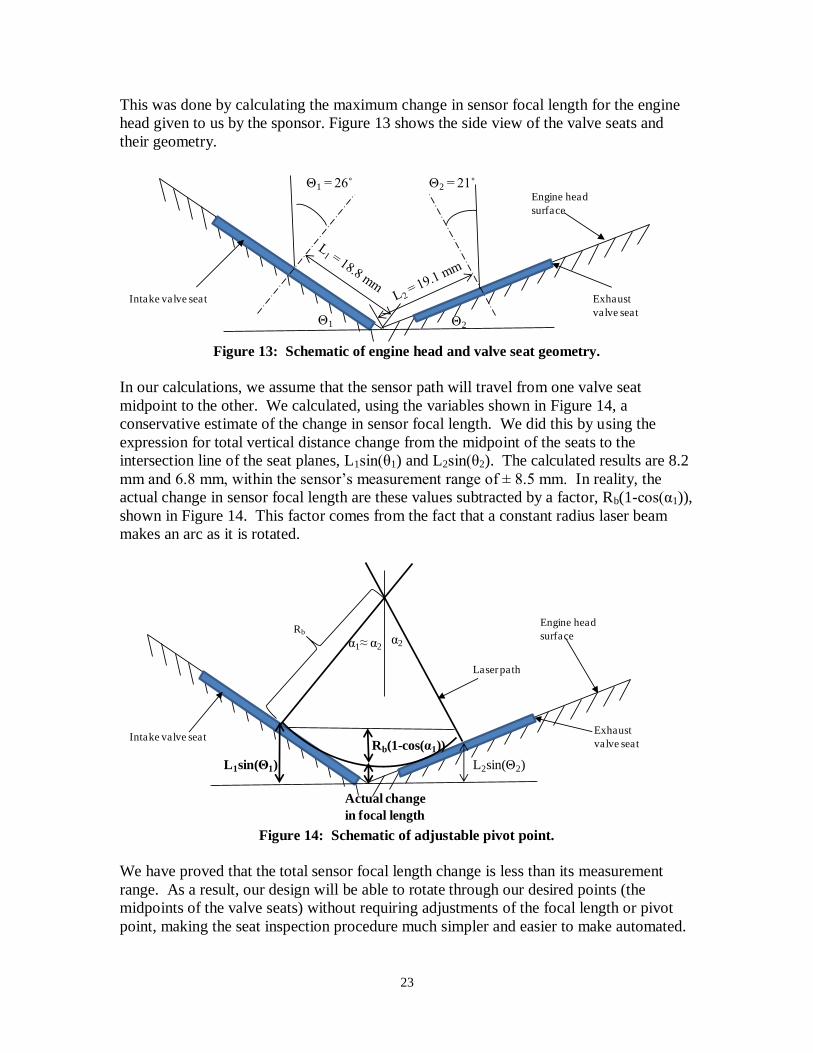
This was done by calculating the maximum change in sensor focal length for the engine
head given to us by the sponsor. Figure 13 shows the side view of the valve seats and
their geometry.
Engine head
surface
Intake valve seat Exhaust
valve seat
Θ1 = 26˚ Θ2 = 21˚
Θ2Θ1
Figure 13: Schematic of engine head and valve seat geometry.
In our calculations, we assume that the sensor path will travel from one valve seat
midpoint to the other. We calculated, using the variables shown in Figure 14, a
conservative estimate of the change in sensor focal length. We did this by using the
expression for total vertical distance change from the midpoint of the seats to the
intersection line of the seat planes, L1sin(θ1) and L2sin(θ2). The calculated results are 8.2
mm and 6.8 mm, within the sensor’s measurement range of ± 8.5 mm. In reality, the
actual change in sensor focal length are these values subtracted by a factor, Rb(1-cos(α1)),
shown in Figure 14. This factor comes from the fact that a constant radius laser beam
makes an arc as it is rotated.
Exhaust
valve seat
Engine head
surface
Intake valve seat
L1sin(Θ1) L2sin(Θ2)
Laser path
Actual change
in focal length
Rb
α1≈ α2α2
Rb(1-cos(α1))
Figure 14: Schematic of adjustable pivot point.
We have proved that the total sensor focal length change is less than its measurement
range. As a result, our design will be able to rotate through our desired points (the
midpoints of the valve seats) without requiring adjustments of the focal length or pivot
point, making the seat inspection procedure much simpler and easier to make automated.

24
Simplicity of Parts: The chosen design utilizes one part (the plate containing the tracks
and the motor) for many functions and thus assembly will not be difficult.
Robustness from Structural Geometry: Finally, with the chosen design, the linear
stage operates in a horizontal direction so that it does not compete with gravity, which
helps assure its fine precision. Because this concept is the only one that satisfies all of the
most important functions well and in a simple manner, it has been chosen for our final
concept. Most importantly, it enables the sensor to move accurately in an automated
method, making it distinctly appealing to our customers, the automakers.
Change in mechanism design: Since the original selection for our final concept, we
have modified the mechanism that controls the sensor position along the arch track. In
place of a lead screw driving an internal threaded bearing attached to the sensor mount,
the motor now rotates a beam that applies force on a slider attached to the sensor mount.
This design allows the motor to be placed below the track, which decreases the width of
the plate. This is important because when creating the final design, it became apparent
that there was a great need to reduce the width of the plate for structural reasons and the
height of the plate could be increased to accommodate the new motor position without
much consequence. This new mechanism design is shown below.
Selected Concept
In order to provide more clarity to our engineering analysis and final designs, we will
briefly describe the final concept in greater detail. Our selected concept, the arch shaped
track allowing rotation of the sensor about a non-physical pivot point, has four major
parts, shown in Figure 15:
1. The sensor mount/fine tuning adjustment
2. The arched track and plate with new mechanism described above
3. The plate mount
4. The motion stage supports

25
Figure 15: Drawing of assembled design including major components
The sensor mount/fine tuning adjustment consists of a U-shaped block with slots on the
sides. The sensor is bolted to the mount along the slots and can slide up and down with
respect to the mount.
The arched track and plate are connected as one rigid part. The plate is rectangular and
the arched track is an extruded arc. The sensor-mount slides along the arched track to
allow for rotation of the sensor. The motion of the sensor along the track is controlled by
the mechanism described above.
The plate support consists of two parallelogram plates and a horizontal plate. The three
plates are welded to each other. The horizontal plate is bolted onto the motion stage
slider. The parallelogram plates contain side slots on which the plate with the arched
track is bolted. The arched track plate can slide vertically with respect to the plate
support.
The motion stage support consists of two large, U-shaped bars that extend over the
motion stage. They are connected to the granite block via four L-shaped brackets.
Engineering Analysis
Once our final concept had been selected, we completed a detailed design of our system.
We identified design constraints and determined variables that are set through qualitative,
technical reasoning, and variables that are determined through quantitative engineering
analyses. Our design considers the following factors:
Sensor
Sensor
mount
Arched Track
and Plate
Plate
Mount
Motion Stage
Support
Motion
Stage

26
1. Spacing constraints from the ConoProbe sensor, engine head, and purchased
component geometries and specifications
2. Structural soundness (resistance to fatigue, yielding, vibrations)
3. Motor transmission effectiveness/efficiency
The table below lists the design variables, the type of analysis used to define them, and
the values determined for each one through analysis. We include descriptions of the
qualitative reasoning behind determining some of our mechanism’s dimensions in the
“Final Design” section, where they are included with the description of the components.
Next, we describe how the design variables were identified using a qualitative and
quantitative analysis.
Table 3: Variables to be determined by analysis
Variable Determined by Value
Mechanism material Qualitative analysis Aluminum 6061-T6511
Structural support material Qualitative analysis Carbon steel
Base material Qualitative analysis Granite
Motion stage selection Qualitative analysis Aerotech ATS 115
Small mechanical parts Qualitative analysis Mcmaster shafts, bearing,
track roller
Motor Motor torque analysis Sure Step Motor 23055
Roller/peg location on
sensor mount
Position analysis 15 mm from sensor top and
bottom, 23.5 mm from
sensor right and left edge
Track arc angle Position analysis 88.4º
Track width Position analysis 55 mm
Motor mounting position Position analysis 15 mm below track’s
bottom surface
Mechanism plate length Position analysis 224 mm
Mechanism plate width Position analysis 124 mm
Mechanism plate thickness Vibration analysis 25 mm
Motion stage support C
channel length
Structural analysis 300 mm
Motion stage support C
channel width
Structural analysis 80 mm
Motion stage support C
channel thickness
Structural analysis 13 mm
Motion stage support
vertical post height
Structural analysis 338 mm
Motion stage support cross
section dimension
Structural analysis 25×75 mm
Qualitative Analyses The qualitative analyses include material selection, motion stage selection, track roller
selection, and ball bearing selection.

27
Material Selection
Aluminum 6061-T6511 has been identified as the material of choice for all machined
parts for the system. This choice has been made for four main reasons. First, this material
is widely available in the shop we will use for prototype fabrication in a stock size that
will accommodate all pieces we need to machine (1 inch by 6 inch, or 25.4 mm by 152.4
mm). Second, aluminum is easy to machine and some of the structure supporting the
rotational motion of the sensor is somewhat complex. Third, aluminum has a high
strength to weight ratio, and thus we can reduce the weight of the structure supported by
the motion stage to ensure that we do not exceed the stage’s load limits. Finally, this type
of Aluminum is weldable, which is necessary for our design.
Granite was chosen as the material for the engine head base because of its ability to
attenuate external vibrations and because our sponsor requested that we use it.
Medium carbon steel was selected as the material to make the motion stage support.
Medium carbon steel was chosen for its high strength (yield and compressive strength
around 70 ksi), its low cost (around $0.3/lb), and its high availability in the shop and in
stores [CES EduPack 2007].
Motion Stage Selection
A purchased motion stage provides linear translation along a platform at the necessary
speeds and with micro-precision unattainable from our own manufacturing skills. Thus,
at the request of our sponsor, we selected and purchased a custom stage. Our purchased
linear motion stage is an Aerotech, Inc. model ATS115 with 600 mm travel. This model
meets all required engineering specifications which include repeatability, travel, speed,
load, and cost-effectiveness. Most importantly this linear motion stage is repeatable to 1
micron which is of primary concern of our sponsor. The travel of 600 mm is required to
scan a variety of engine heads which will have a maximum length of 500 mm. The
ATS115 is capable of moving a load of 40 kg at 250 mm/s. In comparison, we will be
using the motion stage to move a load of approximately 20 kg at 100 mm/s. The motion
stage is also low cost with high performance, making this model more attractive to our
sponsor which has purchased the motion stage for this project. Overall, the ATS115
meets all engineering specifications requested from our sponsor and set by our design.
The manufacturer specifications of the ATS115 can be found in Appendix K.
Track Roller Selection
The track rollers were selected by making a conservative estimate of the maximum static
and dynamic radial load each could experience. The maximum static load the rollers
should experience is the weight of the sensor divided by two (only the top two rollers
support sensor weight), or 0.4185 pounds. A conservative estimate for the dynamic load
is 5 pounds. A safety factory of two was employed, giving a minimum dynamic load
capacity of 10 pounds; it was later proven in the torque analysis that this load is 0.8516
pounds.

28
All track rollers available through McMaster Carr meet this load capacity and are
relatively inexpensive. Thus, the smallest size available was selected, given the
desirability of developing a compact mechanism, and the small average radius of
curvature about which the rollers must run (4.016”). A track roller can be seen below in
Figure 16.
Figure 16: Photo and schematic drawing of track roller
Table 4: Key track roller dimensions
A (Roller Diameter) 1/2"
B (Roller Width) 3/8”
C (Stud Diameter) 3/16”
D (Stud Length) 5/8”
Thread Size 10-32
Thread Length 1/4"
Max RPM @ No Load 11,500
Radial Load Capacity, Static 790 lbs.
Radial Load Capacity,
Dynamic
680 lbs.
Additional Hex head (good for blind-hole installation, and those
requiring greater tightening torque)
Crowned (slightly curved surface that compensates for
minor misalignment between the track and roller)
Item 3659K11
$19.33 each
Linear Bearing Selection
A linear bearing runs along the shaft that the motor spins, and is connected through a pin
to the sensor. A self-aligning bearing was selected, given that as the shaft is rotated, it
will tend to be misaligned with the bearing. The maximum horizontal load the linear
bearing could experience is that exerted when the sensor is at either edge of the arc: 2.57
pounds (see torque analysis). Given the desirability of a compact mechanism, the linear
bearing with the smallest outer diameter (1/2”) was selected. This bearing can support
horizontal load of 939 pounds, much less than any horizontal load we would expect
during the operation of our mechanism.

29
Figure 17: Dimensioned linear bearing
Table 5: Linear bearing dimensions
A (Outer Diameter) 1/2"
B (Overall Length) 3/4”
C (Distance between External
Ring Slots)
0.437”
Inner Diameter 1/4”
Static Horizontal Load Capacity 939 lbs.
Additional Self-lubricating
6061-T6 aluminum shell
0.002” ceramic coating for added corrosion resistance
Item 9533T1
$11.90 each
Quantitative Analyses
The quantitative analyses include positional analysis, arc geometry, arc and track
analysis, torque analysis, vibrations analysis, and structural analysis.
Positional Analysis
The positional analysis was used to identify key variables required to allow our
mechanism to be realizable and at the same time, to position the sensor quickly and
accurately around the given engine head. We started off by determining the geometry of
the arcs that the laser beam origin and the laser sensor center must make about the pivot
point (axis of rotation) in order to hit the desired beam positions and to be within the
sensor’s measurement range for focal length. During the process, the locations of the
pegs that connect the sensor to the arched track were set. Then, the track dimensions
were determined as well as the position of the motor using the concept of an effective
transmission angle. Finally, the dimensions of the plate that the track is rigidly connected
to were set, allowing us to calculate the clearance that our mechanism is able to maintain
between the sensor and the engine head.
Arc Geometry
The geometry of the arcs that the sensor must pass through and that the laser beam end
must hit was determined based on:

30
1. The valve seat orientations
2. The sensor standoff length of 60 mm and measurement range of ±8.5 mm
First, our goal is to have the laser beam be perpendicular to the valve seat plane when it
reaches the valve seat midpoint. This is shown in Figure 18.
Engine head
surface
Intake valve seat Exhaust
valve seatΘ2Θ1
Exhaust
valve seat midpoint
Intake valve seat
midpoint
Laser path
Figure 18: Laser hits both the intake and exhaust valve seat midpoints at 90 deg from the valve seat
plane.
To find the radius of the arc below the pivot point that meets this goal, we used an
assembly drawing of the engine head given to us by the sponsor (not shown for
proprietary reasons) and drew lines that intersected the valve seat midpoints at 90o and
intersected each other at a relative angle, θ, shown in Figure 19. From the assembly
drawing, we obtained the horizontal length between the lines at the engine head surface,
27.604 mm [see Figure 19], and extracted the angles 64 and 69 deg from the valve seat
inclination angles Θ1 and Θ2 . The angle θ is 47 deg since the angles in a triangle add up to
180 deg. We then used the law of sines to get x1 and x2:
604.27
)47sin()64sin()69sin(
21
xx
(1)
We found that x1=35.2 mm and x2=33.9 mm. To get the full radius of the lower arc, we
add e1 and e2 to x1 and x2, respectively, took their average, and got that Rb, the lower arc
radius centered at the pivot point and ending at the valve seat surfaces, is 45.96 mm.
Since the sensor standoff length is 60 mm, we want the total distance between the sensor
lens and measured surface to be 60 mm. Thus, the top arc radius centered at the pivot
point and ending at the sensor optical lens, Rt, is 60 – Rb = 14.04 mm. Figure 20 shows
this geometry.

31
Engine head
surface
Intake valve seat Exhaust
valve seat
Laser path
x1 x2
Θ1 = 26˚ Θ2 = 21˚
64˚ 69˚
27.604 mm
θ
Pivot point
e1e2
Figure 19: Schematic of variables used to determine the lower arc radius
Rb = 45.96 mm
Engine head surfaces
containing valve seats
Pivot point
Laser paths
Sensor
Rt = 14.04 mm
47˚
Sensor optical lens
Figure 20: Schematic of the radii of the arcs centered at the pivot point and
ending at the valve seat surfaces and the sensor optical lens
Peg Locations and Track Dimensions
Now that we have the arc radius Rt, we are ready to determine the locations of the pegs
on the sensor. The pegs are connected to rollers that sit on the arch track. To set the peg
locations, we looked at the length and width of the sensor, 85 mm and 94 mm. We
decided to use three pegs, two sitting on the top edge of the track and one sitting on the
bottom edge as shown below in Figure 21.

32
23.5mm
23.5mm
Sensor
Pegs
15mm
15mm 15mm
Sensor
midpoint
Figure 21: Peg positions relative to the sensor
To decide on the peg geometry, we looked at the benefits and tradeoffs of the number and
position of the pegs. Having many pegs improves the stability of the sensor motion
(since there are more contact points between the rollers and the track), but requires
precision manufacturing to locate them along the same arcs as the track. Having only a
few (two) pegs is easy to make, but is not as reliable since only two rollers take all of the
force applied by the motor. Since the motor will be providing a force at the midpoint
along the sensor length, that force gets transmitted to the pegs via moments, or the
distance between the pegs and the point of force application multiplied by the force at
each peg. From the moment balance, the more pegs there are, the less load each peg
receives from the motor. Thus, our choice of three pegs provides a middle point between
tradeoffs of reliability and ease of manufacturing. The locations of the pegs on the sensor
were chosen to be far from the midpoint of the sensor so that the moment arm of each peg
is sufficiently large that the force each peg sees is minimized, but not too far from the
sensor midpoint that the track would need to increase in length significantly.
From the positions of the pegs, we can get the dimensions of the arch track, specifically
the track chord length and thickness. The track thickness is the vertical distance between
the top and bottom pegs, which is 55 mm (calculated from the sensor height, 85 mm,
minus the two 15 mm offsets of the pegs). Finding the track chord length is more
complicated. Figure 22 shows the known dimensions of the track, sensor, and laser path
used to calculate the track length (the arc lengths at the top and bottom surfaces of the
track). From these dimensions, a triangle can be drawn to determine the chord length of
the track’s top arc.

33
Figure 22: Dimensions of track and sensor based on peg location and calculated arc geometry.
The top arc chord length is equal to the chord length of the arc passing through the sensor
midpoint and spanning 47 deg plus twice the additional chord lengths need to
accommodate the top pegs. The chord length of the arc passing through the sensor
midpoint is determined from Figure 22, where a triangle such as that in Figure 23 is
shown and the length is found to be 81.3 mm using the law of sines (see Eq. 1).
47˚
Pivot
point
Sensor
midpoint
at -23.5 ˚
rotation
from the
vertical
Sensor
midpoint
at 23.5 ˚
rotation
from the
vertical
66.5˚ 66.5˚
102.24 mm
Chord length
Figure 23: Triangle whose top length is the chord length of the arc
passing through the sensor midpoint
Next, we need to determine the horizontal distance between the sensor midpoint and the
right top peg when the sensor is tilted at its maximum of 23.5 deg (when the laser is
orthogonal to the valve seat midpoint), shown in Figure 24. This horizontal distance, x,
is equal to 23.5/cos(23.5) which turns out to be 25.63 mm.
Sensor
Arch Track
Pivot Point

34
23.5
23.5 mm
23.5
x
Figure 24: schematic showing the extra horizontal distance that the top pegs
add to the top track arc’s chord length
In addition, another 10 mm is added to the top arc’s chord length to ensure that the pegs
will not slide off of the track. Given the 81.3 mm chord length from the sensor
midpoints, the 2×25.63 mm and 10 mm additional length to accommodate the pegs, a
final chord length of 142.56 mm is found. The purpose of finding the track chord length
is to determine the dimensions of the plate on which the track is mounted.
Dimensions of Plate with Arched Track
The width of the plate with the arched track was found using the top track arc’s chord
length and the sensor’s range of motion allowed for focal length adjustment, and the
height was found using both the sensor dimensions, motor dimensions, and range of
motion coming from the sensor’s fine tuning mechanism. Both dimensions were made to
accommodate spacing constraints and to minimize the inertia of the plate.
We defined the plate width to be the top track arc chord length plus the extra horizontal
distance that the sensor sticks out of the track. Figure 25 shows the geometry of the
sensor when it is tilted a maximum angle of 23.5 deg from the vertical. Knowing that the
pegs are located 15 mm below the sensor’s top edge and that the sensor can be extended
along the 23.5 deg axis 10mm due to the fine adjustment mechanism, the total inclined
distance d in Figure 25 is 15 mm. Then, to get w, we simply added the distance of the
peg from the right sensor edge, 23.5 mm, and the thickness of the fine adjustment
mechanism, 9 mm, to get w equal to 32.5 mm.

35
s
θ
α
β
Plate
Right
Edge
Location of
right top peg
Figure 25: Geometry of sensor with maximum tilt of 23.5
o
Then, using basic trigonometry, the following equations were used to obtain the total plate width:
Where chord L is the top track chord length that we calculated from the previous section.
To determine the plate height, we did a force/position analysis to determine the
relationship between the transmission angle of the motor force and the distance between
the motor shaft and the center of the track. The angle β is defined as the angle between
the force perpendicular to the motor shaft and the component of that force tangent to the
center-of-track-arc. The ideal β value is zero, where all of the force from the motor is
used to move the sensor along the arc. Steps taken to obtain the relationship were:
1. Find the chord length of the arc going through the center of the track. Figure 26
and the equations below show that AL=96.86mm.
88.4o
45.8o45.8o
Pivot point
Arc made by center of
the track
L=69.74mm
AL
Figure 26: Geometry of center-of-track arc about the pivot point
mmschordLwidthplatetotal
mms
0.2247.40*256.142*2__
7.40cos41
63.690
43.52)25
5.32(tan
2.442
4.88
1
mmAL
AL
86.96
74.69
)8.45sin()4.88sin(

36
2. Find the angles that the force perpendicular to the motor shaft make with the
horizontal and vertical and the vector tangent to the center-of-track-arc. Figure 27
and equations below show that the angles add up to 90 degs.
Rm
F
θ
θβ
44.2o
Motor shaft position
Center-of-track arc
Figure 27: Geometry of center-of-track arc about the motor shaft
The relationship between transmission angle β and Rm is nonlinear, as shown by the last
equation. Plotting efficiency (1-β/90)*100 against the distance between the motor shaft
and the bottom-of-track arc, Rm-(track width)/2, Figure 28 is generated below.
Efficiency is defined as the percentage of motor force that is being used to rotate the
sensor.
)43.48
7.19(tan8.45
)2/
(tan8.45
2.4490
2.4490
7.19))2.44cos(1(
1
1
Rm
AL
Rm
mmL

37
-30 -20 -10 0 10 20 30 40 5020
30
40
50
60
70
80
90
100
110
Distance between Motor Shaft and Bottom-of-Track Arc (mm)
Eff
icie
ncy o
f M
oto
r F
orc
e (
%)
Figure 28: Plot shows relationship between the distance of the motor from the track’s bottom
surface and the force efficiency. Positive distances relate to the motor shaft positioned below the
track arc.
Figure 28 shows that if the motor shaft is placed at the same vertical position as the
bottom-of-track arc, the efficiency is still greater than 50%. That is, more than 50% of
the force applied by the motor is used to rotate the sensor while the rest is transmitted to
the bearings and is useless. We chose the motor shaft to be located 10 mm below the
bottom-of-track arc because it maintains about 65% force efficiency while not being too
far below the arc that it interferes with the engine head.
Using our selected motor’s dimensions and our chosen motor position, the height of the
plate with the arc track was determined to be 123.58 mm. Figure 29 shows the
dimensions. The space above the track, 25mm was set based on the amount that the
sensor stuck out of the track and the its adjustable vertical range from the fine tuning
mechanism.
Moto
r F
orc
e T
ransm
issio
n E
ffic
iency (
%)

38
Figure 29: Height dimensions of plate with arch track
Once the plate height was set, we checked that it does not interfere with the engine head.
Using the fact that the distance from the sensor optical lens to the engine surface is 60
mm, and that the lens is located 33.2 mm below the bottom-of-the-track arc, the clearance
between the plate and the engine was found to be 34.3 mm. This clearance provides
ample room for the plate to pass obstructions from the engine head.
Resolution of rotational motion: In order to determine the resolution angle for control
of the rotational motion of the sensor, we first derived an equation relating the angle the
motor has turned from the horizontal (θmotor) with the angle the sensor makes with the
horizontal (θsensor) by using the geometry of our mechanism. This equation was found to
be (with all angles in degrees):
Numerically differentiating this equation about a value for a sensor angle of 26 degrees
(the largest angle needed to inspect valve seats) and multiplying by the minimum angle of
rotation controllable by the stepper motor yields a value of 0.3 degrees/pulse, which is the
resolution for the control of our sensor rotation.
Motor Torque Analysis
Following the completion of the position analysis, we used the resulting geometry of the
sensor motion to calculate the torque needed by the stepper motor to control the sensor
motion. To do this, we consider the geometry as shown in Figure 30, as the greatest
amount of torque will be needed when the sensor mount is positioned at one of the
extreme ends of the arc.
Motor
Arch Track
Plate

39
Figure 30: Geometry of the motor torque analysis
As shown in Figure 30, there are two forces acting on the sensor mount: namely, gravity
(mg) and the force exerted by the motor (F). The torque T applied by the motor will be
equal to the product of the moment arm along the beam r and the resulting force F, or T =
F×r. Assuming that both the force F and gravity act at nearly the same point, the static
force balance on the motor yields the following equation.
Using values of r = 51.6 mm, β = 25.6 deg, and θ = 20.2 deg from the positional analysis
and a conservative mass m of 1.5 kg, the maximum torque T required is found to be 0.59
Nm, or 83.6 oz-in. This translates to a maximum force F of 11.4 N, which will be
transmitted to the rollers connecting the sensor mount and the arc track. Using these
results, we checked our purchased motor and bearing ratings to ensure that the maximum
torque and loads they can handle are larger than our values. The motor’s maximum
torque is 166 oz-in, which gives us a factor of safety of 2. The bearing’s maximum radial
load is 3024 N, which gives us a factor of safety of 796. Thus, our assumptions in
selecting purchased components are valid and the components will not fail during
operation.
Vibration Analysis
Because of the high level of precision required for the positioning of the sensor, any time-
varying deflections of the structure due to vibrations must be kept well under the total
tolerance of one micron in the x-direction (transverse motion of the linear stage). For this
reason, all of the parts have been designed as rigidly as possible and all mechanisms that
allow motion are clamped down during operation. This ensures the primary cause of
deflection is the elasticity of the material used for all parts. Because micro-precision is

40
not needed in the other two directions, vibrations have not been considered in the other
two directions.
The part that will cause almost all of the deflection is the plate supporting the mechanism,
as it must be both relatively large and supported only at two ends to allow both the
mechanism’s motion and vertical adjustment of the plate. Although the length, width, and
thickness of the of the plate and the material used to construct it will all affect its
vibration characteristics, we have limited the choice of material to Aluminum 6061-
T6511 (as described above) and we have limited two of the three dimensions of the plate
(the length and width) as being the smallest dimensions allowable by the position
analysis. This is to both limit the amount of structure that is hanging away from the
motion stage and make the design more aesthetically pleasing. Thus, the major design
variable to be determined from a vibration analysis is the necessary plate thickness.
Vibrations causing deflection of the sensor relative to the motion stage may be introduced
into the system three ways. The first is from the surrounding environment external to the
system. For this reason, we have included a thick granite base that should be capable of
dampening any vibrations from the environment (which should be small) to negligible
levels. The remaining two sources of vibrations are possible harmonic excitation due to a
rotating imbalance in the motor driving the motion stage and possible sudden
decelerations of the motion stage that will occur should the motion of the linear stage not
be perfectly smooth. Vibrations occurring due to non-smooth motion may arise due to a
sudden “shock” deceleration or a persistent driving harmonic excitation due to forces
such as friction.
Assumptions for vibration analysis: For the following analysis, the entire deflection in
the x-direction of the sensor relative to the motion stage is assumed to be caused by the
deflection of the plate supporting the mechanism. That is, the support structure mounting
the plate to the stage is assumed to be rigid due to its design. Furthermore, the motion of
the sensor is assumed to perfectly match the motion of the plate in the x-direction. This
means that the sensor will not move relative to the support it is bolted to, and the support
will not move relative to the plate it moves on. In order to ensure this, the sensor support
will be clamped to the plate during transverse motion of the stage, during which micro-
precision is needed. The validity of this assumption is supported by the fact that in the x-
direction alone, all displacement of the structure between the sensor and the motion stage
must come from compression or extension of very rigid structure of short length with the
exception of the deflection of the plate, which will deflect due to bending moment. Thus,
because the compression of a rigid structure of small scale is negligible compared to the
deflection of a plate in the out of plane direction, the focus of this analysis will be on the
plate itself.
Furthermore, this plate is assumed to be thin, as its thickness is approximately one order
of magnitude less than the other two dimensions, and the plate is assumed to behave as an
elastic structure with small deflections. The boundary conditions assumed for the plate
are shown in Figure 31 below. If we were to introduce a coordinate system u, y, and z,
where u is the out of plane deflection of the plate, y is the distance coordinate in the y-

41
axis, and z is the distance coordinate in the z-axis, then sides “a” would be considered
free (such that 0z
u
along each side “a”) and sides “b” would be considered clamped
(such that 0u and 0y
u
along each side “b”). Side “b” is considered clamped as it is
welded to a support (Appendix I.4) in such a way that there should be almost no
displacement and no rotation at the edge, and the support is then bolted down in such a
way that it should not move relative to the motion stage.
Figure 31: Boundary conditions for plate during vibration analysis
Vibrations due to harmonic excitation from motor: When a rotating mass has a
nonzero product of inertia (i.e. if the mass is not perfectly distributed about the axis of
rotation) harmonic excitation of the supporting structure may result. The response of the
structure is a displacement varying sinusoidally with time that is proportional to the
severity of the rotating imbalance. Figure 32 from Engineering Vibration by Daniel J.
Inman show the response displacement normalized by the strength of the rotating
imbalance (characterized by the ratio of the structure mass to the mass and eccentricity of
the rotating imbalance) plotted against the frequency ratio, or the ratio of the driving
frequency (the frequency of the motor driving the imbalance) to the natural frequency of
the system. Regardless of the damping ratio characterizing the system, the normalized
magnitude of the response appears to approach zero as the frequency ratio approaches
zero. Because the rotating imbalance of the motor should be small considering both its

42
size relative to the structure and the quality of the motion stage, ensuring a very high
natural frequency for our plate should ensure a negligible response to the harmonic
excitation from the motor.
Figure 32: Normalized magnitude of the response to harmonic excitation approaches zero as the
ratio of the driving frequency to the structure’s natural frequency approaches zero (taken from
Engineering Vibration, 2nd
Ed. by Daniel J. Inman)
The natural frequency (n) of a plate in rad/s with the boundary conditions assumed
above for out of plane vibrations is given by equation below (from [12]).
2
3
2
2
112
Eh
an
Here, a is the length of side “a”, E is Young’s modulus for the material, h is the thickness
of the plate, is the density of the material per unit thickness, is Poisson’s ratio for the
material, and is a vibration parameter dependent on the ratio of the lengths of sides “a”
and “b” and the boundary conditions (from [12]. For this equation, all material constants
are based on Aluminum 6061-T6511 [13], and all parameters depending on the geometry
and boundary conditions are based on the geometry and assumptions that have already
been listed. Thus, the only parameter that needs to be determined is the plate thickness h.
Figure 33 shows the resulting damping ratio of the plate as a function of its thickness.
The damping ratio is based on a driving frequency of 10 Hz (63 rad/s), as given the pitch
of the screw driving the motion stage and the maximum transverse speed required for our
design, this is the maximum driving frequency that will be encountered.

43
0.01 0.015 0.02 0.0250.006
0.008
0.01
0.012
0.014
0.016
0.018
0.02
Thickness (m)
Fre
quency R
atio
Figure 33: Frequency ratio decreases with increase in plate thickness
As shown above, the frequency ratio is very close to zero and continues to decrease as the
plate thickness increases. Although the plate thickness cannot exceed 25mm due to the
thickness of the stock that will be used to construct it, choosing a thickness of 25 mm will
provide a frequency ratio of ~0.007, which ensures negligible response to harmonic
excitation.
Deflection due to non-smooth motion of linear stage: If the motion stage maintains a
constant velocity, the motion of the sensor should exactly match the motion of the linear
stage. However, if the sensor experiences an acceleration or deceleration relative to the
motion stage, then the plate could deflect such that the actual position of the sensor will
not match the location of the motion stage. Such deflection can be modeled by
determining the equivalent force acting on a plate due to the accelerating masses of the
plate, sensor, mount, and external track, and then modeling the plate as an Euler-
Bernoulli beam to determine the resulting maximum deflection.
The mass of the plate, when subjected to an acceleration (or when the ends of the plate
are subjected to a relative deceleration) will create an equivalent force that can be
modeled as a distributed force over the length (a) of the plate. The total mass of
everything mounted on the plate, conservatively estimated at 2 kg from the density of the
material, the geometry of mount and track, and the mass of the sensor, is then modeled as
a point force acting at the middle of the plate, which is the worst case scenario for
deflection. This model is shown in Figure 34 below.

44
Figure 34: Deflection of plate modeled as Euler-Bernoulli beam under distributed
load from plate inertia and point force from inertia of objects mounted on plate
This deflection can be calculated by superposition of the deflection due to the distributed
load and the deflection of the concentrated load. By assuming an acceleration of 1 g for
our initial analysis, the deflection u can be calculated by equation below, taken from the
superposition of two equations from the databook for course ME 382 at the University of
Michigan.
In this equation, m is the mass of all objects mounted on the plate, g is the acceleration
due to gravity, I is the moment of inertia of the plate about the y-axis, and all other
parameters are the same as for the equation for natural frequency. This 1 g deflection, as
a function of the plate thickness, is shown in Figure 35 below.

45
0.01 0.015 0.02 0.0250
0.5
1
1.5x 10
-6
Thickness (m)
Deflection (
m)
Figure 35: Deflection of plate under 1 g load decreases with increasing plate
thickness
As shown above, the plate deflection crosses the 1 micron threshold at a plate thickness
of 11.5 mm and decreases all the way to 0.12 microns at a plate thickness of 25 mm.
Because an increase in plate thickness improves the deflection characteristics of the plate
under both harmonic excitation and rapid deceleration, the maximum plate thickness
allowed by the stock material (25 mm) has been chosen for our design. Once this
thickness had been chosen, we calculated deflection of the plate as a function of the
deceleration of the plate supports (in g’s), the results for which are shown in Figure 36
below.

46
1 1.5 2 2.5 3 3.5 4 4.5 5 5.5 61
2
3
4
5
6
7
8x 10
-7
Deceleration (g's)
Deflection (
m)
Figure 36: Plate deflection stays within sub-micron range for a large range of
motion stage decelerations.
As shown above, the maximum deflection of the plate should stay within 0.5 microns for
all motion stage decelerations up to 4 g’s, which is well beyond any loading the stage
should experience during normal operation.
Therefore, a plate thickness of 25 mm ensures that the plate will be almost entirely
unaffected by harmonic excitation from a potential rotating imbalance of the motor
driving the stage, or any harmonic excitation of a reasonable driving frequency, and that
the plate will deflect half a micron or less for all loads on the motion stage that may arise
from non-smooth motion of up to 4 g’s.
Finally, to consider vibration response due to harmonic excitation during unsmooth
motion, we will look at the case where the plate thickness has been set at 25 mm. From
the natural frequency equation above, the natural frequency for this system (converted to
Hertz) in the x-direction should be 1500 Hz. The resonant frequency, as a function of the
damping ratio and natural frequency for the system, is given by equation below (from
[11]).
Similarly, the normalized magnitude of the harmonic response of a one dimensional
response is given by equation below (from [11]).

47
In this equation, X is the displacement response, k is the stiffness of the system, and F is
the magnitude of the force driving the harmonic excitation. By taking the stiffness of this
case to be the inverse of the slope from Figure 36 and setting the threshold displacement
response at 0.5 microns, we can solve for the loading (F) in g’s as a function of the
damping ratio. Plotting the resulting loading against the resonant frequency needed to
drive that response for a range of damping ratios from 0 to .707 yields Figure 37. A range
of damping ratios is used for this plot because the actual damping ratio for the system is
not known.
200 400 600 800 1000 1200 1400 16000
0.5
1
1.5
2
2.5
3
3.5
4
4.5
Required frequency to drive resonance (Hz)
Maxim
um
loadin
g (
g's
)
Figure 37: Threshold magnitude of driving loading as a function of required driving
frequency for threshold displacement of 0.5 microns
This figure shows the magnitude of the loading driving the harmonic excitation that
would be required to exceed a 0.5 micron response against the driving frequency required
to force the resonant response in the system for the range of damping ratios listed above.
This shows that in order for the plate to deflect 0.5 microns in a worst case scenario, the
driving harmonic excitation must either have a very high magnitude or a very high
frequency. For example, if a driving frequency of 1000 Hz was somehow achieved, the
magnitude of the driving loading would still have to be at least 3.7 g’s for the
displacement response of the plate to be half a micron. Because the driving harmonic
excitation should not come close to approaching these combinations of frequencies and

48
magnitudes, this structure should suffice for the required precision of the sensor
displacement.
Motion stage support structural analysis
The support structure consists of a granite block, four 6061 aluminum vertical posts, and
two T6061 aluminum top supports. The granite block is 65 x 65 x 4.5 cm and is used to
isolate the inspection device from external vibrations. Four vertical posts rest on the
granite block. On each set of two vertical posts sits one top support (see Figure 15, p. 24).
The posts and the top support were chosen to minimize deflections of the structural
support under the load of the linear stage. The motion stage is 10 kg, the sensor is 0.5 kg,
and aluminum mounted materials including the arc motion plate are 5 kg. Thus, a total of
15.5 kg must be supported by the four vertical posts and top support.
First a stress analysis was done on the vertical posts to confirm that a dimension of 2.5cm
x 7.5cm could be used for the top support. This dimension was chosen based on available
raw materials and confirmed by a stress analysis for 6061 aluminum beam under the
fixed-free condition. The vertical support with the loading force is shown in Figure 38
with an area of 19 cm2, modulus of 70 GPa, and resulting strain of 10
-6. Following this
analysis the dimensions of the top support were set based on the criteria for mounting the
motion stage. The motion stage has bolt holes located 50 mm apart along the length of
the engine head and at 100 mm apart in the traverse direction. This set minimum
requirements of the top support to be 5 cm x 13 cm (w x L). The final dimensions of the
top support will be 8cm x 30cm (w x L) based on a deflection analysis illustrated by
Figure 39. We also have a thickness (t) to the top support of at least 13 mm to support
holes for 0.25 inch bolts. This allows ample room for bolting the vertical posts, top
support, and motion stage together. The results of this analysis provided a second
moment of inertia (I) of 156 mm3 and a max deflection at the center of the top support of
0.01 mm. This deflection is minor when compared to our measurement range of 8.5 cm
therefore the aforementioned dimensions will provide a solid support structure for our
prototype. We expect to see our results of deflection minimization for both initial
demonstration purposes and recurring operation.
Figure 38: Fixed-Free diagram
with force on vertical support
Figure 39: Fixed-Fixed diagram with force on top support, max
deflection shown at center of beam
Aluminum 6061

49
An assembly analysis provided a confirmation that the previously chosen dimensions
would allow for assembly of the granite, four vertical posts, top support, and the linear
motion stage. The vertical posts will be connected to the granite block by bolted L
brackets. The top of the vertical posts are connected to a top support by two bolts on each
post. These top supports support the linear motion stage, which will have in total 8
connection bolts between the top support and motion stage. We will be purchasing the
granite block and raw materials for the vertical posts and top support. We will then mill
holes to fit the aforementioned connection bolts.
This support structure is created for the ATS 115 Linear motion stage from Aerotech, Inc.
It is unlikely that the motion stage can be easily replaced with a different model.
However, the diverse operations of our system are allowed by adjustability in the sensor
system attached to the slide of the motion stage.
It should be noted that the support structure was changed during the manufacturing
process to be made of 1018 mild steel. This steel will provide greater rigidity while
adding minimal cost. For the structure the rigidity is most important, while added weight
is not of concern as it does not appear in our engineering goals. Dimensions are kept
constant and the only change on the above variables is the modulus of elasticity value has
increased from 70 GPa to 210 GPa. This factor of three between moduli of elasticity
lowers the stress in the structure by a factor of three and decreases the maximum
deflection of the top support. Thus, by selecting mild steel we have improved the support
system while not addition significant cost.
Final Design
The final design consists of four major components that allow the sensor to rotate and
translate about the valve seats and that support the motion stage on which our mechanism
is mounted. Figure 15 shows a complete assembly of the design, including the four parts
that we designed: the fine tuning mechanism, arch track and plate, plate support, and the
motion stage support. Each part is described in detail below from the laser sensor to its
connections to the motion stage, granite base, and finally the engine head that the sensor
is measuring.
Sensor mount / fine tuning mechanism
The laser sensor is oriented so that the optical lens faces downwards and is connected
with bolts to the sensor mount assembly. The mechanism allows for adjustment of the
distance between the sensor and the surface of the engine head for focusing purposes (see
Figure 40) and allows for mounting rollers into the plate. This part consists of the sensor
plate (Appendix I.1), onto which the sensor is mounted that slides within the sensor
mount bracket (Appendix I.2). Once the position of the sensor has been adjusted, the
plate can be locked down relative to the bracket by tightening bolts that are fed through
slots machined into the bracket and threaded into the plate containing the sensor mounts.
These two parts were designed such that they are as small as possible while still being
large enough to easily hold the sensor, thick enough to thread screws into, and rigid
enough to ensure negligible displacement of the sensor at any time. The mechanism has

50
three track rollers screwed into it and is attached to the arched track and plate through the
rollers. The bottom roller is adjustable with a set screw such that the rollers can be
clamped down tighter on the external track to allow less play and ensure smoother
motion.
Figure 40: Sensor Mount Bracket
Figure 41: Arched Track
Arched track and plate
The arched track (Appendix I.3) enables the rotation of the sensor about a non-physical
pivot point. It consists of an extruded track with a constant radius arc, along which the
sensor mount will move (see Figure 41). The track width and radius were determined
with the positional analysis in the previous section. Its thickness was determined from
the thickness of the track rollers (9.5 mm).
Plate support and motion stage attachment
The plate support (shown below in Figure 42) is designed to attach the arched track and
plate to the moving platform of the linear motion stage. This support has been designed
such that the plate can be moved up and down relative to the engine head in order to
adjust the pivot point/axis of rotation of the mechanism (see Figure 12). This support has
also been designed such that the arch plate is fixed on two edges to minimize vibrations
(as described in the vibration analysis section). This fixture is achieved by bolting each
side of the plate to triangular support pieces (see Appendix K.4). These triangular
supports, in turn, are bolted down to the motion stage attachment (see Appendix K.5),
which is bolted down to the motion stage. By bolting or welding everything down and
providing considerable rigid support in the x-direction by use of the triangular support,
the motion of the sides of the arch plate should have only negligible deflections (much
less than a micron) compared to the position of the motion stage, which will validate the
assumptions made for the vibration analysis.

51
Figure 42: Arched track mounted to plate supports and linear motion stage.
Motion Stage Supports
The motion stage supports position and support the motion stage above the engine head.
It consists of two U-shaped supports consisting of a top support (Appendix I.6) and side
supports (Appendix I.7) that extend over the top of the stage, onto which the stage is
bolted using predefined holes on the stage. The width of each beam is greater than the
width of the motion stage, allowing for increased stability in the transverse direction
(along the engine head width). This stability is essential because the sensor is usually
rotated off-center from the middle of the motion stage, creating a moment about the x-
axis. Each beam is attached to the granite block base using L-brackets (Appendix I.8)
and bolts.
The granite base is a rectangular block on which all system parts are mounted. The
engine head is mounted upon 8 vertical pins that protrude through the granite base. The
motion stage supports are bolted onto the base so that the length of the motion stage is
positioned directly along the length of the engine head.
Addition of Motor and Transmission
A stepper motor is used to drive the sensor’s rotation. The transmission from the sensor
to the motor uses a shaft that is screwed onto the sensor mount (see Figure 43). From the
sensor mount, the shaft runs through the thickness of the arc plate in the middle of the arc
track. The side of the shaft shown in Figure 43 rotates within a cylindrical sleeve that sits
within a housing that contains a linear bearing that is directed perpendicular to the sleeve.
The bearing rides along a second shaft which is rigidly connected to the rotating motor
shaft. This is done using set screws through the second shaft. The rotary stepper motor
is mounted on the back of the arc plate at the vertical centerline of the arc track. The
motion of the motor and thus, the sensor is controlled using a controller from Applied
Motion Products and the Si Programmer. The Si Programmer contains simple motor
commands. Useful commands that were used on our motor for demonstration purposes
are included in the Appendix.
Sensor Arched Track
and Plate
Plate
Mount
Motion
Stage

52
Figure 43: Prototype transmission
Finally, the roller mechanism also contains a pair of rollers on the back side of the arch
plate that are rigidly connected to the shaft running through the plate such that these
rollers can be used to hold the sensor mount tight against the plate. These back side
rollers prevent the rollers on the track from binding up. They act to support the moment
caused by the motor shaft and thus allows smooth motion and control of the sensor
mechanism via the stepper motor.
In summary, our final design allows a user to scan all 16 valve seats by controlling the
motion of the sensor both along the engine head length and width. The device can
accommodate a variety of engine head sizes, given its open geometry and the ability to
adjust both the focal point and fine-tune focus of the sensor. In addition, it maintains a
clearance between the sensor and the engine head that allows for non-contact
measurements to be taken. All of the sensor’s motion is controllable due to the use of a
motor and linear stage, allowing for adjustability of speeds and positions. Finally, our
design is justified using sound engineering analysis and reasoning, ensuring a high level
of reliability. Our design’s combination of adjustability to accommodate different engine
heads, controllability of sensor motion, high reliability, and micro-precision and
accuracy, and most importantly, its ability to be automated and quick at measuring valve
seat geometry, makes it a viable and desirable concept for our potential customers, the
auto manufacturers.
Manufacturing and Assembly
The following describes the steps we took to fabricate our prototype. Our product is not
intended for mass production, thus the manufacturing details below are suitable for small
scale fabrication. Note that the engine dimensions made for this mechanism are
confidential and thus, are not included in the report.
Sensor mount
The first piece of the sensor mount, the sensor plate, was machined by hand on a milling
machine out of 1/2 inch by 6 inch Aluminum 6061-T6511 stock using a ¾” end mill.
Following milling, the two holes were drilled and countersunk also using the mill.
Cylindrical
sleeve
Stepper
motor
Shaft rigidly
connected to
motor shaft

53
The second piece of the sensor mount, the sensor mount bracket, was machined out of 1
inch by 6 inch Aluminum 6061-T6 stock by use of a CNC mill in the ERC with the help
of Steve Erskine. The slots in this piece were then milled out with a ¼” end mill in the
student machine shop. Finally, the body holes on the back of the bracket into which the
top two rollers are threaded were drilled and tapped with a 6-32 tap. However, for the
bottom roller, a slot 10 mm long was milled to allow the position of the roller to be
adjustable in order to “tighten” the rollers on the outside track. A countersunk slot was
machined on each side in order to allow a pair of machine nuts to hold the roller tight to
the sensor mount bracket. In addition, a ¼” hole was drilled 3/8” deep into the backside
of the sensor mount bracket for the shaft that will ultimately control the bracket’s
movement to be placed. Finally, a set screw was added through the bottom of the plate
such that it could be tightened onto the shaft of the bottom roller, thus allowing the
bottom roller to easily be tightened onto the external track.
Once both parts were made, the sensor was fastened to the sensor plate using two M4
fasteners, the sensor plate was fastened into the sensor bracket using four ¼” -20 thumb
fasteners (for easy adjustment), and the bearings were threaded into the sensor mount.
Finally, once the arch plate had been made, the roller bearings on the sensor mount
assembly were slid onto the external tracks and the shaft was fed through the slot in the
plate into the hole in the back of the sensor mount. When it was determined that the shaft
did not fit tight enough, the end of the shaft was drilled and threaded with a 4-40 tap and
a screw was fed from the front side of the sensor mount bracket through a smaller hole in
the bracket and into the shaft, which was then tightened.
Sensor Mount
Figure 44: Prototype Sensor Mount

54
Arc Plate
Arc plate and support assembly
The arc plate, made out of 1 inch thick Aluminum 6061-T6511 stock, was first squared
into the dimensions of the plate shown in the engineering drawings using a mill. Then,
four holes for the motor mount were drilled through the plate. Following this, a reference
point (a small hole) was drilled into the point on the plate where the motor shaft is
located. This point was used to center the plate on a rotary table around the pivot point
(since the length from the pivot point to the reference point is 32.34 mm). Once the plate
was secured on the table, the track was milled out using a ½” end mill. At this point, the
ends of the arc were not cut off yet. Cutting the arc ends was left as the last step to since
it left room at either end of the arc to make adjustments in machining the grooves. Then,
a T-slot cutter was used to cut the grooves along which the track rollers would rest. The
depth of the grooves was made slightly less than the depth of the rollers to allow for a
tight fit between the top and bottom rollers. Finally, the arc ends were cut with ½” end
mill by first zeroing the angle on the rotary table along the vertical midpoint axis of the
plate. Then, after rotating the plate 25° and -25°, the end mill was used to cut off the arc
ends.
Following the completion of the arc plate, the two triangular supports were milled out of
1/2 inch by 6 inch Aluminum 6061-T6511 stock. The slots were milled using a ¼” end
mill, and the two body holes used to fasten the supports to the arc plate were drilled.
After drilling and tapping the corresponding holes in the arc plate with a ¼-20 tap, the
supports were then fastened to the arc plate.
Figure 45: Prototype Arc Plate Figure 46: Prototype Support Assembly
Motion stage attachment
The motion stage attachment was be milled out of 1/2 inch by 6 inch Aluminum 6061-
T6511 stock; the four attachment holes for the motion stage and the 8 attachment holes
for the arc plate supports were also drilled and tapped using the mill. Then, the arc plate
support assembly was bolted to the motion stage attachment using 8 thumb fasteners and
the attachment was bolted to the motion stage using 4 M6 bolts.

55
Figure 47: Prototype Motion Stage Attachment
Top support: The top supports were made out of 15” pieces of 1” by 3” steel stock by
simply drilling the necessary attachment holes into it using a mill.
Figure 48: Prototype Top Supports
Vertical supports: The vertical supports were made out of 15” pieces of 1” by 3” steel
by simply drilling, and if needed, tapping, the necessary attachment holes.
Figure 49: Prototype Vertical Supports

56
Structure Assembly: First, attachment holes were drilled into the granite block with a
½” masonry bit and ½” anchors were placed into the holes at a depth of 3”. Then, the
purchased L-brackets were fastened to the granite using the anchors and the four vertical
supports were fastened to the four L-brackets using ½” bolts and machine nuts. Next, the
top supports were fastened to the vertical supports by use for two ¼” bolts for each
vertical support. Finally, the motion stage, with everything attached to it, was bolted to
the top supports by use of 4 ¼” bolts for each top support for a total of 8 ¼” bolts
supporting the motion stage.
Figure 50: Prototype Structure Assembly
Mechanism transmission: In order to fasten a shaft perpendicular to the motor shaft, a
small adaptor was made out of 3/8” round aluminum stock. First, a ¼” hole was reamed
into the cylinder both into one end and through a side perpendicular to it. The motor shaft
was then inserted into the side hole, and a piece of ¼” steel stock, sanded down, was
inserted into the end hole to compose the shaft. This piece was then tightened down to
both the motor shaft using three 6-32 set screws and the steel shaft using one 6-32 set
screw.
Next, a small piece containing both the linear bearing through which the first shaft is fed
through and a sleeve bearing in which the second shaft (attached to the sensor bracket)
rotates was made out of ¾” round aluminum stock. To start, a ½” hole was drilled
through the side of the stock and the linear bearing was forced into this hole and
tightened down with a set screw. A 3/8” hole was reamed into the end of the stock and a
¼” sleeve bearing was placed into it and tightened down with four set screws. Finally,
material was removed from the piece with a lathe in the area around the sleeve so that
this part would not hit the motor body during motion.
Once this part had been made, the shaft coming from the sensor mount was slid into the
sleeve bearing in this piece, and the shaft coming from the motor was fed through the
linear bearing, thus completing the mechanism.

57
Figure 51: Prototype Mechanism Support
Electronics assembly: Following the completion of the mechanism, the stepper motor
from the rotational mechanism was connected to an external driver from Applied Motion
Products using 24 gauge copper wires (Appendix N). The external driver connected to
the PC via an adapter cable and was programmed for standalone operation via Si
Programmer control software. Commands used to drive the motor on the prototype are
included in Appendix M. The selected motor from Sure Steps runs on 32 VDC, 4A
maximum. However, for the prototype rotational mechanism, a 110V input (19V, 1A
output) portable power supply was bought and powered the stepper motor through the
external driver. This portable power supply was sufficient for demonstration purposes.
The linear stage was bought with custom wiring and was connected to an Aerotech,
Ensemble CP10 controller. The stage and controller were conveniently powered by a
conventional 110 VAC wall socket, and the controller was connected to the PC via a
USB cord. The Ensemble runs with proprietary Ensemble IDE software and drives the
linear stage to move at speeds up to 250 mm/s and through a variety of movement
patterns such as ramps in velocity, steps, and others. Commands used to drive the stage
on the prototype are included in the Appendix L.
Testing Plan
The fabricated prototype will be tested to confirm that it meets all engineering
specifications set forth earlier in this report. These engineering specifications are listed
below by rank.

58
Table 6: Importance Ranking of Engineering Targets
Rank (1 =
most
important)
Engineering Specification Engineering
Target
1 Error for translational position (x) <1 μm
2 Error for rotational position (θ) <1 degree
3 Reference displacement error <1 μm
4 Cycle Time <30 sec
5 Control of translational speed 1E-6,000 mm/min
6 Damping coefficient of fixture material > 1
7 Number of passes sensor capable of making 1-16
8 Movement of engine head in x, y, and z directions once "fixed" <1 μm
9 Error for translational velocity (dx/dt) <1 mm/min
10 Sensor distance from engine head 51.5-68.5 mm
11 Step size of sensor sampling rate 1 Hz
12 Operational Temperature 18~35 °C
13 Input Voltage 110 Volts
The team’s prototype fabrication included the manufacturing of the support structure,
motion stage mounts, and rotational motion mounts. The software to calibrate sensor
measurements will be completed at a later phase of the project. Thus, the system can be
calibrated to meet certain engineering specifications but we will not be performing these
calibrations. The engineering specifications that will be met at a later date (and are
outside the scope of our project tasks) are (1) error for translational position, (2) error for
rotational position, (3) reference displacement error, (4) cycle time, or (11) step size of
sensor sampling rate. The fundamental metric for the success of our prototype will be its
ability to make two passes along the length of the engine head, scanning all 16 valve
seats. A visual inspection of the sensor’s motion range while running will be sufficient to
determine whether or not our prototype meets this metric. A similar test will be used to
determine the number of passes the sensor is capable of making (7). Also important is
the rotational mechanism’s ability to achieve the desired rotation positions for the
specific engine head, to locate the sensor between 51.5 and 68.5 mm away from the
engine head surface, and to maintain a reasonable clearance between the mechanism’s
plate bottom and the engine head top surface. These determine whether the sensor will be
perpendicular to the valve seats at their midpoints, whether it will be able to take accurate
measurements, and gives an idea of the types of obstructions that the mechanism will be
able to clear.
The control of translational speed to travel (5) will be conducted through our controller
and will allow for adjustment of a step size of 1 mm/s from 0 mm/s to 250 mm/s. This
specification will be tested by setting the speed of the linear motion stage with our
controller and measuring travel distance per unit time.
The movement of the engine head in the x, y, and z directions once “fixed” (8) will be
tested by marking the original position of the engine head, running the sensor
mechanism, and measuring the movement) of the engine head.

59
The sensor distance range from the engine head (10) will be measured by adjusting the
sensor to its maximum and minimum focal length positions. These positions are
determined by the location of the sensor on the arc plate, and the position of the arc plate
in its holster. Manual measurements with calipers are sufficient to give approximate
dimensions of sensor distance range, clearance, and rotation, though in the future, more
exact techniques need to be employed.
We will not test the operational temperature of the mechanism, given that resources are
not available to test the sensor in a climate-controlled environment. However, given the
thermal expansion coefficients of our material choices (primarily aluminum and steel)
and the operating range of the sensor (18-35° C) we expect the device to be operable in
the desired range of 18-35° C.
Finally, we designed electrical components of mechanism to operate off of two
conventional, 110V inputs (13). This can be observed by confirming proper operation
with 110V inputs.
Testing
Testing was conducted after fabrication and allowed for engineering specifications to be
evaluated. Although the only way to truly test the performance of our system would be to
use it to make actual measurements with the sensor and compare them to previous
measurements, this was not possible for two reasons. First, the motion stage must be
calibrated before it can be used to make measurements; because calibration is a multi-
week process for which the stage must be sent away, we finished our prototype prior to
motion stage calibration in order to have a prototype for the design expo, and thus it has
not been calibrated yet. Secondly, there was insufficient time to learn how to operate the
sensor and use it due to the late arrival of the motion stage and thus the late date of final
assembly of our prototype.
Once the stage is calibrated in the future, testing can be conducted to determine the
position and velocity errors for translational and rotational motion as well as the proper
cycle time for the measurement process (as the motion can be programmed to almost any
speed and thus knowledge of the fastest speeds that still provide accurate measurements
are needed). Without this possibility however, we have conducted some simple testing to
at least ensure our prototype can provide the motion needed for these measurements to
take place.
Repeated translational motion
We found the prototype capable of making multiple passes along the entire length of the
engine head and capable of operating at the desired translation speed of 100 mm/s (this
“desired” number requires actual measurements for refinement). We also noted the sensor
distance can be properly adjusted to meet the appropriate measurement range. The engine
head does not move on the granite block during operation. Also the entire operation is
powered conveniently by an 110V power source.

60
Linear motion control
As mentioned in the testing plan, the fundamental metric of success for our prototype is
its ability to pass along the entire length of the engine head. The linear motion stage has a
600 mm travel capable of carrying the inspection sensor well past all engine heads tested.
The longest tested engine head has a length of 500 mm, with which we conducted a
visual inspection to confirm that with the engine head placed on the granite block our
prototype has the capability of scanning the entire length of the engine head. We also
noted that the prototype can make these passes in any quantity; making multiple passes is
easily programmed into the controller. Each pass can be coded by the Ensemble IDE
software included in the controller package from Aerotech, Inc. This software also lets us
control the translational speed metric, whereas we desire a translational speed of 100
mm/s. The controller allows 1 mm/s steps with speeds between 0 and 250 mm/s.
Mechanism metrics
To ensure the sensor hits our desired positions and to gauge how well the mechanism
clears the engine head, manual measurements were taken using calipers. The sensor was
found to be able to move along the track to our desired ± 26 deg smoothly and thus, meet
our rotation requirements. Also, at the maximum rotation position, the sensor distance
from a variety of engine head valve seat surfaces were tested to be between 55 to 75 mm,
both of which have 20 mm adjustability. Thus, with the given adjustments for our system
we can reach the desired measurement range of 51.5 to 68.5 mm. Finally, the clearance
between the mechanism plate’s bottom surface and the flat surface of the engine head
was found to be approximately 33 mm when the course adjustment was positioned at the
bottom of its vertical range and when the fine adjustment was positioned in the middle of
the vertical slot (see Fig. 52 and 53). Compared to the designed clearance of 34 mm at
this same position, our design is pretty spot on – the one mm discrepancy can be
attributed to our machining errors in the arch track, sensor mount, and motion stage
attachment. The maximum clearance we can obtain is actually roughly 43 mm, when the
fine adjustment is shifted downwards to its limit of 10 mm along the slot (see Fig. 52).
The 43 mm clearance provides more than ample room to clear engine head obstructions,
and was verified through manual measurements using calipers. We note that because our
measurements were rough measurements, more precise measurements should be obtained
in the future.

61
Sensor Mount
Figure 52: Prototype Support Assembly Figure 53: Prototype Sensor Mount
Engine head stability
Another visual inspection was conducted to view the engine head movement during
prototype operation. The engine head was stable throughout operation and there was no
noticeable play. However, we would like to have a better mechanism to place the engine
head precisely on the granite block. This can be done in the future, once a specific
demonstrator engine head is decided upon and further validation can be conducted to
ensure no motion of the engine head.
Power supply
The entire prototype operation is fully functional with two conventional power inputs of
110V. The linear stage and controller had a custom 110 V plug, while the motor and
driver were assembled with an AC adapter of 15 VDC, 1 A. However, the motor
controller actually requires a 32 VDC source to provide the motor with all of the power
required to achieve its maximum torque. Although the 15VDC source was able to supply
enough power to the motor to provide rotational motion over very small angles, the full
32VDC source was required to provide the full motion.
Motor life
One aspect of the prototype that failed testing however was the lifetime testing of the
motor. Although the motor ran continuously the entire time at the expo without problems,
and the motor was able to provide the necessary torque to move the sensor to both
extreme positions numerous times, the motor failed during additional testing after the
design expo. Although the reason for failure is not immediately known, it is known that
the motor was very inexpensive and possibly of low quality. This issue is addressed
further in future improvements.
Course adjustment Course adjustment
is positioned at its
lowest vertical
point
Fine (focal length)
adjustment
Vertical slot
When laser is
positioned at its lowest point along
vertical slot, max
clearance is 43
mm!

62
Manufacturing Changes
We made several changes during the manufacturing process to refine our design and
manufacture a fully operational prototype. These engineering change notices (ECN) were
carried out efficiently. The changes include design changes in the granite, structure, bolt
interfaces, triangular supports, and rotational arc motion device.
Stud anchors are used to attach the angle (L) brackets to the granite. These were
originally ½” bolts, however after finding that the 3” depth of only four bolts were
sufficient for carrying the load of the structure, we used 3/8” diameter for the remaining
four bolts. This allowed for faster manufacturing time while not sacrificing the rigidity
needed for the structure to granite interface.
The structure was originally planned to be made with 6061 aluminum, however,
evaluating the raw material needed for the structure we found that 1018 mild steel was
only 3 cents more expensive per pound. We decided to create the structure out of the mild
steel because we were able to order our parts direct from a material supplier. This
prevented additional manufacturing time for the mild steel while at the same time
allowing us to create a more rigid structure with a small investment.
We also wanted to preserve the finish and operation of the ATS 115 motion stage. To do
this we included rubber washers at the mounting points for the linear stage to the
aluminum and mild steel. This will minimize vibrations while protecting the finish on the
linear motion stage.
The structure that hangs from the motion stage slider was originally going to be
supported by two triangular attachments that were to be welded to the arc track.
However, after some load analysis we found it sufficient to place two bolts per triangular
attachment to the arc track. These bolts maintained our operation goals for the prototype
while allowing for a simpler manufacturing process.
Future Improvements
Due to the tight time schedule, the availability of machine shop time and lab time, and the
limited resources associated with the project, improvements to our prototype in the form
of additions and redesigns that would be beneficial, but were unable to be completed, are
discussed here.
One necessary addition to the prototype is the integration of a 32 V power supply to
power the stepper motor. Because we were originally under the impression that the
controller supplied by Aerotech, Inc. could drive the stepper motor we had chosen, we
had to quickly find a different power supply for the motor. The current prototype power
supply for the stepper motor is a 15V power supply from Radio Shack, which has been
modified so that it can be wired to the stepper motor controller. Although this power
supply can provide enough input power for the stepper motor to control the motion of the
sensor mount and sensor over small angles, the 32 V source for which the stepper motor
is designed for will provide the torque for which we designed the system and allow the

63
full motion required. A 30 VDC source has been used to verify that the mechanism will
work with this power; however, it is a lab source and is not practical for system
integration.
A second improvement is the addition of an adjustable mechanism capable of locking
down different engine heads to the granite base. This will ensure no movement of the
engine head during measurements and allow for correct positioning for the engine head.
In order to position the engine head, pins could be mounted in the base that could align
with existing holes in the engine head. Clamps, similar to ones used by many other
machines in the ERC lab, could then be used to clamp down the head, although clamps
may be unnecessary if it is found that the engine head does not move when placed on the
granite base.
A third improvement to our design would be the addition of a clamping mechanism to
ensure no relative movement between the sensor mount and the arch plate during linear
motion when micro-precision is necessary for measurements. Currently, if the rollers on
the backside of the plate are tightened against the plate, the sensor will be held with no
play; however, this requires that the beam supporting these rollers be moved so that the
rollers are over tightened against the back of the plate and then loosened slightly
whenever rotational motion is desired, where as a clamp would prevent this constant
adjustment.
A fourth improvement that could be made to the system would be a redesign of the roller
installation on the sensor mount. Currently, a pair of rollers on the back of the arch plate
hold the rollers attached to the sensor mount tight to the plate, allowing smoother motion
and less play, but on the front side of the plate, it is the ends of the rollers, which do not
roll, that are held tight to the plate. This could be improved by the addition of rollers on
the front side of the arch plate, similar to the ones that currently exist on the backside,
that could “sandwich” the plate and allow even smoother motion of the mechanism. If
done correctly, this could also effectively eliminate the play between the plate and the
sensor mount, which would eliminate the need for the clamp described above and allow
for micro precision of the linear sensor movement as well as the ability to simultaneously
rotate the sensor.
A fifth improvement to the system would be replacement of the stepper motor. As
previously mentioned, the motor, despite its ability to provide the necessary torque, failed
after extensive use. This problem may be fixed by replacing the motor with one of a
higher quality. Because the motor used was a standard size (NEMA 23) with standard
mounting provisions, any motor of this size may be used as a replacement, allowing for
an upgrade during replacement.
Finally, in order to improve the aesthetics of the prototype the steel structure can be
painted and all of the aluminum parts can be sanded (if necessary) and anodized.

64
Conclusion
After determining the customer requirements and engineering specifications for our
design, we listed and organized these functions in a FAST diagram and then generated
function-level concepts to complete these functions in a Morphological chart. These
function-level concepts were then combined to create five system-level concepts to
complete the overall function of our system: precise motion control of the ConoProbe
sensor in order to allow precise measurement of engine valve seats. These system-level
concepts were then compared with a Pugh chart, and one concept was chosen for our
design due to its unmatched ability to control the rotational motion of the sensor
accurately, to eliminate any interference with the engine head, and to enable the valve
seat inspection technique to be completely automated.
We then defined this concept in more detail by performing a number of engineering
analyses, including position analysis, motor torque analysis, vibration analysis, and
structural analysis, in order to develop detailed design parameters. The results of these
analyses were translated into detailed CAD models, a bill of materials, and a
manufacturing plan. With the detailed design of our final concept, we built and tested the
system in order to deliver a complete prototype by the design expo on December 4th
. The
prototype can now be found in the Metrology Lab of the ERC (1100 Dow).
In summary, our final design allows a user to scan all 16 valve seats by controlling the
motion of the sensor both along the engine head length and width. The device can
accommodate a variety of engine head sizes, given its open geometry and the ability to
adjust both the focal point and fine-tune focus of the sensor. In addition, it maintains a
clearance between the sensor and the engine head that allows for non-contact
measurements to be taken. All of the sensor’s motion is controllable due to the use of a
motor and linear stage, allowing for adjustability of speeds and positions. Finally, our
design is justified using sound engineering analysis and reasoning, ensuring a high level
of reliability. Our design’s combination of adjustability to accommodate different engine
heads, controllability of sensor motion, high reliability, and micro-precision and
accuracy, and most importantly, its ability to be automated and quick at measuring valve
seat geometry, makes it a viable and desirable concept for our potential customers, the
auto manufacturers.

65
References
1. “Putting Air Gages to Work .” Edmunds Gages. 26 Sept. 2007
<http://www.edmundsgages.com/metworldart04.htm>
2. “Apparatus for inspecting an engine valve seat.” Patent Storm. 26 Sept. 2007
<www.patentstorm.us/patents/5533384-claims.html>
3. “Accutire ABS Coated Air Gauge.” MSN Shopping. 26 Sept. 2007
<http://shopping.msn.com/prices/shp/?itemId=845526187>
4. “Probe Indicator.” Wikipedia. 26 Sept. 2007
<http://en.wikipedia.org/wiki/Dial_gauge#Probe_indicator>
5. “Valve seat runout gage.” Free Patents Online. 26 Sept. 2007
<http://www.freepatentsonline.com/4630377.html>
6. Quoting Dr. Vijay Srivatsan from ERC-RMS.
7. “ABSOLUTE Digimatic Indicator ID-C Series 543-Standard Type.” Mitutoyo
U.S.A. 26 Sept. 2007
<http://www.mitutoyo.com/TerminalMerchandisingGroup.aspx?group=1198>
8. “Crysta-Apex C Series 191-Standard CNC CMM.” Mitutoyo U.S.A. 26 Sept.
2007
<http://www.mitutoyo.com/TerminalMerchandisingGroup.aspx?group=1013>
9. “Digital holography.” Wikipedia. 26 Sept. 2007
<http://en.wikipedia.org/wiki/Digital_holography>
10. “Linear actuator, integrated position control.” Danaher Motion. 11 Oct. 2007.
http://www.danahermotion.com/documents/index.php?product_cat_id=464
11. Engineering Vibration, 2nd
ed., Daniel J. Inman.
12. Formulas for Natural Frequency and Mode Shapes, Robert D. Blevins.
13. Mechanical Behavior of Materials, Norman Dowling

66
Bios
Ryan Doss
Ryan was raised in west Michigan until graduation from Grandville High School in 2004,
after which he headed for Ann Arbor. For the past two summers, Ryan has worked for
The Boeing Company where he worked in 777 payloads and structures engineering and
787 & 747-8 dynamic loads analysis in 2006 and 2007, respectively. Ryan is currently
conducting research in the area of dynamics with application to biomechanics to measure
knee kinematics with inertial sensors for the study of non-contact ACL failure
mechanisms. Following graduation, Ryan will likely head to graduate school, after which
he will either continue his career in the aerospace industry in the fields of dynamics or
stability and control or continue to conduct research in academia. Outside of academics,
Ryan serves in the Campus Crusade for Christ ministry at U of M as a community group
leader and co-leader of the praise band and runs marathons and other races of
unreasonable distance.
Fletcher McCombie
Fletcher was born on the northwest side of Chicago in the suburb of Barrington. He grew
up in the same area, moving from to Hoffman Estates and eventually to South Barrington.
Throughout secondary education he had deep interest in math and science through
calculus and physics. The University of Michigan was an easy choice for higher
education, as it offers the best engineering program in the Midwest. Academic studies at
Michigan have led to pursuits in dynamics and controls. After graduation Fletcher hopes
to be active in and out of work, pursuing industry achievements, community
involvement, and a continual pursuit of better health for himself and his fellow citizens.
Fletcher’s extracurriculars include music, film, website development, land reclamation,
health activism, and of course his continual pursuit of knowledge.

67
Helen Sun
Helen is from Charlottesville, VA where she graduated from Albemarle High School.
She decided to go to the University of Michigan – Ann Arbor because of her interest in
automotive systems. She declared her major in Mechanical Engineering during her third
semester in college and has really been motivated to pursue continued education in
Controls Systems Design and Design Methodology based on her classes, teachers, and
industry experiences. Her industry experiences include a Toyota Engineering Design Co-
op and a General Motors Drive Quality internship. Her research experiences include the
bowel actuator packaging project and a shape memory alloy creep stabilization project
which led to a conference paper at SPIE. Her research was conducted at the Smart
Materials and Structures Design Lab at the University of Michigan. She plans on getting
a PhD and either doing research or teaching in the future.
Liz Coon
Liz is from East Lansing, MI, and graduated from East Lansing High School in 2004. She
decided to pursue a bachelor’s degree in mechanical engineering because of her interest
in physics, mathematics, and the workings of mechanical systems. During her college
career she has worked in a number of labs, which has included research on electroplating
nickel-titanium shape memory thin films in the Materials Science Department at
Michigan State University; jurkat cancer cell electrical properties research at a Nuclear
Engineering lab at the University of Michigan; and nuclear reactor operation and
experimentation experience at the Universidad Nacional de Córdoba in Argentina. Liz
also has an interest in supply chain and operations, and did an internship investigating
make-to-order cardiovascular products this summer at Cordis, a Johnson & Johnson
company, in Miami Lakes, Florida. After she graduates with her bachelor’s degree in
May 2008, she plans on pursuing an industrial and operations engineering master’s
degree at the University of Michigan.

68
Appendix A: Quality Function Deployment (QFD) Diagram
The following diagram depicts our customer requirements, engineering specifications,
and the relationships between the two that have contributed to the importance of each
specification.

69
Appendix B: Gantt Chart

70
Appendix C: Smart ConoProbe Laser Sensor Technical Specifications

71

72

73
Appendix D: Fast Diagram
Measure Valve
Seat Geometry
Secure engine
block
Move sensor
Record sensor
position
Record distance
measurements
Assure
dependability
Assure
convenience
Enhance product
Please senses
Apply force to
engine block
Locate ref points
on engine block
Move in x direction
Move in z direction
Move in theta
direction
Convert x position
to signal
Convert z position
to signal
Operate accurately
in variable
environments
Include easy-to-
use interface
Power-up easily
Increase precision
Perform
measurements
quickly
Apply force in x
direction
Transmit force in x
direction
Apply force in z
direction
Transmit force in z
direction
Apply force in
theta direction
Transmit force in
theta direction
Minimize impacts
of changes in
temperature
Minimize impact of
ambient particulate
levels
Ergonomic control
of motion in x and
theta directions
Ergonomic control
of motion in z
direction
Automated signal
interpretation
Use precise z-
direction
measurement
instrument
Follow efficient
movement path
Ergonomic engine
block loading
TASK FUNCTION
PRIMARY BASIC
FUNCTIONS
PRIMARY
SUPPORTING
FUNCTIONS
BASIC
FUNCTIONS
SUPPORTING
FUNCTIONSMinimize vibration
of engine block

74
Appendix E: Morphological Chart
Text format

75
Picture format

76
Appendix F: Pugh Chart

77
Appendix G: Bill of Materials
Quantity Part Description Purchased From Part Number Price (each)
7 pieces
(various
lengths)
1”x6” Aluminum 6061-T6511
Stock University of Michigan N/A $0.00
1 Granite Block
45mm x 650 mm x 650mm University of Michigan N/A $0.00
1 Linear Motion Stage
600 mm long
University of Michigan
via Aerotech, Inc. ATS115-600 $0.00
1 NEMA 23 Step Motor Sure Step Stepping
Systems
STP-MTR-
23055 $30.00
1 Smart ConoProbe non-contact optical sensor
University of Michigan via Optimet
N/A $0.00
5 Track Rollers
1/2” diameter, 3/8” width roller McMaster-Carr* 3659K11 $19.33
34 1”x1/4”-20 Screws University of Michigan N/A $0.00
1 10 ct. 1”x1/4"-20 hex bolts
300 stainless steel McMaster-Carr* 92245A537 $6.07
1 10”x1/4” Linear Motion Shaft
w/machinable ends McMaster-Carr* 1144K11 $19.76
1 1/4" Self-Aligning Bearing,
closed McMaster-Carr* 9533T1 $11.90
1 12” x 1/2" ID – 1" OD
Aluminum Tube McMaster-Carr* 9056K281 $8.03
2 .25”x1/4"-20 Set Screws University of Michigan N/A $0.00
6 1018 Mild Steel Stock
1”x 3”x15” University of Michigan N/A $0.00
4 ½” Washers Carpenter Brothers N/A $0.13
8 ½” Wedge Stud Anchors McMaster-Carr* 97799A300 $5.95
4 2” Steel Corner Brackets, zinc
plated McMaster-Carr* 1556A44 $5.67
1 Linear Motion Stage Controller University of Michigan
via Aerotech, Inc. Ensemble CP10 $0.00
12 Round Knob with knurled rim
(style #1) McMaster-Carr* 6079K13 $3.31
1 ¼” Sleeve Bearing Carpenter Brothers N/A $4.79
4 ½” Nuts Carpenter Brothers N/A $0.17
1
18-8 SS Round Head Phillips
Machine Screw
4”x1/4”-20
McMaster-Carr* 91773A572 $9.23
TOTAL $297.63
*http://www.mcmaster.com

78
Appendix H: Computer Aided Drawings of Selected Design Concept
First Iteration Design Models

79
Final Design model
Sensor
Sensor
mount
Arched Track
and Plate
Plate
Mount
Motion Stage
Support
Motion
Stage

80
Appendix I.1: Sensor Mount Plate engineering drawing

81
Appendix I.2: Sensor Mount Bracket engineering drawing

82
Appendix I.3: Arc Plate engineering drawing

83
Appendix I.4: Triangular Plate Support engineering drawing

84
Appendix I.5: Motion Stage Attachment engineering drawing

85
Appendix I.6: Top Support engineering drawing

86
Appendix I.7: Side Support engineering drawing

87
Appendix I.8: L-Bracket engineering drawing

88
Appendix J: Matlab code for vibration analysis
clear all E = 71e9; %Pa v = 0.345; a = 0.224; %m b = 0.124; %m %h = 0.10; %m
rho = 2700; %kg/m^3
%Note: Side b is clamped
h = .01:.001:.025;
for i = 1:length(h) gamma = rho.*h(i); lambda =
interp1([.4,2/3,1,1.5,2.5],[3.511,3.502,3.492,3.477,3.456],a./b); f(i) = lambda.^2./(a^2)*sqrt(E.*h(i).^3./(12.*gamma.*(1-v^2))); r(i) = 20*pi/f(i); end figure plot(h,r,'k') xlabel('Thickness (m)'); ylabel('Frequency Ratio');
m = 1.5; %kg g = 9.81; %m/s^2 % Deflection Calculation for i = 1:length(h) I(i) = 1/12*b*h(i)^3; d(i) = rho*h(i)*b*g*a^4/(384*E*I(i))+m*g*a^3/(192*E*I(i)); end
figure plot(h,d,'k'); xlabel('Thickness (m)'); ylabel('Deflection (m)');
clear h; h = 0.025; I = 1/12*b*h^3; P = [1:0.1:6];
for i = 1:length(P) d(i) = P(i)*rho*h*b*g*a^4/(384*E*I)+m*g*P(i)*a^3/(192*E*I); end
figure plot(P,d,'k'); xlabel('Deceleration (g''s)'); ylabel('Deflection (m)');

89
Appendix K: Motion stage specifications

90

91

92

93

94

95
Appendix L: Ensemble CP 10 Code and Technical Specifications
ENSEMBLE:
ENABLE X
HOME X
DOMOTION:
MOVEINC X 100 F 150
MOVEABS X 500 F 40
MOVEABS X 600 F 150
LINEAR X -600 F 150
GOTO DOMOTION %Comments on command algorithm above
%Enable X axis
%Position stage at x=0 mm, absolute position
%Complete following motions in a loop:
%Move stage to x=100 mm relative to last position at a speed of 150 mm/s
%Move stage to x=500 mm, absolute position (relative to home) at a speed of 40 mm/s
%Move stage to x=600 mm, absolute position (relative to home) at a speed of 150 mm/s
%Return stage to home position at a speed of 150 mm/s
%End of loop, return to beginning of loop
For Ensemble more detailed controller specifications:
http://www.aerotech.com/ensemble/drives.cfm
Ensemble software and manual are available on the CD shipped with the controller.

96
Appendix M: Si Programmer Code and 3540i Driver Manual Website
Applied Motion Products, Inc. Programming Software Version: 2.7.5 Si Programmer V2.7.5 Drive: 3540i Drive Firmware Version: 2.18 Steps per revolution: 20000 Running current: 2.80A Idle current: 1.40A (50%) Jog speed: 4.000 rev/sec Jog accel: 25 rev/s/s Quick Decel rate (used for limits, interrupt and stop button): 1000 rev/s/s Encoder: 4000 counts/rev (1000 lines). Encoder disabled (ignore errors) Interrupt action: none Condition: input 1 high 1 Wait Time 1 seconds 2 Feed to Length(ccw) 1,444 steps, V=0.050 rev/sec, A=100 rev/s/s, D=100 rev/s/s 3 Wait Time 7 seconds 4 Feed to Length(cw) 2,888 steps, V=0.050 rev/sec, A=100 rev/s/s, D=100 rev/s/s 5 Wait Time 7 seconds 6 Feed to Length(ccw) 2,888 steps, V=0.050 rev/sec, A=100 rev/s/s, D=100 rev/s/s 7 Go To Line 3

97
For downloads of driver manual and Si Programmer software:
http://www.applied-motion.com/products/stepper/drives/3540i.php
Appendix N: Selected Stepper Motor Specifications
For more detailed stepper motor specifications: http://web6.automationdirect.com/adc/Technical/Catalog/Motion_Control/Stepper_Systems/Motors_-z-_Cables