leaders in mobility - · pdf fileleaders in annual financial ... consolidated statement of...
TRANSCRIPT

MOBILITYL EADERS IN
ANNUAL FINANCIAL STATEMENTS
FOR THE YEAR ENDED 30 JUNE 2015
AN
NU
AL FIN
AN
CIAL STA
TEMEN
TS FOR
THE YEA
R EN
DED
30
JUN
E 20
15

1 | DIRECTORS’ RESPONSIBILITY FOR SEPARATE AND CONSOLIDATED ANNUAL FINANCIAL REPORTING
1 | PREPARER OF SEPARATE AND CONSOLIDATED ANNUAL FINANCIAL STATEMENTS
1 | CERTIFICATE BY COMPANY SECRETARY
2 | AUDIT REPORT ON THE AUDIT OF THE SEPARATE AND CONSOLIDATED ANNUAL FINANCIAL STATEMENTS
7 | REPORT OF THE AUDIT COMMITTEE
12 | DIRECTORS’ REPORT
14 | CONSOLIDATED STATEMENT OF FINANCIAL POSITION
15 | CONSOLIDATED STATEMENT OF PROFIT OR LOSS
16 | CONSOLIDATED STATEMENT OF COMPREHENSIVE INCOME
17 | CONSOLIDATED STATEMENT OF CASH FLOWS
18 | CONSOLIDATED STATEMENT OF CHANGES IN EQUITY
20 | SEGMENTAL INFORMATION
24 | NOTES TO THE CONSOLIDATED ANNUAL FINANCIAL STATEMENTS
96 | COMPANY ANNUAL FINANCIAL STATEMENTS
104 | ANNEXURE A – ADDITIONAL INFORMATION ON INSURANCE BUSINESSES
106 | ANNEXURE B – SUMMARY OF EMPLOYMENT EQUITY REPORT
CONTENTS
AUDITED ANNUAL FINANCIAL STATEMENTSFOR THE YEAR ENDED 30 JUNE 2015
These consolidated and separate annual financial statements were published on 30 September 2015
In addition to these consolidated and separate annual financial statements the Group publishes an integrated report, available on our website: www.imperial.co.za
Imperial Holdings is a JSE listed South African-based international group of companies active predominantly in three major areas of mobility: > consumer and industrial logistics and supply chain management, > vehicle import, distribution, dealerships, retail, rental and aftermarket parts and > vehicle-related financial services.
Imperial employs over 51 000 people who generate annual revenues in excess of R110 billion, mainly in Africa and Europe, through five major divisions which operate under separate management structures to enable decentralised entrepreneurial creativity within the Group’s clearly-defined strategic, capital, budgetary and governance principles.
Imperial strives for focused value creation and leadership in its chosen markets by allocating capital and resources to those organic and acquisitive growth opportunities that will enhance and be enhanced by the Group’s existing assets, scale and capabilities.
Some of Imperial’s strategic choices will be deliberate – the result of prior research and analysis, while others will be emergent – the result of unplanned or unexpected external developments. In both cases strictly defined capital allocation principles will be applied.

IMPERIAL HOLDINGS LIMITED Audited Annual Financial Statements for the year ended 30 June 2015
1
DIRECTORS’ RESPONSIBILITY FOR SEPARATE AND CONSOLIDATED ANNUAL FINANCIAL REPORTING
The directors of the company are responsible for the maintenance of adequate accounting records and the preparation and integrity of the separate and consolidated annual financial statements and related information. The separate and consolidated annual financial statements have been prepared in accordance with International Financial Reporting Standards and its interpretations adopted by the International Accounting Standards Board in issue and effective for the group at 30 June 2015 and the SAICA Financial Reporting Guides, as issued by the Accounting Practices Committee and financial reporting pronouncements as issued by the Financial Reporting Council and the requirements of the South African Companies Act, 2008. The Group’s independent external auditors, Deloitte & Touche have audited the separate and consolidated annual financial statements and their unmodified report appears on page 2.
The directors are also responsible for the systems of internal control. These are designed to provide reasonable, but not absolute, assurance as to the reliability of the financial statements, and to adequately safeguard, verify and maintain accountability for assets, and to prevent and detect material misstatements and losses. The systems are implemented and monitored by suitably trained personnel with an appropriate segregation of authority and duties. Nothing has come to the attention of the directors to indicate that any material breakdown in the functioning of these controls, procedures and systems has occurred during the year under review.
The separate and consolidated annual financial statements are prepared on the going concern basis. Nothing has come to the attention of the directors to indicate that the group and company will not remain a going concern for the foreseeable future.
The audited annual financial statements set out on pages 7 to 105 which are available on the group’s website at www.imperial.co.za were approved by the board of directors on 24 August 2015 and are signed on their behalf by:
TS Gcabashe MJ Lamberti OS ArbeeChairman Chief Executive Officer Chief Financial Officer
CERTIFICATE BY COMPANY SECRETARY
In my capacity as company secretary, I hereby confirm that, for the year ended 30 June 2015, the company has lodged with the Registrar of Companies all such returns as are required of a public company in terms of the Companies Act, No 71 of 2008, as amended and that all such returns are true, correct and up to date.
RA VenterCompany Secretary
24 August 2015
> DIRECTORS’ RESPONSIBILITY FOR GROUP ANNUAL FINANCIAL REPORTING
These separate and consolidated annual financial statements have been prepared under the supervision of R Mumford CA(SA) and have been audited in terms of section 29(1)(e)(i)(aa) of the Companies Act, 2008.
R MumfordGeneral Manager Group Finance
24 August 2015
PREPARER OF SEPARATE AND CONSOLIDATED ANNUAL FINANCIAL STATEMENTS

2 IMPERIAL HOLDINGS LIMITED Audited Annual Financial Statements for the year ended 30 June 2015
OPINIONWe have audited the consolidated and separate financial statements of Imperial Holdings Limited and its subsidiaries (“the Group”) set out on pages 7 to 105, which comprise the consolidated and separate statements of financial position as at 30 June 2015, and the consolidated and separate statements of profit or loss and other comprehensive income, the consolidated and separate statements of changes in equity and the consolidated and separate statements of cash flows for the year then ended, and the notes to the consolidated and separate financial statements, including a summary of significant accounting policies.
In our opinion, the consolidated and separate financial statements present fairly, in all material respects, the consolidated and separate financial position of Imperial Holdings Limited and the Group as at 30 June 2015, and its consolidated and separate financial performance and its consolidated and separate cash flows for the year then ended in accordance with International Financial Reporting Standards (IFRSs) and the requirements of the Companies Act of South Africa.
BASIS FOR OPINIONWe conducted our audit in accordance with International Standards on Auditing (ISAs). Our responsibilities under those standards are further described in the Auditor’s Responsibilities for the Audit of the Consolidated and Separate Financial Statements section of our report. We are independent of the Group in accordance with the Independent Regulatory Board for Auditors Code of Professional Conduct for Registered Auditors (IRBA Code), which is consistent with the International Ethics Standards Board for Accountants Code of Ethics for Professional Accountants (Part A and B), together with other ethical requirements that are relevant to our audit of the consolidated and separate financial statements in South Africa, and we have fulfilled our other ethical responsibilities in accordance with these requirements. We believe that the audit evidence we have obtained is sufficient and appropriate to provide a basis for our opinion.
KEY AUDIT MATTERSKey audit matters are those matters that, in our professional judgement, were of most significance in our audit of the consolidated and separate financial statements of the current period. These matters were addressed in the context of our audit of the consolidated and separate financial statements as a whole, and in forming our opinion thereon, and we do not provide a separate opinion on these matters. The key audit matters noted below relate to the consolidated and separate financial statements.
For the audit committee chairman’s review of areas of significant judgement see page 9
Key audit matter How our audit addressed the key audit matter
Valuation of goodwill and indeterminate useful life intangible assets
Goodwill and indeterminate useful life intangible assets comprise 8.0% of the total assets of the Group. These assets have been recognised in the consolidated statement of financial position as a consequence of the acquisitive nature of the Group.
As required by the applicable accounting standards, management conducts annual impairment tests to assess the recoverability of the carrying value of goodwill and indeterminate useful life intangible assets. This is performed using discounted cash flow models. As disclosed in note 4, there are a number of key sensitive judgements made in determining the inputs into these models which include: > Revenue growth (including market share and volume growth) > Operating margins > Exchange rate fluctuations and > The discount rates applied to the projected future cash flows.
Accordingly, the impairment test of these assets is considered to be a key audit matter.
The Directors have engaged specialists to assist with the determination of the discount rates for the significant Cash Generating Units to which the goodwill and indeterminate useful life intangible assets relate.
We focused our testing of the impairment of goodwill and indeterminate useful life intangible assets on the key assumptions made by management. Our audit procedures included: > Engaging our internal specialists to assist with:
− Critically evaluating whether the model used by management to calculate the value in use of the individual Cash Generating Units complies with the requirements of IAS 36 Impairment of Assets.
− Validating the assumptions used to calculate the discount rates and recalculating these rates.
> Analysing the future projected cash flows used in the models to determine whether they are reasonable and supportable given the current macroeconomic climate and expected future performance of the Cash Generating Unit.
> Subjecting the key assumptions to sensitivity analyses. > Comparing the projected cash flows, including the assumptions
relating to revenue growth rates and operating margins, against historical performance to test the accuracy of management’s projections.
We found that the assumptions used by management were comparable with historical performance and the expected future outlook and the discount rates used were appropriate in the circumstances. We consider the disclosure of the goodwill and indeterminate useful life intangible assets to be relevant and useful.
> INDEPENDENT AUDITOR’S REPORT TO THE SHAREHOLDERS OF IMPERIAL HOLDINGS LIMITED
REPORT ON THE AUDIT OF THE CONSOLIDATED AND SEPARATE FINANCIAL STATEMENTS
3
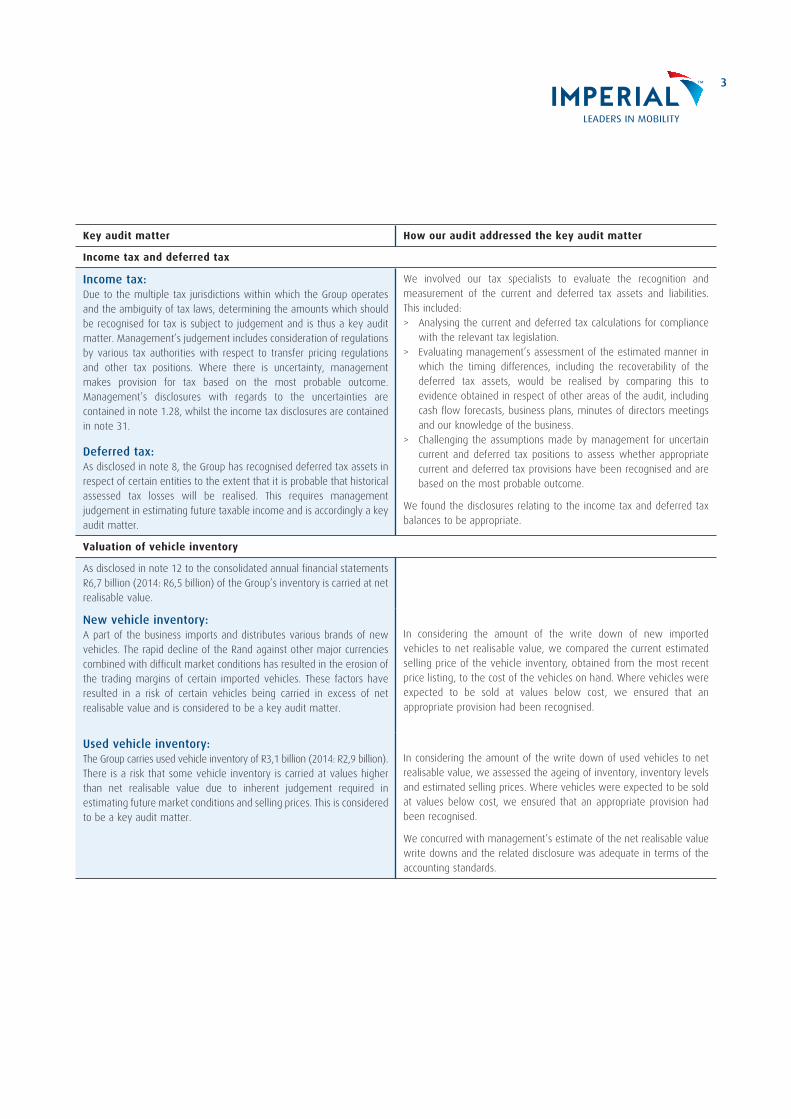
Key audit matter How our audit addressed the key audit matter
Income tax and deferred tax
Income tax:Due to the multiple tax jurisdictions within which the Group operates and the ambiguity of tax laws, determining the amounts which should be recognised for tax is subject to judgement and is thus a key audit matter. Management’s judgement includes consideration of regulations by various tax authorities with respect to transfer pricing regulations and other tax positions. Where there is uncertainty, management makes provision for tax based on the most probable outcome. Management’s disclosures with regards to the uncertainties are contained in note 1.28, whilst the income tax disclosures are contained in note 31.
Deferred tax:As disclosed in note 8, the Group has recognised deferred tax assets in respect of certain entities to the extent that it is probable that historical assessed tax losses will be realised. This requires management judgement in estimating future taxable income and is accordingly a key audit matter.
We involved our tax specialists to evaluate the recognition and measurement of the current and deferred tax assets and liabilities. This included: > Analysing the current and deferred tax calculations for compliance
with the relevant tax legislation. > Evaluating management’s assessment of the estimated manner in
which the timing differences, including the recoverability of the deferred tax assets, would be realised by comparing this to evidence obtained in respect of other areas of the audit, including cash flow forecasts, business plans, minutes of directors meetings and our knowledge of the business.
> Challenging the assumptions made by management for uncertain current and deferred tax positions to assess whether appropriate current and deferred tax provisions have been recognised and are based on the most probable outcome.
We found the disclosures relating to the income tax and deferred tax balances to be appropriate.
Valuation of vehicle inventory
As disclosed in note 12 to the consolidated annual financial statements R6,7 billion (2014: R6,5 billion) of the Group’s inventory is carried at net realisable value.
New vehicle inventory:A part of the business imports and distributes various brands of new vehicles. The rapid decline of the Rand against other major currencies combined with difficult market conditions has resulted in the erosion of the trading margins of certain imported vehicles. These factors have resulted in a risk of certain vehicles being carried in excess of net realisable value and is considered to be a key audit matter.
In considering the amount of the write down of new imported vehicles to net realisable value, we compared the current estimated selling price of the vehicle inventory, obtained from the most recent price listing, to the cost of the vehicles on hand. Where vehicles were expected to be sold at values below cost, we ensured that an appropriate provision had been recognised.
Used vehicle inventory: The Group carries used vehicle inventory of R3,1 billion (2014: R2,9 billion). There is a risk that some vehicle inventory is carried at values higher than net realisable value due to inherent judgement required in estimating future market conditions and selling prices. This is considered to be a key audit matter.
In considering the amount of the write down of used vehicles to net realisable value, we assessed the ageing of inventory, inventory levels and estimated selling prices. Where vehicles were expected to be sold at values below cost, we ensured that an appropriate provision had been recognised.
We concurred with management’s estimate of the net realisable value write downs and the related disclosure was adequate in terms of the accounting standards.

4 IMPERIAL HOLDINGS LIMITED Audited Annual Financial Statements for the year ended 30 June 2015
> INDEPENDENT AUDITOR’S REPORT TO THE SHAREHOLDERS OF IMPERIAL HOLDINGS LIMITED – CONTINUED
Key audit matter How our audit addressed the key audit matter
Sale of the Regent Group
The directors have offered for sale the Group’s interest in the Regent insurance subsidiaries (Regent). Management has therefore assessed that the planned sale of Regent should be presented as a disposal group and as a discontinued operation in accordance with IFRS 5 Non-Current Assets Held for Sale and Discontinued Operations.
The key audit matter in this regard pertains to the appropriate application of IFRS 5, in particular: > Whether the transaction meets the criteria for separate presentation
of assets and liabilities classified as held for sale. > Whether Regent represents a separate major line of business or
geographical area of operations resulting in the presentation of a discontinued operation.
> Whether the assets and liabilities are measured at the lower of the fair value less costs to sell or their carrying amounts.
The disclosure relating to Regent is contained in the consolidated statement of financial position, the consolidated statement of profit or loss and note 15.
We evaluated whether management had appropriately applied the requirements of IFRS 5 by: > Examining minutes of the directors’ board meetings, written
correspondence between the Group and the potential purchasers and communications to the Group’s investors to determine whether the assets and liabilities should be classified as held for sale and whether it represents a discontinued operation.
> Ensuring the assets and liabilities reflected as held for sale and the results presented as discontinued operations fairly present the financial position and results of the Regent Group.
In our view, the separate presentation of Regent as assets and liabilities classified as held for sale and a discontinued operation is appropriate and in accordance with the underlying accounting standards. Furthermore, the measurement of the assets and liabilities of Regent is appropriate with reference to the lower of fair value less costs to sell or carrying amount.
Maintenance and warranty contracts
The Group has a liability for service, maintenance and warranty contracts, in terms of which they are obligated to provide maintenance and repair services over a future specified period.
The determination of the adequacy of the maintenance and warranty contract reserves and the recognition of the related revenue in accordance with IAS 18 Revenue is complex. The values recognised are based on the expected earnings curves of the contracts, which are dependent upon forecasted burn rates derived from key assumptions about the future, including: > Vehicle parts inflation, and > Foreign currency devaluation.
Due to the complexity of the actuarial assumptions and the risk that the quantum of the reserves and consequential revenue recognised is inappropriate, the maintenance and warranty contracts have been identified as key audit matters.
The disclosure related to the maintenance and warranty contracts is contained in notes 1.28 and 22.
We assessed and challenged the assumptions that management made in valuing the service, maintenance and warranty contracts with a focus on the adequacy of the reserves and the appropriateness of the related revenue recognised. This included: > Engaging an independent actuarial specialist to evaluate the work
performed by management’s expert, including: − Assessing the appropriateness of the models utilised by
management’s expert, − Assessing the competence and experience of management’s
expert, and − Testing the inputs into the model and the reasonableness of the
ranges to the sensitivity of the inputs. > Comparing the sufficiency of the funds against historical information
and performing a retrospective review thereon.
We are satisfied with the actuarial assumptions applied and consequently with the measurement of the reserves at 30 June 2015. We are satisfied that the revenue recognised in the period is appropriate. The related disclosure is sufficient.
5
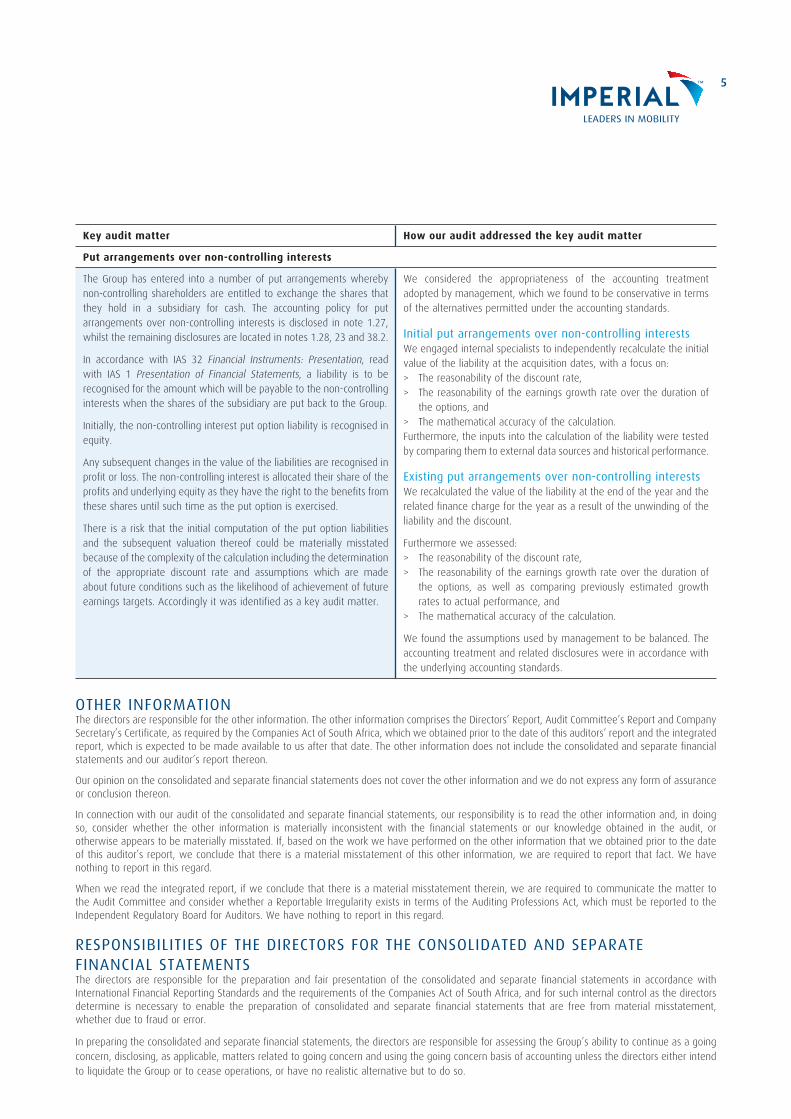
Key audit matter How our audit addressed the key audit matter
Put arrangements over non-controlling interests
The Group has entered into a number of put arrangements whereby non-controlling shareholders are entitled to exchange the shares that they hold in a subsidiary for cash. The accounting policy for put arrangements over non-controlling interests is disclosed in note 1.27, whilst the remaining disclosures are located in notes 1.28, 23 and 38.2.
In accordance with IAS 32 Financial Instruments: Presentation, read with IAS 1 Presentation of Financial Statements, a liability is to be recognised for the amount which will be payable to the non-controlling interests when the shares of the subsidiary are put back to the Group.
Initially, the non-controlling interest put option liability is recognised in equity.
Any subsequent changes in the value of the liabilities are recognised in profit or loss. The non-controlling interest is allocated their share of the profits and underlying equity as they have the right to the benefits from these shares until such time as the put option is exercised.
There is a risk that the initial computation of the put option liabilities and the subsequent valuation thereof could be materially misstated because of the complexity of the calculation including the determination of the appropriate discount rate and assumptions which are made about future conditions such as the likelihood of achievement of future earnings targets. Accordingly it was identified as a key audit matter.
We considered the appropriateness of the accounting treatment adopted by management, which we found to be conservative in terms of the alternatives permitted under the accounting standards.
Initial put arrangements over non-controlling interestsWe engaged internal specialists to independently recalculate the initial value of the liability at the acquisition dates, with a focus on: > The reasonability of the discount rate, > The reasonability of the earnings growth rate over the duration of
the options, and > The mathematical accuracy of the calculation.
Furthermore, the inputs into the calculation of the liability were tested by comparing them to external data sources and historical performance.
Existing put arrangements over non-controlling interestsWe recalculated the value of the liability at the end of the year and the related finance charge for the year as a result of the unwinding of the liability and the discount.
Furthermore we assessed: > The reasonability of the discount rate, > The reasonability of the earnings growth rate over the duration of
the options, as well as comparing previously estimated growth rates to actual performance, and
> The mathematical accuracy of the calculation.
We found the assumptions used by management to be balanced. The accounting treatment and related disclosures were in accordance with the underlying accounting standards.
OTHER INFORMATION The directors are responsible for the other information. The other information comprises the Directors’ Report, Audit Committee’s Report and Company Secretary’s Certificate, as required by the Companies Act of South Africa, which we obtained prior to the date of this auditors’ report and the integrated report, which is expected to be made available to us after that date. The other information does not include the consolidated and separate financial statements and our auditor’s report thereon.
Our opinion on the consolidated and separate financial statements does not cover the other information and we do not express any form of assurance or conclusion thereon.
In connection with our audit of the consolidated and separate financial statements, our responsibility is to read the other information and, in doing so, consider whether the other information is materially inconsistent with the financial statements or our knowledge obtained in the audit, or otherwise appears to be materially misstated. If, based on the work we have performed on the other information that we obtained prior to the date of this auditor’s report, we conclude that there is a material misstatement of this other information, we are required to report that fact. We have nothing to report in this regard.
When we read the integrated report, if we conclude that there is a material misstatement therein, we are required to communicate the matter to the Audit Committee and consider whether a Reportable Irregularity exists in terms of the Auditing Professions Act, which must be reported to the Independent Regulatory Board for Auditors. We have nothing to report in this regard.
RESPONSIBILITIES OF THE DIRECTORS FOR THE CONSOLIDATED AND SEPARATE FINANCIAL STATEMENTSThe directors are responsible for the preparation and fair presentation of the consolidated and separate financial statements in accordance with International Financial Reporting Standards and the requirements of the Companies Act of South Africa, and for such internal control as the directors determine is necessary to enable the preparation of consolidated and separate financial statements that are free from material misstatement, whether due to fraud or error.
In preparing the consolidated and separate financial statements, the directors are responsible for assessing the Group’s ability to continue as a going concern, disclosing, as applicable, matters related to going concern and using the going concern basis of accounting unless the directors either intend to liquidate the Group or to cease operations, or have no realistic alternative but to do so.

6 IMPERIAL HOLDINGS LIMITED Audited Annual Financial Statements for the year ended 30 June 2015
> INDEPENDENT AUDITOR’S REPORT TO THE SHAREHOLDERS OF IMPERIAL HOLDINGS LIMITED – CONTINUED
AUDITOR’S RESPONSIBILITIES FOR THE AUDIT OF THE CONSOLIDATED AND SEPARATE FINANCIAL STATEMENTSOur objectives are to obtain reasonable assurance about whether the consolidated and separate financial statements as a whole are free from material misstatement, whether due to fraud or error, and to issue an auditor’s report that includes our opinion. Reasonable assurance is a high level of assurance, but is not a guarantee that an audit conducted in accordance with ISAs will always detect a material misstatement when it exists. Misstatements can arise from fraud or error and are considered material if, individually or in the aggregate, they could reasonably be expected to influence the economic decisions of users taken on the basis of these consolidated and separate financial statements
As part of an audit in accordance with ISAs, we exercise professional judgement and maintain professional scepticism throughout the audit. We also: > Identify and assess the risks of material misstatement of the consolidated and separate financial statements, whether due to fraud or error, design
and perform audit procedures responsive to those risks, and obtain audit evidence that is sufficient and appropriate to provide a basis for our opinion. The risk of not detecting a material misstatement resulting from fraud is higher than for one resulting from error, as fraud may involve collusion, forgery, intentional omissions, misrepresentations, or the override of internal control.
> Obtain an understanding of internal control relevant to the audit in order to design audit procedures that are appropriate in the circumstances, but not for the purpose of expressing an opinion on the effectiveness of the Group’s internal control.
> Evaluate the appropriateness of accounting policies used and the reasonableness of accounting estimates and related disclosures made by management.
> Conclude on the appropriateness of the directors’ use of the going concern basis of accounting and based on the audit evidence obtained, whether a material uncertainty exists related to events or conditions that may cast significant doubt on the Group’s ability to continue as a going concern. If we conclude that a material uncertainty exists, we are required to draw attention in our auditor’s report to the related disclosures in the consolidated and separate financial statements or, if such disclosures are inadequate, to modify our opinion. Our conclusions are based on the audit evidence obtained up to the date of our auditors’ report. However, future events or conditions may cause the Group to cease to continue as a going concern.
> Evaluate the overall presentation, structure and content of the consolidated and separate financial statements, including the disclosures, and whether the consolidated and separate financial statements represent the underlying transactions and events in a manner that achieves fair presentation.
> Obtain sufficient appropriate audit evidence regarding the financial information of the entities or business activities within the Group to express an opinion on the consolidated and separate financial statements. We are responsible for the direction, supervision and performance of the group audit. We remain solely responsible for our audit opinion.
We communicate with the directors regarding, among other matters, the planned scope and timing of the audit and significant audit findings, including any significant deficiencies in internal control that we identify during our audit.
We also provide the directors with a statement that we have complied with relevant ethical requirements regarding independence, and to communicate with them all relationships and other matters that may reasonably be thought to bear on our independence, and where applicable, related safeguards.
From the matters communicated with the directors, we determine those matters that were of most significance in the audit of the consolidated and separate financial statements of the current period and are therefore the key audit matters. We describe these matters in our auditors’ report unless law or regulation precludes public disclosure about the matter or when, in extremely rare circumstances, we determine that a matter should not be communicated in our report because the adverse consequences of doing so would reasonably be expected to outweigh the public interest benefits of such communication.
The engagement partner on the audit resulting in this independent auditor’s report is Andrew Mackie.
Andrew Mackie Partner
Registered Auditor 24 August 2015
Deloitte & Touche Buildings 1 and 2, Deloitte Place The Woodlands Office Park, Woodlands Drive Sandton

IMPERIAL HOLDINGS LIMITED Audited Annual Financial Statements for the year ended 30 June 2015
7
The audit committee has pleasure in submitting this report, which has been approved by the Board and has been prepared in accordance with section 94(7)f of the Companies Act No 71 of 2008 (“the Act”) and incorporating the recommendations of the King Code of Corporate Governance (King III).
In summary, this committee assists the board in its responsibilities covering the: > internal and external audit processes for the group taking into account the significant risks, > adequacy and functioning of the group’s internal controls, > integrity of the financial reporting
The committee has performed all the duties required in section 94(7) of the Companies Act 71 of 2008.
MEMBERS OF THE AUDIT COMMITTEE AND ATTENDANCE AT MEETINGSThe audit committee consists of the non-executive directors listed below and meets at least four times per annum in accordance with its charter. All members act independently as described in the Act. The members of the committee in respect of the year ended 30 June 2015 comprised Mr MJ Leeming (Chairman), Mrs T Dingaan, Ms P Langeni, Mr RJA Sparks and Mr Y Waja (“the committee”), all of whom are independent non-executive directors of the Company.
Mr MJ Leeming retires as a director with effect from 1 September 2015 and Mr RM Kgosana was appointed as a director and Audit Committee Chairman with effect from 1 September 2015. In addition, Mr G Dempster who joined the Imperial Board on 24 February 2015 will join the Audit Committee as member.
The members are being recommended by the board for appointment for the financial year ending 30 June 2016, and their appointments are being submitted to shareholders for approval at the next AGM on 3 November 2015. The abridged curricula vitae of the members are included in the “Our Leadership” section in the integrated report, which is available on the Group’s website at www.imperial.co.za.
During the year under review, four meetings were held and attendance of those meetings is set out in the table below.
MemberNumber of
meetings attended
MJ Leeming (Chairman) (Member since 2002) 4T Dingaan (Member since 2014) 4P Langeni (Member since 2005) 3RJA Sparks (Member since 2006) 4Y Waja (Member since 2008) 4RM Kgosana (Member from 1 Sept 2015) n/a
The head of the internal audit department and external auditors, in their capacities as auditors to the group, attend and report at all audit committee meetings.
The Group risk management function is also represented by the head of Risk. Executive directors and relevant senior financial managers attend meetings by invitation. In addition the deputy chairman of the board and the chairman of the Regent audit committee attend all meetings.
ROLE OF THE AUDIT COMMITTEEThe audit committee has adopted a formal charter, approved by the board, setting out its duties and responsibilities as prescribed in the Act and incorporating additional duties delegated to it by the Board.
The committee: > fulfills the duties that are assigned to it by the Act and as governed by other legislative requirements, including the statutory audit committee
functions required for subsidiary companies; > assists the Board in overseeing the quality and integrity of the group’s integrated reporting process, including the financial statements and
sustainability reporting, and announcements in respect of the financial results; > ensures that an effective control environment in the group is maintained; > provides the chief financial officer, external auditors and the head of internal audit with unrestricted access to the committee and its chairman
as is required in relation to any matter falling within the ambit of the committee; > meets with the external auditors, senior managers and executive directors as the committee may elect; > meets confidentially with the internal and external auditors without other executive board members and the company’s chief financial officer
being present; > reviews and recommends to the Board the interim financial results and annual financial statements; > oversees the activities of, and ensures coordination between, the activities of the internal and external auditors; > fulfills the duties that are assigned to it by the Act and as governed by other legislative requirements, including the statutory audit committee
functions required for subsidiary companies;
> REPORT OF THE AUDIT COMMITTEE FOR THE YEAR ENDED 30 JUNE 2015
8 IMPERIAL HOLDINGS LIMITED Audited Annual Financial Statements for the year ended 30 June 2015
> REPORT OF THE AUDIT COMMITTEE FOR THE YEAR ENDED 30 JUNE 2015 – CONTINUED
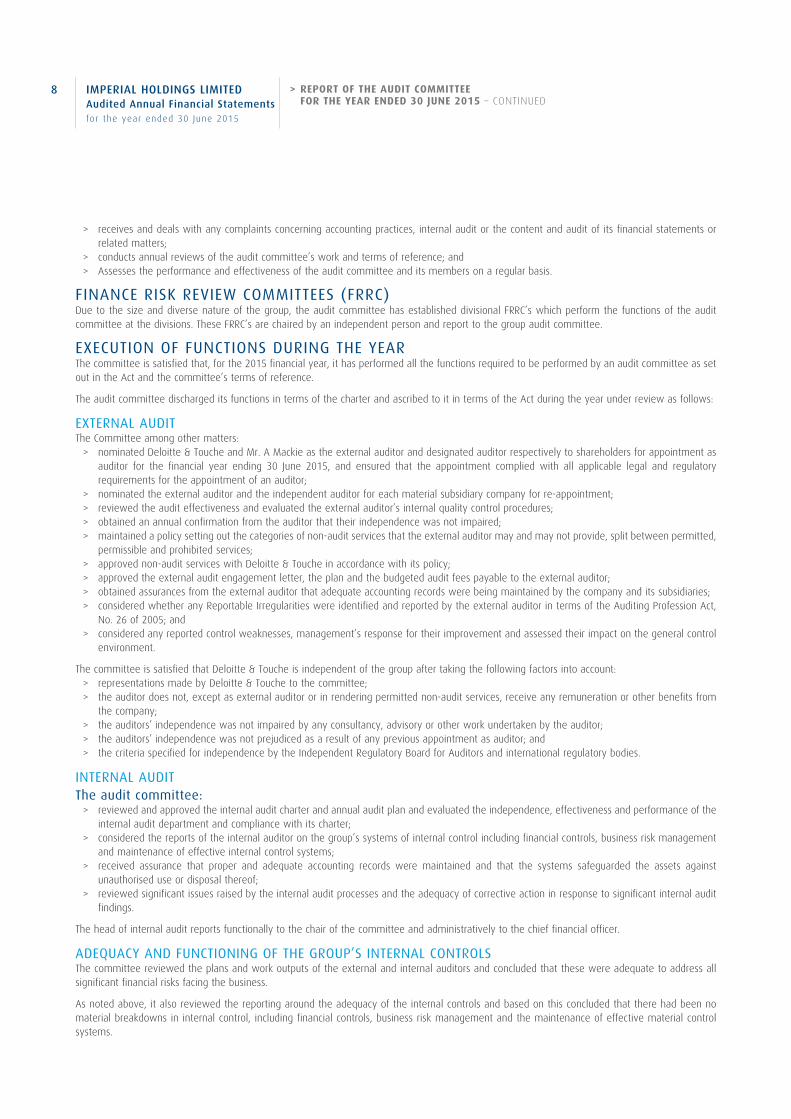
> receives and deals with any complaints concerning accounting practices, internal audit or the content and audit of its financial statements or related matters;
> conducts annual reviews of the audit committee’s work and terms of reference; and > Assesses the performance and effectiveness of the audit committee and its members on a regular basis.
FINANCE RISK REVIEW COMMITTEES (FRRC)Due to the size and diverse nature of the group, the audit committee has established divisional FRRC’s which perform the functions of the audit committee at the divisions. These FRRC’s are chaired by an independent person and report to the group audit committee.
EXECUTION OF FUNCTIONS DURING THE YEARThe committee is satisfied that, for the 2015 financial year, it has performed all the functions required to be performed by an audit committee as set out in the Act and the committee’s terms of reference.
The audit committee discharged its functions in terms of the charter and ascribed to it in terms of the Act during the year under review as follows:
EXTERNAL AUDITThe Committee among other matters:
> nominated Deloitte & Touche and Mr. A Mackie as the external auditor and designated auditor respectively to shareholders for appointment as auditor for the financial year ending 30 June 2015, and ensured that the appointment complied with all applicable legal and regulatory requirements for the appointment of an auditor;
> nominated the external auditor and the independent auditor for each material subsidiary company for re-appointment; > reviewed the audit effectiveness and evaluated the external auditor’s internal quality control procedures; > obtained an annual confirmation from the auditor that their independence was not impaired; > maintained a policy setting out the categories of non-audit services that the external auditor may and may not provide, split between permitted,
permissible and prohibited services; > approved non-audit services with Deloitte & Touche in accordance with its policy; > approved the external audit engagement letter, the plan and the budgeted audit fees payable to the external auditor; > obtained assurances from the external auditor that adequate accounting records were being maintained by the company and its subsidiaries; > considered whether any Reportable Irregularities were identified and reported by the external auditor in terms of the Auditing Profession Act,
No. 26 of 2005; and > considered any reported control weaknesses, management’s response for their improvement and assessed their impact on the general control
environment.
The committee is satisfied that Deloitte & Touche is independent of the group after taking the following factors into account: > representations made by Deloitte & Touche to the committee; > the auditor does not, except as external auditor or in rendering permitted non-audit services, receive any remuneration or other benefits from
the company; > the auditors’ independence was not impaired by any consultancy, advisory or other work undertaken by the auditor; > the auditors’ independence was not prejudiced as a result of any previous appointment as auditor; and > the criteria specified for independence by the Independent Regulatory Board for Auditors and international regulatory bodies.
INTERNAL AUDIT The audit committee:
> reviewed and approved the internal audit charter and annual audit plan and evaluated the independence, effectiveness and performance of the internal audit department and compliance with its charter;
> considered the reports of the internal auditor on the group’s systems of internal control including financial controls, business risk management and maintenance of effective internal control systems;
> received assurance that proper and adequate accounting records were maintained and that the systems safeguarded the assets against unauthorised use or disposal thereof;
> reviewed significant issues raised by the internal audit processes and the adequacy of corrective action in response to significant internal audit findings.
The head of internal audit reports functionally to the chair of the committee and administratively to the chief financial officer.
ADEQUACY AND FUNCTIONING OF THE GROUP’S INTERNAL CONTROLSThe committee reviewed the plans and work outputs of the external and internal auditors and concluded that these were adequate to address all significant financial risks facing the business.
As noted above, it also reviewed the reporting around the adequacy of the internal controls and based on this concluded that there had been no material breakdowns in internal control, including financial controls, business risk management and the maintenance of effective material control systems.

9
FINANCIAL REPORTINGThe audit committee ensures that the financial reporting to stakeholders fairly presents the state of affairs of the Group. This covers the annual financial statements, integrated report, interim and preliminary reporting.
The committee among other matters: > confirmed the going concern as the basis of preparation of the interim and annual financial statements; > reviewed compliance with the financial conditions of loan covenants and determined that the capital of the company was adequate; > examined and reviewed the interim and annual financial statements, as well as all financial information disclosed prior to the submission to the
board for their approval and then for disclosure to stakeholders; > ensured that the annual financial statements fairly present the financial position of the company and of the group as at the end of the financial
year and the results of operations and cash flows for the financial year and considered the basis on which the company and the group was determined to be a going concern;
> considered the appropriateness of the accounting policies adopted and changes thereto; > reviewed the external auditor’s audit report and key audit matters included; > reviewed the representation letter relating to the annual financial statements which was signed by management; > considered any problems identified and reviewed any significant legal and tax matters that could have a material impact on the financial
statements; > considered accounting treatments, significant unusual transactions and accounting judgments.
SIGNIFICANT AREAS OF JUDGEMENTIn arriving at the figures disclosed in the financial statements there are many areas where judgement is needed. These are outlined in note 1.28 to the annual financial statements. The audit committee has looked at the quantum of the assets and liabilities on the statement of financial position and other items that require significant judgement and decided to note the following:
> Inventories > Trade receivables > Land, buildings and leasehold improvements > Goodwill and intangible assets > Tax > Quality of earnings > Discontinued operations > Maintenance and warranty contracts > Put option liabilities
In making its assessment in each of the above areas the FRRC’s and the audit committee examined the external auditors report and questioned senior management in arriving at their conclusions.
InventoriesThe major risks relating to this asset are the physical verification and valuation being at the lower of cost and net realisable value. The group has adopted a strict process to count inventory on a regular basis and to follow up on any discrepancies to the accounting records. There were no material adjustments during the year.
The cost of the inventory is assessed in relation to its anticipated realisable value and the necessary impairments raised. The necessary impairments raised were largely relating to used vehicles and certain imported vehicles where the imported cost due to the depreciation of the Rand was above the anticipated selling price.
The FRRC’s and audit committee considers the carrying value of inventory to be fairly stated. They also noted the reclassification of the vehicles sold subject to buy back arrangements which are accounted for as an operating lease and now disclosed as vehicles for hire instead of inventory.
Refer to note 12 in the consolidated annual financial statements for the amounts.
Trade receivablesThe major risk relating to this asset is credit risk. Credit extension assessment processes are the responsibility of management. The audit committee has assessed that these are adequate and has examined the aging of the group’s trade receivables. Based on the aging and management’s judgement of the receivable’s collectability, a provision for doubtful debts is raised.
The FRRC’s and audit committee considers the carrying value of trade receivables to be fairly stated. Refer to note 38.1.5 in the consolidated annual financial statements.

10 IMPERIAL HOLDINGS LIMITED Audited Annual Financial Statements for the year ended 30 June 2015
Land, buildings and leasehold improvementsThese assets need to be assessed annually for their residual value, useful lives and impairment. Buildings have estimated useful lives of up to 20 years. To arrive at the residual value of a building in today’s values the usage of the building and its forecasted residual value at the end of its useful life needs to be assessed and then this amount is present valued. This requires the use of capitalisation rates and discount factors with a high level of judgement.
To further advance the review, the group has a process of valuing its property portfolio to assess for impairments. All properties will be valued over a five year cycle. The valuation was done by an internal expert using the income approach method.
There were no material impairments during the year. The FRRC’s and the audit committee considered the carrying values to be fairly stated. Refer to notes 6 and 28 in the consolidated annual financial statements.
Goodwill and intangible assetsGoodwill and other indeterminate useful life intangible assets are assessed annually for impairment. The key assumptions used are cash flow projections, growth rates and discount rates applied. The cash flow projections are approved by senior management. The discount rates are established by an independent expert taking into account the geographic and other risk factors relating to the particular cash generating unit being assessed. The audit committee considered the impairment tests noting the assumptions used, their sensitivities and the head room. It is of the opinion that the carrying value of the goodwill is fairly stated.
Refer to note 4 in the annual financial statements for further details.
TaxThe Group operates in different jurisdictions with complex tax legislation requiring judgements needed in recognising tax liabilities. There are also judgements needed in recognising deferred tax assets.
The FRRC’s and audit committee questioned management on the computation and tax risks relating to the group. Where appropriate, the audit committee also considers the opinions of the group’s independent tax advisors. The audit committee considers the probability of the recovery of significant deferred tax assets, based on forecasts prepared by management.
No major tax issues arose during the year.
The effective tax rate of 26,6% was slightly down compared to 27,2% in the prior year. The tax rate benefitted from prior year over provisions.
Refer to notes 1.28, 8 and 31 in the consolidated annual financial statements for further details.
Maintenance and warranty contractsThis liability is required to cover contractual costs of maintenance and warranty work to be carried out in the future. The adequacy of this amount is actuarially determined by forecasted burn rates which are affected by exchange rates, inflation and incident levels. These require a high level of judgement.
Independent actuarial experts are used to determine the inputs needed resulting in the final liability. The FRRC is this area is chaired by an independent actuary to strengthen the review process.
The audit committee considers the assumptions supporting the liability to be reasonable and the carrying value to be fair.
Refer to notes 1.28 and 22 for further details.
Put option liabilitiesThis liability arises when new acquisitions have contractual obligations enabling non-controlling interest shareholders to put their shares back to the group at an agreed price. The initial recognition of this amount is debited directly to equity with subsequent movements to the liability recognised in the statement of profit or loss.
In arriving at the liability the future earnings need to be assessed and discounted back to calculate the present value. This requires a high level of judgement.
The FRRC chairman for this area questioned management on the inputs and considers that they resulted in a liability that fairly presents the obligation to be settled. The audit committee considers that the carrying value is fairly reflected.
Refer to notes 1.28, 23, 38.2 and the statement of changes in equity for further details.
Quality of earningsThere were no material once off income or expense items that affected the operating profit.
The reconciliation of Earnings Per Share (EPS) to Headline Earnings Per Share (HEPS) and Core EPS outlines the items of a non-operational nature affecting earnings and is outlined in note 32.
> REPORT OF THE AUDIT COMMITTEE FOR THE YEAR ENDED 30 JUNE 2015 – CONTINUED

11
Discontinued operationThe sale of Regent is regarded as highly probable in terms of the accounting standards. A buyer has been identified who is currently performing the due diligence. The sale will only be confirmed once the due diligence has been finalised, and all the commercial terms and regulatory approvals have been completed.
As a result the statement of profit and loss has been split between continuing and discontinued operations, and on the statement of financial position Regent’s assets are included under ‘Assets classified as held for sale’ and its liabilities under ‘Liabilities directly associated with assets classified as held for sale’. We also need to reflect the net assets held for sale at the lower of its carrying value and net realisable value. Our assessment is that there is no need for impairment.
The audit committee agrees with the classification of Regent as a discontinued operation and the disclosures made.
Refer to note 15 for further details.
RISK MANAGEMENT AND INFORMATION TECHNOLOGY (IT) GOVERNANCE The committee: > reviewed the group’s policies on risk assessment and risk management, including fraud risks and IT risks as they pertain to financial reporting and
the going concern assessment, and found them to be sound; and > considered the relevant findings and recommendations of the risk committee.
LEGAL AND REGULATORY REQUIREMENTS To the extent that these may have an impact on the annual financial statements, the committee: > reviewed legal matters that could have a material impact on the group; > reviewed the adequacy and effectiveness of the group’s procedures, including its risk management framework, to ensure compliance with legal
and regulatory responsibilities; > monitored complaints received via the group’s whistleblowing service; and > considered reports provided by management, internal audit and the external auditors regarding compliance with legal and regulatory requirements.
EXPERTISE AND EXPERIENCE OF CHIEF FINANCIAL OFFICER AND THE FINANCE FUNCTIONAs required by 3.84(h) of the JSE Limited Listings Requirements, the audit committee has satisfied itself that the chief financial officer, Mr OS Arbee, has the appropriate expertise and experience. In addition, the committee satisfied itself that the composition, experience and skills set of the finance function met the group’s requirements.
SUBSIDIARY COMPANIESThe functions of the committee are also performed for each subsidiary company of Imperial Holdings Limited that has not appointed an audit committee, on the basis that the committee delegates the performance of such functions to sub-committees referred to as finance and risk review committees. Divisional finance and risk review committees have been constituted and these committees report significant issues to the group audit committee. Each divisional finance and risk review committee is chaired by an independent chairman with no operational role in the group’s divisions.
INTEGRATED REPORTFollowing the review by the committee of the consolidated annual financial statements of Imperial Holdings Limited for the year ended 30 June 2015, the committee is of the view that in all material respects they comply with the relevant provisions of the Act and International Financial Reporting Standards and fairly present the consolidated and separate financial positions at that date and the results of operations and cash flows for the year then ended. The committee has also satisfied itself of the integrity of the integrated report and the sustainability information reported therein.
Having achieved its objectives, the committee has recommended the annual financial statements and the integrated report for the year ended 30 June 2015 for approval to the board. The board has subsequently approved the reports, which will be open for discussion at the forthcoming annual general meeting.
MJ LeemingChairman

12 IMPERIAL HOLDINGS LIMITED Audited Annual Financial Statements for the year ended 30 June 2015
> DIRECTORS’ REPORT FOR THE YEAR ENDED 30 JUNE 2015
NATURE OF BUSINESSImperial is a mobility group with activities spanning logistics, supply chain management, vehicle import, distribution and retail, car rental, parts and industrial equipment distribution and financial services. > All of these operations are conducted in South Africa. > Logistics operations are conducted in sub-Saharan Africa, Europe, South America and North America. > Vehicle retail operations are conducted in the United Kingdom, Australia and neighbouring countries in Africa. > Financial services operations are conducted in Botswana and Lesotho.
FINANCIAL PERFORMANCEThe net attributable profit for the year amounted to R3 054 million (2014: R3 272 million). Basic earnings per share for the year was 1 582 cents (2014: 1 687 cents).
The results for the year are set out in the consolidated statement of profit or loss on page 15 of this report.
SHARE CAPITALThe authorised and issued share capital is detailed in note 16 and the shares repurchased in note 17 to the annual financial statements.
The number of shares in issue on 30 June 2015 was as follows:
CompanyShares
repurchased Net
Ordinary sharesThe movements in the ordinary shares was as follows:Ordinary shares at the beginning of year 207 815 753 (7 864 456) 199 951 297Deferred ordinary shares converted to ordinary shares 831 469 831 469Ordinary shares repurchased (320 000) (320 000)Ordinary shares repurchased and cancelled during the year (5 864 944) (5 864 944)
Ordinary shares at the end of year 202 782 278 (8 184 456) 194 597 822
Deferred ordinary sharesThe movement in the number of deferred ordinary shares was as follows:Deferred ordinary shares at the beginning of year 11 025 236 11 025 236Converted into ordinary shares (831 469) (831 469)
Deferred ordinary shares at the end of year 10 193 767 10 193 767
Total issued share capital 212 976 045 (8 184 456) 204 791 589
Non-redeemable, non participating preference sharesOpening and closing balance 4 540 041 4 540 041
The preference shares are classified as interest bearing debt in the statement of financial position due to the cumulative nature of their dividend rights.
DIRECTORS AND SECRETARYThe names of the directors and secretary who presently hold office are set on the inside back cover of this report.
In accordance with the Memorandum of Incorporation, Messrs Y Waja, OS Arbee, MP de Canha, M Swanepoel and Ms P Langeni retire by rotation at the forthcoming annual general meeting but, being eligible, offer themselves for re-election and their re-election is recommended by the board. MJ Leeming will retire from the board at the end of August 2015.
In accordance with the Memorandum of Incorporation, the appointments of Messrs GW Dempster and P Cooper, who were appointed during the year are submitted for confirmation at the forthcoming annual general meeting. S Kana and RM Kgosana were appointed as directors with effect from 1 September 2015.
The aggregate interest of the directors in the issued ordinary share capital of the company is disclosed in note 40.
The board has considered and confirmed the suitability, qualifications and competence of the company secretary.

13
IMPERIAL HOLDINGS SHARE APPRECIATION RIGHTS, DEFERRED BONUS AND CONDITIONAL SHARE PLAN SCHEMESDetails of the rights granted in terms of the schemes are set out in note 18.2 of this report.
DIVIDENDSDetails of the dividends declared are set out in note 34 of this report.
SUBSIDIARIESDetails of the company’s principal subsidiaries are reflected in note 39 of this report.
Purchases by the group of material subsidiaries, was as follows:
MATERIAL SUBSIDIARIES ACQUIRED BY THE GROUP
Nature of business Percentage interest
Pharmed Pharmaceuticals (Pty) Limited (SA) Logistics 62,5Imres BV (Holland) Logistics 70S&B Commercials plc (UK) Commercial vehicle dealerships 100
MATERIAL SUBSIDIARIES DISPOSED OF BY THE GROUP
Nature of business Percentage interest
Dettmar (Europe) Logistics 100
DISCONTINUED OPERATIONSThe sale of Regent is regarded as highly probable in terms of the accounting standards. A buyer has been identified who is currently performing the due diligence. The sale will only be confirmed once the due diligence has been completed and all the commercial terms and the regulatory approvals have been obtained. The sale of Regent will result in the loss of a segment and it is therefore seen as a major line of business.
As a result the consolidated statement of profit and loss has been split between continuing and discontinued operations, and on the consolidated statement of financial position Regent’s assets are included under ‘Assets classified as held for sale’ and its liabilities under ‘Liabilities directly associated with assets classified as held for sale’. We also need to reflect the net assets classified as held for sale at the lower of its carrying value and net realisable value. Our assessment is that there is no need for impairment.
SPECIAL RESOLUTIONSThe company passed the following special resolutions at its annual general meeting held on 4 November 2014:
> Granting to the directors of the company general authority for the acquisition by the company or any subsidiary, of ordinary shares in the company.
> Granting to the directors of the company specific authority to provide financial assistance to related and inter related parties as contemplated in section 44 and 45 of the Companies Act, 2008 (the Act).
> Approving the directors’ fees payable from 1 July 2014 to the date of the next annual general meeting in 2015.
Subsidiaries of the company passed special resolutions, the nature of which might be significant to members in their appreciation of the state of affairs of the Group, as follows:
> Granting to the directors of the companies specific authority to provide financial assistance to related and inter related parties as contemplated in section 45 of the Act.
> Granting to the companies authority to make distributions as contemplated in section 46 of the Act. > Approving directors’ fees payable from 1 July 2014 to 30 June 2015. > Adopting new Memoranda of Incorporation.
EVENTS AFTER THE REPORTING PERIODShareholders are advised that an ordinary dividend of 445 cents per ordinary share has been declared by the board of Imperial on 24 August 2014.
ACCOUNTING POLICIES AND NEW AND REVISED STANDARDSThese are outlined in notes 1 to 3 of this report.
14 IMPERIAL HOLDINGS LIMITED Audited Annual Financial Statements for the year ended 30 June 2015
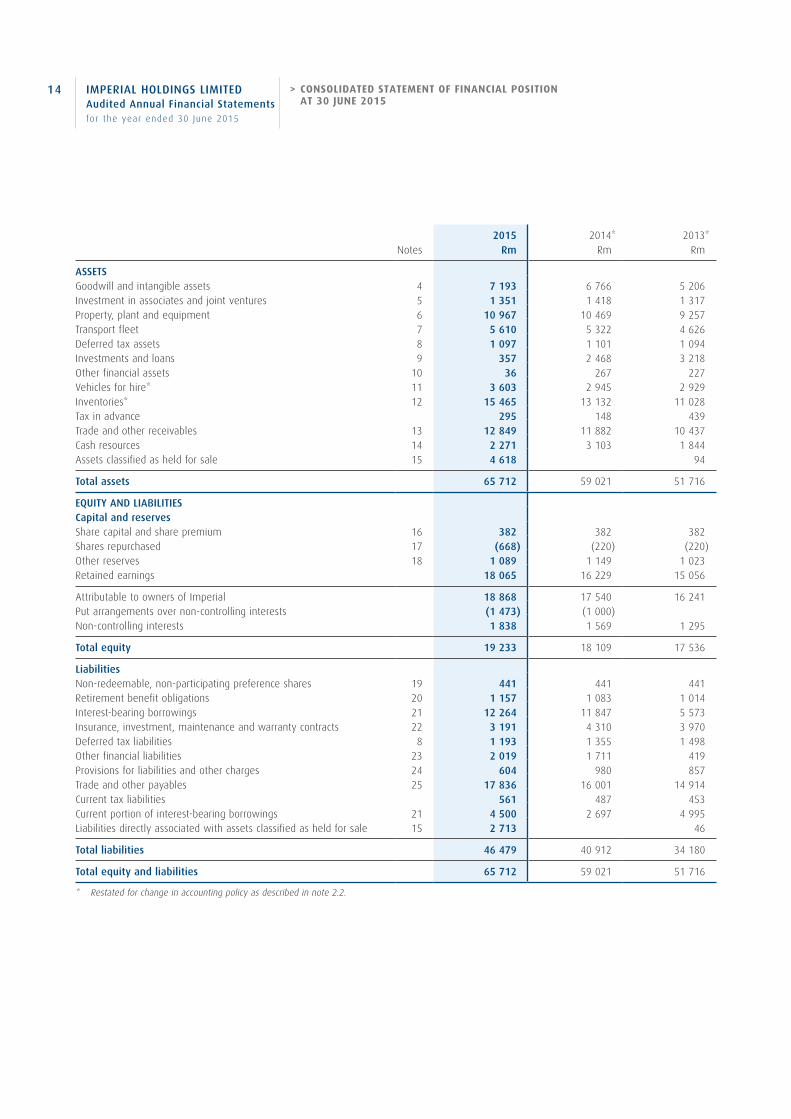
> CONSOLIDATED STATEMENT OF FINANCIAL POSITION AT 30 JUNE 2015
Notes2015
Rm2014*
Rm2013*
Rm
ASSETSGoodwill and intangible assets 4 7 193 6 766 5 206Investment in associates and joint ventures 5 1 351 1 418 1 317Property, plant and equipment 6 10 967 10 469 9 257Transport fleet 7 5 610 5 322 4 626Deferred tax assets 8 1 097 1 101 1 094Investments and loans 9 357 2 468 3 218Other financial assets 10 36 267 227Vehicles for hire* 11 3 603 2 945 2 929Inventories* 12 15 465 13 132 11 028Tax in advance 295 148 439Trade and other receivables 13 12 849 11 882 10 437Cash resources 14 2 271 3 103 1 844Assets classified as held for sale 15 4 618 94
Total assets 65 712 59 021 51 716
EQUITY AND LIABILITIESCapital and reservesShare capital and share premium 16 382 382 382Shares repurchased 17 (668) (220) (220)Other reserves 18 1 089 1 149 1 023Retained earnings 18 065 16 229 15 056
Attributable to owners of Imperial 18 868 17 540 16 241Put arrangements over non-controlling interests (1 473) (1 000)Non-controlling interests 1 838 1 569 1 295
Total equity 19 233 18 109 17 536
LiabilitiesNon-redeemable, non-participating preference shares 19 441 441 441Retirement benefit obligations 20 1 157 1 083 1 014Interest-bearing borrowings 21 12 264 11 847 5 573Insurance, investment, maintenance and warranty contracts 22 3 191 4 310 3 970Deferred tax liabilities 8 1 193 1 355 1 498Other financial liabilities 23 2 019 1 711 419Provisions for liabilities and other charges 24 604 980 857Trade and other payables 25 17 836 16 001 14 914Current tax liabilities 561 487 453Current portion of interest-bearing borrowings 21 4 500 2 697 4 995Liabilities directly associated with assets classified as held for sale 15 2 713 46
Total liabilities 46 479 40 912 34 180
Total equity and liabilities 65 712 59 021 51 716
* Restated for change in accounting policy as described in note 2.2.

IMPERIAL HOLDINGS LIMITED Audited Annual Financial Statements for the year ended 30 June 2015
15
Notes2015
Rm2014*
Rm
Continuing operationsRevenue 26 107 453 100 662Net operating expenses 27 (99 290) (92 667)
Profit from operations before depreciation and recoupments 8 163 7 995Depreciation, amortisation, impairments and recoupments 28 (2 492) (2 264)
Operating profit 5 671 5 731Recoupments from sale of properties, net of impairments 28 29 110Amortisation of intangible assets arising on business combinations 28 (415) (336)Other non-operating items 29 (80) (149)
Profit before net financing costs 5 205 5 356Finance cost including fair value gains and losses 30 (1 326) (1 052)Finance income 30 132 126
Profit before share of results of associates and joint ventures 4 011 4 430Share of result of associates and joint ventures 33 78
Profit before tax 4 044 4 508Income tax expense 31 (1 035) (1 171)
Profit for the year from continuing operations 3 009 3 337
Discontinued operationsProfit for the year from discontinued operations 15 377 290
Net profit for the year 3 386 3 627
Net profit attributable to:Owners of Imperial 3 054 3 272
Continuing operations 2 735 3 025Discontinued operations 319 247
Non-controlling interests 332 355
Continuing operations 274 312Discontinued operations 58 43
3 386 3 627
Earnings per share (cents) 32Continuing operations– Basic 1 416 1 559– Diluted 1 406 1 542
Discontinued operations– Basic 166 128– Diluted 162 124
Total operations– Basic 1 582 1 687– Diluted 1 568 1 666
* Restated for change in accounting policy as described in note 2.2 and re-presented for continuing and discontinued operations as described in note 2.1.
> CONSOLIDATED STATEMENT OF PROFIT OR LOSS FOR THE YEAR ENDED 30 JUNE 2015

16 IMPERIAL HOLDINGS LIMITED Audited Annual Financial Statements for the year ended 30 June 2015
2015Rm
2014Rm
Net profit for the year 3 386 3 627Other comprehensive (losses) income (268) 177
Items that may be reclassified subsequently to profit or loss (172) 133
Exchange (losses) gains arising on translation of foreign operations (304) 533
– Movement in translation reserve (312) 521– Share of associates' and joint ventures movement in translation reserve 8 12
Movement in valuation reserve (36) 36
– Fair value (loss) gain on available-for-sale investment (87) 45– Reclassification of loss (gain) on disposal of available-for-sale investment 43 (1)– Income tax relating to fair value loss (gain) on available-for-sale investment 8 (8)
Movement in hedge accounting reserve 168 (436)
– Effective portion of change in fair value of cash flow hedges 150 (318)– Amounts reclassified from hedge accounting reserve on matured contracts 25 (102)– Share of associates' and joint ventures movement in hedge accounting reserve (14)– Income tax relating to hedge accounting reserve movements (7) (2)
Items that will not be reclassified subsequently to profit or loss (96) 44
Remeasurement of defined benefit obligations (137) 64Income tax relating to remeasurement of defined benefit obligations 41 (20)
Total comprehensive income for the year 3 118 3 804
Total comprehensive income attributable to:Owners of Imperial 2 762 3 486Non-controlling interests 356 318
3 118 3 804
> CONSOLIDATED STATEMENT OF COMPREHENSIVE INCOME FOR THE YEAR ENDED 30 JUNE 2015

IMPERIAL HOLDINGS LIMITED Audited Annual Financial Statements for the year ended 30 June 2015
17
Notes2015
Rm2014*
Rm
Cash flows from operating activitiesCash receipts from customers 109 772 102 643Cash paid to suppliers and employees (100 773) (96 670)
Cash generated by operations before capital expenditure on rental assets 33.1 8 999 5 973Expansion capital expenditure – rental assets (772) (331)Net replacement capital expenditure – rental assets (759) (480)
– Expenditure (2 496) (2 543)– Proceeds 1 737 2 063
Cash generated by operations 7 468 5 162Finance cost paid (1 312) (1 052)Finance income received 132 126Tax paid (1 301) (1 267)
4 987 2 969
Cash flows from investing activitiesAcquisition of subsidiaries and businesses 33.2 (991) (276)Disposal of subsidiaries and businesses 33.3 53 (21)Expansion capital expenditure – excluding rental assets (1 743) (1 626)
– Property (744) (790)– Transport fleet (999) (836)
Net replacement capital expenditure – excluding rental assets 33.4 (1 245) (1 162)
– Intangible assets (361) (142)– Plant and equipment (703) (597)– Transport fleet (181) (423)
Net movement in associates and joint ventures 178 (144)Net movement in investments, loans and other financial instruments (1 203) 1 113
(4 951) (2 116)
Cash flows from financing activitiesHedge cost premium paid (128) (108)Ordinary shares repurchased (2014: repurchased and cancelled) (56) (502)Dividends paid (1 724) (1 940)Change in non-controlling interests (90) (364)Capital raised from non-controlling interests 1 89Repayment of corporate bond (1 500)Proceeds from the issue of corporate bonds 3 000Net increase in other interest-bearing borrowings 487 1 805
(1 510) 480
Net (decrease) increase in cash and cash equivalents (1 474) 1 333Effects of exchange rate changes on cash resources in foreign currencies 7 45Cash and cash equivalents at beginning of year 898 (480)
Cash and cash equivalents at end of year 33.5 (569) 898
* Restated for change in accounting policy as described in note 2.2.
> CONSOLIDATED STATEMENT OF CASH FLOWS FOR THE YEAR ENDED 30 JUNE 2015

18 IMPERIAL HOLDINGS LIMITED Audited Annual Financial Statements for the year ended 30 June 2015
> CONSOLIDATED STATEMENT OF CHANGES IN EQUITY FOR THE YEAR ENDED 30 JUNE 2015
Other reserves
Share capital
and share premium
Rm
Shares repurchased
Rm
Share-based
payment reserve
Rm
Hedge accounting
reserveRm
Statutory reserve
Rm
Foreign currency
translationreserve
Rm
Premium paid on
purchase ofnon-
controlling interests
Rm
Valuation reserve
Rm
Changes in net asset of
associates and joint ventures
Rm
Retained earnings
Rm
Attributable to owners
of ImperialRm
*Put arrangements
over non- controlling
interestsRm
Non- controlling
interestsRm
Total equity
Rm
At 30 June 2013 382 (220) (267) 317 173 951 (157) 6 15 056 16 241 1 295 17 536
Net attributable profit for the year 3 272 3 272 355 3 627Other comprehensive income (385) 519 36 44 214 (37) 177
Total comprehensive income for the year (385) 519 36 3 316 3 486 318 3 804Movements in statutory reserve 10 (10)Share-based cost charged to profit or loss 101 101 3 104Share-based equity reserve transferred to retained earnings on vesting (16) 16Share-based equity reserve hedging cost utilisation (96) 1 (95) (5) (100)Charge for amending the conversion profile of deferred ordinary shares 70 70 70Dividend of 440 cents per ordinary share in September 2013 (854) (854) (854)Dividend of 400 cents per ordinary share in March 2014 (764) (764) (764)Repurchase and cancellation of 2 971 808 ordinary shares from the open market at an average price of R168,85 (502) (502) (502)Initial recognition of put options written over non-controlling interest (1 289) (1 289)Share of changes in net assets in associates and joint ventures 91 91 91Non-controlling interests disposed, net of acquisitions and shares issued (9) (9) 376 367Net decrease in non-controlling interests through buy-outs (225) (225) 289 (96) (32)Realisation on disposal of subsidiaries 27 2 (29)Non-controlling interests share of dividends (322) (322)
At 30 June 2014 382 (220) (208) (68) 183 1 470 (364) 44 92 16 229 17 540 (1 000) 1 569 18 109
Net attributable profit for the year 3 054 3 054 332 3 386Other comprehensive income 146 (309) (36) (93) (292) 24 (268)
Total comprehensive income for the year 146 (309) (36) 2 961 2 762 356 3 118
Movements in statutory reserve 39 (39)Share-based cost charged to profit or loss 126 126 4 130Share-based equity reserve transferred to retained earnings on vesting 7 (7)Share-based equity reserve hedge refund 7 7 (3) 4Dividend of 420 cents per ordinary share in September 2014 (804) (804) (804)Repurchase of 320 000 shares from the open market at an average price of R172,68, plus transaction cost (56) (56) (56)Initial recognition of put options written over non-controlling interest (473) (473)Dividend of 350 cents per ordinary share in March 2015 (667) (667) (667)Cancellation of 5 864 944 ordinary shares held by Lereko Mobility 665 (665)Re-allocation of prior years' intergroup surplus on shares cancelled (1 057) 1 057Share of changes in net assets in associates and joint ventures (3) (2) (5) (5)Realisation on disposal of subsidiaries 12 12 12Non-controlling interests acquired, net of disposals and shares issued 208 208Net decrease in non-controlling interests through buy-outs (47) (47) (43) (90)Non-controlling interests share of dividends (253) (253)
At 30 June 2015 382 (668) (71) 78 222 1 161 (399) 8 90 18 065 18 868 (1 473) 1 838 19 233
* Initial fair value of the put option liability relating to the additional 30% that the Group will acquire from the non-controlling shareholders in Imres BV. The initial recognition of the put options written in the prior year relates to non-controlling interest in Eco Health Limited.

19
Other reserves
Share capital
and share premium
Rm
Shares repurchased
Rm
Share-based
payment reserve
Rm
Hedge accounting
reserveRm
Statutory reserve
Rm
Foreign currency
translationreserve
Rm
Premium paid on
purchase ofnon-
controlling interests
Rm
Valuation reserve
Rm
Changes in net asset of
associates and joint ventures
Rm
Retained earnings
Rm
Attributable to owners
of ImperialRm
*Put arrangements
over non- controlling
interestsRm
Non- controlling
interestsRm
Total equity
Rm
At 30 June 2013 382 (220) (267) 317 173 951 (157) 6 15 056 16 241 1 295 17 536
Net attributable profit for the year 3 272 3 272 355 3 627Other comprehensive income (385) 519 36 44 214 (37) 177
Total comprehensive income for the year (385) 519 36 3 316 3 486 318 3 804Movements in statutory reserve 10 (10)Share-based cost charged to profit or loss 101 101 3 104Share-based equity reserve transferred to retained earnings on vesting (16) 16Share-based equity reserve hedging cost utilisation (96) 1 (95) (5) (100)Charge for amending the conversion profile of deferred ordinary shares 70 70 70Dividend of 440 cents per ordinary share in September 2013 (854) (854) (854)Dividend of 400 cents per ordinary share in March 2014 (764) (764) (764)Repurchase and cancellation of 2 971 808 ordinary shares from the open market at an average price of R168,85 (502) (502) (502)Initial recognition of put options written over non-controlling interest (1 289) (1 289)Share of changes in net assets in associates and joint ventures 91 91 91Non-controlling interests disposed, net of acquisitions and shares issued (9) (9) 376 367Net decrease in non-controlling interests through buy-outs (225) (225) 289 (96) (32)Realisation on disposal of subsidiaries 27 2 (29)Non-controlling interests share of dividends (322) (322)
At 30 June 2014 382 (220) (208) (68) 183 1 470 (364) 44 92 16 229 17 540 (1 000) 1 569 18 109
Net attributable profit for the year 3 054 3 054 332 3 386Other comprehensive income 146 (309) (36) (93) (292) 24 (268)
Total comprehensive income for the year 146 (309) (36) 2 961 2 762 356 3 118
Movements in statutory reserve 39 (39)Share-based cost charged to profit or loss 126 126 4 130Share-based equity reserve transferred to retained earnings on vesting 7 (7)Share-based equity reserve hedge refund 7 7 (3) 4Dividend of 420 cents per ordinary share in September 2014 (804) (804) (804)Repurchase of 320 000 shares from the open market at an average price of R172,68, plus transaction cost (56) (56) (56)Initial recognition of put options written over non-controlling interest (473) (473)Dividend of 350 cents per ordinary share in March 2015 (667) (667) (667)Cancellation of 5 864 944 ordinary shares held by Lereko Mobility 665 (665)Re-allocation of prior years' intergroup surplus on shares cancelled (1 057) 1 057Share of changes in net assets in associates and joint ventures (3) (2) (5) (5)Realisation on disposal of subsidiaries 12 12 12Non-controlling interests acquired, net of disposals and shares issued 208 208Net decrease in non-controlling interests through buy-outs (47) (47) (43) (90)Non-controlling interests share of dividends (253) (253)
At 30 June 2015 382 (668) (71) 78 222 1 161 (399) 8 90 18 065 18 868 (1 473) 1 838 19 233
* Initial fair value of the put option liability relating to the additional 30% that the Group will acquire from the non-controlling shareholders in Imres BV. The initial recognition of the put options written in the prior year relates to non-controlling interest in Eco Health Limited.

20 IMPERIAL HOLDINGS LIMITED Audited Annual Financial Statements for the year ended 30 June 2015
> SEGMENTAL INFORMATION FOR THE YEAR ENDED 30 JUNE 2015
Group Logistics Africa Logistics InternationalVehicle Import, Distribution
and DealershipsVehicle Retail, Rental
and After Market PartsMotor-related Financial Services
and products Head-Office and Eliminations
R million 2015 2014^ 2015 2014 2015 2014 2015 2014^ 2015 2014^ 2015 2014^ 2015 2014^
Segment profit or loss – Continuing operations
Revenue 107 453 100 662 25 347 22 090 19 071 19 249 27 437 27 100 37 547 34 014 1 429 1 166 (3 378) (2 957)
– South Africa 67 101 66 191 15 372 15 755 23 898 23 611 29 780 28 616 1 429 1 166 (3 378) (2 957)– Rest of Africa 10 481 6 818 9 974 6 319 388 390 119 109 – International 29 871 27 653 1 16 19 071 19 249 3 151 3 099 7 648 5 289
Operating profit 5 671 5 731 1 587 1 270 958 971 960 1 518 1 677 1 569 620 587 (131) (184)
– South Africa 3 828 4 248 952 939 885 1 475 1 491 1 421 620 587 (120) (174)– Rest of Africa 668 367 632 334 4 6 32 27 – International 1 175 1 116 3 (3) 958 971 71 37 154 121 (11) (10)
Depreciation, amortisation, impairments and recoupments 2 878 2 490 924 773 739 765 546 401 662 566 117 63 (110) (78)
– South Africa 1 754 1 480 636 604 531 389 579 504 117 63 (109) (80)– Rest of Africa 305 184 288 169 3 2 14 13 – International 819 826 739 765 12 10 69 49 (1) 2
Net finance costs 1 194 926 407 327 180 180 494 360 313 279 (200) (220)
– South Africa 825 652 281 265 473 341 271 255 (200) (209)– Rest of Africa 135 70 126 62 3 3 6 5 – International 234 204 180 180 18 16 36 19 (11)
Pre-tax profits* 4 093 4 473 1 037 865 647 555 458 1 165 1 388 1 371 647 616 (84) (99)
– South Africa 2 893 3 593 661 677 399 1 135 1 260 1 256 647 616 (74) (91)– Rest of Africa 404 219 373 191 5 6 26 22 – International 796 661 3 (3) 647 555 54 24 102 93 (10) (8)
Additional segment information – Continuing operations Analysis of revenue by type
– Sale of goods 63 966 57 497 8 216 4 964 23 441 23 475 32 308 29 057 1 1– Rendering of services 43 487 43 165 17 008 17 005 19 070 19 222 2 295 2 218** 4 515 4 301 594 434 5 (15)
107 453 100 662 25 224 21 969 19 070 19 222 25 736 25 693 36 823 33 358 594 434 6 (14)Inter-group revenue 123 121 1 27 1 701 1 407** 724 656 835 732 (3 384) (2 943)
107 453 100 662 25 347 22 090 19 071 19 249 27 437 27 100 37 547 34 014 1 429 1 166 (3 378) (2 957)
Analysis of depreciation, amortisation, impairment and recoupments 2 878 2 490 924 773 739 765 546 401 662 566 117 63 (110) (78)
– Depreciation and amortisation 2 520 2 296 731 695 575 591 553 404 659 620 117 63 (115) (77)– Recoupments and impairments (57) (142) (20) (46) (16) (19) (7) (3) (19) (73) 5 (1)– Amortisation of intangible assets arising on
business combinations 415 336 213 124 180 193 22 19
Share of result of associates and joint ventures included in pre-tax profits 33 78 34 40 25 31 (3) 9 33 26 27 29 (83) (57)
^ Restated as described in note 2 on page 38.* Pre-tax profits is calculated as profit before tax, impairment of goodwill and profit or loss on sale of investment in subsidiaries, associates and joint ventures and
other businesses.** The 2014 revenue split has a misallocation between “Rendering of services” and “Inter-group revenue” of R140 million. The revised figures are:
– Rendering of services – R2 078 million – Inter-group revenue – R1 547 million

21
Group Logistics Africa Logistics InternationalVehicle Import, Distribution
and DealershipsVehicle Retail, Rental
and After Market PartsMotor-related Financial Services
and products Head-Office and Eliminations
R million 2015 2014^ 2015 2014 2015 2014 2015 2014^ 2015 2014^ 2015 2014^ 2015 2014^
Segment profit or loss – Continuing operations
Revenue 107 453 100 662 25 347 22 090 19 071 19 249 27 437 27 100 37 547 34 014 1 429 1 166 (3 378) (2 957)
– South Africa 67 101 66 191 15 372 15 755 23 898 23 611 29 780 28 616 1 429 1 166 (3 378) (2 957)– Rest of Africa 10 481 6 818 9 974 6 319 388 390 119 109 – International 29 871 27 653 1 16 19 071 19 249 3 151 3 099 7 648 5 289
Operating profit 5 671 5 731 1 587 1 270 958 971 960 1 518 1 677 1 569 620 587 (131) (184)
– South Africa 3 828 4 248 952 939 885 1 475 1 491 1 421 620 587 (120) (174)– Rest of Africa 668 367 632 334 4 6 32 27 – International 1 175 1 116 3 (3) 958 971 71 37 154 121 (11) (10)
Depreciation, amortisation, impairments and recoupments 2 878 2 490 924 773 739 765 546 401 662 566 117 63 (110) (78)
– South Africa 1 754 1 480 636 604 531 389 579 504 117 63 (109) (80)– Rest of Africa 305 184 288 169 3 2 14 13 – International 819 826 739 765 12 10 69 49 (1) 2
Net finance costs 1 194 926 407 327 180 180 494 360 313 279 (200) (220)
– South Africa 825 652 281 265 473 341 271 255 (200) (209)– Rest of Africa 135 70 126 62 3 3 6 5 – International 234 204 180 180 18 16 36 19 (11)
Pre-tax profits* 4 093 4 473 1 037 865 647 555 458 1 165 1 388 1 371 647 616 (84) (99)
– South Africa 2 893 3 593 661 677 399 1 135 1 260 1 256 647 616 (74) (91)– Rest of Africa 404 219 373 191 5 6 26 22 – International 796 661 3 (3) 647 555 54 24 102 93 (10) (8)
Additional segment information – Continuing operations Analysis of revenue by type
– Sale of goods 63 966 57 497 8 216 4 964 23 441 23 475 32 308 29 057 1 1– Rendering of services 43 487 43 165 17 008 17 005 19 070 19 222 2 295 2 218** 4 515 4 301 594 434 5 (15)
107 453 100 662 25 224 21 969 19 070 19 222 25 736 25 693 36 823 33 358 594 434 6 (14)Inter-group revenue 123 121 1 27 1 701 1 407** 724 656 835 732 (3 384) (2 943)
107 453 100 662 25 347 22 090 19 071 19 249 27 437 27 100 37 547 34 014 1 429 1 166 (3 378) (2 957)
Analysis of depreciation, amortisation, impairment and recoupments 2 878 2 490 924 773 739 765 546 401 662 566 117 63 (110) (78)
– Depreciation and amortisation 2 520 2 296 731 695 575 591 553 404 659 620 117 63 (115) (77)– Recoupments and impairments (57) (142) (20) (46) (16) (19) (7) (3) (19) (73) 5 (1)– Amortisation of intangible assets arising on
business combinations 415 336 213 124 180 193 22 19
Share of result of associates and joint ventures included in pre-tax profits 33 78 34 40 25 31 (3) 9 33 26 27 29 (83) (57)
^ Restated as described in note 2 on page 38.* Pre-tax profits is calculated as profit before tax, impairment of goodwill and profit or loss on sale of investment in subsidiaries, associates and joint ventures and
other businesses.** The 2014 revenue split has a misallocation between “Rendering of services” and “Inter-group revenue” of R140 million. The revised figures are:
– Rendering of services – R2 078 million – Inter-group revenue – R1 547 million

22 IMPERIAL HOLDINGS LIMITED Audited Annual Financial Statements for the year ended 30 June 2015
> SEGMENTAL INFORMATION FOR THE YEAR ENDED 30 JUNE 2015 – CONTINUED
Group Logistics Africa Logistics International
Vehicle Import, Distribution and
DealershipsVehicle Retail, Rental
and After Market PartsMotor-related Financial Services and products
Head-Office and Eliminations Insurance
R million 2015 2014^ 2015 2014 2015 2014 2015 2014^ 2015 2014^ 2015 2014^ 2015 2014^ 2015~ 2014
Segment financial positionOperating assets1 56 944 55 968 15 310 12 702 11 250 11 543 15 350 14 351 13 702 11 822 2 647 1 905 (1 315) (740) 4 385
– South Africa 34 312 35 081 9 034 8 225 13 885 12 809 10 113 9 797 2 647 1 905 (1 367) (873) 3 218– Rest of Africa 6 557 5 903 6 275 4 476 201 198 81 62 1 167– International 16 075 14 984 1 1 11 250 11 543 1 264 1 344 3 508 1 963 52 133
Fixed assets included in operating assets 20 180 18 736 5 308 5 060 4 682 4 358 5 103 4 476 4 982 4 961 997 469 (892) (724) 136
– Property, plant and equipment 10 967 10 469 2 096 1 739 2 244 2 319 3 346 3 210 3 313 3 348 9 9 (41) (292) 136– Transport fleet 5 610 5 322 3 212 3 321 2 438 2 039 (40) (38) – Vehicles for hire 3 603 2 945 1 757 1 266 1 669 1 613 988 460 (811) (394)
Operating liabilities2 23 167 22 802 5 512 4 649 4 304 4 512 5 594 4 172 5 263 4 298 3 468 3 141 (974) (542) 2 572
– South Africa 14 794 14 636 3 682 3 307 5 358 3 917 3 338 3 224 3 468 3 141 (1 052) (743) 1 790– Rest of Africa 1 896 2 212 1 824 1 342 62 74 10 14 782– International 6 477 5 954 6 4 304 4 512 174 181 1 915 1 060 78 201
Net working capital3 9 874 8 033 1 183 527 416 271 4 294 5 319 2 707 2 156 565 447 709 242 (929)
– South Africa 7 253 6 516 336 74 3 834 4 843 1 924 1 828 565 447 594 95 (771)– Rest of Africa 924 343 852 453 62 52 11 (1) (1) (3) (158)– International 1 697 1 174 (5) 416 271 398 424 772 329 116 150
Net debt4 14 493 11 882 4 872 3 778 4 150 4 062 4 661 5 465 3 089 2 420 (1 738) (2 002) (541) (202) (1 639)
– South Africa 7 763 6 771 2 669 2 344 4 185 4 921 2 199 2 052 (1 738) (2 002) 448 614 (1 158)– Rest of Africa 2 454 1 166 2 209 1 433 194 183 51 31 (481)– International 4 276 3 945 (6) 1 4 150 4 062 282 361 839 337 (989) (816)
Net capital expenditure 4 519 3 599 1 046 887 1 173 1 119 1 199 998 844 633 649 224 (500) (316) 108 54
– South Africa 2 856 1 978 711 666 1 182 792 710 560 649 224 (501) (316) 105 52– Rest of Africa 369 250 335 221 8 1 23 26 3 2– International 1 294 1 371 1 173 1 119 9 205 111 47 1
^ Restated as described in note 2 on page 38.~ The assets and liabilities of the Insurance business are shown as held-for-sale at 30 June 2015.1 Operating assets is total assets less loans receivable, tax assets, assets classified as held for sale and cash resources in respect of non-financial services segments.2 Operating liabilities is total liabilities less non-redeemable, non-participating preference shares, interest-bearing borrowings, tax liabilities, put option liabilities and
liabilities directly associated with assets classified as held for sale.3 Net working capital consists of inventories, trade and other receivables, trade and other payables and provisions.4 Net debt is the aggregate of interest-bearing borrowings, non-redeemable, non-participating preference shares less cash resources.

23
Group Logistics Africa Logistics International
Vehicle Import, Distribution and
DealershipsVehicle Retail, Rental
and After Market PartsMotor-related Financial Services and products
Head-Office and Eliminations Insurance
R million 2015 2014^ 2015 2014 2015 2014 2015 2014^ 2015 2014^ 2015 2014^ 2015 2014^ 2015~ 2014
Segment financial positionOperating assets1 56 944 55 968 15 310 12 702 11 250 11 543 15 350 14 351 13 702 11 822 2 647 1 905 (1 315) (740) 4 385
– South Africa 34 312 35 081 9 034 8 225 13 885 12 809 10 113 9 797 2 647 1 905 (1 367) (873) 3 218– Rest of Africa 6 557 5 903 6 275 4 476 201 198 81 62 1 167– International 16 075 14 984 1 1 11 250 11 543 1 264 1 344 3 508 1 963 52 133
Fixed assets included in operating assets 20 180 18 736 5 308 5 060 4 682 4 358 5 103 4 476 4 982 4 961 997 469 (892) (724) 136
– Property, plant and equipment 10 967 10 469 2 096 1 739 2 244 2 319 3 346 3 210 3 313 3 348 9 9 (41) (292) 136– Transport fleet 5 610 5 322 3 212 3 321 2 438 2 039 (40) (38) – Vehicles for hire 3 603 2 945 1 757 1 266 1 669 1 613 988 460 (811) (394)
Operating liabilities2 23 167 22 802 5 512 4 649 4 304 4 512 5 594 4 172 5 263 4 298 3 468 3 141 (974) (542) 2 572
– South Africa 14 794 14 636 3 682 3 307 5 358 3 917 3 338 3 224 3 468 3 141 (1 052) (743) 1 790– Rest of Africa 1 896 2 212 1 824 1 342 62 74 10 14 782– International 6 477 5 954 6 4 304 4 512 174 181 1 915 1 060 78 201
Net working capital3 9 874 8 033 1 183 527 416 271 4 294 5 319 2 707 2 156 565 447 709 242 (929)
– South Africa 7 253 6 516 336 74 3 834 4 843 1 924 1 828 565 447 594 95 (771)– Rest of Africa 924 343 852 453 62 52 11 (1) (1) (3) (158)– International 1 697 1 174 (5) 416 271 398 424 772 329 116 150
Net debt4 14 493 11 882 4 872 3 778 4 150 4 062 4 661 5 465 3 089 2 420 (1 738) (2 002) (541) (202) (1 639)
– South Africa 7 763 6 771 2 669 2 344 4 185 4 921 2 199 2 052 (1 738) (2 002) 448 614 (1 158)– Rest of Africa 2 454 1 166 2 209 1 433 194 183 51 31 (481)– International 4 276 3 945 (6) 1 4 150 4 062 282 361 839 337 (989) (816)
Net capital expenditure 4 519 3 599 1 046 887 1 173 1 119 1 199 998 844 633 649 224 (500) (316) 108 54
– South Africa 2 856 1 978 711 666 1 182 792 710 560 649 224 (501) (316) 105 52– Rest of Africa 369 250 335 221 8 1 23 26 3 2– International 1 294 1 371 1 173 1 119 9 205 111 47 1
^ Restated as described in note 2 on page 38.~ The assets and liabilities of the Insurance business are shown as held-for-sale at 30 June 2015.1 Operating assets is total assets less loans receivable, tax assets, assets classified as held for sale and cash resources in respect of non-financial services segments.2 Operating liabilities is total liabilities less non-redeemable, non-participating preference shares, interest-bearing borrowings, tax liabilities, put option liabilities and
liabilities directly associated with assets classified as held for sale.3 Net working capital consists of inventories, trade and other receivables, trade and other payables and provisions.4 Net debt is the aggregate of interest-bearing borrowings, non-redeemable, non-participating preference shares less cash resources.

24 IMPERIAL HOLDINGS LIMITED Audited Annual Financial Statements for the year ended 30 June 2015
1. ACCOUNTING POLICIESThe principal accounting policies adopted and the methods of computation used in the preparation of these consolidated annual financial statements are set out below and are consistent in all material respects with those applied during the previous year except for the changes in accounting policies disclosed in note 2.2 and adoption of new and amended statements and interpretations as disclosed in note 2.4.
1.1 STATEMENT OF COMPLIANCEThe consolidated annual financial statements are stated in South African Rand and are prepared in accordance with International Financial Reporting Standards (IFRS) and its interpretations adopted by the International Accounting Standards Board (IASB) in issue and effective for the Group at 30 June 2015 and the SAICA Financial Reporting Guides, as issued by the Accounting Practices Committee and financial reporting pronouncements as issued by the Financial Reporting Standards Council and the Companies Act of South Africa, 2008.
1.2 BASIS OF MEASUREMENTThe consolidated annual financial statements are prepared on the historical cost basis, modified by the restatement of certain financial instruments to fair value and insurance and defined retirement benefit liabilities in accordance with actuarial valuations.
1.3 INSURANCEDetailed accounting policies and other disclosures specifically covering insurance companies are outlined in Annexure A.
1.4 CONSOLIDATIONThe consolidated annual financial statements incorporate the financial statements of the company and entities controlled by the company (its subsidiaries).
The Group controls an investee when it is exposed, or has rights, to variable returns from its involvement with the investee and has the ability to affect those returns through its power over the investee.
Income and expenses of subsidiaries acquired or disposed of during the year are included in or removed from profit or loss and other comprehensive income from the date on which control was obtained or lost respectively.
Total comprehensive income of subsidiaries is attributed to owners of Imperial and to non-controlling interests even if this results in non-controlling interests having a deficit balance.
In preparing the consolidated financial statements where a subsidiary of the Group uses accounting policies other than those adopted in the consolidated financial statements for like transactions, appropriate adjustments are made to its financial statements to bring it in line with the Group’s accounting policies.
All intergroup transactions, balances and unrealised income and expenses are eliminated in full.
Changes in the Group’s ownership interest in subsidiaries that do not result in the Group losing control over the subsidiaries are accounted for in equity. Any difference between the amount by which non-controlling interests is adjusted and the fair value of the consideration paid or received is recognised directly to the premium paid on purchase of non-controlling interests reserve in equity.
When the Group loses control of a subsidiary a gain or loss is recognised in profit or loss.
The fair value of any investment retained in the former subsidiary at the date when control is lost is regarded as the fair value on initial recognition for subsequent accounting under IAS 39 – Financial Instruments: Recognition and Measurement or, when applicable, the cost on initial recognition of an investment in associate or a jointly controlled entity.
> NOTES TO THE CONSOLIDATED ANNUAL FINANCIAL STATEMENTS FOR THE YEAR ENDED 30 JUNE 2015

25
1.5 BUSINESS COMBINATIONSAcquisitions of businesses are accounted for using the acquisition method as described below.
An acquisition is considered a business combination if the assets acquired and liabilities assumed constitute a business.
The consideration transferred in a business combination is measured at fair value, which includes the fair value of the acquisition date asset and any liability resulting from a contingent consideration arrangement.
Acquisition-related costs are expensed in profit or loss as incurred.
At the acquisition date, the identifiable assets acquired and liabilities assumed are measured at fair value except for deferred tax assets or liabilities, and assets or liabilities related to employee benefit arrangements which are recognised and measured in accordance with IAS 12 – Income Taxes and IAS 19 – Employee Benefits respectively.
The excess of the aggregate of the consideration transferred, the non-controlling interest and the acquisition date fair value of previously held equity interest over the fair value of the identifiable net assets acquired is recognised as goodwill. If the cost of acquisition is below the fair values of the identifiable net assets acquired (i.e. bargain purchase), then the difference is credited to profit or loss in the period of acquisition.
The non-controlling interests are measured at their proportionate share of the fair value of the identifiable assets acquired and liabilities assumed.
When the consideration transferred includes a contingent consideration, that contingent consideration is recognised as a liability and measured at its acquisition-date fair value and included in the consideration transferred in a business combination. The contingent consideration is remeasured at subsequent dates to its fair value through profit or loss.
When the business combination is achieved in stages, the Group’s previously held equity interest in the acquiree is remeasured to fair value with the resulting gain or loss recognised in profit or loss.
If the initial accounting for a business combination is incomplete by the end of the reporting period in which the business combination occurs, the Group reports provisional amounts for the items where the accounting is incomplete. Those provisional amounts are adjusted during the measurement period where applicable.
1.6 FOREIGN CURRENCIESTransactions denominated in a foreign currency are recorded at the rates of exchange prevailing at the dates of the transactions.
At the end of each reporting period, monetary items denominated in foreign currencies are retranslated at the rates prevailing at that date.
Exchange differences on monetary items are recognised in profit or loss in the period in which they arise except for exchange differences on transactions entered into in order to hedge certain foreign currency risks which are recognised in other comprehensive income and accumulated in the hedge accounting reserve in equity.
For the purpose of presenting consolidated financial statements, the assets and liabilities of the Group’s foreign operations are translated into Rand using exchange rates prevailing at the end of each reporting period. Income and expense items are translated at the weighted average exchange rates for the period.
Exchange differences arising on translating foreign operations are recognised in other comprehensive income and accumulated in the foreign currency translation reserve in equity.
On disposal of a foreign operation all the exchange differences accumulated in equity in respect of that operation attributable to owners of Imperial are reclassified to profit or loss.
Goodwill and fair value adjustments on identifiable assets and liabilities acquired on the acquisition of a foreign operation are treated as assets and liabilities of the foreign operation and are translated at the rate of exchange prevailing at the end of each reporting period.

26 IMPERIAL HOLDINGS LIMITED Audited Annual Financial Statements for the year ended 30 June 2015
1.7 INVESTMENT IN ASSOCIATESThe results, assets and liabilities of entities over which the Group exercises significant influence (associates) are incorporated in the consolidated annual financial statements using the equity method of accounting.
Under the equity method, an investment in associate is initially recognised at cost and adjusted thereafter to recognise the Group’s share of the profit or loss and other comprehensive income of the associate.
The Group’s share of other net asset changes in the associate, other than profit or loss or other comprehensive income and distributions received is recognised in equity. Such changes include those arising from additional shares issued by the associate to third parties or when the associate accounts for equity settled share-based payment transactions.
The Group’s share of associates’ net income, presented net of tax, is based on financial statements drawn up to reporting dates that are coterminous with that of the Group.
Where reporting dates are not coterminous, adjustments are made to the associate’s net income for the effects of significant transactions or events that occur after the associate’s reporting date and up to the reporting date of the Group.
When the Group’s share of losses of the associate exceeds the Group’s interest in that associate, the Group discontinues recognising its share of further losses. Additional losses are recognised only to the extent that the Group has incurred legal or constructive obligations or made payments on behalf of the associate. If the associate subsequently reports profits, the Group resumes recognising its share of those profits only after its share of profits equals the share of losses not recognised previously.
Any excess of the cost of acquisition over the Group’s share of the fair value of the net identifiable assets of an associate at the date of acquisition is recognised as goodwill, which is included within the carrying amount of the associate.
Any excess of the Group’s share of the net fair value of identifiable assets, liabilities and contingent liabilities over the cost of the investment, after reassessment, is recognised immediately in profit or loss as a bargain purchase.
The requirements of IAS 39 – Financial Instruments: Recognition and Measurement are applied to determine whether it is necessary to recognise any impairment loss with respect to the Group’s investment in an associate. When necessary the entire carrying amount of the investment is tested for impairment in accordance with IAS 36 – Impairment of Assets as a single asset by comparing its recoverable amount to its carrying amount. Any impairment loss recognised forms part of the carrying amount of the investment. Any reversal of that impairment loss is recognised in accordance with IAS 36 – Impairment of Assets to the extent that the recoverable amount of the investment subsequently increases.
Upon disposal of an associate that results in the Group losing significant influence over that associate, any retained investment is measured at fair value at that date and the fair value is regarded as the fair value on initial recognition as a financial asset in accordance with IAS 39 – Financial Instruments: Recognition and Measurement. The difference between the previous carrying amount of the associate attributable to the retained interest and its fair value is included in the determination of the gain or loss on disposal of the associate. In addition, the Group accounts for all amounts previously recognised in other comprehensive income in relation to that associate on the same basis as would be required if that associate had directly disposed of the related assets or liabilities.
When a group entity transacts with an associate of the Group, unrealised profits and losses are eliminated to the extent of the Group’s interest in the relevant associate.
Ukhamba Holdings (Pty) Ltd (Ukhamba)The Group has a 46,9% interest in Ukhamba, a black empowerment partner who currently owns ordinary and deferred ordinary Imperial shares.
Any fair value gains made by Ukhamba on the revaluation of its Imperial shares are eliminated from the Group’s net profit and comprehensive income. Any dividends received from Ukhamba first reduce its carrying value as an associate to zero and then any surplus is recognised directly in equity.
1.8 INTERESTS IN JOINT VENTURESThe Group’s interest in jointly controlled entities is accounted in the same way as investments in associates described above.
> NOTES TO THE CONSOLIDATED ANNUAL FINANCIAL STATEMENTS FOR THE YEAR ENDED 30 JUNE 2015 – CONTINUED

27
1.9 GOODWILLGoodwill arising on acquisition is carried at cost as established at the date of acquisition of the business less accumulated impairment losses, if any.
For the purpose of impairment testing, goodwill is allocated to each of the Group’s cash-generating units (or groups of cash-generating units) that are expected to benefit from the synergies of the business combination.
A cash-generating unit to which goodwill has been allocated is tested for impairment annually, or when there is an indication that the unit may be impaired. If the recoverable amount of the cash-generating unit is less than its carrying amount, the impairment loss is first allocated to the goodwill and then to the other assets of the unit pro rata based on the carrying amount of each asset in the unit.
Any impairment loss for goodwill is recognised directly in profit or loss. An impairment loss for goodwill is not reversed in subsequent periods.
On disposal of the relevant cash-generating unit, the attributable amount of goodwill is included in the determination of the profit or loss on disposal.
The Group’s policy for goodwill arising on the acquisition of an associate or joint venture is described under investment in associates.
1.10 INTANGIBLE ASSETSIntangible assets with finite useful lives that are acquired separately are carried at cost less accumulated amortisation and accumulated impairment losses. Amortisation is recognised on a straight-line basis over their estimated useful lives.
Intangible assets are not revalued.
The estimated useful life and amortisation method are reviewed at the end of each reporting period, with the effect of any changes accounted for on a prospective basis, if any.
Intangible assets acquired in a business combination and recognised separately from goodwill are initially recognised at their fair value at the acquisition date. Subsequent to initial recognition, intangible assets acquired in a business combination are reported at cost, being the acquisition date fair value, less accumulated amortisation and accumulated impairment losses on the same basis as intangibles that are acquired separately.
An intangible asset is derecognised on disposal or when no future economic benefits are expected from use or disposal.
Gains or losses arising from derecognition of an intangible asset, measured as the difference between the net disposal proceeds and the carrying amount of the asset are recognised in profit or loss when the intangible asset is derecognised.
1.11 IMPAIRMENT OF TANGIBLE AND INTANGIBLE ASSETS EXCLUDING GOODWILLAt the end of each reporting period, the Group assesses if there is any indication that such assets have suffered an impairment loss. If any such indication exists, the recoverable amount of the asset is estimated in order to determine the extent of the impairment loss.
When it is not possible to estimate the recoverable amount of an individual asset, the Group estimates the recoverable amount of the cash-generating unit to which the asset belongs.
Intangible assets with indeterminate useful lives and intangible assets not yet ready for their intended use are tested for impairment at least annually and whenever there is an indication that the asset may be impaired.
Recoverable amount is the higher of fair value less costs to sell and value in use. In assessing value in use, the estimated future cash flows are discounted to their present value using a pre-tax discount rate that reflects the current market assessments of the time value of money and the risks specific to the asset for which the estimates of future cash flows have not been adjusted.
If the recoverable amount of an asset (or cash-generating unit) is estimated to be less than its carrying amount, the carrying amount of the asset (cash-generating unit) is reduced to its recoverable amount.
An impairment loss is recognised immediately in profit or loss.
Where an impairment loss subsequently reverses, the carrying amount of the asset (cash-generating unit) is increased to the revised estimate of its recoverable amount, but so that the increased carrying amount does not exceed the carrying amount that would have been determined had no impairment loss been recognised for the asset (cash-generating unit) in prior years.
A reversal of an impairment loss is recognised immediately in profit or loss.

28 IMPERIAL HOLDINGS LIMITED Audited Annual Financial Statements for the year ended 30 June 2015
1.12 PROPERTY, PLANT AND EQUIPMENT, TRANSPORT FLEET AND VEHICLES FOR HIRELand is stated at cost less accumulated impairment and is not depreciated.
Buildings held for use in the production or supply of goods or services, or for administrative purposes, are stated at cost less any accumulated depreciation and impairment losses.
Buildings in the course of construction for production, supply or administrative purposes are carried at cost less any recognised impairment loss.
Land and buildings held as portfolio properties whose benefits are shared with policyholders are fair valued through profit or loss.
All other assets are stated at cost less accumulated depreciation and accumulated impairment losses.
Costs include all costs incurred in bringing the assets to the location and condition for their intended use and include professional fees and, for qualifying assets, borrowing costs capitalised in accordance with the Group’s accounting policy.
Depreciation is recognised so as to write off the cost of assets less their residual values over their useful lives, using the straight-line method.
The estimated useful lives, residual values and depreciation methods are reviewed at the end of each reporting period, with the effect of any changes in estimate accounted for on a prospective basis, if any.
Depreciation commences when the assets are ready for their intended use.
Assets held under finance leases are depreciated over their expected useful lives on the same basis as owned assets. However, when there is no reasonable certainty that ownership will be obtained by the end of the lease term, assets are depreciated over the shorter of the lease term and their useful lives.
Costs include the estimated costs of dismantling and removing the assets and, where appropriate, costs are split into significant components.
Major improvements to leasehold properties are capitalised and written off over the period of the lease.
Where significant components of an asset have different useful lives to the asset itself, those components are depreciated over their estimated useful lives.
Assets are derecognised on disposal or when no future economic benefits are expected to arise from the continued use of the asset.
Any gain or loss arising from the derecognition of an item of property, plant and equipment is determined as the difference between the sales proceeds and the carrying amount of the asset and is recognised in profit or loss.
Vehicles for hire are reclassified to inventories at their carrying amount when they cease to be rented and become available-for-sale.
1.13 INVENTORIESInventories are stated at the lower of cost and net realisable value. Net realisable value is the estimate of the selling price for inventories less all estimated costs of completion and costs necessary to make the sale. Cost is determined as follows:
Vehicles specific costCaravans, spares and accessories weighted average costFuel, oil and merchandise first-in-first outFast moving consumer goods first-in-first out
Work in progress includes direct costs and a proportion of overheads.
> NOTES TO THE CONSOLIDATED ANNUAL FINANCIAL STATEMENTS FOR THE YEAR ENDED 30 JUNE 2015 – CONTINUED

29
1.14 LEASESLeases are classified as finance leases whenever the terms of the lease transfer substantially all the risks and rewards of ownership to the lessee. All other leases are classified as operating leases.
The Group as lessorRental income from operating leases is recognised on a straight-line basis over the term of the relevant lease.
Assets leased under operating leases are included under the appropriate category of assets in the statement of financial position.
They are depreciated over their expected useful lives on a basis consistent with similar items of property, plant and equipment.
The Group as lesseeAssets held under finance leases are initially recognised as assets of the Group at their fair value at the inception of the lease or, if lower, at the present value of the minimum lease payments.
The corresponding liability to the lessor is included in the statement of financial position as a finance lease obligation.
Finance lease payments are apportioned between finance expenses and reduction of the lease obligation so as to achieve a constant rate of interest of the remaining balance of the liability.
Finance expenses are recognised immediately in profit or loss, unless they are directly attributable to qualifying assets in which case they are capitalised in accordance with the Group’s policy on borrowing costs.
Operating lease payments are recognised as an expense on a straight-line basis over the lease term.
When an operating lease is terminated before the lease period has expired, any payment required to be made to the lessor by way of penalty is recognised as an expense in the period in which termination takes place.
Contingent rentals are recognised as an expense in the period in which they are incurred.
1.15 INCENTIVE SCHEMESThe Group operates equity-settled share-based compensation plans for senior employees and executives.
Equity-settled share-based payments to employees are measured at the fair value of the equity instrument at the grant date.
The fair value determined at the grant date of the equity-settled share-based payments is expensed on a straight-line basis over the vesting period, based on the Group’s estimate of equity instruments that will eventually vest, with a corresponding increase in equity.
At the end of each reporting period, the Group revises its estimates of the number of equity instruments that are expected to vest.
The impact of the revision of original estimates, if any, is recognised in profit or loss with a corresponding adjustment to the share based payment reserve in equity.
1.16 RETIREMENT BENEFIT OBLIGATIONSDefined contribution plansPayments to defined contribution retirement benefit plans are recognised as an expense when employees have rendered services entitling them to the contributions.
Defined benefit plansFor defined benefit retirement plans, the cost of providing benefits is determined using the projected unit credit method, with actuarial valuations carried out at the end of each reporting period.
Past-service costs are recognised immediately to the extent that the benefits are vested, otherwise it is amortised on a straight-line basis over the average period until the benefits become vested.
Actuarial gains and losses are recognised immediately in other comprehensive income and accumulated in retained earnings so that the retirement benefit obligation reflects its full value.

30 IMPERIAL HOLDINGS LIMITED Audited Annual Financial Statements for the year ended 30 June 2015
1.17 PROVISIONSProvisions are recognised when the Group has a present obligation (legal or constructive) as a result of a past event, it is probable that the Group will be required to settle the obligation and a reliable estimate can be made of the amount of the obligation.
The amount recognised as a provision is reviewed at the end of each reporting period and represents the best estimate of the consideration required to settle the obligation, taking into account the risks and uncertainties surrounding it.
When a provision is measured using the cash flows estimated to settle the present obligation, its carrying amount is the fair value of those cash flows.
When some or all of the economic benefits required to settle a provision are expected to be recovered from a third party, a receivable is recognised as an asset if it is virtually certain that reimbursement will be received and the amount of the receivable can be measured reliably.
Provisions are reversed when it is no longer probable that an outflow of resources will be required to settle the obligation.
Insurance claimsInsurance claims comprise provisions for the estimate of the ultimate cost of settling all claims incurred but unpaid at the end of the reporting period, whether reported or not. Related anticipated insurance recoveries are recognised separately as assets when it is virtually certain the amounts will be received.
Dismantling and environmental riskThe Group provides for the dismantling of property, plant and equipment at the end of their useful lives where a contractual requirement exists and for any probable environmental risks.
Onerous contractsPresent obligations arising under onerous contracts are recognised and measured as provisions. An onerous contract is considered to exist where the Group has a contract under which the unavoidable cost of meeting the obligation under the contract exceeds the economic benefits expected from the contract.
1.18 INCOME TAXESIncome tax expense represents the sum of current tax and deferred tax.
Current taxThe tax currently payable is based on taxable profit for the year. Taxable profit differs from ’profit before tax’ as reported in profit or loss as a result of items of income or expense that are taxable or deductible in other years (temporary differences) and items that are not taxable or deductible.
The Group’s liability for current tax is calculated using tax rates that have been enacted or substantively enacted by the end of the reporting period.
Deferred taxDeferred tax is the tax expected to be payable or recoverable on differences between the carrying amount of assets and liabilities in the Group’s consolidated financial statements and the corresponding tax bases used in the computation of taxable profit and is accounted for using the balance sheet liability method.
Deferred tax liabilities are generally recognised for all taxable temporary differences.
Deferred tax assets are recognised to the extent that it is probable that taxable profits will be available against which deductible temporary differences can be utilised.
Deferred tax assets and liabilities are not recognised if the temporary differences arise from the initial recognition of goodwill or from the initial recognition, other than in a business combination, of other assets and liabilities in a transaction that affects neither the tax profit nor accounting profit.
The measurement of deferred tax assets and deferred tax liabilities reflects the tax consequences that would follow from the manner in which the Group expects to recover or settle the carrying amount of assets and liabilities.
The carrying amount of deferred tax assets is reviewed at each reporting date and is adjusted to the extent that it is no longer probable that sufficient taxable profit will be available to allow all or part of the asset to be recovered.
> NOTES TO THE CONSOLIDATED ANNUAL FINANCIAL STATEMENTS FOR THE YEAR ENDED 30 JUNE 2015 – CONTINUED

31
Deferred tax is calculated at the tax rates that are expected to apply in the year when the liability is settled or the asset is realised.
Deferred tax is charged or credited in profit or loss, except when it relates to items charged or credited directly to other comprehensive income and equity, in which case the deferred tax is also taken directly to other comprehensive income and equity.
Deferred tax assets and liabilities are offset when they relate to income taxes levied by the same tax authority and the Group intends to settle its current tax assets and liabilities on a net basis.
Dividends taxDividends tax is levied on non-exempt shareholders. The Group is responsible for the collection of the dividends tax and payment of the amounts collected to the South African Revenue Service (SARS). As this tax is levied on the shareholders and not the company, it does not form part of the tax expense recognised in profit or loss or in other comprehensive income. Dividends are reflected gross of tax.
1.19 NON-CURRENT ASSETS CLASSIFIED AS HELD FOR SALENon-current assets and disposal groups are classified as held for sale if their carrying amount will be recovered principally through a sale transaction rather than through continuing use.
This condition is regarded as met only when the sale is highly probable and the non-current asset (or disposal group) is available for immediate sale in its present condition.
Management must be committed to the sale, which should be expected to qualify for recognition as a completed sale within one year from the date of classification as held for sale.
When the Group is committed to a sale plan involving loss of control of an entity, all of the assets and liabilities of that entity are classified as held for sale when the criteria described above are met, regardless of whether the Group will retain a non-controlling interest in its former subsidiary after the sale.
Non-current assets (and disposal groups) classified as held for sale are measured at the lower of their previous carrying amount and fair value less costs to sell.
1.20 REVENUE RECOGNITIONRevenue from the sale of goods is recognised when significant risks and rewards of ownership of the goods are transferred to the buyer.
Where there are guaranteed buyback arrangements in terms of which significant risks and rewards of ownership have not transferred to the purchaser, the transaction is accounted for as a lease.
Revenue arising from the rendering of services is recognised on the accrual basis in accordance with the substance of the agreement.
Revenue from vehicle maintenance plans is recognised based on an established pattern, when vehicle maintenance services are performed over the period of the plan.
The Group reflects premium income relating to insurance business gross of reinsurance. Premiums are accounted for at the commencement of the risk. Premiums on investment contracts are excluded from profit or loss.
Where the Group acts as an agent and is remunerated on a commission basis, the commission is included in revenue. Where the Group acts as principal, the total value of business handled is included in revenue.
1.21 INTEREST AND DIVIDEND INCOMEInterest income is accrued on the time basis, by reference to the principal outstanding and the effective interest rate applicable, which is the rate that exactly discounts estimated future cash receipts through the expected life of the financial asset to that asset’s carrying amount.
Dividend income from investments is recognised when the Group’s rights to receive payment have been established.
1.22 BORROWING COSTSBorrowing costs directly attributable to the acquisition, construction or production of assets that necessarily take a substantial period of time to get ready for their intended use or sale, are added to the cost of those assets until such time as the assets are substantially ready for their intended use or sale.
All other borrowing costs are recognised in profit or loss in the period in which they are incurred.

32 IMPERIAL HOLDINGS LIMITED Audited Annual Financial Statements for the year ended 30 June 2015
1.23 EARNINGS PER SHAREBasic earnings per shareBasic earnings per share is calculated by dividing net profit attributable to owners of Imperial by the weighted average number of ordinary shares in issue during the year, net of shares repurchased and the Group’s interest in its own ordinary shares held by associates.
Diluted earnings per shareFor diluted earnings per share, the weighted average number of ordinary shares in issue, net of shares repurchased, is adjusted for the dilutive effect of potential ordinary shares under the share incentive schemes and an associate’s obligation to deliver shares.
Potential ordinary shares are treated as dilutive when their conversion to ordinary shares would decrease basic earnings per share.
The effect of anti-dilutive potential ordinary shares is excluded from the calculation of diluted earnings per share.
Headline earnings per share and core earnings per shareThe presentation of headline earnings per share is mandated under the JSE Listings Requirements and is calculated in accordance with Circular 3/2013 – Headline Earnings, as issued by the South African Institute of Chartered Accountants.
Core earnings is a non-IFRS measure and excludes the impact of certain non-operational income and expense items from reported headline earnings. It is included to provide an additional basis on which to measure the Group’s normalised earnings performance.
1.24 SHARE ISSUE COSTS, SHARES REPURCHASED AND DIVIDEND PAYMENTSShare issue costsIncremental costs directly attributable to the issue of new shares or the repurchase of existing shares are shown as a deduction, net of applicable tax, in equity. An incremental share issue cost is one which would not have arisen if shares had not been issued or repurchased.
Shares repurchasedThe purchase by the Group of its own equity instruments and held in a subsidiary company results in the recognition of shares repurchased. The consideration paid is deducted from equity. Where shares repurchased are subsequently sold, reissued or otherwise disposed of, any consideration received is included in equity attributable to owners of Imperial, net of any directly attributable incremental transaction costs and the related tax effects. Shares repurchased by the company and subsequently cancelled are shown as a deduction in retained earnings.
Dividend payments to owners of ImperialDividend distributions to owners of Imperial are recognised as a liability in the period in which the dividends are approved and declared. Interim and final dividends are accrued when approved by the board of directors.
Dividend payments to preference shareholdersDue to their cumulative nature the non-redeemable, non-participating preference shares are classified as debt financial instruments with no repayment terms. The dividends payable on the non-redeemable, non-participating preference shares are accrued on a time basis, with reference to the principal outstanding and the effective interest rate applicable, and recognised in profit or loss within finance cost. Interim and final preference dividends are payable when approved by the board of directors.
1.25 EVENTS AFTER THE REPORTING PERIODThe financial statements are adjusted to reflect events that occurred between the end of the reporting period and the date when the financial statements are authorised for issue, only if those events provide evidence of conditions that existed at the end of the reporting period.
Events that are indicative of conditions that arose after the reporting period are disclosed, with no adjustment to the financial statements.
1.26 SEGMENT INFORMATIONOperating segments are reported in a manner consistent with the internal reporting provided to the chief operating decision-maker.
The chief operating decision making body who is responsible for allocating resources and assessing performance of the operating segments, has been identified collectively as the group executive committee.
Segment revenue reflects both sales to external parties and intergroup transactions across segments. Inter-segment revenue is revenue raised by one segment relating to sales to other segments within the Group, which is eliminated under head office and eliminations.
Segment operating assets and liabilities are only those items that can be specifically identified within a particular segment.
> NOTES TO THE CONSOLIDATED ANNUAL FINANCIAL STATEMENTS FOR THE YEAR ENDED 30 JUNE 2015 – CONTINUED

33
1.27 FINANCIAL INSTRUMENTSFinancial assets and financial liabilities are recognised in the Group’s consolidated statement of financial position when the Group becomes party to the contractual provisions of the instrument.
Initial measurement of financial assets and financial liabilitiesFinancial assets and financial liabilities are initially recorded at fair value plus, in the case of financial assets and financial liabilities not fair valued through profit or loss, transaction costs that are directly attributable to the acquisition or issue of the financial asset or financial liability.
Subsequent measurement of financial assetsFinancial assets at fair value through profit or loss, including derivative assets, are subsequently measured at fair value without any deduction for transaction costs that may be incurred on sale or disposal.
Available-for-sale investments are subsequently remeasured to fair value. Any unrealised gain and loss is recognised in other comprehensive income and accumulated in the valuation reserve in equity until the investment is disposed of or impaired, at which time the cumulative gain or loss deferred in equity is reclassified to profit or loss.
Investments in equity instruments whose fair value cannot be measured reliably are carried at cost.
Loans receivable and trade receivables are subsequently measured at amortised cost using the effective interest method, less any impairment as appropriate.
Cash resources are carried at cost which is also fair value.
Subsequent measurement of financial liabilitiesAll financial liabilities are subsequently measured at amortised cost using the effective interest method except for financial liabilities at fair value through profit or loss, including derivative liabilities, which are measured at fair value.
Hedge accountingThe Group enters into forward exchange contracts, forward rate agreements and interest-rate swap agreements in order to hedge its exposure to foreign exchange and interest rate risk. The Group does not use derivative financial instruments for speculative purposes.
Changes in the fair value of derivative instruments that are not formally designated in a hedge relationship are recognised immediately in profit or loss.
Changes in the fair value of a ’fair value hedge’ are recognised in profit or loss. The gain or loss on the hedged item, attributable to the hedged risk, is adjusted to the carrying amount of the hedged item with a corresponding entry in profit or loss.
The effective portion of changes in the fair value of a ’cash flow hedge’ is recognised directly in other comprehensive income and accumulated in the hedge accounting reserve in equity. The gain or loss relating to the ineffective portion is recognised immediately in profit or loss.
If the cash flow hedge of a forecast transaction results in the recognition of a non-financial asset or a non-financial liability then, at the time the asset or liability is recognised, the associated gains or losses on the derivative that had previously been recognised in the Group’s hedge accounting reserve in equity are included in the initial measurement of the asset or liability.
For hedges that do not result in the recognition of a non-financial asset or a non-financial liability, amounts deferred in the Group’s hedge accounting reserve in equity are recognised in profit or loss in the same period in which the hedged item affects profit or loss on a proportionate basis.
Hedge accounting is discontinued when the hedge relationship is revoked or the hedging instrument expires or is sold, terminated, exercised or no longer qualifies for hedge accounting. At that time, any cumulative gain or loss deferred in equity remains in equity and is recognised when the forecast transaction is ultimately recognised in profit or loss.
If a hedge transaction is no longer expected to occur, the net cumulative gain or loss deferred in equity is immediately reclassified to profit or loss.

34 IMPERIAL HOLDINGS LIMITED Audited Annual Financial Statements for the year ended 30 June 2015
1.27 FINANCIAL INSTRUMENTS CONTINUED
Impairment of financial assetsFinancial assets, other than those fair valued through profit or loss, are assessed for indicators of impairment at the end of each reporting period. Financial assets are considered to be impaired when there is objective evidence that, as a result of one or more events that occurred after the initial recognition of the financial asset, the estimated future cash flows of the investment have been affected.
For available-for-sale investments, a significant or prolonged decline in the fair value of the security below its cost is considered to be objective evidence of impairment.
For financial assets carried at amortised cost, the amount of the impairment loss recognised is the difference between the asset’s carrying amount and the present value of estimated future cash flows, discounted at the financial asset’s original effective interest rate.
The carrying amount of the financial asset is reduced by the impairment loss directly for all financial assets with the exception of trade receivables, where the carrying amount is reduced through the use of a provision account. When a trade receivable is considered uncollectible, it is written off against the provision account.
Subsequent recoveries of amounts previously written off are credited against the allowance account. Changes in the carrying amount of the allowance account are recognised in profit or loss.
When an available-for-sale financial asset is considered to be impaired, cumulative gains or losses previously recognised in other comprehensive income are immediately reclassified to profit or loss.
For financial assets measured at amortised cost, if, in a subsequent period, the amount of the impairment loss decreases and the decrease can be related objectively to an event occurring after the impairment was recognised, the previously recognised impairment loss is reversed through profit or loss to the extent that the carrying amount of the investment at the date the impairment is reversed does not exceed what the amortised cost would have been had the impairment not been recognised.
In respect of available-for-sale investments, impairment losses previously recognised in profit or loss are not reversed through profit or loss. Any increase in fair value subsequent to an impairment loss is recognised in other comprehensive income and accumulated under the heading valuation reserve.
The Group derecognises a financial asset only when the contractual rights to the cash flows from the asset expire, or when it transfers the financial asset and substantially all the risks and rewards of ownership of the asset to another party.
On derecognition of a financial asset in its entirety, the difference between the asset’s carrying amount and the sum of the consideration received and receivable and the cumulative gain or loss that had been recognised in other comprehensive income and accumulated in equity is recognised in profit or loss.
The Group derecognises a financial liability when the obligation specified in the contract is discharged, cancelled or expires.
Put arrangements over non-controlling interestsWritten put options on the shares of a subsidiary held by non-controlling interests give rise to a financial liability for the present value of the redemption amount. The liability that may become payable under the arrangement is initially recognised at fair value with a corresponding entry directly in equity. Subsequent changes to the fair value of the liability are recognised in profit and loss.
Cash resourcesCash resources comprise cash on hand and on-demand deposits, together with short-term, highly liquid investments with a maturity of three months or less from the date of acquisition, that are readily convertible to a known amount of cash and that are subject to an insignificant risk of changes in value. Bank overdrafts are shown within current portion of interest-bearing borrowings on the consolidated statement of financial position. Cash and cash equivalents in the consolidated statement of cash flows are reflected net of overdrafts.
> NOTES TO THE CONSOLIDATED ANNUAL FINANCIAL STATEMENTS FOR THE YEAR ENDED 30 JUNE 2015 – CONTINUED

35
1.28 SIGNIFICANT ACCOUNTING JUDGEMENTS, ESTIMATES AND ASSUMPTIONS
The preparation of the consolidated annual financial statements requires the Group’s management to make judgements, estimates and assumptions that affect the reported amounts of assets and liabilities and the disclosure of contingent assets and liabilities at the date of the financial statements, and the reported amounts of revenues and expenses during the reporting period. The determination of estimates requires the exercise of judgement based on various assumptions and other factors such as historical experience, current and expected economic conditions, and, in some cases, actuarial techniques. Actual results could differ from these estimates in the application of the Group’s accounting policies, which are described above.
The following accounting policies have been identified as involving particularly complex or subjective decisions or assessments:
Insurance companiesDetails of significant accounting judgements and estimates are given in Annexure A.
Residual values and useful livesThe Group depreciates its assets over their estimated useful lives taking into account residual values, which, following the requirements of IAS 16 – Property, Plant and Equipment, are reassessed on an annual basis. The actual lives and residual values of these assets can vary depending on a variety of factors. Technological innovation, product life cycles and maintenance programmes all impact the useful lives and residual values of the assets. Residual value assessments consider issues such as future market conditions, the remaining life of the asset and projected disposal values.
Income taxesThe group is subject to income taxes in numerous jurisdictions. Significant judgement is required in determining the worldwide provision for income taxes due to the complexity of legislation. There are many transactions and calculations for which the ultimate tax determination is uncertain during the ordinary course of business. The group recognises liabilities for anticipated taxes based on estimates. Where the final tax outcome of these matters is different from the amounts that were initially recorded, such differences will impact the income tax and deferred tax provisions in the period in which such determination is made.
The Group recognises the net future tax benefit related to deferred income tax assets to the extent that it is probable that the deductable temporary differences will reverse in the foreseeable future. Assessing the recoverability of deferred income tax assets required the Group to make significant estimates related to expectations of future taxable income
Estimates of future taxable income are based on forecast cash flows from operations and the application of existing tax laws in each jurisdiction. To the extent that future cash flows and taxable income differ significantly from estimates, the ability of the group to realise the net deferred tax assets recorded at the statement of financial position date could be impacted. Additionally, future changes in tax laws in the jurisdictions in which the group operates could limit the ability of the Group to obtain tax deductions in future periods.
Contingent liabilitiesManagement applies its judgement to the fact patterns and advice it receives from its attorney, advocates and other advisors in assessing if an obligation is probable, more likely than not, or remote. This judgement application is used to determine whether the obligation is recognised as a liability or disclosed as a contingent liability.
Revenue recognitionMaintenance and warranty contracts are sold with vehicles to cover the cash cost of future expenditure over specified periods. Revenue from vehicle maintenance plans is recognised based on an established pattern of when vehicle maintenance services are performed over the period of the plan.
Revenue is adjusted to cater for expected future expenditure which is determined based on historical trends and include forecasted inflationary adjustment on an annual basis. The balance of the unearned revenue is recognised on termination of the contract when the contract mileage has been reached.

36 IMPERIAL HOLDINGS LIMITED Audited Annual Financial Statements for the year ended 30 June 2015
Statement of financial position presentation based on liquidityManagement believes that the presentation of the statement of financial position on a liquidity basis provides information that is reliable and is more relevant compared to a current and non-current presentation.
The nature of the Group’s operations is diverse and as such it becomes more difficult to clearly identify a single operating cycle that would be relevant across all business segments. Maturity profiles of some assets and liabilities are provided in the notes to the consolidated annual financial statements.
The following guidance is provided on assets and liabilities where further judgement is required:
AssetsAssets that the Group expects to realise, or intends to sell or consume in its normal operating cycle would include reinsurance debtors, inventory and trade and other receivables. The operating cycles for these assets are generally not more than twelve months. Vehicles for hire have an operating cycle of more than 12 months. Vehicles that have reached the end of the useful life as rental assets are shown as inventory.
The Group’s investment portfolios are measured by portfolio managers who acquire or dispose of investments in terms of acceptable risk levels and cash requirements of the Group. The timing of the disposals are uncertain and there are no restrictions on the Group to realise investments.
Other loans receivable mature over periods longer than 12 months and include amounts that are receivable within one year from the reporting period.
Cash resources from the financial services operation are restricted by the division’s capital structure. Cash resources from other operations are unrestricted.
LiabilitiesLiabilities that the Group expects to settle in its normal operating cycle include trade and other payables and provisions. Trade and other payables are normally settled within one year from the reporting period, whereas some amounts of provisions mature over periods longer than 12 months.
Other financial liabilities are payable over longer periods but do consist of amounts that are due within one year from the reporting period.
Insurance, investment, maintenance and warranty contracts are settled as and when the services are performed. These multi-year policies often only become effective once a defined event has occurred and as such leads to a highly judgemental maturity profile. The maturity of these liabilities can range from one year to more than five years after the reporting period.
Significant judgments made to determine the stage of completion, known as burn rates, of contracts include: > Vehicles parts inflation > Foreign currency movements > Estimated use of vehicles
Other financial liabilities are payable over longer periods but do consist of amounts that are due within one year from the reporting period.
Discontinued operations and non-current assets classified as held for saleManagement classifies a non-current asset (or disposal group) as held for sale if its carrying amount will be recovered principally through a sale transaction rather than through continuing use.
Management classifies a component of the group as a discontinued operation if it: > represents a separate major line of business or geographical area of operation; > is part of a single coordinated plan to dispose of a separate major line of business or geographical area of operations; or > is a subsidiary acquired exclusively with a view to resale as a discontinued operation.
Other financial assets classified as held for sale (or disposal group) are measured at the lower of their carrying amount and fair value less costs to sell.
Once the value of the assets and liabilities and the results of trading of discontinued operations become immaterial they are no longer shown separately and are included in continuing operations.
Provision for doubtful debtsProvision is made for doubtful debts based on management’s estimate of the prospect of recovering the debt. Where management has determined that a debt is no longer recoverable, the amount is written off.
> NOTES TO THE CONSOLIDATED ANNUAL FINANCIAL STATEMENTS FOR THE YEAR ENDED 30 JUNE 2015 – CONTINUED

37
Provision against inventoryInventory is counted at least once a year and any shortages and obsolete stock identified is written off immediately. An allowance is made for slow-moving and obsolete inventory based on historical trends, and where the imported cost due to the depreciation of the Rand was above the anticipated selling price.
Fair value of financial instrumentsAssessing the significance of a particular input to the fair value measurement in its entirety requires judgement, considering the factors specific to the asset or liability.
Asset impairmentsThe Group periodically evaluates its assets for impairment, including identifiable intangibles, whenever events, such as losses being incurred, or changes in circumstances such as changes in the market, indicate that the carrying amount of the asset may not be recoverable. Our judgements regarding the existence of impairment indicators are based on market conditions and operational performance of the different businesses. Future events could cause management to conclude that impairment indicators exist. In order to assess if there is any impairment, we estimate the future cash flows expected to result from the use of the asset(s) and its eventual disposition. Considerable management judgement is necessary to estimate discounted future cash flows, including appropriate bases for making judgements and estimates.
The calculation of appropriate discount rates (weighted average cost of capital) is a sensitive input into valuations. While every effort is made to make use of independent information and apply consistent methodology, actual circumstances or outcomes could vary significantly from such estimates, including changes in the economic and business environment.
The variances could result in changes in useful lives or impairment. These changes can have either a positive or negative impact on our estimates of impairment and can result in additional charges.
Share based paymentsEquity-settled share-based payments are measured at fair value at the date of grant. In calculating the expense the Group considers the best estimate of the number of shares that are expected to vest taking into account the achieving of the performance conditions and participants who will forfeit their rights. The final number that will vest may be different.
Retirement benefit obligationsThe valuation of the retirement benefit obligations is arrived at using discount rates, projected payment increases, projected other contribution increases and fluctuation rates. The final obligation will depend on length of service and the value of the salary at the time of payment to the participants.
Put option liabilityThe liability arises when new acquisitions have contractual obligations enabling non-controlling shareholders to put their shares back to the group at an agreed price. In arriving at the liability the future earnings need to be assessed and discounted back to calculate the present value. This requires a high level of judgement.

38 IMPERIAL HOLDINGS LIMITED Audited Annual Financial Statements for the year ended 30 June 2015
2. CHANGES IN ACCOUNTING POLICIES AND DISCLOSURES2.1 PRESENTATION OF DISCONTINUED OPERATIONS
Financial statementsThe result of the Insurance businesses (discontinued operations) are presented as a single line item in the consolidated statement of profit or loss under Discontinued operations. The assets and related liabilities are shown under 'Assets classified as held for sale' and 'Liabilities directly associated with assets classified as held for sale' on the consolidated statement of financial position. The consolidated statement of comprehensive income, the consolidated statement of changes in equity and the consolidated statement of cash flows are shown in total for continued and discontinued operations. Further disclosure for the discontinued operations are provided in note 15 on page 50.
The notes to the financial statementsCertain notes to the consolidated statement of financial position include movements from the discontinued operations up to the point of reclassification as held for sale. The notes to the consolidated statement of profit or loss relate to continuing operations only with the exception of the 'Earnings per share' note that is reconciled in total but distinguishes between continuing and discontinued operations for the per share values. Therefore, to cross reference certain amounts disclosed in the notes to the statement of financial position to certain amounts disclosed in the notes to the consolidated statement of profit or loss, the amounts disclosed in note 15 should be taken into consideration.
2.2 CHANGE IN ACCOUNTING POLICYVehicles held under buy-back arrangementsThe vehicle importer businesses, included under Vehicle Import, Distribution and Dealerships, sell vehicles that are subject to buy back arrangements. These vehicles are accounted for as an operating lease over the period of the buy back arrangement lasting about one year. In prior years, they have been accounted for as Inventory in accordance with IAS 2 Inventories.
As these vehicles are not immediately available for sale and are subject to an operating lease, it is considered more appropriate to account for them as items of Property, plant and equipment in accordance with IAS 16 Property, Plant and Equipment. The vehicles are included in Vehicles for hire on the consolidated statement of financial position.
This change in accounting policy resulted in a reallocation between line items on the consolidated statement of profit or loss and on the consolidated statement of financial position without affecting operating profit and total assets. The impact of the restatement on the comparative amounts were as follows:
2013Rm
2014Rm
Statement of financial positionIncrease in vehicles for hire 464 642Decrease in inventories (464) (642)
Total assets
Statement of profit or lossContinuing operationsDecrease in net operating expenses 106
Increase in profit from operations before depreciation and recoupments 106Increase in depreciation, amortisation, impairments and recoupments (106)
Operating profit
Statement of cash flowsDecrease in cash paid to suppliers and employees 284
Increase in cash generated by operations before capital expenditure on rental assets 284Increase in expansion capital expenditure – rental assets (194)Increase in net replacement capital expenditure – rental assets (90)
– Increase in expenditure (584)– Increase in proceeds 494
Cash generated by operations
The notes to the consolidated annual financial statements have been restated accordingly.
> NOTES TO THE CONSOLIDATED ANNUAL FINANCIAL STATEMENTS FOR THE YEAR ENDED 30 JUNE 2015 – CONTINUED

39
2.3 RESTATEMENT OF THE SEGMENTAL INFORMATIONThe 2014 segmental information has been restated to reflect the profit or loss for continuing operations only by excluding the Insurance segment, for the change in accounting policy as described in note 2.2 and for the reallocation of the United Kingdom head office out of Head-Office and Eliminations to the Vehicles Retail, Rental and After Market Parts segment.
The impact of the restatements were as follows:
Segment profit or lossRevenue
Rm
Operating profit
Rm
Depreciation, amortisation,impairments
andrecoupments
Rm
Net finance costRm
Pre-tax profit
Rm
Vehicle Import, Distribution and DealershipsPreviously stated 27 100 1 518 239 360 1 165Change in accounting policy (refer note 2.2) 162
As restated 27 100 1 518 401 360 1 165
Vehicle Retail, Rental and After Market PartsPreviously stated 33 997 1 559 561 272 1 363Reallocation of UK head office from Head-Office and Eliminations 17 10 5 7 8
As restated 34 014 1 569 566 279 1 371
Motor Related Financial Services and ProductsPreviously stated 1 166 477 63 513Continued access to cell captive arrangements with Regent 110 110Associate classified as discontinued operations (7)
As restated 1 166 587 63 616
Segment financial position
Operating assets
Rm
Operating liabilities
Rm
Net debt
Rm
Net capitalexpenditure
Rm
Vehicle Import, Distribution and DealershipsPreviously stated 14 351 4 172 5 465 714Change in accounting policy (refer note 2.2) 284
As restated 14 351 4 172 5 465 998
Vehicle Retail, Rental and After Market PartsPreviously stated 11 509 4 287 2 242 614Reallocation of UK head office from Head-Office and Eliminations 313 11 178 19
As restated 11 822 4 298 2 420 633
2.4 NEW AND AMENDED ACCOUNTING STANDARDS THAT BECAME EFFECTIVE DURING THE YEARThe group applied the following amended statements during the year. None of the amendments has had a material impact on the consolidated financial statements of the Group.
IAS 16 – Property Plant and Equipment (amended)IAS 39 – Financial Instruments – Recognition and Measurements (amended)IAS 19 – Employee Benefits (amended)IFRS 2 – Share Based Payments (amended)
2.5 PRESENTATION OF STATEMENT OF PROFIT OR LOSSTo improve the content and format of the consolidated statement of profit or loss, certain items that are not operational in nature have been shown in total with details given in note 29.

40 IMPERIAL HOLDINGS LIMITED Audited Annual Financial Statements for the year ended 30 June 2015
3. NEW AND REVISED INTERNATIONAL FINANCIAL REPORTING STANDARDS IN ISSUE BUT NOT YET EFFECTIVEThe following are applicable amendments to IFRS that could have an impact on the Group’s future financial statements. The Group does not anticipate that other amendments resulting from annual improvements to have an impact on its financial statements other than additional disclosures.
Pronouncement Title Effective date
IFRS 9 (amended) IFRS 9 – Financial InstrumentsIFRS 9 introduces a single classification and measurement model for financial assets which is dependent on the entities business model objective for managing financial assets and on the contractual cash flow characteristics of financial assets.
Financial assets are classified as either, amortised cost, fair value through profit or loss or fair value through other comprehensive income whilst financial liabilities are classified as amortised cost or fair value through profit or loss.
The standard also introduces a new impairment model which follows a three-stage approach based on changes in expected credit losses of a financial instrument. The model also determines the recognition of impairment as well as the recognition of interest revenue.
Amendments were also made to the criteria for applying hedge accounting, more specifically on the hedge effectiveness which requires the existence of an economic relationship between the hedge item and the hedging instrument and that credit risk does not dominate changes in the fair value of the hedge item or hedging instrument and lastly that the hedge ratio is the same for both the hedging relationship and the quantity of the hedged item actually hedged and the quantity of the hedging instrument used to hedge it.
The Group anticipates that the application of IFRS 9 may have an impact on amounts reported in respect of the group’s financial assets and financial liabilities. However, it is not practicable to provide a reasonable estimate of the effect of IFRS 9 until a detailed review has been completed.
Annual periods beginning on or after 1 January 2018
IFRS 15 IFRS 15 – Revenue From Contracts With CustomersThe objective of IFRS 15 is to establish the principles that an entity shall apply to report useful information to users of financial statements about the nature, amount, timing, and uncertainty of revenue and cash flows arising from a contract with a customer.
The core principle of IFRS 15 is that an entity will recognise revenue to depict the transfer of promised goods or services to customers in an amount that reflects the consideration to which the entity expects to be entitled in exchange for those goods or services. This core principle is delivered in a five-step model framework: > Identify the contract(s) with a customer > Identify the performance obligations in the contract > Determine the transaction price > Allocate the transaction price to the performance obligations in the contract > Recognise revenue when (or as) the entity satisfies a performance obligation.
Application of this guidance will depend on the facts and circumstances present in a contract with a customer and will require the exercise of judgment.
IFRS 15 was issued in January 2014 and replaces the following standards and interpretations when it becomes effective: > IAS 11 – Construction contracts > IAS 18 – Revenue > IFRIC 15 – Agreements for the Construction of Real Estate > IFRIC 18 – Transfers of Assets from Customers > SIC-31 Revenue – Barter Transactions Involving Advertising Services
The Group is in the process of assessing the impact of IFRS 15 on its consolidated annual financial statements.
Annual periods beginning on or after 1 January 2018
> NOTES TO THE CONSOLIDATED ANNUAL FINANCIAL STATEMENTS FOR THE YEAR ENDED 30 JUNE 2015 – CONTINUED

41
GoodwillRm
Customer lists and contracts
Rm
Computer software
Rm
Other intangibles
RmTotal
Rm
4. GOODWILL AND INTANGIBLE ASSETSAt 30 June 2015Cost 5 944 2 923 729 159 9 755Accumulated amortisation and impairment 926 1 215 376 45 2 562
5 018 1 708 353 114 7 193
Net carrying value at beginning of year 4 737 1 722 216 91 6 766Movements during the year~
Net acquisition of subsidiaries and businesses 463 351 3 1 818Additions 337 34 371Proceeds from disposal (9) (1) (10)Profit (loss) on disposal 1 (1)Impairment charge (67) (67)Amortisation (415) (85) (10) (510)Currency adjustments (102) 50 (2) 1 (53)Reclassification to assets classified as held for sale (13) (108) (1) (122)
Net carrying value at end of year 5 018 1 708 353 114 7 193
~ The above include movements from the discontinued operations up to the point of reclassification to assets classified as held for sale. The amounts disclosed in the notes to the consolidated statement of profit or loss relate to continuing operations only. Refer to note 15.2 for certain disclosures relating to discontinued operations.
GoodwillRm
Customer lists and contracts
Rm
Computer software
Rm
Other intangibles
RmTotal
Rm
At 30 June 2014Cost 5 596 2 558 625 147 8 926Accumulated amortisation and impairment 859 836 409 56 2 160
4 737 1 722 216 91 6 766
Net carrying value at beginning of year 3 926 1 055 156 69 5 206Net acquisition of subsidiaries and businesses 579 937 1 10 1 527Additions 128 17 145Proceeds from disposal (3) (3)Impairment charge (38) (7) (45)Amortisation (339) (67) (6) (412)Loss from disposal (1) (1)Reclassification 3 3Currency adjustments 270 69 6 1 346
Net carrying value at end of year 4 737 1 722 216 91 6 766
Expenditure on acquired trademarks, licenses, customer lists and computer software is amortised using the straight-line basis over their estimated useful lives between 2 to 10 years. Goodwill is not amortised, but is tested for impairment annually.
Refer to note 39.3 for details of new business combinations during the year.

42 IMPERIAL HOLDINGS LIMITED Audited Annual Financial Statements for the year ended 30 June 2015
4. GOODWILL AND INTANGIBLE ASSETS CONTINUED
GOODWILL AND INDETERMINATE USEFUL LIFE INTANGIBLE ASSETSA summary of the goodwill and indeterminate useful life intangible assets by cash generating unit (CGU) and related assumptions applied for impairment testing purposes are as follows:
Carrying amount Pre tax discount rate Terminal growth rate
CGUs with significant goodwill2015
Rm2014
Rm2015
%2014
%2015
%2014
%
Logistics AfricaCIC Holdings Limited 468 468 16,3 16,6 6,0 6,0Imperial Health Sciences 194 194 20,9 20,7 4,5 4,5Eco Health Limited 532 463 19,0 20,4 9,0 9,0Imres B.V 400 11,9 2,6Imperial Managed Logistics (Pty) Limited 67 67 20,5 20,4 4,5 4,5Logistics International*Panopa Group* 451 487 7,8 8,4 1,5 1,5Neska Group* 82 146 7,7 8,3 1,5 1,5Lehnkering Group* 1 055 1 076 7,8 8,4 1,5 1,5Lubcke Marine 54 58 6,4 7,8 1,5 1,5Shipping Group* 772 7,8 1,5Reederei Group* 759 9,0 1,5Rijnaarde BV* 87 8,4 1,5Vehicle Import, Distributionand DealershipsUvundlu Investments (Pty) Limited 56 56 19,0 19,2 5,4 4,5E-Z-Go Golf Carts 55 55 17,9 16,6 4,5 4,5Renault SA (Pty) Limited 98 98 16,0 15,7 4,5 4,5Vehicle Retail, Rental and AfterMarket PartsBeekman Super Canopies (Pty) Limited 76 76 19,5 20,1 4,5 4,5Midas (Pty) Limited 202 202 16,4 16,0 4,5 4,5Orwell Trucks Limited 61 57 12,1 13,3 2,0 2,0S&B Commercials plc 60 12,1 2,0
Significant goodwill 4 683 4 349Other goodwill* 335 388
Net carrying value of goodwill 5 018 4 737
CGU's with significant indeterminate useful life intangible assetsRenault SA (Pty) Limited 222 222 16,0 15,7 4,5 4,5Other 45 45
Net carrying value of indeterminate useful life intangible assets~ 267 267
~ Included in customer lists and contracts above.* The CGU's within this division have changed in line with their business reporting segments.
> NOTES TO THE CONSOLIDATED ANNUAL FINANCIAL STATEMENTS FOR THE YEAR ENDED 30 JUNE 2015 – CONTINUED

43
GOODWILL IMPAIRMENT TESTINGGoodwill is allocated to the appropriate CGU's according to the type of business and where it operates. The CGU's represent the identifiable assets for which an active market exists and which generate independent cash flows for the Group.
External and internal factors surrounding the business operations play a role in determining an indication of impairment. In addition the carrying amount of goodwill is subject to an annual impairment test. Impairment tests are carried out on all goodwill balances within each CGU.
Impairment of goodwill arises when the recoverable amount of the CGU, including goodwill is less than the carrying value. The recoverable amount is determined as the greater of the fair value less costs to sell or the value in use. In most instances it is difficult to use the fair value less costs to sell as no reliable estimate is easily obtainable in determining the recoverable amount. Therefore the value in use method is used to assess the goodwill for impairment.
KEY ASSUMPTIONS USED IN VALUE IN USE CALCULATIONSCash flow projectionsThe value in use is calculated using the forecasted cash inflows and outflows which are expected to be derived from continuing use of the CGU and its ultimate disposal. Cash flow projections for financial forecasts are based on expected revenue, operating margins, working capital requirements and capital expenditure, which were approved by senior management.
The expected revenues were based on market share assumptions, volume growth and price increases. No significant change in market share was assumed during the forecasted period and is based on the average market share in the period immediately before the forecast period. Volume growth was based on average growth experienced in recent years. The exchange rates used in the cash flow projections were consistent with external sources of information.
Operating margins reflect past experience but adjusted for any expected changes for the individual CGU's.
These cash flow projections cover a five-year forecast period, which are then extrapolated into perpetuity using applicable terminal growth rates.
The key assumptions used in arriving at projected cash flows were as follows:Logistics Africa – Market share assumptions and operating margins.Logistics International – Market share assumptions and operating margins.Vehicle Import, Distribution and Dealerships – Volume growth, exchange rates affecting the purchase price in relation to the vehicle selling price increases.Vehicle Retail, Rental and After Market Parts – Market share assumptions and operating margins.
Growth ratesGrowth rates applied are determined based on future trends within the industry, geographic location and past experience within the operating divisions. Growth rates can fluctuate from year to year based on the assumptions used to determine these rates.
The Group used steady growth rates to extrapolate revenues beyond the forecasted period, which were consistent with publicly available information relating to long-term average growth rates for each of the markets in which each of the respective CGUs operates.
Discount rates appliedThe discount rates present the current market assessment of the risks for each CGU, taking into consideration the time value of money and individual risks of the underlying assets that have not been incorporated in the cash flow projections. The discount rate calculations are derived from the CGU's weighted average cost of capital and takes into account both the cost of debt and the cost of equity.
The cost of equity was arrived at by using the capital asset pricing model (CAPM) which, where necessary, takes into account an equity risk premium and a small stock premium. The CAPM uses market betas of comparable entities in arriving at the cost of equity. The cost of debt is based on the interest-bearing borrowings the CGU is obliged to service.
The debt to equity ratio was determined by applying market value weights based on theoretical target gearing levels, giving consideration to industry averages and using data of comparable entities.

44 IMPERIAL HOLDINGS LIMITED Audited Annual Financial Statements for the year ended 30 June 2015
4. GOODWILL AND INTANGIBLE ASSETS CONTINUED
GOODWILL IMPAIRMENTSDuring the current year the Group impaired goodwill amounting to R67 million (2014: R38 million) in the following operating segments. The goodwill impairment is included within "Other non-operating items" in profit or loss.
Operating segment2015
Rm2014
Rm
ContinuingLogistics Africa 33 30 Logistic International 32 Vehicle Retail, Rental and After Market Parts 1 8
DiscontinuedInsurance 1
67 38
The goodwill impairments are as a result of changes in trading and market conditions.
Change in key assumptions and conclusionThe directors believe that any reasonable possible change in the key assumptions on which the recoverable amount is based would not cause the aggregate carrying amount to exceed the aggregate recoverable amount of the CGU.
2015Rm
2014Rm
5. INVESTMENT IN ASSOCIATES AND JOINT VENTURESListed shares at cost 282 282 Unlisted shares at cost 486 478 Share of post-acquisition equity 422 463
Carrying value of shares – equity accounted 1 190 1 223 Indebtedness by associates and joint ventures 161 195
– Less than one year 116 112 – More than one year 45 83
1 351 1 418
Valuation of sharesListed shares at fair value (Level 1 in the fair value hierarchy) 763 882
Details of the group's material associates and joint ventures are reflected in note 39.5.
> NOTES TO THE CONSOLIDATED ANNUAL FINANCIAL STATEMENTS FOR THE YEAR ENDED 30 JUNE 2015 – CONTINUED

45
Land, buildings and
leasehold improve-
mentsRm
Equipment and
furnitureRm
Motor vehicles
RmTotal
Rm
6. PROPERTY, PLANT AND EQUIPMENTAt 30 June 2015Cost 10 493 5 375 639 16 507 Accumulated depreciation and impairment 1 700 3 550 290 5 540
8 793 1 825 349 10 967
Net carrying value at beginning of year 8 461 1 721 287 10 469 Movements during the year~
Net acquisition of subsidiaries and businesses 50 9 48 107 Additions 998 604 272 1 874 Proceeds from disposal (254) (24) (149) (427)Depreciation (149) (495) (118) (762)Impairment charge (4) (7) (11)Profit from disposal 33 1 7 41 Currency adjustments (119) (48) 1 (166)Reclassifications (117) 103 2 (12)Reclassification to assets classified as held for sale (106) (39) (1) (146)
Net carrying value at end of year 8 793 1 825 349 10 967
~ The above include movements from the discontinued operations up to the point of reclassification to assets classified as held for sale. The amounts disclosed in the notes to the consolidated statement of profit or loss relate to continuing operations only. Refer to note 15.2 for certain disclosures relating to discontinued operations.
Land, buildings and
leasehold improve-
mentsRm
Equipment and
furnitureRm
Motor vehicles
RmTotal
Rm
At 30 June 2014Cost 10 109 5 046 521 15 676 Accumulated depreciation and impairment 1 648 3 325 234 5 207
8 461 1 721 287 10 469
Net carrying value at beginning of year 7 425 1 585 247 9 257 Net acquisition of subsidiaries and businesses 21 15 26 62 Additions 1 101 620 200 1 921 Proceeds from disposal (311) (100) (123) (534)Depreciation (148) (468) (75) (691)Impairment charge (37) (1) (38)Profit (loss) from disposal 150 (5) 6 151 Currency adjustments 262 93 4 359 Reclassifications (2) (18) 2 (18)
Net carrying value at end of year 8 461 1 721 287 10 469
Depreciation is calculated on a straight-line basis to write off the cost of each component of an asset to its residual value over its estimated useful life as follows:– Buildings 20 years– Equipment and furniture 3 to 10 years– Motor vehicles 3 to 5 years
Certain property, plant and equipment were encumbered as security for interest-bearing borrowings amounting to R80 million (2014: R23 million), refer to note 21.
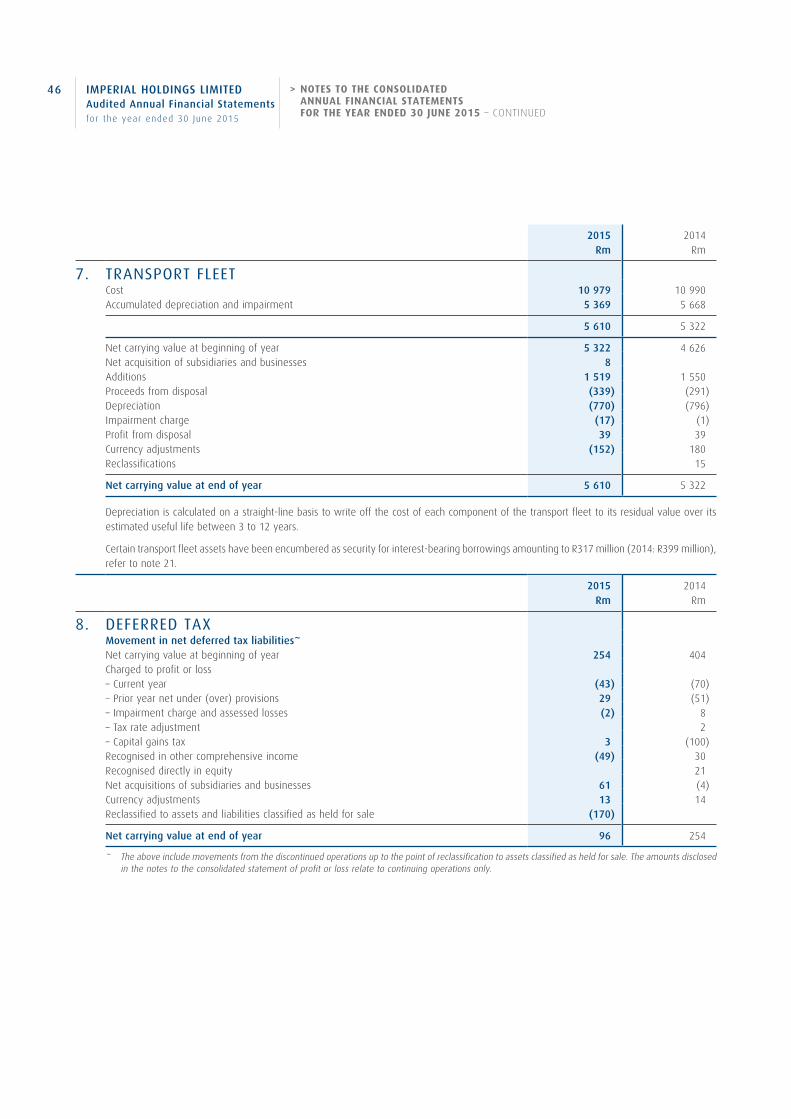
46 IMPERIAL HOLDINGS LIMITED Audited Annual Financial Statements for the year ended 30 June 2015
2015Rm
2014Rm
7. TRANSPORT FLEETCost 10 979 10 990 Accumulated depreciation and impairment 5 369 5 668
5 610 5 322
Net carrying value at beginning of year 5 322 4 626 Net acquisition of subsidiaries and businesses 8 Additions 1 519 1 550 Proceeds from disposal (339) (291)Depreciation (770) (796)Impairment charge (17) (1)Profit from disposal 39 39 Currency adjustments (152) 180 Reclassifications 15
Net carrying value at end of year 5 610 5 322
Depreciation is calculated on a straight-line basis to write off the cost of each component of the transport fleet to its residual value over its estimated useful life between 3 to 12 years.
Certain transport fleet assets have been encumbered as security for interest-bearing borrowings amounting to R317 million (2014: R399 million), refer to note 21.
2015Rm
2014Rm
8. DEFERRED TAXMovement in net deferred tax liabilities~
Net carrying value at beginning of year 254 404 Charged to profit or loss – Current year (43) (70)– Prior year net under (over) provisions 29 (51)– Impairment charge and assessed losses (2) 8 – Tax rate adjustment 2 – Capital gains tax 3 (100)Recognised in other comprehensive income (49) 30 Recognised directly in equity 21 Net acquisitions of subsidiaries and businesses 61 (4)Currency adjustments 13 14 Reclassified to assets and liabilities classified as held for sale (170)
Net carrying value at end of year 96 254
~ The above include movements from the discontinued operations up to the point of reclassification to assets classified as held for sale. The amounts disclosed in the notes to the consolidated statement of profit or loss relate to continuing operations only.
> NOTES TO THE CONSOLIDATED ANNUAL FINANCIAL STATEMENTS FOR THE YEAR ENDED 30 JUNE 2015 – CONTINUED

47
2015Rm
2014Rm
8. DEFERRED TAX CONTINUED
Analysis of deferred tax– Intangible assets 356 394 – Property, plant and equipment 338 284 – Transport fleet 579 648 – Vehicles for hire 98 50 – Investments 21 15 – Inventories (137) (130)– Provisions and maintenance contracts (818) (690)– Deferral of recoupments 134 129 – Retirement benefit obligation (194) (164)– Tax losses (247) (316)– Capital gains tax 67 – Other (34) (33)
Net deferred tax on statement of financial position 96 254
Deferred tax assets (1 097) (1 101)Deferred tax liabilities 1 193 1 355
Net deferred tax on statement of financial position 96 254
Unrecognised tax lossesUnused tax losses available for offset against future profits (1 861) (2 149)Deferred tax asset recognised in respect of such losses 878 1 127
Remaining tax losses not recognised (983) (1 022)
Where entities within the group are expecting to be profitable and have a high prospect of utilising any noted assessed losses in the future, deferred tax assets are raised. The assessments are performed on a continuous basis and if required the deferred tax asset raised is impaired. Management has assumed that the recoverability of the balance of the unrecognised losses is still in doubt because a trend of profitable growth in the respective entities has not yet been established and hence have not raised deferred tax assets on this balance.
Deferred tax assets were impaired where entities do not show signs of profitability in the foreseeable future.

48 IMPERIAL HOLDINGS LIMITED Audited Annual Financial Statements for the year ended 30 June 2015
2015Rm
2014Rm
9. INVESTMENTS AND LOANSInvestmentsListed at fair value~ 1 883 Unlisted at fair value~ 309
2 192 Loans at amortised cost 357 276
Total investments and loans 357 2 468
The above investments are categorised as follows:Designated at fair value through profit or loss 1 983
– Investments~ 1 674 – Fixed and negotiable deposits~ 309
Available-for-sale 209
2 192
The maximum exposure to market risk at reporting date for investments designated as fair value through profit and loss equates their carrying value~ 1 983
~ Reclassified to assets classified as held for sale.
Effective interest rates on loans 2,5% – 10,0% 5,0% – 11,5%
Maturity analysis of investments and loans– Maturing within one year 152 163 – Maturing after one year but within five years 94 330 – Maturing after five years 111 175
357 668 Investments realisable at short notice 1 800
357 2 468
10. OTHER FINANCIAL ASSETSReinsurance receivables 267 Cross-currency swaps at fair value – maturing July 2017 36
36 267
The reinsurance receivables were reclassified to 'Assets classified as held for sale'.
For further disclosures refer to note 38.
> NOTES TO THE CONSOLIDATED ANNUAL FINANCIAL STATEMENTS FOR THE YEAR ENDED 30 JUNE 2015 – CONTINUED

49
2015Rm
2014Rm
11. VEHICLES FOR HIRE*Cost 4 413 3 661 Accumulated depreciation and impairment 810 716
3 603 2 945
Net carrying value at beginning of year 2 945 2 929 Additions 3 268 2 874 Proceeds from disposal (1 737) (2 063)Depreciation (921) (760)Profit from disposal 5 2 Currency adjustments 1 Reclassifications 42 (37)
Net carrying value at end of year 3 603 2 945
* 2014 Restated for change in accounting policy as described in note 2.2.
Depreciation is calculated on a straight-line basis to write off the cost of each component of the vehicle to its residual value over its estimated useful life between 1 to 5 years.
12. INVENTORIES*New vehicles 8 591 7 515 Used vehicles 3 150 2 915 Spares, accessories and finished goods 1 971 1 673 Pharmaceutical goods 996 353 Fast moving consumer goods 355 287 Merchandise 185 192 Work in progress 119 107 Fuel and oil 98 90
15 465 13 132
* 2014 Restated for change in accounting policy as described in note 2.2.
Inventories carried at net realisable value included above 6 715 6 482 Net amount of inventory write-down expensed in profit or loss 28 95
Certain inventories have been encumbered as security for interest-bearing borrowings amounting to R927 million (2014: R417 million), refer to note 21.
13. TRADE AND OTHER RECEIVABLESTrade receivables 11 531 10 688
– Gross receivables 12 042 11 117 – Provision for doubtful debts (511) (429)
Prepayments and other receivables 1 233 1 189 Derivative instruments 85 5
12 849 11 882
For further disclosures refer to note 38.
.
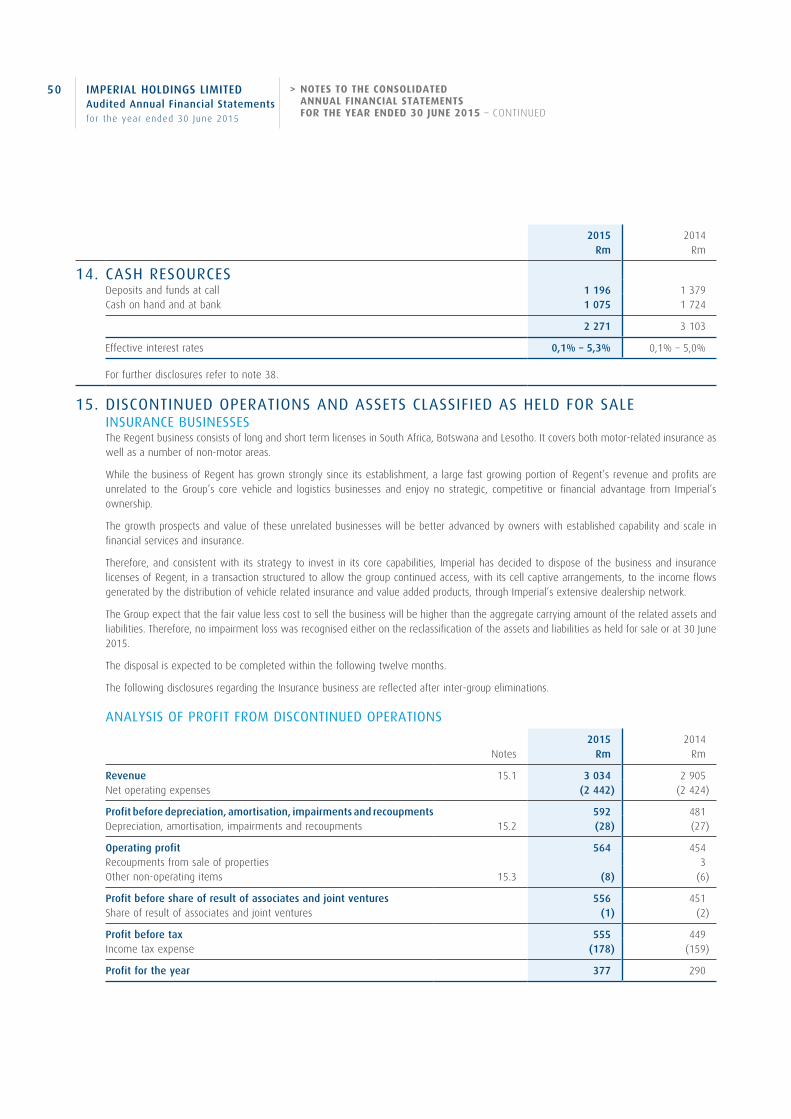
50 IMPERIAL HOLDINGS LIMITED Audited Annual Financial Statements for the year ended 30 June 2015
2015Rm
2014Rm
14. CASH RESOURCESDeposits and funds at call 1 196 1 379 Cash on hand and at bank 1 075 1 724
2 271 3 103
Effective interest rates 0,1% – 5,3% 0,1% – 5,0%
For further disclosures refer to note 38.
15. DISCONTINUED OPERATIONS AND ASSETS CLASSIFIED AS HELD FOR SALEINSURANCE BUSINESSESThe Regent business consists of long and short term licenses in South Africa, Botswana and Lesotho. It covers both motor-related insurance as well as a number of non-motor areas.
While the business of Regent has grown strongly since its establishment, a large fast growing portion of Regent’s revenue and profits are unrelated to the Group’s core vehicle and logistics businesses and enjoy no strategic, competitive or financial advantage from Imperial’s ownership.
The growth prospects and value of these unrelated businesses will be better advanced by owners with established capability and scale in financial services and insurance.
Therefore, and consistent with its strategy to invest in its core capabilities, Imperial has decided to dispose of the business and insurance licenses of Regent, in a transaction structured to allow the group continued access, with its cell captive arrangements, to the income flows generated by the distribution of vehicle related insurance and value added products, through Imperial’s extensive dealership network.
The Group expect that the fair value less cost to sell the business will be higher than the aggregate carrying amount of the related assets and liabilities. Therefore, no impairment loss was recognised either on the reclassification of the assets and liabilities as held for sale or at 30 June 2015.
The disposal is expected to be completed within the following twelve months.
The following disclosures regarding the Insurance business are reflected after inter-group eliminations.
ANALYSIS OF PROFIT FROM DISCONTINUED OPERATIONS
Notes2015
Rm2014
Rm
Revenue 15.1 3 034 2 905 Net operating expenses (2 442) (2 424)
Profit before depreciation, amortisation, impairments and recoupments 592 481 Depreciation, amortisation, impairments and recoupments 15.2 (28) (27)
Operating profit 564 454 Recoupments from sale of properties 3 Other non-operating items 15.3 (8) (6)
Profit before share of result of associates and joint ventures 556 451 Share of result of associates and joint ventures (1) (2)
Profit before tax 555 449 Income tax expense (178) (159)
Profit for the year 377 290
> NOTES TO THE CONSOLIDATED ANNUAL FINANCIAL STATEMENTS FOR THE YEAR ENDED 30 JUNE 2015 – CONTINUED

51
2015Rm
2014Rm
15.1 ANALYSIS OF REVENUERendering of services 111 102 Gross premiums received 2 918 2 802 Other 5 1
External revenue 3 034 2 905 Inter-group revenue 64 69
Total revenue 3 098 2 974
15.2 DEPRECIATION, AMORTISATION, IMPAIRMENTS AND RECOUPMENTSDepreciation and amortisationIntangible assets (10) (8)Property, plant and equipment (18) (19)
(28) (27)
15.3 OTHER NON-OPERATING ITEMSFair value loss on derivatives (1)Change in economic assumptions of insurance funds (6) (7)Capital items (1) 1
(8) (6)
15.4 CASH FLOWS FROM DISCONTINUED OPERATIONSCash flows from operating activities 391 402 Cash flows from investing activities (1 103) 1 123 Cash flows from financing activities (31) (72)
The major classes of assets and liabilities classified as held for sale at 30 June were as follows:
15.5 ASSETSGoodwill and intangible assets 122 Investment in associates and joint ventures 17 Property, plant and equipment 146 Current and deferred tax assets 20 Investments and other financial assets 3 250 Trade and other receivables 218 Cash resources 845
Assets classified as held for sale 4 618
15.6 LIABILITIESInsurance and investment contracts 1 361 Current and deferred tax liabilities 197 Trade and other payables and provisions 1 155
Liabilities directly associated with assets classified as held for sale 2 713
Investments and other financial assets consists of listed investments of R2 288 million (level 1 in the fair value hierarchy), fixed and negotiable deposits of R733 million (level 2 in the fair value hierarchy) and reinsurance receivables of R229 million at amortised cost.

52 IMPERIAL HOLDINGS LIMITED Audited Annual Financial Statements for the year ended 30 June 2015
2015Rm
2014Rm
16. SHARE CAPITAL AND SHARE PREMIUMAuthorised share capital394 999 000 (2014: 394 999 000) ordinary shares of 4 cents each 15 15 50 000 000 (2014: 50 000 000) deferred ordinary shares of 4 cents each 2 2 15 000 000 (2014: 15 000 000) preferred ordinary shares of 4 cents each 1 1 1 000 (2014: 1 000) redeemable preference shares of 4 cents each40 000 000 (2014: 40 000 000) non-redeemable, non-participating preference shares of 4 cents each* 2 2
20 20
Issued and fully paid share capital~
202 782 278 (2014: 207 815 753) ordinary shares of 4 cents each 8 8 10 193 767 (2014: 11 025 236) deferred ordinary shares of 4 cents each 1 1
Share capital 9 9 Share premium 373 373
Share capital and premium 382 382
* For non-redeemable, non-participating preference shares in issue refer to note 19.~ For movements in the number of issued shares refer to the Directors report on page 12.
Directors' authority to issue ordinary shares and non-redeemable, non-participating preference sharesThe directors have been given general authority until the next annual general meeting to issue: > not more than five percent of the issued ordinary share capital at 30 June 2014; > not more than five million of the non-redeemable, non-participating preference shares.
Ordinary sharesThe ordinary shares carry one vote per share and are entitled to an ordinary dividend.
Deferred ordinary sharesUkhamba, the BEE partner that owns an effective 10,7% shareholding in Imperial, at 30 June 2015 facilitated the trading of its shares on an Over the Counter (OTC) Platform to allow our employees and beneficiaries in Ukhamba to monetise their value in Ukhamba. To allow for this, at a general meeting held on 21 October 2013, Imperial shareholders agreed to alter the conversion profile of the deferred ordinary shares to equal predetermined conversions over 12 years. As a result 831 469 deferred shares convert annually, with the last conversion on 30 June 2025. The R70 million cost for altering the conversion profile of the deferred shares was charged to profit or loss in the prior year.
By the end of the current financial year 12 561 622 (2014: 11 730 153) deferred ordinary shares have been converted into ordinary shares.
The deferred ordinary shares carry one vote per share and are not entitled to dividends.
Directors interests in issued share capitalAt year-end the aggregate shareholdings of the directors in the issued ordinary share capital of the company are outlined in note 40.
> NOTES TO THE CONSOLIDATED ANNUAL FINANCIAL STATEMENTS FOR THE YEAR ENDED 30 JUNE 2015 – CONTINUED

53
Number of shares
2015Rm
17. SHARES REPURCHASEDShares repurchased, at 30 June 2015, consists of 8 184 456 ordinary shares held by a wholly owned subsidiary of the company.The movement in the shares repurchased were as follows:Ordinary shares held by wholly owned subsidiary 7 864 456 445Ordinary shares held by Lereko accounted for as shares repurchased 5 864 944 (665)
Carrying value at the beginning of year 13 729 400 (220)Repurchase of 320 000 ordinary shares at R172,68 each, plus transaction cost 320 000 (56)Cancellation of 5 864 944 shares^ (5 864 944) 665Re-allocation of prior years surplus on shares cancelled (1 057)
Carrying value at end of year 8 184 456 (668)
^ On 4 June 2015 Imperial exercised its call option right in terms of the Lereko BEE transaction to repurchase the 5 864 944 Imperial shares held by Lereko. The shares repurchased were delivered to Imperial on 15 June 2015 and cancelled at the same time.
2015Rm
2014Rm
18. OTHER RESERVESForeign currency translation reserve (refer note 18.1) 1 161 1 470Share-based payment reserve (For details about the Group's share schemes refer note 18.2) (71) (208)Hedge accounting reserve 78 (68)Statutory reserve 222 183Premium paid on purchase of non-controlling interests (refer note 18.3) (399) (364)Valuation reserve 8 44Changes in net asset of associates and joint ventures 90 92
1 089 1 149
For movements in other reserves, refer to the consolidated statement of changes in equity on pages 18 and 19.
18.1 FOREIGN CURRENCY TRANSLATION RESERVEBalance at beginning of year 1 470 951Goodwill and intangible assets (53) 346Investments, loans, other financial assets, associates and joint ventures (39) 83Property, plant and equipment (166) 359Transport fleet (152) 180Deferred tax (13) (14)Vehicles for hire 1Inventories 25 204Current tax 11 5Trade and other receivables (182) 389Cash resources 7 45Non-controlling interests (5) (14)Retirement benefit obligations 78 (114)Interest-bearing borrowings 117 (487)Insurance, investment, maintenance and warranty contracts (4) (6)Other financial liabilities (58) (2)Provisions for liabilities and charges 23 (55)Trade and other payables 101 (400)
Balance at end of year 1 161 1 470

54 IMPERIAL HOLDINGS LIMITED Audited Annual Financial Statements for the year ended 30 June 2015
18. OTHER RESERVES CONTINUED
18.2 SHARE-BASED PAYMENT RESERVEClosed periodBecause of the potential sale of the Insurance division regulations prevent the allocation of share appreciation rights and deferred bonus plan rights until the closed period is lifted.
The following details applies to the Group's share schemes.
2015 2014
Share Appreciation Rights SchemeNumber of
rights
Weighted average
exercise price (Rand)
Number of rights
Weighted average
exercise price (Rand)
Rights granted at beginning of year 10 925 436 176,38 11 216 355 148,05 Rights allocated during the year 3 197 046 193,77 Rights exercised during the year (934 431) 113,67 (2 685 895) 84,46 Rights forfeited during the year (619 933) 186,64 (802 070) 161,64
Unexercised rights at end of year 9 371 072 181,94 10 925 436 176,38
Number of rights
Average exercise price (Rand) Expiry date
Share Appreciation Rights Scheme – details of rights by year of grantGrant dateJune 2009 73 555 55,32 June 2016June 2010 235 405 96,71 June 2017June 2011 391 750 116,59 June 2018June 2012 2 261 282 170,57 June 2019June 2013 3 370 514 195,20 June 2020June 2014 3 038 566 193,77 June 2021
Total unexercised rights at end of year 9 371 072
Total weighted average price 181,94
Number of rights
Deferred Bonus Plan 2015 2014
Rights granted at beginning of year 305 495 119 363Rights exercised during the year (280 546) (99 539)Rights forfeited during the year (24 949) (19 824)
Prior year rights carried forwardRights allocated during the year 305 495
Unexercised rights at end of year 305 495
> NOTES TO THE CONSOLIDATED ANNUAL FINANCIAL STATEMENTS FOR THE YEAR ENDED 30 JUNE 2015 – CONTINUED

55
Deferred Bonus Plan – details of rights taken up and to be vested#
Number of rights
Vesting date
Rights taken upSeptember 2012 96 116 September 2015September 2013 84 065 September 2016June 2014 60 787 June 2017September 2014 216 550 September 2017
# Rights entitle participants to invest in Imperial shares, which, if held for three years, will be matched by the company on a one-for-one basis by the allocation of an equal number of Imperial shares for no consideration.
Upon exercise by participants the group will settle the value of the difference between the exercise and grant price by delivering shares, alternatively as a fall back provision only by settling the value in cash.
Based on prior years' vesting experience, hedges and shares have been purchased to cover the anticipated number of share appreciation rights and deferred bonuses that will convert. During the 2015 financial year the company repurchased 320 000 shares.
The fair values for the share-based payment reserve is calculated using a Black-Scholes pricing model.
The inputs into the model established at the grant dates and which have not changed were as follows:
2014 2013 2012
Share Appreciation Rights Scheme Volatility (%) 28,41 29,50 30,80 Weighted average share price (Rand) 193,77 195,20 170,57 Weighted average exercise price (Rand) 193,77 195,20 170,57 Weighted average fair value (Rand) 46,67 47,02 43,24 Expected life (years) 4,28 4,32 4,26 Average risk-free rate (%) 7,75 6,50 5,85 Expected dividend yield (%) 4,34 3,89 3,28
Deferred Bonus PlanVolatility (%) 28,41 29,50 30,80 Weighted average share price (Rand) 193,77 195,20 170,57 Weighted average fair value (Rand) 168,45 171,89 153,56 Expected life (years) 3,23 3,27 3,20 Average risk-free rate (%) 7,75 6,50 5,85 Expected dividend yield (%) 4,34 3,89 3,28
The volatilities were determined by calculating the historical volatility of the company’s share price over the previous five years. The expected life is determined by the rules of the schemes which dictate the final expiry date.
The current year's share based payment expense charged to profit or loss amounted to R130 million of which R20 million related to discontinued operations. A current income tax benefit of R10 million was recognised directly in equity.
Directors' interests in issued share capitalAt year-end the aggregate shareholdings of the directors in the issued ordinary share capital of the company are outlined in note 40.

56 IMPERIAL HOLDINGS LIMITED Audited Annual Financial Statements for the year ended 30 June 2015
18. OTHER RESERVES CONTINUED
18.3 PREMIUM PAID ON PURCHASE OF NON-CONTROLLING INTERESTSThe effects of changes in the group's ownership interest in subsidiaries that did not result in a loss of control during the year were as follows:
Decrease in equity
attributable to owners of
ImperialRm
Increase (decrease) in
non-controlling interests
Rm
Consideration amount
Rm
The effects of changes in the group's ownership interest in subsidiaries that did not result in a loss of control during the year were as follows: (47) (43) (90)
2015 (47) (43) (90)
In May 2014 the Group acquired a further 15% ownership interest from a non-controlling shareholder of Eco Health Limited thereby increasing its interest from 53% to 68%. The transaction resulted in a decrease in the put option liability of R289 million with a corresponding entry to equity. (176) (97) (273)Aggregate of immaterial transactions (49) 1 (48)
2014 (225) (96) (321)
2015Rm
2014Rm
19. NON-REDEEMABLE, NON-PARTICIPATING PREFERENCE SHARESNon-redeemable, non-participating preference shares at cost 441 441
4 540 041 preference shares listed on the JSE under specialist securities – preference shares sector.
These shares are entitled to a preference dividend being 82,5% of the prime interest rate. The company is obligated to pay any arrear dividends within five years from the proceeds raised by issuing new ordinary shares within six months prior to such payment. Because of the cumulative nature of these preference shares they are classified as debt with no repayment terms.
The coupon is payable semi-annually on 1 April and 1 October and annually this amounts to R35 million (2014: R33 million) which is included in finance cost in profit or loss.
> NOTES TO THE CONSOLIDATED ANNUAL FINANCIAL STATEMENTS FOR THE YEAR ENDED 30 JUNE 2015 – CONTINUED

57
2015Rm
2014Rm
20. RETIREMENT BENEFIT OBLIGATIONSDefined contribution plansThe Group provides retirement benefits through independent funds under the control of trustees and all contributions to those funds are charged to profit or loss. The large majority of South African employees, other than those employees required by legislation to be members of various industry funds, are members of the Imperial Group Pension Fund and the Imperial Group Provident Fund which are governed by the Pensions Funds Act, 1956.
Total cost charged to profit or loss 766 676
Defined benefit plansImperial Logistics International GmbH, a subsidiary located in Germany, operates a number of defined benefit plans for its employees in Europe with a majority of the plans being unfunded. Under the plans the employees are entitled to retirement benefits which are dependent on seniority, length of service and level of pay.
The benefit obligations in Europe are provided for based on actuarial valuations prepared using the projected unit credit method, with the following assumptions: % %
– Discount rate 2,30 3,00 – Projected pension payment increase 1,75 1,75 – Projected salary and other contribution increase 2,00 2,00 – Fluctuation rate (depends on the age of male or female) 0,00 – 8,00 0,00 – 8,00
The latest actuarial valuation was performed in June 2015. In the opinion of the actuary, the provision for the defined benefit obligations is adequate. The next valuation will be conducted in June 2016.
2015Rm
2014Rm
The amounts, included in staff costs, recognised in profit or loss in respect of the plans are as follows:Current service cost 16 25Interest costs 30 30
46 55
The amount included on the consolidated statement of financial position arising from the Group's obligations are as follows:Defined retirement benefit obligationsCarrying value at beginning of year 1 083 1 014Acquisition of subsidiaries and businesses 1Remeasurement in other comprehensive income 137 (64)Payments to retired employees (32) (38)Plan assets transferred 2Currency adjustments (78) 114Amounts charged to profit or loss 46 55
Carrying value at end of year 1 157 1 083
The expected payments to retired employees for the next financial year is R42 million and the average duration of the retirement plans varies from 8 to 38 years with a median of 18 years.
A quantitative sensitivity analysis for significant assumptions as at 30 June 2015 is as shown below:
Assumptions Discount rate Future pension costSensitivity level 1% increase
Rm1% decrease
Rm1% increase
Rm1% decrease
Rm
Impact on defined benefit obligation (183) 240 163 (134)
Based on past experience life expectancy is assumed to remain unchanged.
The sensitivity analysis have been determined based on a method that extrapolates the impact on the defined benefit obligation as a result of reasonable changes in the key assumptions occurring at the end of the reporting period.

58 IMPERIAL HOLDINGS LIMITED Audited Annual Financial Statements for the year ended 30 June 2015
2015Rm
2014Rm
21. INTEREST-BEARING BORROWINGSLong-term– Loans secured by mortgage bonds over fixed property 117 96– Liabilities under capitalised finance leases 201 211– Instalment sale creditors secured by assets 12 20– Corporate bonds 5 841 5 837– Listed on the Bond Exchange of South Africa
– IPL 5 – maturing in September 2015 500 500– IPL 6 – maturing in September 2017 1 537 1 536– IPL 7 – maturing in April 2018 763 762– IPL 8 – maturing in October 2020 1 526 1 525– IPL 9 – maturing in May 2021 757 756– IPL 10 – maturing in May 2021 758 758
– Syndicated bank term loans 2 862 3 467– Bilateral loan 1 012 1 080– Revolving credit facility term loans 3 012 1 500– Unsecured loans 22 128
13 079 12 339Short term– Unsecured loans, call borrowings and bank overdrafts 3 386 1 601– Commercial paper 299 604
Total borrowings at amortised cost 16 764 14 544Less: Current portion of interest-bearing borrowings 4 500 2 697
Long-term borrowings 12 264 11 847
Interest rate analysis
Current year interest rates
(%)
Fixed– Mortgage bonds, capitalised finance leases and installment sale creditors 2,0 – 11,8 272 245– Corporate bonds – IPL 6 9,8 1 537 1 536– Corporate bonds – IPL 10 9,4 758 758– Syndicated Bank term loans 2 480– Notice loans 2,0 – 4,1 65– Unsecured loans 9,3 – 18,0 4 116– Bilateral loan 2,3 1 012 1 080Variable linked– Mortgage bonds, capitalised finance leases and installment sale creditors 7,8 – 10,0 58 82– Corporate bonds – IPL 5 7,9 – 8,1 500 500– Corporate bonds – IPL 7 7,3 – 7,7 763 762– Corporate bonds – IPL 8 7,5 – 7,9 1 526 1 525– Corporate bonds – IPL 9 7,5 – 7,8 757 756– Syndicated Bank term loans 1,2 – 1,7 2 862 987– Revolving credit facility term loans 1,8 – 7,7 3 012 1 500– Notice loans 6,6 53 230– Unsecured loans 0,1 – 10,0 18– Floorplan – Unsecured loans 3,4 – 11,0 1 021 731– Commercial paper 5,3 – 6,5 299 604– Call borrowings 2,5 – 10,3 1 313 583– Bank overdrafts 1,0 – 9,5 934 69
16 764 14 544
For interest-rate swap arrangements and further disclosures refer to note 38.
> NOTES TO THE CONSOLIDATED ANNUAL FINANCIAL STATEMENTS FOR THE YEAR ENDED 30 JUNE 2015 – CONTINUED

59
21. INTEREST-BEARING BORROWINGS CONTINUED
Capitalised finance leases
More than five years
Rm
One to five years
Rm
Less than one year
Rm2015
Rm2014
Rm
Total minimum lease payments 17 142 63 222 243Amounts representing finance charges (2) (13) (6) (21) (32)
Present value of minimum lease payments 15 129 57 201 211
Details of encumbered assets
Carrying value of
debt secured
Rm
Carrying value of
assets encumbered
Rm
Property, plant and
equipmentRm
Transport fleet
RmInventories
Rm
Debt InstrumentsMortgage bonds, capitalised leases and installment sale creditors 394 397 80 317Floorplan 927 927 927
2015 1 321 1 324 80 317 927
2014 755 839 23 399 417
Maturity analysis of interest bearing borrowings by geographic
2020 and onwards
Rm2019
Rm2018
Rm2017
Rm2016
Rm2015
Rm2014
Rm
South Africa 4 674 3 675 72 2 641 11 062 8 767Europe 2 733 180 332 540 644 4 429 4 962United Kingdom 19 624 643 204Australia 320 320 445Other 14 3 6 16 271 310 166
7 421 183 4 013 647 4 500 16 764 14 544
Analysis of debt by denominated currency2015
Rm%
of total
SA rand 10 645 63,5 Euro 4 098 24,4 British pound 714 4,3 US dollar 355 2,1 Australian dollar 341 2,0 Japanese yen 258 1,5 Nigerian naira 175 1,0 Other 178 1,1
16 764 100,0
Borrowing facilities2015
Rm2014
Rm
Total facilities established 18 644 13 401Less: Utilised 9 272 6 698
Unutilised borrowing capacity 9 372 6 703
In terms of the memorandum of incorporation the borrowing powers of the Group are unlimited.

60 IMPERIAL HOLDINGS LIMITED Audited Annual Financial Statements for the year ended 30 June 2015
2015Rm
2014Rm
22. INSURANCE, INVESTMENT, MAINTENANCE AND WARRANTY CONTRACTSLong-term insurance funds~ 830Short-term insurance funds~ 575Maintenance and warranty contracts 3 191 2 905
3 191 4 310
Maturity analysis of insurance, investment, maintenance and warranty contracts– Maturing within one year 981 1 398 – Maturing after one year but within five years 1 799 2 180 – Maturing after five years 411 732
3 191 4 310
~ Reclassified to liabilities directly associated with assets classified as held for sale at 30 June 2015.
23. OTHER FINANCIAL LIABILITIESCross currency and interest-rate swap instruments 233 199Contingent consideration liabilities 31 92Other payables 115 430Put option liabilities 1 640 990
2 019 1 711
The put options in respect of the non-controlling interests in subsidiaries arise from arrangements whereby the non-controlling shareholders of Eco Health Limited have the right to put their remaining shareholding in Eco Health Limited to Imperial Capital Limited, as well as the non-controlling shareholders of Imres B.V. who have the right to put their remaining shareholding in Imres BV to Imperial International B.V.Netherlands.
For a maturity analysis and further disclosures refer to note 38.
> NOTES TO THE CONSOLIDATED ANNUAL FINANCIAL STATEMENTS FOR THE YEAR ENDED 30 JUNE 2015 – CONTINUED

61
Insurance claims
2015Rm
Dismantling and
environ-mental risk
2015Rm
Other2015
Rm
Total2015
Rm
Total2014
Rm
24. PROVISIONS FOR LIABILITIES AND OTHER CHARGESAt 30 June 2015Carrying value at beginning of year 124 408 448 980 857
Amounts added 17 46 224 287 455Unused amounts reversed (14) (27) (55) (96) (59)
Charged to profit or loss 3 19 169 191 396Amounts utilised (14) (19) (364) (397) (397)Net acquisitions of subsidiaries and businesses 16 16 54Currency adjustments 1 (25) 1 (23) 55Reclassifications 15Reclassification to liabilities directly associated with assets classified as held for sale (114) (49) (163)
Carrying value at end of year 383 221 604 980
Maturity profileMaturing in less than one year 50 161 211 508Maturing in one to five years 1 48 49 222Maturing in more than five years 332 12 344 250
383 221 604 980
Dismantling provisions are raised when a contractual obligation exists to remove buildings or leasehold improvements after termination of the underlying lease contract. The provision for environmental risks include the discounted cost for ongoing ground and water treatment at certain sites and possible risks identified during the environmental due diligence undertaken in the course of the Lehnkering acquisition.
Other provisions include warranty and after sales provision of R37 million and onerous contract provisions of R84 million.
The ageing fairly reflects the timing and amounts of the estimated payments to be made.
25. TRADE AND OTHER PAYABLES2015
Rm2014
Rm
Trade payables and other accruals 17 683 15 869Deferred income 83 85Derivative financial instruments 70 47
17 836 16 001
For further disclosures refer to note 38.

62 IMPERIAL HOLDINGS LIMITED Audited Annual Financial Statements for the year ended 30 June 2015
2015Rm
2014Rm
26. REVENUE26.1 AN ANALYSIS OF THE GROUP'S REVENUE IS AS FOLLOWS:
Sale of goods 63 966 57 497Rendering of services 43 487 43 165
107 453 100 662
Revenue includes:
26.2 REVENUE RECEIVED FROM THE GROUP'S ASSOCIATES AND JOINT VENTURESSale of goods 3 5Rendering of services 149 132
152 137
Revenue excludes:
26.3 REVENUE BETWEEN SUBSIDIARIESSale of goods 1 686 1 767Rendering of services 1 049 1 194Gross premiums received 10
2 735 2 971
27. NET OPERATING EXPENSESPurchase of goods 59 877 53 217Changes in inventories (1 530) (1 159)Cost of outside services 15 602 15 689Staff costs 15 085 14 062Staff share-based costs 110 88Other operating income (1 508) (1 456)Other operating costs 11 654 12 226
99 290 92 667
The above includes:Auditors' remuneration– Audit fees 66 55– Other services 6 3
72 58
Rental and operating lease charges– Property 1 207 1 071– Plant and equipment 344 402– Vehicles 76 7– Transport fleet 230 232– Other 7 22
1 864 1 734
Additional lease charges contingent upon turnover
– Property 16 7
Dividend income 181 166
* The amounts disclosed in the notes to the statement of profit or loss relate to continuing operations only. Refer to note 15.2 for certain disclosures relating to discontinued operations.
> NOTES TO THE CONSOLIDATED ANNUAL FINANCIAL STATEMENTS FOR THE YEAR ENDED 30 JUNE 2015 – CONTINUED

63
2015Rm
2014Rm
28. DEPRECIATION, AMORTISATION, IMPAIRMENTS AND RECOUPMENTSDepreciation and amortisationIntangible assets 85 68
Total amortisation of intangible assets 500 404Less: amortisation of intangible assets arising on business combinations (415) (336)
Property, plant and equipment 744 672Transport fleet 770 796Vehicles for hire 921 760
2 520 2 296ImpairmentsIntangible assets 7Plant and equipment 7 1Transport fleet 17 1
2 544 2 305RecoupmentsIntangible assets 1Plant and equipment (8) (1)Transport fleet (39) (39)Vehicles for hire (5) (2)
2 492 2 264
Recoupments from sale of properties, net of impairmentsRecoupments from sale of properties 33 147Impairment of properties (4) (37)
29 110
29. OTHER NON-OPERATING ITEMSRemeasurement of financial instruments not held-for-trading (15) (28)
Foreign exchange gains (losses) on foreign currency monetary items 75 (31)Charge for remeasurement of put option liabilities (49) (16)Gains on remeasurement of contingent consideration liabilities 2 18Reclassification of (loss) gain on disposal of available-for-sale investment (43) 1
Capital items (65) 13
Impairment of goodwill (66) (38)Profit (loss) on disposal of investments in associates and joint ventures 2 (8)Profit on disposal of subsidiaries and businesses 15 81Business acquisition costs (16) (22)
Other items (134)
Net cost of meeting obligation under onerous contract (64)Charge for amending the conversion profile of the deferred ordinary shares (70)
(80) (149)

64 IMPERIAL HOLDINGS LIMITED Audited Annual Financial Statements for the year ended 30 June 2015
2015Rm
2014*Rm
30. FINANCING COSTInterest paid on financial liabilities not at fair value through profit or loss 1 312 1 052Fair value loss on interest-rate swap instruments 14
Finance cost including fair value losses 1 326 1 052Finance income on financial assets not fair valued through profit or loss (132) (126)
1 194 926
31. INCOME TAX EXPENSESouth African normal tax– Current 960 1 001– Prior year (over) under provisions (148) 52
812 1 053
Foreign tax– Current 240 312– Prior year over provisions (2)– Tax rate adjustment 2
238 314
Deferred tax– Current (56) (94)– Prior year under (over) provisions 29 (49)– (Impairment) impairment reversal (2) 10– Tax rate adjustment 2
(29) (131)
Capital gains tax– Current 6 35– Deferred 3– Prior year overprovision of deferred tax (100)
9 (65)
Withholding and secondary taxes 5
Income tax expense 1 035 1 171
Reconciliation of tax rates: % %Profit before tax, excluding share of result of associates and joint ventures – effective tax rate 25,8 26,4Income tax effect of:– Foreign tax differential 0,4 0,3– Tax assets not recognised and deferred tax impairments 0,1 0,1– Disallowable charges and capital losses (3,2) (4,0)– Exempt and capital income 2,2 3,8– Withholding and secondary taxes (0,1)– Capital gains tax (0,2) (0,8)– Prior year net overprovisions 3,0 2,2
28,0 28,0
* The amounts disclosed in the notes to the consolidated statement of profit or loss relate to continuing operations only. Refer to note 15 for certain disclosures relating to discontinued operations.
Based on its interpretation of tax law and prior experience the group believes that its accrual for tax liabilities are adequate for all open tax years.
> NOTES TO THE CONSOLIDATED ANNUAL FINANCIAL STATEMENTS FOR THE YEAR ENDED 30 JUNE 2015 – CONTINUED

65
2015Rm
2014Rm
32. EARNINGS PER SHAREOrdinary sharesNet profit attributable to owners of Imperial – basic earnings 3 054 3 272Saving of finance costs by associate on potential sale of Imperial shares 44 60
Diluted earnings 3 098 3 332
Weighted average number of ordinary shares in issue (million) 193,1 193,9
Basic earnings per share (cents) 1 582 1 687
Continuing operations 1 416 1 559Discontinued operations 166 128
Weighted average number of ordinary shares (million) 193,1 193,9 Adjusted for weighted average potential ordinary shares resulting from:– Conversion of deferred ordinary shares to ordinary shares (million) 1,6 – Potential disposal of shares held by an associate (million) 4,5 4,5
Weighted average number of ordinary shares for diluted earnings (million) 197,6 200,0
Diluted earnings per share (cents) 1 568 1 666
Continuing operations 1 406 1 542Discontinued operations 162 124

66 IMPERIAL HOLDINGS LIMITED Audited Annual Financial Statements for the year ended 30 June 2015
Headline earnings and diluted headline earnings per share is calculated as follows:
Gross amount
Rm
Income taxRm
Non-controlling
interestRm
2015Rm
2014Rm
Earnings – diluted 3 098 3 332Impairment of property, plant and equipment and transport fleet (IAS 36) 28 (6) (1) 21 38Impairment of intangible assets (IAS 36) 5Profit from disposal of property, plant and equipment, transport fleet and vehicles for hire (IAS 16) (85) 19 3 (63) (152)Profit from disposal of intangible assets (IAS 38) 1Impairment of goodwill (IAS 36) 67 (11) 56 38(Profit) loss on disposal of investment in associates and joint ventures (IAS 28) (2) (2) 7Profit on disposal of subsidiaries and businesses (IFRS 10) (15) (15) (75)Reclassification of loss (gain) on disposal of available-for-sale investments (IAS 39) 43 43 (1)Adjustments included in result of associates and joint ventures 41 41 18
Headline earnings – diluted 3 179 3 211Saving of finance cost by associate on potential sale of Imperial shares (44) (60)
Headline earning – basic 3 135 3 151
Weighted average number of ordinary shares in issue (million) 193,1 193,9 Basic headline earnings per share (cents) 1 624 1 625
Continuing operations 1 458 1 498Discontinued operation 166 127
Weighted average number of ordinary shares for diluted earnings (million) 197,6 200,0 Diluted headline earnings per share (cents) 1 609 1 606
Continuing operations 1 446 1 482Discontinued operation 163 124
> NOTES TO THE CONSOLIDATED ANNUAL FINANCIAL STATEMENTS FOR THE YEAR ENDED 30 JUNE 2015 – CONTINUED

67
32. EARNINGS PER SHARE CONTINUED
Core earnings and diluted core earnings per share is calculated as follows:
Gross amount
Rm
Income taxRm
Non-controlling
interestRm
2015Rm
2014Rm
Headline earnings – diluted 3 179 3 211Amortisation of intangible assets arising on business combinations 415 (112) (43) 260 229Net cost of meeting obligations under onerous contract 44Change in economic assumptions on insurance funds 6 (2) 4 5Charge for amending the conversion profile of deferred shares 70Remeasurement of contingent consideration and put option liabilities 47 47 (2)Non-recurring foreign exchange gain on inter-group monetary item (104) 29 (75)Business acquisition costs 16 16 22
Core earnings – diluted 3 431 3 579Saving of finance cost by associate on potential sale of Imperial shares (44) (60)
Core earnings – basic 3 387 3 519
Weighted average number of ordinary shares in issue (million) 193,1 193,9
Basic core earnings per share (cents) 1 754 1 815
Continuing operations 1 586 1 685Discontinued operations 168 130
Weighted average number of ordinary shares for diluted earnings (million) 197,6 200,0 Diluted core earnings per share (cents) 1 736 1 790
Continuing operations 1 571 1 664Discontinued operations 165 126

68 IMPERIAL HOLDINGS LIMITED Audited Annual Financial Statements for the year ended 30 June 2015
2015Rm
2014*Rm
33. NOTES TO THE CONSOLIDATED STATEMENT OF CASH FLOWS
33.1 CASH GENERATED BY OPERATIONS BEFORE CAPITAL EXPENDITURE ON RENTAL ASSETS
Profit before net financing costs 5 761 5 807
Continuing operations 5 205 5 356Discontinued operations 556 451
Adjusted for:˜ Amortisation of intangible assets, net of recoupments 95 77 Amortisation of intangible assets arising on business combinations 415 336 Depreciation of property, plant and equipment 762 691 Depreciation of transport fleet, net of recoupments 731 757 Depreciation of vehicles for hire, net of recoupments 916 758 Profit from disposal of property, plant and equipment (41) (151) Impairment of assets 28 46 Impairment of goodwill 67 38 (Profit) loss from disposal of investments in associates and joint ventures (2) 7 Profit on disposal of subsidiaries and businesses (15) (81) Fair value gains on investments (82) (188) Foreign exchange gains (170) (15) Fair value gains 97 28 Reclassification of loss (gain) on disposal of available-for-sale financial asset 43 (1) Recognition of share-based costs 130 104 Charge for amending the conversion profile of deferred ordinary shares 70 Net movement in insurance, investments, maintenance and warranty contracts 237 352 Remeasurement of contingent consideration liabilities (2) (18) Remeasurement of put option liabilities 49 16 Business acquisition costs 16 22 Increase in retirement benefit obligations 14 19
Cash generated by operations before changes in working capital 9 049 8 674Working capital movements Increase in inventories (1 566) (1 008) Increase in trade and other receivables (715) (925) Increase (decrease) in trade and other payables and provisions 2 231 (768)
8 999 5 973
* Restated for change in accounting policy as described in note 2.2.~ The adjustments above include movements from discontinued operations.
> NOTES TO THE CONSOLIDATED ANNUAL FINANCIAL STATEMENTS FOR THE YEAR ENDED 30 JUNE 2015 – CONTINUED

69
2015Rm
2014Rm
33.2 ACQUISITION OF SUBSIDIARIES AND BUSINESSESGoodwill 513 579Intangible assets 355 949Investments and loans 2Property, plant and equipment 126 62Transport fleet 19Inventories 761 957Trade and other receivables 679 431Cash resources 84 358Net deferred tax (liabilities) asset (63) 4Non-controlling interests (199) (279)Retirement benefit obligations (1)Interest-bearing borrowings (432) (580)Other financial liabilities (69)Provisions for liabilities and other charges (16) (58)Trade and other payables (732) (1 428)Net current tax liabilities (20) (15)
Purchase consideration transferred 1 076 911 Contingent consideration (17) Deferred liability (299) Business acquisition costs 16 22 Cash resources acquired (84) (358)
Cash flow on acquisition 991 276
33.3 DISPOSAL OF SUBSIDIARIES AND BUSINESSESGoodwill 50Intangible assets 2Property, plant and equipment 19 3Transport fleet 11Net deferred tax (liabilities) assets (2) 1Other financial assets 1Vehicles for hire 54Inventories 1Trade and other receivables 83 61Cash resources 7 29Non-controlling interests 8 (2)Other financial liabilities (20)Interest-bearing borrowings (27) 4Provisions for liabilities and other charges (4)Trade and other payables (67) (84)
Net assets disposed 63 65Cash resources disposed (7) (29)Goodwill reserve realised 12Fair value of listed shares received (level 1 in the fair value hierarchy) (168)Liability incurred 30(Loss) profit on disposal of subsidiaries and businesses (15) 81
Cash flow on disposal 53 (21)

70 IMPERIAL HOLDINGS LIMITED Audited Annual Financial Statements for the year ended 30 June 2015
2015Rm
2014Rm
33. NOTES TO THE CONSOLIDATED STATEMENT OF CASH FLOWS CONTINUED
33.4 NET REPLACEMENT CAPITAL EXPENDITURE – EXCLUDING RENTAL ASSETSExpenditure– Intangible assets (371) (145)– Plant and equipment (876) (820)– Transport fleet (520) (714)
(1 767) (1 679)
Proceeds from disposals– Intangible assets 10 3– Plant and equipment 173 223– Transport fleet 339 291
522 517
Net expenditure– Intangible assets (361) (142)– Plant and equipment (703) (597)– Transport fleet (181) (423)
(1 245) (1 162)
33.5 CASH AND CASH EQUIVALENTSCash resources 2 271 3 103Cash resources included in 'Assets classified as held for sale' 845Short-term loans and overdrafts (3 685) (2 205)
(569) 898
34. ORDINARY DIVIDENDSInterim– In the current year a dividend of 350 cents per share was paid on 30 March 2015– In the prior year a dividend of 400 cents per share was paid on 31 March 2014
Final– A dividend of 445 cents per share is payable on 28 September 2015– In the prior year a dividend of 420 cents per share was paid on 29 September 2014
Dividends are reflected gross of tax.
> NOTES TO THE CONSOLIDATED ANNUAL FINANCIAL STATEMENTS FOR THE YEAR ENDED 30 JUNE 2015 – CONTINUED

71
2015Rm
2014Rm
35. COMMITMENTSCapital expenditure commitments to be incurredContracted 1 342 1 605Authorised by directors but not contracted 947 680
2 289 2 285
The commitments are substantially for the replacement of transport fleet and the construction of buildings to be used by the group, which will be financed from proceeds from disposals and existing facilities.
More than five years
Rm
One to five years
Rm
Less than one year
Rm2015
Rm2014
Rm
Operating lease payablesProperty 883 1682 751 3 316 3 061Vehicles 12Plant and equipment 1 75 77 153 64Transport fleet 90 534 344 968 1 089
974 2 291 1 172 4 437 4 226
Operating lease receivablesProperty 4 39 37 80 60Vehicles 3 387 218 608 561Plant and equipment 4
7 426 255 688 625
36. CONTINGENT LIABILITIESSubsidiary companies have received summons for claims amounting to R17 million. The group and its legal advisors believe that these claims are unlikely to succeed. 17 16
The Group has contingent liabilities in respect of guarantees issued to bankers and others, on behalf of associates, for facilities in the normal course of business to the extent that they are used. The utilisation of facilities was: 73 84
Guarantees issued by Imperial Logistics International GmbH 235 137
As part of the NAC sale in 2013 Imperial Holdings have issued a guarantee to secure vendor funding for five years for R80 million. 80 80
Except for the above claims, there is no current or pending litigation that is considered likely to have a material adverse effect on the Group.
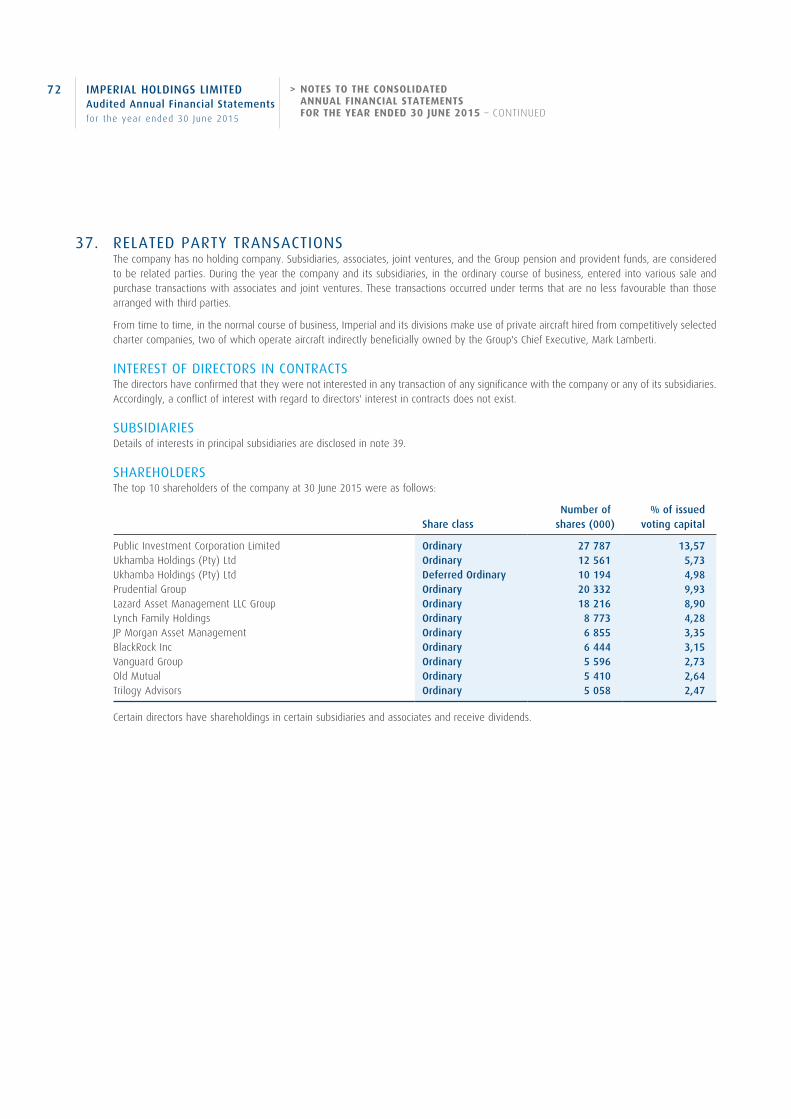
72 IMPERIAL HOLDINGS LIMITED Audited Annual Financial Statements for the year ended 30 June 2015
37. RELATED PARTY TRANSACTIONSThe company has no holding company. Subsidiaries, associates, joint ventures, and the Group pension and provident funds, are considered to be related parties. During the year the company and its subsidiaries, in the ordinary course of business, entered into various sale and purchase transactions with associates and joint ventures. These transactions occurred under terms that are no less favourable than those arranged with third parties.
From time to time, in the normal course of business, Imperial and its divisions make use of private aircraft hired from competitively selected charter companies, two of which operate aircraft indirectly beneficially owned by the Group's Chief Executive, Mark Lamberti.
INTEREST OF DIRECTORS IN CONTRACTSThe directors have confirmed that they were not interested in any transaction of any significance with the company or any of its subsidiaries. Accordingly, a conflict of interest with regard to directors' interest in contracts does not exist.
SUBSIDIARIESDetails of interests in principal subsidiaries are disclosed in note 39.
SHAREHOLDERSThe top 10 shareholders of the company at 30 June 2015 were as follows:
Share classNumber of
shares (000)% of issued
voting capital
Public Investment Corporation Limited Ordinary 27 787 13,57Ukhamba Holdings (Pty) Ltd Ordinary 12 561 5,73Ukhamba Holdings (Pty) Ltd Deferred Ordinary 10 194 4,98Prudential Group Ordinary 20 332 9,93Lazard Asset Management LLC Group Ordinary 18 216 8,90Lynch Family Holdings Ordinary 8 773 4,28JP Morgan Asset Management Ordinary 6 855 3,35BlackRock Inc Ordinary 6 444 3,15Vanguard Group Ordinary 5 596 2,73Old Mutual Ordinary 5 410 2,64Trilogy Advisors Ordinary 5 058 2,47
Certain directors have shareholdings in certain subsidiaries and associates and receive dividends.
> NOTES TO THE CONSOLIDATED ANNUAL FINANCIAL STATEMENTS FOR THE YEAR ENDED 30 JUNE 2015 – CONTINUED

73
ASSOCIATES AND JOINT VENTURESDetails of investments in associates and joint ventures that are material to the Group are disclosed in note 39.
Details of revenue derived from associates and joint ventures are outlined in note 26.2.
2015Rm
2014Rm
Key management personnelKey management personnel are directors and those executives having authority and responsibility for planning, directing and controlling the activities of the group.
Key management personnel remuneration comprises:Non-executive directors' fees 7 22Short-term employee benefits 233 214Long-term employee benefits 14 13
254 249
Number of key management personnel 53 54
Net gains on share options and cash retention plan bonus 47 103
The Group has many different operations, retail outlets and service centres where the group staff may be transacting.
Key management are required to report any transactions with the group in excess of R100 000. The total value of the goods and services supplied to or from key management on an arm's length basis amounted to: 16 32
The Group received insurance premiums on an arm's length basis from the group pension and provident funds to the amount of: 9 10
The Group pays for legal services on an arm's length basis from a firm of attorneys in which a director of the company has an interest, amounting to: 8 14
38. FINANCIAL INSTRUMENTS38.1 FINANCIAL RISK FACTORS
The Group's treasury activities are aligned to the company's decentralised business model and the asset and liability committee's (Alco) strategies. The Alco is a board sub-committee responsible for implementing best practice asset and liability risk management with its main objectives being the management of liquidity, interest rate, price and foreign exchange risk. The Alco meets every quarter and follows a comprehensive risk management process. The treasury implements the Alco risk management policies and directives and provides financial risk management services to the various divisional businesses, coordinates access to domestic and international financial markets for bank as well as debt capital markets funding. The treasury monitors and manages the financial risks relating to the operations of the Group through internal risk reports which analyse exposures by degree and magnitude of risks. These risks include market risk (including foreign exchange risk, interest rate risk, and price risk), credit risk and liquidity risk.
The day-to-day management of foreign exchange risk and credit risk is performed on a decentralised basis by the various business units within the Group's hedging policies and guidelines.
The Group's objectives, policies and processes for measuring and managing these risks are detailed below.
The Group seeks to minimise the effects of these risks by matching assets and liabilities as far as possible or by using derivative financial instruments to hedge these risk exposures.
The Group does not enter into or trade in financial instruments, including derivative financial instruments, for speculative purposes. The Group enters into financial instruments to manage and reduce the possible adverse impact on earnings from changes in interest rates and foreign exchange rates.

74 IMPERIAL HOLDINGS LIMITED Audited Annual Financial Statements for the year ended 30 June 2015
38. FINANCIAL INSTRUMENTS CONTINUED
38.1.1 Market riskThis is the risk that changes in response to the general market conditions, such as foreign exchange rates, interest rates, commodity prices and equity prices, which may adversely impact on the Group's earnings, assets, liabilities and equity.
The objective of market risk management is to manage and control market risk exposures within acceptable parameters, whilst optimising the return on risk.
The Group's activities expose it primarily to the financial risks of changes in foreign currency exchange rates, interest rates and equity prices.
38.1.2 Currency riskThis is the risk of losses arising from the effects of adverse movements in exchange rates on net foreign currency asset or liability positions.
The Group undertakes certain transactions denominated in foreign currencies, hence exposures to exchange rate fluctuations arise. In order to manage these risks, the Group may enter into hedging transactions, which make use of derivatives. Derivative instruments are used by the Group for hedging purposes. Such instruments include forward exchange contracts, futures and certain currency options authorised by Alco.
The policy of the Group is to maintain a fully covered foreign exchange risk position in respect of foreign currency commitments with a few exceptions authorised by the Alco. Automotive spare parts may be settled in the spot markets and where specific South African Exchange Control authorisation has been obtained from authorised dealers in foreign exchange, up to 75% of forecast annual sales can be covered. The day-to-day management of foreign exchange risk is performed on a decentralised basis by the various business units within the Group's hedging policies and guidelines. Trade-related import exposures are managed through the use of natural hedges arising from foreign assets as well as forward exchange contracts and the option structures authorised by Alco.
The average exchange rates shown include the cost of forward cover. The amounts represent the net Rand equivalent of commitments to purchase and sell foreign currencies, and have all been recorded at fair value.
The Group has entered into certain forward exchange contracts and option structures authorised by Alco that relate to importation of inventories and interest-bearing borrowings at 30 June and specific foreign commitments not yet due. The details of these contracts are as follows:
Foreign currency – 2015
Foreign amount(million)
Average exchange
rate
Contract value
Rm
Marked to market
Rm
ImportsUS dollar 276 12,16 3 358 3 370 Euro 172 13,71 2 355 2 363 Pound sterling (9) 17,75 (167) (181)
5 546 5 552 Interest-bearing borrowingsJapanese yen 3 757 0,10 379 379
5 925 5 931
> NOTES TO THE CONSOLIDATED ANNUAL FINANCIAL STATEMENTS FOR THE YEAR ENDED 30 JUNE 2015 – CONTINUED

75
Foreign currency – 2014
Foreign amount(million)
Average exchange
rate
Contract value
Rm
Marked to market
Rm
ImportsUS dollar 258 10,77 2 779 2 761 Euro 136 14,38 1 956 1 899 Pound sterling 12 17,63 204 200 Japanese yen 163 0,11 17 17 Other 1 6 6
4 962 4 883 Interest-bearing borrowingsJapanese yen 3 114 0,14 450 326
5 412 5 209
Fair value is calculated as the difference between the contracted value and the value to maturity. The fair value adjustments are included in trade and other receivables and trade and other payables.
The impact from a 10% movement in the valuation of the Rand would approximately have a R593 million impact on Group's equity. The 10% sensitivity rate is based on management's assessment of a reasonable possible change in foreign exchange rates over the foreseeable future, with regards to the market value.
The sensitivity of profits to changes in exchange rates as a result of foreign exchange gains or losses on remeasurement of foreign denominated financial assets and liabilities translated at spot rates are offset by equivalent gains or losses in currency derivatives.
Divisional currency riskLogistics AfricaThe risk in this division relates to certain transactions in foreign currencies, which result in foreign currency denominated debtors and creditors. In order to mitigate the risks which arise from this exposure, these items are settled immediately or where foreign exchange contracts are available the risk is hedged within a 50% minimum Group risk policy for African businesses. Inter company loans in different currencies can cause translation gains and losses through the statement of profit or loss.
Logistics InternationalCurrency risk exposure arises from the conclusion of transactions in currencies other than the functional currencies of operations in the Netherlands, Belgium, France, Germany, Poland and Sweden. All material exposures arising from transactions external to the Group are covered by forward exchange contracts. Translation risk arises from the net investment in overseas businesses in the United Kingdom, Australia, United States of America, South America, Poland and Sweden. These translation exposures are recognised directly in equity through the translation reserve and only charged to profit or loss when the subsidiary is sold. No net investment hedges are in place.
Vehicle Import, Distribution and DealershipsThe Group's major currency exposure exists in this division. Risk exposures result from vehicles, spare parts and equipment being imported and invoiced in foreign currency. Forward exchange contracts, futures and certain currency options are used to hedge this exposure. Up to 75% of forecast annual sales can be covered should it be deemed necessary. In addition, investments in overseas businesses result in translation risk, which is recognised directly in equity through the translation reserve and only charged to profit or loss should the investment be sold. No net investment hedges are in place.
Vehicle Retail, Rental and Aftermarket PartsRisk exposure is limited to translation risk for investments in dealerships in the United Kingdom, operational cash flows in these dealerships are in the functional currencies of those countries, and exposure to currency risk results from translation into our presentation currency (ZAR). This division is also exposed to certain small transactions in foreign currencies, which result in foreign currency denominated creditors. In order to mitigate the risks which arise from this exposure, forward exchange contracts are taken to hedge this exposure.
Insurance (Classified as Held for sale)Risk exposures result from foreign operations as well as the division holding investments in foreign equities, which are administered by portfolio managers and monitored by an investment committee.

76 IMPERIAL HOLDINGS LIMITED Audited Annual Financial Statements for the year ended 30 June 2015
38. FINANCIAL INSTRUMENTS CONTINUED
38.1.3 Interest rate riskThis is the risk that fluctuations in interest rates may adversely impact on the Group's earnings, assets, liabilities and equity.
The Group is exposed to interest rate risk as it borrows and places funds at both fixed and floating rates. The risk is managed by matching fixed and floating rate assets and liabilities wherever possible and to achieve a repricing profile in line with Alco directives. Use is made of interest rate derivatives. The Group analyses the impact on profit or loss of defined interest rate shifts – taking into consideration refinancing, renewal of existing positions, alternative financing and hedging.
The Group's treasury follows a centralised cash management process including cash management systems across bank accounts in South Africa to minimise risk and interest costs. The Group's offshore cash management is managed by the treasuries in Germany, the United Kingdom and the Netherlands. The rest of Africa cash management requirements is managed through a treasury management committee set up to focus on this area.
The interest rate profile of total borrowings is reflected in note 21.
The Group has entered into interest rate derivative contracts that entitle it to either receive or pay interest at floating rates on notional principal amounts and oblige it to pay or receive interest at fixed rates on the same amounts.
Details of the interest rate derivative instruments at 30 June 2015 were as follows:
Notional amount
Rm
Current year effective rate
(variable) %
Derivative contract rate
(fixed)%
Corporate bonds – IPL7 (swap from variable to fixed) 500 7,3 – 7,7 8,7Revolving credit facility term loan (swap from variable to fixed) 1 500 7,4 – 7,7 8,8Syndicated bank term loans (swap from variable to fixed) 1 694 1,2 – 1,7 1,6
The insurance division in addition to its short-term deposits, has fixed rate investments, such as negotiable certificate of deposits (NCDs), gilts and bonds. The risk is mitigated by the use of fund managers under the guidance of the investment committee, which has ultimate responsibility for the investment portfolio's risk profile and related decisions.
A 50 basis points increase or decrease in interest rates represents management's assessment of the reasonably possible changes in interest risk. The impact of a 50 basis points increase in interest rates will have an annualised R26 million (2014: R20 million) effect on the Group’s after tax profit and equity.
38.1.4 Equity price riskThe Group through its insurance business is exposed to equity price risk as it holds equity securities, which are designated as fair value through profit or loss.
The sensitivity analysis has been determined based on the exposure to equity price risk at 30 June. The impact of a 10% change in the equity index will have a R37 million (2014: R33 million) effect on the Group’s after tax profit and a R37 million (2014: R36 million) impact on equity. The sensitivity is based on management's assessment of a reasonable move in equity prices over the foreseeable future.
Divisional equity price riskInsuranceThe insurance division has limited its exposure to equities to minimise the volatility that the equity price risk brings to the Group's statement of profit or loss. The equity portfolio consists of high-quality securities. The risk is monitored by the investment committee reviewing performance of the portfolio taking into cognisance of the Group's risk appetite and cash requirements. The investment portfolios are well diversified and hedges are implemented when approved by the investment committee.
> NOTES TO THE CONSOLIDATED ANNUAL FINANCIAL STATEMENTS FOR THE YEAR ENDED 30 JUNE 2015 – CONTINUED

77
38.1.5 Credit risk Credit risk, or the risk of counterparties defaulting, is controlled by the application of credit approvals, limits and monitoring procedures. Where needed, the Group obtains appropriate collateral to mitigate risk. Counterparty credit limits are in place and are reviewed and approved by the respective subsidiary boards.
The carrying amount of financial assets represents the maximum credit exposure on 30 June 2015. None of the financial assets below were given as collateral for any security provided.
The Group only enters into long-term financial deposits with authorised financial institutions of high credit ratings assigned by international or recognised credit-rating agencies.
Cash resourcesIt is Group policy to deposit short-term cash with reputable financial institutions with investment grade credit ratings assigned by international or recognised credit-rating agencies or counterparties authorised by the investment committee.
Trade accounts receivableTrade accounts receivable consist of a large, widespread customer base. Group companies monitor the financial position of their customers on an ongoing basis. Creditworthiness of trade receivables is assessed when credit is first extended and is reviewed regularly thereafter. The granting of credit is controlled by the application of account limits. Where considered appropriate, use is made of credit guarantee insurance.
2015Rm
2014Rm
Trade and other receivables that are neither past due nor impaired 8 680 8 571Past due trade receivables 2 851 2 117
Less than 1 month 1 859 1 440Between 1 – 3 months 533 391More than 3 months 242 189Past due more than 1 year 217 97
Total trade receivables 11 531 10 688
Based on past experience, the Group believes that no impairment is necessary in respect of trade receivables not past due as the amount relates to customers that have a good track record with the Group, and there has been no objective evidence to the contrary.
Included in trade receivables are receivables which are past the original expected collection date (past due) at the reporting date. There has not, however, been a significant change in credit quality and the amounts are still considered recoverable. Those which are not considered to be recoverable have been included in the provision for doubtful debts below. A summarised age analysis of past due trade receivables is set out above.
The overdue trade receivables ageing profile above is considered typical of the various industries in which certain of our businesses operate. Given this, existing insurance cover, and the nature of the related counterparties these amounts are considered recoverable.

78 IMPERIAL HOLDINGS LIMITED Audited Annual Financial Statements for the year ended 30 June 2015
38. FINANCIAL INSTRUMENTS CONTINUED
38.1 FINANCIAL RISK FACTORS CONTINUED
38.1.5 Credit risk continued
Provision for doubtful debts for trade receivablesBefore these financial instruments can be impaired, they are evaluated for the possibility of any recovery, which includes an examination of the length of time they have been outstanding. Provision is made for bad debts on trade accounts receivable. Management does not consider that there is any material credit risk exposure not already covered by a doubtful debt provision.
There is no significant concentration of risk in respect of any particular customer or industry segment. There is no single customer whose revenue streams exceed 10% of the Group’s revenue.
Provision for doubtful debts for trade receivables2015
Rm2014
Rm
Set out below is a summary of the movement in the provision for doubtful debts for the year:Carrying value at the beginning of the year 429 337Net acquisition of subsidiaries and businesses 51 66Amounts reversed to profit or loss (5) (3)Charged to profit or loss 135 65Amounts utilised during the year (18) (45)Currency adjustments 1 9Reclassifications to assets classified as held for sale (82)
Carrying value at the end of the year 511 429
Divisional credit riskLogisticsRisk exposures arise from the granting of credit to customers. The risk is managed by strict monitoring of credit terms. The risk is mitigated by stringent background checks on all new customers, as well as taking legal action against defaulting customers.
Vehicle Import, Distribution and DealershipsRisk exposures arise from the supply of vehicles and equipment to external dealerships and customers. Where vehicles are supplied to external dealerships these are generally covered by a dealer floorplan with a bank, and will usually settle within credit terms, and exposure to credit risk is therefore minimised. When dealing with external customers, the vehicle is required to be fully financed before delivery, thereby mitigating credit risk to the division.
Vehicle Retail, Rental and Aftermarket PartsRisk exposures arise from the granting of credit to customers for parts, spares and vehicle rental. The risk is managed by monthly review of trade receivables ageing. The risk is mitigated by stringent background checks and credit limits being imposed on all new customers, continuous review of credit limits, as well as taking legal action against defaulting customers. Where our dealerships are transacting with external customers, the vehicles are required to be fully financed before delivery, thereby mitigating credit risk to the division.
InsuranceRisk exposures arise from commission being paid to brokers in advance. The risk arises as the client may lapse a policy at any point during the period. The risk is monitored by the credit committee and is mitigated by vetting all brokers, as well as retaining a percentage of the commission.
GuaranteesGuarantees issued to bankers and others, on behalf of subsidiaries, for facilities, as well as guarantees to investors in commercial paper and corporate bonds issued, are disclosed in note 15 to the company annual financial statements.
There were no guarantees provided by banks to secure financing during 2015 and 2014.
> NOTES TO THE CONSOLIDATED ANNUAL FINANCIAL STATEMENTS FOR THE YEAR ENDED 30 JUNE 2015 – CONTINUED

79
38.1.6 Liquidity risk Liquidity risk is the risk that the Group will not be able to meet its financial obligations as they fall due. The Group's approach to managing liquidity is to ensure that it will always have sufficient liquidity to meet its liabilities when due, under normal and stressed conditions, without incurring unacceptable losses or risking damage to the Group's reputation.
The responsibility for liquidity risk management rests with the Alco, which has developed an appropriate liquidity risk management framework for the management of the Group's short, medium and long-term funding requirements. The Group accesses the corporate bond market to ensure that there is sufficient long term funding within the funding mix together with long-term bank facilities.
The Group manages liquidity risk by monitoring forecast cash flows in compliance with loan covenants and ensuring that adequate unutilised committed borrowing facilities are maintained. Unutilised borrowing facilities are reflected in note 21.
To avoid incurring interest on late payments, financial risk management policies and procedures are entrenched to ensure the timeous matching of orders placed with goods received notes or services acceptances and invoices.
Contractual maturities (which includes interest) of financial liabilities are as follows:
Maturity profile of financial liabilities
Carrying amount
Rm
Contractual cash flows
Rm
Less than one year
Rm
One to five years
Rm
More than five years
Rm
Interest-bearing borrowings* 16 764 19 728 5 151 9 709 4 868Other financial liabilities 2 019 2 065 87 1 200 778Trade payables and accruals 17 683 17 683 17 683Current derivative financial liabilities 70 70 70
2015 36 536 36 546 22 991 10 909 5 646
2014 32 171 35 742 19 064 10 729 5 949
* Excludes R441 million non-redeemable, non-participating preference shares (refer to note 19).

80 IMPERIAL HOLDINGS LIMITED Audited Annual Financial Statements for the year ended 30 June 2015
38. FINANCIAL INSTRUMENTS CONTINUED
38.2 FAIR VALUE MEASUREMENT38.2.1 Fair value hierarchy
The Group's financial instruments carried at fair value are classified into three categories defined as follows:
Level 1 financial instruments are those that are valued using unadjusted quoted prices in active markets for identical financial instruments. These instruments consist of listed equity securities (see note 15).
Level 2 financial instruments are those valued using techniques based primarily on observable market data. Instruments in this category are valued using quoted prices for similar instruments or identical instruments in markets which are not considered to be active; or valuation techniques where all the inputs that have a significant effect on the valuation are directly or indirectly based on observable market data. Financial instruments classified as level 2 are mainly comprised of over the counter (OTC) derivatives instruments.
Level 3 financial instruments are those valued using techniques that incorporate information other than observable market data. Instruments in this category have been valued using a valuation technique where at least one input, which could have a significant effect on the instrument’s valuation, is not based on observable market data.
The following table shows which financial instruments on the statement of financial position are carried at amortised cost and which are carried at fair value. Financial instruments carried at fair value are further categorised into the appropriate fair value hierarchy.
Financial instrument
Carrying value
Rm
At fair value At amortised
costRm
Level 2Rm
Level 3Rm
Financial assetsLoans 357 357Non-current financial asset 36 36Trade and other receivables 12 849 85 12 764
Trade receivables and prepayments 12 764 12 764Derivative instruments 85 85
Cash resources 2 271 2 271
15 513 121 15 392
Financial liabilitiesNon-redeemable, non-participating preference shares 441 441Interest-bearing borrowings 16 764 16 764Other financial liabilities 2 019 233 1 671 115
Cross currency and interest-rate swap liabilities 233 233Contingent consideration liabilities 31 31Loans payable 115 115Put option liability 1 640 1 640
Trade and other payables 17 753 70 17 683
Trade payables and accruals 17 683 17 683Derivative instruments 70 70
36 977 303 1 671 35 003
> NOTES TO THE CONSOLIDATED ANNUAL FINANCIAL STATEMENTS FOR THE YEAR ENDED 30 JUNE 2015 – CONTINUED

81
38. FINANCIAL INSTRUMENTS CONTINUED
38.2 FAIR VALUE MEASUREMENT38.2.2 Level 3 sensitivity information
The fair values of the level 3 financial liabilities of R1 671 million were estimated by applying an income approach valuation method including a present value discount technique. The fair value measurement is based on significant inputs that are not observable in the market. Key assumptions used in the valuations includes the assumed probability of achieving profits targets and the discount rates applied. The assumed profitabilities were based on historical performances but adjusted for expected growth.
The following table shows how the fair value of the level 3 financial liabilities as at 30 June 2015 would change if the significant assumptions were to be replaced by a reasonable possible alternative.
Financial instruments Valuation technique Main assumption
Carrying value
Rm
Increase in liabilities
Rm
Decrease in liabilities
Rm
Put option liabilities Income approach Earnings growth 1 640 21 (114)Contingent consideration liabilities Income approach Assumed profits 31 (2)
Movements in level 3 financial instruments carried at fair valueThe following tables shows the movements during the year of level 3 financial instruments carried at fair value:
Financial liabilities
Put option liabilities
Rm
Contingentconsideration
liabilitiesRm
2015Rm
2014Rm
Carrying value at beginning of year 990 82 1 072 214Initial recognition in equity for new acquisitions 473 473 1 289Reversed in equity on buy-out of non-controlling interest (289)Arising on acquisition of businesses 17 17Fair valued through profit or loss 49 (2) 47 (2)Settlements (64) (64) (39)Currency adjustments 128 (2) 126 (13)Transfers to level 2 (88)
Carrying value at the end of the year 1 640 31 1 671 1 072
Transfers between hierarchy levelsThere were no transfers between the fair value hierarchy levels during the year.
38.2.3 Fair value of financial instruments carried at amortised costThe following table sets out instances where the carrying amount of financial liabilities, as recognised on the statement of financial position at 30 June 2015, differs from their fair values. In all other instances the carrying amounts of the Group's financial assets and liabilities approximate their fair values, due to the nature of the financial instruments.
Carrying value
Rm
Fair value*
Rm
Listed corporate bonds (included in interest-bearing borrowings) 5 841 5 808Listed non-redeemable, non-participating preference shares 441 345
* The fair values were determined with reference to unadjusted observable market data (level 1 in the fair value hierarchy).

82 IMPERIAL HOLDINGS LIMITED Audited Annual Financial Statements for the year ended 30 June 2015
38. FINANCIAL INSTRUMENTS CONTINUED
38.3 CAPITAL MANAGEMENTThe Group’s objectives when managing capital are to safeguard its ability to continue as a going concern in order to provide returns and growth for shareholders and benefits for other stakeholders. The Group maintains an appropriate mix of equity and debt in order to optimise the weighted average cost of capital (WACC) within an appropriate risk profile. Capital allocation is evaluated against the expected and forecast return on invested capital against the appropriate WACC for that division or business.
The Group has externally imposed capital requirements in terms of debt covenants on bank facilities. The covenant requires the Group to maintain a net debt to earnings before interest, tax, depreciation and amortisation (EBITDA) of below 3.5:1. The ratio at 30 June 2015 is 1.81:1 (2014: 1.55:1). Our insurance businesses have externally imposed regulatory capital requirements.
Consistent with others in the industry, the Group monitors capital on the basis of its gearing ratio. This ratio is calculated as net debt divided by total equity. Net debt is calculated as total interest-bearing borrowings less cash resources.
2015Rm
2014Rm
Interest-bearing borrowings* 17 205 14 985Less: Cash resources 2 271 3 103
Net debt 14 934 11 882
Total equity 19 233 18 109
Gearing ratio 77,6% 65,6%
* Includes R441 million non-redeemable, non-participating preference shares.
There were no defaults or breaches in terms of interest-bearing borrowings during either reporting periods.
There were no reclassifications of financial assets or financial liabilities that occurred during the year. There were no financial assets or liabilities settled or extinguished which did not meet the derecognition requirements.
39. INTEREST IN OTHER ENTITIES39.1 COMPOSITION OF THE GROUP
Imperial is a diversified, international group of companies involved in mobility. The consolidated financial statements include the accounts of Imperial Holdings Limited (the Company) and all of its subsidiaries at 30 June 2015.
The group holds a majority voting rights in all of its subsidiaries. Non-controlling shareholders have significant interests in three of the Group's subsidiaries. Material associates to the Group are MDS Logistics, MiX Telematics and Ukhamba Holdings. Details are provided below.
39.1.1 The principal operating subsidiaries of the Company and their activities are:
SubsidiaryPlace of incorporation
Ownership Interest (%) Nature of business
Associated Motor Holdings (Pty) Limited*
South Africa 90 Associated Motor Holdings (Pty) Limited imports and distributes passenger and light and heavy commercial vehicles, automotive products, motorcycles and industrial equipment in Southern Africa. It also sells maintenance and warranty products. Further details on the composition of the Associated Motor Holdings (Pty) Limited Group is provided in note 39.1.2.
Boundlesstrade 154 (Pty) Limited
South Africa 90 E-Z-GO, a distributor of golf carts is housed within Boundlesstrade. Its market includes golf courses and estates as well as healthcare and hospitality industries. This subsidiary also houses associates and joint ventures which distribute Chery and Foton motor vehicles.
> NOTES TO THE CONSOLIDATED ANNUAL FINANCIAL STATEMENTS FOR THE YEAR ENDED 30 JUNE 2015 – CONTINUED

83
SubsidiaryPlace of incorporation
Ownership Interest (%) Nature of business
CIC Holdings Limited Namibia 100 CIC operates within the Fast Moving Consumer Goods Industry through agency agreements with blue chip manufacturers. Its service offering includes selling, merchandising, warehousing, distribution, debtors’ administration, and staffing and security solutions. The group has facilities in all the main centres throughout Namibia, Botswana, Swaziland, Mozambique and South Africa.
Imperial Holdings International Cooperation U.A.
Netherlands 100 Business conducted by Imperial Holdings International Cooperation U.A and its subsidiaries comprises integrated logistics solutions and vehicle sales. Further details on the composition of Imperial Holdings International Cooperation U.A. is provided in note 39.1.3.
Imperial Group Limited~ South Africa 100 Business conducted by Imperial Group Limited comprises, vehicle rental, motor trading, automotive parts, property investments, transportation, logistics, sale of motor components, panel beating and group services. Details on the businesses included are provided in note 39.1.4.
Jurgens Ci (Pty) Limited South Africa 100 Jurgens Ci is Southern Africa’s largest manufacturer of caravans, motor homes and specialised conversions. Their network of dealers is throughout South Africa and Namibia, and it exports to Australia.
Midas (Pty) Limited* South Africa 75 The Midas group markets and distributes quality automotive parts and accessories, D.I.Y and leisure products through selected channels. The group consists of Parts Incorporated Africa, the national hub and spoke distribution business, NAPA, the marketing co-operative to the members of the leading local brands, and the franchises Midas, Motolek, ADCO, CBS and Auto Care & Diagnostics. The Group increased its interest in Midas to 89% after the reporting period.
Regent Insurance Company Limited~ (Held for sale)
South Africa 100 Regent Insurance is a registered short term insurer of motor related value added insurance products, including extended warranties, credit insurance, paint protection, commercial vehicles, goods in transit cover and comprehensive passenger car cover. Regent Insurance operates in South Africa, Botswana and Lesotho.
Regent Life Assurance Company Limited~ (Held for sale)
South Africa 100 Regent Life is a registered life assurer. Its products include credit life, funeral cover, underwritten risk cover and savings products sold primarily through dealers, financial institutions, brokers and affinity schemes. Regent Life operates in South Africa, Botswana and Lesotho.
Imperial Capital Limited South Africa 100 Imperial Capital is a registered Domestic Treasury Management Company (DTMC) entity. It holds the 68% interest in Eco Health Limited. Eco Health is a leading distributor of pharmaceutical products in Nigeria. Based in Lagos, Nigeria, the company also has operations in Ghana and Dubai. Further details are provided for the non-controlling interest, refer to note 39.4.
Pharmed Pharmaceutical (Pty) Limited
South Africa 62,5 Pharmed specialises in the wholesale supply and distribution of healthcare related products – including ethical, generic, patent and homeopathic medicines; surgical, dental and veterinary products; and medical equipment.
* Further details are provided on non-controlling interest, refer to note 39.4.~ Certain restrictions apply to this subsidiary, refer to note 39.2.

84 IMPERIAL HOLDINGS LIMITED Audited Annual Financial Statements for the year ended 30 June 2015
39. INTEREST IN OTHER ENTITIES CONTINUED
39.1 COMPOSITION OF THE GROUP CONTINUED
39.1.2 Principal subsidiaries of Associated Motor Holdings (Pty) Limited, held directly or indirectly, are as follows:
SubsidiaryPlace of incorporation
Ownership Interest (%) Nature of business
Accordian Investments (Pty) Limited
South Africa 60 Accordian is an importer and distributor of Tata vehicles and parts for South Africa.
Hyundai Auto South Africa (Pty) Limited
South Africa 100 Hyundai Auto SA is an importer and distributor of Hyundai vehicles and parts for Southern Africa. The Group has established a network of dealerships in South Africa, Namibia and Botswana.
Imperial Car Imports (Pty) Limited
South Africa 100 Imperial Car Imports has a 60% interest in Renault SA (Pty) Limited. Renault SA through distribution agreements with Renault SAS France imports and distributes Renault motor vehicles and parts in South Africa.
Kia Motors SA (Pty) Limited South Africa 100 Kia Motors is an importer and distributor of Kia vehicles and parts for South Africa.
KMSA Holdings (Pty) Limited South Africa 82,5 KMSA is an importer of all Kawasaki motorcycle and personal watercraft products for Southern Africa.
Uvundlu Investments (Pty) Limited
South Africa 75 Uvundlu houses the Goscor Group, which imports, distributes and rents forklifts, cherry pickers and cleaning equipment, tooling, and powered products, and provides after-sales parts and services for a range of represented brands.
> NOTES TO THE CONSOLIDATED ANNUAL FINANCIAL STATEMENTS FOR THE YEAR ENDED 30 JUNE 2015 – CONTINUED

85
39.1.3 Principal subsidiaries of Imperial Holdings International Cooperation U.A.
SubsidiaryPlace of incorporation
Ownership Interest (%) Nature of business
Imperial Logistics International GmbH
Germany 100 The subsidiary houses the Imperial Shipping Group. Imperial Shipping implement efficient transport solutions on Europe’s waterways. It has a fleet of inland vessels used on European waterways. In addition to dry cargo, tanker, gas and coastal shipping, the range of services includes container transport and industrial logistics.
Imperial Shipping Paraguay S.A.
Germany 95 Imperial Shipping Paraguay implements transportation of goods and materials on the South American waterways. Currently it has a fleet of inland vessels used on the Rio Parana river, transporting iron ore, grain and other bulk products between Brazil, Paraguay and Argentina.
Neska Germany 65 A specialist for intermodal shipments of diverse goods, Neska operates bulk and container terminals in the main industrial centres along Germany’s inland waterways.
Panopa Germany 100 A contract logistics specialist providing a broad range of services from the beginning to the end of the supply chain. Panopa services the steel, automotive and spare parts industries.
Lehnkering Group Germany 100 Lehnkering specialises in chemical logistics, offering transport, warehousing distribution and extensive value added services such as manufacturing and packaging on behalf of its customers. It has 55 locations in Europe and one in the USA.
Imperial Mobility UK United Kingdom 100 Imperial Mobility UK is involved in the commercial vehicle market, from light commercial to medium, heavy and extra-heavy commercial vehicles. It sells new and used vehicles and vans as well as related financial services, parts and servicing.
Associated Motors Australia (Pty) Ltd
Australia 90 This operation retails Ford, Mitsubishi and Renault through six dealerships in the Sydney area.
Imres BV Netherlands 70 Imres, a wholesaler of pharmaceutical and medical supplies to NGO’s, hospitals and retailers, operates in the international medical relief industry, targeting mainly African emerging countries with developing healthcare markets and needs.

86 IMPERIAL HOLDINGS LIMITED Audited Annual Financial Statements for the year ended 30 June 2015
39. INTEREST IN OTHER ENTITIES CONTINUED
39.1 COMPOSITION OF THE GROUP CONTINUED
39.1.4 Principal businesses of Imperial Group Limited
BusinessPlace of incorporation
Ownership Interest (%) Nature of business
Logistics South Africa 100 These businesses provide a complete logistics solutions including transportation, warehousing, distribution and related value added services in South Africa.
Automotive South Africa 100 The Automotive business within Imperial Group Limited comprises of bikes, passenger, light, medium and heavy commercial vehicle dealerships in South Africa. The franchise dealerships represent virtually every major OEM brand.
Car rental South Africa 100 The Car Rental operations housed within Imperial Group Limited comprises of three business units: Car Rental (Europcar and Tempest), Used Car Sales (Auto Pedigree brand) and Panel repair centres. This unit operates in Southern Africa.
Finance South Africa 100 Provides the treasury function of the Group.
39.2 SIGNIFICANT RESTRICTIONSThe following table shows significant restrictions that apply to three of the Group's subsidiaries. The amounts disclosed represent the carrying values of total assets and total liabilities in the consolidated statement of financial position net of inter-group eliminations.
Total assets Total liabilities
2015Rm
2014Rm
2015Rm
2014Rm
Continuing operationsThe externally imposed capital requirements placed on the Group in terms of debt covenants on bank facilities requires that Imperial Group Limited, a wholly owned subsidiary, maintain a ratio of financial indebtedness to the financial indebtedness of the Group that is higher than the ratio of the EBITDA of Imperial Group Limited to the EBITDA of the Group. 13 337 12 397 15 252 13 142
Discontinued operationsOur long-term insurance operations have regulatory imposed capital adequacy requirements. The capital adequacy requirement is an estimate of the minimum capital that will be required to meet fairly substantial deviations from the main assumptions affecting their business. At 30 June 2015 the capital adequacy requirements was R82 million (2014: R94 million) and the ratio of excess assets to capital adequacy requirements was 5.2 (2014: 3.3).
Our short-term insurance operations are required to maintain, at all times, a statutory surplus asset ratio and free assets after spreading limitations. The returns submitted by the company to the regulator showed that the company met the minimum capital requirements with a solvency ratio of 46% at 30 June 2015 (2014: 40,2%). 4 618 4 399 2 713 2 742
> NOTES TO THE CONSOLIDATED ANNUAL FINANCIAL STATEMENTS FOR THE YEAR ENDED 30 JUNE 2015 – CONTINUED

87
39.3 BUSINESS COMBINATIONS DURING THE YEAR
Businesses acquired Nature of businessOperating segment
Date acquired
Interest acquired
(%)
Purchase consideration
Rm
Pharmed Pharmaceutical (Pty) Limited
Wholesale supply and distribution of healthcare related products
Logistics Africa July 2014 62,5 148
Imres BV* Wholesaler of pharmaceutical and medical supplies to mainly African and emerging markets
Logistics Africa September 2014 75 691
S&B Commercials plc Mercedes Benz commercial franchise business
Vehicle Retail, Rental and After market Parts
September 2014 100 167
Individually immaterial acquisitions
70
1 076
* The Group subsequently decreased its interest in Imres B.V. to 70%.
Fair value of assets acquired and liabilities assumed at date of acquisition:
PharmedRm
ImresRm
S&B Commercials
Rm
Individually immaterial
acquisitionsRm
TotalRm
AssetsIntangible assets 1 308 36 10 355Property, plant and equipment 60 8 53 5 126Transport fleet 5 14 19Investments and loans 2 2Inventories 194 126 434 7 761Trade and other receivables 312 207 129 31 679Cash resources 12 63 9 84
572 661 715 78 2 026
LiabilitiesRetirement benefit obligations 1 1Deferred tax liabilities 1 55 7 63Interest-bearing borrowings 17 82 329 4 432Trade and other payables and provisions 307 136 269 36 748Current tax liabilities 9 9 1 1 20
334 282 606 42 1 264
Acquirees' carrying amount at acquisition 238 379 109 36 762Non-controlling interests (101) (95) (3) (199)
Net assets acquired 137 284 109 33 563Purchase consideration transferred 148 691 167 70 1 076
Cash paid 148 691 167 53 1 059Contingent consideration 17 17
Excess of purchase price over net assets acquired 11 407 58 37 513
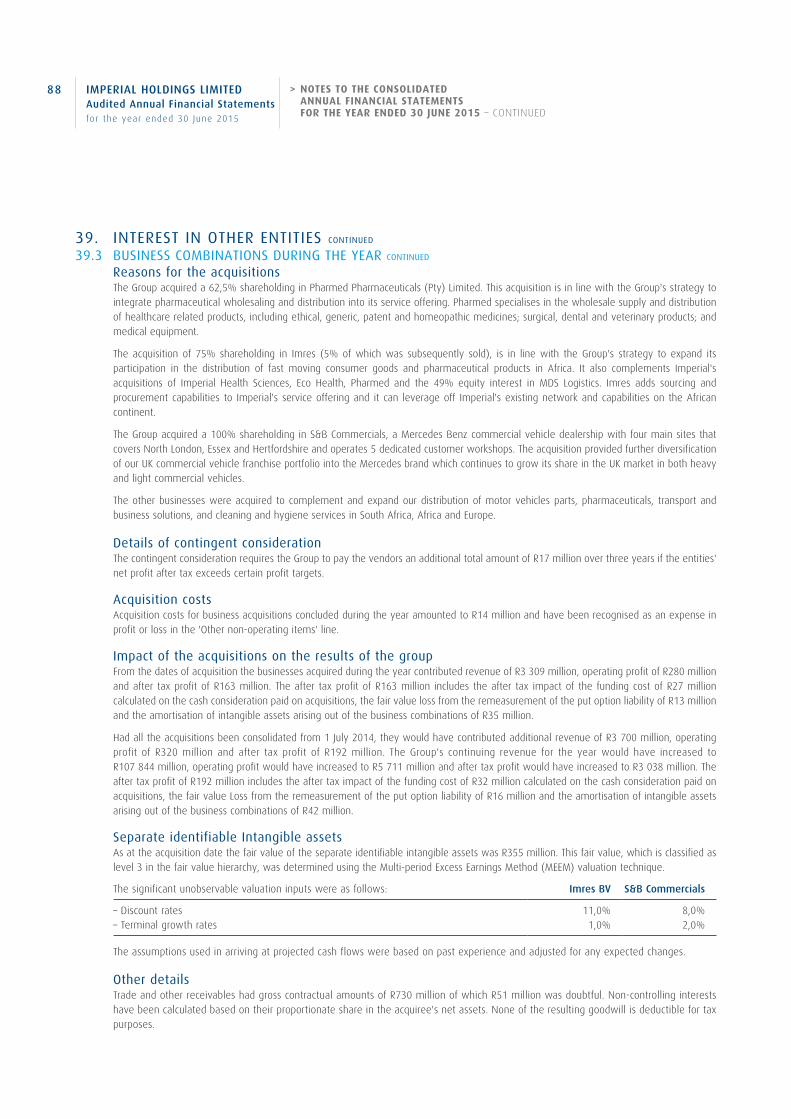
88 IMPERIAL HOLDINGS LIMITED Audited Annual Financial Statements for the year ended 30 June 2015
39. INTEREST IN OTHER ENTITIES CONTINUED
39.3 BUSINESS COMBINATIONS DURING THE YEAR CONTINUED
Reasons for the acquisitionsThe Group acquired a 62,5% shareholding in Pharmed Pharmaceuticals (Pty) Limited. This acquisition is in line with the Group's strategy to integrate pharmaceutical wholesaling and distribution into its service offering. Pharmed specialises in the wholesale supply and distribution of healthcare related products, including ethical, generic, patent and homeopathic medicines; surgical, dental and veterinary products; and medical equipment.
The acquisition of 75% shareholding in Imres (5% of which was subsequently sold), is in line with the Group's strategy to expand its participation in the distribution of fast moving consumer goods and pharmaceutical products in Africa. It also complements Imperial's acquisitions of Imperial Health Sciences, Eco Health, Pharmed and the 49% equity interest in MDS Logistics. Imres adds sourcing and procurement capabilities to Imperial's service offering and it can leverage off Imperial's existing network and capabilities on the African continent.
The Group acquired a 100% shareholding in S&B Commercials, a Mercedes Benz commercial vehicle dealership with four main sites that covers North London, Essex and Hertfordshire and operates 5 dedicated customer workshops. The acquisition provided further diversification of our UK commercial vehicle franchise portfolio into the Mercedes brand which continues to grow its share in the UK market in both heavy and light commercial vehicles.
The other businesses were acquired to complement and expand our distribution of motor vehicles parts, pharmaceuticals, transport and business solutions, and cleaning and hygiene services in South Africa, Africa and Europe.
Details of contingent considerationThe contingent consideration requires the Group to pay the vendors an additional total amount of R17 million over three years if the entities' net profit after tax exceeds certain profit targets.
Acquisition costsAcquisition costs for business acquisitions concluded during the year amounted to R14 million and have been recognised as an expense in profit or loss in the 'Other non-operating items' line.
Impact of the acquisitions on the results of the groupFrom the dates of acquisition the businesses acquired during the year contributed revenue of R3 309 million, operating profit of R280 million and after tax profit of R163 million. The after tax profit of R163 million includes the after tax impact of the funding cost of R27 million calculated on the cash consideration paid on acquisitions, the fair value loss from the remeasurement of the put option liability of R13 million and the amortisation of intangible assets arising out of the business combinations of R35 million.
Had all the acquisitions been consolidated from 1 July 2014, they would have contributed additional revenue of R3 700 million, operating profit of R320 million and after tax profit of R192 million. The Group's continuing revenue for the year would have increased to R107 844 million, operating profit would have increased to R5 711 million and after tax profit would have increased to R3 038 million. The after tax profit of R192 million includes the after tax impact of the funding cost of R32 million calculated on the cash consideration paid on acquisitions, the fair value Loss from the remeasurement of the put option liability of R16 million and the amortisation of intangible assets arising out of the business combinations of R42 million.
Separate identifiable Intangible assetsAs at the acquisition date the fair value of the separate identifiable intangible assets was R355 million. This fair value, which is classified as level 3 in the fair value hierarchy, was determined using the Multi-period Excess Earnings Method (MEEM) valuation technique.
The significant unobservable valuation inputs were as follows: Imres BV S&B Commercials
– Discount rates 11,0% 8,0%– Terminal growth rates 1,0% 2,0%
The assumptions used in arriving at projected cash flows were based on past experience and adjusted for any expected changes.
Other detailsTrade and other receivables had gross contractual amounts of R730 million of which R51 million was doubtful. Non-controlling interests have been calculated based on their proportionate share in the acquiree's net assets. None of the resulting goodwill is deductible for tax purposes.
> NOTES TO THE CONSOLIDATED ANNUAL FINANCIAL STATEMENTS FOR THE YEAR ENDED 30 JUNE 2015 – CONTINUED

89
39.4 NON-CONTROLLING INTERESTS IN THE GROUP'S ACTIVITIESThe following subsidiaries have non-controlling interests that are material to the group.
SubsidiaryPrincipal place of business Operating segment
Ownership interest held by NCI (%)
2015 2014
Associated Motor Holdings (Pty) Limited South Africa Vehicle Import, Distribution and Dealerships 10 10Midas (Pty) Limited South Africa Vehicle Retail, Rental and Aftermarket parts 25 25Eco Health Limited Nigeria Logistics Africa 32 32
The following is summarised financial information for AMH, Midas and Eco Health, based on their respective consolidated financial statements prepared in accordance with IFRS, modified for fair value adjustments made at time of acquisition and differences in accounting policies. The information is before inter-company eliminations with other entities in the Group.
AMH Midas Eco Health^
R million 2015 2014 2015 2014 2015 2014
Revenue 23 111 22 336 4 096 3 869 1 944 646
Net profit for the year 701 1 248 172 159 16 16
Net profit attributable to non-controlling interests 97 161 43 41 5 5
Other comprehensive income 161 (411) 68 (22)
Total comprehensive income 862 837 172 159 84 (6)
Income attributable to non-controlling interests 67 120 43 41 27 (3)
Total assets 15 663 14 297 1 172 1 146 1 673 1 354Total liabilities 10 321 9 394 575 602 1 114 813
Total equity 5 342 4 903 597 544 559 541
Equity attributable to non-controlling interest 655 606 149 140 179 173
Dividends paid to non-controlling interest 54 98 29 25 21 28
^ Acquired in March 2014. Total comprehensive income in 2014 is for the 4 months ended June 2014.

90 IMPERIAL HOLDINGS LIMITED Audited Annual Financial Statements for the year ended 30 June 2015
39. INTEREST IN OTHER ENTITIES CONTINUED
39.5 INTEREST IN ASSOCIATES AND JOINT VENTURESThe following associates are material to the Group. They are all equity accounted.
MiX Telematics Limited MDS Logistics PLCUkhamba Holdings (Pty) Limited
Nature of relationship with the Group
Operations include vehicle tracking and fleet management. Provides services to Imperial's new and used vehicle dealerships.
Strategic supply chain provider, providing access to new markets in Africa.
Imperial's black economic empowerment partner.
Principal place of business/Country of incorporation
South Africa Nigeria South Africa
Ownership interest/Voting rights held 25,3% (2014: 25,6%) 49,0% 46,9%
Fair value of ownership interest (listed)* R763 million (2014: R882 million)
* Based on the unadjusted quoted market price at 30 June (Level 1 in the fair value hierarchy).
The following is summarised financial information for Mix, MDS and Ukhamba, based on their respective consolidated financial statements prepared in accordance with IFRS, modified for fair value adjustments made at time of acquisition and differences in accounting policies.
MiX Telematics Limited~ MDS Logistics PLCUkhamba Holdings
(Pty) Limited
R millionMarch2015
March2014
June2015
June2014
June2015
June2014
Revenue 1 389 1 272 305 289
Net profit (loss) for the year 149 152 59 55 (150) 388Other comprehensive income 31 48 (34) 50 (116) 41
Total comprehensive income 180 200 25 105 (266) 429
Total assets 2 229 1 977 639 747 4 160 4 512Total liabilities 364 305 70 94 2 202 2 361
Total equity 1 865 1 672 569 653 1 958 2 151
Group's interest in net assets of investee at beginning of year 428 249 314 263 1 008 767Equity acquired 24 Share of total comprehensive income 46 53 12 51 (124) 201Share of increase in net assets (2) 113 Dividends (received from) paid to associate (11) (47) 34 40
Group's proportional interest in net assets of investee 472 428 279 314 918 1 008Reversal of fair value adjustments on Imperial shares (918) (958)Adjustment for differences in financial year-end 1 10Goodwill 62 62
Carrying value of interest in investee at end of year 535 500 279 314 50
~ Listed on the Johannesburg Securities Exchange with a March year-end.
> NOTES TO THE CONSOLIDATED ANNUAL FINANCIAL STATEMENTS FOR THE YEAR ENDED 30 JUNE 2015 – CONTINUED

91
Immaterial associates and joint venturesThe following summarises the Group's interest in immaterial associates and joint ventures, based on the amounts reported in the Groups consolidated financial statements:
Associates Joint ventures
R million 2015 2014 2015 2014
Group's share of:– Net profit 67 64 (15) 2– Other comprehensive income (2) 4 (14)
– Total comprehensive income 65 64 (11) (12)
Carrying value of interest in immaterial associates 301 341 75 18
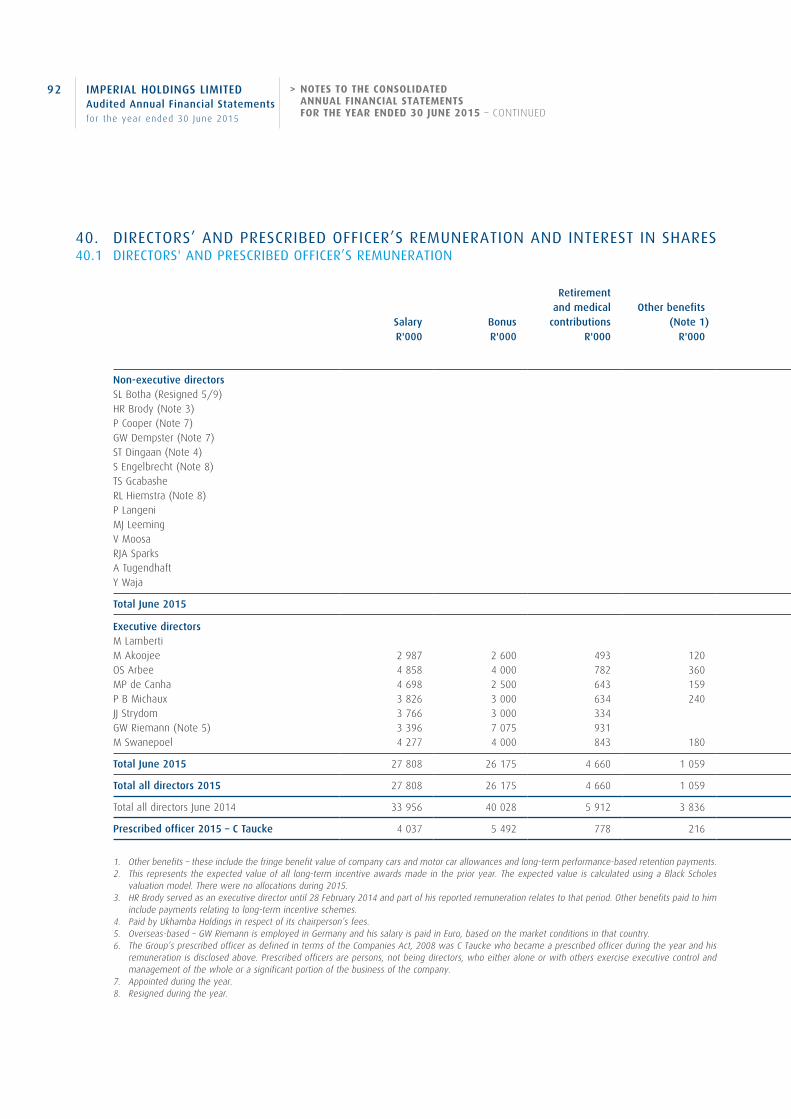
92 IMPERIAL HOLDINGS LIMITED Audited Annual Financial Statements for the year ended 30 June 2015
40. DIRECTORS’ AND PRESCRIBED OFFICER’S REMUNERATION AND INTEREST IN SHARES40.1 DIRECTORS' AND PRESCRIBED OFFICER’S REMUNERATION
Salary R'000
Bonus R'000
Retirement and medical
contributions R'000
Other benefits (Note 1)
R'000
Directors’ fees
R'000
Subsidiary/Associate and
Sub-committee fees
R'000
2015 Total
R'000
2014 Total
R'000
Expected value of Long Term
Incentive awards made in 2015
R'000
Expected value of Long Term
Incentive awards made in 2014
R'000
Total Total (Note 2) (Note 2)
Non-executive directorsSL Botha (Resigned 5/9) 58 HR Brody (Note 3) 113 120 233 14 947 P Cooper (Note 7) 78 78 GW Dempster (Note 7) 78 78 ST Dingaan (Note 4) 225 285 510 739 S Engelbrecht (Note 8) 150 64 214 392 TS Gcabashe 1 012 293 1 305 1 134 RL Hiemstra (Note 8) 94 79 173 392 P Langeni 225 274 499 466 MJ Leeming 225 735 960 875 V Moosa 225 239 464 437 RJA Sparks 225 670 895 856 A Tugendhaft 618 221 839 763 Y Waja 225 764 989 928
Total June 2015 3 493 3 744 7 237 21 987
Executive directorsM Lamberti 8 543 10 329 M Akoojee 2 987 2 600 493 120 6 200 5 242 3 850 3 600 OS Arbee 4 858 4 000 782 360 10 000 9 914 6 360 6 000 MP de Canha 4 698 2 500 643 159 8 000 8 643 5 650 5 500 P B Michaux 3 826 3 000 634 240 7 700 6 736 5 000 4 700 JJ Strydom 3 766 3 000 334 7 100 6 262 4 100 GW Riemann (Note 5) 3 396 7 075 931 410 11 812 23 935 M Swanepoel 4 277 4 000 843 180 9 300 8 606 5 650 5 300
Total June 2015 27 808 26 175 4 660 1 059 410 60 112 69 338 35 053 39 529
Total all directors 2015 27 808 26 175 4 660 1 059 3 903 3 744 67 349 91 325 35 053 39 529
Total all directors June 2014 33 956 40 028 5 912 3 836 3 338 4 255 91 325
Prescribed officer 2015 – C Taucke 4 037 5 492 778 216 10 523
1. Other benefits – these include the fringe benefit value of company cars and motor car allowances and long-term performance-based retention payments.2. This represents the expected value of all long-term incentive awards made in the prior year. The expected value is calculated using a Black Scholes
valuation model. There were no allocations during 2015.3. HR Brody served as an executive director until 28 February 2014 and part of his reported remuneration relates to that period. Other benefits paid to him
include payments relating to long-term incentive schemes.4. Paid by Ukhamba Holdings in respect of its chairperson’s fees.5. Overseas-based – GW Riemann is employed in Germany and his salary is paid in Euro, based on the market conditions in that country.6. The Group’s prescribed officer as defined in terms of the Companies Act, 2008 was C Taucke who became a prescribed officer during the year and his
remuneration is disclosed above. Prescribed officers are persons, not being directors, who either alone or with others exercise executive control and management of the whole or a significant portion of the business of the company.
7. Appointed during the year.8. Resigned during the year.
> NOTES TO THE CONSOLIDATED ANNUAL FINANCIAL STATEMENTS FOR THE YEAR ENDED 30 JUNE 2015 – CONTINUED

93
40. DIRECTORS’ AND PRESCRIBED OFFICER’S REMUNERATION AND INTEREST IN SHARES40.1 DIRECTORS' AND PRESCRIBED OFFICER’S REMUNERATION
Salary R'000
Bonus R'000
Retirement and medical
contributions R'000
Other benefits (Note 1)
R'000
Directors’ fees
R'000
Subsidiary/Associate and
Sub-committee fees
R'000
2015 Total
R'000
2014 Total
R'000
Expected value of Long Term
Incentive awards made in 2015
R'000
Expected value of Long Term
Incentive awards made in 2014
R'000
Total Total (Note 2) (Note 2)
Non-executive directorsSL Botha (Resigned 5/9) 58 HR Brody (Note 3) 113 120 233 14 947 P Cooper (Note 7) 78 78 GW Dempster (Note 7) 78 78 ST Dingaan (Note 4) 225 285 510 739 S Engelbrecht (Note 8) 150 64 214 392 TS Gcabashe 1 012 293 1 305 1 134 RL Hiemstra (Note 8) 94 79 173 392 P Langeni 225 274 499 466 MJ Leeming 225 735 960 875 V Moosa 225 239 464 437 RJA Sparks 225 670 895 856 A Tugendhaft 618 221 839 763 Y Waja 225 764 989 928
Total June 2015 3 493 3 744 7 237 21 987
Executive directorsM Lamberti 8 543 10 329 M Akoojee 2 987 2 600 493 120 6 200 5 242 3 850 3 600 OS Arbee 4 858 4 000 782 360 10 000 9 914 6 360 6 000 MP de Canha 4 698 2 500 643 159 8 000 8 643 5 650 5 500 P B Michaux 3 826 3 000 634 240 7 700 6 736 5 000 4 700 JJ Strydom 3 766 3 000 334 7 100 6 262 4 100 GW Riemann (Note 5) 3 396 7 075 931 410 11 812 23 935 M Swanepoel 4 277 4 000 843 180 9 300 8 606 5 650 5 300
Total June 2015 27 808 26 175 4 660 1 059 410 60 112 69 338 35 053 39 529
Total all directors 2015 27 808 26 175 4 660 1 059 3 903 3 744 67 349 91 325 35 053 39 529
Total all directors June 2014 33 956 40 028 5 912 3 836 3 338 4 255 91 325
Prescribed officer 2015 – C Taucke 4 037 5 492 778 216 10 523
1. Other benefits – these include the fringe benefit value of company cars and motor car allowances and long-term performance-based retention payments.2. This represents the expected value of all long-term incentive awards made in the prior year. The expected value is calculated using a Black Scholes
valuation model. There were no allocations during 2015.3. HR Brody served as an executive director until 28 February 2014 and part of his reported remuneration relates to that period. Other benefits paid to him
include payments relating to long-term incentive schemes.4. Paid by Ukhamba Holdings in respect of its chairperson’s fees.5. Overseas-based – GW Riemann is employed in Germany and his salary is paid in Euro, based on the market conditions in that country.6. The Group’s prescribed officer as defined in terms of the Companies Act, 2008 was C Taucke who became a prescribed officer during the year and his
remuneration is disclosed above. Prescribed officers are persons, not being directors, who either alone or with others exercise executive control and management of the whole or a significant portion of the business of the company.
7. Appointed during the year.8. Resigned during the year.

94 IMPERIAL HOLDINGS LIMITED Audited Annual Financial Statements for the year ended 30 June 2015
40. DIRECTORS’ REMUNERATION AND INTEREST IN SHARES CONTINUED
40.2 INCENTIVE SCHEMESExecutive directors participate in long-term incentive schemes, designed to recognise the contributions of senior employees to the growth in the company's equity. Within limits imposed by shareholders, rights are allocated to directors and senior employees. The equity-linked compensation benefits for executive directors are set out below.
Participation in the share appreciation rights schemeDirectors
Commencement date
Price on commence-ment date
(R)Number of rights*
Number of rights
exercised
Number of rights forfeited
Number of rights
remaining Vesting date
M Akoojee 14 June 2011 116,59 11 628 11 628 15 September 201413 June 2012 170,57 24 016 24 016 26 August 201511 June 2013 195,20 38 154 38 154 15 September 2016
OS Arbee 2 June 2010 96,71 56 333 1 031 55 302 15 September 201314 June 2011 116,59 23 377 23 377 15 September 201413 June 2012 170,57 44 743 44 743 26 August 201511 June 2013 195,20 77 582 77 582 15 September 2016
MP de Canha 14 June 2011 116,59 25 011 25 011 15 September 201413 June 2012 170,57 47 876 47 876 26 August 201511 June 2013 195,20 68 215 68 215 15 September 2016
M Swanepoel 14 June 2011 116,59 23 377 23 377 15 September 201413 June 2012 170,57 44 743 44 743 26 August 201511 June 2013 195,20 68 641 68 641 15 September 2016
PB Michaux 14 June 2011 116,59 12 200 12 200 15 September 201413 June 2012 170,57 31 241 31 241 26 August 201511 June 2013 195,20 51 092 51 092 15 September 2016
JJ Strydom 14 June 2011 116,59 9 384 9 384 15 September 201413 June 2012 170,57 29 342 29 342 26 August 201511 June 2013 195,20 48 263 48 263 15 September 2016
* The number of rights that will eventually vest is subject to the achievement of performance conditions linked to core EPS targets relative to a peer group
of 20 JSE listed companies and return on invested capital (ROIC) targets relative to weighted cost of capital. The rights vested could be fewer than the
number granted.
Participation in the deferred bonus planExecutive directors
Allocation date
Number of rights
allocated
Number of shares
committedto the plan*
Balanceavailable tobe taken up
Vestedduring the
yearBalance
remaining Vesting date
MJ Lamberti 1 March 2014 60 787 60 787 60 787 15 September 2017
M Akoojee 18 June 2010 10 000 3 376 3 376 7 September 2014 2 445 2 445 26 August 2015
14 June 2011 5 805 5 805 5 805 7 September 201413 June 2012 4 854 4 854 4 854 26 August 201513 June 2013 3 266 3 266 3 266 15 September 201630 June 2014 18 579 18 579 18 579 15 September 2017
OS Arbee 14 June 2011 10 406 10 406 10 406 7 September 201413 June 2012 9 044 6 727 6 727 26 August 201511 June 2013 5 872 5 872 5 872 15 September 201630 June 2014 30 965 30 965 30 965 15 September 2017
MP de Canha 14 June 2011 12 486 10 712 10 712 7 September 201413 June 2012 9 677 8 064 8 064 26 August 201511 June 2013 6 276 6 276 6 276 15 September 201630 June 2014 28 384 28 384 28 384 15 September 2017
> NOTES TO THE CONSOLIDATED ANNUAL FINANCIAL STATEMENTS FOR THE YEAR ENDED 30 JUNE 2015 – CONTINUED

95
Allocation date
Number of rights
allocated
Number of shares
committedto the plan+
Balanceavailable tobe taken up
Vestedduring the
yearBalance
remaining Vesting date
M Swanepoel 14 June 2011 9 641 9 641 9 641 7 September 201413 June 2012 6 156 6 156 6 156 26 August 201511 June 2013 5 164 5 164 5 164 15 September 201630 June 2014 27 352 27 352 27 352 15 September 2017
PB Michaux 14 June 2011 5 251 5 251 5 251 7 September 201413 June 2012 4 793 4 793 4 793 26 August 201511 June 2013 4 634 4 634 4 634 15 September 201630 June 2014 24 256 24 256 24 256 15 September 2017
JJ Strydom 14 June 2011 4 039 4 039 4 039 7 September 201413 June 2012 3 957 3 957 3 957 26 August 201511 June 2013 3 689 3 689 3 689 15 September 201630 June 2014 21 159 21 159 21 159 15 September 2017
* The number of rights that will eventually vest is subject to the achievement of performance conditions linked to core EPS targets relative to a peer group of 20 JSE listed companies and return on invested capital (ROIC) targets relative to weighted cost of capital. The rights vested could be fewer than the number granted.
40.3 GAINS BY DIRECTORS ON SAR, DBP AND CRP DURING THE YEAR
Directors2015
R’0002014R’000
HR Brody 18 894
OS Arbee 2 465 3 218
M Akoojee 1 969 3 357
MP de Canha 2 560 11 384
M Swanepoel 3 896 8 721
PB Michaux 2 220 6 158
JJ Strydom 1 753 3 884
40.4 DIRECTORS’ INTERESTS IN SHARES
2015 2014
Beneficial Non-beneficial Beneficial Non-beneficial
Non-executiveHR Brody 36 682GW Dempster 99RL Hiemstra 10 406SP Kana 9 417MJ Leeming 6 928 6 928RJA Sparks 40 000 20 000 40 000 20 000Y Waja 3 000 3 000
52 616 26 928 90 088 26 928
ExecutiveMJ Lamberti 500 000 450 000OS Arbee 71 344 56 477M Akoojee 34 873 25 692MP de Canha 1 725 385 1 686 289M Swanepoel 38 672 20 961PB Michaux 48 243 38 058JJ Strydom 56 865 54 442
2 475 382 2 331 919
2 527 898 26 928 2 422 007 26 928
There have been no changes in the above interests from the end of the financial year to the date of the annual financial statements.

96 IMPERIAL HOLDINGS LIMITED Audited Annual Financial Statements for the year ended 30 June 2015
> COMPANY STATEMENT OF FINANCIAL POSITION AT 30 JUNE 2015
Notes2015
Rm2014
Rm
ASSETSInterests in subsidiaries 2 8 648 9 456Investments in associates and joint ventures 3 50 1 221Investments 4 47 47Trade and other receivables 68Current tax asset 2Interests in subsidiaries classified as held for sale 2 603
Total assets 9 350 10 792
EQUITY AND LIABILITIESCapital and reservesShare capital and share premium 5 382 382Other reserves 70 401Retained earnings 8 418 9 474
Total equity 8 870 10 257
LiabilitiesNon-redeemable, non-participating preference shares 6 441 441Trade payables and other liabilities 8 39 70Current tax liabilities 24
Total liabilities 480 535
Total equity and liabilities 9 350 10 792
Notes2015
Rm2014
Rm
Revenue 9 1 476 2 426Net operating expenses 10 (19) (108)Other non-operating items 11 (196) (268)
Profit before net financing income 1 261 2 050Finance cost (35) (33)Finance income 37 62
Profit before tax 1 263 2 079Income tax 12 12 126
Net profit and total comprehensive income for the year 1 275 2 205
There have been no movements in other comprehensive income in the current and prior year.
> COMPANY STATEMENT OF COMPREHENSIVE INCOME FOR THE YEAR ENDED 30 JUNE 2015

IMPERIAL HOLDINGS LIMITED Audited Annual Financial Statements for the year ended 30 June 2015
97 > COMPANY STATEMENT OF CHANGES IN EQUITY FOR THE YEAR ENDED 30 JUNE 2015
Share capital and share premium
Rm
Other reserves
Rm
Retained earnings
RmTotal
Rm
At 30 June 2013 382 331 9 523 10 236Total comprehensive income for the year 2 205 2 205Repurchase and cancellation of 2 971 808 ordinary shares from the open market (502) (502)Charge for amending the conversion profile of the deferred ordinary shares 70 70Ordinary dividends declared (1 752) (1 752)
At 30 June 2014 382 401 9 474 10 257Total comprehensive income for the year 1 275 1 275Ordinary dividends declared (1 597) (1 597)Expiration of Lereko call option (309) (756) (1 065)Direct transfer to retained earnings (22) 22
At 30 June 2015 382 70 8 418 8 870
Notes2015
Rm2014
Rm
Cash flows from operating activitiesCash generated by operations 13 1 535 2 263Finance cost paid (35) (33)Finance income received 37 62Tax paid 14 (14) (24)
1 523 2 268
Cash flows from investing activitiesDisposals (additions) of investments and loans to subsidiaries, associates and joint ventures 107 (169)Disposal of investments 183Settlement of contingent consideration liabilities (33) (28)
74 (14)
Cash flows from financing activitiesRepurchase and cancellation of 2 971 808 ordinary shares from the open market (502)Dividends paid (1 597) (1 752)
(1 597) (2 254)
Net movement in cash and cash equivalentsCash and cash equivalents at beginning of year
Cash and cash equivalents at end of year
> COMPANY STATEMENT OF CASH FLOWS FOR THE YEAR ENDED 30 JUNE 2015

98 IMPERIAL HOLDINGS LIMITED Audited Annual Financial Statements for the year ended 30 June 2015
1. ACCOUNTING POLICIES The principal accounting policies adopted and methods of computation used in the preparation of the company’s annual financial statements
are set out below and are consistent in all material aspects with those applied during the previous year except for the adoption of new and amended statements
1.1 INTEREST IN SUBSIDIARIES Interest in subsidiaries are carried at cost less accumulated impairment losses. Acquisition-related costs for new interests acquired during the
year are recognised in profit or loss.
1.2 INVESTMENTS IN ASSOCIATES AND JOINT VENTURES Investments in associates and joint ventures are carried at cost less accumulated impairment losses.
1.3 INVESTMENTS Investments are carried at cost less accumulated impairment losses.
1.4 FINANCIAL INSTRUMENTS Financial assets and financial liabilities are recognised when the company becomes a party to the contractual provisions of the contract.
Initial measurement Financial assets and financial liabilities are initially measured at fair value plus transaction costs.
Subsequent measurement Financial assets comprising of trade receivables are subsequently measured at amortised cost using the effective interest method, less any
impairment where appropriate.
Financial liabilities comprising of trade payables and contingent consideration liabilities are subsequently measured at amortised cost using the effective interest method, less any impairment where appropriate.
Derecognition Financial assets are derecognised when the right to receive cash flows have expired or the company has transferred the financial asset and
all the risks and rewards associated with ownership of the financial asset.
Financial liabilities are derecognised when the obligations specified in the contacts are discharged, cancelled or expired.
1.5 REVENUE Dividend income from interest in subsidiaries, investments in associates and joint ventures and other investments, is recognised when the
company’s right to receive payment has been established.
1.6 FINANCE COST AND FINANCE INCOME Finance cost comprises of the preference dividend payable on the non-redeemable, non-participating preference shares. Finance cost is
recognised in profit or loss in the period in which it is incurred on a day-to-day basis using the effective interest method.
Finance income is recognised in profit or loss using the effective interest method.
1.7 CAPITAL ITEMS Capital items includes gains or losses on disposal and impairments of subsidiaries and investment in associates and joint ventures.
1.8 INCOME TAXES Income tax comprises of current and withholding tax for the year recognised in profit or loss.
Current tax Current tax assets or liabilities are recognised based on the expected tax payable or refundable. Current tax is calculated on the taxable profit
for the period using the tax rates that have been enacted of substantively enacted by the end of the reporting period.
Withholding tax Withholding tax is payable at different tax rates on dividends received from foreign subsidiaries.
> NOTES TO THE COMPANY ANNUAL FINANCIAL STATEMENTS FOR THE YEAR ENDED 30 JUNE 2015

99
1.9 SIGNIFICANT JUDGEMENT AND ESTIMATES The preparation of the annual financial statements requires the company’s management to make judgements, estimates and assumptions that
affect the reported amounts of assets and liabilities and the disclosure of contingent assets and liabilities at the date of the financial statements, and the reported amounts of revenues and expenses during the reporting period. The determination of estimates requires the exercise of judgement based on various assumptions and other factors such as historical experience and current and economic conditions.
The company uses judgement when assessing the impairments of the investments in subsidiaries, associates and joint ventures, the fair value of the Lereko call option and the fair value of contingent consideration liabilities.
1.10 NEW AND REVISED INTERNATIONAL FINANCIAL REPORTING STANDARDS IN ISSUE BUT NOT YET EFFECTIVE
Amendments to IFRS 9 – Financial Instruments and the new standard for revenue (IFRS 15 – Revenue From Contacts With Customers), are expected to have no significant impact on the company’s accounting policies and methods of computation.
2015Rm
2014Rm
2. INTERESTS IN SUBSIDIARIESShares at cost, net of impairments 6 495 6 618Indebtedness by subsidiaries, net of impairments 2 153 2 838
8 648 9 456
The investment in Regent Insurance and Regent Life have been reclassified as held for sale as the Group plans to dispose of these investments.
Details of the company’s principal subsidiaries are reflected in note 39 of the consolidated annual financial statements.
3. INVESTMENTS IN ASSOCIATES AND JOINT VENTURESUnlisted shares at cost 45 44Impairments (12) (12)
33 32Indebtedness by associates and joint ventures 17 16Lereko Mobility (Pty) Ltd call option 1 173
50 1 221
Lereko Mobility (Pty) Ltd (Lereko) call optionBalance at beginning of year 1 173 1 244Fair value adjustment through profit or loss (108) (71)Expiration of call option (1 065)
Balance at end of year 1 173
4. INVESTMENTSUnlisted shares at cost, net of impairments 47 47

100 IMPERIAL HOLDINGS LIMITED Audited Annual Financial Statements for the year ended 30 June 2015
2015Rm
2014Rm
5. SHARE CAPITAL AND SHARE PREMIUMAuthorised share capital394 999 000 (2014: 394 999 000) ordinary shares of 4 cents each 15 1550 000 000 (2014: 50 000 000) deferred ordinary shares of 4 cents each 2 215 000 000 (2014: 15 000 000) preferred ordinary shares of 4 cents each 1 11 000 (2014: 1 000) redeemable preference shares of 4 cents each40 000 000 (2014: 40 000 000) non-redeemable, non-participating preference shares of 4 cents each* 2 2
20 20
Issued and fully paid share capital202 782 278 (2014: 207 815 715) ordinary shares of 4 cents each 8 810 193 767 (2014: 11 025 236) deferred ordinary shares of 4 cents each 1 1
Share capital 9 9Share premium 373 373
Share capital and premium 382 382
* For non-redeemable, non-participating preference shares in issue refer to note 6.
Directors’ authority to issue ordinary shares and non-redeemable, non-participating preference sharesThe directors have been given general authority until the next annual general meeting to issue: > not more than five percent of the issued ordinary share capital at 30 June 2014; > not more than five million of the non-redeemable, non-participating preference shares.
Ordinary sharesThe ordinary shares carry one vote per share and are entitled to an ordinary dividend.
Deferred ordinary sharesUkhamba, the BEE partner that owns an effective 10,1% shareholding in Imperial, facilitated the trading of its shares on an Over the Counter (OTC) Platform to allow our employees and beneficiaries in Ukhamba to monetise their value in Ukhamba. To allow for this, at a general meeting held on 21 October 2013, Imperial shareholders agreed to alter the conversion profile of the deferred ordinary shares to equal predetermined conversions over 12 years. As a result 831 469 deferred shares convert annually, with the last conversion on 30 June 2025. The R70 million cost for altering the conversion profile of the deferred shares was charged to profit or loss in the prior year.
To the end of the current financial year 12 561 622 (2014: 11 730 153) deferred ordinary shares have been converted into ordinary shares.
The deferred ordinary shares carry one vote per share and are not entitled to dividends.
Directors’ interests in issued share capitalAt year-end the aggregate shareholdings of the directors in the issued ordinary share capital of the company are outlined in note 40 of the consolidated annual financial statements.
2015Rm
2014Rm
6. NON-REDEEMABLE, NON-PARTICIPATING PREFERENCE SHARESNon-redeemable, non-participating preference shares at cost 441 441
4 540 041 preference shares listed on the JSE under specialist securities – preference shares sector.
These shares are entitled to a preference dividend being 82,5% of the prime interest rate. The company is obligated to pay any arrear dividends within five years from the proceeds raised by issuing new ordinary shares within six months prior to such payment. Because of the cumulative nature of these preference shares they are classified as debt with no repayment terms.
The coupon is payable semi-annually on 1 April and 1 October and annually this amounts to R35 million (2014: R33 million ) which is included as part of finance cost in profit or loss.
> NOTES TO THE COMPANY ANNUAL FINANCIAL STATEMENTS FOR THE YEAR ENDED 30 JUNE – CONTINUED

101
2015Rm
2014Rm
7. DEFERRED TAX LIABILITYMovement in deferred taxBalance at beginning of year 146Prior year overprovision (146)
8. TRADE PAYABLES AND OTHER LIABILITIESTrade payables and accruals at amortised cost 26 30Contingent consideration liabilities (Level 3 financial instrument) 13 40
39 70
The fair value of the trade payables and accruals approximate their fair value.
Movements in contingent consideration liabilities (Level 3 financial instrument)Balance at beginning of year 40 74Settlements (33) (28)Remeasured to profit or loss (6)Amounts raised 6
13 40
9. REVENUEAn analysis of the company’s revenue is as follows:Dividends received from subsidiaries, associates and joint ventures 1 467 2 419Fees received 9 7
1 476 2 426
10. NET OPERATING EXPENSESThe following disclosable items have been included in operating expenses:Auditors’ remuneration 2 1Non-executive directors’ emoluments* 7 6Professional fees 5 6Acquisition costs 5 10
* Refer to note 40 in the consolidated annual financial statements for the executive directors emoluments.
11. OTHER NON-OPERATING ITEMSRemeasurement of financial instruments not held-for-trading (108) (63)
Fair value loss on Lereko Mobility (Pty) Ltd call option (108) (71)Other fair value gains 8
Capital items (88) (135)
Loss on sale of subsidiaries and businesses (42) (7)Impairment of investments in subsidiaries, loans to subsidiaries and associates (46) (128)
Other items (70)
Charge for amending the conversion profile of the deferred ordinary shares (70)
(196) (268)

102 IMPERIAL HOLDINGS LIMITED Audited Annual Financial Statements for the year ended 30 June 2015
2015Rm
2014Rm
12. INCOME TAXSouth African normal tax– Current 12 20Capital gains tax– Current 4– Prior year over provision of current tax (27) (6)– Prior year over provision of deferred tax (146)Withholding tax on dividends 3 2
(12) (126)
Reconciliation of tax rate: % %Profit before tax – effective tax rate (1,0) (6,1)Tax effect of:– Withholding tax on dividends (0,2) (0,1)– Disallowable charges and capital losses (1,2) (4,7)– Exempt income 30,6 32,8– Fair value adjustment on Lereko Mobility (Pty) Ltd call option (2,3) (1,0)– Capital gains tax (0,2)– Prior year overprovision 2,1 7,3
28,0 28,0
2015Rm
2014Rm
13. CASH GENERATED BY OPERATIONSProfit before net financing income 1 261 2 050Capital items 88 135Fair value gain on Lereko Mobility (Pty) Ltd call option 108 71Other fair value gains (8)Charge for amending the conversion profile of deferred ordinary shares 70Acquisition costs 5 10Working capital movements– Decrease (increase) in trade and other receivables 68 (54)– Increase (decrease) in trade and other payables 5 (11)
1 535 2 263
14. TAX PAIDBalance at beginning of year (24) (28)Current tax recognised in profit or loss 12 (20)Balance at end of year (2) 24
(14) (24)
> NOTES TO THE COMPANY ANNUAL FINANCIAL STATEMENTS FOR THE YEAR ENDED 30 JUNE 2015 – CONTINUED

103
2015Rm
2014Rm
15. CONTINGENT LIABILITIESThe company has contingent liabilities in respect of guarantees issued to bankersand others, on behalf of subsidiaries, for facilities in the normal course ofbusiness to the extent that they are used. The year-end utilisation of facilities was: 8 942 5 718
The company has contingent liabilities in respect of guarantees issued to bankersand others, on behalf of associates, for facilities in the normal course of businessto the extent that they are used. The year-end utilisation of facilities was: 167 84
As part of the NAC sale in 2013 Imperial Holdings have issued a guarantee to secure vendorfunding for five years for: 80 80
The company has guaranteed the obligations to the investors in the commercial paper and corporate bonds issued. 6 140 6 441
16. FINANCIAL INSTRUMENTS Interest rate risk This is the risk that fluctuations in interest rates may adversely impact the company’s assets, liabilities and equity. As the company has no
significant interest-bearing financial instruments, the company’s income and operating cash flows are substantially independent of fluctuations in market interest rates. Interest payable on the non-redeemable, non-participating preference shares and the interest received on the intergroup loan are exposed to interest risk.
Liquidity risk This is the risk that the company may not be able to meet its financial instruments as they fall due. The company manages liquidity risk by
managing forecast cash flows and ensuring that adequate liquidity needs are maintained.
17. EVENTS AFTER THE REPORTING PERIOD An ordinary dividend of 445 cents has been declared by the board of Imperial on 24 August 2015.
104 IMPERIAL HOLDINGS LIMITED Audited Annual Financial Statements for the year ended 30 June 2015
> ANNEXURE A – ADDITIONAL INFORMATION ON INSURANCE BUSINESSES (HELD FOR SALE)
1. ACCOUNTING POLICIES INSURANCE AND INVESTMENT CONTRACTS
Classification of contracts Long-term insurance operations: Insurance contracts are those contracts where the Regent Life Group (the insurer) has accepted significant insurance risk from another party
(the policyholder) by agreeing to compensate the policyholder if a specified uncertain future event (the insured event) adversely affects the policyholder. As a general guideline, the Regent Life Group determines whether it has significant insurance risk, by comparing benefits paid with benefits payable if the insured event did not occur. Insurance contracts can also transfer financial risk.
Investment contracts are those contracts that transfer significant financial risk with no significant insurance risk. Financial risk is the risk of a possible future change in one or more of a specified interest rate, security price, commodity price, foreign exchange rate, a credit rating or credit index or other variable.
Once a contract has been classified as an insurance contract, it remains an insurance contract for the remainder of its lifetime, even if the insurance risk reduces significantly during this period, unless all rights and obligations are extinguished or expire. Investment contracts can however be reclassified as insurance contracts after inception, if insurance risk becomes significant.
Insurance contracts are classified into individual credit life contracts, individual life contracts, annuity contracts, group funeral, group life and group credit life contracts. This classification applies consistently across all long term insurers within Regent Life Group (being Regent South Africa, Lesotho National Life Assurance and Regent Life Botswana).
These contracts are valued in terms of the Financial Soundness Valuation (FSV) basis contained in SAP 104 issued by the Actuarial Society of South Africa.
The statutory actuary reviews the calculation of the liabilities under long-term insurance contracts and investment contracts annually at the statement of financial position date in accordance with prevailing legislation, Generally Accepted Actuarial Standards in South Africa and International Financial Reporting Standards as appropriate. The transfers to or from insurance liabilities are accounted for in the statement of comprehensive income and represents the increase or decrease in contract liabilities, including all necessary provisions and reserves.
The liabilities for investment contracts are set equal to the accumulated fair value of the underlying assets plus a non-unit reserve calculated in accordance with SAP 104. Any deficiency is immediately charged to profit and loss and a provision is raised for losses from the liability adequacy tests.
Investment contracts are initially and thereafter recognised at fair value, with changes in fair value being accounted for in the statement of comprehensive income. The premiums, benefit payments and investment earnings relating to these investment contracts have been excluded from the statement of comprehensive income and accounted for directly as movements in the liability.
Short-term insurance operations: Contracts under which the short-term insurance operations accept significant insurance risk from another party (the policyholder) by agreeing
to compensate the policyholder or other beneficiary if a specified uncertain future event (the insured event) adversely affects the policyholder, or other beneficiary, are classified as insurance contracts. Insurance risk is risk other than financial risk, transferred from the holder of the contract to the issuer. Financial risk is the risk of a possible future change in one or more of a specified interest rate, security price, commodity price, foreign exchange rate, index of prices or rates, a credit rating or credit index or other variable. Insurance contracts may also transfer some financial risk.
Reinsurance of long-term and short-term insurance operations: Contracts entered into with reinsurers by the long-term and short-term operations, under which the group is compensated for losses on one
or more contracts, and which meet the classification requirements for insurance contracts, are classified as reinsurance contracts held.
The benefits to which the long-term and short-term operations are entitled under their reinsurance contracts held are recognised as reinsurance assets, consisting of short-term and long-term balances due from reinsurers that are dependent on the expected claims and benefits. Reinsurance liabilities are primarily premiums payable and are recognised as an expense when due. Reinsurance assets are assessed for impairment on an annual basis, reducing the carrying amount of the reinsurance asset to its recoverable amount through the statement of comprehensive income.
Revenue recognition Long-term insurance operations: Premiums and annuity considerations on insurance contracts are recognised when due in terms of the contract, other than group schemes.
Premium receivable in respect of group schemes that is due after the year end date is ignored. However, where the operating ratios exceed 100%, a deficiency reserve would be established to offset any expected losses up until the next renewal date. Premium income on insurance contracts is shown gross of reinsurance. Premiums are shown before deduction of commission. Premium income received in advance is included in trade and other payables. Amounts received under investment contracts, such as premiums, are recorded as deposits to investment contract liabilities.

105
Short-term insurance operations: Gross written premiums comprise the premiums on insurance contracts entered into during the year, irrespective of whether they relate in
whole or in part to a later accounting period. Premiums are disclosed gross of commission to intermediaries and exclude Value Added Tax. Premiums written include adjustments to premiums written in the prior accounting periods. The earned portion of the premium received is recognised as revenue. Premiums are earned from the date of attachment of risk, over the indemnity period, based on the pattern of risks underwritten less provisions raised for cash-backs.
Insurance results Long-term insurance operations: Profits or losses are determined in accordance with the guidance note on Financial Soundness Valuations (SAP 104) and International Financial
Reporting Standards. The underlying philosophy of the Financial Soundness Valuation is to recognise profits over the term of each insurance contract. In the valuation of liabilities, provision is made for: > The best estimate of future experience; > Compulsory margins prescribed in SAP 104; and > Discretionary margins determined to release profits to shareholders consistent with policy design and company policy.
Short-term insurance operations: The underwriting results are determined after making provisions for unearned premiums, outstanding claims, incurred but not reported claims;
unexpired risk provision, cash-back provisions and such additional provisions as are considered necessary. The methods used to determine these provisions are as follows:
Unearned premiums Premiums are earned from the date the risk attaches, over the indemnity period, based on the pattern of the risk underwritten. Unearned
premiums, which represent the proportion of premiums written in the current year which relate to risks that have not expired by the end of the financial year, are calculated on the 365th basis for even risk business and other bases that best represent the unearned risk profile for uneven risk business.
Claims Claims incurred consist of claims and claims handling expenses paid during the financial year together with the movement in the provision for
outstanding claims. Claims outstanding comprise provisions for the estimate of the ultimate cost of settling all claims incurred but unpaid at the statement of financial position date whether reported or not, and an appropriate risk margin. Related anticipated reinsurance recoveries are disclosed separately as assets. These estimated reinsurance and other recoveries are assessed in a manner similar to the assessment of claims outstanding.
While the directors consider that the gross provisions for claims and the related reinsurance recoveries are fairly stated on the basis of the information currently available to them, the ultimate liability will vary as a result of subsequent information and events and may result in significant adjustments to the amounts provided. Adjustments to the amounts of claims provisions established in prior years are reflected in the financial statements for the period in which the adjustments are made, and disclosed separately if material. The methods used to value these provisions, and the estimates made, are reviewed regularly.
Incurred but not reported – IBNR Provision is made in the policyholders’ liabilities under insurance contracts for the estimated cost at the end of the year for claims IBNR at that
date. IBNR provisions are calculated using run-off triangle techniques or as a multiple, based on the average historical reporting delay, of the claims reported in the three weeks following the valuation date but where the claims event occurred prior to valuation date. These liabilities are not discounted due to the short-term nature of outstanding claims. Outstanding claims and benefit payments are stated gross of reinsurance.
Unexpired risk provision Provision is made for unexpired risks arising to the extent that the expected value of claims and claims handling expenses attributable to the
unexpired periods of contracts in force at the statement of financial position date exceeds the unearned premiums provision in relation to such contracts and attributable investment income after the deduction of any deferred acquisition costs.
Cash-back provisions A provision is made for the accrued expected obligations to policyholders to the extent that the premiums for these benefits are already
received and other terms and conditions are met within the period leading up to the expected cash back.
Deferred acquisition costs The costs of acquiring new and renewal insurance business that is commission and other acquisition costs, primarily related to the term
products of that business, are deferred. Deferred acquisition costs are amortised on a pro-rata basis over the contract term. Similarly, any reinsurance commissions received are deferred and recognised as income over the term of the reinsurance contract.
Cell Captives The group operates cell captives on behalf of entities that wish to participate in the insurance result of a particular category of insured risk.
Preference shares are issued to those participants giving them the right to share profits on an agreed basis. To reflect the substance of the transaction it is consolidated and the participant’s share of profits is treated as a non-controlling interest.

106 IMPERIAL HOLDINGS LIMITED Audited Annual Financial Statements for the year ended 30 June 2015
> ANNEXURE B – SUMMARY OF EMPLOYMENT EQUITY REPORT
Summary of global workforce 2015 2014
South African (including foreign nationals) 37 654 38 766Non-South African 13 707 12 905
Total workforce 51 361 51 671
Summary of the employment equity report terms of section 22 of the Employment Equity Act of South Africa
Male Female Foreign nationalsTotal2015
Total2014Occupational levels A C I W A C I W M F
Permanent staffTop management 1 1 6 90 6 3 4 7 2 120 159Senior management 27 10 41 340 13 5 16 77 529 588Professionally qualified and experienced specialists and mid-management 280 190 309 1 367 144 95 141 789 6 9 3 330 3 242Skilled technical and academically qualified workers, junior management, supervisors, foremen and superintendents 2 382 967 792 2 467 848 402 303 1 409 47 10 9 627 10 541Semi-skilled and discretionary decisions-making 9 360 1 738 623 921 2 344 818 404 1 205 70 18 17 501 15 200Unskilled and defined decision-making 4 040 576 93 59 1 091 152 4 17 35 2 6 069 6 421
16 090 3 482 1 864 5 244 4 446 1 475 872 3 504 158 41 37 176 36 151 Non-permanent staff 220 25 18 40 113 21 14 27 478 2 615
16 310 3 507 1 882 5 284 4 559 1 496 886 3 531 158 41 37 654 38 766
A = Africans; C = Coloureds; I = Indians; W = Whites
The above is an aggregation of all South African operating entities

107
Summary of global workforce 2015 2014
South African (including foreign nationals) 37 654 38 766Non-South African 13 707 12 905
Total workforce 51 361 51 671
Summary of the employment equity report terms of section 22 of the Employment Equity Act of South Africa
Male Female Foreign nationalsTotal2015
Total2014Occupational levels A C I W A C I W M F
Permanent staffTop management 1 1 6 90 6 3 4 7 2 120 159Senior management 27 10 41 340 13 5 16 77 529 588Professionally qualified and experienced specialists and mid-management 280 190 309 1 367 144 95 141 789 6 9 3 330 3 242Skilled technical and academically qualified workers, junior management, supervisors, foremen and superintendents 2 382 967 792 2 467 848 402 303 1 409 47 10 9 627 10 541Semi-skilled and discretionary decisions-making 9 360 1 738 623 921 2 344 818 404 1 205 70 18 17 501 15 200Unskilled and defined decision-making 4 040 576 93 59 1 091 152 4 17 35 2 6 069 6 421
16 090 3 482 1 864 5 244 4 446 1 475 872 3 504 158 41 37 176 36 151 Non-permanent staff 220 25 18 40 113 21 14 27 478 2 615
16 310 3 507 1 882 5 284 4 559 1 496 886 3 531 158 41 37 654 38 766
A = Africans; C = Coloureds; I = Indians; W = Whites
The above is an aggregation of all South African operating entities

CORPORATE INFORMATION
DIRECTORSNon-executiveTS Gcabashe* (Chairman)A Tugendhaft, (Deputy Chairman)P Cooper*GW Dempster*T Dingaan*P Langeni*MJ Leeming*MV MoosaRJA Sparks*Y Waja** Independent
EXECUTIVEMJ Lamberti (Chief Executive)M AkoojeeOS Arbee (Chief Financial Officer)MP de CanhaPB MichauxJJ StrydomM Swanepoel
Group Internal Audit ExecutiveG Nzalo, BCom, CA (SA), CIA
Group TreasurerWF Reitsma, BTech Banking, MCom, FIBSA, CAIB, PBSA, FIFM
Group Legal Advisor and Company SecretaryRA Venter, BCom, LLB, LLM
Investor Relations ManagerE. Mansingh email: [email protected]
Group Head of RiskBJ Francis, BCompt (Hons), CIA, MBA
Group Head of SustainabilityMR Sharfuddin, BBA, IMP (Insead)
Business address and registered officeImperial PlaceJeppe Quondam79 Boeing Road EastBedfordview2007
Postal address and contact numbersPO Box 3013Edenvale1610
Telephone +27 (0) 11 372 6500Facsimile +27 (0) 11 372 6550
Name and registration numberImperial Holdings Limited1946/021048/06
Share transfer secretariesComputershare Investor Services (Pty) Ltd70 Marshall StreetJohannesburg2001
PO Box 61051Marshalltown2107
Telephone +27 (0)11 370 5000Facsimile +27 (0)11 370 5487
Websitewww.imperial.co.za
JSE informationOrdinary share code: IPLISIN: ZAE000067211Preference share code: IPLPISIN: ZAE000088076
Shareholders’ diaryFinal dividend payment: 28 September 2015Annual general meeting: 3 November 2015Interim results released: 25 February 2016Final results released: 23 August 2016

IMPERIAL PLACEJEPPE QUONDAM79 BOEING ROAD EASTBEDFORDVIEW2007
PO BOX 3013EDENVALE1610SOUTH AFRICA
WWW.IMPERIAL.CO.ZA