lean capacity planning for tool room: an iterative system...
TRANSCRIPT

Advances in Production Engineering & Management ISSN 1854-6250 Volume 10 | Number 4 | December 2015 | pp 169–184 Journal home: apem-journal.org http://dx.doi.org/10.14743/apem2015.4.200 Original scientific paper
Lean capacity planning for tool room: An iterative system improvement approach Haider, A.a,*, Mirza, J.a, Ahmad, W. a aUniversity of Engineering and Technology, Department of Industrial Engineering, Taxila, Pakistan A B S T R A C T A R T I C L E I N F O Capacity planning helps to synchronize demands and production volumes, and assists in early preparedness for dealing with future production imbal-ances. A tool room of armored manufacturing organization was selected for this work study. Initially, a master production schedule and rough cut capaci-ty plans are prepared based on the delivery commitments of the organization. Time and motion study of the tool room for 28 weeks was performed to de-termine its current production capacity. It was observed that imbalance be-tween demands and production exists. An iterative system improvement strategy was proposed for exploring the potential of tool room. Lean concepts and methodologies were the essence of the proposed system improvement strategy. It was observed that WIP had been reduced by 18 %, production volumes had improved by 24 % and tardiness reduced by 28 %. This strengthened our belief that lean philosophy is equally applicable within the capacity planning domain. The capacity planning approach presented in this work study could also be generalized for other domains. This approach be-lieves in improving the potential through elimination of wastes, process im-provement, defect prevention and total preventative maintenance. This ap-proach improves the system optimally by utilizing existing resources availa-ble on the shop floor. This research will be further expanded towards the major production units of this organization. We are currently working on capacity planning for rebuilding the activities of T-80 UD battlefield tanks. © 2015 PEI, University of Maribor. All rights reserved.
Keywords: Capacity planning Lean thinking Manufacturing Tool room Simulation
*Corresponding author: [email protected] (Haider, A.)
Article history: Received 26 February 2015 Revised 3 October 2015 Accepted 20 October 2015
1. Introduction Capacity planning helps organizations to know their capabilities to produce. Organizations can respond to forthcoming production forecasts by exploiting this potential and maintaining de-sired rate of production. This proactive response can manage production imbalances and suc-ceeds in retaining existing customers. A transparent and smooth production flow owing to cus-tomer demands can help plan for expansion in business. Management can optimally assign re-sources and reduce costs incurred on carrying unnecessary inventories. Organizations make sensible commitments and systematically move forward with their customers. Furthermore, this helps organizations to design suitable facility layouts that can guarantee higher productivity and minimal costs. Capacity planning is dependent upon proper evaluation of certain input factors that may include raw material, plant downtime, inventory, workforce and market share [1].
Granularity of understanding can be improved by decomposition of capacity planning pro-cess. Initial level (0-level) performs resource planning for organization. At 0-level, key resources are defined to determine appropriate layout required for organization. Furthermore, infrastruc-
169
Haider, Mirza, Ahmad
ture and logistics requirement is established. Level-1 plans within the facility and determines requirements of workstations suitable for production activity. An estimated capacity from these workstations can be calculated based on available workstations and process flow. Level-2 de-composition identifies execution plans, how to monitor and control production activity. This level of decomposition determines inputs and output at shop floor. It is common practice to de-fine three level of capacity planning [2]. In an existing facility, capacity planning can be imple-mented through re-engineering. A re-engineering process for an existing facility will adopt bot-tom up strategy and will be reverse capacity planning activity [1, 3].
Mostly, organizations believe in ‘make to order strategy’ to produce desired production vol-umes. Fluctuations in demand may arise under certain circumstances. Such abrupt increases or decreases in demand will result in failure to meet customer demands. This situation will result in failure of ‘make to order’ strategy. Whenever, there exists possibilities that abrupt changes in demands may occur, organizations follow contingency plan by adopting lead or lag strategies for capacity planning. None of these strategies can be trusted altogether and each has its own pro-spects and consequences. Any increase in demand can be fulfilled by ‘production in advance’. This strategy will help in winning confidence of customers through timely delivery of product. ‘Production in advance’ will require extra space for additional products to store. In worst case situation, an abrupt drop in demand will cause salvage of overproduced products. Inventory carrying cost and wastage due to overproduction are two major drawbacks of lead or produc-tion in advance strategy. With ‘delayed production’, possibilities of drops in demand can be managed. In case of sudden escalation of demands, this strategy will not be able to fulfil custom-er demands and will subsequently result in losing the confidence of customers. Preferably, each organization must have its own customized capacity planning strategy exploiting blend of more than one strategy. Make to order strategy is suitable for low volume production activity and “lead” can be adopted for higher volume production. It is common practice that organizations run at lower than designed rates of production due to real life constraints and production losses [1-4].
In an existing facility, capacity planning can be implemented through re-engineering. A re-engineering process for an existing facility will adopt bottom up strategy and will be “reverse capacity planning” activity. Existing and proposed organizational setups can be modelled to sup-port capacity planning process. Proposed organizational setups result from implementation of capacity planning strategies e.g. value stream map in lean capacity planning process. Lean phi-losophy was implemented in capacity planning domain by Linne and Ekhall [3]. Authors pro-posed methodology to identify problems in capacity planning process and resolution of these problems through lean. Their work supported high level implementation of lean in capacity planning process. Their proposed solution can be taken as Pre-Capacity Planning Process lean implementation. It is useful to implement lean more rigorously during capacity planning pro-cess. An amalgam of lean and capacity planning process may result in cost effective capacity en-hancement. This research work proposes bottom up lean capacity planning strategy for an existing organ-izational setup. An integrated implementation of lean and capacity planning during re-engineering activity is presented. In this model, each level of capacity planning is given “lean attention”. Initially, lean is implemented at level-2 and its prospects improve level-1. Lean im-plementation at level-1 improves capacity planning process at 0-level. Proposed model will pro-vide better solution for effective capacity planning.
Remainder of the paper is organized as follows. Related work is outlined in Section 2. In section 3, we have briefly identified the problems being faced by tool room. Section 4, is about the capacity planning initiative taken in this research to study the existing capacity and future demands for tool room. Proposed capacity planning approach has been described in Section 5. In order to validate the suitability of proposed approach, performance measures have been dis-cussed in section 6. We have briefly discussed our experimental study in Section 7. Results are discussed in section 8 and reviewed and analyzed in Section 9. Section 10 is the last but not the least and concludes our research work and gives future directions.
170 Advances in Production Engineering & Management 10(4) 2015

Lean capacity planning for tool room: An iterative system improvement approach
2. Related work It is possible to identify issues and their root causes associated with a capacity planning process. Panacea to these issues can be found in lean principles [3]. These lean principles can be imple-mented in a capacity planning process. Based on this implementation, an improved model for capacity planning can be presented. This is high level application of lean in capacity planning process. Decomposition of capacity planning process allows implementation of lean principles and tools at lower levels. Introducing lean capacity planning process is preferable than imple-menting lean principles only on identified problem areas [3]. Production activities can be mod-elled using value stream maps (VSM) [5]. Furthermore, it is possible to analyse and review value stream maps and identify potential improvements. Well worked value stream maps can be used to identify starving, saturated and bottleneck stations. Simulation models can replace value stream maps to validate suggested improvements. Complimentary use of value stream map and simulation model can be suggested. Proactive and reactive lean logistics for resource planning phase of capacity planning are suggested using value stream map and identification of bottle-neck resources [5]. Capacity planning has also been extensively studied in service sector apart from manufacturing sector e.g. emergency departments of hospitals [6-7]. Long waiting times in queue affect provisioning of service to patients in hospital. Value stream mapping of current scenario can be used to identify root causes of long queues. Simulation model identified flaws in current resource planning with identification of possible improvements. These improvements can be iteratively used to identify suitable solution [8]. Alternate solutions achieved through iterative improvements provide flexibility to adopt suitable solution for enhanced capacity plan-ning. This approach was implemented in automotive sector of Thailand using Tecnomatrix soft-ware. Re-engineering the facility and inclusion of further resources to enhance capacity for esca-lated demands was achieved through simulation of fabrication shop models [9]. Identification of saturated and starved resources helped reduce workers and adjustment of arrival and indexed times for conveyors. This was also helpful to propose better layout and facility design. Similarly, excessive transportation and undesired motion of workforce can also be addressed through val-ue stream mapping [10].
Apart from value stream mapping, other lean methodologies like 5S, Meiruka and Kaizan helped propose “to-be” model from “as-is” model [11]. Regression analysis conducted on these methodologies determined the effectiveness of these methodologies. “Tam the” model improved the effectiveness of lean capacity planning process. This research study believes in utilizing bot-tom up lean methodology in capacity planning.
Reviewed literature shows that existing initiatives partially implement lean philosophy in ca-pacity planning. Lean capacity requirement planning can improve rough cut capacity plans and subsequently lean rough cut capacity plans can be used for better resource planning. Existing research is focused on lean resource planning and ignores lean capacity requirement planning and lean rough cut capacity plans.
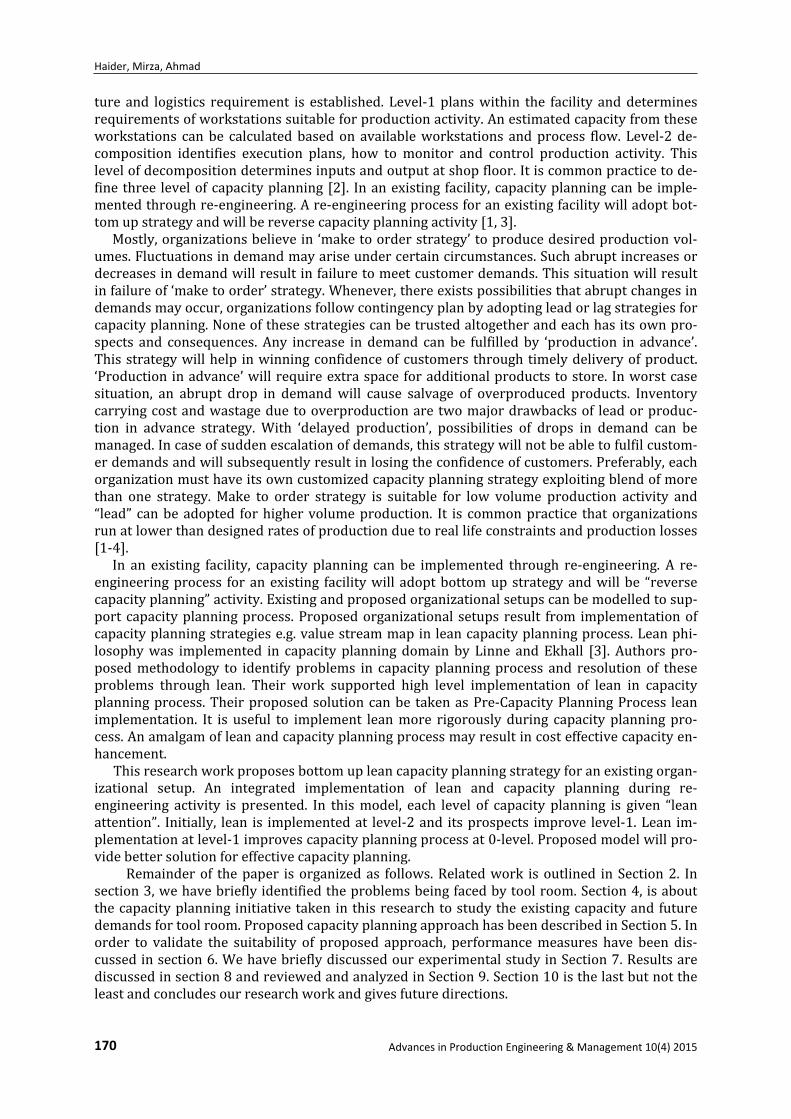
3. Problem statement Precision Defense Organization (PDO) is a strategic organization and is rebuilding and manufac-turing armored vehicles of Chinese, Russian and American origin. It has five major units for manufacturing and rebuilding of battlefield tanks, gun barrels, armored personnel carriers and self-propelled guns. These units have assembling, heat treatment, machining and fabrication shops. Manufacturing and rebuild of armored vehicles demands rigorous machining operations with special purpose tooling, jigs and fixtures. Special purpose tooling is required for complex and specific machining tasks e.g. machine gun holes etc. Tool manufacturing shop also known as tool room is primarily responsible to provide standard and special purpose tooling to these units. PDO believes in indigenous production of armored vehicles and discourages import of tooling, jigs and fixtures from abroad.
Advances in Production Engineering & Management 10(4) 2015 171
Haider, Mirza, Ahmad
Fig. 1 Manufacturing units of PDO
Senior management decides production targets keeping in view the strategic position of cus-tomer. Suppose a strategic decision is made to upgrade fleet of 500old t-type battlefield tanks. Customer demands completion of this task in five years. Senior management has no option other than upgrading 10 battlefield tanks in a month. This results in unwanted burden on major and supporting units. PDO has a team of experts who prepares master production schedules, rough cut capacity plans and bill of materials for these targets. This team prepares detailed demand of tooling, jigs and fixtures for tool room supervisors. Due to technical and managerial constraints, tool room suffers failure to manufacture demanded quantity of tooling. Some of the work orders are returned without any action due to heavy workload on machining facility of tool room. Spe-cial purpose tooling e.g. corn mill cutters and long shank drills are not available in local market.
There exist two alternatives to resolve this problem. Initially, PDO units seek help of local vendors for procurement of these tools. Inability of local vendors to provide special purpose tooling forces import of these tools from brotherly country, China. Import of these tooling is ex-pensive and time consuming activity. Long lead times of these tooling hamper the production activity and non-availability of tooling on time results in delayed production of final products. Customer keeps on sending armored vehicles according to promised schedules. Strategic assets get strangled at PDO with large work in process inventory and holds up. Held up vehicles, suffer wear and tear due to harsh weather as these wait for their turn. This results in weak strategic position of customer on its borders.
Senior management of PDO is more interested to provide viable delivery targets to its cus-tomer. These viable targets can be set after detailed analysis of existing system and proper ca-pacity planning. This study is aimed to provide solid foundations for capacity planning of tool room.
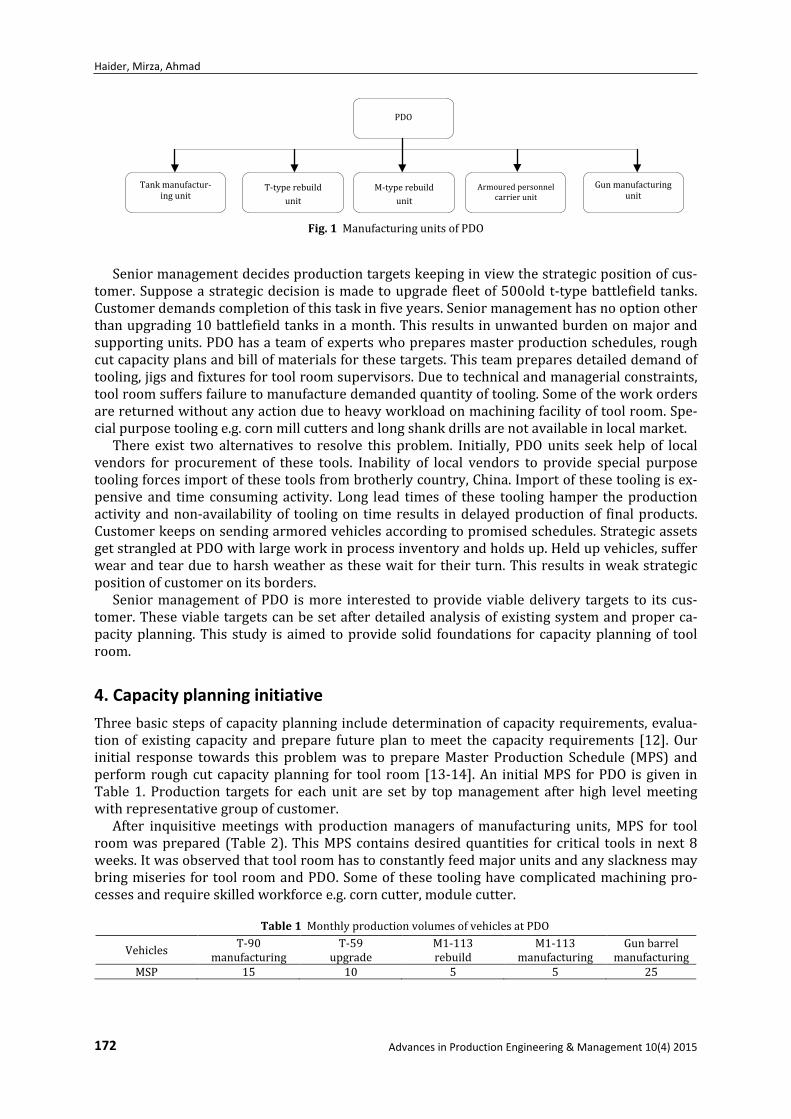
4. Capacity planning initiative Three basic steps of capacity planning include determination of capacity requirements, evalua-tion of existing capacity and prepare future plan to meet the capacity requirements [12]. Our initial response towards this problem was to prepare Master Production Schedule (MPS) and perform rough cut capacity planning for tool room [13-14]. An initial MPS for PDO is given in Table 1. Production targets for each unit are set by top management after high level meeting with representative group of customer.
After inquisitive meetings with production managers of manufacturing units, MPS for tool room was prepared (Table 2). This MPS contains desired quantities for critical tools in next 8 weeks. It was observed that tool room has to constantly feed major units and any slackness may bring miseries for tool room and PDO. Some of these tooling have complicated machining pro-cesses and require skilled workforce e.g. corn cutter, module cutter.
Table 1 Monthly production volumes of vehicles at PDO Vehicles T-90
manufacturing T-59
upgrade M1-113 rebuild
M1-113 manufacturing
Gun barrel manufacturing
MSP 15 10 5 5 25
Tank manufactur-ing unit
T-type rebuild unit
M-type rebuild unit
Armoured personnel carrier unit
Gun manufacturing unit
PDO
172 Advances in Production Engineering & Management 10(4) 2015

Lean capacity planning for tool room: An iterative system improvement approach
Table 2 MPS for tool room Part W1 W 2 W 3 W 4 W 5 W 6 W 7 W 8 Corn cutter 4 3 4 3 4 3 4 3 Side and face cutter 4 3 4 3 4 3 4 3 Module cutter 4 3 4 3 4 3 4 3 End mill cutter 4 3 4 3 4 3 4 3 Reamers 6 6 6 6 6 6 6 6 Drills 6 6 6 6 6 6 6 6 Miscellaneous shafts 6 6 6 6 6 6 6 6 Gears 5 6 5 6 5 6 5 6 MPS 39 36 39 36 39 36 39 36
Table 3 Typical MPS for corn cutter Week 1 2 3 4 5 6 7 8 Forecast 3 2 2 3 3 2 2 3 Projected available 0 2 1 1 0 2 1 1 MPS 0 4 3 4 3 4 3 4
We prepared MPS for each tooling and then individual MPS were summed up to make MPS for tool room. A typical MPS record for corn mill cutter is given in Table 3.It was supposed that there exists a beginning inventory of three corn cutters in tool room.
Our next step was to prepare rough cut capacity plan for tool room. Planning factor (α) for work centres defined in Eq. 1. We performed time and motion study of tool room for consecutive eight weeks. We observed sequence of processes, set up times, processing times, wait times, arrival times, man hours spent and idle times.
Planning factor work centre (wc) = 𝑃𝑃𝑃𝑃𝑃𝑃𝑃𝑃𝑃𝑃𝑃𝑃𝑃𝑃𝑃𝑃𝑃𝑃𝑃𝑃 𝑝𝑝𝑃𝑃𝑃𝑃 𝑝𝑝𝑝𝑝𝑃𝑃𝑝𝑝𝑝𝑝𝑃𝑃𝑝𝑝𝑝𝑝𝑡𝑡 𝑝𝑝𝑝𝑝𝑃𝑃𝑝𝑝𝑃𝑃 𝑝𝑝𝑃𝑃𝑃𝑃𝑝𝑝𝑝𝑝𝑃𝑃𝑃𝑃𝑝𝑝
(1)
We calculated total machining hours required for scheduled production of each part in tool room using Eq.2.
𝑊𝑊𝑊𝑊𝑊𝑊𝑊𝑊 𝑐𝑐𝑐𝑐𝑐𝑐𝑐𝑐𝑊𝑊𝑐𝑐 𝑇𝑇𝑇𝑇𝑇𝑇𝑐𝑐 = 𝑇𝑇𝑇𝑇𝑊𝑊𝑇𝑇𝑐𝑐𝑐𝑐 𝑄𝑄𝑐𝑐𝑄𝑄 × 𝑃𝑃𝑃𝑃𝑇𝑇𝑐𝑐𝑐𝑐𝑇𝑇𝑐𝑐𝑇𝑇 𝐹𝐹𝑇𝑇𝑐𝑐𝑐𝑐𝑊𝑊𝑊𝑊 (2)
Based on this time and motion study, processing times, parts produced, planning factor and machine hours for each part are given in Table 4.
Table 4 Rough cut capacity planning for tool room
Part Processing [h]
Parts produced [qty]
Planning factor [wc]
Target [qty]
Machining [h]
Corn cutter 1481.8 2.3 10.52 4 42.06 Side and face cutter 1362.5 2.5 8.89 4 35.56 Module cutter 1249.3 2.7 7.47 4 29.90 End mill cutter 861.52 4 3.55 4 14.22 Reamers 481.86 7 1.11 6 6.67 Drills 703 5 2.37 6 14.20 Miscellaneous shafts 405.73 8.5 0.79 6 4.73 Gears 1105.7 3.14 5.86 5 29.28
We determined percentage of processing time spent on manufacturing processes for each tooling using Eq. 3 and is given in Table 5.
𝑃𝑃𝑐𝑐𝑊𝑊𝑐𝑐𝑐𝑐𝑐𝑐𝑐𝑐𝑇𝑇𝑇𝑇𝑐𝑐 𝑝𝑝𝑊𝑊𝑊𝑊𝑐𝑐𝑐𝑐𝑝𝑝𝑝𝑝𝑇𝑇𝑐𝑐𝑇𝑇 𝑐𝑐𝑇𝑇𝑇𝑇𝑐𝑐 =𝑊𝑊𝑊𝑊𝑊𝑊𝑊𝑊𝑐𝑐𝑐𝑐𝑐𝑐𝑐𝑐𝑊𝑊𝑐𝑐 𝑐𝑐𝑇𝑇𝑇𝑇𝑐𝑐
𝑇𝑇𝑊𝑊𝑐𝑐𝑇𝑇𝑃𝑃 𝑝𝑝𝑊𝑊𝑊𝑊𝑐𝑐𝑐𝑐𝑝𝑝𝑝𝑝𝑇𝑇𝑐𝑐𝑇𝑇 𝑐𝑐𝑇𝑇𝑇𝑇𝑐𝑐 × 100 (3)
Advances in Production Engineering & Management 10(4) 2015 173
Haider, Mirza, Ahmad
Table 5 Percentage of processing time for tool production Part Heat treatment Turning Milling Grinding Other Corn cutter 20 20 35 20 5 Side and face cutter 15 25 45 15 0 Module cutter 15 20 40 20 5 End mill cutter 15 25 45 15 15 Reamers 10 25 50 10 5 Drills 10 25 50 10 5 Miscellaneous shafts 5 70 20 5 0 Gears 10 20 60 5 5
Processing time required for each manufacturing process to produce desired quantity of tool-ing in a week time is determined using Eq. 4 and is given in Table 6.
𝑃𝑃𝑊𝑊𝑊𝑊𝑐𝑐𝑐𝑐𝑝𝑝𝑝𝑝𝑇𝑇𝑐𝑐𝑇𝑇 𝑐𝑐𝑇𝑇𝑇𝑇𝑐𝑐 = 𝑃𝑃𝑐𝑐𝑊𝑊𝑐𝑐𝑐𝑐𝑐𝑐𝑐𝑐𝑇𝑇𝑇𝑇𝑐𝑐 𝑃𝑃𝑊𝑊𝑊𝑊𝑐𝑐𝑐𝑐𝑝𝑝𝑝𝑝𝑇𝑇𝑐𝑐𝑇𝑇 𝑇𝑇𝑇𝑇𝑇𝑇𝑐𝑐 × 𝑊𝑊𝑊𝑊𝑊𝑊𝑊𝑊𝑐𝑐𝑐𝑐𝑐𝑐𝑐𝑐𝑊𝑊𝑐𝑐 ℎ𝑊𝑊𝑝𝑝 (4)
Table 6 Processing time for tool production (h) Part Heat treatment Turning Milling Grinding Other Corn cutter 8.41 8.41 14.72 8.41 2.10 Side and face cutter 5.33 8.89 16.00 5.33 0.00 Module cutter 4.49 5.98 11.96 5.98 1.50 End mill cutter 2.13 3.56 6.40 2.13 2.13 Reamers 0.67 1.67 3.34 0.67 0.33 Drills 1.42 3.55 7.10 1.42 0.71 Miscellaneous shafts 0.24 3.31 0.95 0.24 0.00 Gears 2.93 5.86 17.57 1.46 1.46
It is true that capacity plan and MPS helped to understand the demand of customer and iden-tified the shortcomings of the existing system. An important step in capacity planning was to determine whether the tool room is capable to work according to MPS and rough cut capacity plan. Research analysis of existing system performed over 8 weeks, necessitated process im-provement to fulfil targeted deliveries reflected in MPS.
In order to exploit the potential of tool room and synchronize demand and production, it was decided to model the existing system and identify grey areas hampering production capability of the existing system.
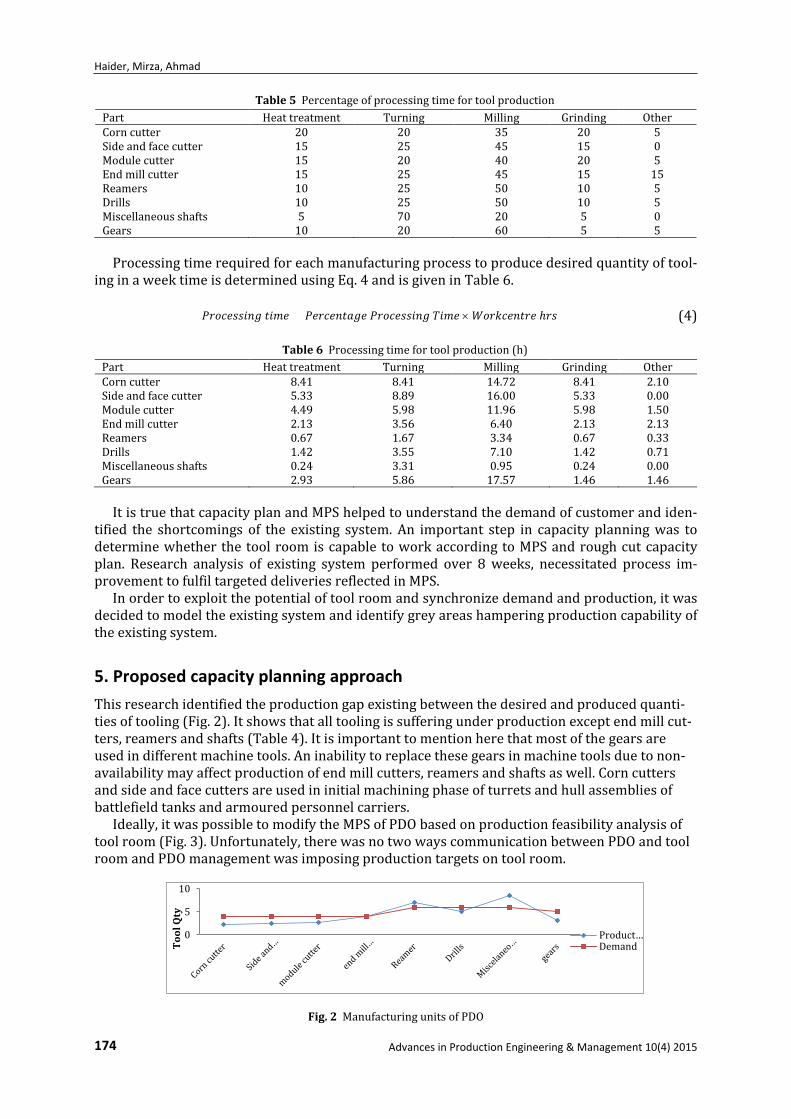
5. Proposed capacity planning approach This research identified the production gap existing between the desired and produced quanti-ties of tooling (Fig. 2). It shows that all tooling is suffering under production except end mill cut-ters, reamers and shafts (Table 4). It is important to mention here that most of the gears are used in different machine tools. An inability to replace these gears in machine tools due to non-availability may affect production of end mill cutters, reamers and shafts as well. Corn cutters and side and face cutters are used in initial machining phase of turrets and hull assemblies of battlefield tanks and armoured personnel carriers.
Ideally, it was possible to modify the MPS of PDO based on production feasibility analysis of tool room (Fig. 3). Unfortunately, there was no two ways communication between PDO and tool room and PDO management was imposing production targets on tool room.
Fig. 2 Manufacturing units of PDO
0
5
10
Tool
Qty
Product…Demand
174 Advances in Production Engineering & Management 10(4) 2015

Lean capacity planning for tool room: An iterative system improvement approach
Fig. 3 Ideal capacity planning strategy
Fig. 4 Proposed capacity planning strategy
Our proposed iterative improvement strategy to tune demands and production is shown in Fig.4. This proposed approach was developed on motivation from genetic algorithms and com-putational intelligence domain [15].
Objective and candidate MPS are prepared using MPS of PDO and analysis of existing system respectively. If objective and candidate MPS of tool room are equivalent, candidate MPS becomes final MPS for tool room. In case of non-equivalence, iterative strategy for process improvement is implemented. A rough cut capacity plan is prepared using candidate MPS of tool room and is thoroughly reviewed for system and process improvements. Improved system is modelled and simulated for preparation of refined and improved candidate MPS of tool room. These steps are repeated for iterative improvement until objective and candidate MPS are equivalent. Although our proposed approach is specific to capacity planning of PDO tool room, yet it can also be equal-ly used in other domains.
In proposed approach, we have used lean thinking for system improvement. Lean principles used in our approach for continuous improvement are given in Fig. 5.
Fig. 5 Lean methodologies for system improvement
Elimination of wastes
Process improvement
Total preventive maintenance
Defect prevention
Existing system Improved system
MPS of PDO MPS of tool room Rough cut capaci-ty plan
Tool room perfor-mance analysis
Yes
No
Objective MPS of tool room
MPS of PDO
Equivalent
MPS of tool room
Analysis of existing system
Analysis of plan System im-provements
Modelling and simulation
Result analysis
Rough cut capacity plan
Candidate MPS of tool room
Advances in Production Engineering & Management 10(4) 2015 175
Haider, Mirza, Ahmad
6. Performance measures and evaluation criteria Performance measures to evaluate the usefulness of peoposed approach are defined as:
• Production volumes • Work in process (WIP) inventory • Mean flow times • Mean tardiness • Mean queue times
6.1 Production volumes
Productivity of a system is called its throughput and is gauged by the production volumes of the system. Objectively, production volumes of a system must match the demanded quantities.
6.2 Work in process (WIP)
Unfinished parts present in a system for value addition are termed as work in process (WIP) inventory[11]. Lower WIP inventory is an indication of efficient system. Preferably, WIP should be equal to the number of work cenres in the system. Thus WIP can never be lower than the number of work centres. If 𝑊𝑊𝑊𝑊𝑃𝑃 > # 𝑊𝑊𝑊𝑊𝑊𝑊𝑊𝑊 𝑐𝑐𝑐𝑐𝑐𝑐𝑐𝑐𝑊𝑊𝑐𝑐𝑝𝑝 then system is in saturation state else if 𝑊𝑊𝑊𝑊𝑃𝑃 < # 𝑊𝑊𝑊𝑊𝑊𝑊𝑊𝑊 𝑐𝑐𝑐𝑐𝑐𝑐𝑐𝑐𝑊𝑊𝑐𝑐𝑝𝑝 then system is in starvation state.
6.3 Mean flow times
It is the time spent by a part as WIP in the system and is also known as time in process (TIP) or process time [17-18]. Less mean flow times can be helpful to reduce WIP and improve production capacity of a manufacturing setup.
6.4 Mean tardiness
Any lateness in delivering the targeted production is termed as tardiness. Tardiness shows an inefficiency of the system and is discouraged by production managers. Ideally, there should be zero tardiness in delivering the targeted production volumes.
6.5 Mean queue times
It is total waiting time spent by a part in queues before some value addition at work centres. When WIP is equal to number of workstations, mean queue time is zero.
7. Experimental study Our research encompasses 28 weeks time and motion study of tool room. Initial three steps of our proposed approach that inlcude preparation of candidate MPS, rough cut capacity plan and system analysis have already been performed in sections 3 and 4. Our next step in proposed methodolgy is to improve the system. It was discussed in section 4 that we have used lean thinking for system improvement. These proposed lean improvents are discussed as under;
7.1 Elimination of wastes
Lean identifies seven types of wastes in production systems. Elimination of these wastes helps to reduce flow times of parts produced.Some wastes found in tool room were due to poor layout and facility design. These wastes include undue transportation of tools and movement of work force. Other wastes in tool room include improper utilization of resources and long wait times before value addition.
This work addressed these wastes through re-arrangment of work centres after generation of part families and making of cells (Table 7). Inorder to optimize resource utilization and reduce wait times, one piece flow strategy was implemented.
176 Advances in Production Engineering & Management 10(4) 2015
Lean capacity planning for tool room: An iterative system improvement approach
Table 7 Identification of part families [16] Serial
No Part Family Parts
1 Cutter family Side and face cutter, Hobbing cutter, Corn mill cutter, End mill cutter, Slit saw cutter, module cutter
2 Reamer & drill family Taper drill, Twist shank drill, Reamers 3 Gear family Worm, Bevel, Spur gears 4 Lathe tool family Right, left turning tool, parting tool, grooving
tool, universal turning tool, 3&4 Jaw chucks 5 Gauge family Ring, Snap, Plug gauges 6 Jigs and fixture family Fixtures
7.2 Process improvement
Kaizan highlighted that system must be evoloved through continuous improvement.Our first initiative was to ensure quick changeover of tooling by inclusion of automatic tool changers on machines. We also identified starving and saturated stations and enhanced bottleneck work centres in number and improved value added manhours. Improvement in value added manhours was achieved through reduction in breakdown time and mean time to failure. This was achieved by ensuring the availability of inventory for frequently wearing and tearing parts of machine tools [20].
Arrival time of parts to the tool room from heat treatment shop was adjusted using input analyzer of Arena 10.0 and using poisson distribution. These requirements were communicated to manager of heat treatment shop for adherence.
7.3 Defect prevention
Production of defect free tooling is very important to meet delivery targets. Most of the parts in tool room were being rejected due to variations in heat treatment aspect of cutters. Unnecessary annealing and hardening made machining processes impossible on some parts. We suggested preparation of process sheets, inspection manuals and quality assurance for heat treatment pro-cess to prevent scrapping of tooling after hardening and annealing processes.
Secondly, we suggested improvements in programming blocks of numeric controlled ma-chines to avoid manual errors caused by operators.
7.4 Total preventive maintenance
We observed long breakdown times for some work centres especially gear lathe and universal grinding machines due to non-availability of different machine tool parts. As discussed earlier, we have ensured that breakdown time is minimized through preventive maintenance and avail-ability of frequently wearing out parts in inventory.
We modelled and simulated the improved system using Arena 10.0. Experimental results are discussed in Section 8.
8. Experimental results Results obtained after simulation of improved system were analysed and reviewed with focus on predefined performance measures [19]. These findings are discussed as under;
8.1 Production volumes
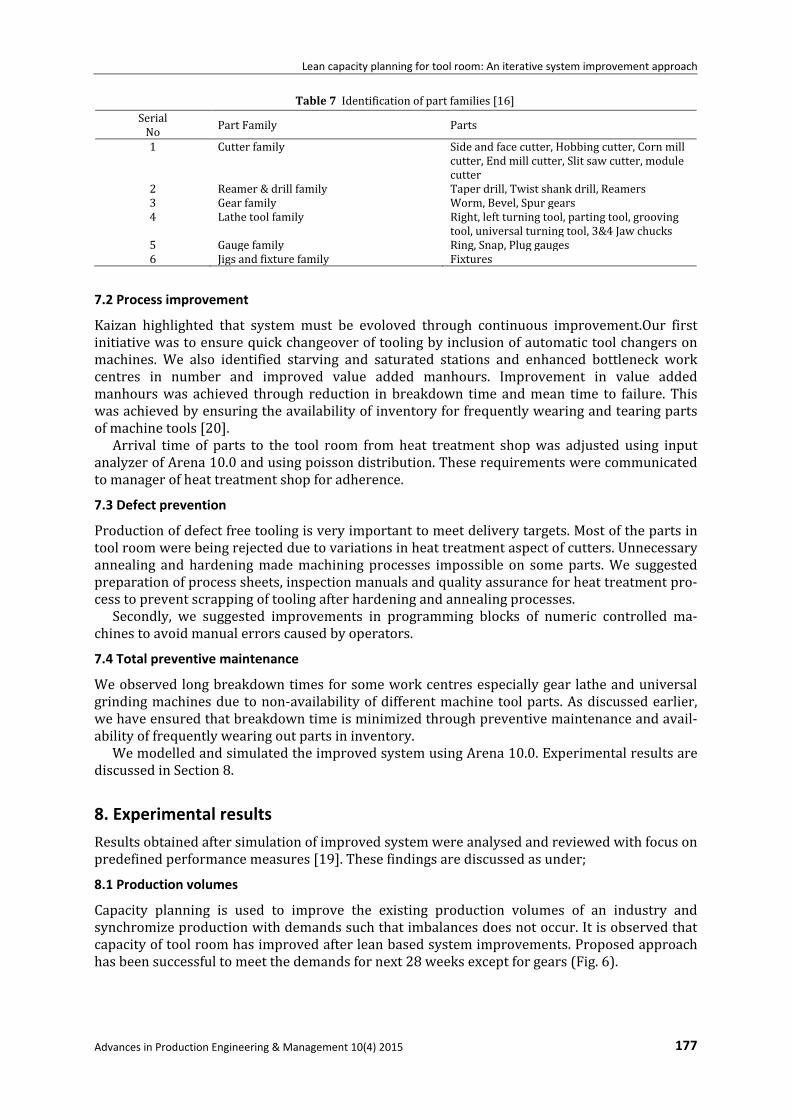
Capacity planning is used to improve the existing production volumes of an industry and synchromize production with demands such that imbalances does not occur. It is observed that capacity of tool room has improved after lean based system improvements. Proposed approach has been successful to meet the demands for next 28 weeks except for gears (Fig. 6).
Advances in Production Engineering & Management 10(4) 2015 177
Haider, Mirza, Ahmad
Fig. 6 Lean capacity planning of pool room
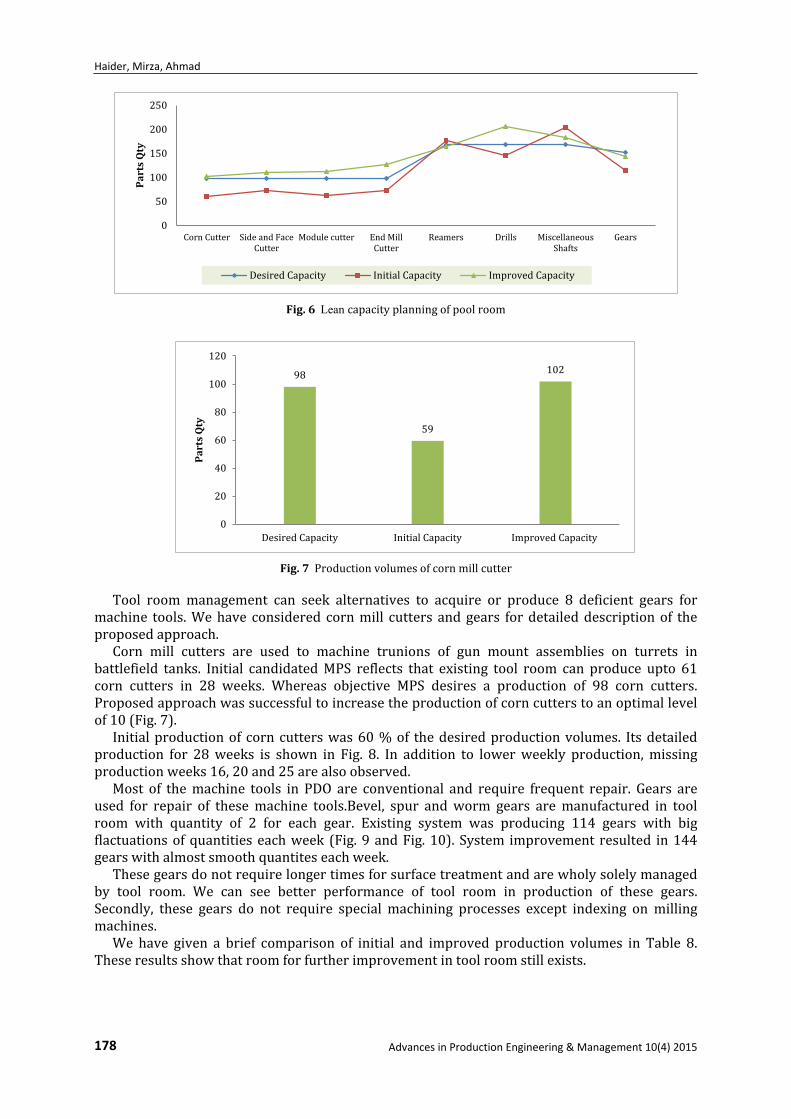
Fig. 7 Production volumes of corn mill cutter
Tool room management can seek alternatives to acquire or produce 8 deficient gears for machine tools. We have considered corn mill cutters and gears for detailed description of the proposed approach.
Corn mill cutters are used to machine trunions of gun mount assemblies on turrets in battlefield tanks. Initial candidated MPS reflects that existing tool room can produce upto 61 corn cutters in 28 weeks. Whereas objective MPS desires a production of 98 corn cutters. Proposed approach was successful to increase the production of corn cutters to an optimal level of 10 (Fig. 7).
Initial production of corn cutters was 60 % of the desired production volumes. Its detailed production for 28 weeks is shown in Fig. 8. In addition to lower weekly production, missing production weeks 16, 20 and 25 are also observed.
Most of the machine tools in PDO are conventional and require frequent repair. Gears are used for repair of these machine tools.Bevel, spur and worm gears are manufactured in tool room with quantity of 2 for each gear. Existing system was producing 114 gears with big flactuations of quantities each week (Fig. 9 and Fig. 10). System improvement resulted in 144 gears with almost smooth quantites each week.
These gears do not require longer times for surface treatment and are wholy solely managed by tool room. We can see better performance of tool room in production of these gears. Secondly, these gears do not require special machining processes except indexing on milling machines.
We have given a brief comparison of initial and improved production volumes in Table 8. These results show that room for further improvement in tool room still exists.
0
50
100
150
200
250
Corn Cutter Side and FaceCutter
Module cutter End MillCutter
Reamers Drills MiscellaneousShafts
Gears
Part
s Q
ty
Desired Capacity Initial Capacity Improved Capacity
98
59
102
0
20
40
60
80
100
120
Desired Capacity Initial Capacity Improved Capacity
Part
s Q
ty
178 Advances in Production Engineering & Management 10(4) 2015

Lean capacity planning for tool room: An iterative system improvement approach
Fig. 8 Production volumes of corn mill cutter
Fig. 9 Production volumes of gears
Fig. 10 Production volumes of gears
Table 8 Comparison of production volumes
Part Desired capacity Initial capacity Improved capacity Corn cutter 98 59 102 Side and face cutter 98 72 111 Module cutter 98 63 112 End mill cutter 98 73 127 Reamers 168 176 165 Drills 168 146 205 Miscellaneous shafts 168 204 183 Gears 152 114 144
1,00
1,50
2,00
2,50
3,00
3,50
4,00
W1 W2 W3 W4 W5 W6 W7 W8 W9 W10 W11 W12 W13 W14 W15 W16 W17 W18 W19 W20 W21 W22 W23 W24 W25 W26 W27 W28
Part
s Q
ty
Initial Improved
152
114
144
020406080
100120140160
Desired Capacity Initial Capacity Improved Capacity
Part
s Q
ty
1,00
2,00
3,00
4,00
5,00
6,00
7,00
W1 W2 W3 W4 W5 W6 W7 W8 W9 W10W11W12W13W14W15W16W17W18W19W20W21W22W23W24W25W26W27W28
Part
s Q
ty
Initial Improved
Advances in Production Engineering & Management 10(4) 2015 179

Haider, Mirza, Ahmad
8.2 Mean work in process (WIP) inventory
Ideally WIP should be equal to the number of work centres in a manufacturing setup. An improvement in mean WIP for proposed approach was noted. But it was still greater than no. of work centres in the system. There were 11 work centres in the system.
Fig. 11 Mean WIP inventory
8.3 Mean tardiness
This performance measures indicates deviation from promised delivery dates. Mean tardiness is measured in hours and it is for whole period of 28 weeks (Table 9). Comparatively, improved system has shown considerable improvements in reducing the tardy jobs. It is interesting to discuss that despite improvements in arrival times, transportation times, set up times and reduction in WIP, the improved system is also having tardiness. Further investigations showed that there are few tardy weeks for corn cutter, module cutters and gears. There is no tardy week for side and face cutters and drills. But there are many tardy weeks for end mill cutters, reamers and shafts. Although, improved system is having tardy weeks, it is still performing good in delivery of tooling to the major units(Fig. 12).
Table 9 Mean tardiness of tool room
Part Initial mean tardiness Improved mean tardiness Corn cutter -5755.01 -42.00 Side and face cutter -4581.63 0.00 Module cutter -3841.81 -37.29 End mill cutter -9863.78 -300.86 Reamers 0.00 -360.23 Drills -2908.78 0.00 Miscellaneous shafts -39.9704 -201.84 Gears -5755.01 -42.00
Fig. 12 Mean tardiness for improved and initial systems
8
10
12
14
16
18
Mea
n W
IP
Existing Improved
-12000,00
-10000,00
-8000,00
-6000,00
-4000,00
-2000,00
0,00Corn Cutter Side and Face
CutterModule cutter End Mill Cutter Reamers Drills Miscellaneous
ShaftsGears
Tard
ines
s (h
rs)
Improved Initial
180 Advances in Production Engineering & Management 10(4) 2015

Lean capacity planning for tool room: An iterative system improvement approach
8.4 Mean queue times
This performance measure was included to reveal the reasons for tardy jobs, observed in section 8.3. We studied only those work centres that were having long queue times for improved system aswell. Intitally, we studied tool grinding machine (Fig. 13). Except gears and shafts, all parts are visiting this work centre. Improved system was having mean queue times for the parts , but these were acceptable and can not contribute to tardiness of the job.
Mean queue times on tool mill and vertical grinder indicated the reasons for delayed delivery of parts. End mill cutters and module cutters visited these work centres and were resultantly having tardiness due to longer queue times (Fig. 14).
Tool mills are used for reamers and cutters and longer queue times on this work centre contributed to overall delay in production of reamers and cutters (Fig. 15).
Fig. 13 Mean queue times for tool grinder
Fig. 14 Mean queue times for vertical grinder
0
100
200
300
400
500
600
700
800
Mea
n Qu
eue
Tim
es (h
rs)
Initial Improved
0
50
100
150
200
250
300
Mea
n Qu
eue
Tim
es (h
rs)
Initial Improved
Advances in Production Engineering & Management 10(4) 2015 181

Haider, Mirza, Ahmad
Fig. 15 Mean queue times for tool mill
9. Review and analysis of results This section is essence of our research and explains lean based system improvement initiatives taken during this study.
Going through results discussed in previous sections, it can be inferred that WIP is larger than work centres, tool room is having waste of overproduction, toolings are having tardiness and resources are saturated due to long queue times. System improvement strategy for iterative improvement is discussed in Table 11.
This research emphasized on elimination of wastes to improve capacity of organization. Results indicate that proposed system is having waste of overproduction. How to eliminate this waste to improve the system? Overproduction can be eliminated by restricting the issuance of blanks to tool room for value addition. Alternatively, operations supervisor can maintain the counts of parts produced and stop processing on further parts or components. What will be the benefit of controlling overproduction? It will be helpful to reduce queue times on bottleneck work centres and alleviate state of saturation.
Tardiness and larger WIP can be controlled by adjusting arrival times of blanks from heat treatment shops. If work centres are producing almost desired quantity of products, it is insane to increase arrival times and cause saturation of work centres. Arrival times in imrpoved system are manually managed and can be re-adjusted to suit one piece flow production. Although, control on overproduction will be helpful to improve WIP yet reduction of processing times on saturated work centres can be equally useful.
Every production unit has 10 % of quality allowance for defective parts and unexpected situations. We have reduced this allowance to 2 percent in our workstudy.
Each work centre is assigned mean time to failure based on work history of existing system. Preventive maintenance of work centres can be used to improve this time. An improvement in this time will result in quick processing of toolings on work centres and will reduce queue times. Mean time to failure can be improved through periodic inspection of work centres and availability of alternative in case of failures.
This work used this type of system improvement suggestions during each iteration. Last iteration was left to present overall working of proposed approach.
Table 11 Iterative system improvement approach
Serial No. Lean improvement System improvement initiatives
1 Elimination of wastes Overproduction control 2 System improvement Fixing blank quantity, Adjusting arrival times,
Improving process times 3 Defect prevention 2per cent quality waste 4 Total preventive maintenance Revisiting breakdown times
0
50
100
150
200
250
300
350
400
W1
W2
W3
W4
W5
W6
W7
W8
W9
W10
W11
W12
W13
W14
W15
W16
W17
W18
W19
W20
W21
W22
W23
W24
W25
W26
W27
W28
Mea
n Qu
eue
Tim
es (h
rs)
Initial Improved
182 Advances in Production Engineering & Management 10(4) 2015
Lean capacity planning for tool room: An iterative system improvement approach
10. Conclusion and future work This study has proposed an iterative improvement strategy using lean concepts and
methodologies. Although, proposed strategy is for tool room capacity planning yet it can be equally used for other domains as well. Proposed approach was validated through modelling and simulation of tool room. Actual execution of the approach can be used to assess its true suitability. It was assumed that breakdown times of work centres have been controlled. Inability to control these times in real implementation will deter the performance of our proposed approach. Despite the requirement of defined quantities of toolings for major units, there might occur situations that require additional tooling for normal production process. Our research has also considered this situation. This approach has suggested minor changes in design and layout of tool room to reduce trasnportation of parts and motion of workforce. Besides PDO management, whether senior management of other organizations will be interested to relocate work centres for suggested changes in layout. This might hamper suitability of our proposed approach in other domains.
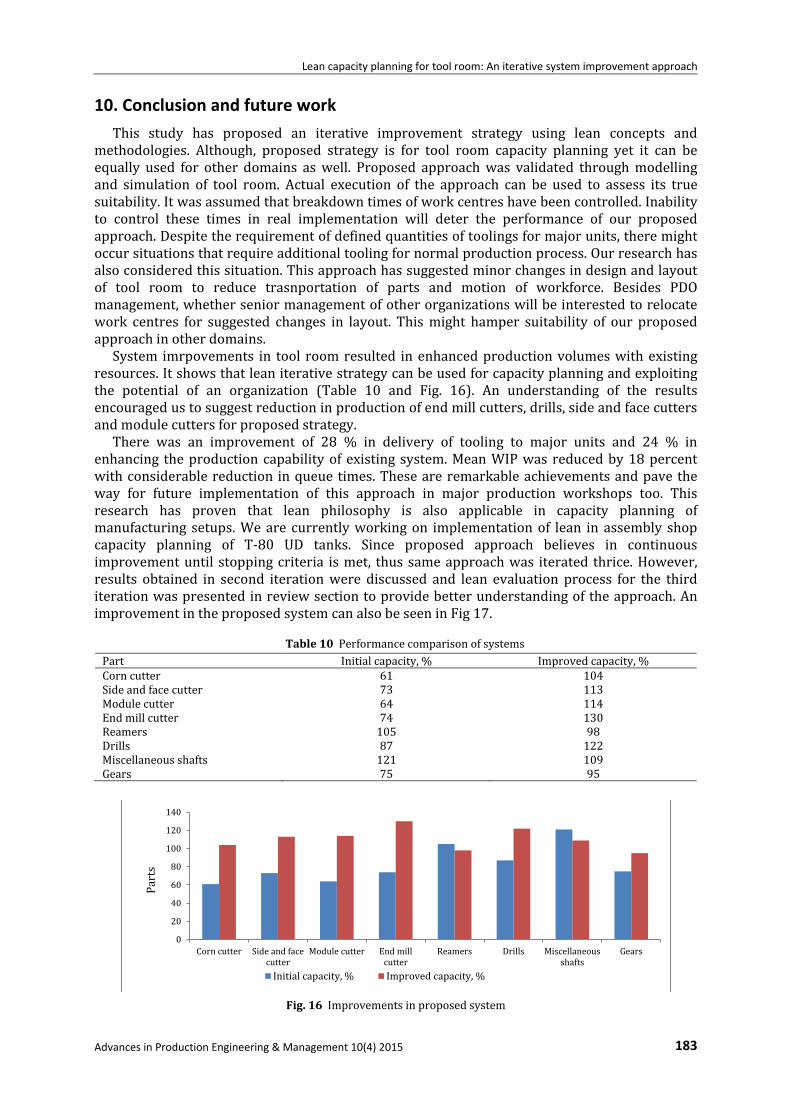
System imrpovements in tool room resulted in enhanced production volumes with existing resources. It shows that lean iterative strategy can be used for capacity planning and exploiting the potential of an organization (Table 10 and Fig. 16). An understanding of the results encouraged us to suggest reduction in production of end mill cutters, drills, side and face cutters and module cutters for proposed strategy.
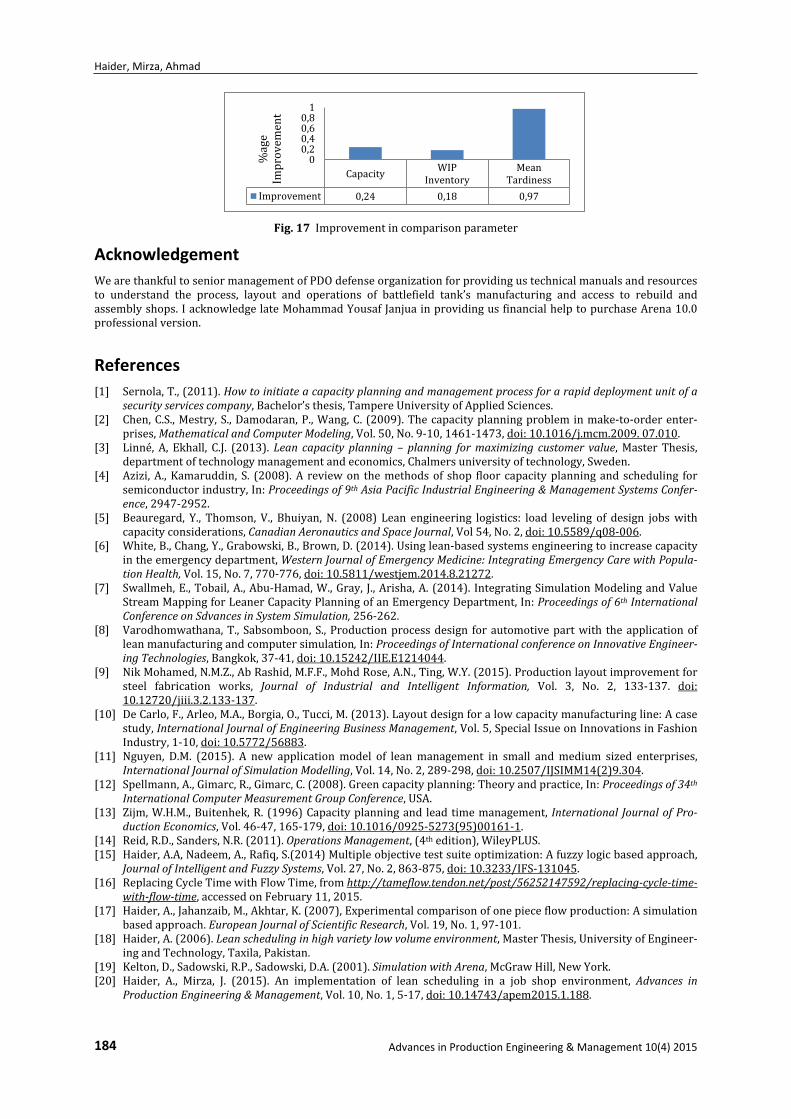
There was an improvement of 28 % in delivery of tooling to major units and 24 % in enhancing the production capability of existing system. Mean WIP was reduced by 18 percent with considerable reduction in queue times. These are remarkable achievements and pave the way for future implementation of this approach in major production workshops too. This research has proven that lean philosophy is also applicable in capacity planning of manufacturing setups. We are currently working on implementation of lean in assembly shop capacity planning of T-80 UD tanks. Since proposed approach believes in continuous improvement until stopping criteria is met, thus same approach was iterated thrice. However, results obtained in second iteration were discussed and lean evaluation process for the third iteration was presented in review section to provide better understanding of the approach. An improvement in the proposed system can also be seen in Fig 17.
Table 10 Performance comparison of systems Part Initial capacity, % Improved capacity, % Corn cutter 61 104 Side and face cutter 73 113 Module cutter 64 114 End mill cutter 74 130 Reamers 105 98 Drills 87 122 Miscellaneous shafts 121 109 Gears 75 95
Fig. 16 Improvements in proposed system
0
20
40
60
80
100
120
140
Corn cutter Side and facecutter
Module cutter End millcutter
Reamers Drills Miscellaneousshafts
Gears
Initial capacity, % Improved capacity, %
Part
s
Advances in Production Engineering & Management 10(4) 2015 183
Haider, Mirza, Ahmad
Fig. 17 Improvement in comparison parameter
Acknowledgement We are thankful to senior management of PDO defense organization for providing us technical manuals and resources to understand the process, layout and operations of battlefield tank’s manufacturing and access to rebuild and assembly shops. I acknowledge late Mohammad Yousaf Janjua in providing us financial help to purchase Arena 10.0 professional version.
References [1] Sernola, T., (2011). How to initiate a capacity planning and management process for a rapid deployment unit of a
security services company, Bachelor’s thesis, Tampere University of Applied Sciences. [2] Chen, C.S., Mestry, S., Damodaran, P., Wang, C. (2009). The capacity planning problem in make-to-order enter-
prises, Mathematical and Computer Modeling, Vol. 50, No. 9-10, 1461-1473, doi: 10.1016/j.mcm.2009. 07.010. [3] Linné, A, Ekhall, C.J. (2013). Lean capacity planning – planning for maximizing customer value, Master Thesis,
department of technology management and economics, Chalmers university of technology, Sweden. [4] Azizi, A., Kamaruddin, S. (2008). A review on the methods of shop floor capacity planning and scheduling for
semiconductor industry, In: Proceedings of 9th Asia Pacific Industrial Engineering & Management Systems Confer-ence, 2947-2952.
[5] Beauregard, Y., Thomson, V., Bhuiyan, N. (2008) Lean engineering logistics: load leveling of design jobs with capacity considerations, Canadian Aeronautics and Space Journal, Vol 54, No. 2, doi: 10.5589/q08-006.
[6] White, B., Chang, Y., Grabowski, B., Brown, D. (2014). Using lean-based systems engineering to increase capacity in the emergency department, Western Journal of Emergency Medicine: Integrating Emergency Care with Popula-tion Health, Vol. 15, No. 7, 770-776, doi: 10.5811/westjem.2014.8.21272.
[7] Swallmeh, E., Tobail, A., Abu-Hamad, W., Gray, J., Arisha, A. (2014). Integrating Simulation Modeling and Value Stream Mapping for Leaner Capacity Planning of an Emergency Department, In: Proceedings of 6th International Conference on Sdvances in System Simulation, 256-262.
[8] Varodhomwathana, T., Sabsomboon, S., Production process design for automotive part with the application of lean manufacturing and computer simulation, In: Proceedings of International conference on Innovative Engineer-ing Technologies, Bangkok, 37-41, doi: 10.15242/IIE.E1214044.
[9] Nik Mohamed, N.M.Z., Ab Rashid, M.F.F., Mohd Rose, A.N., Ting, W.Y. (2015). Production layout improvement for steel fabrication works, Journal of Industrial and Intelligent Information, Vol. 3, No. 2, 133-137. doi: 10.12720/jiii.3.2.133-137.
[10] De Carlo, F., Arleo, M.A., Borgia, O., Tucci, M. (2013). Layout design for a low capacity manufacturing line: A case study, International Journal of Engineering Business Management, Vol. 5, Special Issue on Innovations in Fashion Industry, 1-10, doi: 10.5772/56883.
[11] Nguyen, D.M. (2015). A new application model of lean management in small and medium sized enterprises, International Journal of Simulation Modelling, Vol. 14, No. 2, 289-298, doi: 10.2507/IJSIMM14(2)9.304.
[12] Spellmann, A., Gimarc, R., Gimarc, C. (2008). Green capacity planning: Theory and practice, In: Proceedings of 34th International Computer Measurement Group Conference, USA.
[13] Zijm, W.H.M., Buitenhek, R. (1996) Capacity planning and lead time management, International Journal of Pro-duction Economics, Vol. 46-47, 165-179, doi: 10.1016/0925-5273(95)00161-1.
[14] Reid, R.D., Sanders, N.R. (2011). Operations Management, (4th edition), WileyPLUS. [15] Haider, A.A, Nadeem, A., Rafiq, S.(2014) Multiple objective test suite optimization: A fuzzy logic based approach,
Journal of Intelligent and Fuzzy Systems, Vol. 27, No. 2, 863-875, doi: 10.3233/IFS-131045. [16] Replacing Cycle Time with Flow Time, from http://tameflow.tendon.net/post/56252147592/replacing-cycle-time-
with-flow-time, accessed on February 11, 2015. [17] Haider, A., Jahanzaib, M., Akhtar, K. (2007), Experimental comparison of one piece flow production: A simulation
based approach. European Journal of Scientific Research, Vol. 19, No. 1, 97-101. [18] Haider, A. (2006). Lean scheduling in high variety low volume environment, Master Thesis, University of Engineer-
ing and Technology, Taxila, Pakistan. [19] Kelton, D., Sadowski, R.P., Sadowski, D.A. (2001). Simulation with Arena, McGraw Hill, New York. [20] Haider, A., Mirza, J. (2015). An implementation of lean scheduling in a job shop environment, Advances in
Production Engineering & Management, Vol. 10, No. 1, 5-17, doi: 10.14743/apem2015.1.188.
Capacity WIPInventory
MeanTardiness
Improvement 0,24 0,18 0,97
00,20,40,60,8
1
%ag
e Im
prov
emen
t
184 Advances in Production Engineering & Management 10(4) 2015