lean six sigma
TRANSCRIPT
Copyright © 2012 by Sheila Shaffie and Shahbaz Shahbazi. All rights reserved. Except aspermitted under the United States Copyright Act of 1976, no part of this publication maybe reproduced or distributed in any form or by any means, or stored in a database orretrieval system, without the prior written permission of the publisher.
ISBN: 978-0-07-175085-1MHID: 0-07-175085-1
The material in this eBook also appears in the print version of this title: ISBN: 978-0-07-174385-3, MHID: 0-07-174385-5.
All trademarks are trademarks of their respective owners. Rather than put a trademarksymbol after every occurrence of a trademarked name, we use names in an editorialfashion only, and to the benefit of the trademark owner, with no intention ofinfringement of the trademark. Where such designations appear in this book, they havebeen printed with initial caps.
McGraw-Hill eBooks are available at special quantity discounts to use as premiums andsales promotions, or for use in corporate training programs. To contact a representativeplease e-mail us at [email protected].
Trademarks: McGraw-Hill, the McGraw-Hill Publishing logo, 36-Hour Course, andrelated trade dress are trademarks or registered trademarks of The McGraw-HillCompanies and/or its affi liates in the United States and other countries and may not beused without written permission. All other trademarks are the property of their respectiveowners. The McGraw-Hill Companies is not associated with any product or vendormentioned in this book.
Portions of information contained in this publication/book are printed with permission ofMinitab Inc. All such material remains the exclusive property and copyright of MinitabInc. All rights reserved.
TERMS OF USE
This is a copyrighted work and The McGraw-Hill Companies, Inc. (“McGraw-Hill”) and itslicensors reserve all rights in and to the work. Use of this work is subject to these terms.Except as permitted under the Copyright Act of 1976 and the right to store and retrieve
one copy of the work, you may not decompile, disassemble, reverse engineer, reproduce,modify, create derivative works based upon, transmit, distribute, disseminate, sell,publish or sublicense the work or any part of it without McGraw-Hill’s prior consent. Youmay use the work for your own noncommercial and personal use; any other use of thework is strictly prohibited. Your right to use the work may be terminated if you fail tocomply with these terms.
THE WORK IS PROVIDED “AS IS.” McGRAW-HILL AND ITS LICENSORS MAKE NOGUARANTEES OR WARRANTIES AS TO THE ACCURACY, ADEQUACY ORCOMPLETENESS OF OR RESULTS TO BE OBTAINED FROM USING THE WORK,INCLUDING ANY INFORMATION THAT CAN BE ACCESSED THROUGH THE WORKVIA HYPERLINK OR OTHERWISE, AND EXPRESSLY DISCLAIM ANY WARRANTY,EXPRESS OR IMPLIED, INCLUDING BUT NOT LIMITED TO IMPLIED WARRANTIESOF MERCHANTABILITY OR FITNESS FOR A PARTICULAR PURPOSE. McGraw-Hill andits licensors do not warrant or guarantee that the functions contained in the work willmeet your requirements or that its operation will be uninterrupted or error free. NeitherMcGraw-Hill nor its licensors shall be liable to you or anyone else for any inaccuracy,error or omission, regardless of cause, in the work or for any damages resultingtherefrom. McGraw-Hill has no responsibility for the content of any information accessedthrough the work. Under no circumstances shall McGraw-Hill and/or its licensors beliable for any indirect, incidental, special, punitive, consequential or similar damages thatresult from the use of or inability to use the work, even if any of them has been advised ofthe possibility of such damages. This limitation of liability shall apply to any claim orcause whatsoever whether such claim or cause arises in contract, tort or otherwise.
CONTENTSIntroduction
1. Define
2. Measure
3. Analyze
4. Improve
5. Control
6. Conclusion
ProcessArc Comprehension Test
ProcessArc Comprehension Test Answer Key
Index

INTRODUCTIONWith the integration of the Lean and Six Sigma methodologies—the Big Bang of thequality movement—the business world finally has at its disposal the tools it needs toactually deliver top-quality service and products. As we shall see in this book, it is up tothe leaders of each organization to make the tough decisions and transform theirorganization from one that uses catchphrases and sexy slogans to attract customers (onlyto lose them a few months later) to one that actually has the facts and data to back up theclaims it makes about being a “quality organization.” The truth is that the GDP of theUnited States has seen a steady shift from manufacturing to services over the last twodecades, and the visible differentiation in the nonmanufacturing sector is through servicedelivery and product ingenuity. Lean Six Sigma is based on the premise that in order todeliver service and product excellence, firms must not only have an in-depth knowledgeof their internal processes, but also have a profound understanding of customers’ currentexpectations and future needs.
While they are still two distinct practices and philosophies, the integration of Lean andSix Sigma has created an approach that is more flexible and applicable when addressingbusiness challenges. Lean Six Sigma helps companies make the transformation from amore traditional business and operational management model to a process managementone. This transformation allows for increased clarity, consistency, ownership, and controlof business processes.
This book aims to introduce you to Lean Six Sigma and to help you make informeddecisions about this methodology. Our learning objectives for you are to enable you to:
• Understand why a company should utilize the Six Sigma and Lean methodologies
• Learn the roles of measurement and statistics in Six Sigma
• Gain exposure to a range of tools, from simple to advanced
• Understand the value of combining Six Sigma with Lean methodology
• Understand when and why to apply Six Sigma and Lean tools
• Engage in a step-by-step application of the methodology and tools
• Develop a rollout plan and outline the roles of executives and leaders in supporting
that plan
BUILDING THE CASE FOR QUALITYThere are several reasons why an organization needs to establish a quality culture.
Letting the Numbers Tell the Story
While this is less often lacking in organizations today, the need for quality must beestablished within an organization well before the organization sets out on this journey.Every company will have its own set of objectives; however, a study by Hendricks andSinghal, titled Empirical Evidence from Firms That Have Won Quality Awards, clearlyshowed that the bottom-line performance of companies that emphasize quality ismarkedly improved. This study was an empirical review of all Quality Award winners overa 10-year period. According to the study’s findings, the award-winning companiesexperienced:
• A 91 percent growth in operating revenue compared to 43 percent for the controlgroup
• A 69 percent increase in sales compared to 32 percent
• A 79 percent increase in total assets compared to 37 percent
• A 23 percent increase in number of employees compared to 7 percent
• An 8 percent rise in return on sales compared to no improvement for the controlgroup
• A 9 percent improvement in return on assets compared to 6 percent
Looking at these data, we can safely say that effective implementation of qualityprinciples leads to an improvement in long-term financial performance for mostorganizations.
Fundamentally, organizations deploy Lean Six Sigma to help alleviate marketpressures and, in the process, to transform themselves into more responsive andcompetitive entities. To achieve the types of results observed in the Hendricks andSinghal study, an organization has to set out on a quality journey. Lean Six Sigma canhelp an organization achieve quantifiable improvements by:
• Creating a sustainable quality culture
Bringing clarity to “invisible” processes and enhancing control
• Providing a corporate strategy for differentiation
Becoming a world-class service or product provider at the lowest cost
Providing customers with what they value
Reducing the hidden costs associated with poor-quality products or services
• Disproving the perception that Lean Six Sigma applies only in manufacturing
Building a Sustainable Quality Culture
Since the 1980s, organizations have attempted to introduce quality methodologies withvarying degrees of success. The reasons for their success or failure are numerous, but onereason stands out more than any other: the lack of a sustainable quality culture. WithLean Six Sigma (LSS), an organization is setting out on a distinct journey using commonoperating mechanisms, training, an organizational structure, objectives, and a commonlanguage. The fact that LSS is increasingly the approach to quality chosen by both largeand small organizations is in large part because it has staying power; it is a provenmethodology that has produced measurable financial results over two decades. If anorganization and all its various divisions have accepted the introduction of LSS, they areall working toward a common strategic goal, and they all understand the path to attainingthis goal, then the effectiveness of LSS is greatly enhanced.
One way in which LSS helps in the development of a sustainable quality culture is byassessing business process performance in an unbiased fashion. Outside of themanufacturing world, where we can see the product that is being created and visuallyinspect it for defects, controling quality becomes more difficult. How do we inspect ourproduct throughout its development if it is a loan, an insurance policy, or the transfer ofpatient records from a hospital to a clinic? The truth is that most of these products andprocesses are invisible, meaning that we rely on a transfer of information to complete thetask and deliver the product or service. And it is increasingly difficult to conduct qualitycontrol on information transfer; we must have a mechanism in place to notify us that, forexample, file transfer between the branch and the back office has slowed drastically, withthe result that customers are being made to wait an extra 10 days to open an account.
Simple Lean Six Sigma tools like value stream mapping and process maps can bring tolight things that have been assumed or are not well understood. By making what residesinside people’s heads or systems (invisible) visible on a map, an organization can notonly identify opportunities for improvement, but create a baseline for currentperformance.
There are two further points that emphasize LSS’s strength in promotingsustainability:
1. LSS projects are typically linked to business-critical issues. This ensures that theLSS teams are assigned to address challenging issues and deliver quantifiablebenefits, and that they get the level of attention and support required for long-termsuccess.
2. LSS provides a standard approach to problem solving. Management and executivescan be sure that the appropriate level of rigor has been applied and that the teamhas worked to find the root cause. In short, LSS stops employees from jumping fromproblem statement to solution.
DEVELOPING A CORPORATE STRATEGY FOR DIFFERENTIATIONThe LSS methodology helps an organization successfully make the transition to one thatdifferentiates itself by:
1. Offering top-level service
2. Simultaneously offering products or services that the customer values
3. Having the lowest level of operating expenses
This transformation takes place because the organization better understands the needsand wants of its customer base, is able to measure and monitor its vendors’ performance,and improves its internal business processes. It is undeniable that the degree ofdifference between the products or services of competitors is shrinking. How docustomers differentiate between companies when the products being offered are basicallythe same? How does a car buyer choose between lenders when deciding on a loanprovider? The rates are almost identical. The answer to this question is the foundation ofquality in an organization, from both a product and a service delivery dimension. Themore we understand what the end buyers want and how we perform to their expectations,
the clearer the road map for improvement will be. This is how Lean Six Sigma is beingutilized in the marketplace today to create differentiation.
HELPING TO OVERCOME OPERATIONAL CHALLENGESRegardless of an organization’s industry or size, there are three types of challenges thatcan prevent it from operating effectively, leaving it with inefficient processes and poorservice delivery. These challenges are:
1. Introducing new processes or products without:
• Having a complete understanding of risk, that is, recognizing what could go wrong,how to address it, and its impact on other parts of the organization
• Success metrics—how to know if the goals have been reached
2. One-at-a-time changes or improvements—being in reactive mode:
• Adversely affecting one process while trying to fix another
• Not allowing for a cohesive, strategic fix
3. Lack of appropriate in-process and executive metrics:
• Not knowing what to measure, how to measure it, and how often
• Failing to drive continuous improvement based on employee noise level
These challenges arise because organizations don’t have a systematic problem-solvingplatform or a business culture that is based on process management and data-drivendecision making. Regardless of the type of challenge facing the organization, the factremains that executives need a systematic and structured approach to dealing withbusiness issues. Most often, this structured approach comes directly from the qualitystrategy that has been implemented. The strengths of Lean Six Sigma are that it helpsorganizations overcome these challenges by providing a common language, training, anda problem-solving tool kit. It will help ensure that all business decisions, whether theyinvolve buying a new core system or launching a new product, are based on data(customer, market, process capability, and so on). From a process improvementperspective, it ensures that the process is being looked at holistically, taking intoconsideration its natural start and end points, and thus mitigating the risk of
reengineering only a piece of the process and having an adverse impact on other parts ofthe organization.
GOALS AND SUCCESS METRICS OF LEAN SIX SIGMAAny meaningful initiative needs to have success metrics. Organizations need tocontinuously gauge the effectiveness of their Lean Six Sigma deployment. The four maingoals of a LSS deployment are:
1. Reduce operational cost and risk
• Increase efficiency and predictability
• Reduce the cost associated with poor quality
2. Increase revenue
• Reduce leakage
3. Improve customer service—deliver consistent customer service
4. Build a culture of continuous improvement
Reduce Operational Cost and Risk
For most companies operating today, operational cost and risk are significant factorscontributing to lower profits, or even losses. While some risk cannot be eliminated andoperational cost is ubiquitous, Lean Six Sigma can provide a road map that can drasticallyreduce an organization’s exposure to risk while making the organization more efficient atdelivering its product or service. An example of a cost-reduction project would be a focuson decreasing process cycle time. The end result will be a streamlined process with fewertouchpoints, fewer non-value-adding activities, less rework, and fewer failures, all ofwhich will reduce cost. Additional benefits may be consistently meeting service-levelagreements (SLAs) with customers, avoiding penalties, and recognizing revenue faster.Another main focal area for Lean Six Sigma is projects to reduce cost associated with poorquality. For companies that choose to ignore the importance of quality in their operationsand their product offering, it is important to outline the impact that this will have on theirbottom line. On average, U.S. companies dedicate about 15 percent of their sales toresolving quality matters. For our purposes here, I will point out some of the moreblatant tangible and intangible costs associated with providing products or services with
poor quality.
Tangible Costs
Inspection. Anytime we have to inspect a service or product, we are performing a stepthat our customers do not want to pay for. In the ideal (Lean Six Sigma) world, theproduct or service would never arrive at a particular point in a deficient or incompleteform. The flow or process would be set up in such a way that any potential errors willbe captured and fixed at the process step where they occur.
Process waste. This includes any activity that adds cost or time to the process butdoes not change the fit, form, or function of the product or service being delivered.Examples are scanning, mail distribution, and rechecking.
Rework. This implies redoing something that has ostensibly already been done.Without any doubt, we can say that no customer wants to bear this cost. The idea ofrework implies that the process has been set up in a way that allows incomplete orincorrect work to pass further along in the process, so that it must be caught (andcorrected) by someone downstream.
Complaints. If we can minimize the reasons for a customer complaint, we will reducecost to the organization. Complaints can affect our bottom line drastically in caseswhere the product or service has some critical faults. Also, complaints can lead to theloss of repeat business from an existing client.
Intangible Costs
These are costs associated with our failures in the quality realm that are hard to quantify.For example, losing customers has multiple effects on an organization. A lost customerwill inform several other people of his experience, in addition to causing the companydecreased revenue. Managing angry customers and handling complaints are alsoexamples of intangible costs that should be reduced using LSS.
Increase Revenue
Opportunities for increasing revenue can be uncovered by a better understanding ofcustomer needs and wants, and also by identification of leakage points. Typical Lean SixSigma projects on the revenue side focus on improving cross-selling activities (increasingthe products per customer ratio), improving the repurchase rate for similar goods orservices, or increasing application conversion rates. With regard to conversion rates, thinkof the number of applications that a bank or credit union may receive for car loans—how
many of those applications are actually converted into loans? The goal of a Lean SixSigma project would be to recognize the major dropout points or leakage points in theprocess and identify ways to reduce or eliminate them. Ultimately the goal is to improvethe company’s bottom line.
Deliver Consistent Customer Service
The image of your company is created in large part by its interaction with customers. Youwant this interaction to be as consistent as possible because disappointed customers arevocal critics. Lean Six Sigma can help identify the amount of variation your customers areexperiencing, what is driving that variation, and ultimately, how the number ofdissatisfied customers can be minimized.
Build a Culture of Continuous Improvement
No methodology will have staying power if it does not instill a single-minded focus oncontinuous improvement within employees. Lean Six Sigma is built on a platform thatconstantly revisits the idea of improving processes and customer impact. If the centralfocus of an organization is on continuous improvement, chances are that in the longterm, that organization will not be in reactive mode. The role of Lean Six Sigma inbuilding a continuous improvement culture is significant, including:
• A standard approach to problem solving
• A common language, organizational structure (Green Belts, Black Belts, and so on),and culture for measuring business process performance
• The creation of infrastructure in the company to permit access to reliable and timelyprocess data so that accurate business decisions can be made
• The development of meaningful process metrics that help gauge performance as wellas identify future improvement opportunities
THE IMPORTANCE OF LSS IN NONMANUFACTURING SECTORSAt some point in this discussion, we have to consider why this methodology should beembraced by nonmanufacturing companies that are hoping to deliver better service andproduct to their customers. None of these should come as a surprise, given the volume ofinformation about the application of LSS to the services, healthcare, and financial sectors.
Up to 50 Percent of Service Cost Is Non-Value-Added Work in Your Customers’ Eyes
In other words, about 50 percent of the costs associated with delivering service are forthings that customers do not want to pay for. The need to reexamine an application forcompleteness, the need to double-check whether an amount is correct, and the need toverify an account type are all activities that customers consider unnecessary, as theyexpect the work to have been done correctly the first time.
Much Service Work Is Invisible, and Invisible Work Is Hard to Improve
One of the truisms for the service sector (and increasingly for the U.S. economy as awhole) is the fact that the work being performed is not visible. We work on data entry,make judgments on applications, and respond to customer requests online. These are allactivities that do not involve visual observation of a product. We are manipulatinginformation and data on a customer application, not observing the manufacture of amobile phone. It is easier to identify defects when we can observe a cellular phone as itgoes through manufacturing than when we process an application for a home mortgage.In the case of the mortgage, once the applicant triggers the request, the informationenters a pipeline and must pass through several different silos within the organizationbefore a response is delivered to the customer. Most often, there is minimalcommunication between these silos, and for this reason an application can easily get heldup (for example, at underwriting). Unless the work environment can be made visible,either by process mapping or by the development of daily process metrics, it is difficult toidentify improvement or risk-reduction opportunities.
We Add Value to the End Product or Service Only 5 to 10 Percent of the Time
Let’s take the example of applying for a new health insurance policy and look at thetotality of the effort required to process that application before a policy is issued to thecustomer. In reality, while that application is in our possession, we are adding value 5 to10 percent of the time. The other 90 to 95 percent of the time is considered waste; itincludes such things as checking, rechecking, waiting for information, waiting forapproval, and reentering information, and all these activities add no value to the finalproduct. It is for our internal purposes (regulatory and compliance) or because of ourinternal process structure (system limitation, organizational structure, or poor processdesign) that we have this inefficiency and redundancy.
The 80/20 Rule Holds True
There have always been delays in the service sector—this is a fact of life, and we havegotten used to it. These can include waiting for a debit card to arrive or a business owner’sline-of-credit renewal getting caught up in the paper shuffle. But in reality, these delays
don’t have to be as pervasive a problem as we currently observe. The fact is that morethan 80 percent of delays are caused by less than 20 percent of activities. For those of usin the quality realm, this means that by tackling a small segment of business processes,we can achieve far-reaching improvements.
The reality is that competition is fierce and customers are more informed. Thecombination of these two factors is leading to a decrease in your customers’ loyalty. Tostay ahead of the game, forward-thinking businesses will challenge their staff membersand force them to make tough decisions based on data, not on intuition or gut instinct.LSS provides a platform that allows organizations to combat this negative environment;it encourages an organization to listen to its customers’ demands and then use thatinformation to change for the better.
DEFINING SIX SIGMA, LEAN, AND LEAN SIX SIGMABefore we look at implementation, we should first define the terms we are using and takea brief look at the history of these methodologies.
Six Sigma
In the late 1970s, many U.S.-based companies began adopting quality initiatives. In manycases, they started down this path because their backs were up against the wall. Leadingmanufacturers were losing market share to overseas competitors, particularly those fromJapan. At that time, Japanese companies were using Total Quality Control (TQC) andLean principles to improve manufacturing performance and to design “customer-centric”products. In response, U.S. firms began adopting Total Quality Management (TQM), avariation of TQC. In the 1990s, Jack Welch, the CEO of General Electric, began toutingthe benefits of a new quality game changer: Six Sigma. The world of quality began toconverge on Six Sigma because of the benefits it delivered and its flexibility in terms ofbeing able to apply it to any functional business area. Today, it has made its way throughall the major segments of the U.S. economy: financial services, healthcare, defense,government, and manufacturing. Six Sigma is a statistical problem-solving methodologyand a management philosophy, one that dictates that business and process decisionsshould be based on data. It contains five distinct problem-solving phases known as theDMAIC approach:
• Define the problem statement, the goal, and the financial benefits.
• Measure the current performance of the process and collect the required data.
• Analyze the root cause of the problem.
• Improve the process to eliminate errors and instability.
• Control the performance of the process, ensuring that the improvements aresustained.
Six Sigma’s fundamental goal is to reduce operational variance by improving theoverall quality and performance levels of business processes. This is particularly criticalin the service sector, as customers are more likely to take notice of service variance, or“foul-ups.”
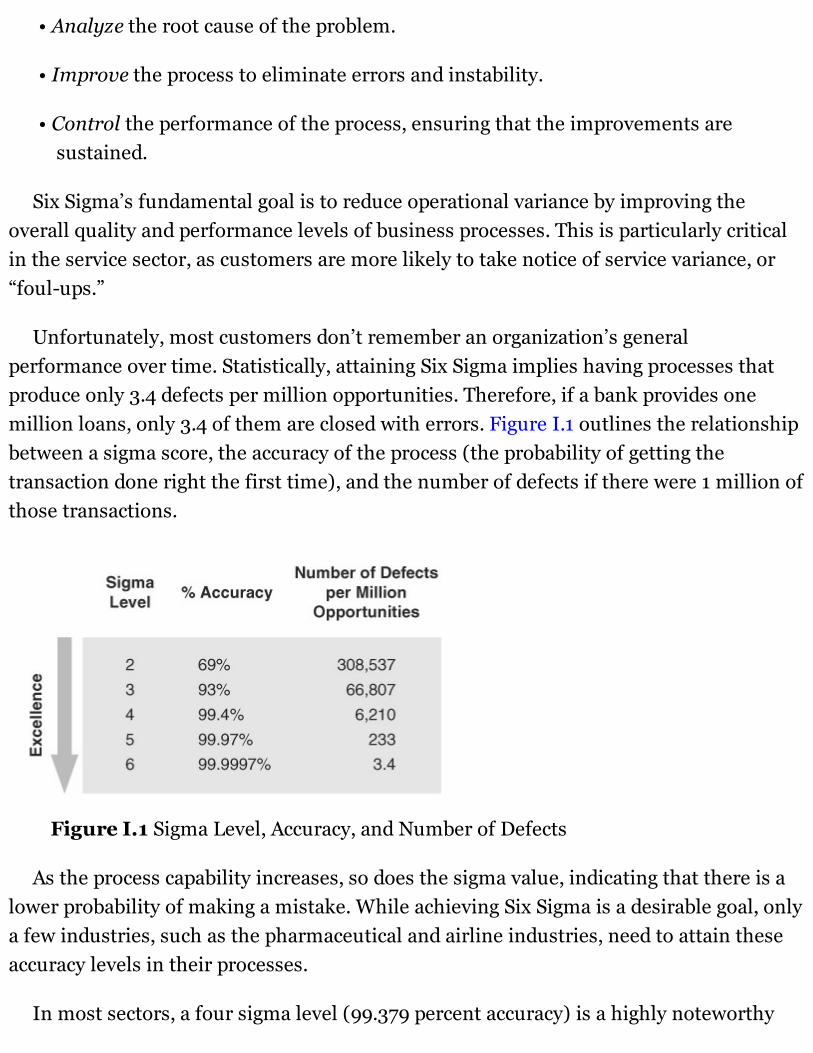
Unfortunately, most customers don’t remember an organization’s generalperformance over time. Statistically, attaining Six Sigma implies having processes thatproduce only 3.4 defects per million opportunities. Therefore, if a bank provides onemillion loans, only 3.4 of them are closed with errors. Figure I.1 outlines the relationshipbetween a sigma score, the accuracy of the process (the probability of getting thetransaction done right the first time), and the number of defects if there were 1 million ofthose transactions.
Figure I.1 Sigma Level, Accuracy, and Number of Defects
As the process capability increases, so does the sigma value, indicating that there is alower probability of making a mistake. While achieving Six Sigma is a desirable goal, onlya few industries, such as the pharmaceutical and airline industries, need to attain theseaccuracy levels in their processes.
In most sectors, a four sigma level (99.379 percent accuracy) is a highly noteworthy
accomplishment. Furthermore, it is commonly accepted today that embarking on the“quality journey” is in itself an important step. As mentioned earlier, customers are moreapt to take issue with situations in which things don’t proceed the way they have come toexpect.
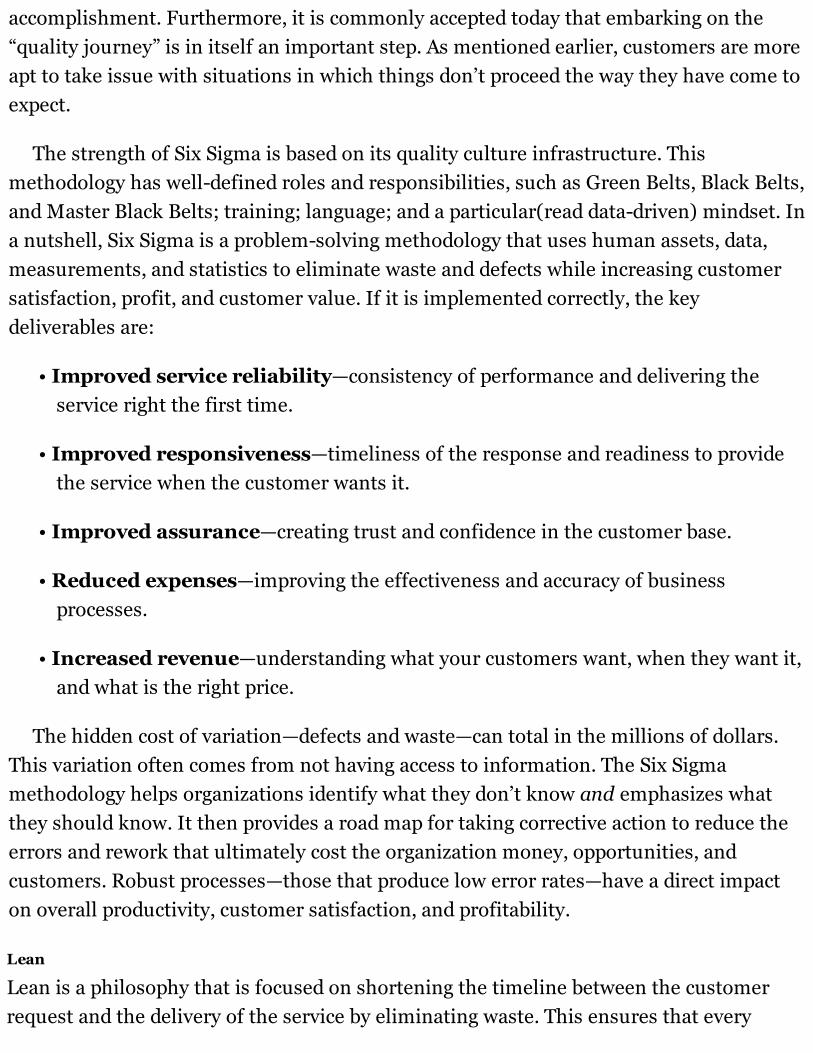
The strength of Six Sigma is based on its quality culture infrastructure. Thismethodology has well-defined roles and responsibilities, such as Green Belts, Black Belts,and Master Black Belts; training; language; and a particular(read data-driven) mindset. Ina nutshell, Six Sigma is a problem-solving methodology that uses human assets, data,measurements, and statistics to eliminate waste and defects while increasing customersatisfaction, profit, and customer value. If it is implemented correctly, the keydeliverables are:
• Improved service reliability—consistency of performance and delivering theservice right the first time.
• Improved responsiveness—timeliness of the response and readiness to providethe service when the customer wants it.
• Improved assurance—creating trust and confidence in the customer base.
• Reduced expenses—improving the effectiveness and accuracy of businessprocesses.
• Increased revenue—understanding what your customers want, when they want it,and what is the right price.
The hidden cost of variation—defects and waste—can total in the millions of dollars.This variation often comes from not having access to information. The Six Sigmamethodology helps organizations identify what they don’t know and emphasizes whatthey should know. It then provides a road map for taking corrective action to reduce theerrors and rework that ultimately cost the organization money, opportunities, andcustomers. Robust processes—those that produce low error rates—have a direct impacton overall productivity, customer satisfaction, and profitability.
Lean
Lean is a philosophy that is focused on shortening the timeline between the customerrequest and the delivery of the service by eliminating waste. This ensures that every
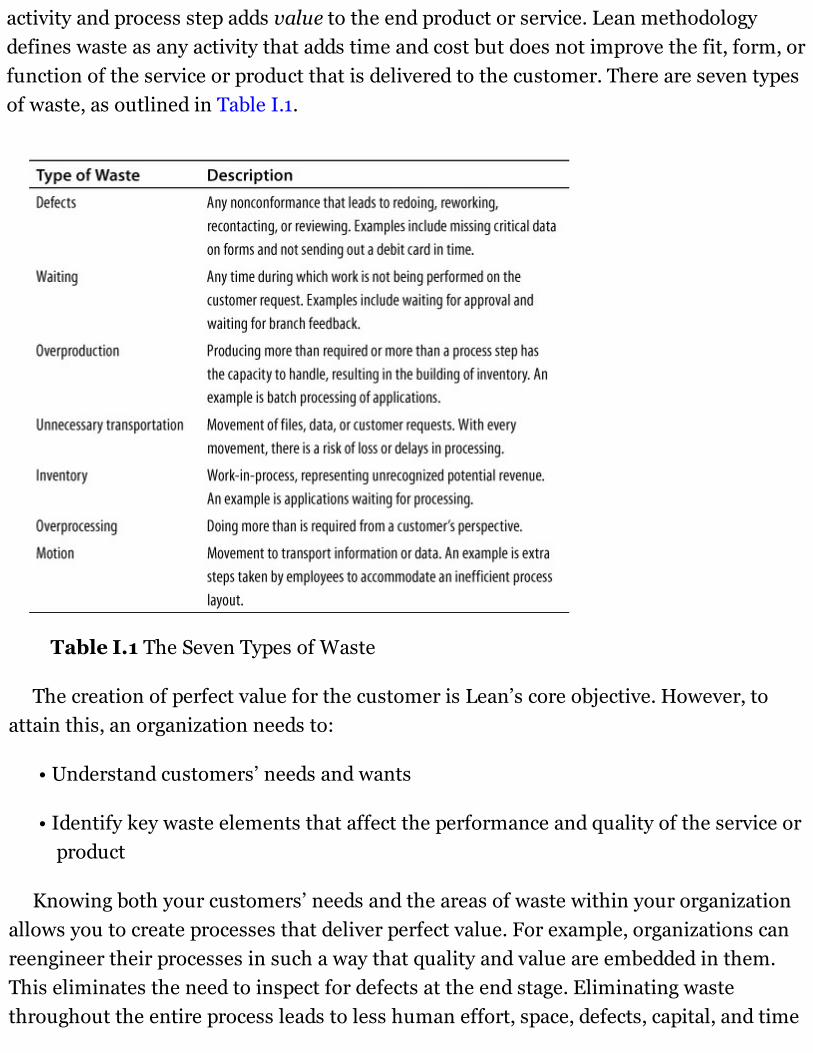
activity and process step adds value to the end product or service. Lean methodologydefines waste as any activity that adds time and cost but does not improve the fit, form, orfunction of the service or product that is delivered to the customer. There are seven typesof waste, as outlined in Table I.1.
Table I.1 The Seven Types of Waste
The creation of perfect value for the customer is Lean’s core objective. However, toattain this, an organization needs to:
• Understand customers’ needs and wants
• Identify key waste elements that affect the performance and quality of the service orproduct
Knowing both your customers’ needs and the areas of waste within your organizationallows you to create processes that deliver perfect value. For example, organizations canreengineer their processes in such a way that quality and value are embedded in them.This eliminates the need to inspect for defects at the end stage. Eliminating wastethroughout the entire process leads to less human effort, space, defects, capital, and time
when delivering a service. This ultimately translates into a faster response to customerneeds at a lower overall cost to the organization. To attain perfect value creation,management will need to change its focus. Instead of optimizing separate technologies,assets, and vertical departments, management has to optimize the flow of products andservices through the entire value stream. This will invariably require an in-depth look atthe end-to-end flow that brings a product or service to the customer. Once that flow isunderstood, the elimination of waste and redundancies can begin. When it is deployedcorrectly, Lean’s main deliverables are:
• A reduction in work in process (WIP), or the backlog
• Increased productivity
• Increased process capacity
• Improved area and/or organizational layouts for optimization
• Standardized operations and processes
Lean Six Sigma
Over the past century, various quality methodologies have come and gone, but some basicprinciples have endured. In 1913, when young Henry Ford developed his assembly-linesystem, he focused on standardization and taking waste out of the car manufacturingprocess. Over the years, the world of quality has ultimately converged on the principlesthat are known today as Lean and Six Sigma. Lean, with its simple approach that focuseson improving the speed and efficiency of processes, provides breadth in problem solving.On the other hand, Six Sigma is more sophisticated and offers a method for drilling deepinto complex issues. Six Sigma also has a very structured approach to problem solvingthat is absent in Lean. By definition, Six Sigma is about enhancing the quality andaccuracy of processes by reducing variation, while Lean focuses on achieving fasterresponse times by eliminating waste. As a result, these two methodologies offercomplementary tool kits; they help address the root cause of different businesschallenges. For example, if the goal is reducing account opening cycle time, Leanprinciples can help identify areas of waste to be eliminated. On the other hand, if the goalis to reduce credit card losses, Six Sigma tools provide the better fit with understandingroot causes.
IMPLEMENTATION OVERVIEW
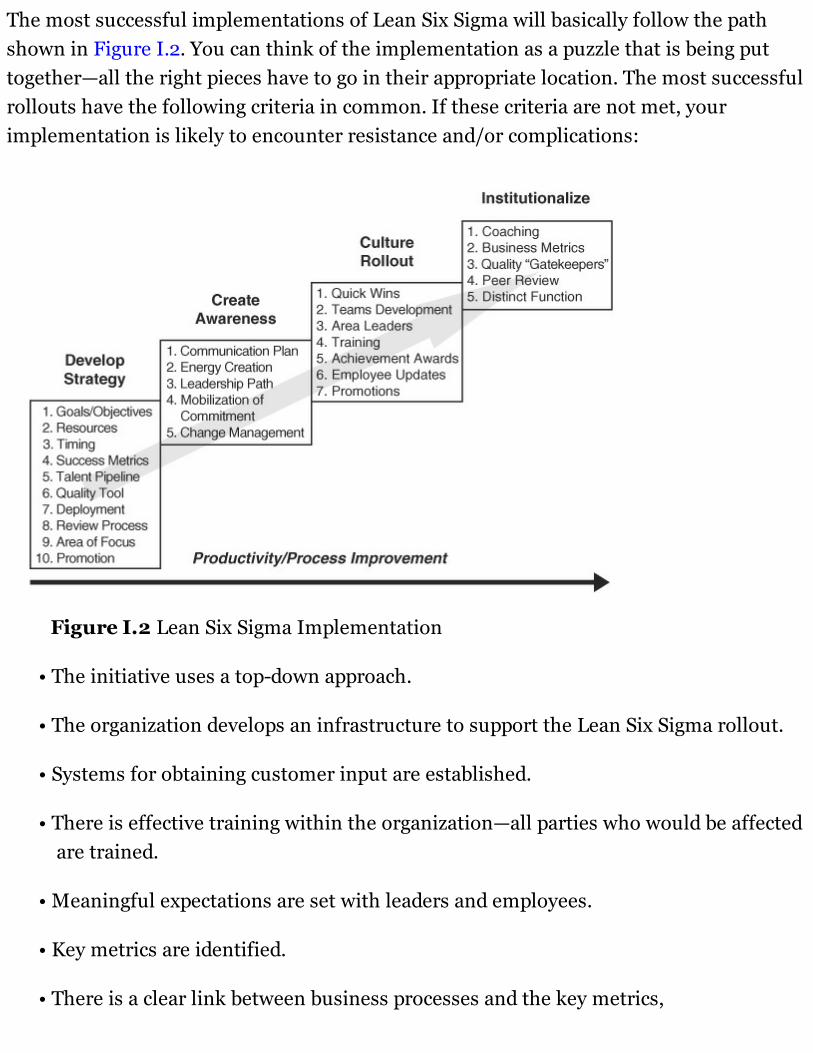
The most successful implementations of Lean Six Sigma will basically follow the pathshown in Figure I.2. You can think of the implementation as a puzzle that is being puttogether—all the right pieces have to go in their appropriate location. The most successfulrollouts have the following criteria in common. If these criteria are not met, yourimplementation is likely to encounter resistance and/or complications:
Figure I.2 Lean Six Sigma Implementation
• The initiative uses a top-down approach.
• The organization develops an infrastructure to support the Lean Six Sigma rollout.
• Systems for obtaining customer input are established.
• There is effective training within the organization—all parties who would be affectedare trained.
• Meaningful expectations are set with leaders and employees.
• Key metrics are identified.
• There is a clear link between business processes and the key metrics,
In real terms, the rollout of a Lean Six Sigma effort has three distinct phases. In thefirst phase, the Quality Leader aligns the effort with the company’s mission, selects afocus area, and forms the organization. During the second phase, Champions are trained,metrics are developed, and projects are identified. In the third and final phase, Black andGreen Belts are trained and start executing the projects.
Integral to the first phase are the milestones for building a quality infrastructure.These milestones outline at what time to engage in specific activities to ensure asuccessful adoption of the methodology. The first step is strategy development for thequality organization. Without it, the team will not have an end goal toward which itfocuses all its efforts. The strategy should include the following components:
• Goals and objectives of the quality initiative
Resources needed
Timeline to be followed to ensure momentum
Success metrics to gauge the effectiveness of the initiative
A talent pipeline for training and project execution
Areas of focus that will both deliver quick wins and resolve chronic business issues
A promotion path for the Green Belts and Black Belts once they have completedtheir 18- to 24-month assignment
The next milestone after the strategy has been developed is to create awarenessconcerning the initiative. This will involve:
• Formulating a communication plan across all levels of the organization
Energy creation (within the organization) through education and sharing thequality initiative vision
Mobilizing commitment from the key stakeholders and management
Developing a change management road map to ensure that all points of risk(technology, political, and cultural) have been identified
This step can be the catalyst for the initiative. The way in which the organization isinformed of this stage, the leadership path for staff members to work toward, and theenergy creation will go a long way in creating the excitement needed for success in acritical initiative.
The third milestone is the culture “rollout.” In this phase, we show the organizationwhat it can be expect as we move further down the Lean Six Sigma path. The goal is toprove how successful and powerful the methodology can be in order to facilitate itsinstitutionalization. The specifics that we must deliver during this phase are:
• Quick wins to maintain momentum and also overcome skepticism
Develop teams to get everyone involved. This helps in both identifying robustsolutions and overcoming resistance.
Identify area leaders for continuous improvement ownership.
Train all levels of employees.
Achievement awards to ensure that hard work is recognized.
Promotion of Green Belts and Black Belts who have truly delivered quantifiableand meaningful benefits for the organization. This reenforces the message that thequality initiative is not going to go away, but rather that its successful leaders willbe rewarded.
Of the items just listed, the one that we need to focus on most is the quick wins. It willbe through these wins that the organization will feel the effectiveness and power of LeanSix Sigma. A side effect of this will be an increased demand from other departments toget involved in the initiative. Since pushing rope is ineffectual, this method of creatingexcitement and buy-in for the initiative is preferred. More success will come fromshowcasing the effectiveness of the initiative and clearly outlining how otherdepartments can also benefit from it. This stage will also require the involvement of thecompany’s human resources department, as many of the activities involved demand itsexpertise and know-how: training, promotions, developing teams, and so on. In anutshell, the better informed coworkers are, the greater the likelihood of success with aquality initiative.

The final milestone is institutionalizing the initiative and ensuring that all projects areconducted under the rubric of Lean Six Sigma. By this point in the launch, we havesufficient staff capability to begin coaching Black and Green Belts through projects, andthe business has begun implementing metrics that will guide project selection andresource allocation. The viability and worthiness of the initiative at this point is no longerin question; rather, the issue is ensuring that the organization has the tools andresources needed for continued success.
LSS ORGANIZATION STRUCTUREFor long-lasting success of the Lean Six Sigma initiative, the organization will need tohave a formal structure for its deployment. This formal structure will include Green Belts,Black Belts, and Master Black Belts (see Figure I.3), as well as Champions or Sponsors.Later, in the Define phase, we will discuss the role and responsibilities of the Championand/or Sponsor in more detail.
Figure I.3 Organization Structure for LSS Implementation
Green Belts
Green Belts are employees who have been trained in the Lean Six Sigma methodology.The expectation is that they will dedicate about 25 percent of their time to working onprojects that have been identified. The role of the Green Belt is mostly one of providinginvaluable expertise to Black Belts or other Green Belts. Generally Green Belts are highly
regarded staff members with a good understanding of the organization in which theywork. They will be provided with training, after which it is expected that they will eitherlead a small project or work as a team member on a larger project. Because of the fluidnature of their role, Green Belts should be able to shift easily between being a consensusbuilder and being a tough analyst, ensuring that work is not being postponed because ofthe intransigence of some uninterested party.
Over time, several of the more highly accomplished Green Belts will generally moveon to become Black Belts.
Black Belts
Black Belts, unlike Green Belts, lead larger Lean Six Sigma projects. They spend 100percent of their time working on larger-scale projects that require a full-time focus andmore in-depth expertise in the methodology. They have had extensive training, have abetter developed skill set, and are focused solely on the project at hand. Black Belts are avaluable resource, as they need to be competent in numerous roles. A competent BlackBelt will be able to convince the toughest naysayer of the importance of working on aproject. In addition to being strong analytically, she will also have the self-confidenceneeded to get in front of senior leaders and firmly present a business case. The bestanalogy is to compare a Black Belt to a polished diplomat who can sweet-talk, but alsoplay the tough game when required.
Over time, several of your highly accomplished Black Belts will generally move on tobecome Master Black Belts within different units of the company.
Master Black Belt
A Master Black Belt will lead the Lean Six Sigma effort within one segment of yourcompany. Generally, one Master Black Belt is assigned to each business unit. MasterBlack Belts are responsible for working with the Green and Black Belts in completingprojects. The job description of a Master Black Belt is to facilitate the successfulcompletion of all Lean Six Sigma projects in his project funnel. For this reason, a MasterBlack Belt must have a direct and open line of communication with senior leaders to dealwith any pressing resource issues. He must be well versed in the methodology (though itis rare that a Master Black Belt actually conducts analysis) in order to help guide theGreen and Black Belts in appropriate tool usage.
Champion or Sponsor
The Champion or Sponsor leads the Lean Six Sigma effort within the entire organization.She is responsible for setting the overall quality strategy, which will require having a keenunderstanding of areas that are in need of improvement and/or additional resources. TheChampion is often a senior-level staff member who can work easily with the Master BlackBelts, Black Belts, and Green Belts in setting the overall direction for project execution.She is, in effect, a barrier buster.
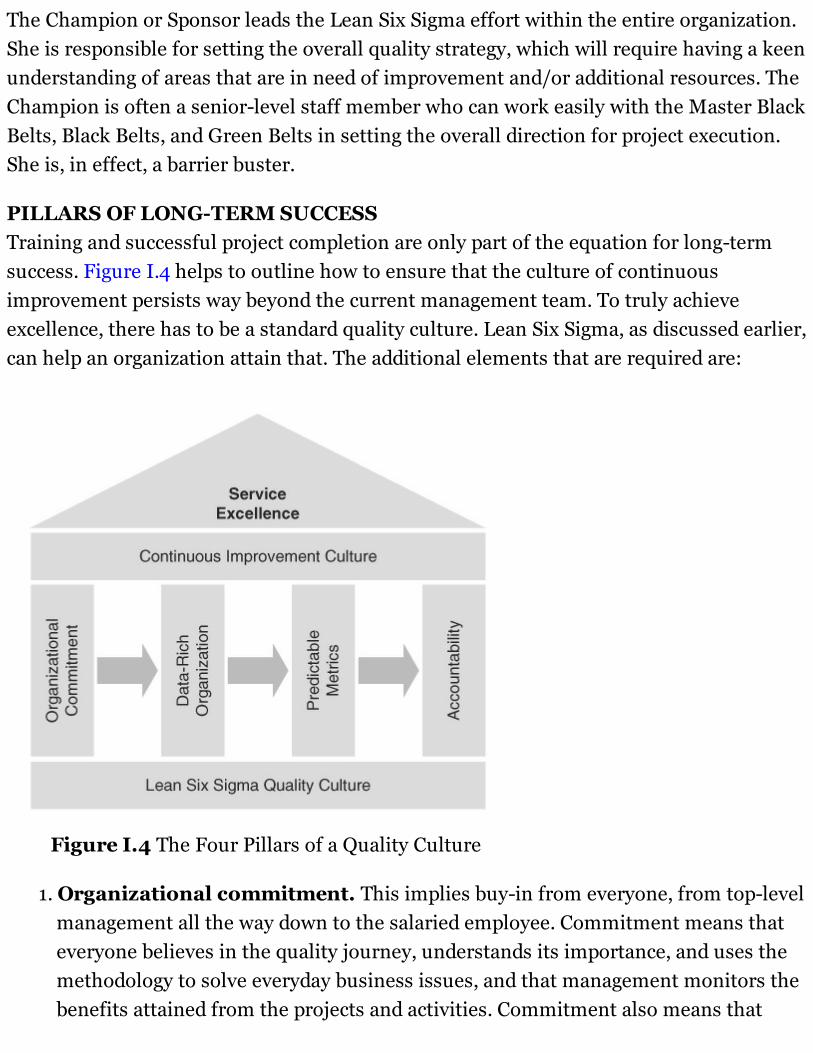
PILLARS OF LONG-TERM SUCCESSTraining and successful project completion are only part of the equation for long-termsuccess. Figure I.4 helps to outline how to ensure that the culture of continuousimprovement persists way beyond the current management team. To truly achieveexcellence, there has to be a standard quality culture. Lean Six Sigma, as discussed earlier,can help an organization attain that. The additional elements that are required are:
Figure I.4 The Four Pillars of a Quality Culture
1. Organizational commitment. This implies buy-in from everyone, from top-levelmanagement all the way down to the salaried employee. Commitment means thateveryone believes in the quality journey, understands its importance, and uses themethodology to solve everyday business issues, and that management monitors thebenefits attained from the projects and activities. Commitment also means that
management and executives understand their roles and responsibilities in makingthe continuous improvement culture live well beyond their tenure, so they have todemand excellence and reward people when it is attained.
2. Becoming a data-rich organization. In order to make business decisions basedon data, management and employees need access to timely and accurate process andcustomer data. Getting to this point can be a tedious process. While there may becopious amounts of data in an organization, the accuracy of those data may be inquestion, or they may not be exactly what is needed to monitor the particular issuethat is being analyzed. Lean Six Sigma projects can help build the requiredinfrastructure to get to the right data. Collection of accurate and current datarequires robust business processes.
3. Developing unbiased and predictable business metrics. Metrics translatethe strategic goals of the business into measurable activities from the highest to thelowest level of the organization. If developed correctly, metrics allow anorganization to drive a culture of accountability. The biggest challenge withdeveloping metrics is lack of the required data.
4. Creating a culture of accountability and acceptance. Accountability givesmeaning and focus to the metrics of the business. However, to mitigate the risks ofcultural backlash, the assistance of the human resources department should besought. HR can help in the development and implementation of the requiredcompensation, evaluation, training, and communication plans to achieve employeeacceptance.
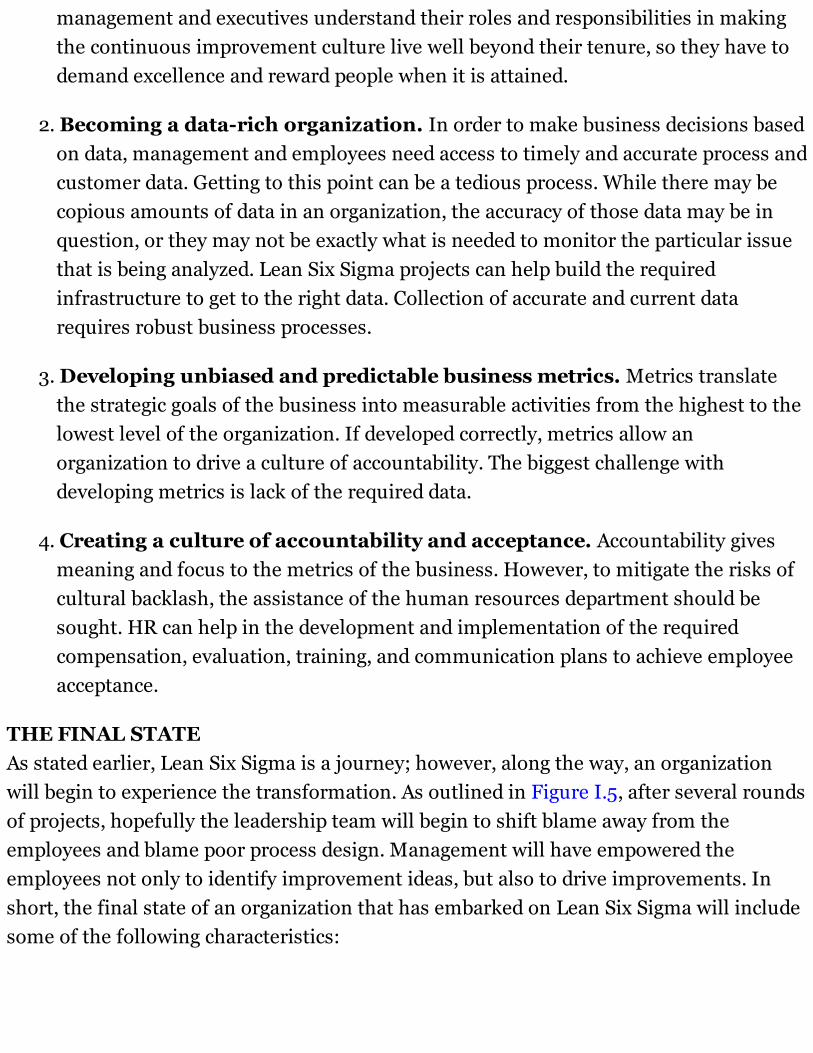
THE FINAL STATEAs stated earlier, Lean Six Sigma is a journey; however, along the way, an organizationwill begin to experience the transformation. As outlined in Figure I.5, after several roundsof projects, hopefully the leadership team will begin to shift blame away from theemployees and blame poor process design. Management will have empowered theemployees not only to identify improvement ideas, but also to drive improvements. Inshort, the final state of an organization that has embarked on Lean Six Sigma will includesome of the following characteristics:
Figure I.5 Transformation from Traditional to Lean Six Sigma Thinking
• An organization driven by data-based decision making
• Accurate and reliable process data that will support the key business performancemetrics
• Line leaders and executive staff who are driven to find the root cause of problemsinstead of treating symptoms
• An organization that embraces and encourages a continuous improvement culturewith measurable results
• An organization that is capable of making step changes instead of incrementalchanges

CHAPTER 1
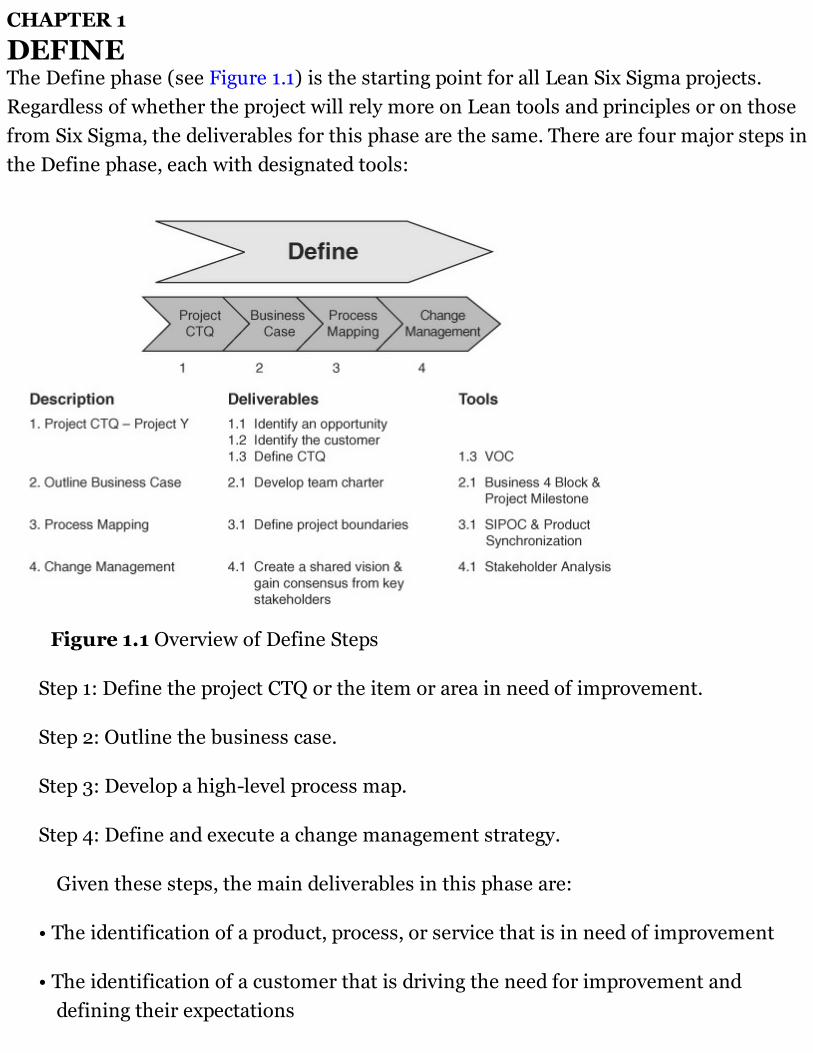
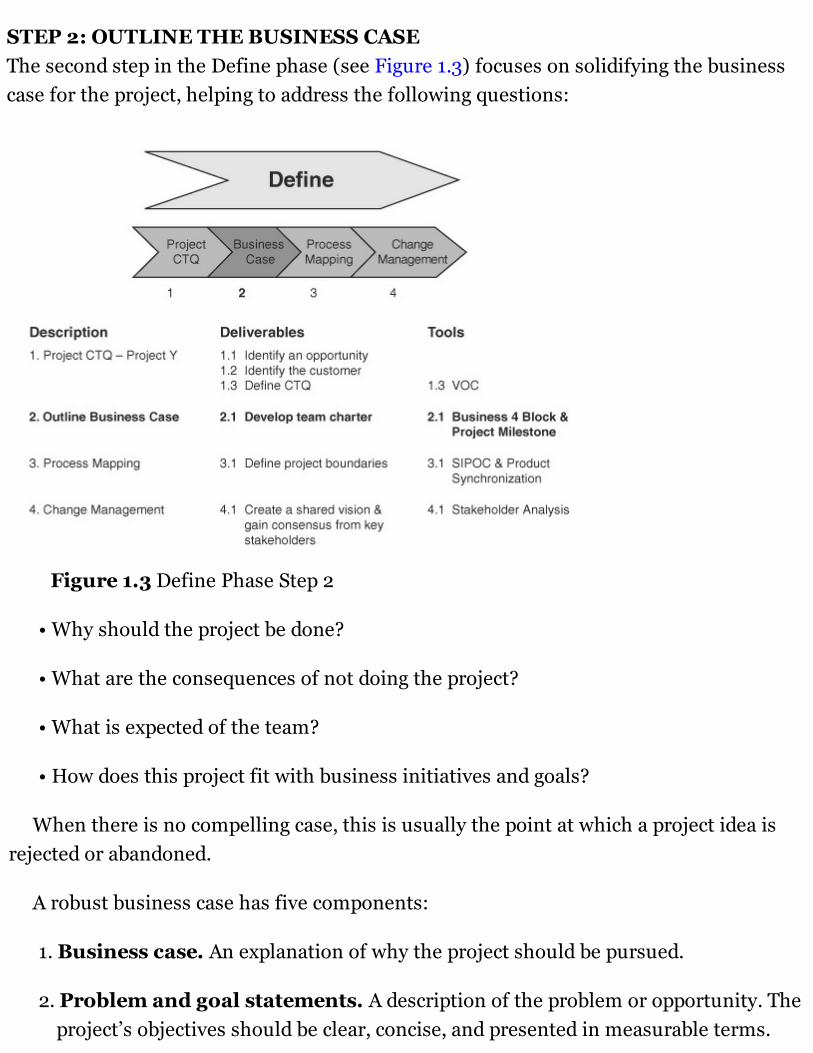
DEFINEThe Define phase (see Figure 1.1) is the starting point for all Lean Six Sigma projects.Regardless of whether the project will rely more on Lean tools and principles or on thosefrom Six Sigma, the deliverables for this phase are the same. There are four major steps inthe Define phase, each with designated tools:
Figure 1.1 Overview of Define Steps
Step 1: Define the project CTQ or the item or area in need of improvement.
Step 2: Outline the business case.
Step 3: Develop a high-level process map.
Step 4: Define and execute a change management strategy.
Given these steps, the main deliverables in this phase are:
• The identification of a product, process, or service that is in need of improvement
• The identification of a customer that is driving the need for improvement anddefining their expectations
• A team charter with a problem statement, goal, financial benefits, scope, andrequired resources
• An outline of areas of risk
• The receipt of approval or sign-off from the project champion or executive sponsor
As these deliverables indicate, the Define phase can be viewed as an exploratory phase;it is during this phase that, as the project owner, you will help to determine if there is abusiness case that is worth pursuing. Traditionally, the Define phase is viewed as one ofthe more challenging phases because of the sheer amount of due diligence required tobuild a solid business case. If this phase is not completed accurately, the chances ofsuccess are marginal. The basic requirements are:
1. A well-defined problem statement with an accurate depiction of the frequency andmagnitude of errors, issues, and defects
2. Consensus on the need for change, vision, and direction by the project championand key stakeholders
STEP 1: DEFINE THE PROJECT CTQ OR THE ITEM OR AREA IN NEED OFIMPROVEMENTIn the first step of Define, there are three distinct deliverables:
• Defining an opportunity
• The identification of the customer
• Defining the critical-to-quality (CTQ) parameter
Defining an Opportunity
The improvement opportunity that is identified is what ultimately defines the project—what is broken, how often it breaks, and the impact on the customer and the firm. As theproject owner, you will need to ensure that the opportunity has the characteristicsrequired for a great project. What defines a great project is whether:
1. The opportunity has clear boundaries and measurable goals.
2. The opportunity is aligned with a business-critical issue or initiative.

3. The customer will feel the improvements.
A commonly asked question is, “How do I find an opportunity for improvement?” Theworld of opportunities is divided into two segments: internal and external. Internalimprovement opportunities can be identified by:
• Brainstorming with a cross-functional team
• Analyzing core business processes, either by mapping them or by examining theirhistorical performance (if they have been measured in the past)
• Financial analysis of the business unit
• Review of repeated business, process, product, or service issues or challenges
• Identification of business goals or metrics that have been missed or poorly executed
External opportunities are driven by your customer(s)—auditors, creditors, orconsumers of your final product or service. Project ideas from external sources can beidentified by:
• Conducting surveys
• Analysis of existing customer feedback
• Direct dialogue with the customers
In your discovery phase for an improvement opportunity, you may actually identifyseveral. How can you prioritize them or eliminate some of them? Asking the followingquestions should help in the weeding-out process:
1. What can you do to improve the situation?
2. How important is the issue to your customer?
3. Is the opportunity or error in need of improvement measurable?
4. Are data available or easily generated?
5. Can benefits be quantified?

6. Is the process stable, or at least controllable?
7. Is the scope of the problem narrow enough to finish the improvement in four to sixmonths?
8. Is there a sponsor or champion who is willing to provide or help you acquire theresources?
Answers to these questions should help with project selection. For example, if data arenot available or easily generated, validating the problem, baselining the current state, andultimately proving that an improvement has taken place become impossible. However,while that project should not be selected immediately, a data collection plan can beimplemented in order to make the opportunity possible in the future. Also, if the scope istoo large, so that the opportunity requires a substantial amount of resources (humancapital as well as dollars), and/or if it may take longer than six months to complete, thenperhaps it should be rescoped. But most important, whatever you choose as a projectidea, it must be driven by the customer—this can be an internal or an external customer.We will discuss this idea in the upcoming section.
In the event that you are approached by a business leader with a project idea or abusiness issue that needs to be addressed, it is critical to note that no project idea shouldbe accepted as factual or 100 percent accurate. What makes this phase challenging, asstated earlier, is that the burden of validating the opportunity or problem falls on theshoulders of the project leader. Validation entails both defining the problem andestablishing its magnitude and the frequency of its occurrence. A well-defined problemstatement helps provide a better answer to the “Who cares?” question. More on this topicwill be discussed in Step 2 of the Define phase.
Identifying the Customer
Once the project opportunity has been determined, the customer(s) should be identified.Project opportunities are most often driven by managers or directors; however, while thismakes the manager or director the project sponsor or champion, she is not the“customer.” The customer is the recipient of the output from the process, product, orservice that you will be improving during this project. Therefore, the project’s customercan be internal or external. External customers are the ones who are paying the bills; theyare external to the company. Internal customers are those who receive the output frombusiness processes. As an example, if the project is to improve the quality of underwriting
in the lending department, then the customers can be the operations or servicing teams(internal customers). Alternatively, if the project will focus on reducing the overall cycletime required to approve a loan, the customer is the borrower (external customer).Identifying the correct customer for the project will ensure that you have adequatelycaptured the customer’s requirements, expectations, and needs for improvement.
Defining the Critical-to-Quality Parameters
Let’s start by first defining the term critical-to-quality (CTQ) parameter.
A CTQ is any product, process, or service characteristic that satisfies a key customerrequirement and/or process requirement.
Because a CTQ is a process, product, or service characteristic, it has to be measurable.Examples of characteristics are speed, accuracy, timeliness, and cost. In the lendingenvironment, customer CTQs may include time to receive a final decision and/or numberof documents required to make a final decision. For opening a new account, it may be thecost of having multiple accounts at a bank or the wait time to receive a debit card. At ahospital, it may be patient wait time or accuracy of dispensing medication. The mostimportant attributes of a CTQ are that it has to be translated directly from the voice of thecustomer (VOC) and that it must give an unbiased view of customer needs.
The challenge with most projects is that customers often tell you what they need onlyin vague, high-level, and nonspecific terms: “I need a quick response” or “I need moreinformation.” The challenge is to transform these customer needs into customer CTQsthat are specific and measurable. Hopefully by this point it has become clear why it isimportant to have a well-defined customer CTQ for your project in the Define phase—because without it, you will not be able to clearly outline what process needs to beimproved, and to what extent. If we were to put this discussion in terms of amathematical equation, it would look like this:
where Y = customer CTQ or the thing we need to improve with Lean Six Sigma
F(x) = the internal process(es) that directly affect the customer CTQ
This equation can be read as Y, or the customer CTQ, is a function of x, or internalprocesses. To put it another way, what the customer experiences is driven by our internal
processes. Once we know what the customer (internal or external) wants, we will have abetter understanding of what needs to be improved in our processes, policies, products,and services.
Once we have established the customer CTQ, we will learn in upcoming phases how tolink that CTQ to internal processes needing improvement.
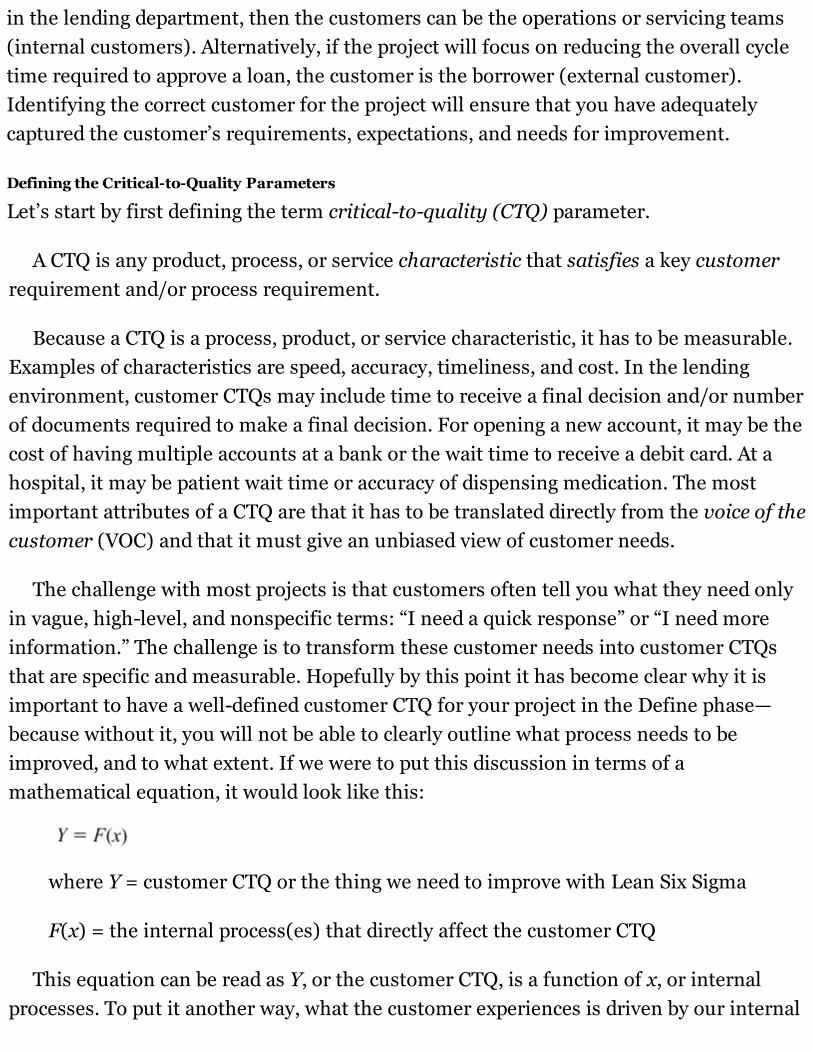
The three milestones outlined in Figure 1.2 help to identify and define the customerCTQ:
Figure 1.2 Milestones to Determining CTQs
Milestone 1: Identify All Potential Customers
Customers, by definition, are the recipients of the work product at the end of a process,product, or service. The scope of the project helps define the boundaries of the processunder consideration and hence the recipients of its output. Customers can be eitherinternal (the sales team, Underwriting, Compliance, or Marketing) or external (therecipients of your services, external auditors, or the IRS). It is very common for a projectto have multiple customers. One thing to consider is that you do not, and should not,treat all customers the same way, giving equal importance to their needs andexpectations. Segmenting customers (based on profitability, risk, region, or complexity) isa strategy that will help you prioritize their needs and expectations. As an example, whenthe project is improving turnaround time in a radiology department, should patients,regulators, and doctors (all recipients of the service or end product) be treated equallywhen considering what to improve? When the project is changing the lending form toreduce the complexity of the process, do the voices of the regulators, lending officers, andborrowers carry the same weight? The answers may be yes, depending on the project, butthat does not always have to be the case. The project goals and risks should help youprioritize what customers to focus on during the problem and solution identificationstages.
Milestone 2: Collect Voice of the Customer
You may already have VOC collection processes in place, such as call centers, relationshipmanager client visits, or annual surveys. The data from these sources can be used todefine the CTQ. However, never accept data or information as it is provided to you. Themethod and processes used to collect this information can affect its reliability andvalidity. So before analyzing the data, make sure that you understand:
• How the data were collected
• The purpose of collecting the data
• Questions asked during the data collection process
• The customers involved
• The duration of the collection process
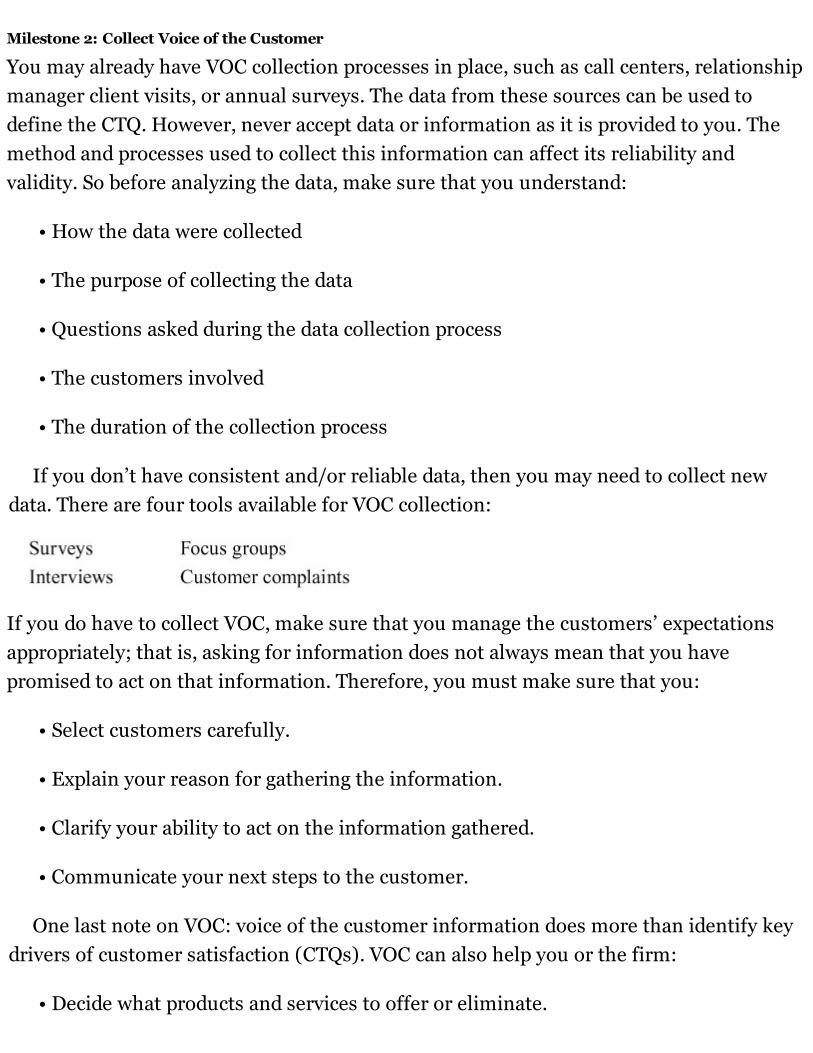
If you don’t have consistent and/or reliable data, then you may need to collect newdata. There are four tools available for VOC collection:
If you do have to collect VOC, make sure that you manage the customers’ expectationsappropriately; that is, asking for information does not always mean that you havepromised to act on that information. Therefore, you must make sure that you:
• Select customers carefully.
• Explain your reason for gathering the information.
• Clarify your ability to act on the information gathered.
• Communicate your next steps to the customer.
One last note on VOC: voice of the customer information does more than identify keydrivers of customer satisfaction (CTQs). VOC can also help you or the firm:
• Decide what products and services to offer or eliminate.
• Identify critical features for new or existing products and services.
• Make process management a proactive system.
• Decide where to focus your improvement efforts.
• Get a baseline measure of customer satisfaction through which to measureimprovement.
Reliable, accurate, and timely collection of VOC can help business leaders make sounddecisions about their products and services. It helps them understand not just what thecustomer wants, but how the customer utilizes the firm’s existing products and services.
Milestone 3. Identify Customer CTQs
A Lean Six Sigma tool used to organize and prioritize customer CTQs is called customerneeds mapping. This tool helps translate VOC into a customer need. There are three stepsin customer needs mapping:
1. Collect voice of the customer and identify service, product, and quality issues.
2. Translate the VOC into a specific need.
3. Transform the need into a measurable process characteristic (if possible) or link itto the process that is driving dissatisfaction.
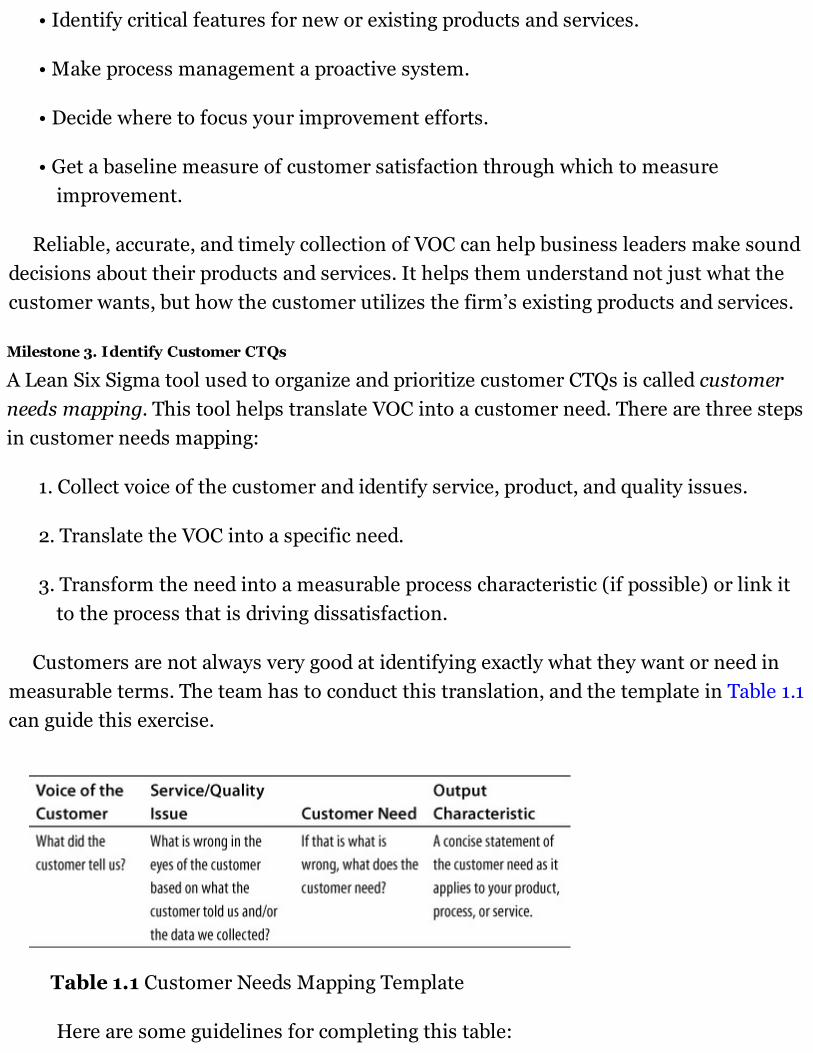
Customers are not always very good at identifying exactly what they want or need inmeasurable terms. The team has to conduct this translation, and the template in Table 1.1can guide this exercise.
Table 1.1 Customer Needs Mapping Template
Here are some guidelines for completing this table:
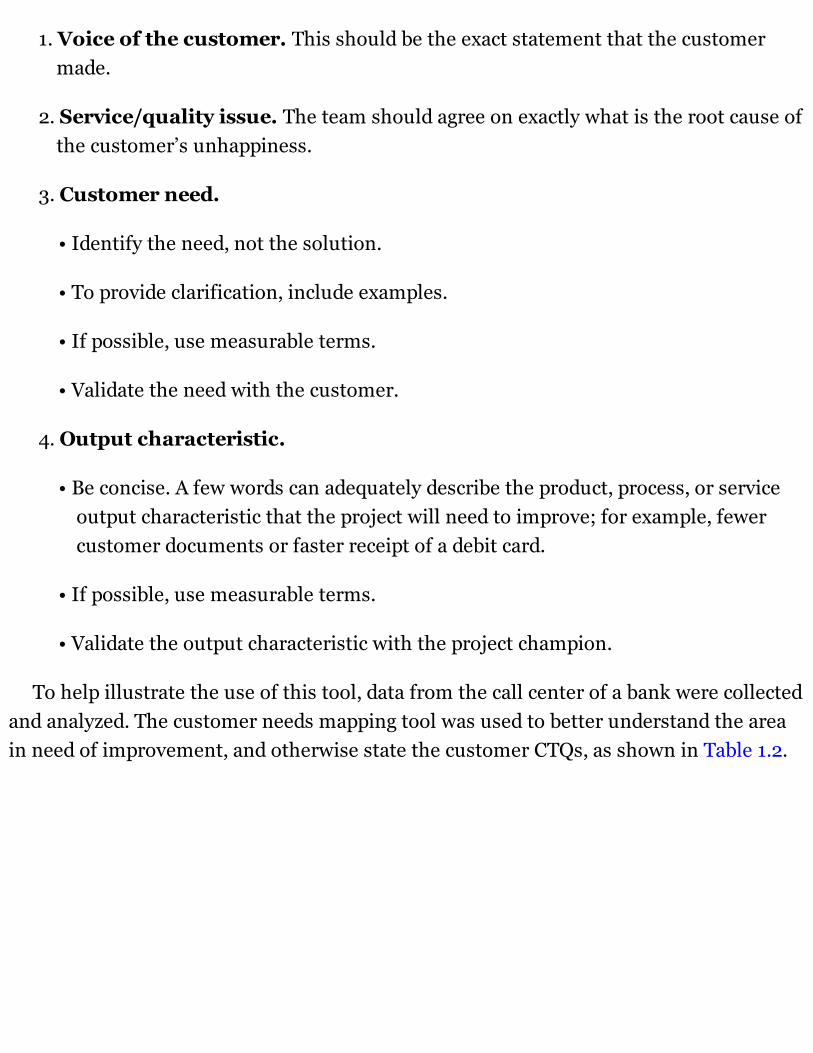
1. Voice of the customer. This should be the exact statement that the customermade.
2. Service/quality issue. The team should agree on exactly what is the root cause ofthe customer’s unhappiness.
3. Customer need.
• Identify the need, not the solution.
• To provide clarification, include examples.
• If possible, use measurable terms.
• Validate the need with the customer.
4. Output characteristic.
• Be concise. A few words can adequately describe the product, process, or serviceoutput characteristic that the project will need to improve; for example, fewercustomer documents or faster receipt of a debit card.
• If possible, use measurable terms.
• Validate the output characteristic with the project champion.
To help illustrate the use of this tool, data from the call center of a bank were collectedand analyzed. The customer needs mapping tool was used to better understand the areain need of improvement, and otherwise state the customer CTQs, as shown in Table 1.2.
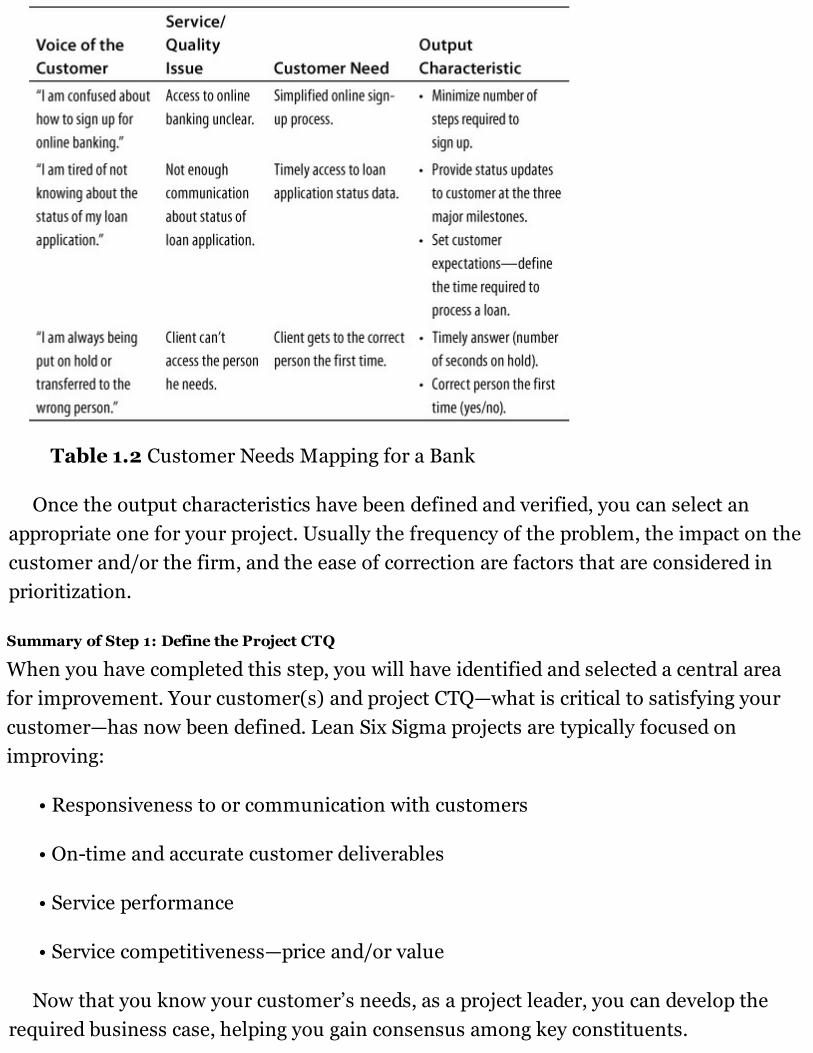
Table 1.2 Customer Needs Mapping for a Bank
Once the output characteristics have been defined and verified, you can select anappropriate one for your project. Usually the frequency of the problem, the impact on thecustomer and/or the firm, and the ease of correction are factors that are considered inprioritization.
Summary of Step 1: Define the Project CTQ
When you have completed this step, you will have identified and selected a central areafor improvement. Your customer(s) and project CTQ—what is critical to satisfying yourcustomer—has now been defined. Lean Six Sigma projects are typically focused onimproving:
• Responsiveness to or communication with customers
• On-time and accurate customer deliverables
• Service performance
• Service competitiveness—price and/or value
Now that you know your customer’s needs, as a project leader, you can develop therequired business case, helping you gain consensus among key constituents.
STEP 2: OUTLINE THE BUSINESS CASEThe second step in the Define phase (see Figure 1.3) focuses on solidifying the businesscase for the project, helping to address the following questions:
Figure 1.3 Define Phase Step 2
• Why should the project be done?
• What are the consequences of not doing the project?
• What is expected of the team?
• How does this project fit with business initiatives and goals?
When there is no compelling case, this is usually the point at which a project idea isrejected or abandoned.
A robust business case has five components:
1. Business case. An explanation of why the project should be pursued.
2. Problem and goal statements. A description of the problem or opportunity. Theproject’s objectives should be clear, concise, and presented in measurable terms.
3. Project scope. A definition of the boundaries of the process, service, or productthat is in need of improvement. Included and excluded components are welloutlined.
4. Team roles. The required resources, expectations, and responsibilities are laid out.
5. Financial benefits. The expected financial benefits (if any) are calculated basedon expected improvements.
If these components are developed adequately, you can ensure that the project will besuccessful. So let’s start with the problem and goal statements. The one thing to avoid isstating the problem in general and ambiguous terms; this will lead to confusion andscope creep. A good problem statement meets the SMART criteria:
S: Specific
M: Measurable
A: Attainable
R: Relevant
T: Time-bound
Problem Statement
The problem statement is an objective (quantifiable) description of the “pain”experienced by internal and/or external customers as a result of a poorly performingprocess or service. When writing the problem statement, consider the followingquestions:
• What is wrong or not meeting the customer’s need or expectations?
• When and where do the problems occur?
• How big is the problem, and what is its impact?
Here is an example of a poorly written problem statement:
“Our customers are angry with us, resulting in poor customer retention.”
Here is how it can be improved:
“In the second quarter (when), 15 percent of our customers have left the bankfor another institution (what). The current rate of attrition is up from 8percent to the current level of 15 percent (magnitude). This negatively affectsour operating cash flow (impact or consequence).
As the project leader, when you are writing the problem statement, you need to ensurethat the definition of the problem is based on observation and fact and not onassumptions. This will require the team to collect process data and analyze them to verifythe problem. Assigning or prejudging a root cause in the problem statement should beavoided, as this will undermine the effectiveness of improvements. For example, do notsay, “The rate of customer attrition has increased by 40 percent in the last quarterbecause of poor customer service.”
Goal Statement
The goal statement should define the team’s targeted improvement. It typically startswith a verb: reduce, increase, eliminate, or something similar. Since the root cause of theproblem is not known at this point in the project, it is difficult to really know what theend result will look like. Therefore, in the Define phase, the goal statement in thebusiness case tends to be broad; it is hard to know whether it is possible to reduce theerror rate by 50 percent or to eliminate customer attrition. However, the goal statementshould be refined to a more exact number after the Analyze phase, when the root cause ofthe problem has been identified and a strategy for improvement has been developed. Likethe problem statement, the goal statement must not assign blame, assume a root cause,or prescribe a solution. At this early stage, the goal should be tied to some percentageimprovement that the business or customer needs to see or feel in order to make theproject worthwhile.
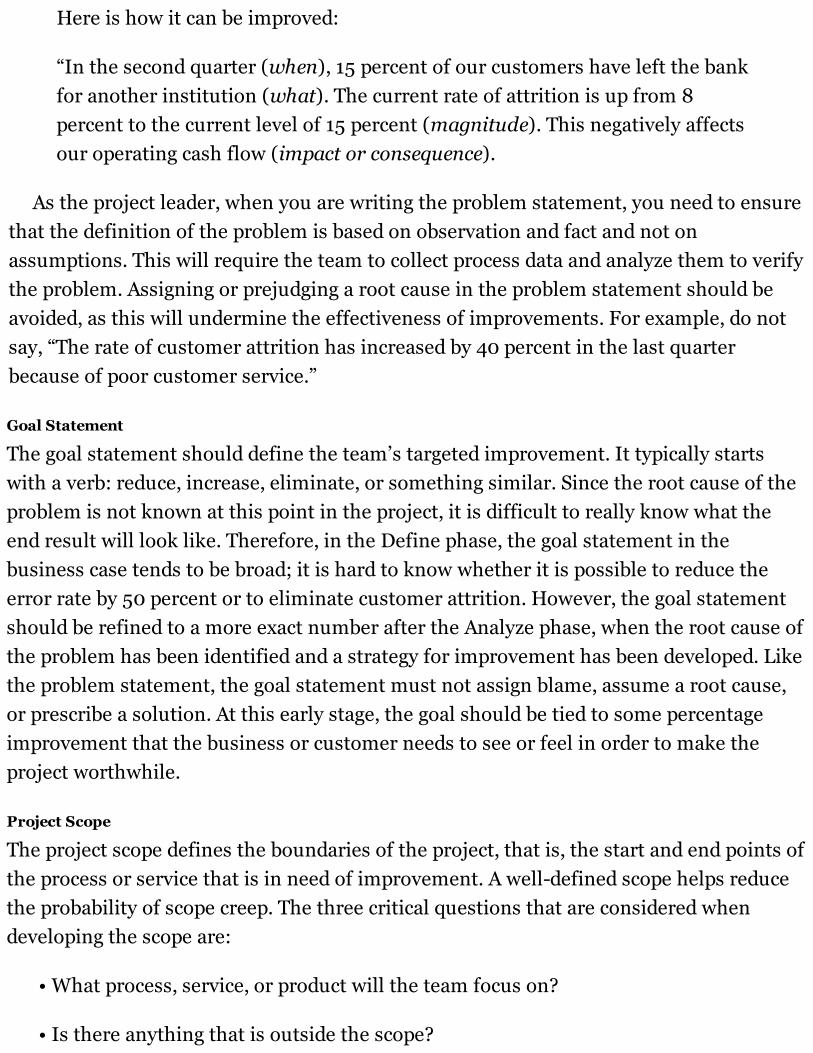
Project Scope
The project scope defines the boundaries of the project, that is, the start and end points ofthe process or service that is in need of improvement. A well-defined scope helps reducethe probability of scope creep. The three critical questions that are considered whendeveloping the scope are:
• What process, service, or product will the team focus on?
• Is there anything that is outside the scope?
• Are there any constraints (process, IT, resources, and so on) that must beconsidered?
The following is an example of scope for a project focused on reducing account-opening cycle time in branches:
Team Roles
A project cannot be executed solely by the Green Belt or Black Belt who is assigned to leadit. A cross-functional team, representing all the areas that will be directly affected by theproject, should be formed and assigned to the project. Most often the project leader doesnot have the depth or breadth of knowledge of the functional area required to define theproblem, collect the required data, analyze the root cause, and find the optimal solutions.In short, the project leader is not always an area expert. Having a team assigned to theGreen Belt or Black Belt:
• Helps reduce the project execution timeline:
There will be more resources available to complete tasks.
The probability of rework and execution error is reduced, as tasks will be assignedto subject-matter experts.
• Ensures buy-in from the various functional areas:
Successful projects always lead to change, and that is not always accepted byeveryone in the organization. Having a cross-functional team whose membersrepresent the various areas that will be affected by the change ensures that theseareas are involved in the problem and solution identification process. If the ideascome from the team, the probability of the improvements being accepted,implemented, and maintained is significantly higher.
Every Lean Six Sigma project has five types of roles involved in it:
• Project champion
• Project leader (Green or Black Belt)
• Key stakeholders
• Core cross-functional team
• Supplementary team
Project Champion
The champion is the individual who has initiated the improvement. Either the projectidea has come from her or she sees the need for change. The champion creates the senseof urgency for the improvement. She is also known as the barrier buster. At every stage ofproject execution, the project leader may be faced with resistance—team members may bereluctant to help, area managers may not assign the required resources to the project,functional managers may reject improvement ideas, and so on. The central role of theproject champion is to work within her sphere of influence to set the direction for theproject and to support the Green Belt or Black Belt in its execution. She is the liaisonbetween the project team and management, helping to create the need for change, settingthe direction for the project, assigning the required resources, allocating the requiredfunding, and removing any and all barriers to project execution. During the course of theproject, she reviews progress frequently. Furthermore, once the project has ended andchanges have been implemented, the project champion ensures that those changesrecommended by the team are not cast aside after a few months.
Project Leader
The project leader is typically a Black Belt and is allocated to the project full-time. TheBlack Belt is the key planner for the project and is ultimately responsible for thedeliverables: he defines the direction for project execution, determines the deliverables ineach phase, creates team assignments, follows progress, and acts as a link tomanagement. The project leader is responsible for maintaining project executionmomentum—any potential risks should be escalated to the Master Black Belt or projectchampion. The project leader is also responsible for keeping the champion and the keystakeholders updated on the status of the project.
Key Stakeholders

Key stakeholders are individuals whose areas, processes, and teams will be directlyaffected by the project. They are typically part of management. It is critical to identifythem during the Define phase, because without their buy-in and involvement, theprobability of long-term success will be reduced. It is the responsibility of the projectleader to always keep the key stakeholders abreast of the project status. Any signs ofresistance from the key stakeholders should be escalated to the project champion forquick resolution.
Core Cross-Functional Team
The members of the core team are expected to allocate 10 to 15 percent of their time tosupporting the project. These are functional area experts, representing the processes,services, or products that are within the scope of the project.
Supplementary Team
The members of the supplemental team act as support for the project on an as-neededbasis. The time commitment from these members is minimal. Examples ofsupplementary team members may include HR, whose expertise will be needed duringthe Control phase to help ensure sustainability, Compliance to sign off on documentationor process changes, or IT to support the extraction of data from the various databases.
Financial Benefits
There will be situations in which projects that do not provide significant financial benefitswill be selected for execution, for example, those dealing with compliance or regulatoryissues. However, for the most part, Lean Six Sigma projects should have financial benefitsassociated with them. If you are focused on reducing cycle time, this should yield areduction in touch time, and hence a reduction in labor. A reduction in cycle time alsoreduces inventory, such as unprocessed applications. The faster an account is opened, thefaster revenue can be realized.
Calculating the expected financial benefits helps prioritize improvement opportunitiesand creates motivation for the team.
Business Case Example
To pull all these concepts together, Figure 1.4 shows a completed business case. Anational bank’s lending division is losing customers to competitors. Based on VOC datacollected, the primary reason has been identified as response time. The business case hasbeen developed by the Black Belt to be presented to the project champion and the key
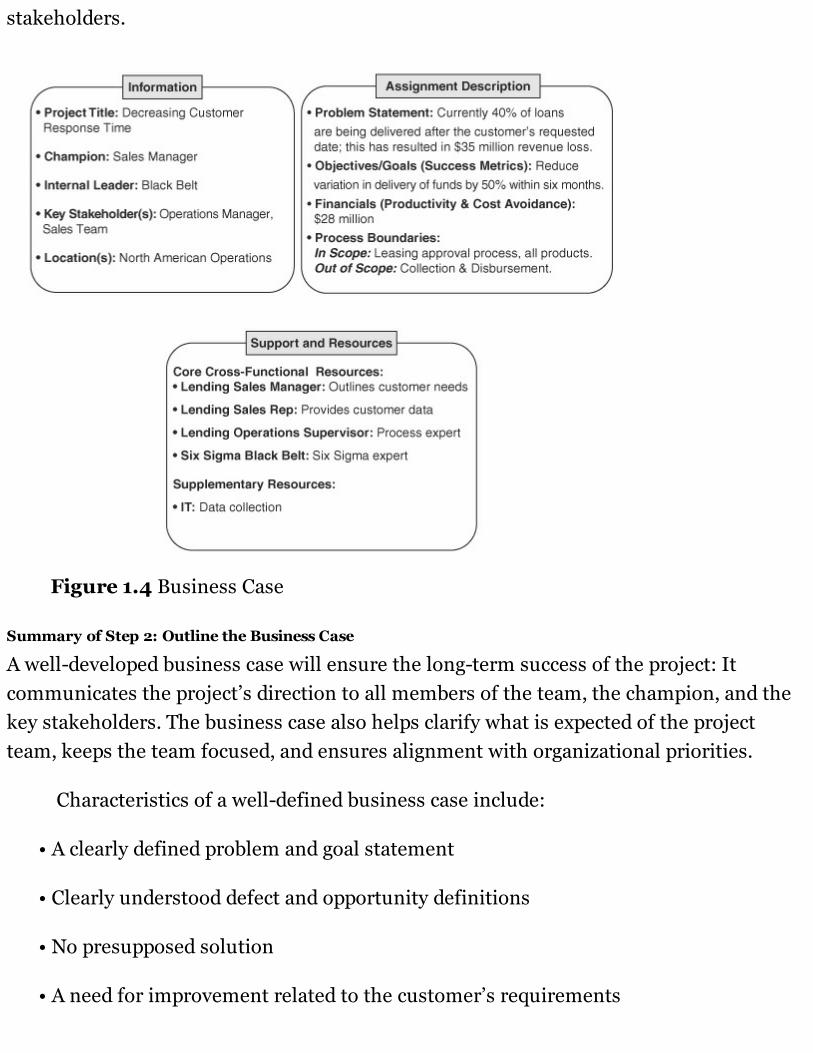
stakeholders.
Figure 1.4 Business Case
Summary of Step 2: Outline the Business Case
A well-developed business case will ensure the long-term success of the project: Itcommunicates the project’s direction to all members of the team, the champion, and thekey stakeholders. The business case also helps clarify what is expected of the projectteam, keeps the team focused, and ensures alignment with organizational priorities.
Characteristics of a well-defined business case include:
• A clearly defined problem and goal statement
• Clearly understood defect and opportunity definitions
• No presupposed solution
• A need for improvement related to the customer’s requirements
• Alignment of the project with a business strategy
• A manageable project scope—it can yield results within four to six months
• Identifiable and measurable impact
• Adequate resources assigned to the project
• A data-driven project!
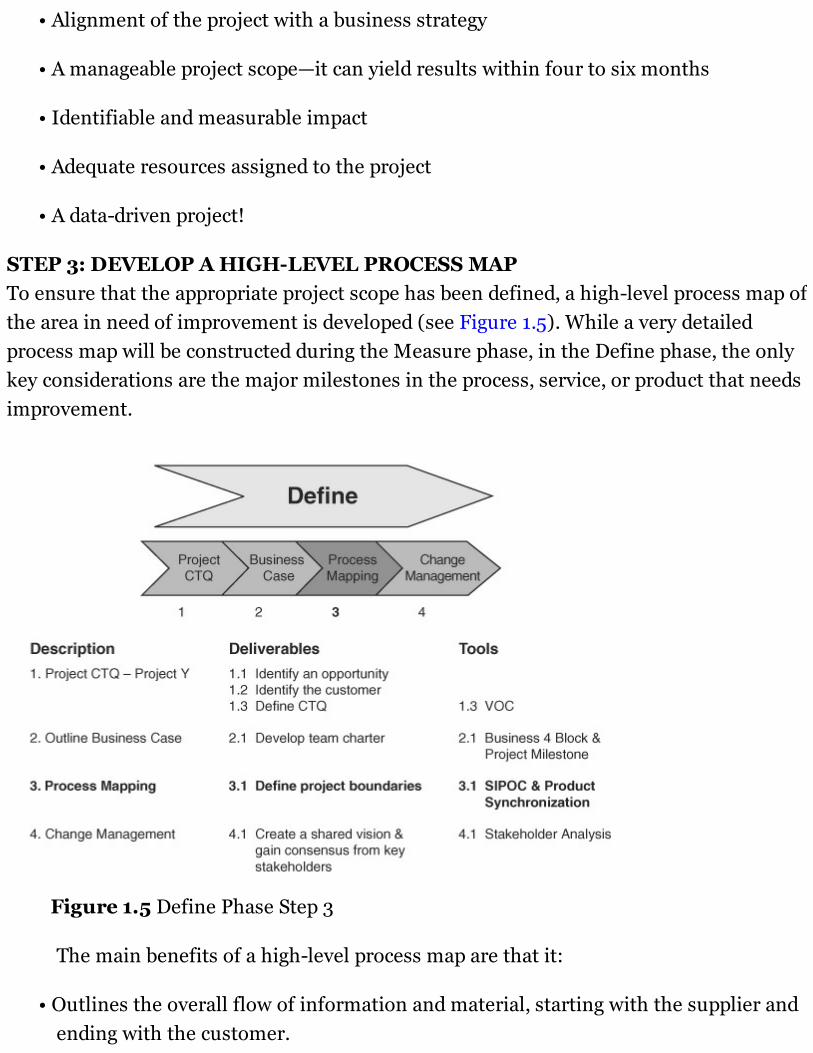
STEP 3: DEVELOP A HIGH-LEVEL PROCESS MAPTo ensure that the appropriate project scope has been defined, a high-level process map ofthe area in need of improvement is developed (see Figure 1.5). While a very detailedprocess map will be constructed during the Measure phase, in the Define phase, the onlykey considerations are the major milestones in the process, service, or product that needsimprovement.
Figure 1.5 Define Phase Step 3
The main benefits of a high-level process map are that it:
• Outlines the overall flow of information and material, starting with the supplier andending with the customer.
• Provides a graphical display of the steps, events, and operations and the relationshipof resources.
• Helps everyone involved in the project understand how the disparate parts of thecompany combine to provide a service or product.
There are two tools that you can use in completing this step:
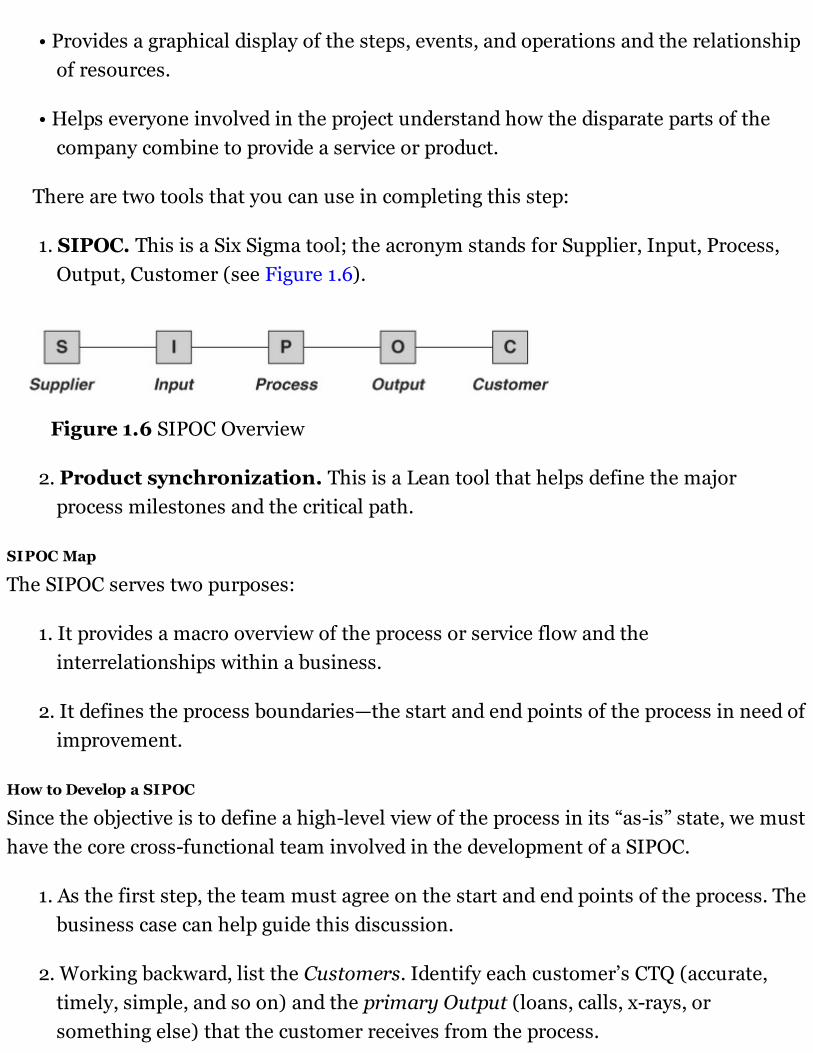
1. SIPOC. This is a Six Sigma tool; the acronym stands for Supplier, Input, Process,Output, Customer (see Figure 1.6).
Figure 1.6 SIPOC Overview
2. Product synchronization. This is a Lean tool that helps define the majorprocess milestones and the critical path.
SIPOC Map
The SIPOC serves two purposes:
1. It provides a macro overview of the process or service flow and theinterrelationships within a business.
2. It defines the process boundaries—the start and end points of the process in need ofimprovement.
How to Develop a SIPOC
Since the objective is to define a high-level view of the process in its “as-is” state, we musthave the core cross-functional team involved in the development of a SIPOC.
1. As the first step, the team must agree on the start and end points of the process. Thebusiness case can help guide this discussion.
2. Working backward, list the Customers. Identify each customer’s CTQ (accurate,timely, simple, and so on) and the primary Output (loans, calls, x-rays, orsomething else) that the customer receives from the process.
3. With the C and O of the SIPOC defined, using brainstorming techniques, the teamshould outline the five to seven high-level Process steps that result in the outputs.Process steps typically start with a verb.
4. Once the team has agreed on the process steps, the critical Inputs that affect thequality of the process can be identified.
5. The last step is to list all the Suppliers that provide inputs to the process.
6. The SIPOC should then be validated by walking the actual process.
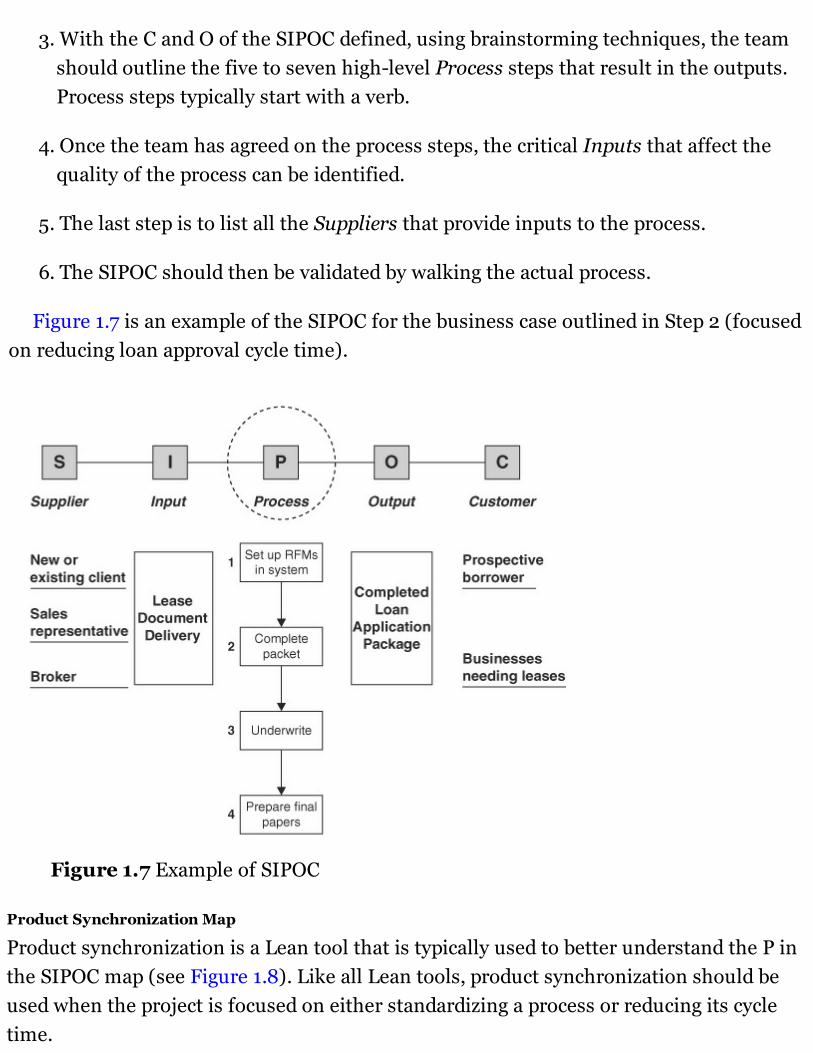
Figure 1.7 is an example of the SIPOC for the business case outlined in Step 2 (focusedon reducing loan approval cycle time).
Figure 1.7 Example of SIPOC
Product Synchronization Map
Product synchronization is a Lean tool that is typically used to better understand the P inthe SIPOC map (see Figure 1.8). Like all Lean tools, product synchronization should beused when the project is focused on either standardizing a process or reducing its cycletime.
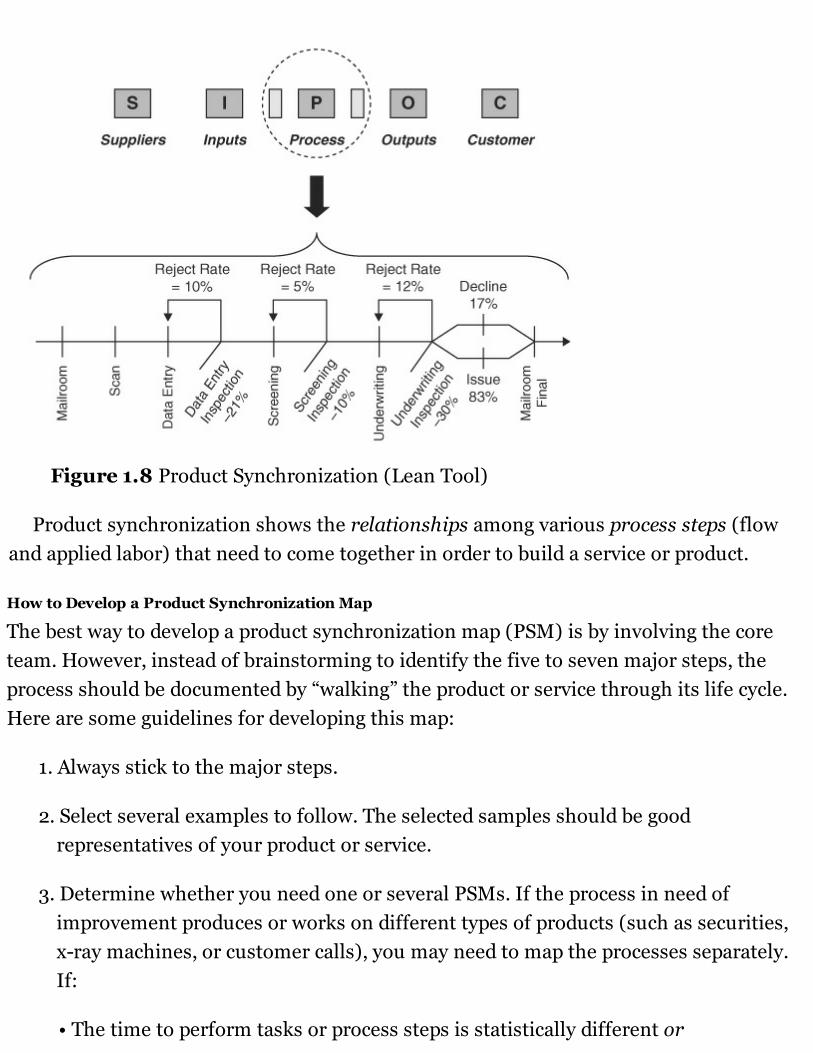
Figure 1.8 Product Synchronization (Lean Tool)
Product synchronization shows the relationships among various process steps (flowand applied labor) that need to come together in order to build a service or product.
How to Develop a Product Synchronization Map
The best way to develop a product synchronization map (PSM) is by involving the coreteam. However, instead of brainstorming to identify the five to seven major steps, theprocess should be documented by “walking” the product or service through its life cycle.Here are some guidelines for developing this map:
1. Always stick to the major steps.
2. Select several examples to follow. The selected samples should be goodrepresentatives of your product or service.
3. Determine whether you need one or several PSMs. If the process in need ofimprovement produces or works on different types of products (such as securities,x-ray machines, or customer calls), you may need to map the processes separately.If:
• The time to perform tasks or process steps is statistically different or
• The process steps that the product or service goes through are different, thenseparate PSMs will be needed.
4. Process options and variations should be documented. An example of an option isdata entry inspection (QA) in Figure 1.8. Of all new applications, only 21 percent areaudited for data entry errors. As for variations in the process, after underwriting, theprocess splits, with 17 percent of the applications being declined and the rest beingissued.
5. Any rework loops or fall-out points in the process should be included.
• Any rework point or reject rate greater than 1 percent should be included in themap.
The product synchronization map, like the SIPOC, presents only the high-level view ofa process or service that is in need of improvement. Product synchronization providesmore detail concerning the P of SIPOC. Its main objectives are to collect information thatis critical to reducing process cycle time and increasing standardization. Using the PSM,you can now better identify flow issues caused by:
1. Redundancies
2. Implicit or unclear requirements
3. Tricky handoffs
4. Conflicting objectives
5. Common problem areas or high rework rates
Summary of Step 3: Develop a High-Level Process Map
Once the business case has been completed, a high-level “as-is” process map of the areabeing focused on should be developed. This graphical representation of the process willensure that all constituents are in agreement regarding the scope of the project and theprocess, product, or services involved. Clearly defining the Customer, the existing processOutputs, major Process steps, the Inputs to the process, and the individuals or entitiesthat Supply the inputs will eliminate all assumptions and ambiguities.
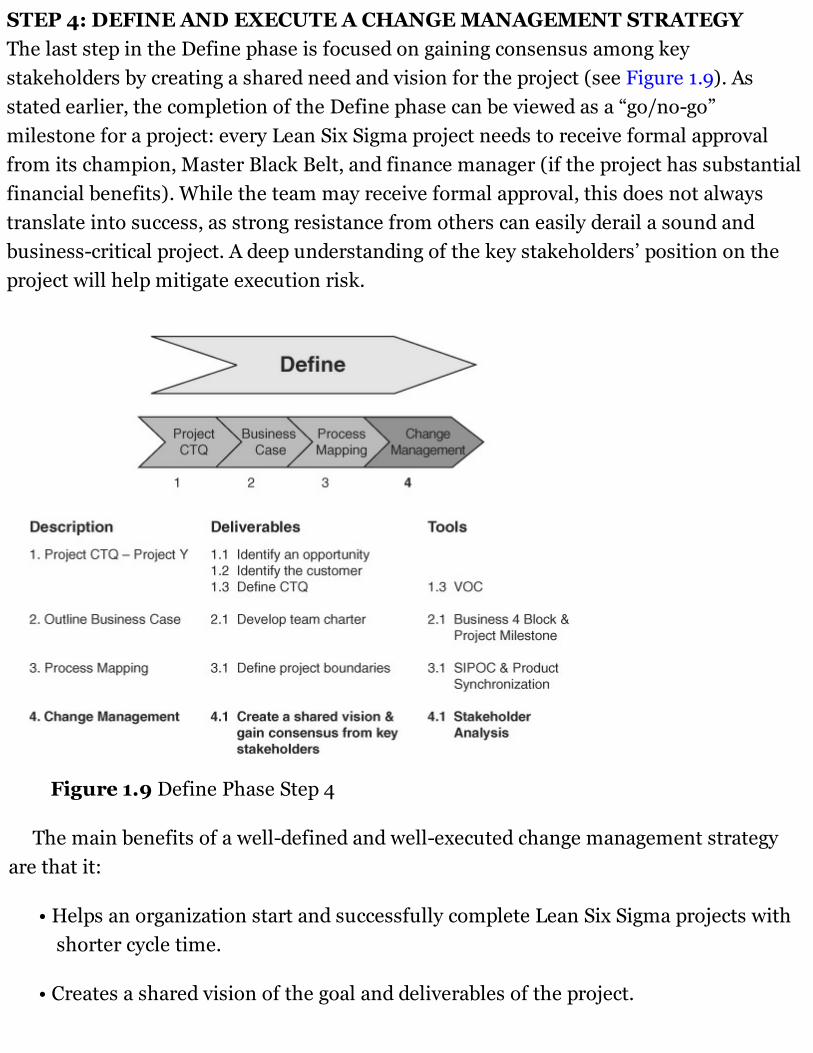
STEP 4: DEFINE AND EXECUTE A CHANGE MANAGEMENT STRATEGYThe last step in the Define phase is focused on gaining consensus among keystakeholders by creating a shared need and vision for the project (see Figure 1.9). Asstated earlier, the completion of the Define phase can be viewed as a “go/no-go”milestone for a project: every Lean Six Sigma project needs to receive formal approvalfrom its champion, Master Black Belt, and finance manager (if the project has substantialfinancial benefits). While the team may receive formal approval, this does not alwaystranslate into success, as strong resistance from others can easily derail a sound andbusiness-critical project. A deep understanding of the key stakeholders’ position on theproject will help mitigate execution risk.
Figure 1.9 Define Phase Step 4
The main benefits of a well-defined and well-executed change management strategyare that it:
• Helps an organization start and successfully complete Lean Six Sigma projects withshorter cycle time.
• Creates a shared vision of the goal and deliverables of the project.
• Ensures that you have the buy-in of key stakeholders prior to starting the project.
Helps identify the key stakeholders.
Outlines their required level of support if the project is to be a success.
• Allows for efficient implementation of solutions.
Increases access to required resources and data.
• Ensures that the Control portion of the project is sustainable—that there is an easyhandoff.
Change Management Milestones and Tools
A Lean Six Sigma change management strategy has five distinct milestones:
1. Identifying change leadership. Every project will need a champion who willsponsor the change.
2. Developing a shared need. The project leader and champion have to clearlyarticulate the need for change. It is best to leverage the business case. The need forchange can be driven by a threat or opportunity, or it can be instilled within theorganization and widely shared through data, demonstration, or demand.
3. Shaping a vision. The desired outcome of the project is clear, legitimate, widelyunderstood, and shared.
4. Mobilizing commitment. There is a strong commitment from key constituentsto invest in change. The team leader is to demand and receive managementattention.
5. Institutionalizing the change and monitoring progress. Once change isstarted, it endures, and best practices are transferred throughout the organization.
There are several tools that can be used to ensure that a shared need has been created,that all constituents have the same vision for the project, and that all points of resistancehave been identified.
Threat vs. Opportunity Matrix
The threat vs. opportunity matrix (see Figure 1.10) is a simple tool that can be utilized in
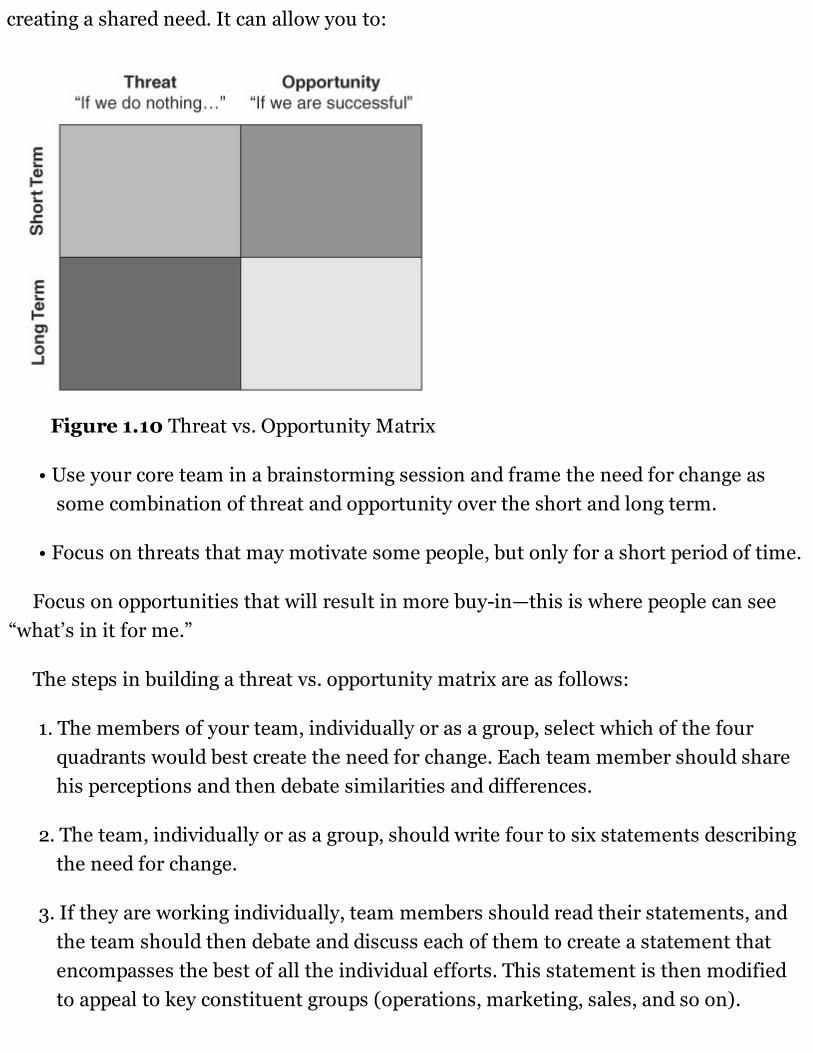
creating a shared need. It can allow you to:
Figure 1.10 Threat vs. Opportunity Matrix
• Use your core team in a brainstorming session and frame the need for change assome combination of threat and opportunity over the short and long term.
• Focus on threats that may motivate some people, but only for a short period of time.
Focus on opportunities that will result in more buy-in—this is where people can see“what’s in it for me.”
The steps in building a threat vs. opportunity matrix are as follows:
1. The members of your team, individually or as a group, select which of the fourquadrants would best create the need for change. Each team member should sharehis perceptions and then debate similarities and differences.
2. The team, individually or as a group, should write four to six statements describingthe need for change.
3. If they are working individually, team members should read their statements, andthe team should then debate and discuss each of them to create a statement thatencompasses the best of all the individual efforts. This statement is then modifiedto appeal to key constituent groups (operations, marketing, sales, and so on).

Figure 1.11 is an example of a completed threat vs. opportunity matrix for “reducingcycle time.”
Figure 1.11 Completed Threat vs. Opportunity Matrix
Elevator Speech
The elevator speech is an ideal tool for creating a vision that can be articulated in 90seconds or less. The vision must clearly outline the future state, one for which genuinecommitment can be gained from the key stakeholders. Additionally, a well-defined visionmust appeal to both the “head” and the “heart” of the project’s team members and keystakeholders.
The best way to create an elevator speech is by conducting a brainstorming sessionwith the core team. The speech must provide answers to the following questions:
1. What is our project about?
2. Why is it important to do?
3. What will success look like?
4. What do we need from the key stakeholders?
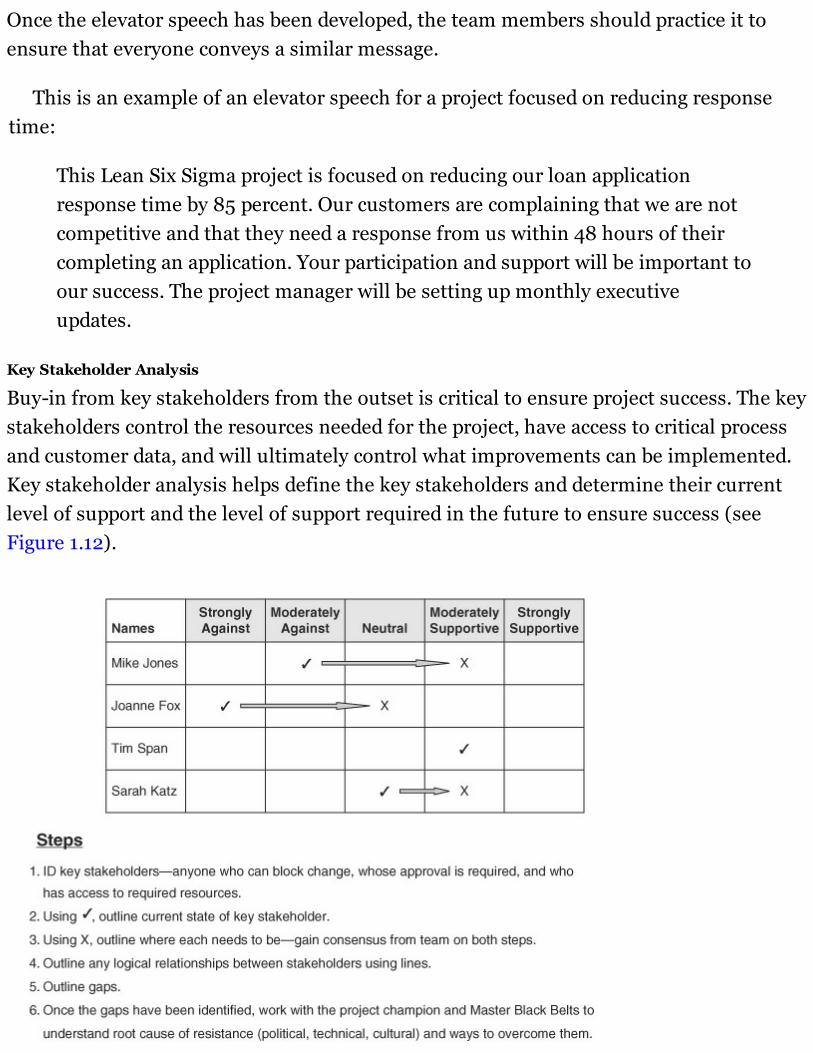
Once the elevator speech has been developed, the team members should practice it toensure that everyone conveys a similar message.
This is an example of an elevator speech for a project focused on reducing responsetime:
This Lean Six Sigma project is focused on reducing our loan applicationresponse time by 85 percent. Our customers are complaining that we are notcompetitive and that they need a response from us within 48 hours of theircompleting an application. Your participation and support will be important toour success. The project manager will be setting up monthly executiveupdates.
Key Stakeholder Analysis
Buy-in from key stakeholders from the outset is critical to ensure project success. The keystakeholders control the resources needed for the project, have access to critical processand customer data, and will ultimately control what improvements can be implemented.Key stakeholder analysis helps define the key stakeholders and determine their currentlevel of support and the level of support required in the future to ensure success (seeFigure 1.12).
Figure 1.12 Key Stakeholder Analysis
A quick reminder: a key stakeholder is any person or group of people that is:
• Responsible for the final decision
• Likely to be affected, positively or negatively, by the outcomes you want
• In a position to assist or block your achievement of the outcomes
• An expert or special resource that could substantially affect the quality of your endproduct or service
• Able to have influence over other stakeholders
Summary of Step 4: Define and Execute a Change Management Strategy
Change management is not focused on the robustness of the quality strategy, whether theright candidates have been selected for Green Belt or Black Belt positions, or whether theright tools have been used to yield solutions. Rather, its central deliverable is to ensurethat an environment supporting long-term success has been created—a culture ofacceptance. An excellent solution without the appropriate level of buy-in will not lead tosuccess. It is important to remember the six milestones of change managementthroughout project execution, starting with identifying the key stakeholders and creatinga vision to mobilizing commitment by recognizing and respecting others’ style.
DEFINE PHASE SUMMARYThe Define phase is one of the more challenging steps as it requires the Green Belt orBlack Belt to clearly outline the need for change. Uncovering an improvementopportunity is not always a comfortable topic of discussion for all members of leadership—it inherently brings to light issues that have been overcompensated or ignored in thepast. However the project leader can better facilitate discussion and remove emotion byusing data in problem and goal statements. The more precise and accurate the definitionof the opportunity, the better the chances that the project will be prioritized accordingly.It should also be noted that it is typically in the Define phase that a project is eitheraccepted or rejected by the leadership team. And any rejections should not be viewed asfailure by the Green Belt or Black Belt, rather it is cause for celebration. Thanks to herdue diligence the company avoided investing time and money on an issue that isnoncritical or blown out of proportion.
DEFINE PHASE CHECKLIST Define the customer (internal or external).
Outline the customer’s critical to quality (CTQ) parameter(s).
Develop a business case—determine the problem and goal statements, milestones,scope, resources, and financial benefits.
Define a high-level as-is state of the business process.
Gain consensus on the business case and mobilize the required resources.
QUESTIONS TO ASK AT THE END OF THE DEFINE PHASE1. Will my customer(s) recognize our project CTQ list?
2. Are we working on the biggest customer issue first?
3. What sources of information and data did we use?
4. What do we measure internally today to track performance?
5. Do we understand the high-level information and data flow?
6. Do we have consensus from the key stakeholders?
APPLICATION OF LEAN SIX SIGMA CASE STUDY—DEFINE PHASEDELIVERABLESThe following case study illustrates the Define phase of a Lean Six Sigma project.
Step 1: Problem Overview
The quality team at a commercial lending company is approached by the director of sales.
He is very concerned about meeting his sales numbers this year. The people on hissales team have been telling him that they are losing deals to competitors because ofcustomer satisfaction issues: they cannot meet the customers’ expectations in terms ofdelivering funds on time. Consequently, the customers are getting their loans from thefirm’s competitors.
The sales director wants to know how the company can use Lean Six Sigma to decrease
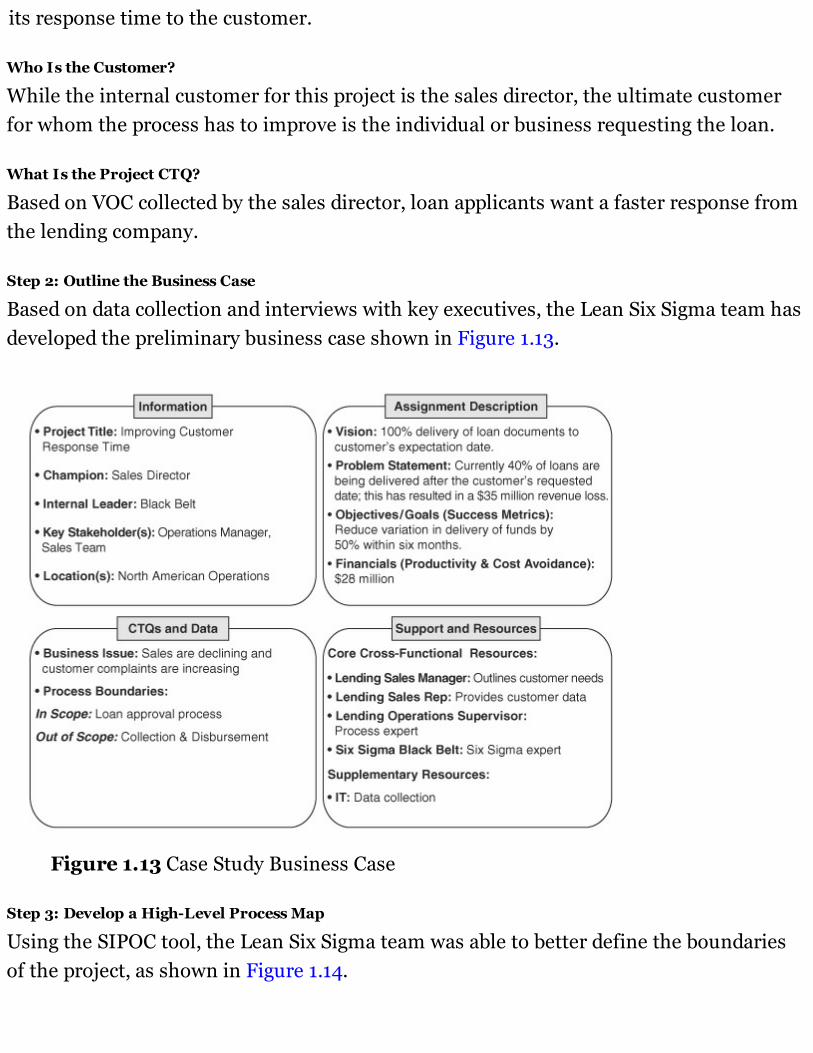
its response time to the customer.
Who Is the Customer?
While the internal customer for this project is the sales director, the ultimate customerfor whom the process has to improve is the individual or business requesting the loan.
What Is the Project CTQ?
Based on VOC collected by the sales director, loan applicants want a faster response fromthe lending company.
Step 2: Outline the Business Case
Based on data collection and interviews with key executives, the Lean Six Sigma team hasdeveloped the preliminary business case shown in Figure 1.13.
Figure 1.13 Case Study Business Case
Step 3: Develop a High-Level Process Map
Using the SIPOC tool, the Lean Six Sigma team was able to better define the boundariesof the project, as shown in Figure 1.14.
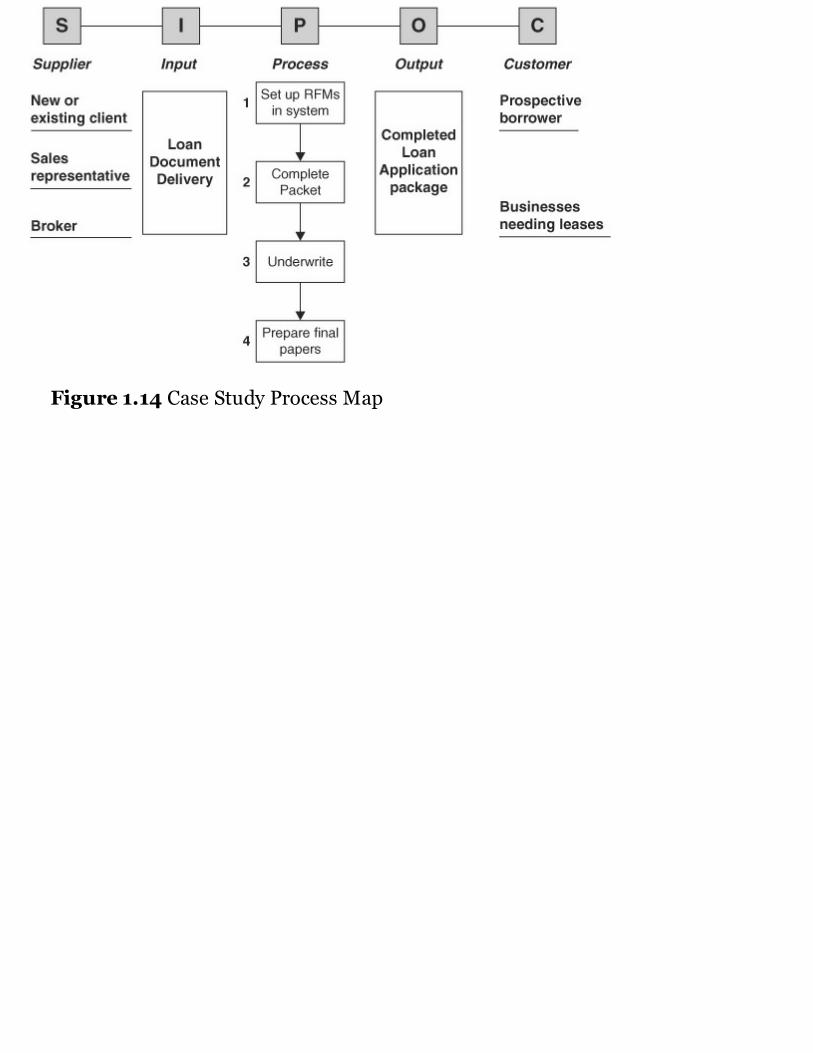
Figure 1.14 Case Study Process Map

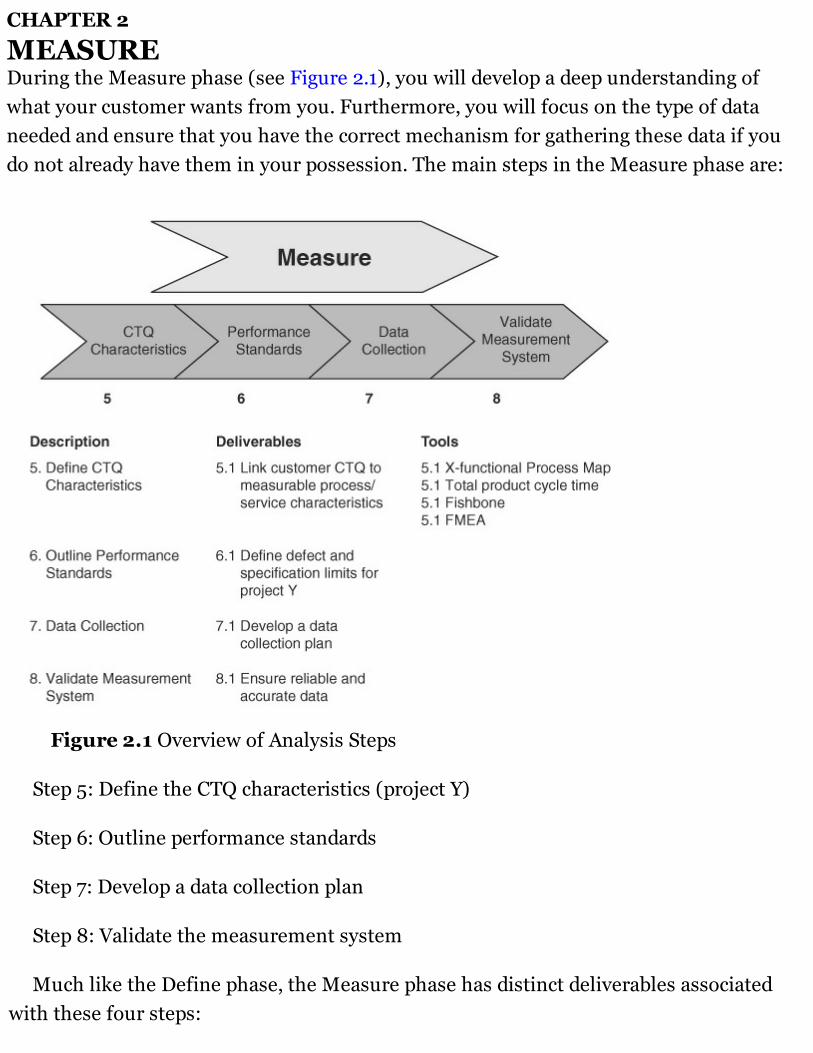
CHAPTER 2
MEASUREDuring the Measure phase (see Figure 2.1), you will develop a deep understanding ofwhat your customer wants from you. Furthermore, you will focus on the type of dataneeded and ensure that you have the correct mechanism for gathering these data if youdo not already have them in your possession. The main steps in the Measure phase are:
Figure 2.1 Overview of Analysis Steps
Step 5: Define the CTQ characteristics (project Y)
Step 6: Outline performance standards
Step 7: Develop a data collection plan
Step 8: Validate the measurement system
Much like the Define phase, the Measure phase has distinct deliverables associatedwith these four steps:
• Drill down on customer critical-to-quality parameters (CTQs), also known as the bigY to little y, where little y is the process(es) that has the largest impact on the big Y(customer CTQ).
• Performance standard for big Y.
• A detailed process map
• A definition of the defect, developed by reviewing the competition and customerrequirements
• Validate that the defect definition can be measured (data source validated)
• Establish and distinguish between data types involved (discrete/attribute vs.continuous/variable)
• Initiation of the data-gathering process
• Validation of the accuracy and reliability of the data collected
Looking at these deliverables, the Measure phase is better defined as one that allowsyou to develop a better understanding of the project.
STEP 5: DEFINE THE CTQ CHARACTERISTICS (PROJECT Y)As you progress through this phase, you will link the customer requirement (the projectCTQ) to the element(s) of the process that need to be improved because they have thelargest impact on the CTQ (the project Y). For example, you may know that your projectCTQ (or what the customer has asked of you) is “on-time delivery of funds”; by the end ofthis step, through the use of various tools, you will have determined that the largestdriver of “on-time delivery” is the “loan approval process.” And that is your project y—thecycle time required to approve applications for loans. Asking a series of questions willguide you on the journey of moving from the project big Y (what the customer wants) tothe little y (the process with highest impact on the customer want):
What am I trying to improve?
What does the customer deem essential?
How do I set up a project to meet the customer’s needs?

The first question may seem obvious and easy to answer, but in reality, answering itmay be a more complex exercise. Deciding exactly what it is you are trying to improvewill force you to understand what your customer deems critical and what processes orprocess elements affect the customer’s expectation. To help you arrive at the answer tothese questions, specific tools are available:
• Process map
• Fishbone diagram
• FMEA
X-Functional Process Map
Process mapping is a powerful tool in developing an understanding of how a business isperforming and, more important, how it is not. Through the use of the two differentforms of process maps we outline here, you can get a “street-level” view of youroperations. The central benefits of process mapping are that it:
1. Provides the ability to uncover problem areas in your business, particularly if theyhave historically been overlooked.
2. Enables the entire group to have a clear view of how a particular operation is failingto meet customer needs.
3. Helps pinpoint the data that you need—and may not possess.
4. Eliminates the perception of how a process works by documenting how it actuallyflows.
It is essential that you depict things (operations, process flow, and so on) as you seethem while you are conducting your research. You must not attempt to gloss overanything. Rather, you must show things as they actually occur in your organization.
The rule of thumb for process mapping is that you need to become the thing that youare trying to map—the loan application, the CT machine you manufacture, or the newemployee you are trying to hire. Every transformation, waiting point, inspection, rework,reentry, and anything else you find must be documented. The devil is always in thedetails. The toughest part of process mapping is not putting one process step in front ofthe other, but determining the level of detail in which to document the process. For that,
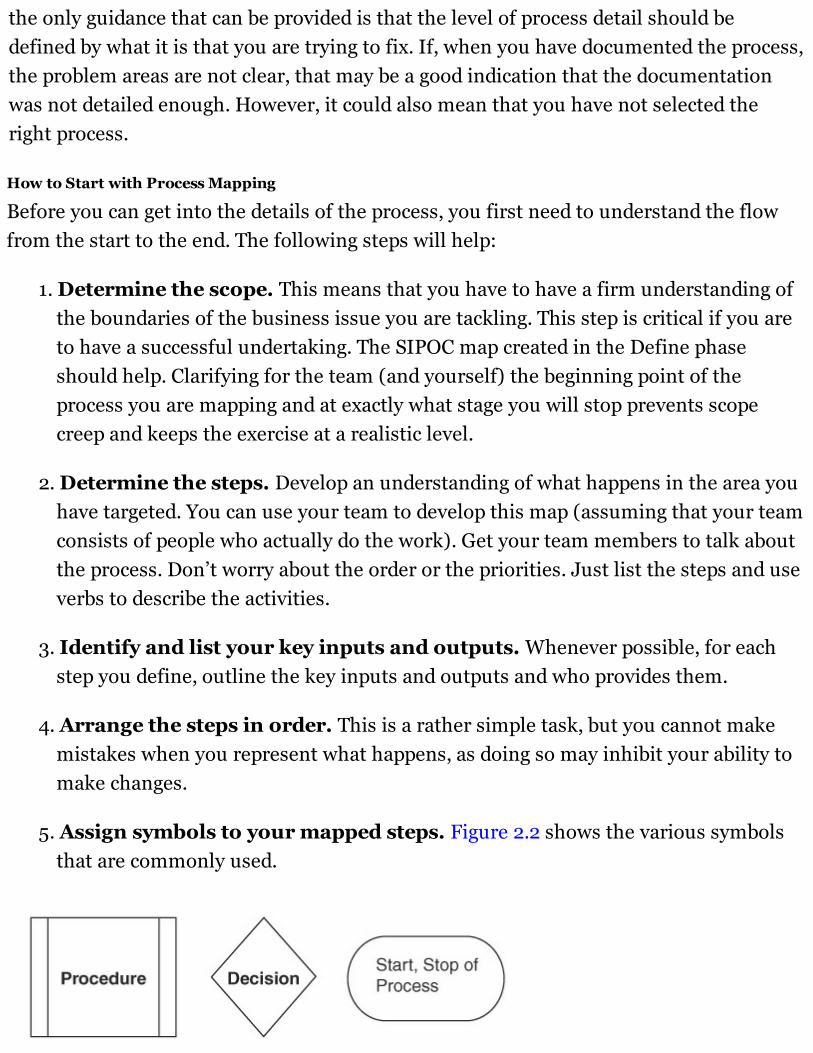
the only guidance that can be provided is that the level of process detail should bedefined by what it is that you are trying to fix. If, when you have documented the process,the problem areas are not clear, that may be a good indication that the documentationwas not detailed enough. However, it could also mean that you have not selected theright process.
How to Start with Process Mapping
Before you can get into the details of the process, you first need to understand the flowfrom the start to the end. The following steps will help:
1. Determine the scope. This means that you have to have a firm understanding ofthe boundaries of the business issue you are tackling. This step is critical if you areto have a successful undertaking. The SIPOC map created in the Define phaseshould help. Clarifying for the team (and yourself) the beginning point of theprocess you are mapping and at exactly what stage you will stop prevents scopecreep and keeps the exercise at a realistic level.
2. Determine the steps. Develop an understanding of what happens in the area youhave targeted. You can use your team to develop this map (assuming that your teamconsists of people who actually do the work). Get your team members to talk aboutthe process. Don’t worry about the order or the priorities. Just list the steps and useverbs to describe the activities.
3. Identify and list your key inputs and outputs. Whenever possible, for eachstep you define, outline the key inputs and outputs and who provides them.
4. Arrange the steps in order. This is a rather simple task, but you cannot makemistakes when you represent what happens, as doing so may inhibit your ability tomake changes.
5. Assign symbols to your mapped steps. Figure 2.2 shows the various symbolsthat are commonly used.
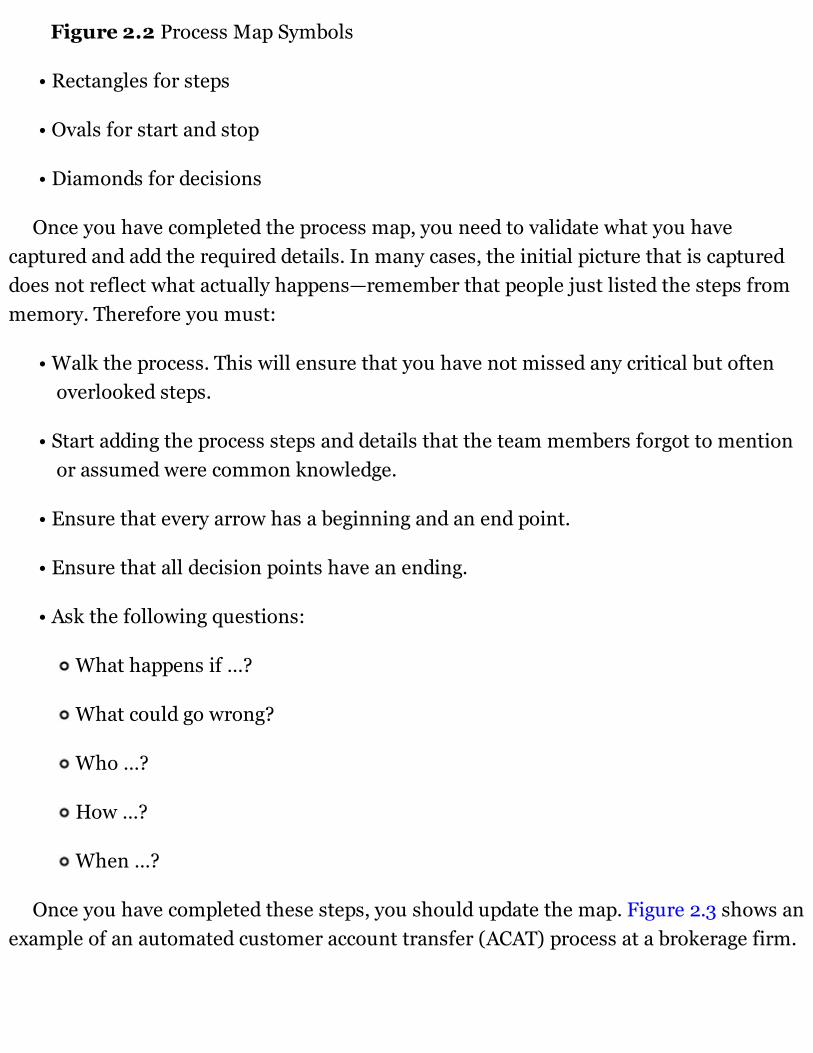
Figure 2.2 Process Map Symbols
• Rectangles for steps
• Ovals for start and stop
• Diamonds for decisions
Once you have completed the process map, you need to validate what you havecaptured and add the required details. In many cases, the initial picture that is captureddoes not reflect what actually happens—remember that people just listed the steps frommemory. Therefore you must:
• Walk the process. This will ensure that you have not missed any critical but oftenoverlooked steps.
• Start adding the process steps and details that the team members forgot to mentionor assumed were common knowledge.
• Ensure that every arrow has a beginning and an end point.
• Ensure that all decision points have an ending.
• Ask the following questions:
What happens if …?
What could go wrong?
Who …?
How …?
When …?
Once you have completed these steps, you should update the map. Figure 2.3 shows anexample of an automated customer account transfer (ACAT) process at a brokerage firm.
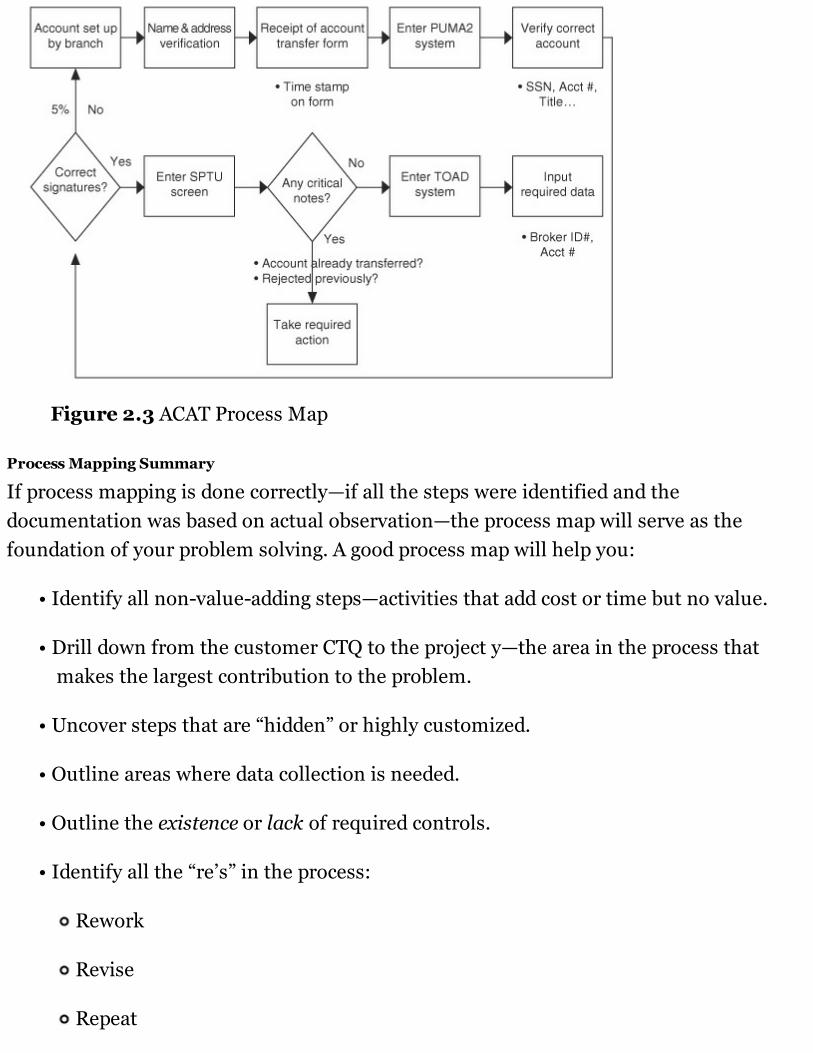
Figure 2.3 ACAT Process Map
Process Mapping Summary
If process mapping is done correctly—if all the steps were identified and thedocumentation was based on actual observation—the process map will serve as thefoundation of your problem solving. A good process map will help you:
• Identify all non-value-adding steps—activities that add cost or time but no value.
• Drill down from the customer CTQ to the project y—the area in the process thatmakes the largest contribution to the problem.
• Uncover steps that are “hidden” or highly customized.
• Outline areas where data collection is needed.
• Outline the existence or lack of required controls.
• Identify all the “re’s” in the process:
Rework
Revise
Repeat
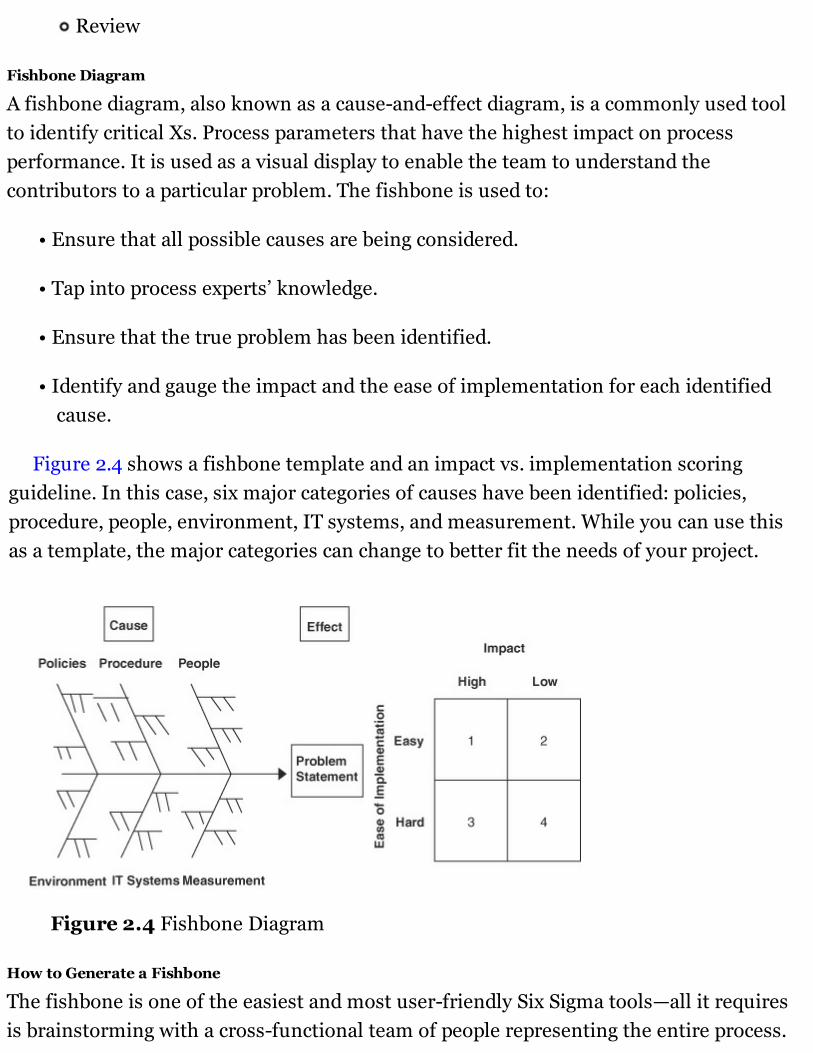
Review
Fishbone Diagram
A fishbone diagram, also known as a cause-and-effect diagram, is a commonly used toolto identify critical Xs. Process parameters that have the highest impact on processperformance. It is used as a visual display to enable the team to understand thecontributors to a particular problem. The fishbone is used to:
• Ensure that all possible causes are being considered.
• Tap into process experts’ knowledge.
• Ensure that the true problem has been identified.
• Identify and gauge the impact and the ease of implementation for each identifiedcause.
Figure 2.4 shows a fishbone template and an impact vs. implementation scoringguideline. In this case, six major categories of causes have been identified: policies,procedure, people, environment, IT systems, and measurement. While you can use thisas a template, the major categories can change to better fit the needs of your project.
Figure 2.4 Fishbone Diagram
How to Generate a Fishbone
The fishbone is one of the easiest and most user-friendly Six Sigma tools—all it requiresis brainstorming with a cross-functional team of people representing the entire process.
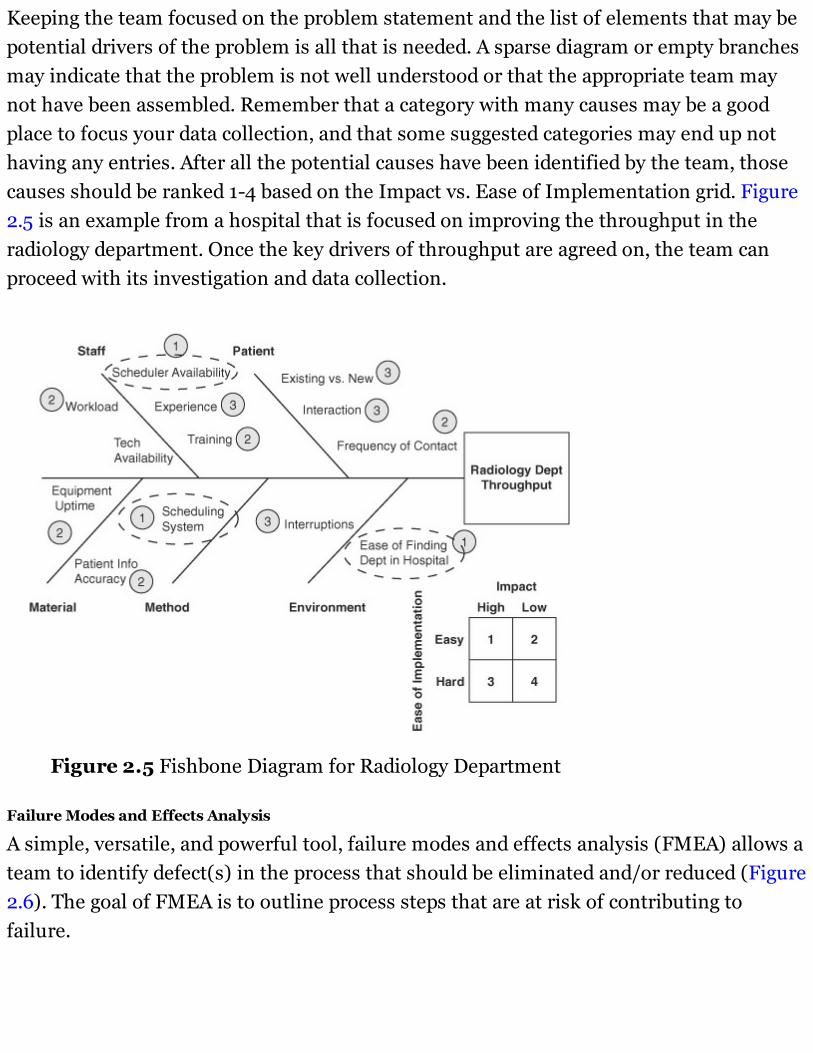
Keeping the team focused on the problem statement and the list of elements that may bepotential drivers of the problem is all that is needed. A sparse diagram or empty branchesmay indicate that the problem is not well understood or that the appropriate team maynot have been assembled. Remember that a category with many causes may be a goodplace to focus your data collection, and that some suggested categories may end up nothaving any entries. After all the potential causes have been identified by the team, thosecauses should be ranked 1-4 based on the Impact vs. Ease of Implementation grid. Figure2.5 is an example from a hospital that is focused on improving the throughput in theradiology department. Once the key drivers of throughput are agreed on, the team canproceed with its investigation and data collection.
Figure 2.5 Fishbone Diagram for Radiology Department
Failure Modes and Effects Analysis
A simple, versatile, and powerful tool, failure modes and effects analysis (FMEA) allows ateam to identify defect(s) in the process that should be eliminated and/or reduced (Figure2.6). The goal of FMEA is to outline process steps that are at risk of contributing tofailure.
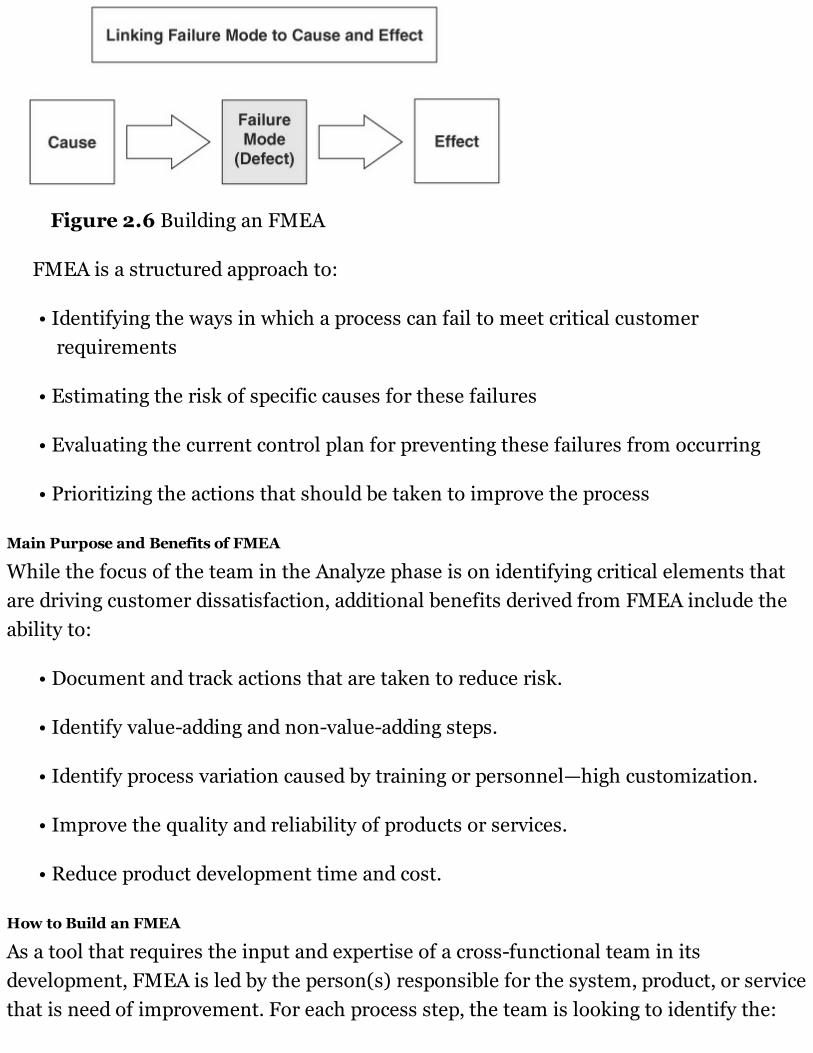
Figure 2.6 Building an FMEA
FMEA is a structured approach to:
• Identifying the ways in which a process can fail to meet critical customerrequirements
• Estimating the risk of specific causes for these failures
• Evaluating the current control plan for preventing these failures from occurring
• Prioritizing the actions that should be taken to improve the process
Main Purpose and Benefits of FMEA
While the focus of the team in the Analyze phase is on identifying critical elements thatare driving customer dissatisfaction, additional benefits derived from FMEA include theability to:
• Document and track actions that are taken to reduce risk.
• Identify value-adding and non-value-adding steps.
• Identify process variation caused by training or personnel—high customization.
• Improve the quality and reliability of products or services.
• Reduce product development time and cost.
How to Build an FMEA
As a tool that requires the input and expertise of a cross-functional team in itsdevelopment, FMEA is led by the person(s) responsible for the system, product, or servicethat is need of improvement. For each process step, the team is looking to identify the:
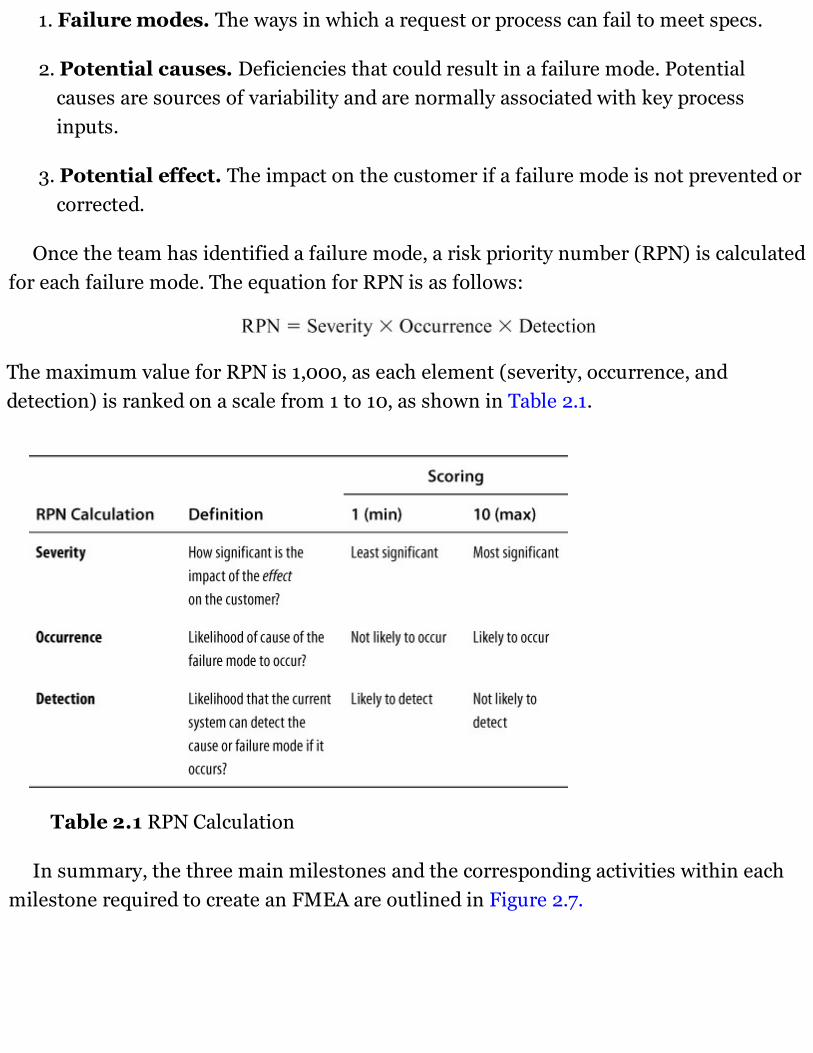
1. Failure modes. The ways in which a request or process can fail to meet specs.
2. Potential causes. Deficiencies that could result in a failure mode. Potentialcauses are sources of variability and are normally associated with key processinputs.
3. Potential effect. The impact on the customer if a failure mode is not prevented orcorrected.
Once the team has identified a failure mode, a risk priority number (RPN) is calculatedfor each failure mode. The equation for RPN is as follows:
The maximum value for RPN is 1,000, as each element (severity, occurrence, anddetection) is ranked on a scale from 1 to 10, as shown in Table 2.1.
Table 2.1 RPN Calculation
In summary, the three main milestones and the corresponding activities within eachmilestone required to create an FMEA are outlined in Figure 2.7.
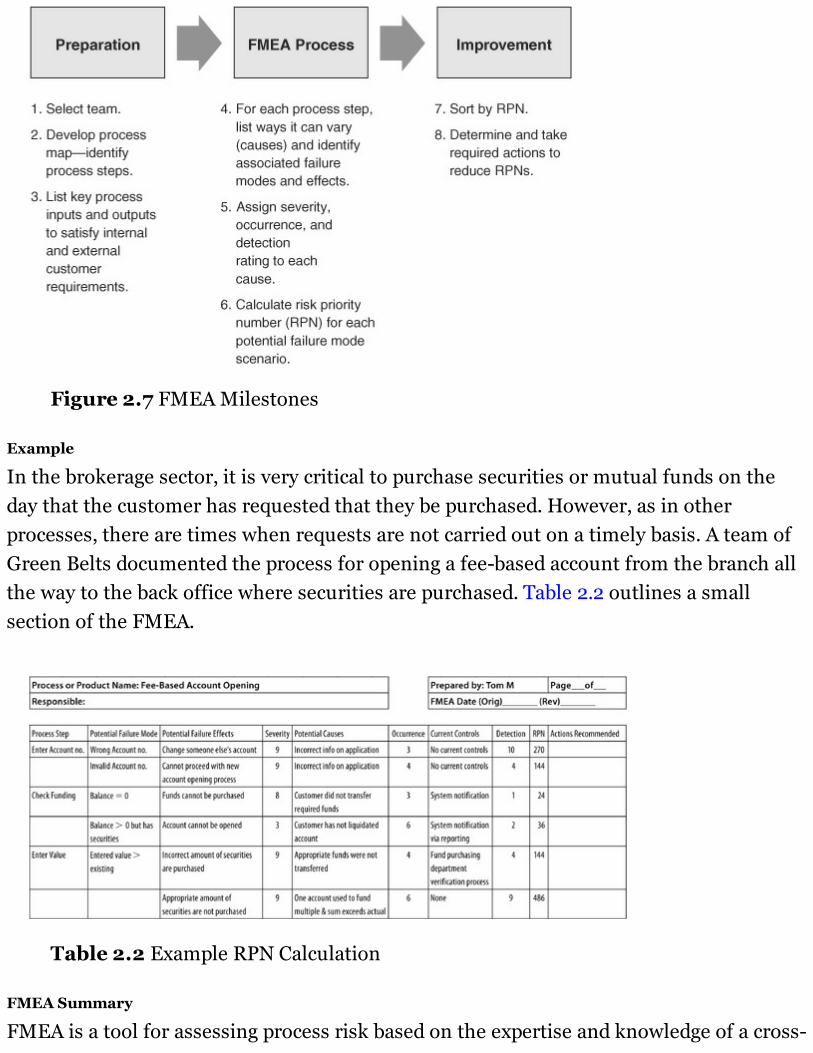
Figure 2.7 FMEA Milestones
Example
In the brokerage sector, it is very critical to purchase securities or mutual funds on theday that the customer has requested that they be purchased. However, as in otherprocesses, there are times when requests are not carried out on a timely basis. A team ofGreen Belts documented the process for opening a fee-based account from the branch allthe way to the back office where securities are purchased. Table 2.2 outlines a smallsection of the FMEA.
Table 2.2 Example RPN Calculation
FMEA Summary
FMEA is a tool for assessing process risk based on the expertise and knowledge of a cross-

functional team.
• FMEA can be used anytime on any product, process, or service when:
Risk assessment is needed.
There is a need to better understand the root causes of failure.
There is a need to identify failure points.
• It helps link causes to failure modes and prioritize through the RPN.
The higher the RPN, the higher the risk.
• It can be used throughout the DMAIC process.
Summary of Step 5: Define the CTQ Characteristics (Project Y)
The tools discussed in this step, process mapping, the fishbone diagram, and FMEA, canbe used to narrow down the scope of the project. While the problem statement outlined inthe Define phase can encompass an entire process, service, or product, Step 5 is intendedto help the team better define a focal point. As outlined in the fishbone example, whilethe project is focused on increasing throughput in the radiology department, the team’sconsensus was that the scheduling system was the largest contributor to the problem.
STEP 6: OUTLINE PERFORMANCE STANDARDA performance standard translates a customer need into a clear and measurablecharacteristic (see Figure 2.8). Once we know what is acceptable, we can then define adefect. Elements of a good performance standard include:
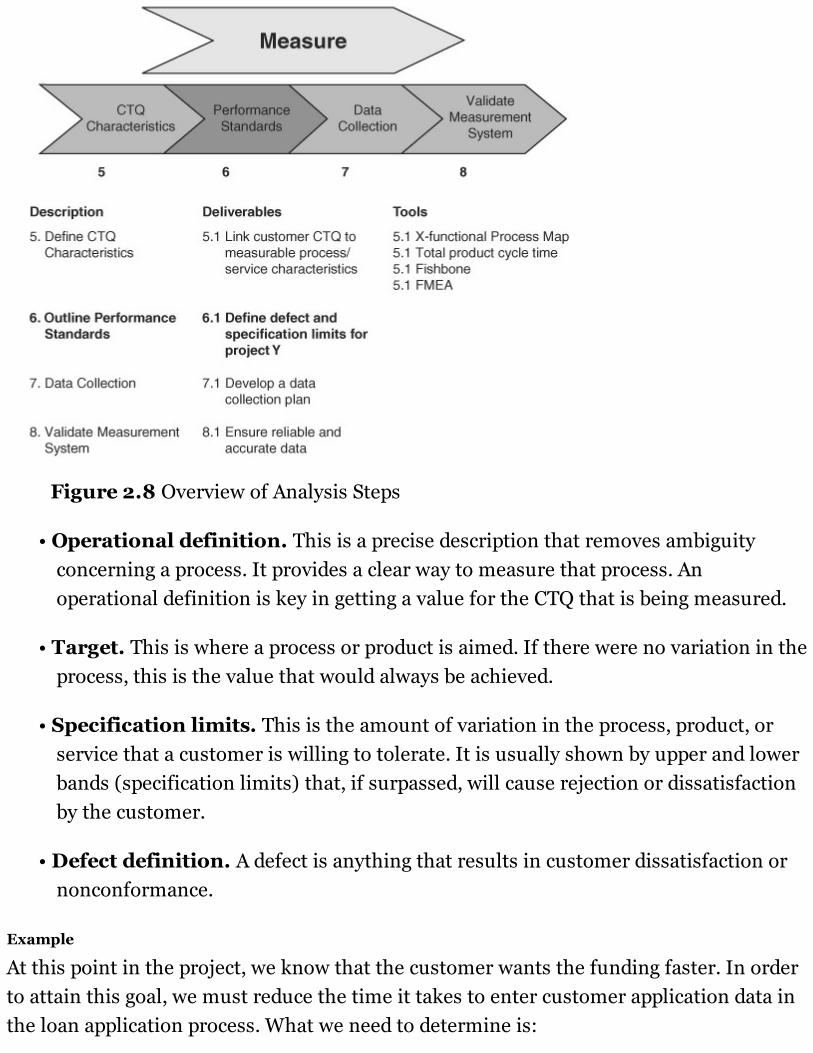
Figure 2.8 Overview of Analysis Steps
• Operational definition. This is a precise description that removes ambiguityconcerning a process. It provides a clear way to measure that process. Anoperational definition is key in getting a value for the CTQ that is being measured.
• Target. This is where a process or product is aimed. If there were no variation in theprocess, this is the value that would always be achieved.
• Specification limits. This is the amount of variation in the process, product, orservice that a customer is willing to tolerate. It is usually shown by upper and lowerbands (specification limits) that, if surpassed, will cause rejection or dissatisfactionby the customer.
• Defect definition. A defect is anything that results in customer dissatisfaction ornonconformance.
Example
At this point in the project, we know that the customer wants the funding faster. In orderto attain this goal, we must reduce the time it takes to enter customer application data inthe loan application process. What we need to determine is:
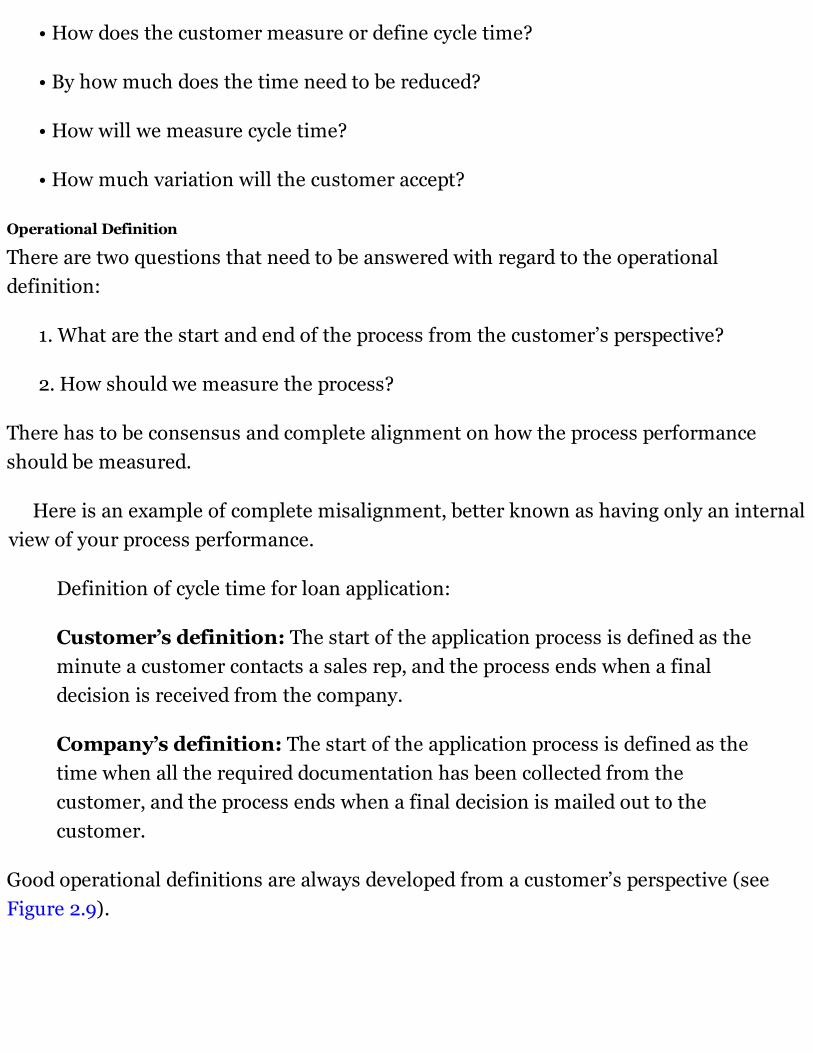
• How does the customer measure or define cycle time?
• By how much does the time need to be reduced?
• How will we measure cycle time?
• How much variation will the customer accept?
Operational Definition
There are two questions that need to be answered with regard to the operationaldefinition:
1. What are the start and end of the process from the customer’s perspective?
2. How should we measure the process?
There has to be consensus and complete alignment on how the process performanceshould be measured.
Here is an example of complete misalignment, better known as having only an internalview of your process performance.
Definition of cycle time for loan application:
Customer’s definition: The start of the application process is defined as theminute a customer contacts a sales rep, and the process ends when a finaldecision is received from the company.
Company’s definition: The start of the application process is defined as thetime when all the required documentation has been collected from thecustomer, and the process ends when a final decision is mailed out to thecustomer.
Good operational definitions are always developed from a customer’s perspective (seeFigure 2.9).
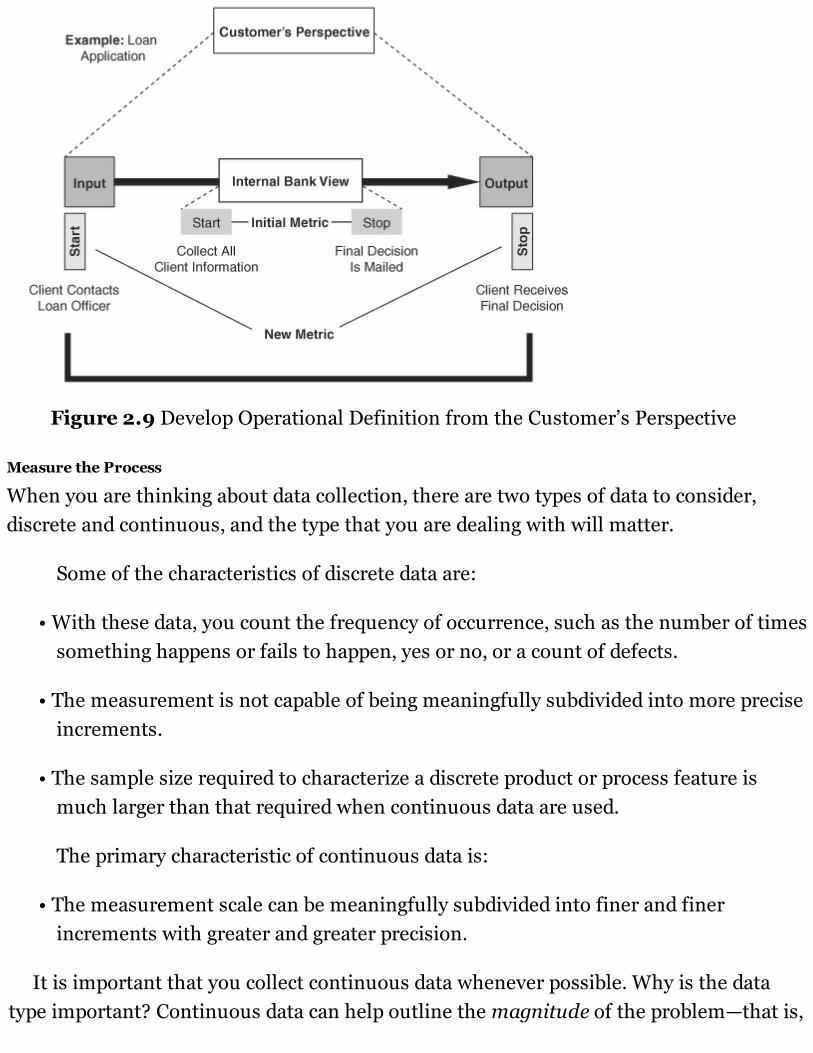
Figure 2.9 Develop Operational Definition from the Customer’s Perspective
Measure the Process
When you are thinking about data collection, there are two types of data to consider,discrete and continuous, and the type that you are dealing with will matter.
Some of the characteristics of discrete data are:
• With these data, you count the frequency of occurrence, such as the number of timessomething happens or fails to happen, yes or no, or a count of defects.
• The measurement is not capable of being meaningfully subdivided into more preciseincrements.
• The sample size required to characterize a discrete product or process feature ismuch larger than that required when continuous data are used.
The primary characteristic of continuous data is:
• The measurement scale can be meaningfully subdivided into finer and finerincrements with greater and greater precision.
It is important that you collect continuous data whenever possible. Why is the datatype important? Continuous data can help outline the magnitude of the problem—that is,
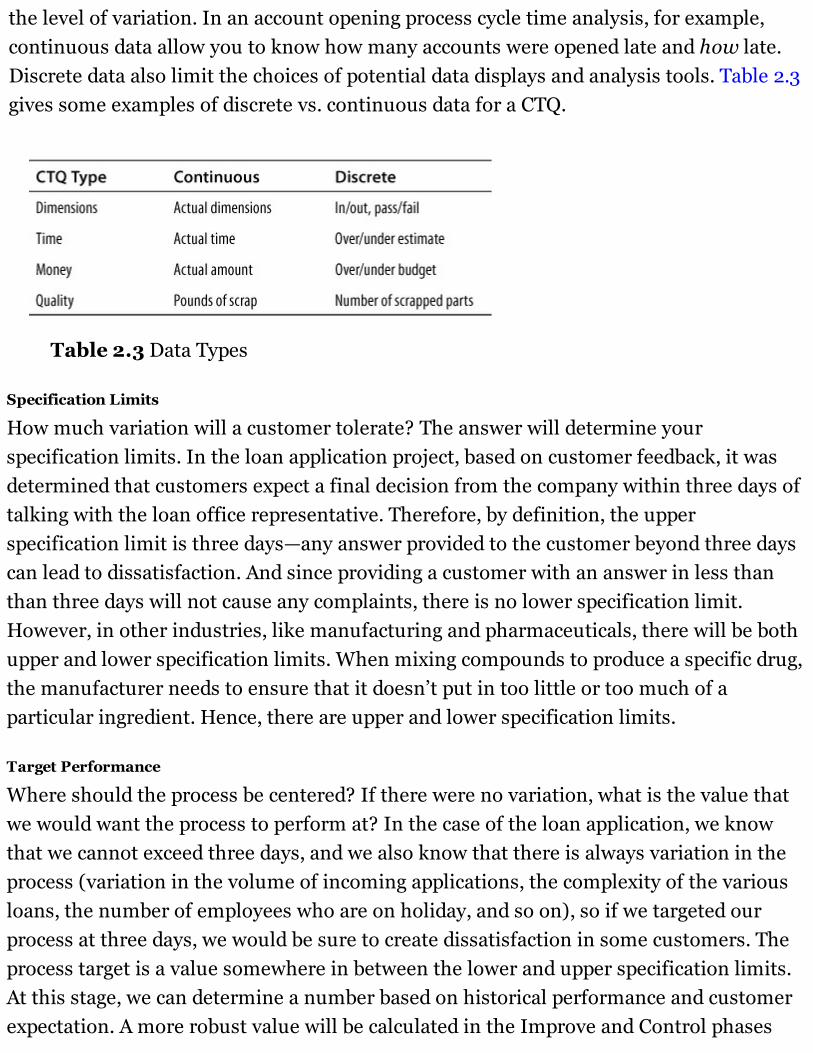
the level of variation. In an account opening process cycle time analysis, for example,continuous data allow you to know how many accounts were opened late and how late.Discrete data also limit the choices of potential data displays and analysis tools. Table 2.3gives some examples of discrete vs. continuous data for a CTQ.
Table 2.3 Data Types
Specification Limits
How much variation will a customer tolerate? The answer will determine yourspecification limits. In the loan application project, based on customer feedback, it wasdetermined that customers expect a final decision from the company within three days oftalking with the loan office representative. Therefore, by definition, the upperspecification limit is three days—any answer provided to the customer beyond three dayscan lead to dissatisfaction. And since providing a customer with an answer in less thanthan three days will not cause any complaints, there is no lower specification limit.However, in other industries, like manufacturing and pharmaceuticals, there will be bothupper and lower specification limits. When mixing compounds to produce a specific drug,the manufacturer needs to ensure that it doesn’t put in too little or too much of aparticular ingredient. Hence, there are upper and lower specification limits.
Target Performance
Where should the process be centered? If there were no variation, what is the value thatwe would want the process to perform at? In the case of the loan application, we knowthat we cannot exceed three days, and we also know that there is always variation in theprocess (variation in the volume of incoming applications, the complexity of the variousloans, the number of employees who are on holiday, and so on), so if we targeted ourprocess at three days, we would be sure to create dissatisfaction in some customers. Theprocess target is a value somewhere in between the lower and upper specification limits.At this stage, we can determine a number based on historical performance and customerexpectation. A more robust value will be calculated in the Improve and Control phases
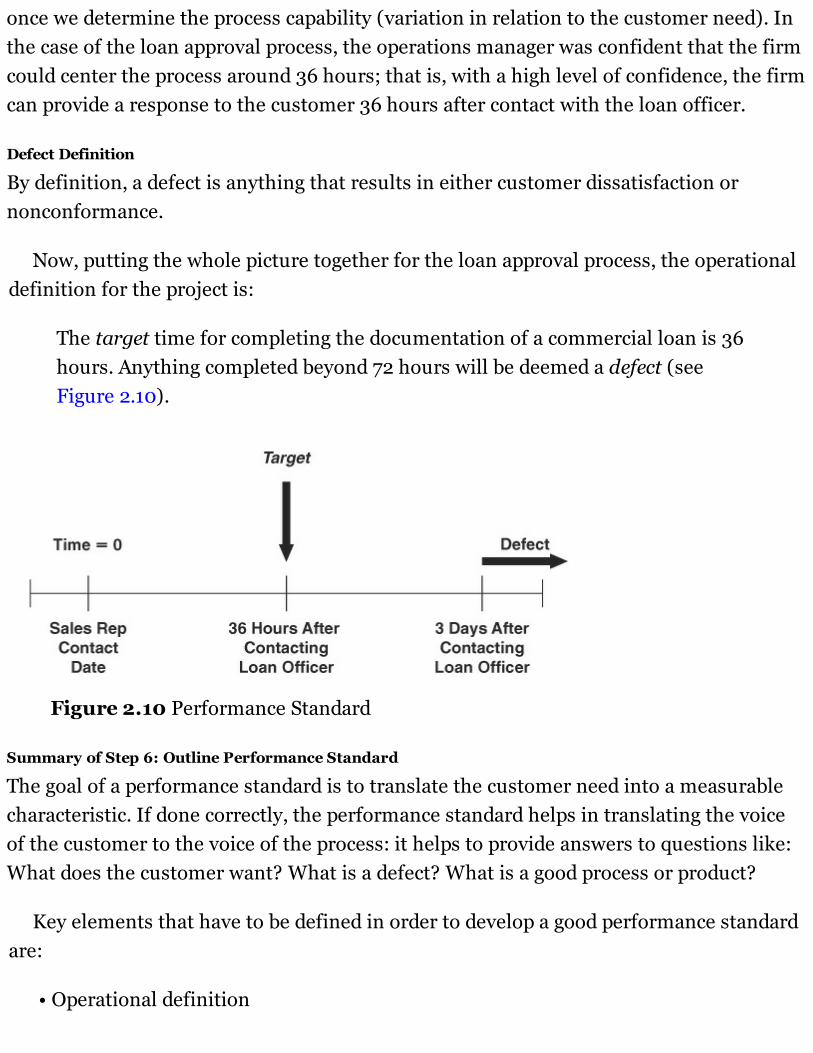
once we determine the process capability (variation in relation to the customer need). Inthe case of the loan approval process, the operations manager was confident that the firmcould center the process around 36 hours; that is, with a high level of confidence, the firmcan provide a response to the customer 36 hours after contact with the loan officer.
Defect Definition
By definition, a defect is anything that results in either customer dissatisfaction ornonconformance.
Now, putting the whole picture together for the loan approval process, the operationaldefinition for the project is:
The target time for completing the documentation of a commercial loan is 36hours. Anything completed beyond 72 hours will be deemed a defect (seeFigure 2.10).
Figure 2.10 Performance Standard
Summary of Step 6: Outline Performance Standard
The goal of a performance standard is to translate the customer need into a measurablecharacteristic. If done correctly, the performance standard helps in translating the voiceof the customer to the voice of the process: it helps to provide answers to questions like:What does the customer want? What is a defect? What is a good process or product?
Key elements that have to be defined in order to develop a good performance standardare:
• Operational definition
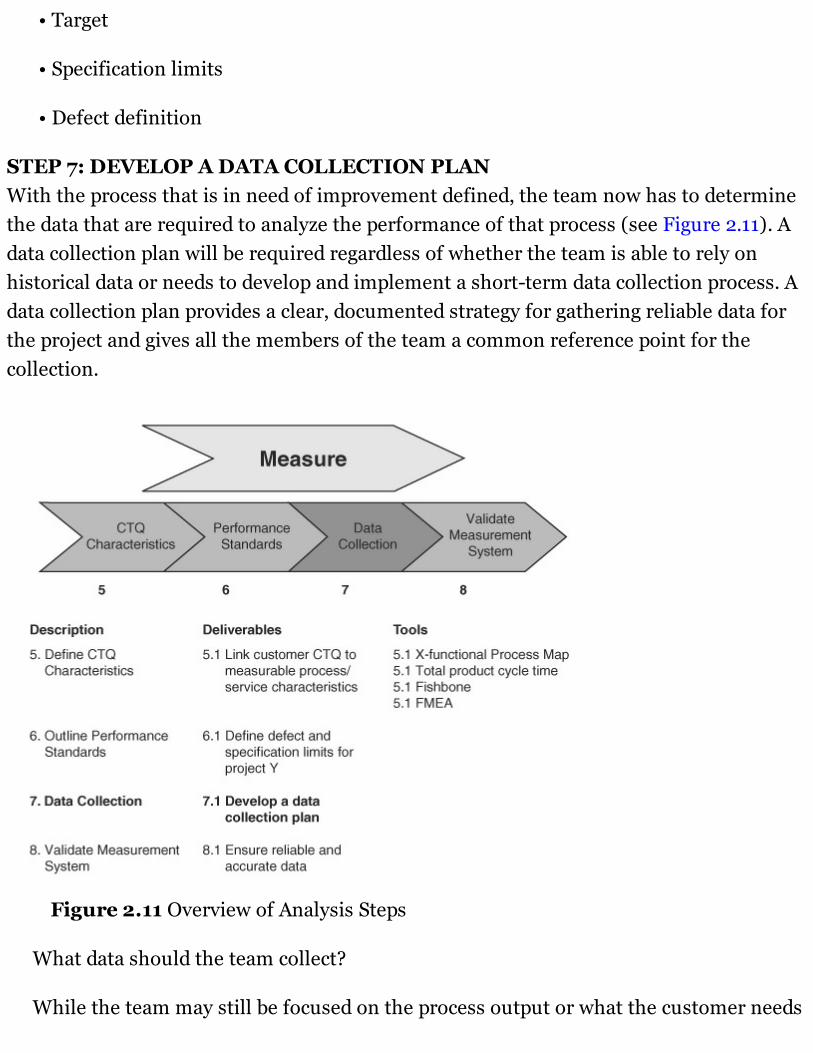
• Target
• Specification limits
• Defect definition
STEP 7: DEVELOP A DATA COLLECTION PLANWith the process that is in need of improvement defined, the team now has to determinethe data that are required to analyze the performance of that process (see Figure 2.11). Adata collection plan will be required regardless of whether the team is able to rely onhistorical data or needs to develop and implement a short-term data collection process. Adata collection plan provides a clear, documented strategy for gathering reliable data forthe project and gives all the members of the team a common reference point for thecollection.
Figure 2.11 Overview of Analysis Steps
What data should the team collect?
While the team may still be focused on the process output or what the customer needs
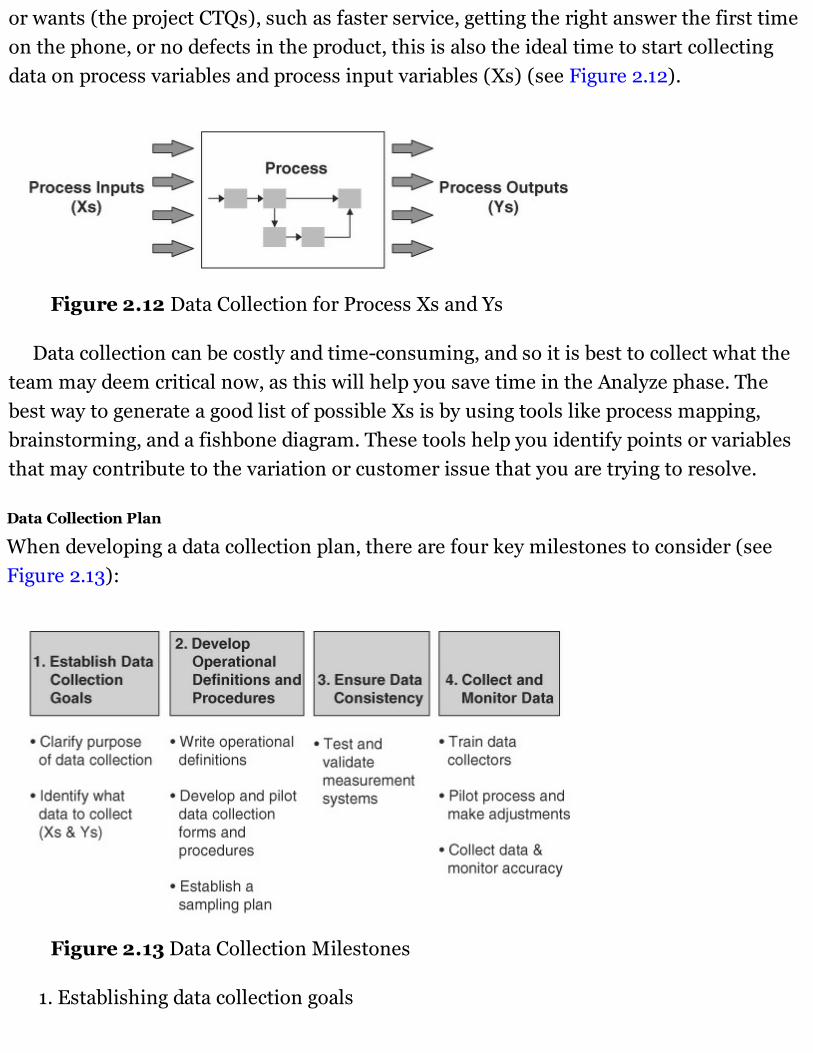
or wants (the project CTQs), such as faster service, getting the right answer the first timeon the phone, or no defects in the product, this is also the ideal time to start collectingdata on process variables and process input variables (Xs) (see Figure 2.12).
Figure 2.12 Data Collection for Process Xs and Ys
Data collection can be costly and time-consuming, and so it is best to collect what theteam may deem critical now, as this will help you save time in the Analyze phase. Thebest way to generate a good list of possible Xs is by using tools like process mapping,brainstorming, and a fishbone diagram. These tools help you identify points or variablesthat may contribute to the variation or customer issue that you are trying to resolve.
Data Collection Plan
When developing a data collection plan, there are four key milestones to consider (seeFigure 2.13):
Figure 2.13 Data Collection Milestones
1. Establishing data collection goals
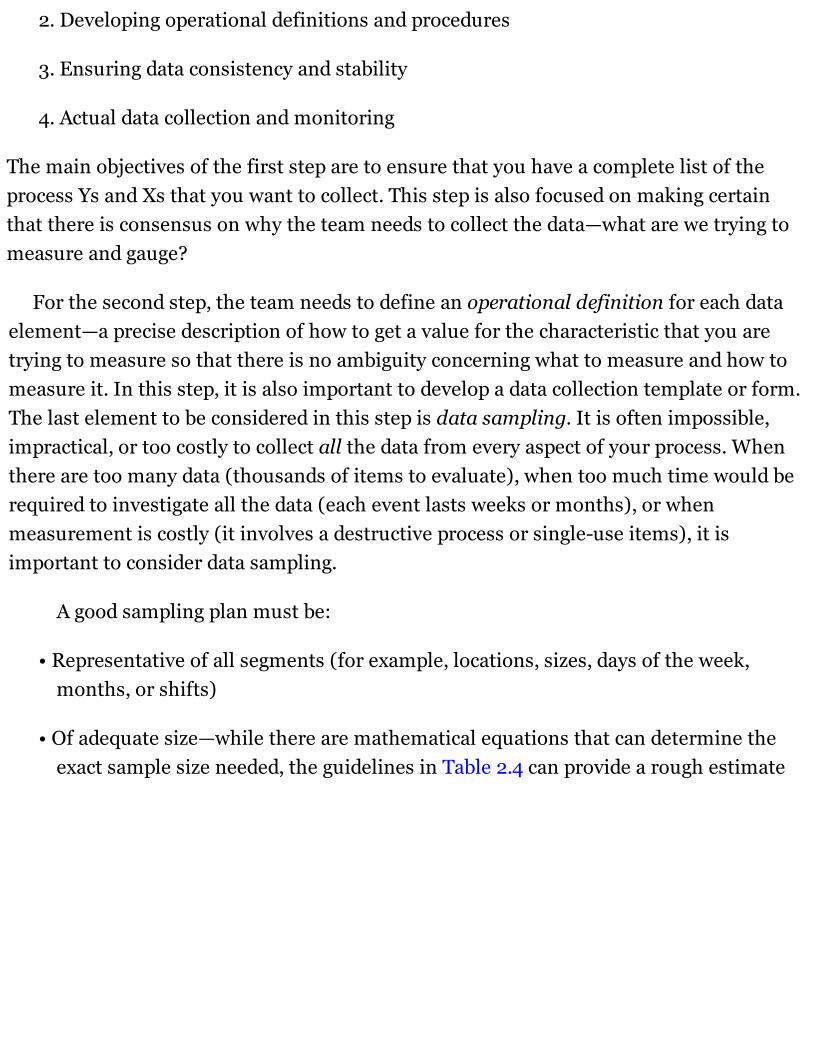
2. Developing operational definitions and procedures
3. Ensuring data consistency and stability
4. Actual data collection and monitoring
The main objectives of the first step are to ensure that you have a complete list of theprocess Ys and Xs that you want to collect. This step is also focused on making certainthat there is consensus on why the team needs to collect the data—what are we trying tomeasure and gauge?
For the second step, the team needs to define an operational definition for each dataelement—a precise description of how to get a value for the characteristic that you aretrying to measure so that there is no ambiguity concerning what to measure and how tomeasure it. In this step, it is also important to develop a data collection template or form.The last element to be considered in this step is data sampling. It is often impossible,impractical, or too costly to collect all the data from every aspect of your process. Whenthere are too many data (thousands of items to evaluate), when too much time would berequired to investigate all the data (each event lasts weeks or months), or whenmeasurement is costly (it involves a destructive process or single-use items), it isimportant to consider data sampling.
A good sampling plan must be:
• Representative of all segments (for example, locations, sizes, days of the week,months, or shifts)
• Of adequate size—while there are mathematical equations that can determine theexact sample size needed, the guidelines in Table 2.4 can provide a rough estimate
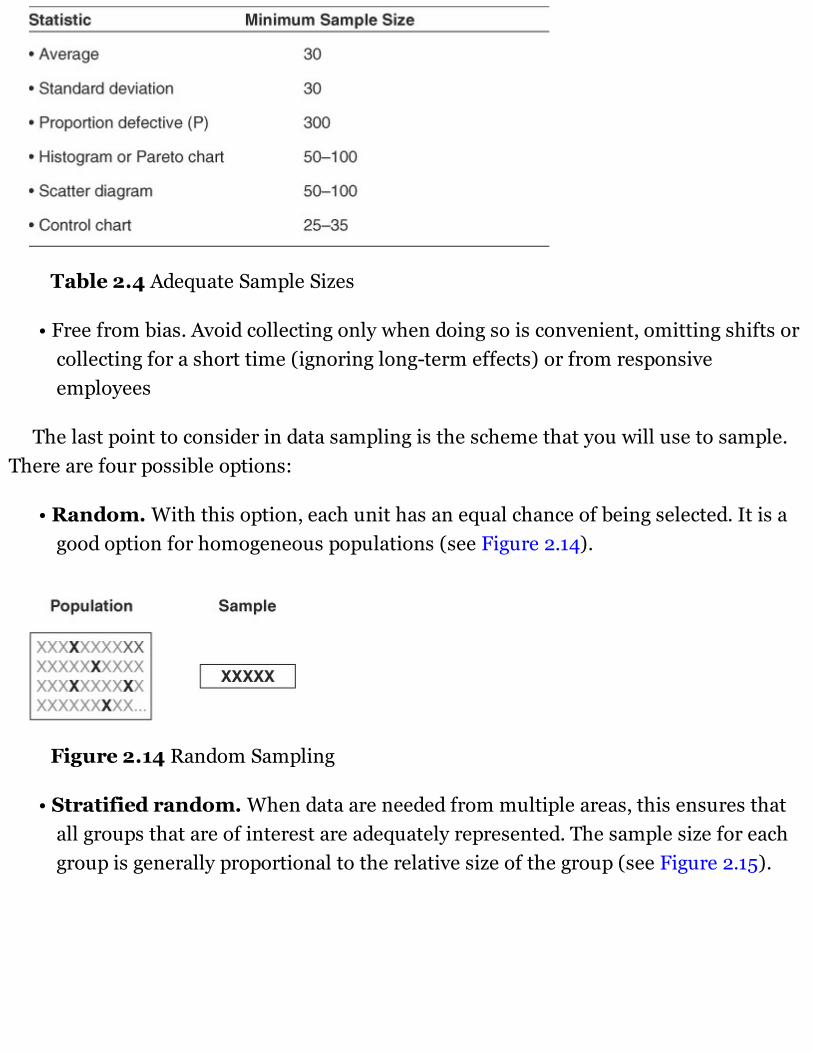
Table 2.4 Adequate Sample Sizes
• Free from bias. Avoid collecting only when doing so is convenient, omitting shifts orcollecting for a short time (ignoring long-term effects) or from responsiveemployees
The last point to consider in data sampling is the scheme that you will use to sample.There are four possible options:
• Random. With this option, each unit has an equal chance of being selected. It is agood option for homogeneous populations (see Figure 2.14).
Figure 2.14 Random Sampling
• Stratified random. When data are needed from multiple areas, this ensures thatall groups that are of interest are adequately represented. The sample size for eachgroup is generally proportional to the relative size of the group (see Figure 2.15).
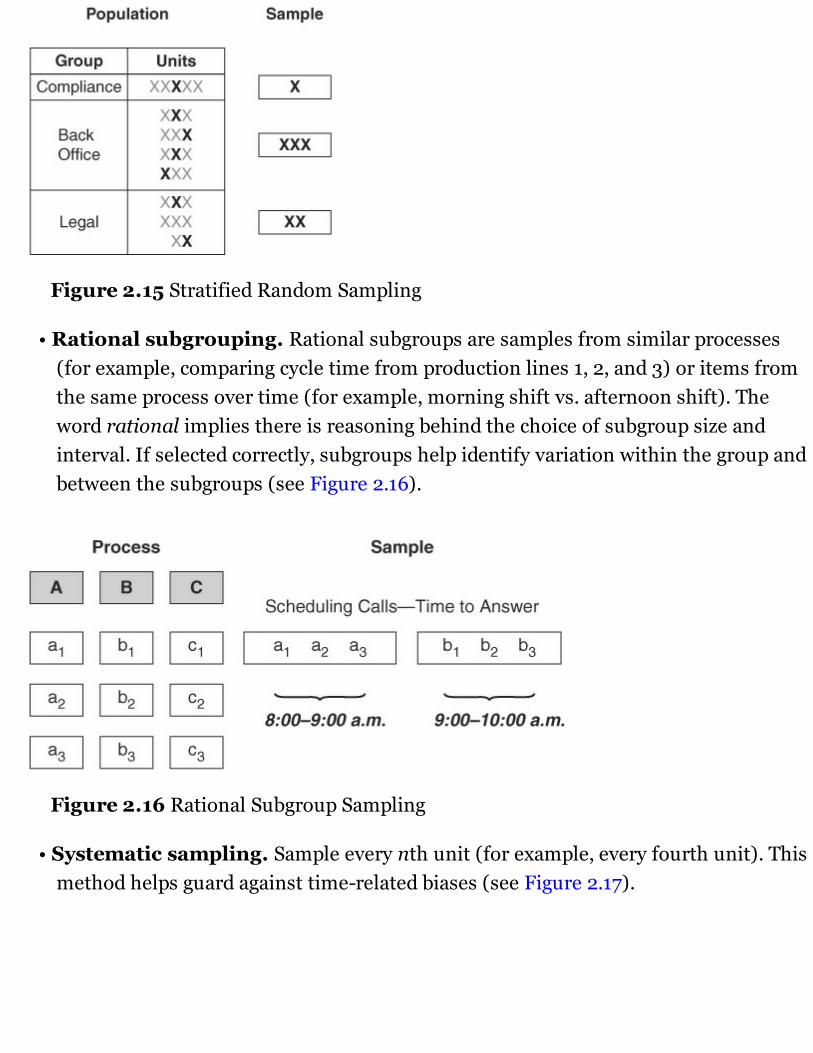
Figure 2.15 Stratified Random Sampling
• Rational subgrouping. Rational subgroups are samples from similar processes(for example, comparing cycle time from production lines 1, 2, and 3) or items fromthe same process over time (for example, morning shift vs. afternoon shift). Theword rational implies there is reasoning behind the choice of subgroup size andinterval. If selected correctly, subgroups help identify variation within the group andbetween the subgroups (see Figure 2.16).
Figure 2.16 Rational Subgroup Sampling
• Systematic sampling. Sample every nth unit (for example, every fourth unit). Thismethod helps guard against time-related biases (see Figure 2.17).
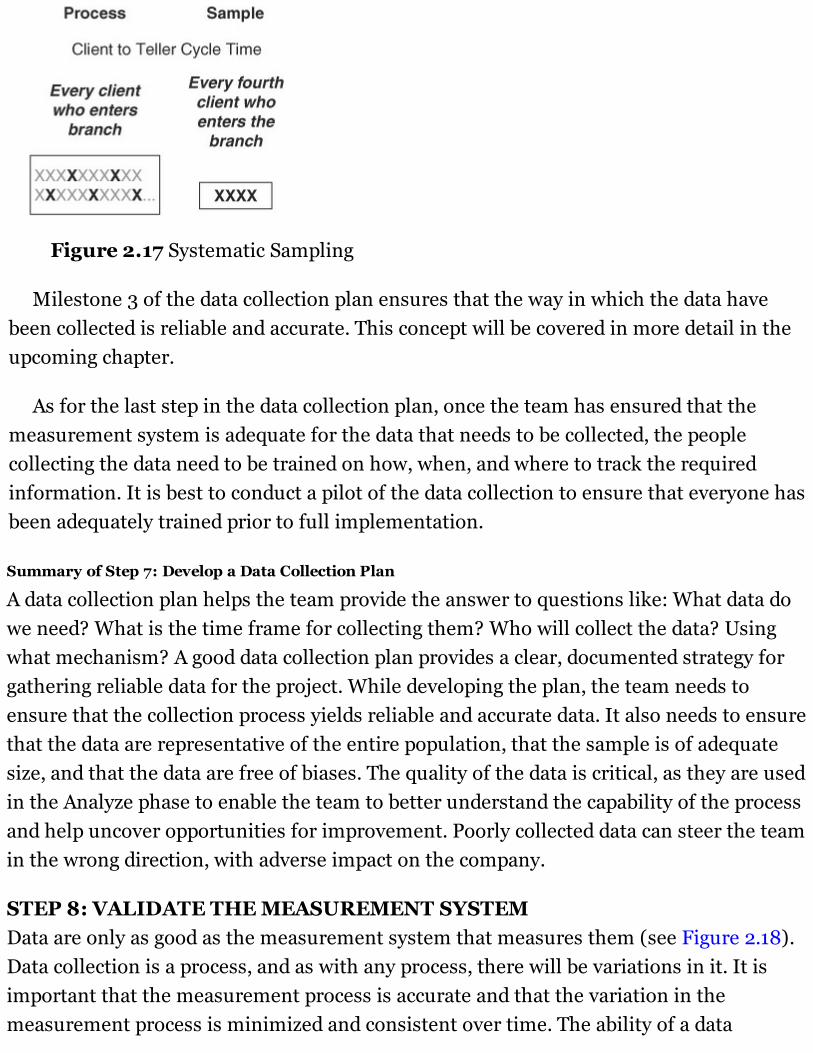
Figure 2.17 Systematic Sampling
Milestone 3 of the data collection plan ensures that the way in which the data havebeen collected is reliable and accurate. This concept will be covered in more detail in theupcoming chapter.
As for the last step in the data collection plan, once the team has ensured that themeasurement system is adequate for the data that needs to be collected, the peoplecollecting the data need to be trained on how, when, and where to track the requiredinformation. It is best to conduct a pilot of the data collection to ensure that everyone hasbeen adequately trained prior to full implementation.
Summary of Step 7: Develop a Data Collection Plan
A data collection plan helps the team provide the answer to questions like: What data dowe need? What is the time frame for collecting them? Who will collect the data? Usingwhat mechanism? A good data collection plan provides a clear, documented strategy forgathering reliable data for the project. While developing the plan, the team needs toensure that the collection process yields reliable and accurate data. It also needs to ensurethat the data are representative of the entire population, that the sample is of adequatesize, and that the data are free of biases. The quality of the data is critical, as they are usedin the Analyze phase to enable the team to better understand the capability of the processand help uncover opportunities for improvement. Poorly collected data can steer the teamin the wrong direction, with adverse impact on the company.
STEP 8: VALIDATE THE MEASUREMENT SYSTEMData are only as good as the measurement system that measures them (see Figure 2.18).Data collection is a process, and as with any process, there will be variations in it. It isimportant that the measurement process is accurate and that the variation in themeasurement process is minimized and consistent over time. The ability of a data
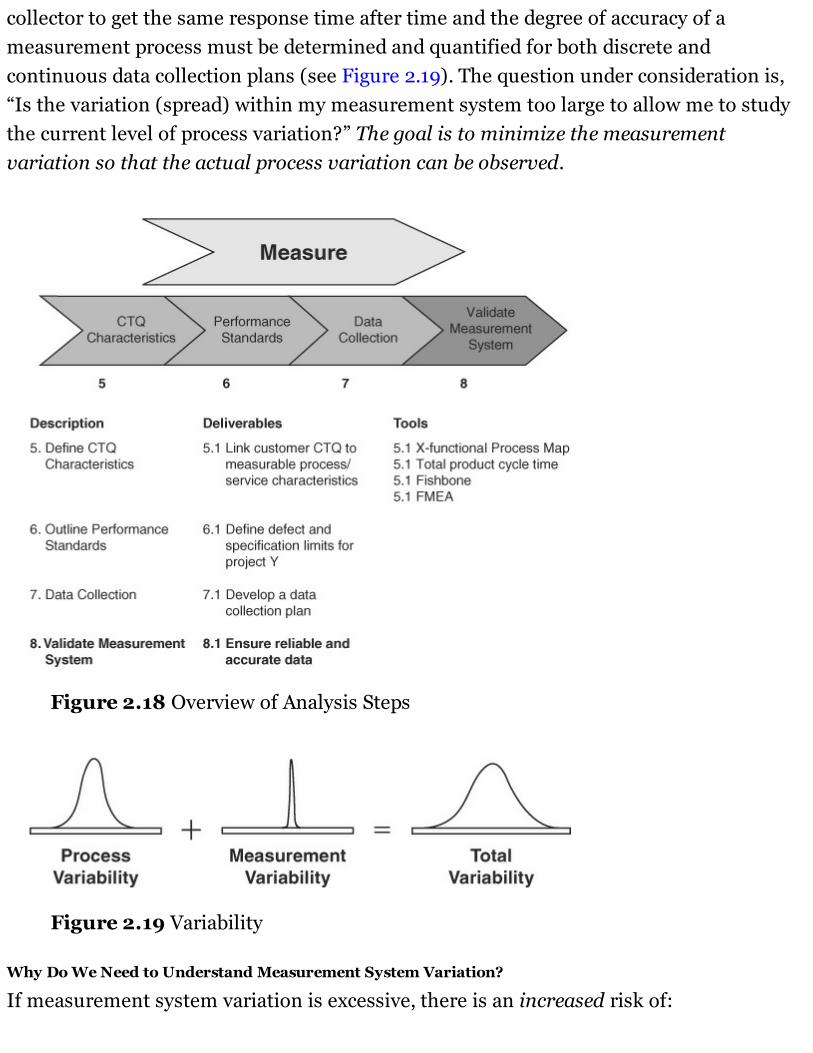
collector to get the same response time after time and the degree of accuracy of ameasurement process must be determined and quantified for both discrete andcontinuous data collection plans (see Figure 2.19). The question under consideration is,“Is the variation (spread) within my measurement system too large to allow me to studythe current level of process variation?” The goal is to minimize the measurementvariation so that the actual process variation can be observed.
Figure 2.18 Overview of Analysis Steps
Figure 2.19 Variability
Why Do We Need to Understand Measurement System Variation?
If measurement system variation is excessive, there is an increased risk of:
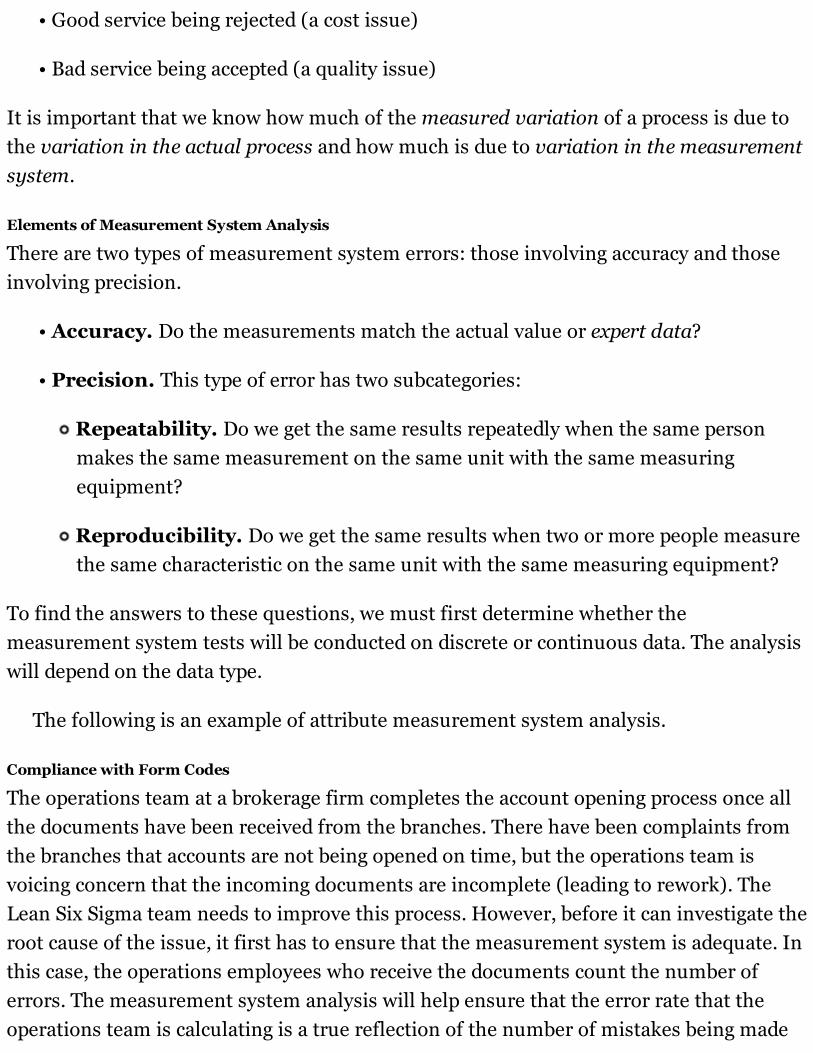
• Good service being rejected (a cost issue)
• Bad service being accepted (a quality issue)
It is important that we know how much of the measured variation of a process is due tothe variation in the actual process and how much is due to variation in the measurementsystem.
Elements of Measurement System Analysis
There are two types of measurement system errors: those involving accuracy and thoseinvolving precision.
• Accuracy. Do the measurements match the actual value or expert data?
• Precision. This type of error has two subcategories:
Repeatability. Do we get the same results repeatedly when the same personmakes the same measurement on the same unit with the same measuringequipment?
Reproducibility. Do we get the same results when two or more people measurethe same characteristic on the same unit with the same measuring equipment?
To find the answers to these questions, we must first determine whether themeasurement system tests will be conducted on discrete or continuous data. The analysiswill depend on the data type.
The following is an example of attribute measurement system analysis.
Compliance with Form Codes
The operations team at a brokerage firm completes the account opening process once allthe documents have been received from the branches. There have been complaints fromthe branches that accounts are not being opened on time, but the operations team isvoicing concern that the incoming documents are incomplete (leading to rework). TheLean Six Sigma team needs to improve this process. However, before it can investigate theroot cause of the issue, it first has to ensure that the measurement system is adequate. Inthis case, the operations employees who receive the documents count the number oferrors. The measurement system analysis will help ensure that the error rate that theoperations team is calculating is a true reflection of the number of mistakes being made
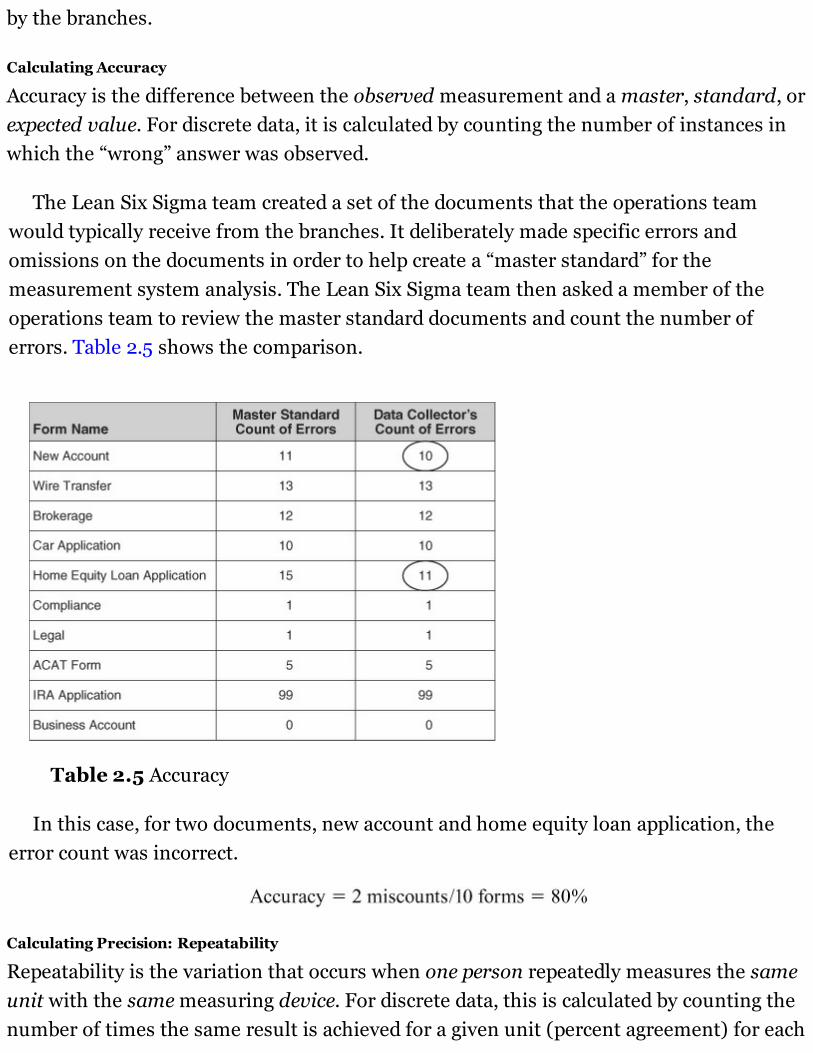
by the branches.
Calculating Accuracy
Accuracy is the difference between the observed measurement and a master, standard, orexpected value. For discrete data, it is calculated by counting the number of instances inwhich the “wrong” answer was observed.
The Lean Six Sigma team created a set of the documents that the operations teamwould typically receive from the branches. It deliberately made specific errors andomissions on the documents in order to help create a “master standard” for themeasurement system analysis. The Lean Six Sigma team then asked a member of theoperations team to review the master standard documents and count the number oferrors. Table 2.5 shows the comparison.
Table 2.5 Accuracy
In this case, for two documents, new account and home equity loan application, theerror count was incorrect.
Calculating Precision: Repeatability
Repeatability is the variation that occurs when one person repeatedly measures the sameunit with the same measuring device. For discrete data, this is calculated by counting thenumber of times the same result is achieved for a given unit (percent agreement) for each
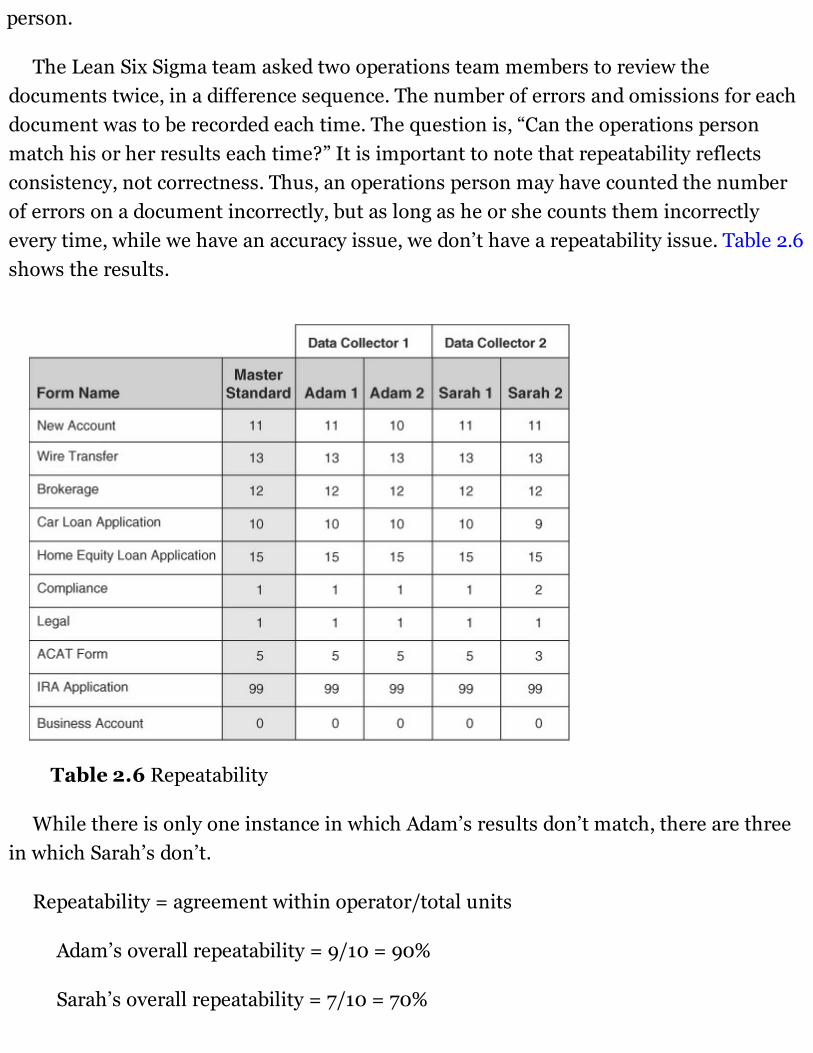
person.
The Lean Six Sigma team asked two operations team members to review thedocuments twice, in a difference sequence. The number of errors and omissions for eachdocument was to be recorded each time. The question is, “Can the operations personmatch his or her results each time?” It is important to note that repeatability reflectsconsistency, not correctness. Thus, an operations person may have counted the numberof errors on a document incorrectly, but as long as he or she counts them incorrectlyevery time, while we have an accuracy issue, we don’t have a repeatability issue. Table 2.6shows the results.
Table 2.6 Repeatability
While there is only one instance in which Adam’s results don’t match, there are threein which Sarah’s don’t.
Repeatability = agreement within operator/total units
Adam’s overall repeatability = 9/10 = 90%
Sarah’s overall repeatability = 7/10 = 70%
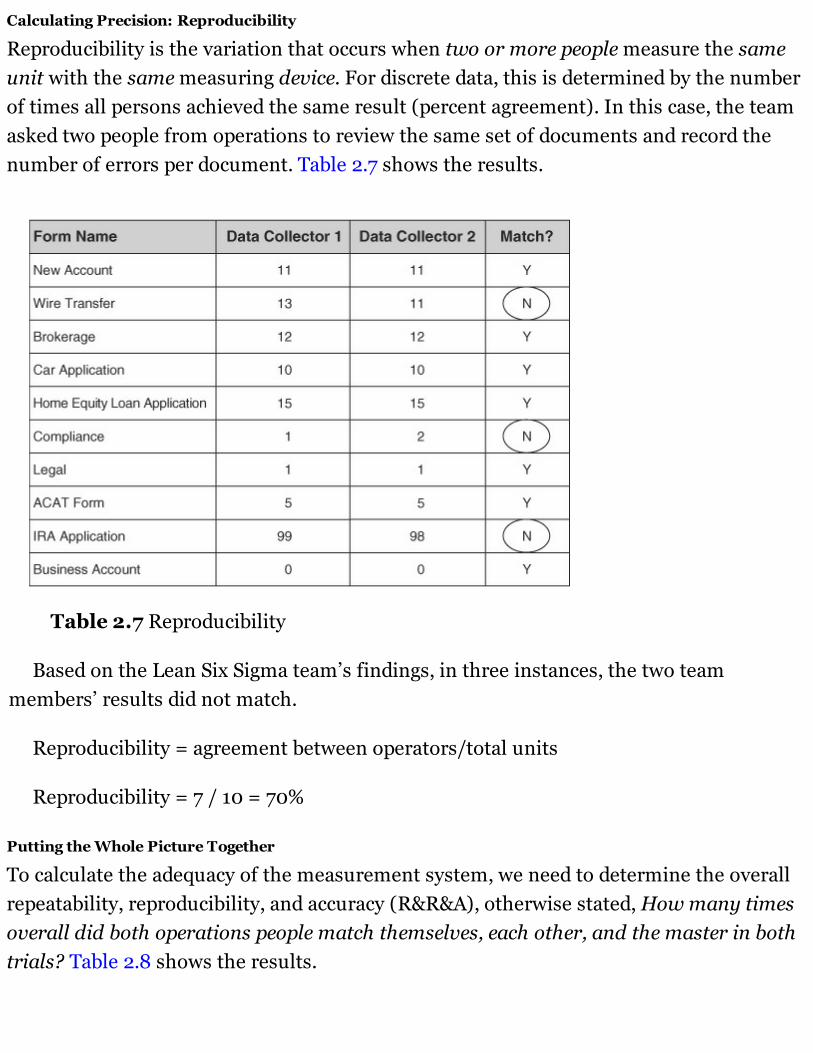
Calculating Precision: Reproducibility
Reproducibility is the variation that occurs when two or more people measure the sameunit with the same measuring device. For discrete data, this is determined by the numberof times all persons achieved the same result (percent agreement). In this case, the teamasked two people from operations to review the same set of documents and record thenumber of errors per document. Table 2.7 shows the results.
Table 2.7 Reproducibility
Based on the Lean Six Sigma team’s findings, in three instances, the two teammembers’ results did not match.
Reproducibility = agreement between operators/total units
Reproducibility = 7 / 10 = 70%
Putting the Whole Picture Together
To calculate the adequacy of the measurement system, we need to determine the overallrepeatability, reproducibility, and accuracy (R&R&A), otherwise stated, How many timesoverall did both operations people match themselves, each other, and the master in bothtrials? Table 2.8 shows the results.
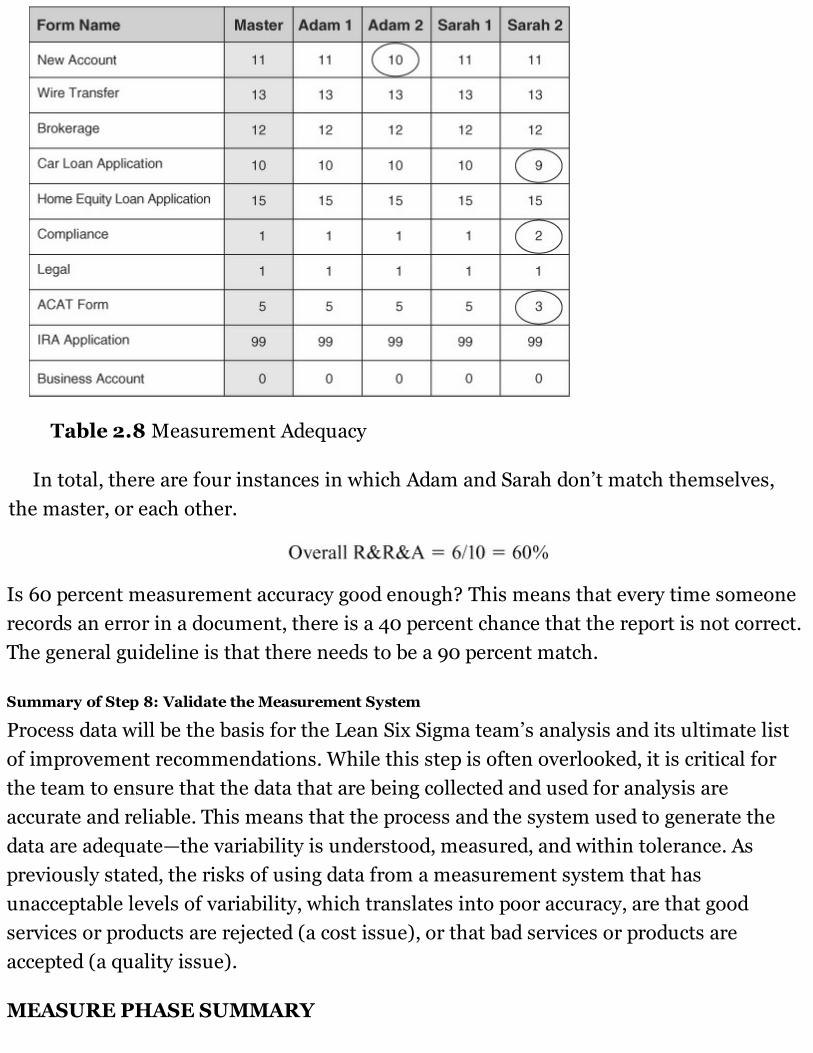
Table 2.8 Measurement Adequacy
In total, there are four instances in which Adam and Sarah don’t match themselves,the master, or each other.
Is 60 percent measurement accuracy good enough? This means that every time someonerecords an error in a document, there is a 40 percent chance that the report is not correct.The general guideline is that there needs to be a 90 percent match.
Summary of Step 8: Validate the Measurement System
Process data will be the basis for the Lean Six Sigma team’s analysis and its ultimate listof improvement recommendations. While this step is often overlooked, it is critical forthe team to ensure that the data that are being collected and used for analysis areaccurate and reliable. This means that the process and the system used to generate thedata are adequate—the variability is understood, measured, and within tolerance. Aspreviously stated, the risks of using data from a measurement system that hasunacceptable levels of variability, which translates into poor accuracy, are that goodservices or products are rejected (a cost issue), or that bad services or products areaccepted (a quality issue).
MEASURE PHASE SUMMARY

The journey of the Measure phase starts with the use of process mapping to betterunderstand the process—it is all about uncovering the unknown or assumed.Documentation of the process will help uncover critical but missing data points. Once theprocess is better understood, then the team can start brainstorming possible points of riskby using a fishbone diagram or FMEA. These activities all lead to the identification of datathat need to be collected in order to better understand the problem and its root causes inthe Analyze phase. But before data can be analyzed, the team must first define a datacollection plan that will ensure consistency and then test the measurement system toensure accuracy. The Measure phase is the “feeder” to the problem-solving and solution-finding phases (Analyze and Improve). Poorly collected data or an inadequate processmap will hinder all upcoming activities, leading to incorrect or suboptimal results.
MEASURE PHASE CHECKLIST Link the customer CTQ or need to a characteristic of the process or service.
Ensure that your operational definition of CTQ performance is the same as thecustomer’s.
Define a defect, target performance, and upper and lower specification limits.
Develop a data collection plan (if historical data are not available).
Ensure that a reliable measurement system is in place.
QUESTIONS TO ASK AT THE END OF THE MEASURE PHASE1. Which physical processes are targeted in this project?
2. Can the problem be tackled by a single project? Do we need to separate the CTQs?
3. Is the measurement continuous? Will it show the true level of variation?
4. Will the measurement reflect the customer’s view of a single transaction?
5. What are the weaknesses of this measurement? How can it be manipulated?
APPLICATION OF LEAN SIX SIGMA CASE STUDY—MEASURE PHASEDELIVERABLESThe continuation of the case study illustrates the Measure phase of a Lean Six Sigmaproject.
Step 5: Define the CTQ Characteristics (Project Y)
With the approval from the Lean Six Sigma Steering Committee, the team can nowproceed to the Measure phase. A detailed process map is created to ensure that everyonehas a common understanding of the flow, key inputs, and deliverables. A segment of themap is shown in Figure 2.20.
Figure 2.20 Case Study Process Map
The map helps the team identify the process steps that have historically caused issuesin approving loan applications. Using the fishbone tool (Figure 2.21), the team beginsdiscussing the possible root causes of the issues that are leading to unacceptableresponse times. Armed with this information, the team now focuses its data collectionand analysis efforts on a few key drivers.
Figure 2.21 Case Study Fishbone Diagram
Step 6: Outline Performance Standard
The team has to determine the best way to measure the problem and also agree on adefinition of a defect. Using interviews with customers and with key staff members insales and operations, the team is able to define an upper specification, a lowerspecification, a target, and a defect definition (see Figure 2.22).
Figure 2.22 Case Study Performance Standard
Steps 7 and 8: Develop a Data Collection Plan and Validate the Measurement System
The Lean Six Sigma team wanted to ensure that the complaints received by the sales teamcould be validated by data—that is, were the results really as bad as the customers weresaying? However, to do this, the team needed to ensure that the data collection andmeasurement systems were adequate. Loan applications were either sent inelectronically, in which case the system generated an automatic time stamp, or they weremailed in. The applications with system time stamps did not require further investigation—the second the loan officer pressed “submit application,” the system would generate atime stamp. However, for the 30 percent of the applications that were received via mail,the application was scanned by the administrator and the application information wasmanually entered into the system. While it was impossible to determine the length oftime that the application waited to be scanned, the team could determine the cycle timebetween scanning and data entry (which then would make the application available foroperations to begin the review process).
The team agreed that it should only take four minutes to enter data, and that anythingbeyond that could indicate a measurement system issue. Based on 250 data points, therewere only four instances in which the system time stamp and the file time stamp did notmeet the four-minute timeline (see Table 2.9). Therefore, the measurement systemaccuracy is around 98.4 percent (1 − (4/250)) × 100%. The team could, with confidence,rely on the historical data to provide a true depiction of process performance.
Table 2.9 Case Study Time Stamps
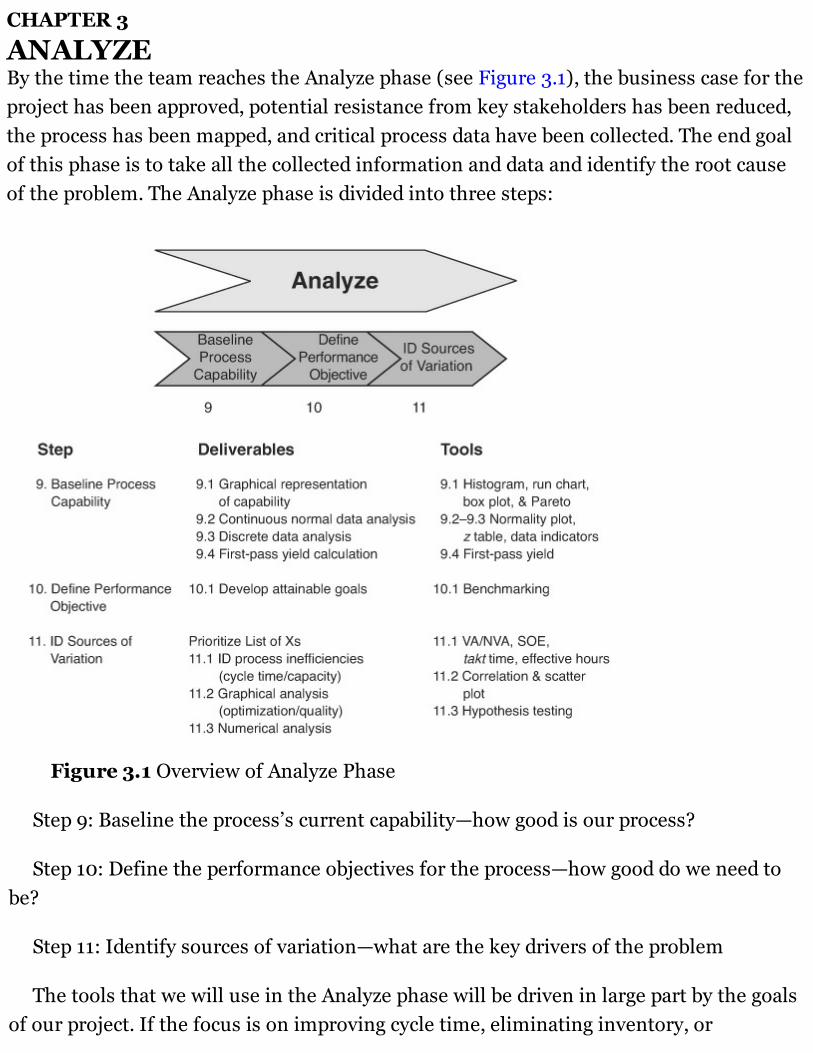
CHAPTER 3
ANALYZEBy the time the team reaches the Analyze phase (see Figure 3.1), the business case for theproject has been approved, potential resistance from key stakeholders has been reduced,the process has been mapped, and critical process data have been collected. The end goalof this phase is to take all the collected information and data and identify the root causeof the problem. The Analyze phase is divided into three steps:
Figure 3.1 Overview of Analyze Phase
Step 9: Baseline the process’s current capability—how good is our process?
Step 10: Define the performance objectives for the process—how good do we need tobe?
Step 11: Identify sources of variation—what are the key drivers of the problem
The tools that we will use in the Analyze phase will be driven in large part by the goalsof our project. If the focus is on improving cycle time, eliminating inventory, or
standardizing a process, the team will rely more on the Lean tools and principles foranalysis. If the focus is on improving the quality of a service, determining optimalpricing, or reducing losses, Six Sigma’s analytical tools will be better suited. The projecttype drives the usage of the tools.
The key deliverables in this phase are:
• Determination of the data distribution type: normal or nonnormal
• The capability of the process: z score and DPMO
• Establish an improvement goal or performance objectives
• Determination of the stability, shape, center, and spread of the process
• Determination of the vital few Xs that affect the project Y
• Determination of which Lean tools to use to identify process bottlenecks
• Recommendations for the Improve phase
STEP 9: BASELINE THE PROCESS’S CURRENT CAPABILITYBefore we can investigate and identify the root cause of a problem, the capability of theprocess in its current state needs to be determined. This is primarily done to providequantifiable evidence that when changes have been implemented (during the Improvephase), the results are positive. If we don’t know how the process is performing inrelation to customer expectations, how can we prove that the implemented changes haveenhanced it?
The concept of capability is about measuring how a process performs in relation to aset of requirements. If our process cycle time to close a loan is 10 days, but the customerexpects that loan within 7 days, how capable is this process? The metric that can help usdefine capability—that is, determine the performance of our process relative to customerneeds and wants—is the z score. The z score is also known as the sigma score; the nameSix Sigma is derived from this. The higher the sigma score, the more capable theperformance of our process.
How to Start Baselining a Process
Baselining or understanding the performance of a process is done by first getting a
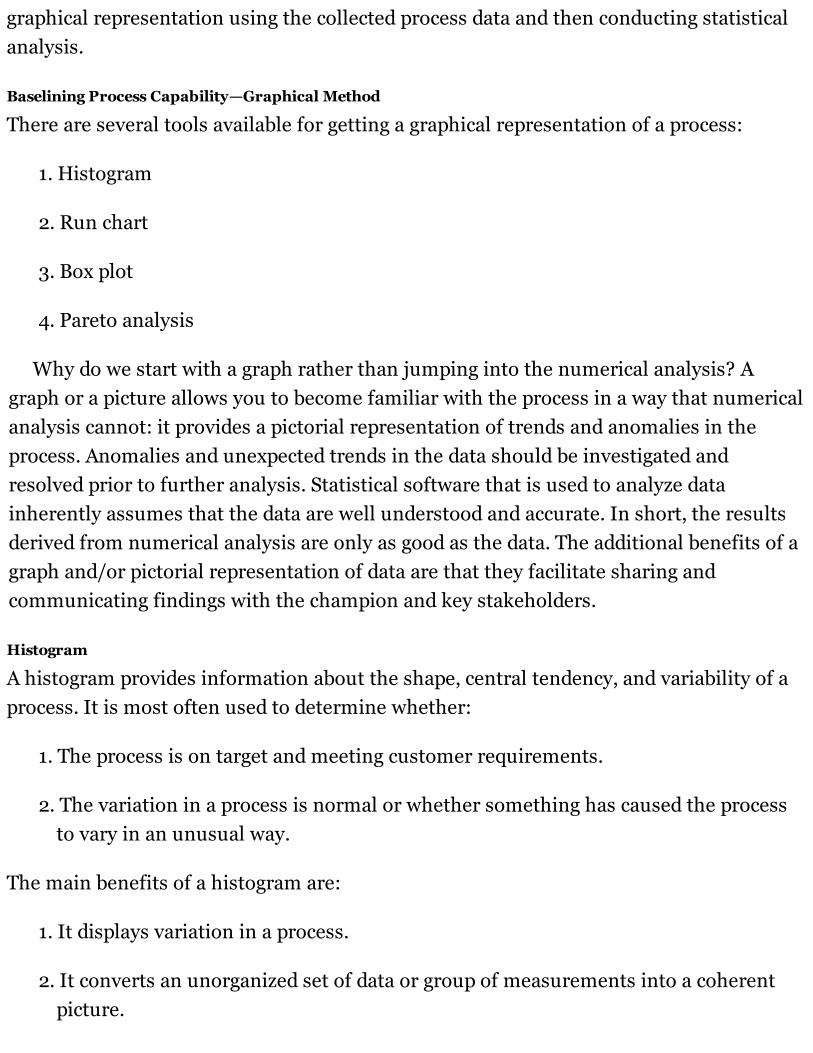
graphical representation using the collected process data and then conducting statisticalanalysis.
Baselining Process Capability—Graphical Method
There are several tools available for getting a graphical representation of a process:
1. Histogram
2. Run chart
3. Box plot
4. Pareto analysis
Why do we start with a graph rather than jumping into the numerical analysis? Agraph or a picture allows you to become familiar with the process in a way that numericalanalysis cannot: it provides a pictorial representation of trends and anomalies in theprocess. Anomalies and unexpected trends in the data should be investigated andresolved prior to further analysis. Statistical software that is used to analyze datainherently assumes that the data are well understood and accurate. In short, the resultsderived from numerical analysis are only as good as the data. The additional benefits of agraph and/or pictorial representation of data are that they facilitate sharing andcommunicating findings with the champion and key stakeholders.
Histogram
A histogram provides information about the shape, central tendency, and variability of aprocess. It is most often used to determine whether:
1. The process is on target and meeting customer requirements.
2. The variation in a process is normal or whether something has caused the processto vary in an unusual way.
The main benefits of a histogram are:
1. It displays variation in a process.
2. It converts an unorganized set of data or group of measurements into a coherentpicture.
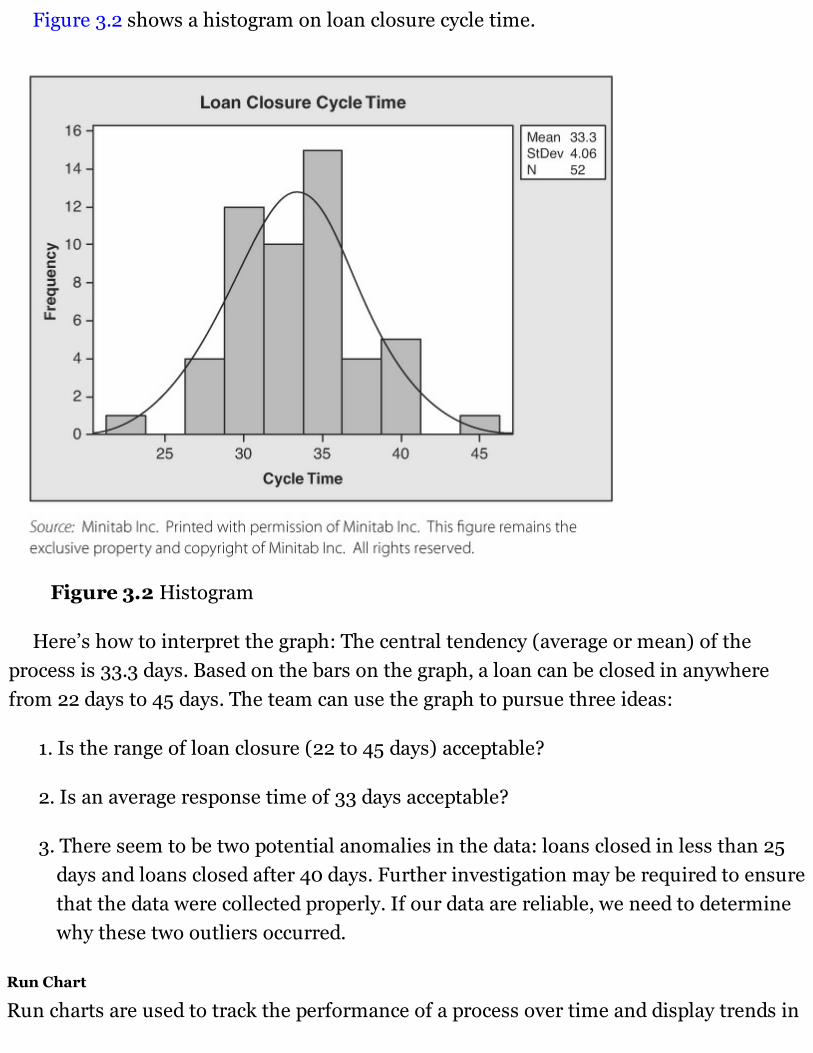
Figure 3.2 shows a histogram on loan closure cycle time.
Figure 3.2 Histogram
Here’s how to interpret the graph: The central tendency (average or mean) of theprocess is 33.3 days. Based on the bars on the graph, a loan can be closed in anywherefrom 22 days to 45 days. The team can use the graph to pursue three ideas:
1. Is the range of loan closure (22 to 45 days) acceptable?
2. Is an average response time of 33 days acceptable?
3. There seem to be two potential anomalies in the data: loans closed in less than 25days and loans closed after 40 days. Further investigation may be required to ensurethat the data were collected properly. If our data are reliable, we need to determinewhy these two outliers occurred.
Run Chart
Run charts are used to track the performance of a process over time and display trends in
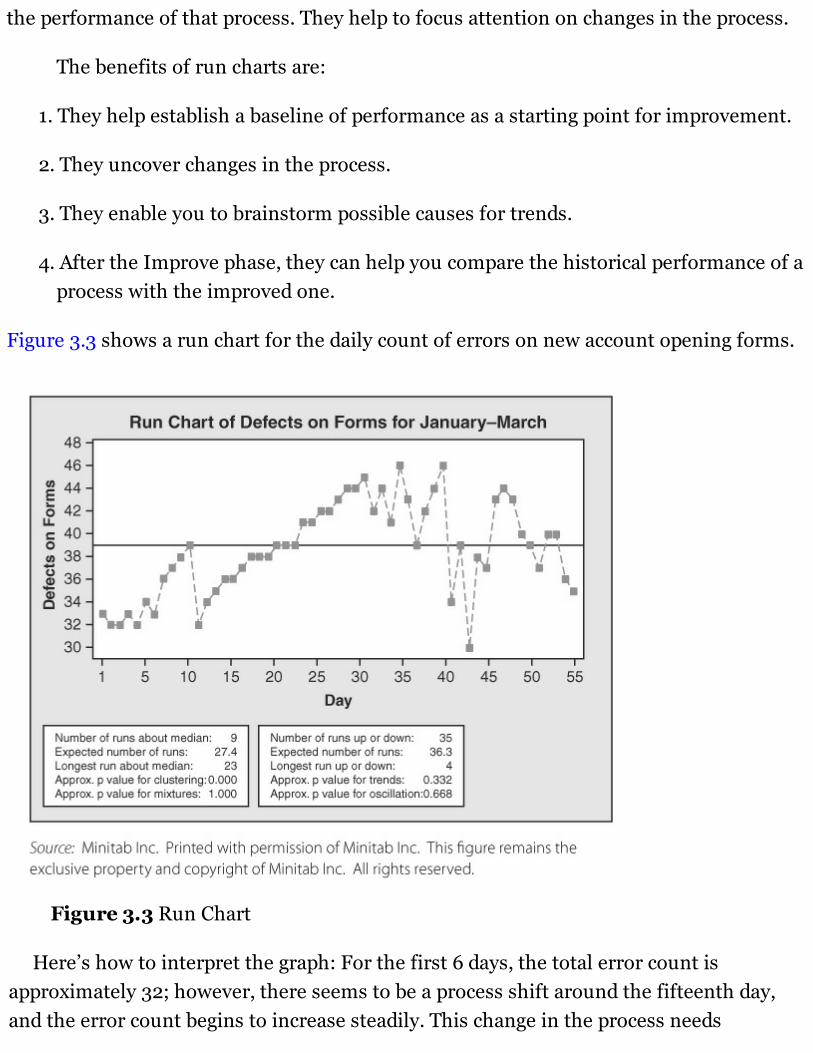
the performance of that process. They help to focus attention on changes in the process.
The benefits of run charts are:
1. They help establish a baseline of performance as a starting point for improvement.
2. They uncover changes in the process.
3. They enable you to brainstorm possible causes for trends.
4. After the Improve phase, they can help you compare the historical performance of aprocess with the improved one.
Figure 3.3 shows a run chart for the daily count of errors on new account opening forms.
Figure 3.3 Run Chart
Here’s how to interpret the graph: For the first 6 days, the total error count isapproximately 32; however, there seems to be a process shift around the fifteenth day,and the error count begins to increase steadily. This change in the process needs
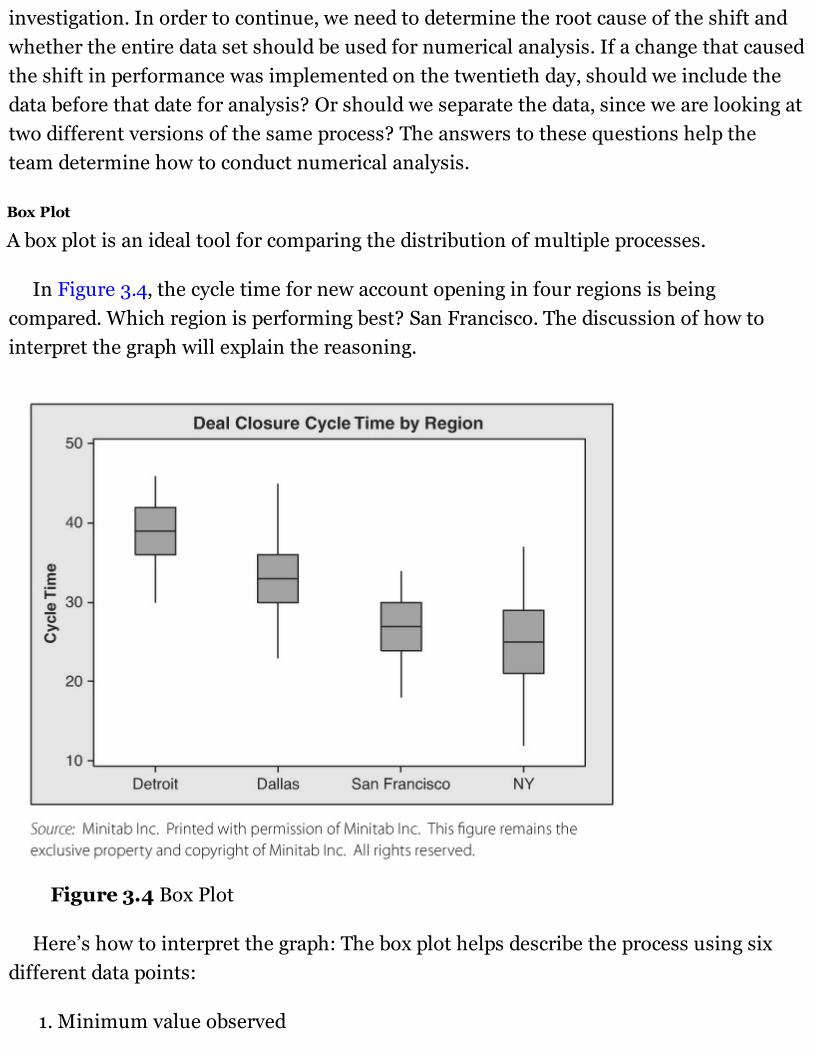
investigation. In order to continue, we need to determine the root cause of the shift andwhether the entire data set should be used for numerical analysis. If a change that causedthe shift in performance was implemented on the twentieth day, should we include thedata before that date for analysis? Or should we separate the data, since we are looking attwo different versions of the same process? The answers to these questions help theteam determine how to conduct numerical analysis.
Box Plot
A box plot is an ideal tool for comparing the distribution of multiple processes.
In Figure 3.4, the cycle time for new account opening in four regions is beingcompared. Which region is performing best? San Francisco. The discussion of how tointerpret the graph will explain the reasoning.
Figure 3.4 Box Plot
Here’s how to interpret the graph: The box plot helps describe the process using sixdifferent data points:
1. Minimum value observed
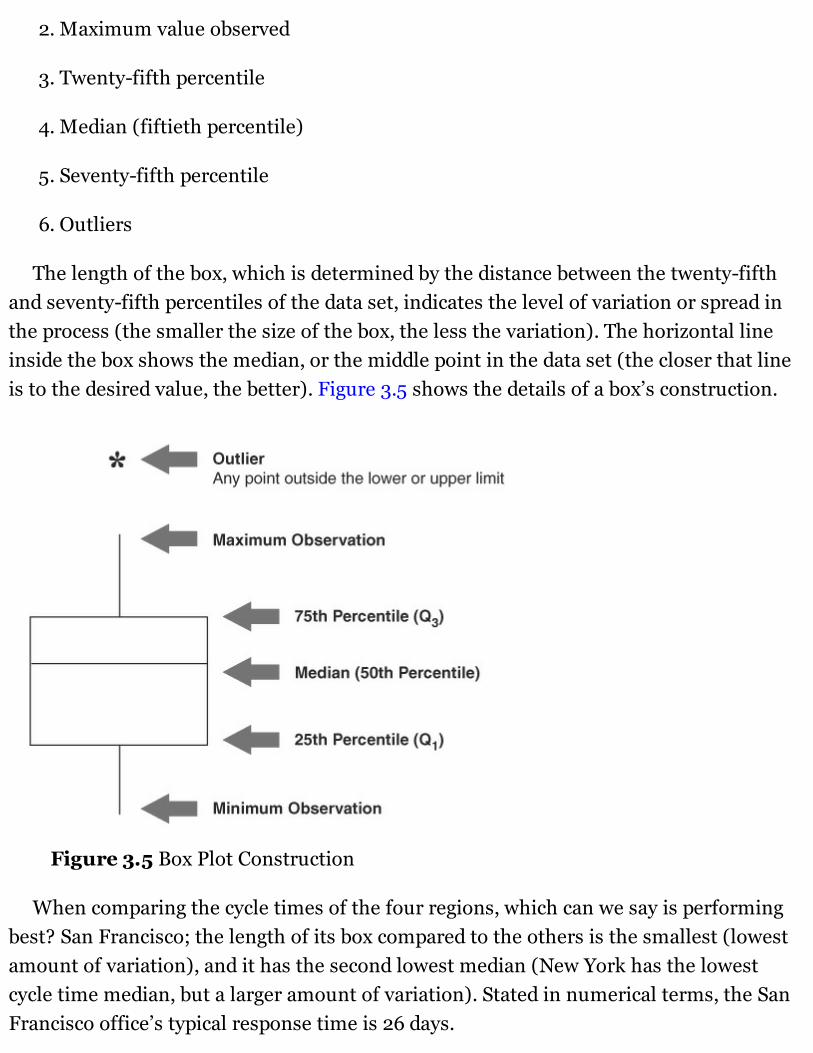
2. Maximum value observed
3. Twenty-fifth percentile
4. Median (fiftieth percentile)
5. Seventy-fifth percentile
6. Outliers
The length of the box, which is determined by the distance between the twenty-fifthand seventy-fifth percentiles of the data set, indicates the level of variation or spread inthe process (the smaller the size of the box, the less the variation). The horizontal lineinside the box shows the median, or the middle point in the data set (the closer that lineis to the desired value, the better). Figure 3.5 shows the details of a box’s construction.
Figure 3.5 Box Plot Construction
When comparing the cycle times of the four regions, which can we say is performingbest? San Francisco; the length of its box compared to the others is the smallest (lowestamount of variation), and it has the second lowest median (New York has the lowestcycle time median, but a larger amount of variation). Stated in numerical terms, the SanFrancisco office’s typical response time is 26 days.
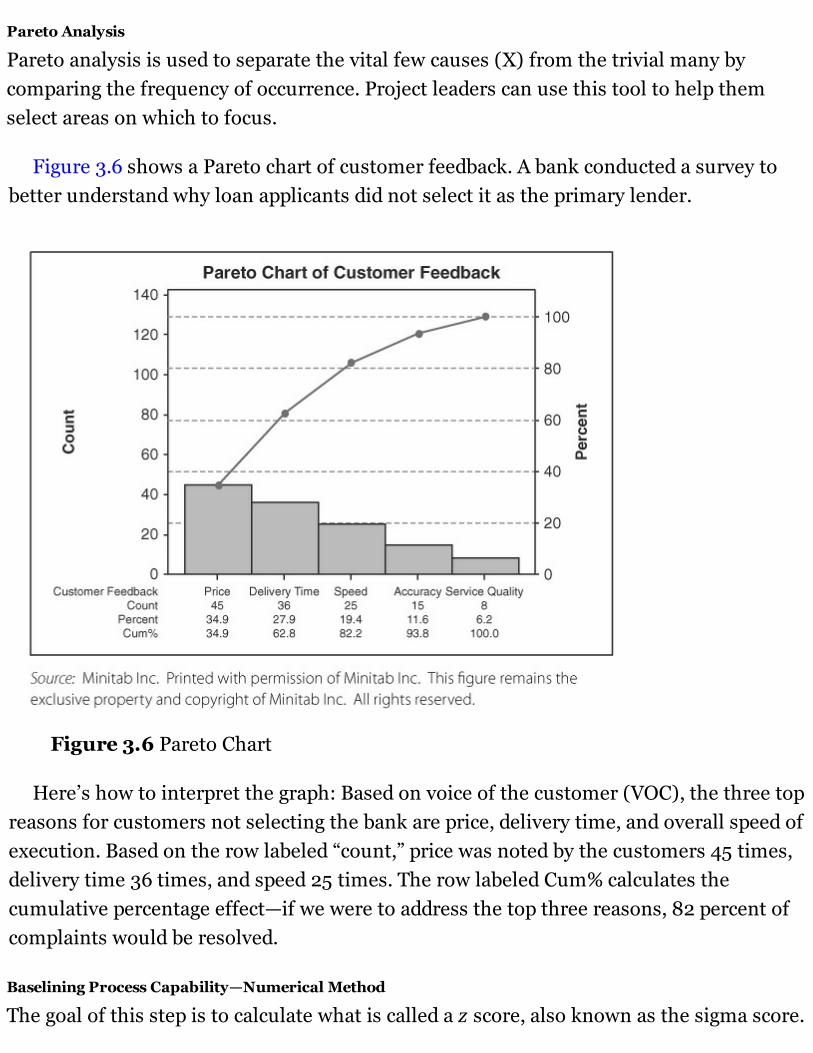
Pareto Analysis
Pareto analysis is used to separate the vital few causes (X) from the trivial many bycomparing the frequency of occurrence. Project leaders can use this tool to help themselect areas on which to focus.
Figure 3.6 shows a Pareto chart of customer feedback. A bank conducted a survey tobetter understand why loan applicants did not select it as the primary lender.
Figure 3.6 Pareto Chart
Here’s how to interpret the graph: Based on voice of the customer (VOC), the three topreasons for customers not selecting the bank are price, delivery time, and overall speed ofexecution. Based on the row labeled “count,” price was noted by the customers 45 times,delivery time 36 times, and speed 25 times. The row labeled Cum% calculates thecumulative percentage effect—if we were to address the top three reasons, 82 percent ofcomplaints would be resolved.
Baselining Process Capability—Numerical Method
The goal of this step is to calculate what is called a z score, also known as the sigma score.
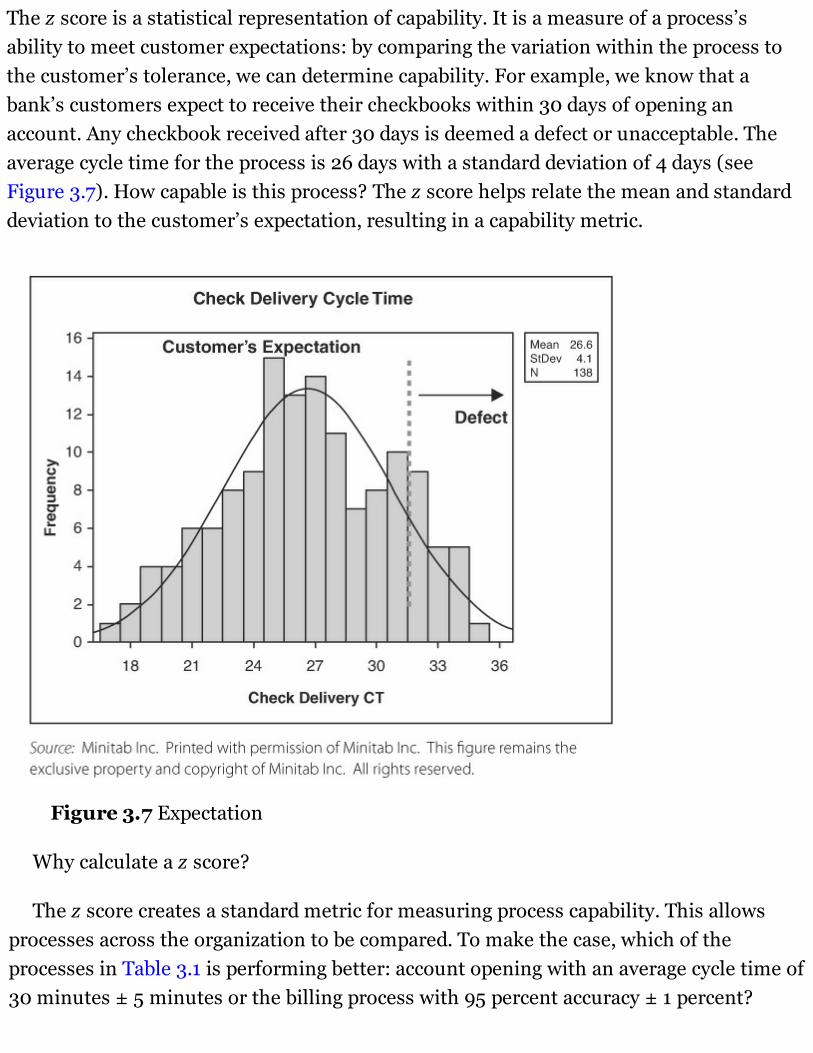
The z score is a statistical representation of capability. It is a measure of a process’sability to meet customer expectations: by comparing the variation within the process tothe customer’s tolerance, we can determine capability. For example, we know that abank’s customers expect to receive their checkbooks within 30 days of opening anaccount. Any checkbook received after 30 days is deemed a defect or unacceptable. Theaverage cycle time for the process is 26 days with a standard deviation of 4 days (seeFigure 3.7). How capable is this process? The z score helps relate the mean and standarddeviation to the customer’s expectation, resulting in a capability metric.
Figure 3.7 Expectation
Why calculate a z score?
The z score creates a standard metric for measuring process capability. This allowsprocesses across the organization to be compared. To make the case, which of theprocesses in Table 3.1 is performing better: account opening with an average cycle time of30 minutes ± 5 minutes or the billing process with 95 percent accuracy ± 1 percent?
Table 3.1 Current Performance
It is difficult to compare processes that are measured differently. However, a z scorecan be calculated for each of these processes, creating a standard platform forcomparison.
Calculating the Z Score
Numerical calculation of a process’s capability depends on two factors: the shape of thedistribution and the type of data. The shape of the distribution determines whether thedata are normally distributed or the distribution has a different shape. The data typedetermines whether the collected data are continuous or discrete.
What Is the Difference Between Continuous and Discrete Data? By definition,with continuous data, there is an infinite number of possible values. Furthermore, thedata can always be subdivided into smaller values. Examples are claim amount, cycletime, and loan amount. Discrete data, on the other hand, have finite values. Examples arepass/fail, good/bad, and percent rejected.
It is always advisable to collect continuous data for Lean Six Sigma projects.Continuous data provide two types of information about the process: frequency andmagnitude. If we collect discrete data for new account opening cycle time, we will knowonly whether the account was opened on time or late. For cases in which it was openedlate, we will not know by how much, and thus we will not be able to discuss the severityof the impact.
How Do I Know if I Have Normal Process Data? Normal data sets, when plotted,have the shape of a bell curve. However, the easiest way to conduct a normality test is byusing a statistical software package. The one most often used for Lean Six Sigma projectsis Minitab. The normality test will help determine whether the distribution of the data is
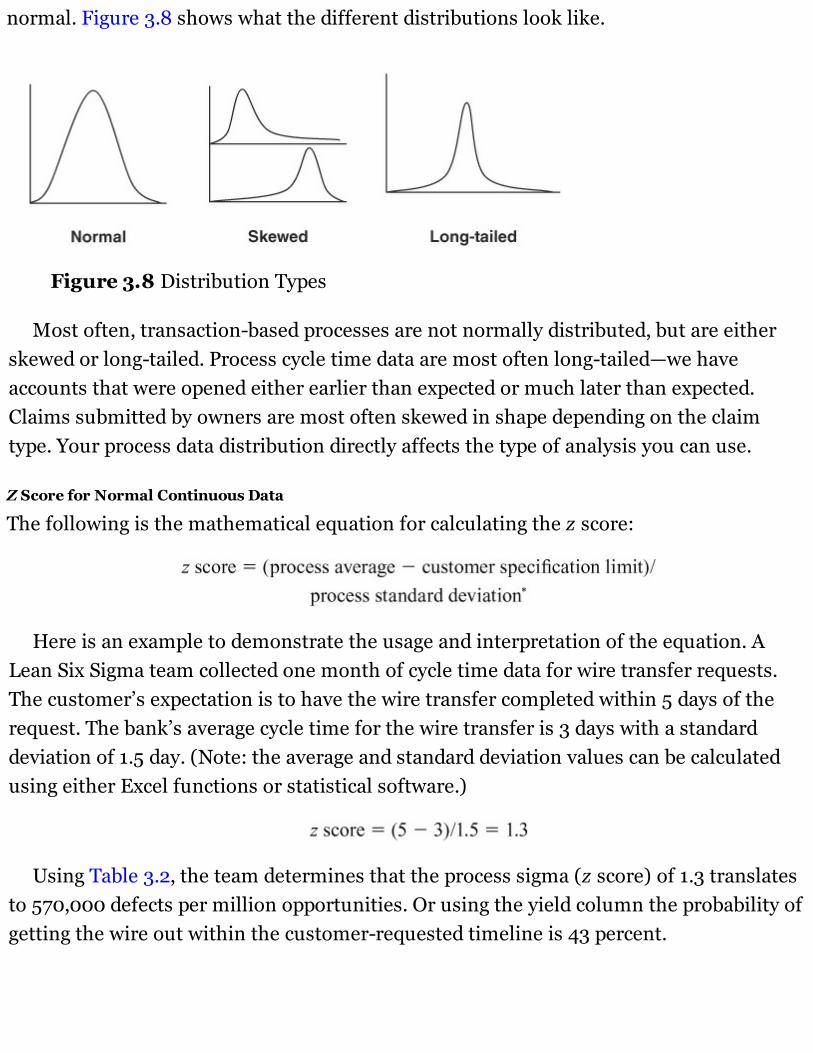
normal. Figure 3.8 shows what the different distributions look like.
Figure 3.8 Distribution Types
Most often, transaction-based processes are not normally distributed, but are eitherskewed or long-tailed. Process cycle time data are most often long-tailed—we haveaccounts that were opened either earlier than expected or much later than expected.Claims submitted by owners are most often skewed in shape depending on the claimtype. Your process data distribution directly affects the type of analysis you can use.
Z Score for Normal Continuous Data
The following is the mathematical equation for calculating the z score:
Here is an example to demonstrate the usage and interpretation of the equation. ALean Six Sigma team collected one month of cycle time data for wire transfer requests.The customer’s expectation is to have the wire transfer completed within 5 days of therequest. The bank’s average cycle time for the wire transfer is 3 days with a standarddeviation of 1.5 day. (Note: the average and standard deviation values can be calculatedusing either Excel functions or statistical software.)
Using Table 3.2, the team determines that the process sigma (z score) of 1.3 translatesto 570,000 defects per million opportunities. Or using the yield column the probability ofgetting the wire out within the customer-requested timeline is 43 percent.
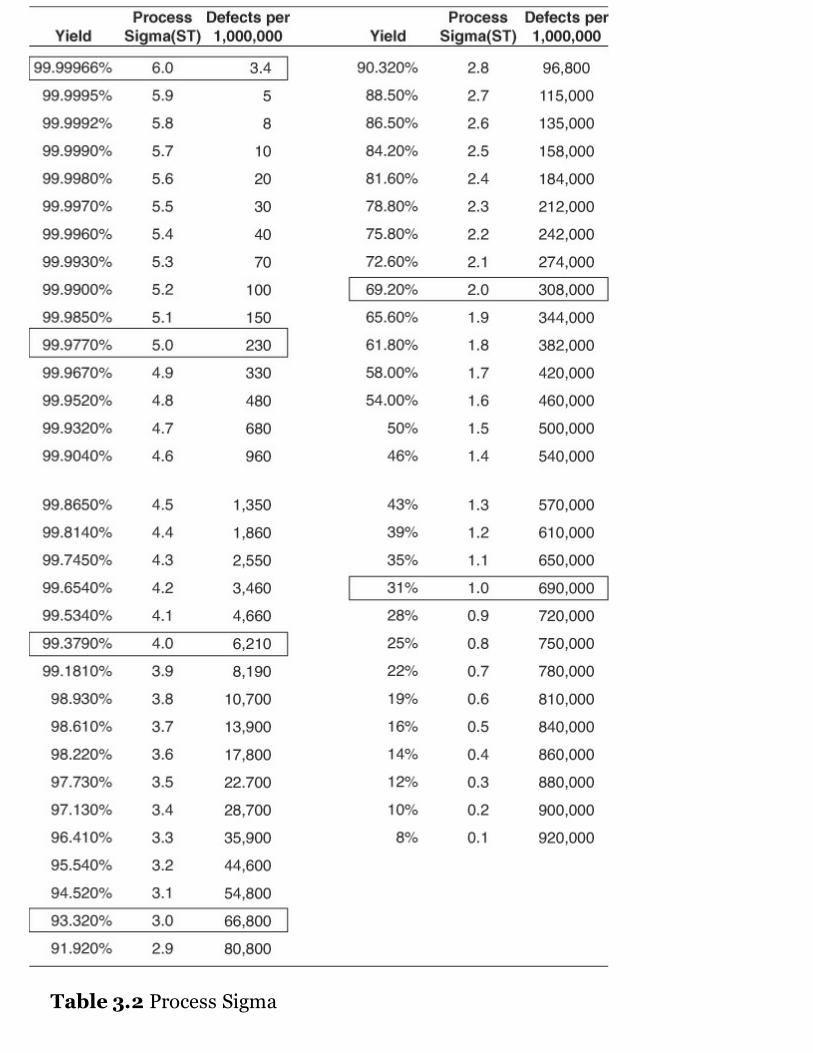
Table 3.2 Process Sigma
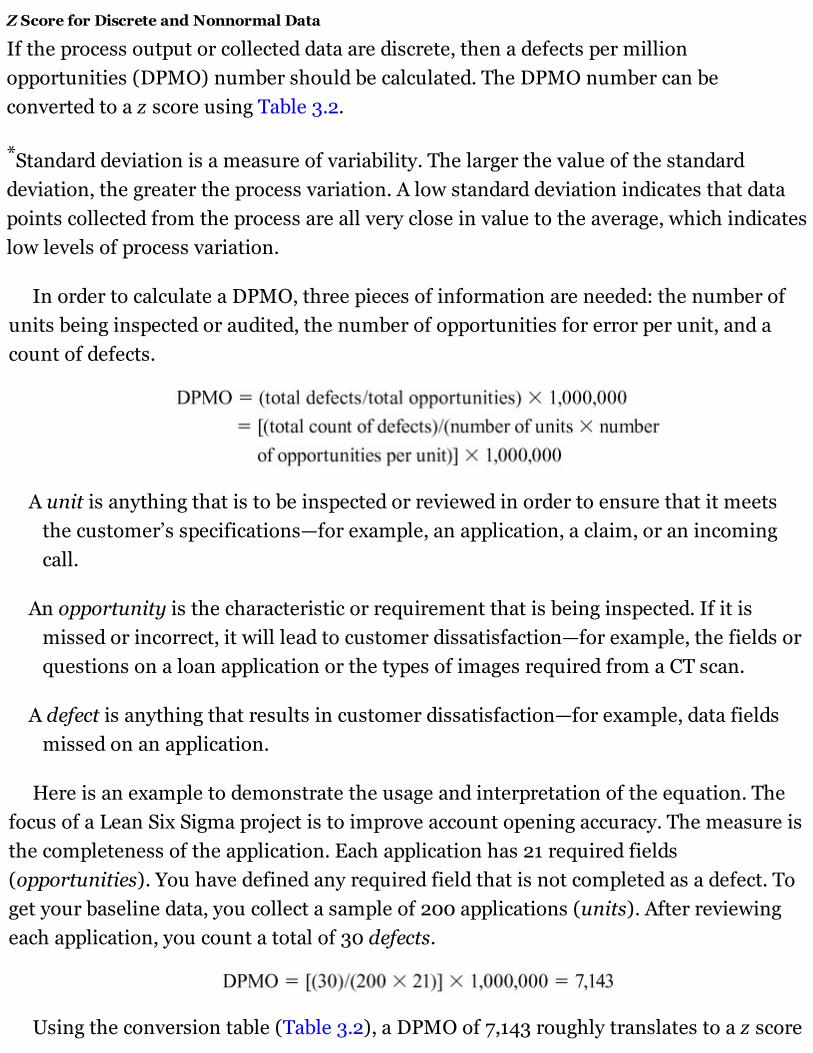
Z Score for Discrete and Nonnormal Data
If the process output or collected data are discrete, then a defects per millionopportunities (DPMO) number should be calculated. The DPMO number can beconverted to a z score using Table 3.2.
*Standard deviation is a measure of variability. The larger the value of the standarddeviation, the greater the process variation. A low standard deviation indicates that datapoints collected from the process are all very close in value to the average, which indicateslow levels of process variation.
In order to calculate a DPMO, three pieces of information are needed: the number ofunits being inspected or audited, the number of opportunities for error per unit, and acount of defects.
A unit is anything that is to be inspected or reviewed in order to ensure that it meetsthe customer’s specifications—for example, an application, a claim, or an incomingcall.
An opportunity is the characteristic or requirement that is being inspected. If it ismissed or incorrect, it will lead to customer dissatisfaction—for example, the fields orquestions on a loan application or the types of images required from a CT scan.
A defect is anything that results in customer dissatisfaction—for example, data fieldsmissed on an application.
Here is an example to demonstrate the usage and interpretation of the equation. Thefocus of a Lean Six Sigma project is to improve account opening accuracy. The measure isthe completeness of the application. Each application has 21 required fields(opportunities). You have defined any required field that is not completed as a defect. Toget your baseline data, you collect a sample of 200 applications (units). After reviewingeach application, you count a total of 30 defects.
Using the conversion table (Table 3.2), a DPMO of 7,143 roughly translates to a z score
of 3.95.
But what does all this mean?
What is a z score of 2 or 3.8 or 6? What is the practical translation of this number?
If a process has a z score of 2, this implies that you are looking at a two sigma process.And a sigma or z score can always be translated to a DPMO number (how many errors aprocess can expect given a million opportunities). On a practical level, the higher the zscore, the higher the capability of the process: it has a lower chance of producing an errorand thus causing customer dissatisfaction. By the time a process has reached a z score of6, otherwise stated as a six sigma process, it produces only 3.4 errors per millionopportunities.
In statistical terms, a z score of 3 posits that three units of standard deviation can fitbetween the average performance of a process (μ) and the customer’s expectation (upperspecification level, or USL). Standard deviation (σ) is a measure of variability. The lessvariation a process experiences, the more stable the process and so the smaller itsstandard deviation value. Otherwise stated, the bell curve shape of processes with lowstandard deviation is very tight and narrow (see Figure 3.9).
Figure 3.9 Bell Curves with Big and Small Standard Deviation
The smaller the standard deviation value, the more units can be fitted between themean and the specification limit. So it follows that the more units of variation we can fitbetween the mean and the specification limit, the more capable the process (see Figure
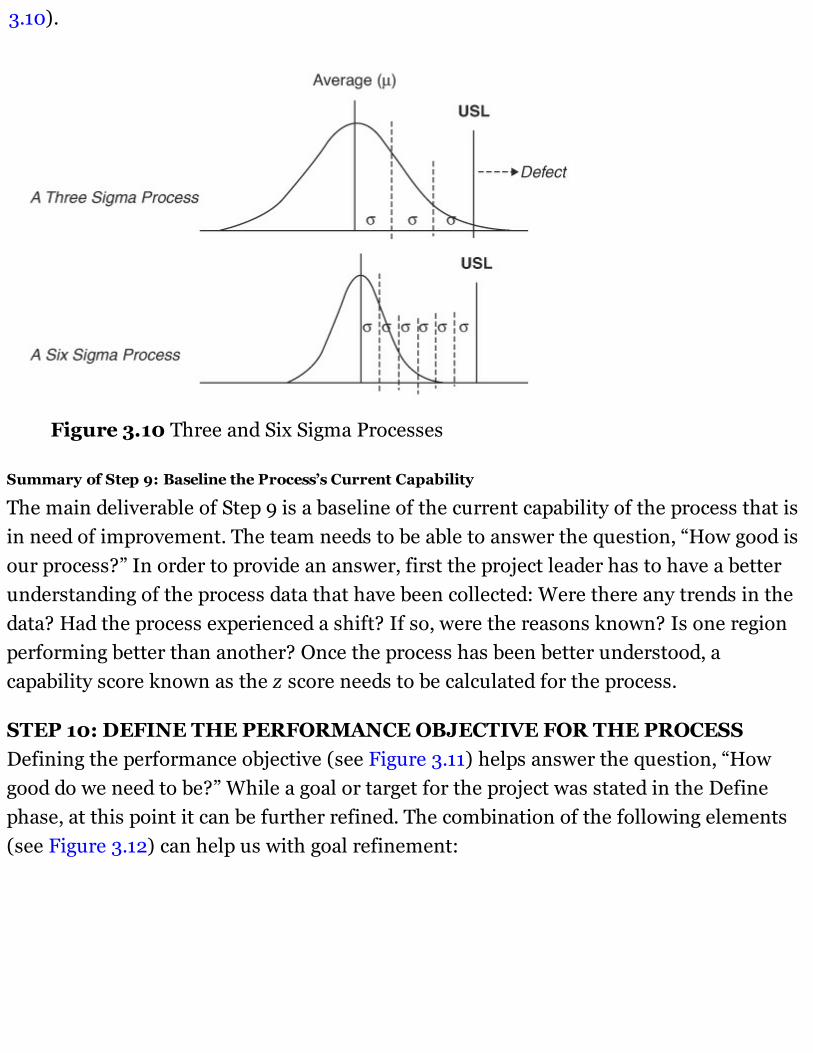
3.10).
Figure 3.10 Three and Six Sigma Processes
Summary of Step 9: Baseline the Process’s Current Capability
The main deliverable of Step 9 is a baseline of the current capability of the process that isin need of improvement. The team needs to be able to answer the question, “How good isour process?” In order to provide an answer, first the project leader has to have a betterunderstanding of the process data that have been collected: Were there any trends in thedata? Had the process experienced a shift? If so, were the reasons known? Is one regionperforming better than another? Once the process has been better understood, acapability score known as the z score needs to be calculated for the process.
STEP 10: DEFINE THE PERFORMANCE OBJECTIVE FOR THE PROCESSDefining the performance objective (see Figure 3.11) helps answer the question, “Howgood do we need to be?” While a goal or target for the project was stated in the Definephase, at this point it can be further refined. The combination of the following elements(see Figure 3.12) can help us with goal refinement:
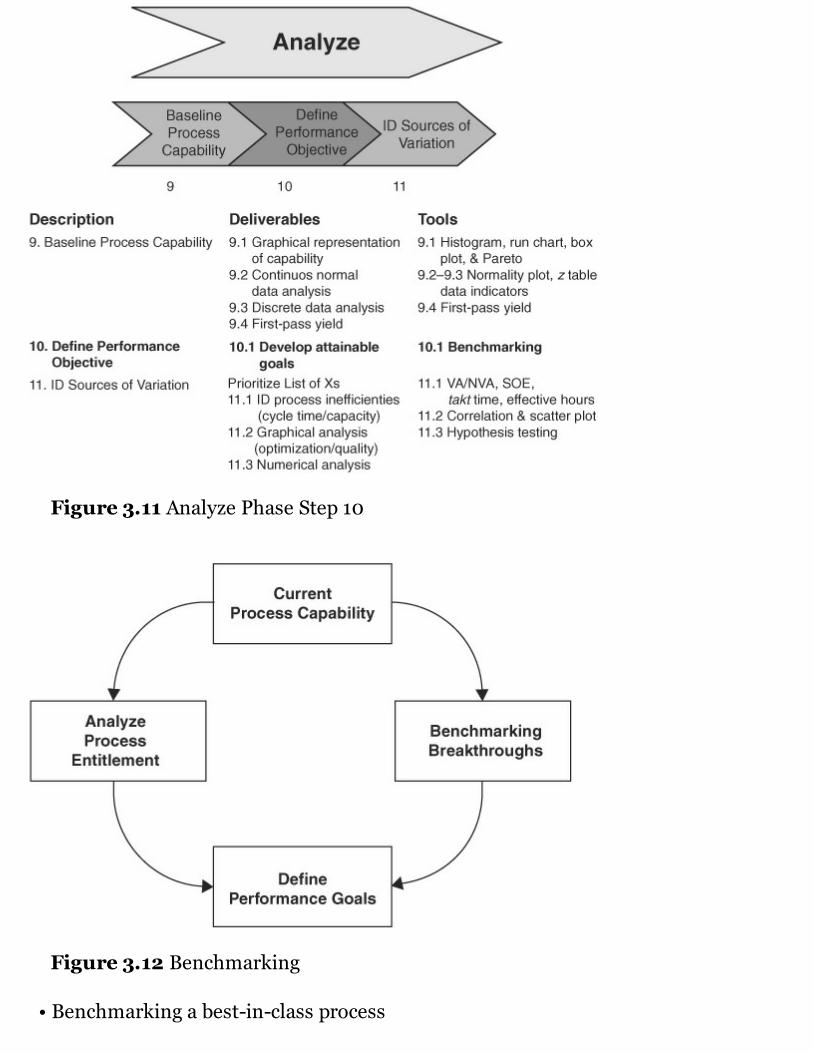
Figure 3.11 Analyze Phase Step 10
Figure 3.12 Benchmarking
• Benchmarking a best-in-class process
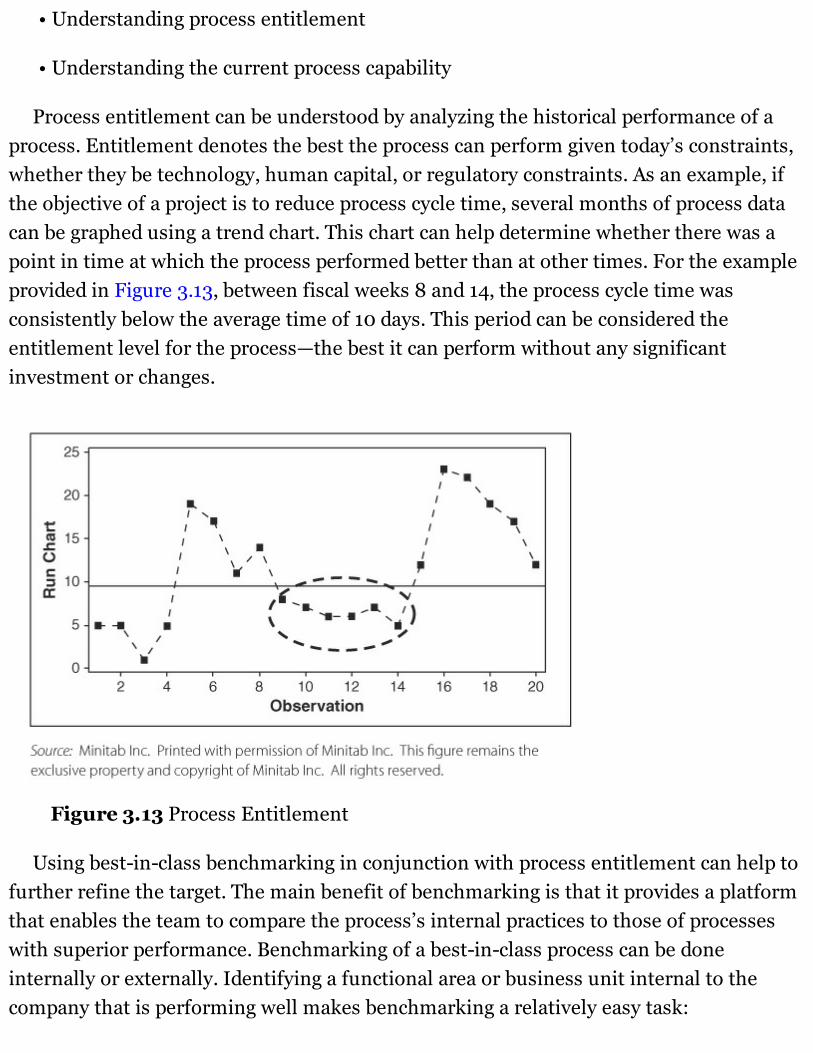
• Understanding process entitlement
• Understanding the current process capability
Process entitlement can be understood by analyzing the historical performance of aprocess. Entitlement denotes the best the process can perform given today’s constraints,whether they be technology, human capital, or regulatory constraints. As an example, ifthe objective of a project is to reduce process cycle time, several months of process datacan be graphed using a trend chart. This chart can help determine whether there was apoint in time at which the process performed better than at other times. For the exampleprovided in Figure 3.13, between fiscal weeks 8 and 14, the process cycle time wasconsistently below the average time of 10 days. This period can be considered theentitlement level for the process—the best it can perform without any significantinvestment or changes.
Figure 3.13 Process Entitlement
Using best-in-class benchmarking in conjunction with process entitlement can help tofurther refine the target. The main benefit of benchmarking is that it provides a platformthat enables the team to compare the process’s internal practices to those of processeswith superior performance. Benchmarking of a best-in-class process can be doneinternally or externally. Identifying a functional area or business unit internal to thecompany that is performing well makes benchmarking a relatively easy task:
• Data can be easily collected and shared.
• Technology and policies should be similar.
• There is a common corporate culture.
Alternatively, benchmarking a competitor or companies in similar industries who havesimilar operating characteristics has high potential for discovery and may lead to outside-the-box thinking.
The combination of baselining capability with either benchmarking and/or identifyingprocess entitlement can help in refining the project goal—it can ensure that the target isattainable. In the end, regardless of the approach that the team has taken to determinethe project goal, one thing remains constant: the customer has to recognize theimprovement.
STEP 11: IDENTIFY SOURCES OF VARIATIONUp to this point, there has been very little distinction between the Lean and Six Sigmamethodologies. However in this step, the tool selection will rely heavily on the projectdeliverables (see Figure 3.14). If the project is focused on standardization, stabilization ofa process (has a z score of <1), or reduction in cycle time, there will be a heavier focus onthe Lean tools. On the other hand, if the z score of the process is >3, and data are requiredto uncover the root cause of the issue, then Six Sigma tools are more appropriate (seeFigure 3.15).
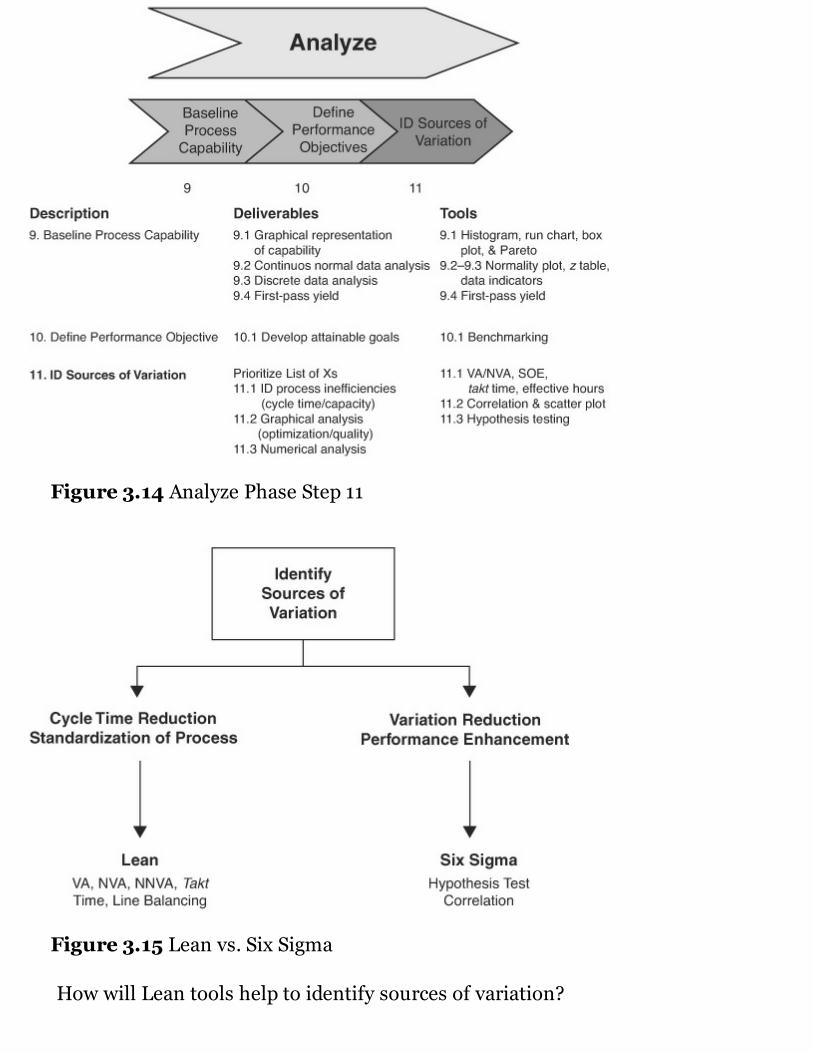
Figure 3.14 Analyze Phase Step 11
Figure 3.15 Lean vs. Six Sigma
How will Lean tools help to identify sources of variation?
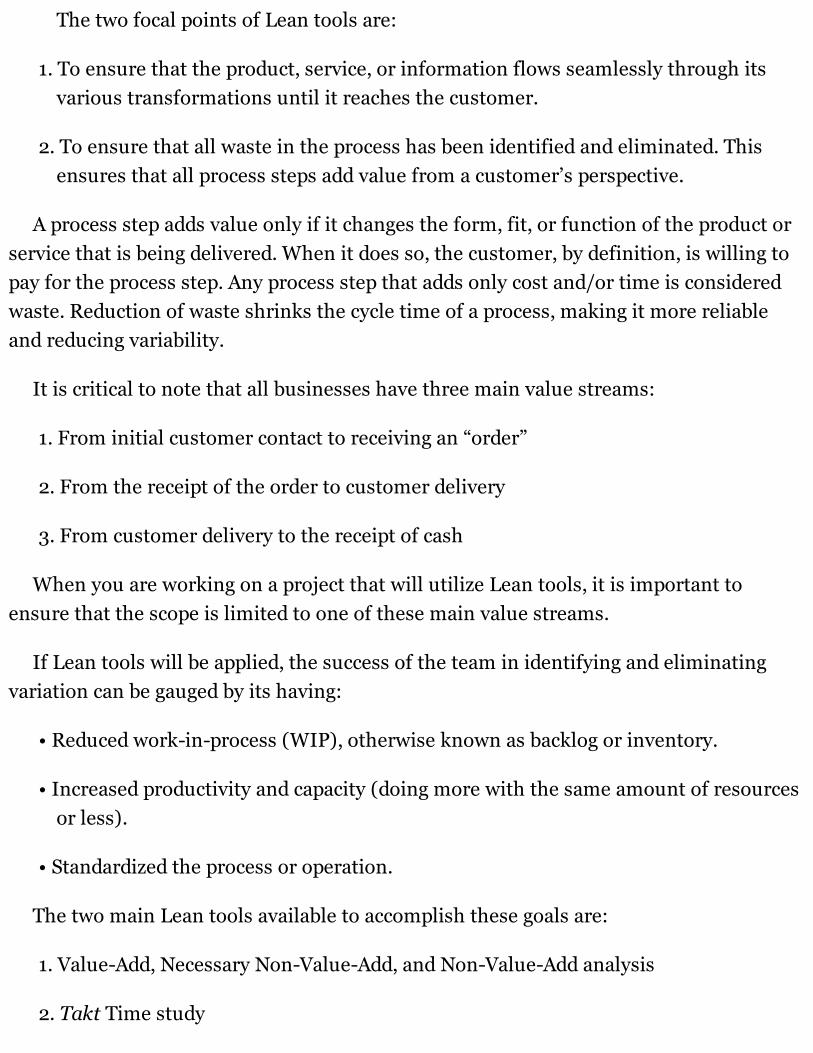
The two focal points of Lean tools are:
1. To ensure that the product, service, or information flows seamlessly through itsvarious transformations until it reaches the customer.
2. To ensure that all waste in the process has been identified and eliminated. Thisensures that all process steps add value from a customer’s perspective.
A process step adds value only if it changes the form, fit, or function of the product orservice that is being delivered. When it does so, the customer, by definition, is willing topay for the process step. Any process step that adds only cost and/or time is consideredwaste. Reduction of waste shrinks the cycle time of a process, making it more reliableand reducing variability.
It is critical to note that all businesses have three main value streams:
1. From initial customer contact to receiving an “order”
2. From the receipt of the order to customer delivery
3. From customer delivery to the receipt of cash
When you are working on a project that will utilize Lean tools, it is important toensure that the scope is limited to one of these main value streams.
If Lean tools will be applied, the success of the team in identifying and eliminatingvariation can be gauged by its having:
• Reduced work-in-process (WIP), otherwise known as backlog or inventory.
• Increased productivity and capacity (doing more with the same amount of resourcesor less).
• Standardized the process or operation.
The two main Lean tools available to accomplish these goals are:
1. Value-Add, Necessary Non-Value-Add, and Non-Value-Add analysis
2. Takt Time study
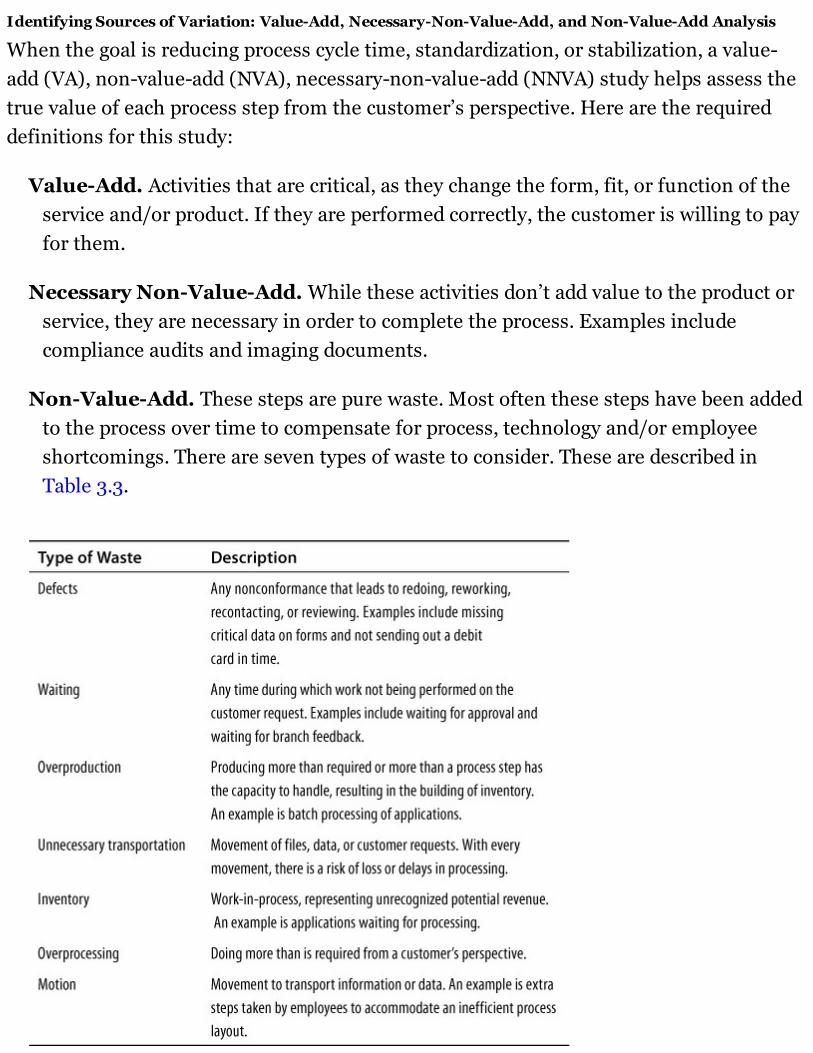
Identifying Sources of Variation: Value-Add, Necessary-Non-Value-Add, and Non-Value-Add Analysis
When the goal is reducing process cycle time, standardization, or stabilization, a value-add (VA), non-value-add (NVA), necessary-non-value-add (NNVA) study helps assess thetrue value of each process step from the customer’s perspective. Here are the requireddefinitions for this study:
Value-Add. Activities that are critical, as they change the form, fit, or function of theservice and/or product. If they are performed correctly, the customer is willing to payfor them.
Necessary Non-Value-Add. While these activities don’t add value to the product orservice, they are necessary in order to complete the process. Examples includecompliance audits and imaging documents.
Non-Value-Add. These steps are pure waste. Most often these steps have been addedto the process over time to compensate for process, technology and/or employeeshortcomings. There are seven types of waste to consider. These are described inTable 3.3.
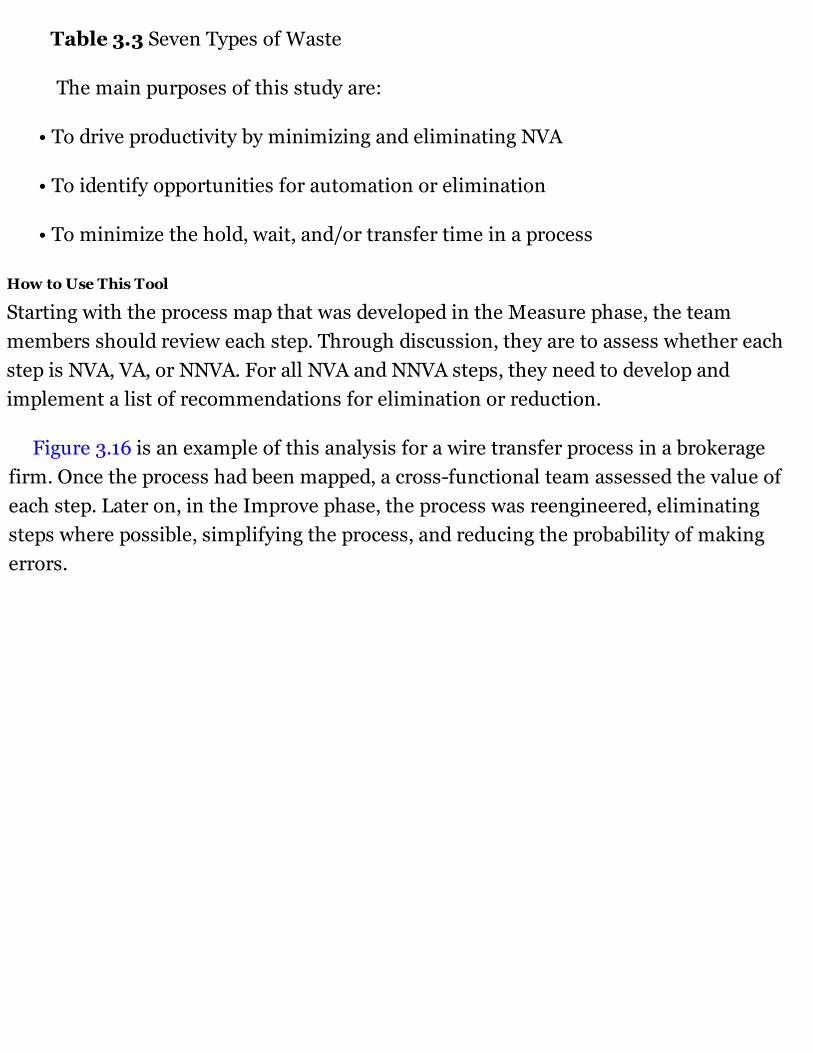
Table 3.3 Seven Types of Waste
The main purposes of this study are:
• To drive productivity by minimizing and eliminating NVA
• To identify opportunities for automation or elimination
• To minimize the hold, wait, and/or transfer time in a process
How to Use This Tool
Starting with the process map that was developed in the Measure phase, the teammembers should review each step. Through discussion, they are to assess whether eachstep is NVA, VA, or NNVA. For all NVA and NNVA steps, they need to develop andimplement a list of recommendations for elimination or reduction.
Figure 3.16 is an example of this analysis for a wire transfer process in a brokeragefirm. Once the process had been mapped, a cross-functional team assessed the value ofeach step. Later on, in the Improve phase, the process was reengineered, eliminatingsteps where possible, simplifying the process, and reducing the probability of makingerrors.
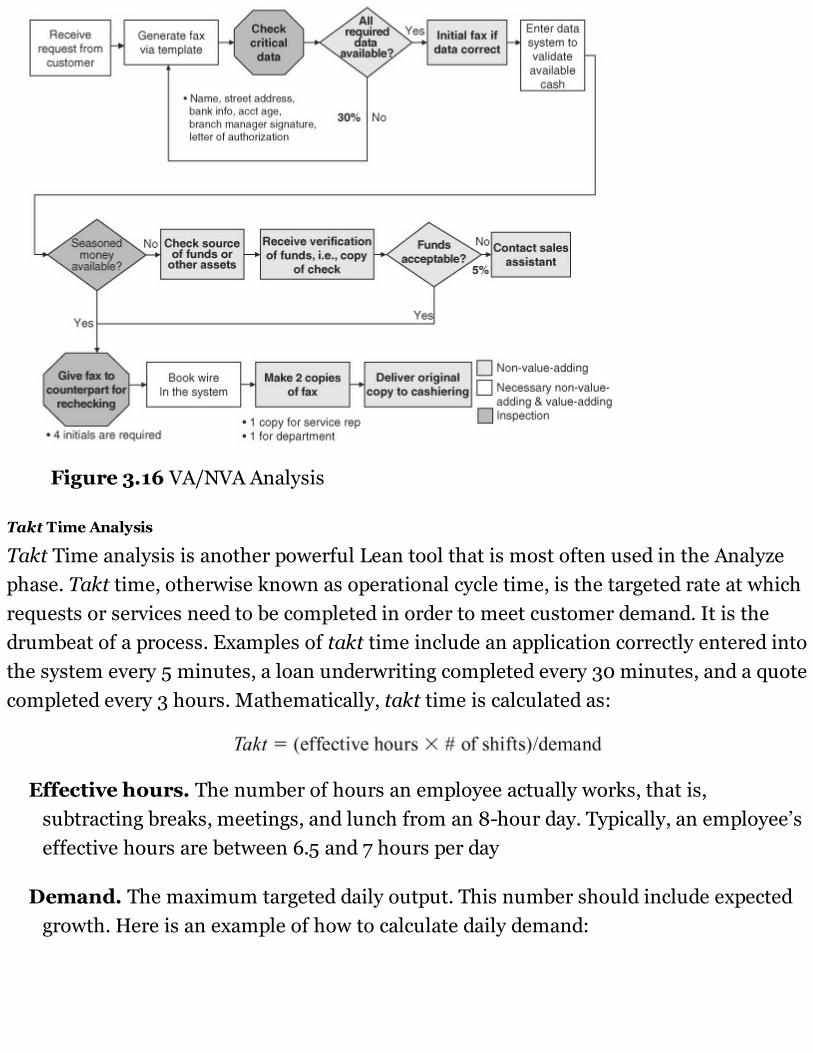
Figure 3.16 VA/NVA Analysis
Takt Time Analysis
Takt Time analysis is another powerful Lean tool that is most often used in the Analyzephase. Takt time, otherwise known as operational cycle time, is the targeted rate at whichrequests or services need to be completed in order to meet customer demand. It is thedrumbeat of a process. Examples of takt time include an application correctly entered intothe system every 5 minutes, a loan underwriting completed every 30 minutes, and a quotecompleted every 3 hours. Mathematically, takt time is calculated as:
Effective hours. The number of hours an employee actually works, that is,subtracting breaks, meetings, and lunch from an 8-hour day. Typically, an employee’seffective hours are between 6.5 and 7 hours per day
Demand. The maximum targeted daily output. This number should include expectedgrowth. Here is an example of how to calculate daily demand:
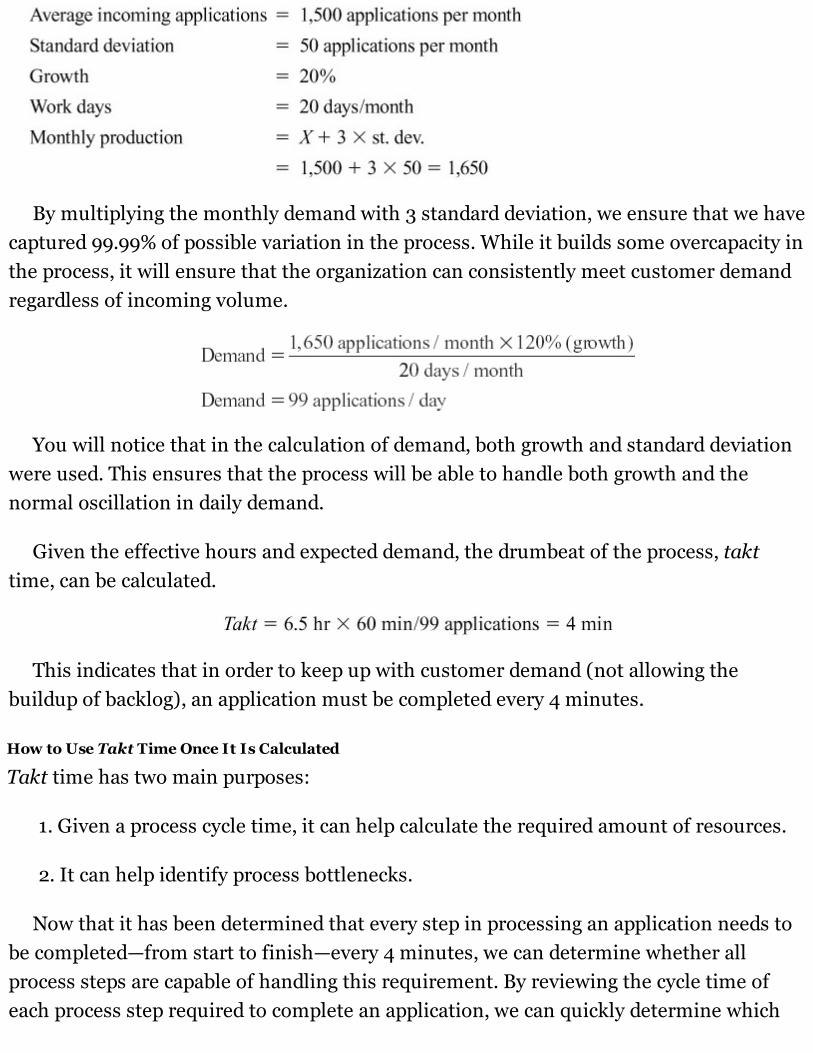
By multiplying the monthly demand with 3 standard deviation, we ensure that we havecaptured 99.99% of possible variation in the process. While it builds some overcapacity inthe process, it will ensure that the organization can consistently meet customer demandregardless of incoming volume.
You will notice that in the calculation of demand, both growth and standard deviationwere used. This ensures that the process will be able to handle both growth and thenormal oscillation in daily demand.
Given the effective hours and expected demand, the drumbeat of the process, takttime, can be calculated.
This indicates that in order to keep up with customer demand (not allowing thebuildup of backlog), an application must be completed every 4 minutes.
How to Use Takt Time Once It Is Calculated
Takt time has two main purposes:
1. Given a process cycle time, it can help calculate the required amount of resources.
2. It can help identify process bottlenecks.
Now that it has been determined that every step in processing an application needs tobe completed—from start to finish—every 4 minutes, we can determine whether allprocess steps are capable of handling this requirement. By reviewing the cycle time ofeach process step required to complete an application, we can quickly determine which
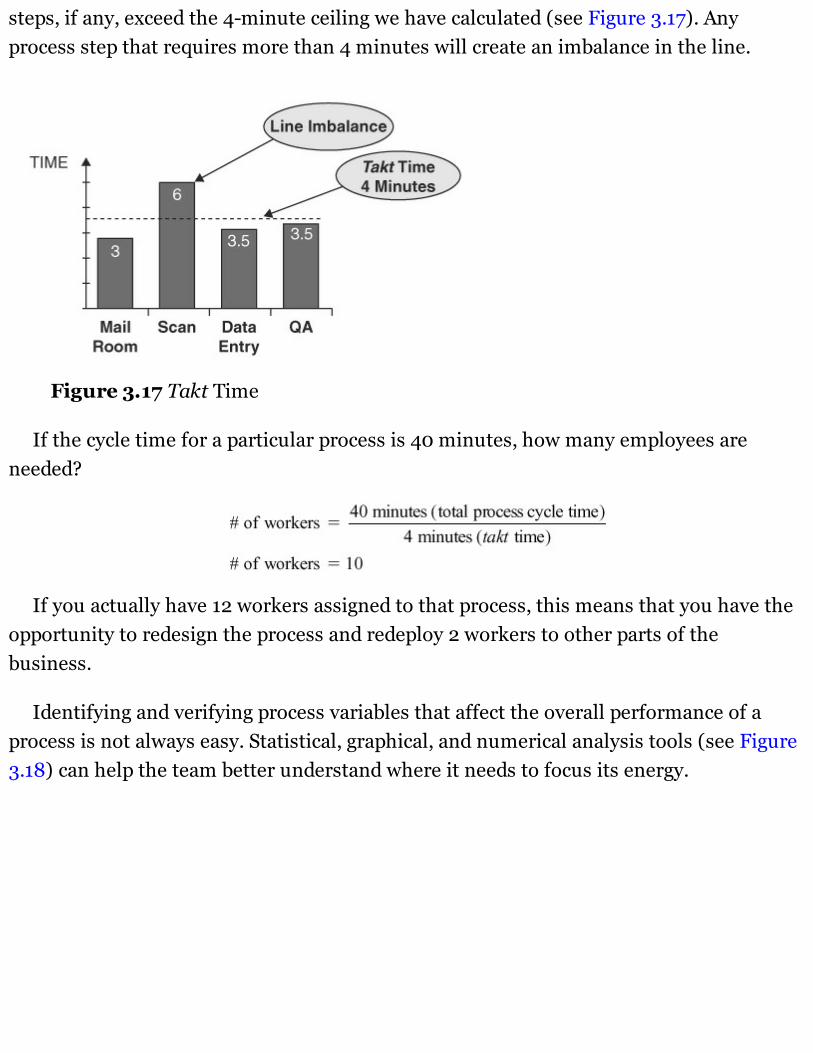
steps, if any, exceed the 4-minute ceiling we have calculated (see Figure 3.17). Anyprocess step that requires more than 4 minutes will create an imbalance in the line.
Figure 3.17 Takt Time
If the cycle time for a particular process is 40 minutes, how many employees areneeded?
If you actually have 12 workers assigned to that process, this means that you have theopportunity to redesign the process and redeploy 2 workers to other parts of thebusiness.
Identifying and verifying process variables that affect the overall performance of aprocess is not always easy. Statistical, graphical, and numerical analysis tools (see Figure3.18) can help the team better understand where it needs to focus its energy.
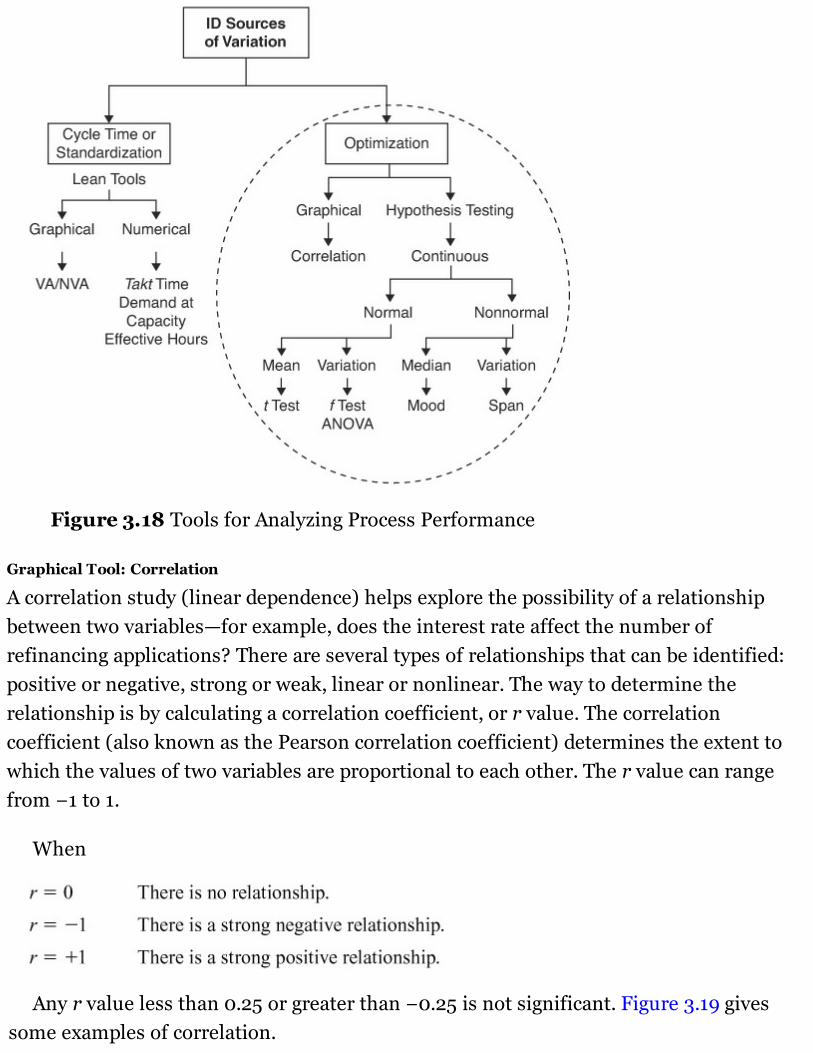
Figure 3.18 Tools for Analyzing Process Performance
Graphical Tool: Correlation
A correlation study (linear dependence) helps explore the possibility of a relationshipbetween two variables—for example, does the interest rate affect the number ofrefinancing applications? There are several types of relationships that can be identified:positive or negative, strong or weak, linear or nonlinear. The way to determine therelationship is by calculating a correlation coefficient, or r value. The correlationcoefficient (also known as the Pearson correlation coefficient) determines the extent towhich the values of two variables are proportional to each other. The r value can rangefrom −1 to 1.
When
Any r value less than 0.25 or greater than −0.25 is not significant. Figure 3.19 givessome examples of correlation.
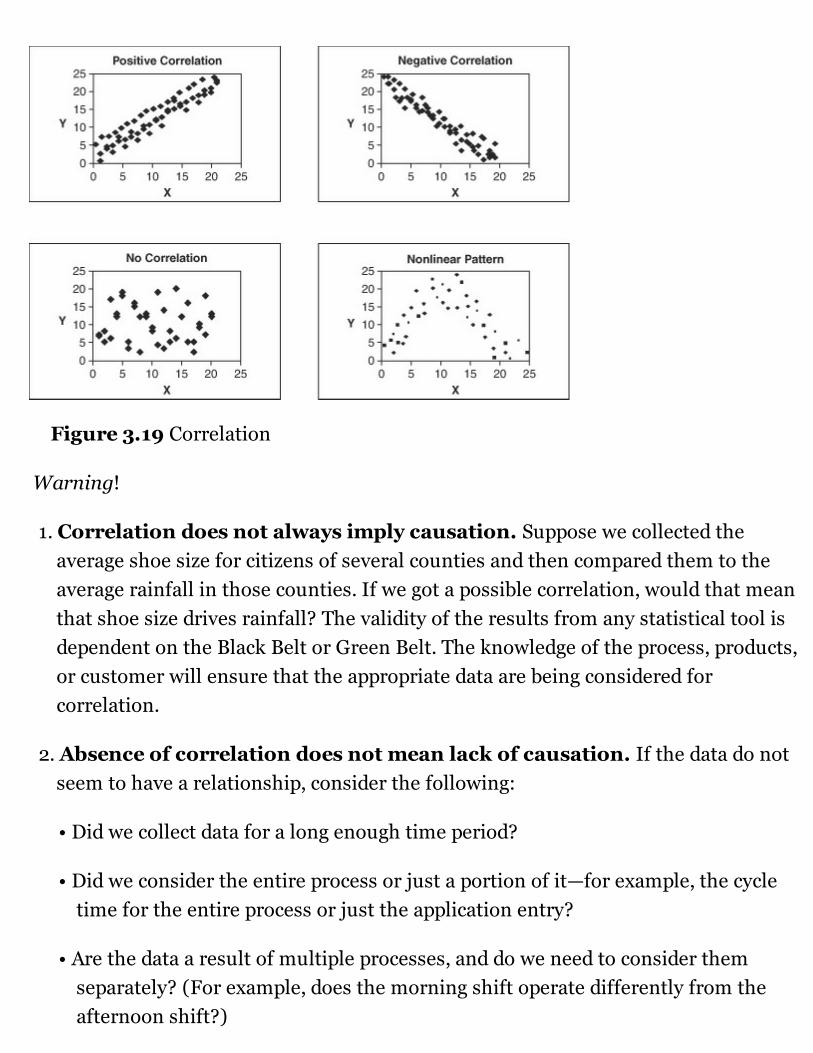
Figure 3.19 Correlation
Warning!
1. Correlation does not always imply causation. Suppose we collected theaverage shoe size for citizens of several counties and then compared them to theaverage rainfall in those counties. If we got a possible correlation, would that meanthat shoe size drives rainfall? The validity of the results from any statistical tool isdependent on the Black Belt or Green Belt. The knowledge of the process, products,or customer will ensure that the appropriate data are being considered forcorrelation.
2. Absence of correlation does not mean lack of causation. If the data do notseem to have a relationship, consider the following:
• Did we collect data for a long enough time period?
• Did we consider the entire process or just a portion of it—for example, the cycletime for the entire process or just the application entry?
• Are the data a result of multiple processes, and do we need to consider themseparately? (For example, does the morning shift operate differently from theafternoon shift?)
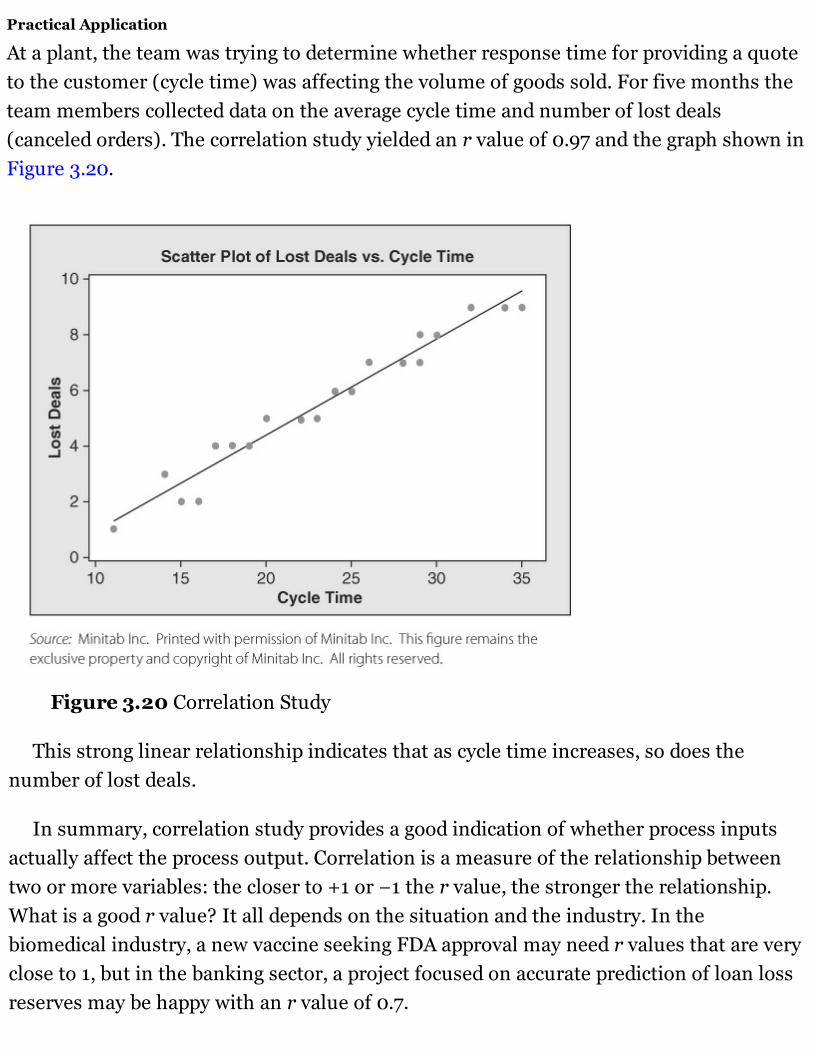
Practical Application
At a plant, the team was trying to determine whether response time for providing a quoteto the customer (cycle time) was affecting the volume of goods sold. For five months theteam members collected data on the average cycle time and number of lost deals(canceled orders). The correlation study yielded an r value of 0.97 and the graph shown inFigure 3.20.
Figure 3.20 Correlation Study
This strong linear relationship indicates that as cycle time increases, so does thenumber of lost deals.
In summary, correlation study provides a good indication of whether process inputsactually affect the process output. Correlation is a measure of the relationship betweentwo or more variables: the closer to +1 or −1 the r value, the stronger the relationship.What is a good r value? It all depends on the situation and the industry. In thebiomedical industry, a new vaccine seeking FDA approval may need r values that are veryclose to 1, but in the banking sector, a project focused on accurate prediction of loan lossreserves may be happy with an r value of 0.7.
Hypothesis Testing
Hypothesis testing, a statistical tool, allows the comparison of two or more processattributes—mean, median, and standard deviation. It provides an objective method fordetermining differences. Sometimes we cannot decide through graphical methods or byusing calculated statistics (sample mean and standard deviation) whether there is astatistically significant difference between processes. Hypothesis testing will provide thatconfirmation. In the end, this test allows us to determine whether observed differencesare statistically significant or the result of chance.
A hypothesis is a statement of an assumption. You can state a hypothesis aboutanything. However, for hypothesis testing, there is a testing protocol: you need to have anull and an alternative hypothesis.
Null hypothesis (H0). This is a statement validating the status quo—there will be nochange of significance observed. Any differences detected are purely due to chanceand not a change in the process.
Alternative hypothesis (Ha). This is a statement that there will be a difference ofstatistical significance detected.
Just remember that with any statistical test, we are making inferences about thepopulation based on only a sample from that population. Thus, there is always aprobability that we will come to an incorrect conclusion. Most statistical tests are runwith a 95 percent confidence level, indicating that there is a 5 percent chance of makingan error.
The decision of whether to accept or reject the null hypothesis is based on thecalculated p value. If the p value is less than or equal to a preassigned significance level(normally set at 5 percent), then we reject the null hypothesis and accept the alternative.Otherwise stated, if the p is low, the null must go! A p value will be calculated by thestatistical software when running a hypothesis test.
Types of Hypothesis Testing
Depending on the type of data you have and whether they are normal or nonnormal, thereare several hypothesis tests available for comparing process characteristics (see Figure3.21).
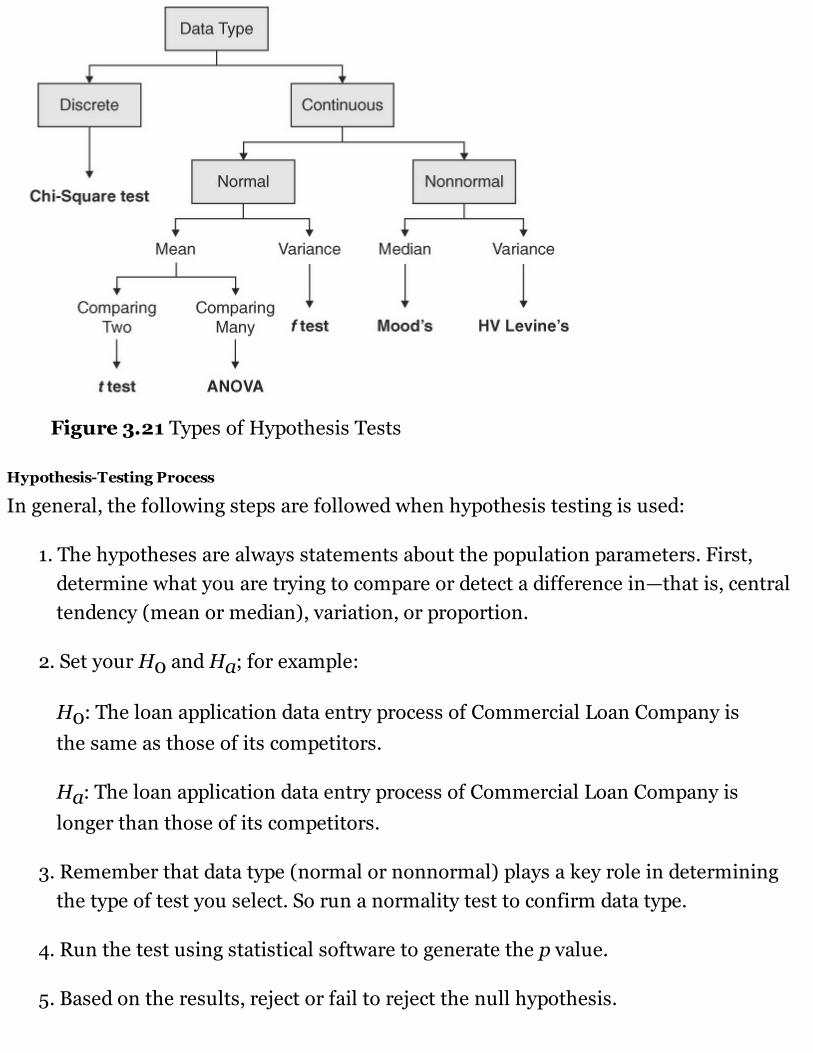
Figure 3.21 Types of Hypothesis Tests
Hypothesis-Testing Process
In general, the following steps are followed when hypothesis testing is used:
1. The hypotheses are always statements about the population parameters. First,determine what you are trying to compare or detect a difference in—that is, centraltendency (mean or median), variation, or proportion.
2. Set your H0 and Ha; for example:
H0: The loan application data entry process of Commercial Loan Company isthe same as those of its competitors.
Ha: The loan application data entry process of Commercial Loan Company islonger than those of its competitors.
3. Remember that data type (normal or nonnormal) plays a key role in determiningthe type of test you select. So run a normality test to confirm data type.
4. Run the test using statistical software to generate the p value.
5. Based on the results, reject or fail to reject the null hypothesis.
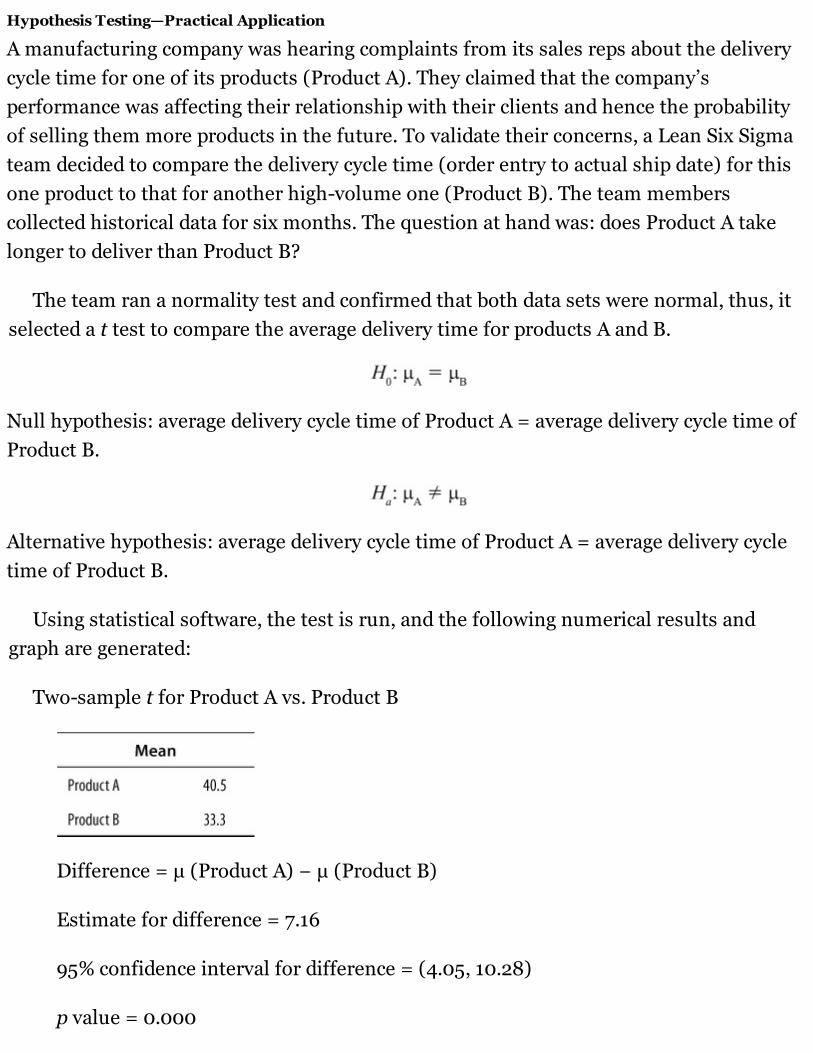
Hypothesis Testing—Practical Application
A manufacturing company was hearing complaints from its sales reps about the deliverycycle time for one of its products (Product A). They claimed that the company’sperformance was affecting their relationship with their clients and hence the probabilityof selling them more products in the future. To validate their concerns, a Lean Six Sigmateam decided to compare the delivery cycle time (order entry to actual ship date) for thisone product to that for another high-volume one (Product B). The team memberscollected historical data for six months. The question at hand was: does Product A takelonger to deliver than Product B?
The team ran a normality test and confirmed that both data sets were normal, thus, itselected a t test to compare the average delivery time for products A and B.
Null hypothesis: average delivery cycle time of Product A = average delivery cycle time ofProduct B.
Alternative hypothesis: average delivery cycle time of Product A = average delivery cycletime of Product B.
Using statistical software, the test is run, and the following numerical results andgraph are generated:
Two-sample t for Product A vs. Product B
Difference = μ (Product A) − μ (Product B)
Estimate for difference = 7.16
95% confidence interval for difference = (4.05, 10.28)
p value = 0.000
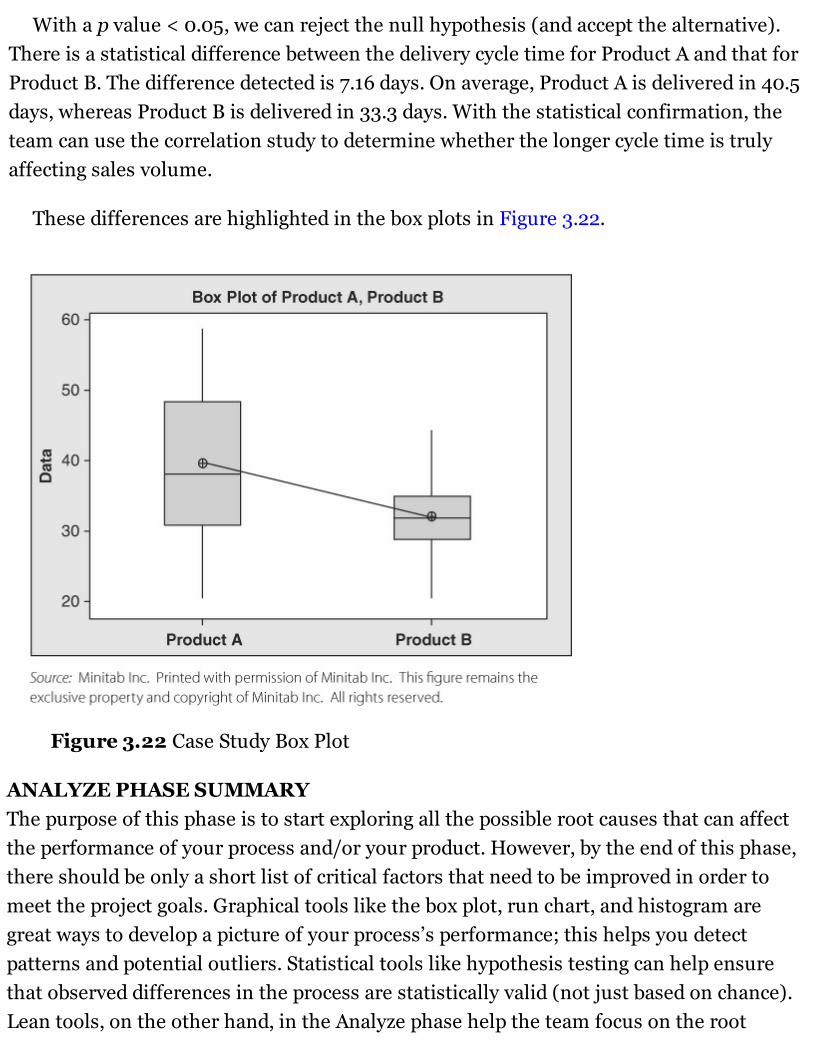
With a p value < 0.05, we can reject the null hypothesis (and accept the alternative).There is a statistical difference between the delivery cycle time for Product A and that forProduct B. The difference detected is 7.16 days. On average, Product A is delivered in 40.5days, whereas Product B is delivered in 33.3 days. With the statistical confirmation, theteam can use the correlation study to determine whether the longer cycle time is trulyaffecting sales volume.
These differences are highlighted in the box plots in Figure 3.22.
Figure 3.22 Case Study Box Plot
ANALYZE PHASE SUMMARYThe purpose of this phase is to start exploring all the possible root causes that can affectthe performance of your process and/or your product. However, by the end of this phase,there should be only a short list of critical factors that need to be improved in order tomeet the project goals. Graphical tools like the box plot, run chart, and histogram aregreat ways to develop a picture of your process’s performance; this helps you detectpatterns and potential outliers. Statistical tools like hypothesis testing can help ensurethat observed differences in the process are statistically valid (not just based on chance).Lean tools, on the other hand, in the Analyze phase help the team focus on the root

causes of service delays or inconsistencies by identifying non-value-adding activities andcalculating takt time (the required production drumbeat to meet customer demandconsistently).
This phase ends with the team members prioritizing their list of improvementopportunities and getting buy-in from the project champion and the process owners tomove into the Improve phase.
ANALYZE PHASE CHECKLIST Develop a graphical representation of data to detect patterns.
Define and calculate a z score or DPMO.
Identify a list of potential Xs.
Benchmark best-in-class operations to better refine the project goal.
Do statistical testing on population differences.
QUESTIONS TO ASK AT THE END OF THE ANALYZE PHASE1. What is the capability of the current process?
2. Is the process stable? Are your data normal?
3. Are the data discrete or continuous?
• What does the distribution look like?
• Has this helped you reduce the potential Xs?
4. Can you separate the vital few from the trivial many special causes?
5. What is the null hypothesis, and what is the alternate hypothesis? What is theconclusion of the analysis?
6. Do you have adequate resources to complete the project?
7. What are your next steps?
APPLICATION OF LEAN SIX SIGMA CASE STUDY—ANALYZE PHASEDELIVERABLES
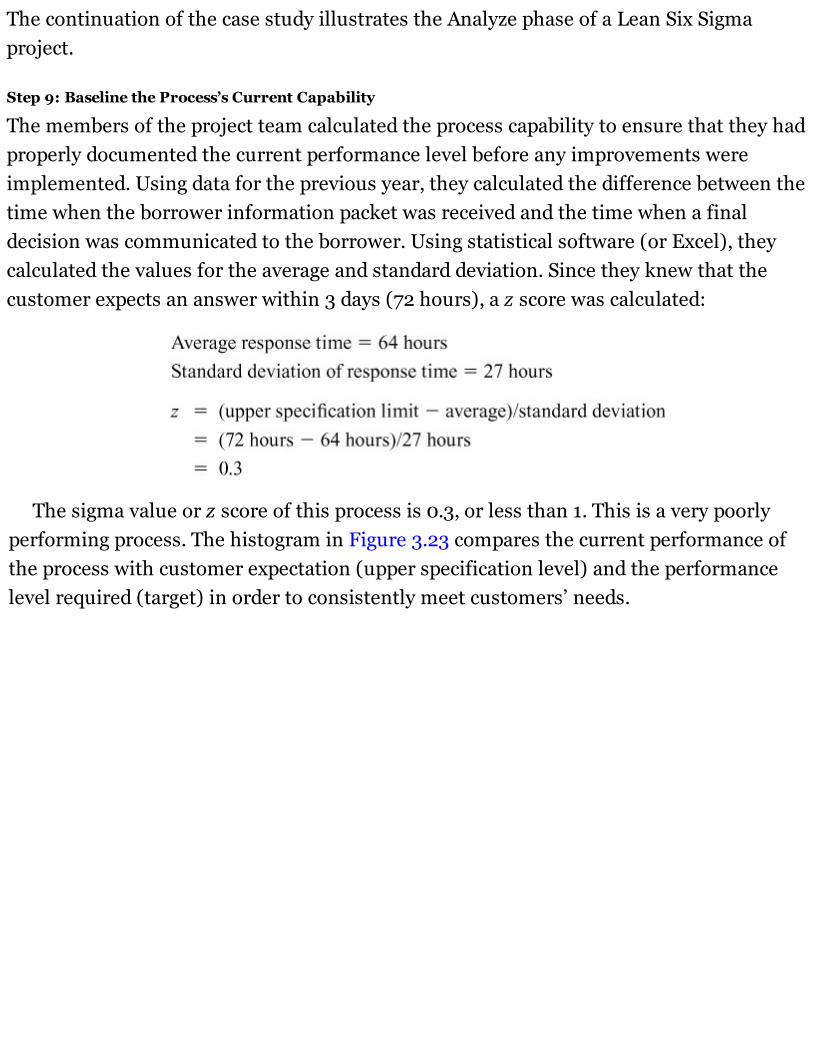
The continuation of the case study illustrates the Analyze phase of a Lean Six Sigmaproject.
Step 9: Baseline the Process’s Current Capability
The members of the project team calculated the process capability to ensure that they hadproperly documented the current performance level before any improvements wereimplemented. Using data for the previous year, they calculated the difference between thetime when the borrower information packet was received and the time when a finaldecision was communicated to the borrower. Using statistical software (or Excel), theycalculated the values for the average and standard deviation. Since they knew that thecustomer expects an answer within 3 days (72 hours), a z score was calculated:
The sigma value or z score of this process is 0.3, or less than 1. This is a very poorlyperforming process. The histogram in Figure 3.23 compares the current performance ofthe process with customer expectation (upper specification level) and the performancelevel required (target) in order to consistently meet customers’ needs.
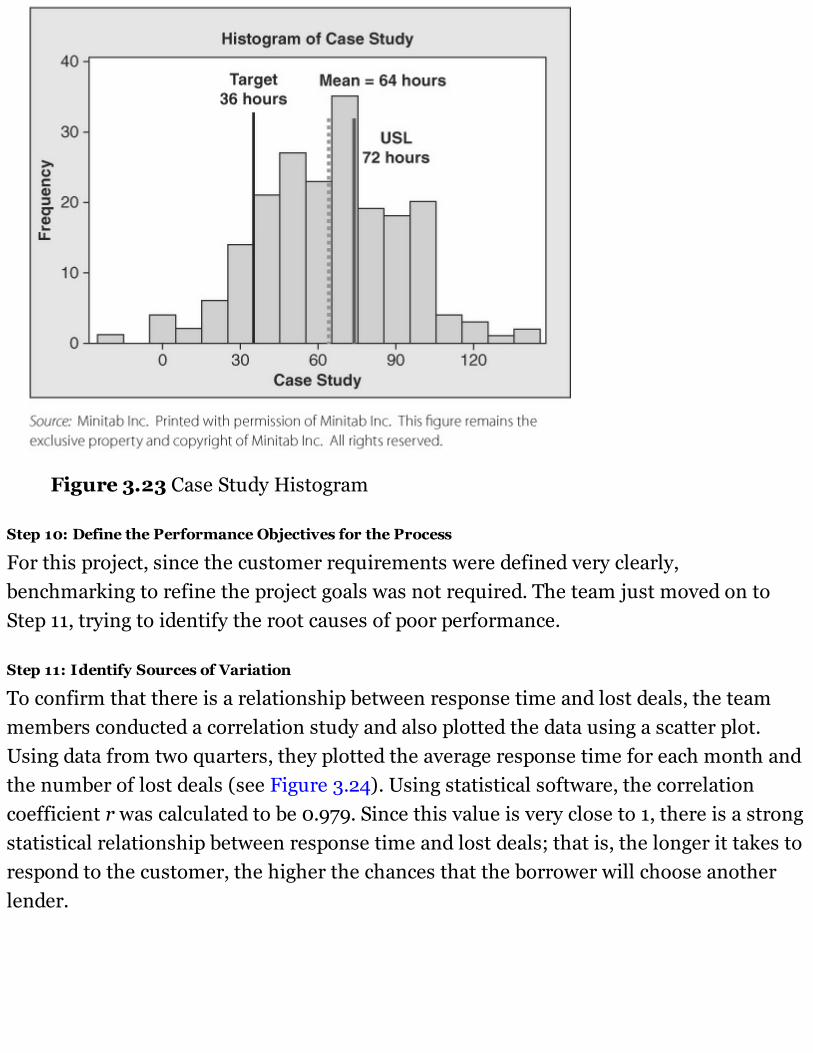
Figure 3.23 Case Study Histogram
Step 10: Define the Performance Objectives for the Process
For this project, since the customer requirements were defined very clearly,benchmarking to refine the project goals was not required. The team just moved on toStep 11, trying to identify the root causes of poor performance.
Step 11: Identify Sources of Variation
To confirm that there is a relationship between response time and lost deals, the teammembers conducted a correlation study and also plotted the data using a scatter plot.Using data from two quarters, they plotted the average response time for each month andthe number of lost deals (see Figure 3.24). Using statistical software, the correlationcoefficient r was calculated to be 0.979. Since this value is very close to 1, there is a strongstatistical relationship between response time and lost deals; that is, the longer it takes torespond to the customer, the higher the chances that the borrower will choose anotherlender.
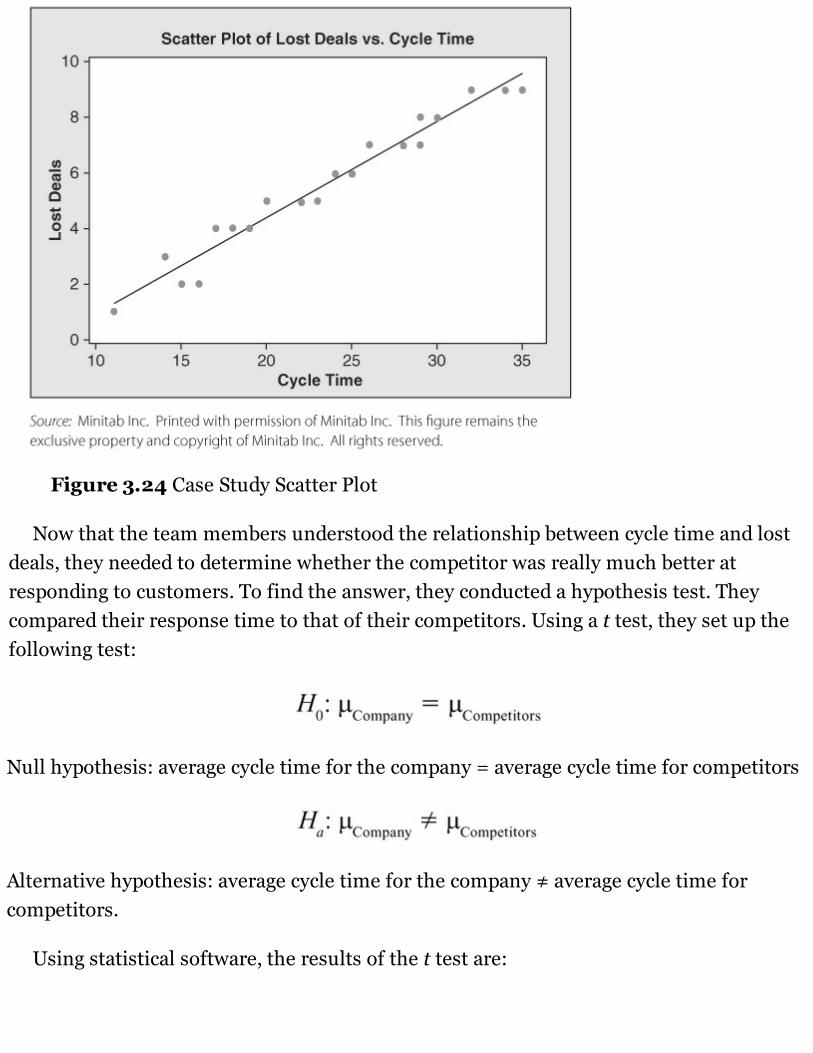
Figure 3.24 Case Study Scatter Plot
Now that the team members understood the relationship between cycle time and lostdeals, they needed to determine whether the competitor was really much better atresponding to customers. To find the answer, they conducted a hypothesis test. Theycompared their response time to that of their competitors. Using a t test, they set up thefollowing test:
Null hypothesis: average cycle time for the company = average cycle time for competitors
Alternative hypothesis: average cycle time for the company ≠ average cycle time forcompetitors.
Using statistical software, the results of the t test are:
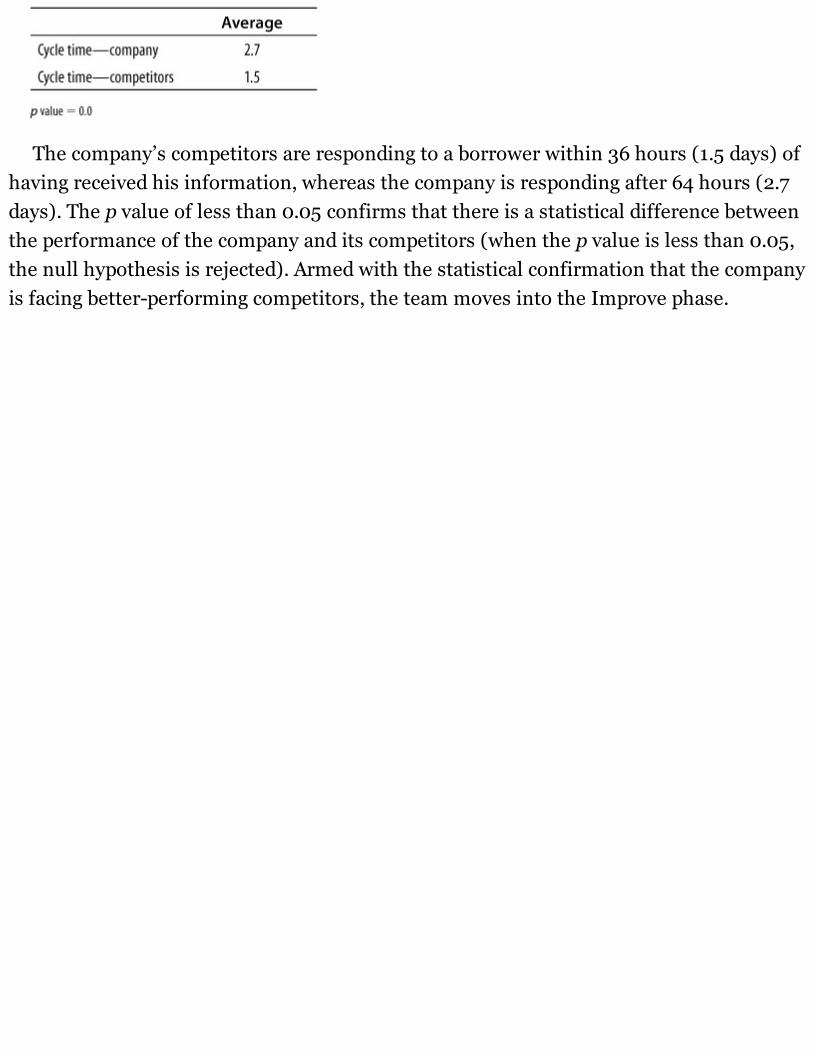
The company’s competitors are responding to a borrower within 36 hours (1.5 days) ofhaving received his information, whereas the company is responding after 64 hours (2.7days). The p value of less than 0.05 confirms that there is a statistical difference betweenthe performance of the company and its competitors (when the p value is less than 0.05,the null hypothesis is rejected). Armed with the statistical confirmation that the companyis facing better-performing competitors, the team moves into the Improve phase.

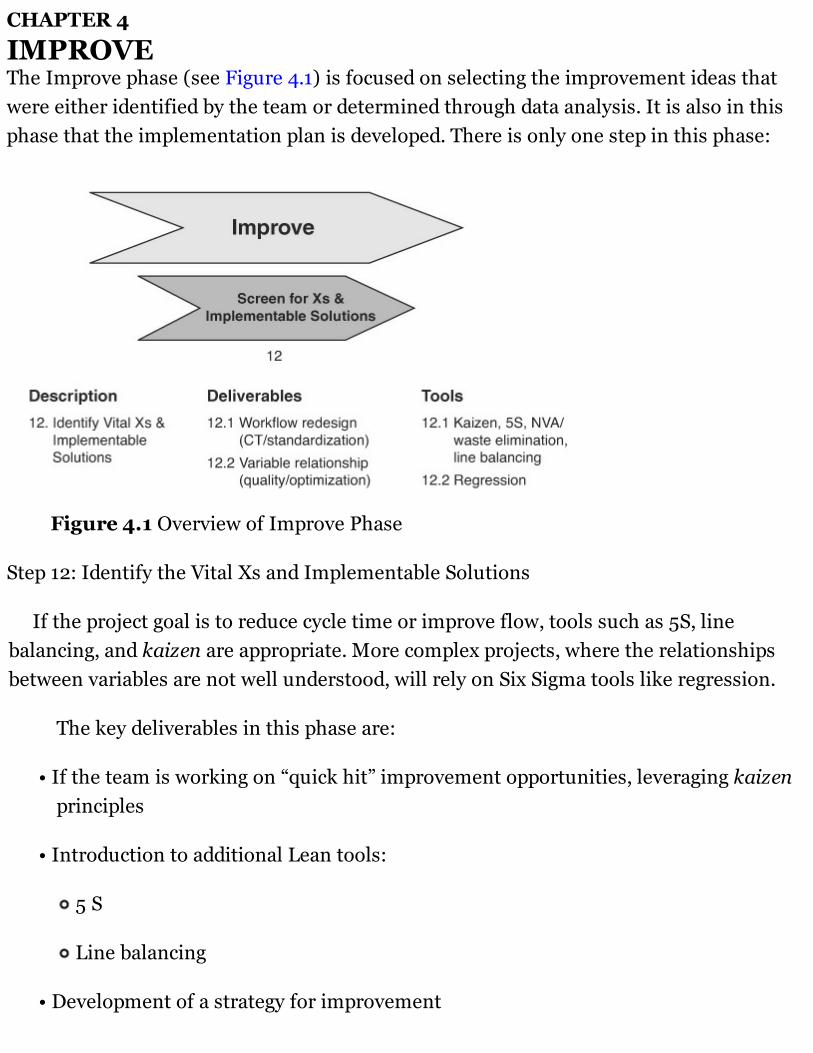
CHAPTER 4
IMPROVEThe Improve phase (see Figure 4.1) is focused on selecting the improvement ideas thatwere either identified by the team or determined through data analysis. It is also in thisphase that the implementation plan is developed. There is only one step in this phase:
Figure 4.1 Overview of Improve Phase
Step 12: Identify the Vital Xs and Implementable Solutions
If the project goal is to reduce cycle time or improve flow, tools such as 5S, linebalancing, and kaizen are appropriate. More complex projects, where the relationshipsbetween variables are not well understood, will rely on Six Sigma tools like regression.
The key deliverables in this phase are:
• If the team is working on “quick hit” improvement opportunities, leveraging kaizenprinciples
• Introduction to additional Lean tools:
5 S
Line balancing
• Development of a strategy for improvement
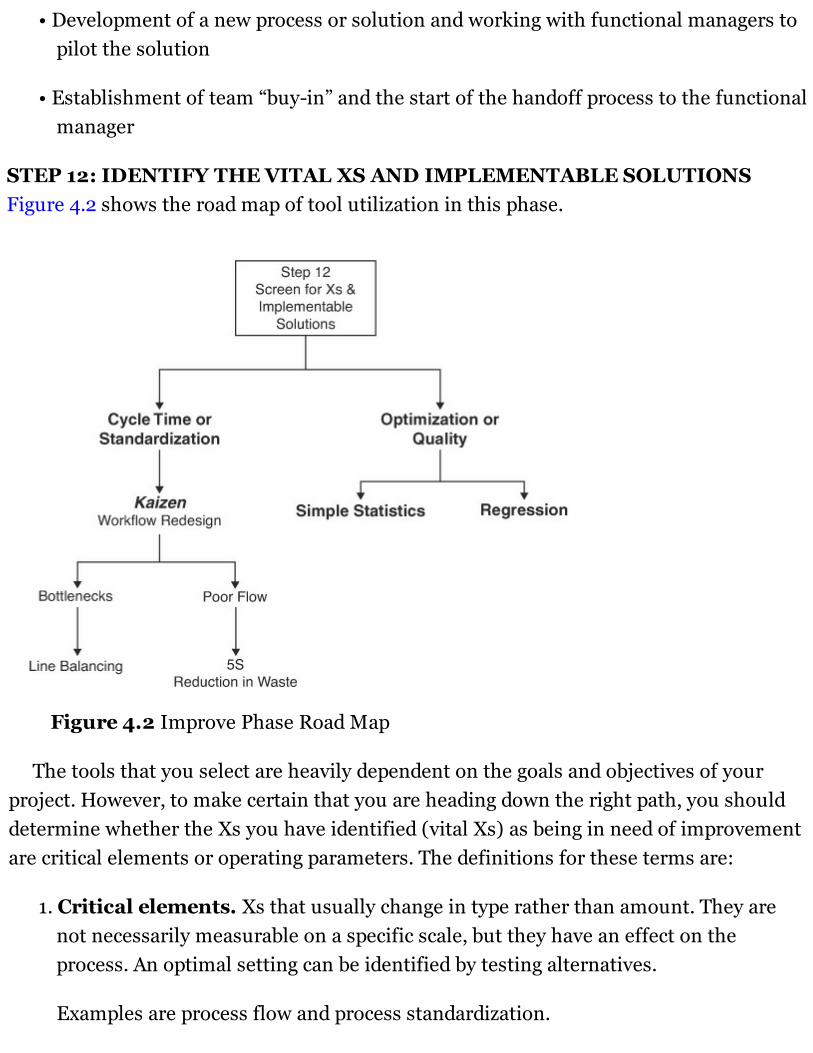
• Development of a new process or solution and working with functional managers topilot the solution
• Establishment of team “buy-in” and the start of the handoff process to the functionalmanager
STEP 12: IDENTIFY THE VITAL XS AND IMPLEMENTABLE SOLUTIONSFigure 4.2 shows the road map of tool utilization in this phase.
Figure 4.2 Improve Phase Road Map
The tools that you select are heavily dependent on the goals and objectives of yourproject. However, to make certain that you are heading down the right path, you shoulddetermine whether the Xs you have identified (vital Xs) as being in need of improvementare critical elements or operating parameters. The definitions for these terms are:
1. Critical elements. Xs that usually change in type rather than amount. They arenot necessarily measurable on a specific scale, but they have an effect on theprocess. An optimal setting can be identified by testing alternatives.
Examples are process flow and process standardization.
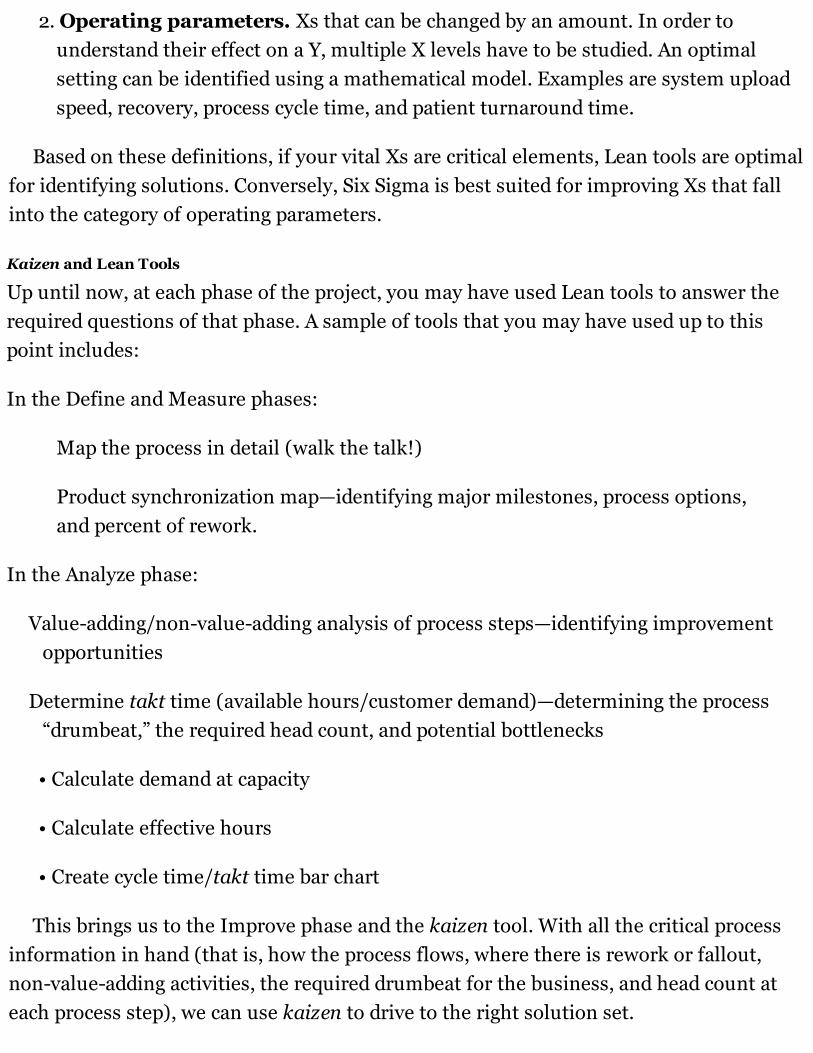
2. Operating parameters. Xs that can be changed by an amount. In order tounderstand their effect on a Y, multiple X levels have to be studied. An optimalsetting can be identified using a mathematical model. Examples are system uploadspeed, recovery, process cycle time, and patient turnaround time.
Based on these definitions, if your vital Xs are critical elements, Lean tools are optimalfor identifying solutions. Conversely, Six Sigma is best suited for improving Xs that fallinto the category of operating parameters.
Kaizen and Lean Tools
Up until now, at each phase of the project, you may have used Lean tools to answer therequired questions of that phase. A sample of tools that you may have used up to thispoint includes:
In the Define and Measure phases:
Map the process in detail (walk the talk!)
Product synchronization map—identifying major milestones, process options,and percent of rework.
In the Analyze phase:
Value-adding/non-value-adding analysis of process steps—identifying improvementopportunities
Determine takt time (available hours/customer demand)—determining the process“drumbeat,” the required head count, and potential bottlenecks
• Calculate demand at capacity
• Calculate effective hours
• Create cycle time/takt time bar chart
This brings us to the Improve phase and the kaizen tool. With all the critical processinformation in hand (that is, how the process flows, where there is rework or fallout,non-value-adding activities, the required drumbeat for the business, and head count ateach process step), we can use kaizen to drive to the right solution set.
What Is Kaizen?
Kaizen literally means change for the better. The word comes from the Japanesecharacters kai, “to take apart,” and zen, “to make good.” It is a process quality tool inwhich instances of waste are eliminated one by one, at minimal cost, by workers poolingtheir ideas and increasing efficiency in a timely manner. And most important, itsphilosophy is based on continuous improvement—you cannot get to the ideal solution inone step.
What Defines a Successful Kaizen Event?
Kaizen is focused on improving process flow and efficiency by eliminating waste.Ultimately, we are ensuring that the implemented improvements are sustained. The mainobjectives of a kaizen event are to:
• Enhance capacity
• Reduce non-value-adding activities or waste
• Increase productivity
• Reduce inventory
• Improve layout or flow
A quick way to assess whether any of the stated objectives have been successfully metis to ask the following questions at the end of the event:
1. Sort. Has the workflow been arranged and prioritized? For example, are the oldestdeals in the backlog being reviewed first?
2. Simplify. Have we prevented problems from occurring? For example, have weensured that all required data are available before work is passed to the next step?
3. Sweep. Has the work area been cleaned up? For example, are overdue or missingitems identified quickly?
4. Standardize. Have we defined tasks clearly? For example, is there a uniformunderstanding of what is a “clean” file that is ready to send to Audit?
5. Sustain. How have we ensured that the new habits developed will stay in place?
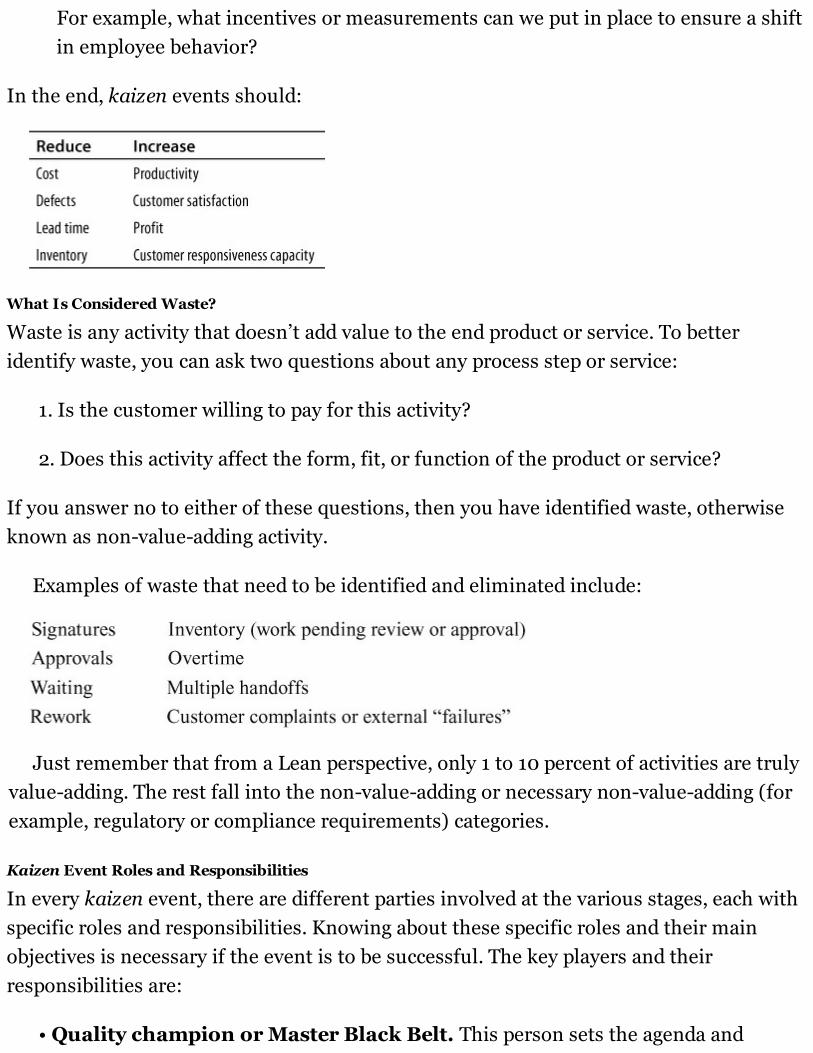
For example, what incentives or measurements can we put in place to ensure a shiftin employee behavior?
In the end, kaizen events should:
What Is Considered Waste?
Waste is any activity that doesn’t add value to the end product or service. To betteridentify waste, you can ask two questions about any process step or service:
1. Is the customer willing to pay for this activity?
2. Does this activity affect the form, fit, or function of the product or service?
If you answer no to either of these questions, then you have identified waste, otherwiseknown as non-value-adding activity.
Examples of waste that need to be identified and eliminated include:
Just remember that from a Lean perspective, only 1 to 10 percent of activities are trulyvalue-adding. The rest fall into the non-value-adding or necessary non-value-adding (forexample, regulatory or compliance requirements) categories.
Kaizen Event Roles and Responsibilities
In every kaizen event, there are different parties involved at the various stages, each withspecific roles and responsibilities. Knowing about these specific roles and their mainobjectives is necessary if the event is to be successful. The key players and theirresponsibilities are:
• Quality champion or Master Black Belt. This person sets the agenda and
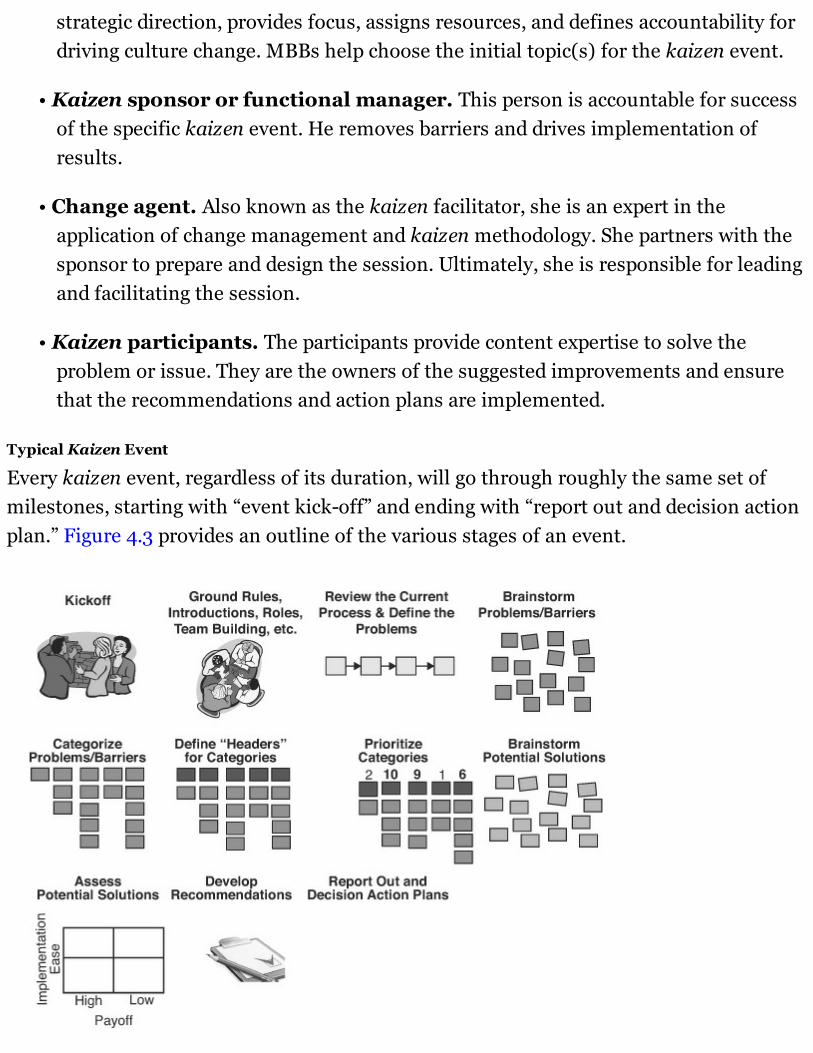
strategic direction, provides focus, assigns resources, and defines accountability fordriving culture change. MBBs help choose the initial topic(s) for the kaizen event.
• Kaizen sponsor or functional manager. This person is accountable for successof the specific kaizen event. He removes barriers and drives implementation ofresults.
• Change agent. Also known as the kaizen facilitator, she is an expert in theapplication of change management and kaizen methodology. She partners with thesponsor to prepare and design the session. Ultimately, she is responsible for leadingand facilitating the session.
• Kaizen participants. The participants provide content expertise to solve theproblem or issue. They are the owners of the suggested improvements and ensurethat the recommendations and action plans are implemented.
Typical Kaizen Event
Every kaizen event, regardless of its duration, will go through roughly the same set ofmilestones, starting with “event kick-off” and ending with “report out and decision actionplan.” Figure 4.3 provides an outline of the various stages of an event.
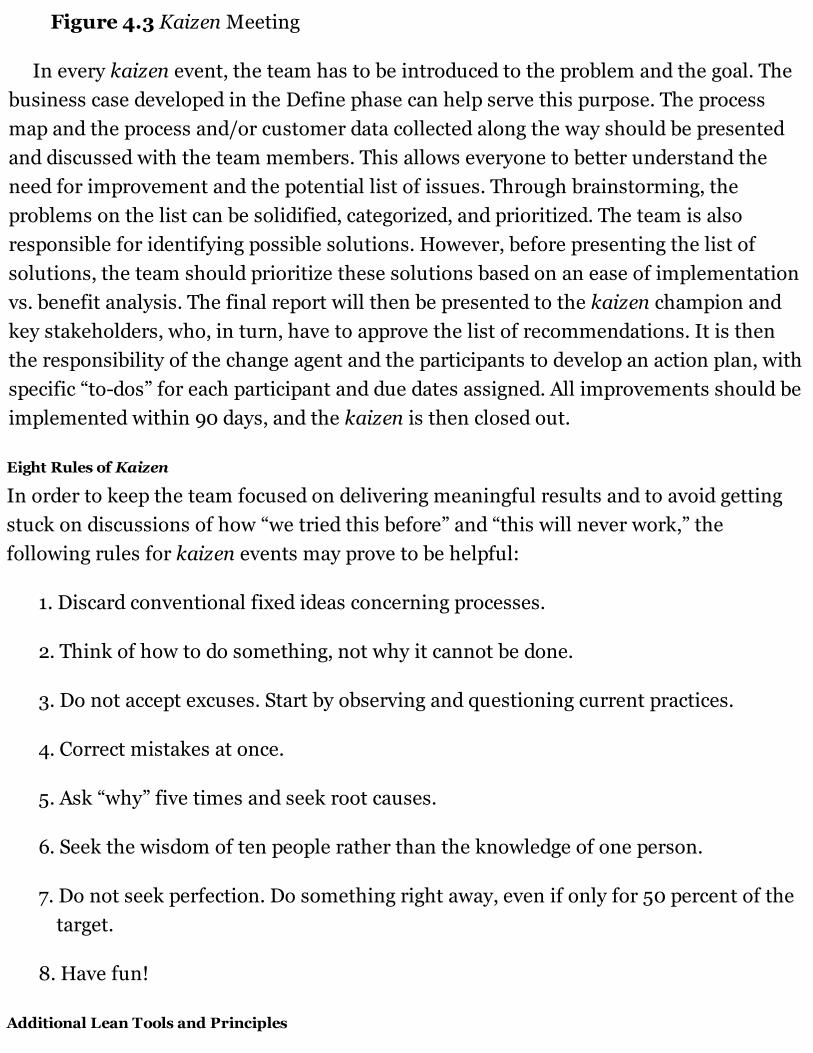
Figure 4.3 Kaizen Meeting
In every kaizen event, the team has to be introduced to the problem and the goal. Thebusiness case developed in the Define phase can help serve this purpose. The processmap and the process and/or customer data collected along the way should be presentedand discussed with the team members. This allows everyone to better understand theneed for improvement and the potential list of issues. Through brainstorming, theproblems on the list can be solidified, categorized, and prioritized. The team is alsoresponsible for identifying possible solutions. However, before presenting the list ofsolutions, the team should prioritize these solutions based on an ease of implementationvs. benefit analysis. The final report will then be presented to the kaizen champion andkey stakeholders, who, in turn, have to approve the list of recommendations. It is thenthe responsibility of the change agent and the participants to develop an action plan, withspecific “to-dos” for each participant and due dates assigned. All improvements should beimplemented within 90 days, and the kaizen is then closed out.
Eight Rules of Kaizen
In order to keep the team focused on delivering meaningful results and to avoid gettingstuck on discussions of how “we tried this before” and “this will never work,” thefollowing rules for kaizen events may prove to be helpful:
1. Discard conventional fixed ideas concerning processes.
2. Think of how to do something, not why it cannot be done.
3. Do not accept excuses. Start by observing and questioning current practices.
4. Correct mistakes at once.
5. Ask “why” five times and seek root causes.
6. Seek the wisdom of ten people rather than the knowledge of one person.
7. Do not seek perfection. Do something right away, even if only for 50 percent of thetarget.
8. Have fun!
Additional Lean Tools and Principles
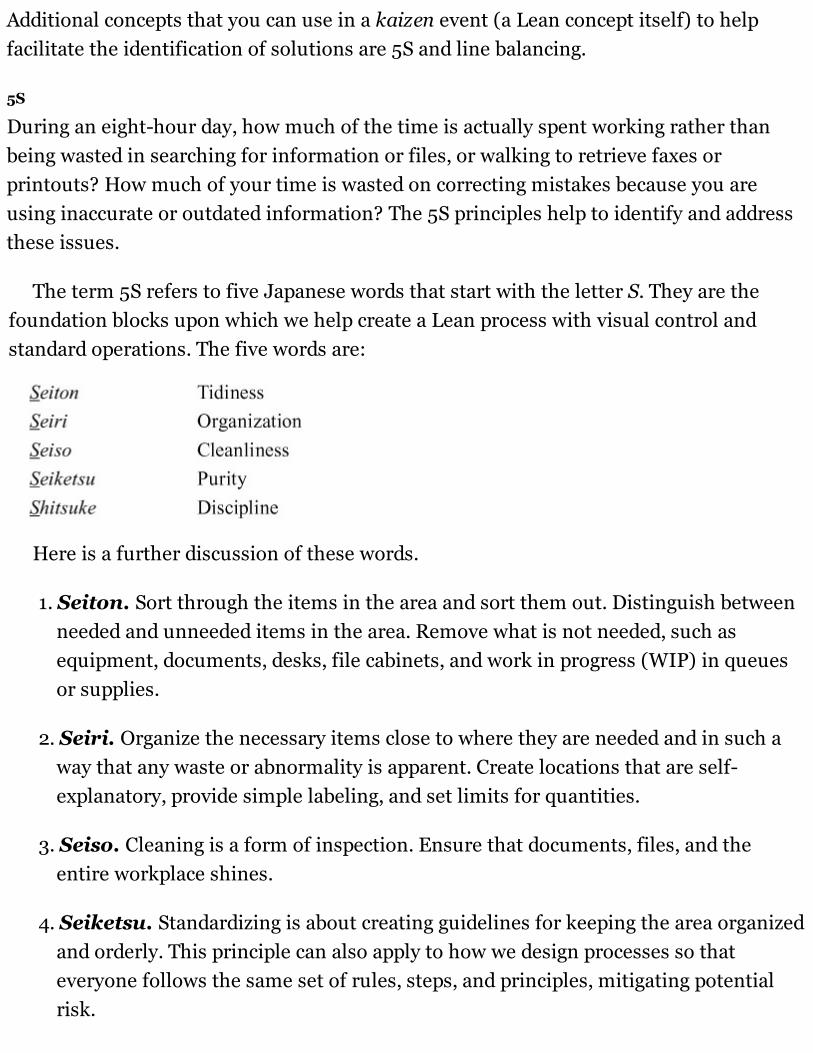
Additional concepts that you can use in a kaizen event (a Lean concept itself) to helpfacilitate the identification of solutions are 5S and line balancing.
5S
During an eight-hour day, how much of the time is actually spent working rather thanbeing wasted in searching for information or files, or walking to retrieve faxes orprintouts? How much of your time is wasted on correcting mistakes because you areusing inaccurate or outdated information? The 5S principles help to identify and addressthese issues.
The term 5S refers to five Japanese words that start with the letter S. They are thefoundation blocks upon which we help create a Lean process with visual control andstandard operations. The five words are:
Here is a further discussion of these words.
1. Seiton. Sort through the items in the area and sort them out. Distinguish betweenneeded and unneeded items in the area. Remove what is not needed, such asequipment, documents, desks, file cabinets, and work in progress (WIP) in queuesor supplies.
2. Seiri. Organize the necessary items close to where they are needed and in such away that any waste or abnormality is apparent. Create locations that are self-explanatory, provide simple labeling, and set limits for quantities.
3. Seiso. Cleaning is a form of inspection. Ensure that documents, files, and theentire workplace shines.
4. Seiketsu. Standardizing is about creating guidelines for keeping the area organizedand orderly. This principle can also apply to how we design processes so thateveryone follows the same set of rules, steps, and principles, mitigating potentialrisk.
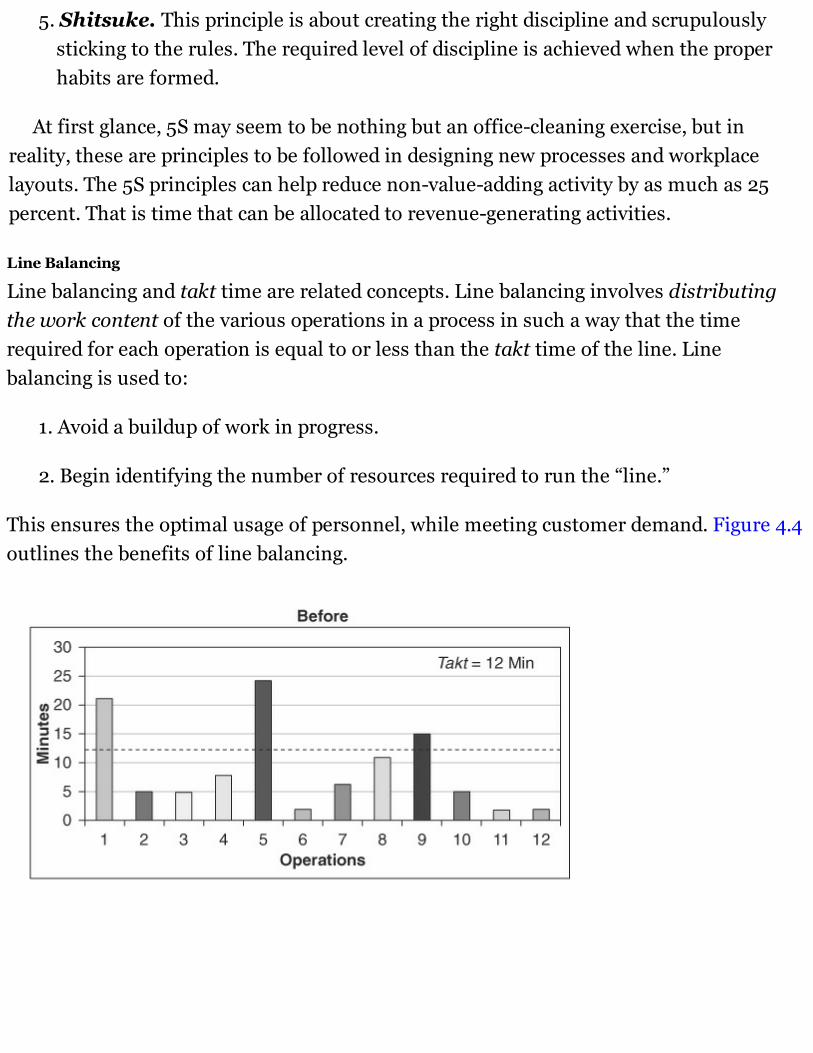
5. Shitsuke. This principle is about creating the right discipline and scrupulouslysticking to the rules. The required level of discipline is achieved when the properhabits are formed.
At first glance, 5S may seem to be nothing but an office-cleaning exercise, but inreality, these are principles to be followed in designing new processes and workplacelayouts. The 5S principles can help reduce non-value-adding activity by as much as 25percent. That is time that can be allocated to revenue-generating activities.
Line Balancing
Line balancing and takt time are related concepts. Line balancing involves distributingthe work content of the various operations in a process in such a way that the timerequired for each operation is equal to or less than the takt time of the line. Linebalancing is used to:
1. Avoid a buildup of work in progress.
2. Begin identifying the number of resources required to run the “line.”
This ensures the optimal usage of personnel, while meeting customer demand. Figure 4.4outlines the benefits of line balancing.
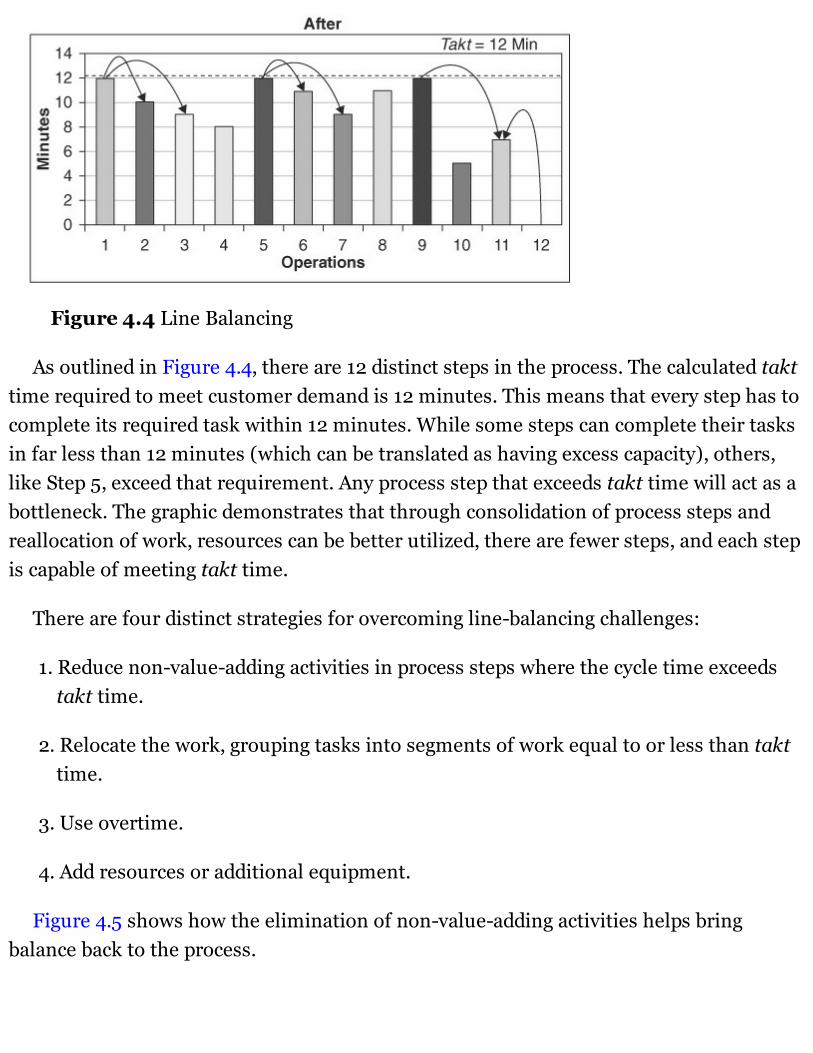
Figure 4.4 Line Balancing
As outlined in Figure 4.4, there are 12 distinct steps in the process. The calculated takttime required to meet customer demand is 12 minutes. This means that every step has tocomplete its required task within 12 minutes. While some steps can complete their tasksin far less than 12 minutes (which can be translated as having excess capacity), others,like Step 5, exceed that requirement. Any process step that exceeds takt time will act as abottleneck. The graphic demonstrates that through consolidation of process steps andreallocation of work, resources can be better utilized, there are fewer steps, and each stepis capable of meeting takt time.
There are four distinct strategies for overcoming line-balancing challenges:
1. Reduce non-value-adding activities in process steps where the cycle time exceedstakt time.
2. Relocate the work, grouping tasks into segments of work equal to or less than takttime.
3. Use overtime.
4. Add resources or additional equipment.
Figure 4.5 shows how the elimination of non-value-adding activities helps bringbalance back to the process.
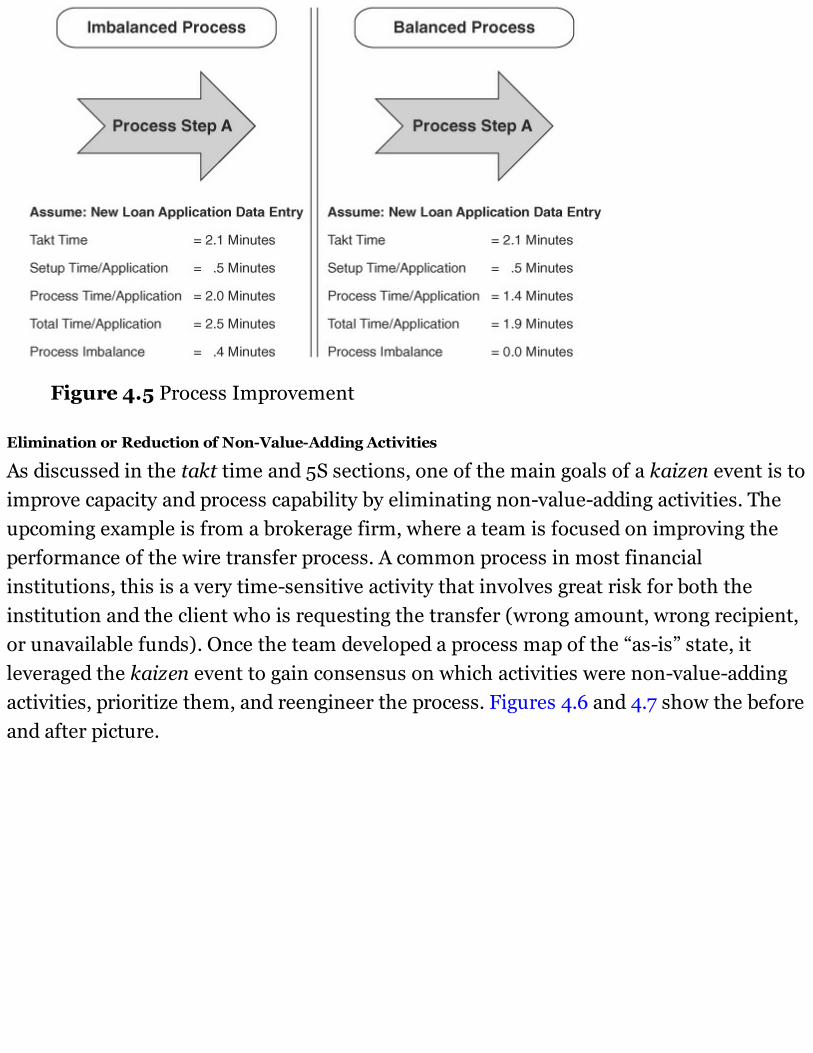
Figure 4.5 Process Improvement
Elimination or Reduction of Non-Value-Adding Activities
As discussed in the takt time and 5S sections, one of the main goals of a kaizen event is toimprove capacity and process capability by eliminating non-value-adding activities. Theupcoming example is from a brokerage firm, where a team is focused on improving theperformance of the wire transfer process. A common process in most financialinstitutions, this is a very time-sensitive activity that involves great risk for both theinstitution and the client who is requesting the transfer (wrong amount, wrong recipient,or unavailable funds). Once the team developed a process map of the “as-is” state, itleveraged the kaizen event to gain consensus on which activities were non-value-addingactivities, prioritize them, and reengineer the process. Figures 4.6 and 4.7 show the beforeand after picture.
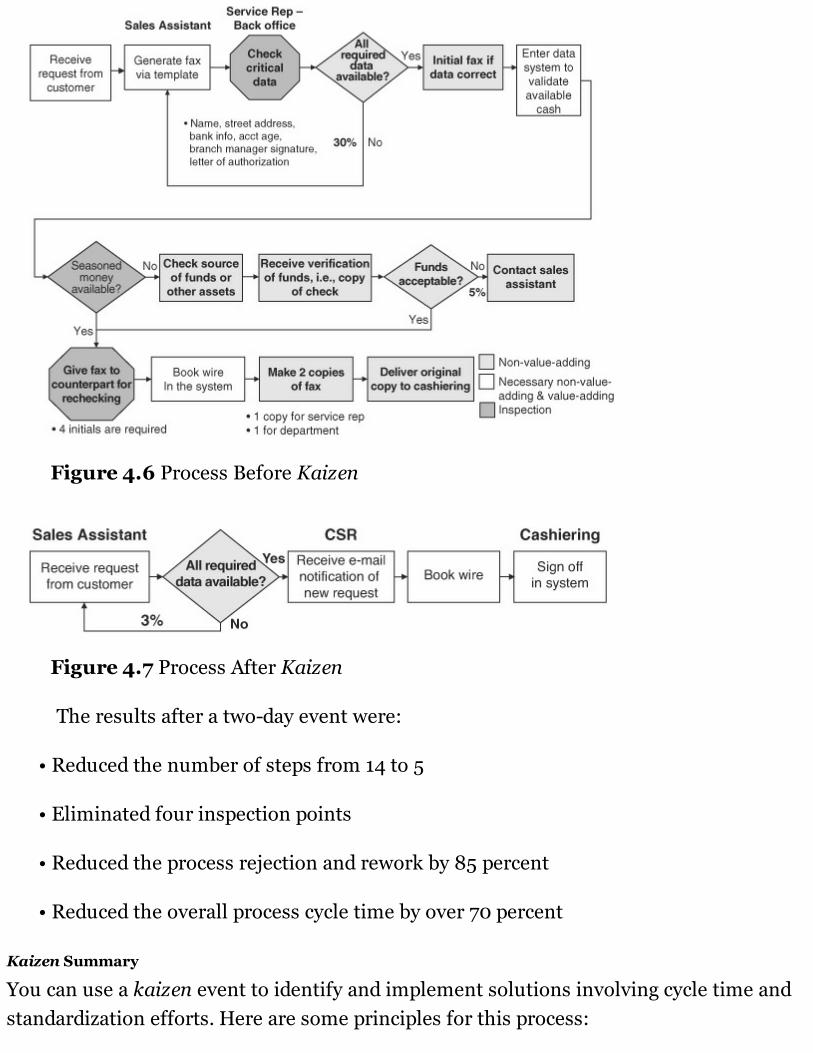
Figure 4.6 Process Before Kaizen
Figure 4.7 Process After Kaizen
The results after a two-day event were:
• Reduced the number of steps from 14 to 5
• Eliminated four inspection points
• Reduced the process rejection and rework by 85 percent
• Reduced the overall process cycle time by over 70 percent
Kaizen Summary
You can use a kaizen event to identify and implement solutions involving cycle time andstandardization efforts. Here are some principles for this process:
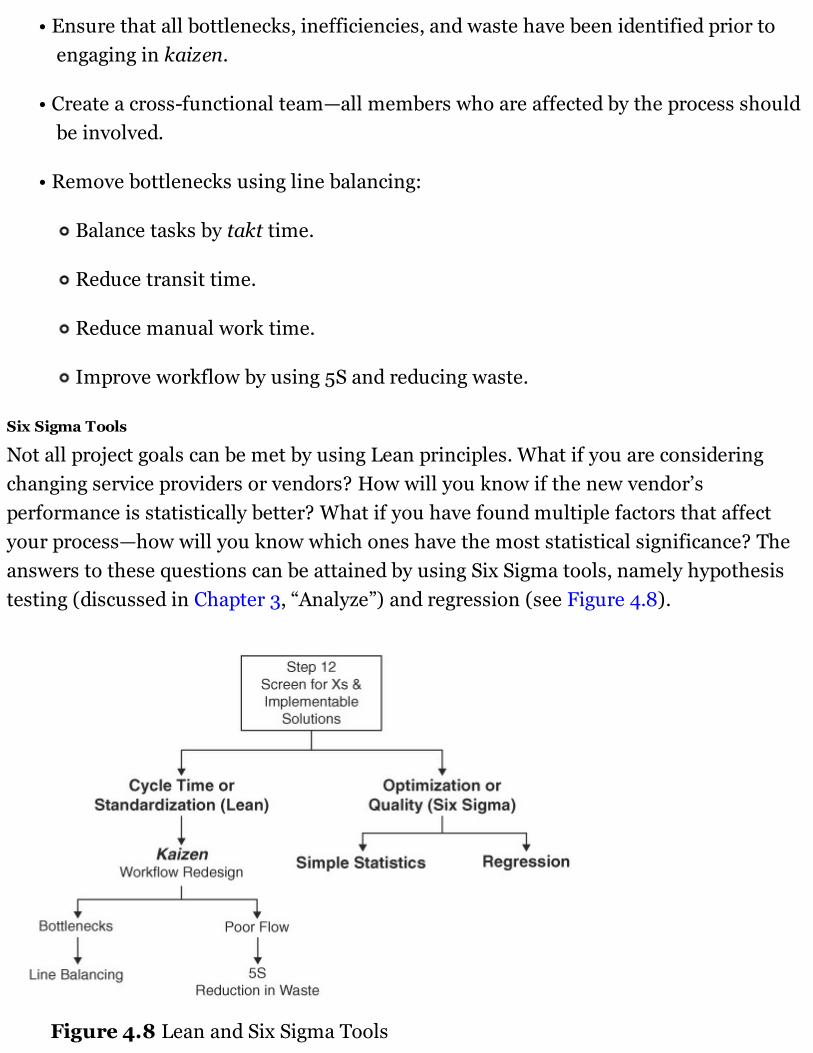
• Ensure that all bottlenecks, inefficiencies, and waste have been identified prior toengaging in kaizen.
• Create a cross-functional team—all members who are affected by the process shouldbe involved.
• Remove bottlenecks using line balancing:
Balance tasks by takt time.
Reduce transit time.
Reduce manual work time.
Improve workflow by using 5S and reducing waste.
Six Sigma Tools
Not all project goals can be met by using Lean principles. What if you are consideringchanging service providers or vendors? How will you know if the new vendor’sperformance is statistically better? What if you have found multiple factors that affectyour process—how will you know which ones have the most statistical significance? Theanswers to these questions can be attained by using Six Sigma tools, namely hypothesistesting (discussed in Chapter 3, “Analyze”) and regression (see Figure 4.8).
Figure 4.8 Lean and Six Sigma Tools
Simpler Statistics—Going Back to What We Know
While there are many statistical tools for the analysis and graphical display of data, theobjective of Six Sigma is to use whatever is appropriate to get the required answers. Andthis means that sometimes there are simpler principles that can yield the requiredfindings. The objective of all Green Belts and Black Belts is to keep it statistically simple(KISS). To demonstrate this point, a regional bank was considering switching itscheckbook issuance vendor. Based on historical performance, it knew that the time ofyear and the type of checkbook the client requested affected the delivery cycle time. Itasked the new vendor under consideration (Vendor B) to provide information on itsdelivery cycle time for a period of two years. Using hypothesis testing, the bank couldthen determine whether its existing vendor (Vendor A) was performing better than or thesame as the new vendor under consideration. Here is how the bank set up the test: for thenull hypothesis, it assumed that the average delivery cycle time was the same for bothvendors, and for the alternative hypothesis, it assumed that the cycle times of the twovendors were different.
Figure 4.9 shows the Minitab box plot and statistical analysis output from hypothesistesting.
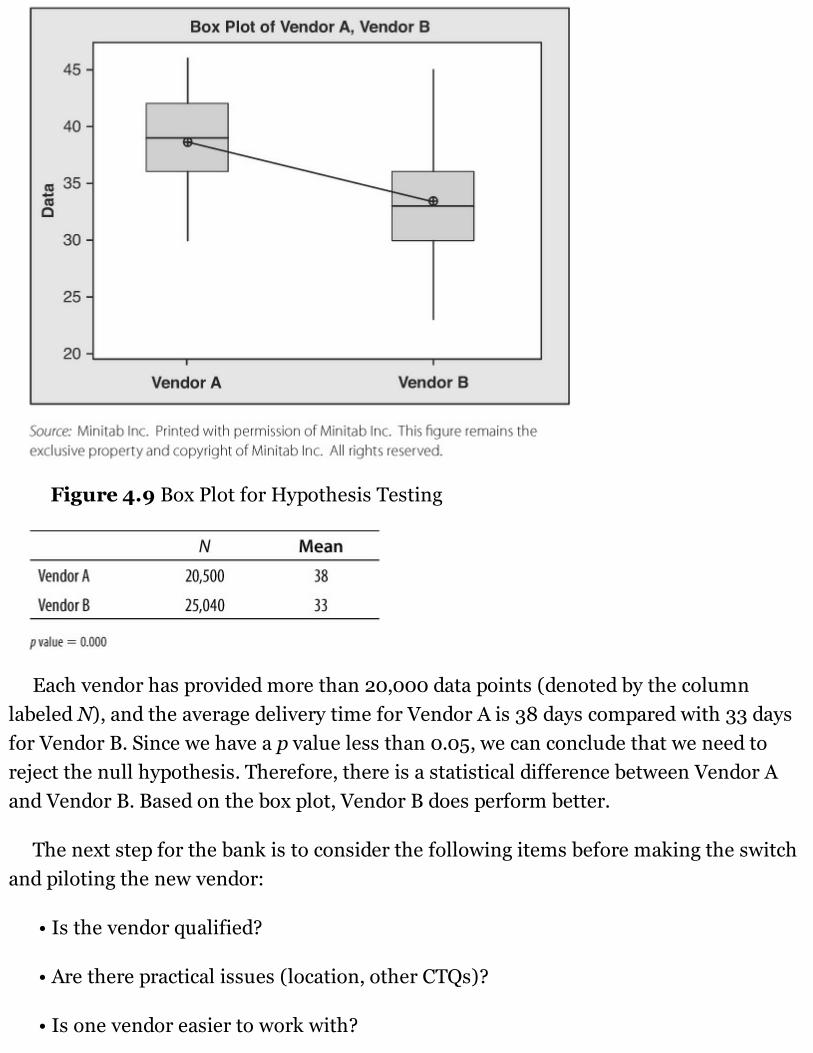
Figure 4.9 Box Plot for Hypothesis Testing
Each vendor has provided more than 20,000 data points (denoted by the columnlabeled N), and the average delivery time for Vendor A is 38 days compared with 33 daysfor Vendor B. Since we have a p value less than 0.05, we can conclude that we need toreject the null hypothesis. Therefore, there is a statistical difference between Vendor Aand Vendor B. Based on the box plot, Vendor B does perform better.
The next step for the bank is to consider the following items before making the switchand piloting the new vendor:
• Is the vendor qualified?
• Are there practical issues (location, other CTQs)?
• Is one vendor easier to work with?
• What will be the impact on other processes?
• What will be the impact on cost?
The use of hypothesis testing, a common yet powerful Six Sigma tool, provided theteam with critical information on whether to proceed with the project or abandon theidea of making the switch.
Introduction to the Idea of Piloting Solutions
A pilot involves testing a process improvement on a small scale in a real businessenvironment, whenever feasible. The objective of the pilot is to collect and analyze realprocess data in order to:
• Confirm that your proposed solution will achieve the targeted performance (such asincreasing production or reducing defects).
• Identify any potential implementation problems (technology, training, and so on)prior to full-scale implementation.
If piloting the improvement is an option, then the team needs to define what a realisticenvironment looks like. The team needs to ensure that the conditions of the pilot reflectthe true business conditions. That is, the new improvement should really experience allthe possible process variations (region, shift, request type, or product type). A sample listof questions to consider when setting up a pilot is:
1. Should the pilot be conducted in one region or many? If many, should the pilots inthe different regions be done simultaneously or one by one?
2. How long should the pilot go on?
3. Should weekends, holidays, and/or peak periods be included?
4. Who should participate? Should it be the best, worst, or average workers?
5. Which product types should be included?
6. How will the process data be collected?
If a pilot is done correctly, the benefits that will be attained include:
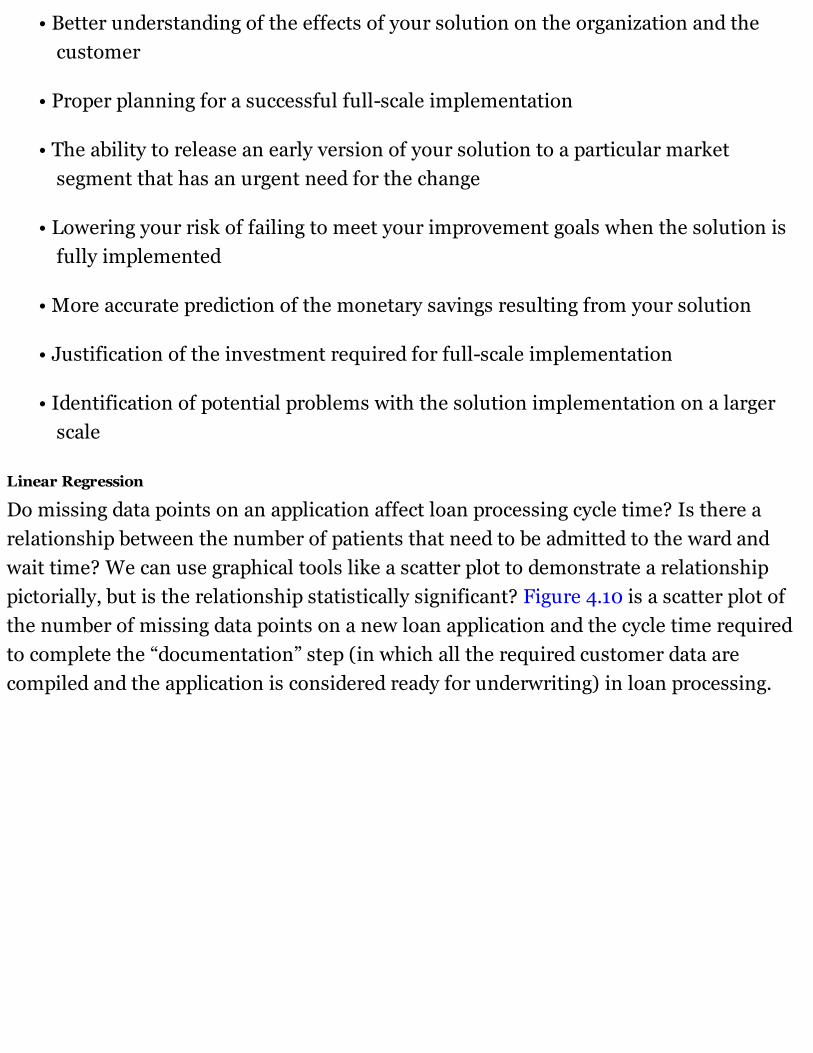
• Better understanding of the effects of your solution on the organization and thecustomer
• Proper planning for a successful full-scale implementation
• The ability to release an early version of your solution to a particular marketsegment that has an urgent need for the change
• Lowering your risk of failing to meet your improvement goals when the solution isfully implemented
• More accurate prediction of the monetary savings resulting from your solution
• Justification of the investment required for full-scale implementation
• Identification of potential problems with the solution implementation on a largerscale
Linear Regression
Do missing data points on an application affect loan processing cycle time? Is there arelationship between the number of patients that need to be admitted to the ward andwait time? We can use graphical tools like a scatter plot to demonstrate a relationshippictorially, but is the relationship statistically significant? Figure 4.10 is a scatter plot ofthe number of missing data points on a new loan application and the cycle time requiredto complete the “documentation” step (in which all the required customer data arecompiled and the application is considered ready for underwriting) in loan processing.
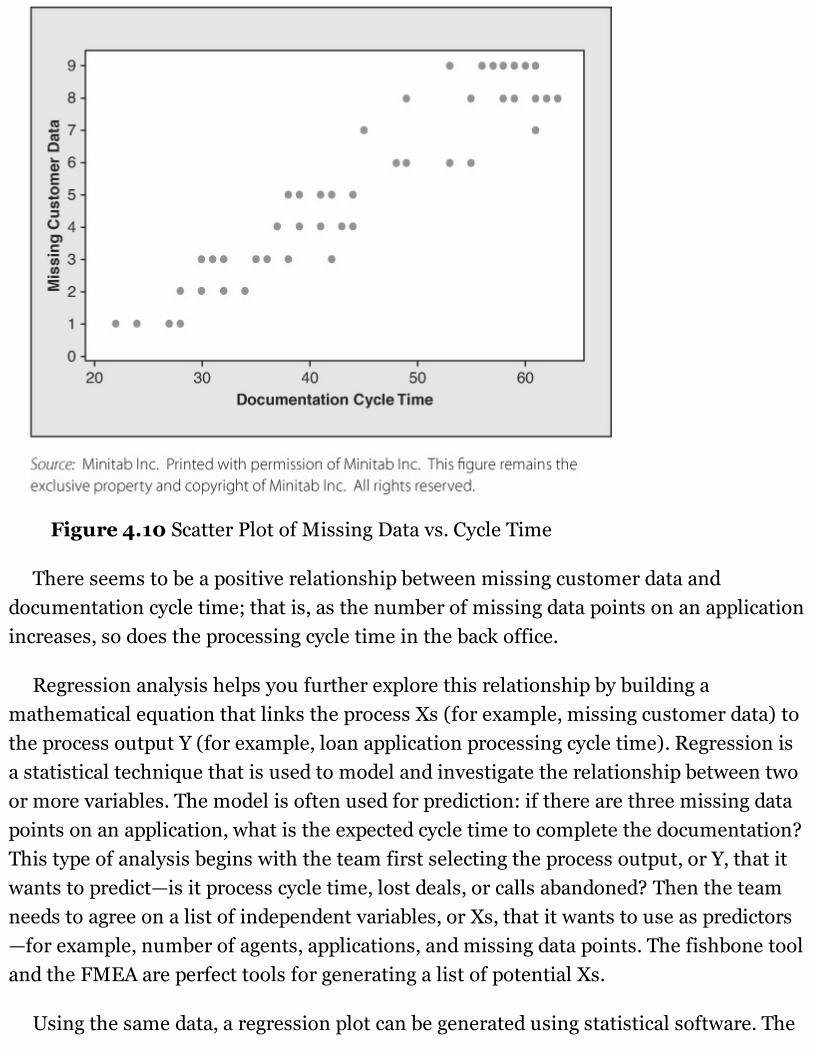
Figure 4.10 Scatter Plot of Missing Data vs. Cycle Time
There seems to be a positive relationship between missing customer data anddocumentation cycle time; that is, as the number of missing data points on an applicationincreases, so does the processing cycle time in the back office.
Regression analysis helps you further explore this relationship by building amathematical equation that links the process Xs (for example, missing customer data) tothe process output Y (for example, loan application processing cycle time). Regression isa statistical technique that is used to model and investigate the relationship between twoor more variables. The model is often used for prediction: if there are three missing datapoints on an application, what is the expected cycle time to complete the documentation?This type of analysis begins with the team first selecting the process output, or Y, that itwants to predict—is it process cycle time, lost deals, or calls abandoned? Then the teamneeds to agree on a list of independent variables, or Xs, that it wants to use as predictors—for example, number of agents, applications, and missing data points. The fishbone tooland the FMEA are perfect tools for generating a list of potential Xs.
Using the same data, a regression plot can be generated using statistical software. The
regression plot in Figure 4.11 has two key outputs:
Figure 4.11 Regression Plot
• A mathematical equation linking documentation cycle time (our process output, Y)to missing data points (process input, X)
• R2 value
The closer the R2 value is to 100 percent, the better the prediction capability of theequation. In statistical terms, it is the fraction of the variation in the output variable thatis explained by the equation. So in this case, 89 percent of the variation that we see in thedocumentation cycle time can be attributed to missing data in the application; the other11 percent is affected by other variables—errors in data collection, volume of applicationson the days when the data were collected, the field rep filling out the application, and soon.
So how do we use this equation? Assume that we have a documentation cycle timetarget of 40 minutes. We can now determine the maximum number of missing data
points that an application can have and still meet the cycle time requirements.
Therefore, any application that is submitted with more than four missing data pointshas a high probability of missing the 40-minute processing cycle time.
What if there appears to be no relationship between your Y and X—that is, the R2
value is very low?
That would mean that, practically speaking, the X does not influence or change your Y.More process data may not necessarily result in a relationship. Some things to considerbefore you abandon your data are:
• Review your data with a process expert to make sure that they make sense.
• Review your process map in conjunction with your data collection plan. Are yourdata hiding multiple processes, such as collecting data from multiple teams,products, or regions? When the data were being collected, combining these effectsmay not have seemed critical, but perhaps the lack of correlation between X and Yindicates that these effects do heavily influence the process output. As an example,if the teams work differently, or if products are sold via different channels, theoutputs may be different (for example, process cycle time between teams orchannels will be different), and that can affect the results of your regression. Incases where the data may reflect multiple processes, each of these processes needsto be examined individually.
IMPROVE PHASE SUMMARYAt the start of the Improve phase, the team has a good list of Xs and/or process steps thatare in need of improvement. Depending on the project goals and the complexity of therequired solutions, the team will have to choose between the Lean and Six Sigma toolkits. Kaizen events, in combination with 5S; VA, NVA, NNVA; and line-balancingprinciples, are reserved for improving process flow and speed, whereas regression andsimpler statistical tools discussed in the Analyze phase (hypothesis testing) are used toensure that we are fixing the appropriate Xs by the right amount. Either path should yieldsignificant improvements that can be measured and quantified. Moving to the next phase,Control, is an indication that appropriate gains have been attained, and that the team’s
focus is now centered on ensuring the sustainability of those gains.
IMPROVE PHASE CHECKLIST Define a short list of Xs.
Ensure that all your Xs are really controllable and that you don’t have any Ys in thelist.
Establish your improvement approach—regression, simple statistics, or kaizen.
If you are pursuing a kaizen event, you have the necessary support to implementthe suggested improvements.
The R2 value attained in regression has an acceptable level of predictability.
Have a final and short list of vital Xs.
QUESTIONS TO ASK AT THE END OF THE IMPROVE PHASE1. What vital Xs have you uncovered?
2. Were you able to resolve your process challenges with a kaizen event? Will moresuch events be needed?
3. How sure are you of your results? Did anything surprise you?
APPLICATION OF LEAN SIX SIGMA CASE STUDY—IMPROVE PHASEDELIVERABLESThe continuation of the case study illustrates the Improve phase of a Lean Six Sigmaproject.
Step 12: Identify the Vital Xs and Implementable Solutions
In the Measure phase, using a fishbone, the team agreed that the manual data entryprocess had the largest impact on the overall process cycle time. In the Improve phase,the team had to understand why. Using the same tool, the fishbone, the team conductedanother brainstorming session, and the results pointed to one central reason: missingcritical information. As outlined in the fishbone diagram in Figure 4.12, some of the mainreasons for missing critical customer information were:
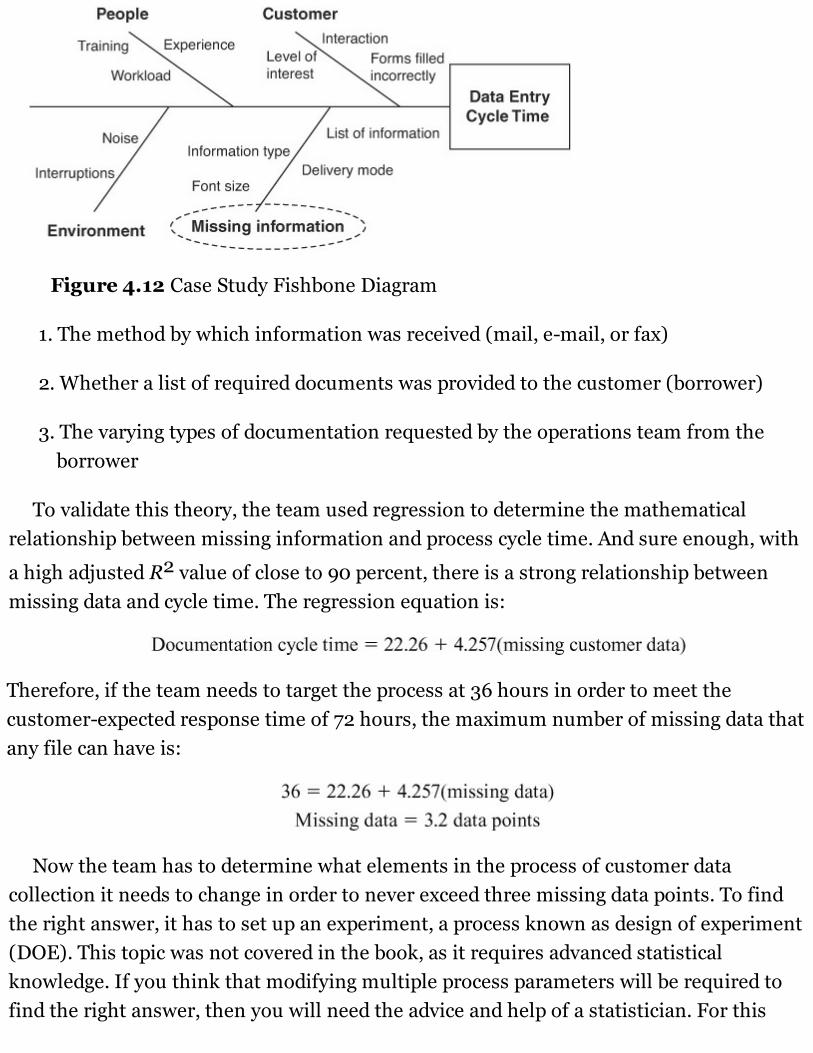
Figure 4.12 Case Study Fishbone Diagram
1. The method by which information was received (mail, e-mail, or fax)
2. Whether a list of required documents was provided to the customer (borrower)
3. The varying types of documentation requested by the operations team from theborrower
To validate this theory, the team used regression to determine the mathematicalrelationship between missing information and process cycle time. And sure enough, with
a high adjusted R2 value of close to 90 percent, there is a strong relationship betweenmissing data and cycle time. The regression equation is:
Therefore, if the team needs to target the process at 36 hours in order to meet thecustomer-expected response time of 72 hours, the maximum number of missing data thatany file can have is:
Now the team has to determine what elements in the process of customer datacollection it needs to change in order to never exceed three missing data points. To findthe right answer, it has to set up an experiment, a process known as design of experiment(DOE). This topic was not covered in the book, as it requires advanced statisticalknowledge. If you think that modifying multiple process parameters will be required tofind the right answer, then you will need the advice and help of a statistician. For this
case study, the team knew that the critical drivers of missing data were:
1. The method by which information was received (e-mail vs. mail)
2. Whether or not a list of required items was provided to the borrower
3. Whether the company had asked for one or two years of financial data
The team set up an experiment in which one, two, or all three variables were changedand the documentation cycle time was measured. The objective was to test the processunder all possible conditions. The results of the experiment were studied using statisticalsoftware. The team concluded that the process cycle time was significantly reduced whena list of required items was provided to the borrower and she was asked to e-mail allinformation. Asking for one vs. two years of financial information had minimal impact onoverall cycle time.
The team must now pilot these solutions to confirm the results of the experiment anddevelop control plans for long-term sustainability.


CHAPTER 5
CONTROLThe last phase of Lean Six Sigma is Control (see Figure 5.1). This phase focuses onsuccessfully passing the project to a functional owner and ensuring long-termsustainability of the improvements. There are three steps in the Control phase:
Figure 5.1 Overview of Control Phase
Step 13: Validate measurement system analysis on the Xs.
Step 14: Determine the process capability.
Step 15: Implement process control.
The main deliverables in this phase are:
• Assurance that the measurement system is adequate to detect differences in theperformance of critical Xs
• Determination of whether project goals have been attained
• Development and implementation of control plans, ensuring that the process staysin control
• Introduction of the different types of control charts
• Knowledge of when to close out your project
STEP 13: VALIDATE MEASUREMENT SYSTEM ANALYSIS ON THE XSTo arrive at the deliverables in Steps 13 and 14, we can rely on tools that were discussed inthe Measure and Analyze phases. Step 13 is about ensuring that we have an adequate andreliable way of measuring the critical Xs of the process. In the Improve phase, wediscovered the critical elements that affect our process performance, that is, critical Xs.We also discovered the critical limits for each X if we wanted the process to perform in aspecific way—for example, to get a loan approved within five days, we need the completeset of borrower’s information by the second day; anything beyond that will would causeus to miss our five-day commitment. Or to keep patient wait time at 15 minutes, we needat least two triage nurses available at all times. And so the team needs to determine howto:
1. Actively track and measure these numbers
2. Ensure that the method by which Xs are been measured is reliable and accurate
This brings us back to the measurement system analysis discussed in the Measurephase. The team can leverage the same principles used to ensure that the measurementsystem was valid for the process output (Y) and ensure that the system is also adequatefor X.
STEP 14: DETERMINE THE PROCESS CAPABILITYAs for Step 14, before we implement the control plans, we first need to ensure that wehave actually achieved our goals. To do this, we need to statistically confirm ourimprovements:
1. Calculate the post improvement performance capability, using the techniquedescribed in Step 9.
2. Confirm that the improvement goal established in Step 2 has affected the Y.
3. If it has not, go back to Step 11 to look for additional sources of variation.
STEP 15: IMPLEMENT PROCESS CONTROLWhen we have completed Steps 13 and 14, we can start to develop the required controlplans.

What Is a Process Control System?
A process control system is a strategy for maintaining the improved process performanceover time. It outlines the specific actions and tools required for sustaining processimprovements or gains. There are several ways to develop a control system:
• Risk management
• Poka-yoke—mistake-proofing devices
• Statistical process control (SPC)
• Data collection plans
• Ongoing measurements
• Audit plans
• Process documentation
• Process ownership
A process control system is critical for all projects because it helps to:
• Define the actions, resources, and responsibilities required to make sure that theproblem remains corrected and that the benefits from the solution continue to berealized.
• Provide the methods and tools needed to maintain the process improvement,independent of the current team.
• Ensure that the improvements made have been documented (this is often necessaryto meet regulatory requirements).
• Ease full-scale implementation by promoting a common understanding of theprocess and planned improvements.
While there are several ways to develop a process control system, we will discuss thethree most common methods (see Figure 5.2).

Figure 5.2 Three Categories of Control Mechanisms
What Is a Quality Plan?
A quality plan is a documented plan whose purpose is to ensure that each product orservice characteristic or process requirement stays in conformance. Examples of thesedocumented plans include the final state process map, checklists, or the newlydocumented standard operating procedures. Ideally, a quality plan should include:
1. Process standards, such as procedures to follow, specifications, or operatingtolerances.
2. A description of the process flow and documentation of roles and responsibilities—aflowchart is very useful.
3. A description of the new standard operating procedures (SOPs). SOPs have to bevery specific, telling the employees precisely what actions to take and when andwhere to take them. The descriptions need to be at a level such that the job can beperformed well by a person who is not fully trained. And finally, they need todescribe how to prevent process variation.
4. Process controls, that is, items to be monitored or audited, and the correspondingresponse planning if the process should deviate.
What Is Mistake-Proofing?
Mistake-proofing, also known as the Lean tool poka-yoke, is a technique for eliminatingerrors by making it impossible for mistakes to occur. When you are applying the conceptof mistake-proofing in developing a control plan, it is important to remember its guidingprinciples:
• Respect the intelligence of employees (mistakes are the fault of processes, notpeople).
• Eliminate high-volume repetitive tasks or actions that require employees toconstantly be alert.
• Free employees’ time and mind to pursue more creative and value-adding activities.
• It is not acceptable to produce even a small number of defects or defective products.
• The objective is zero defects.
If we understand the root cause of errors, we can better define solutions. Generally themain drivers of errors are:
• Incorrect procedures or operational definitions
• Excessive variation in the process or its inputs
• Inaccurate measuring devices
• Human error
Examples of things in our everyday lives that have been mistake-proofed include:
• Irons that shut off automatically
• ATM stations that accept debit cards only if they are inserted correctly
• Cars that stop automatically if a seatbelt is not worn
How Is Mistake-Proofing Different from Traditional Inspection Processes?
Many organizations have dedicated people or use portions of people’s time to reviewother employees’ work or to audit the end product or service for quality control on aregular basis. In these organizations, errors are caught after human labor and cost have
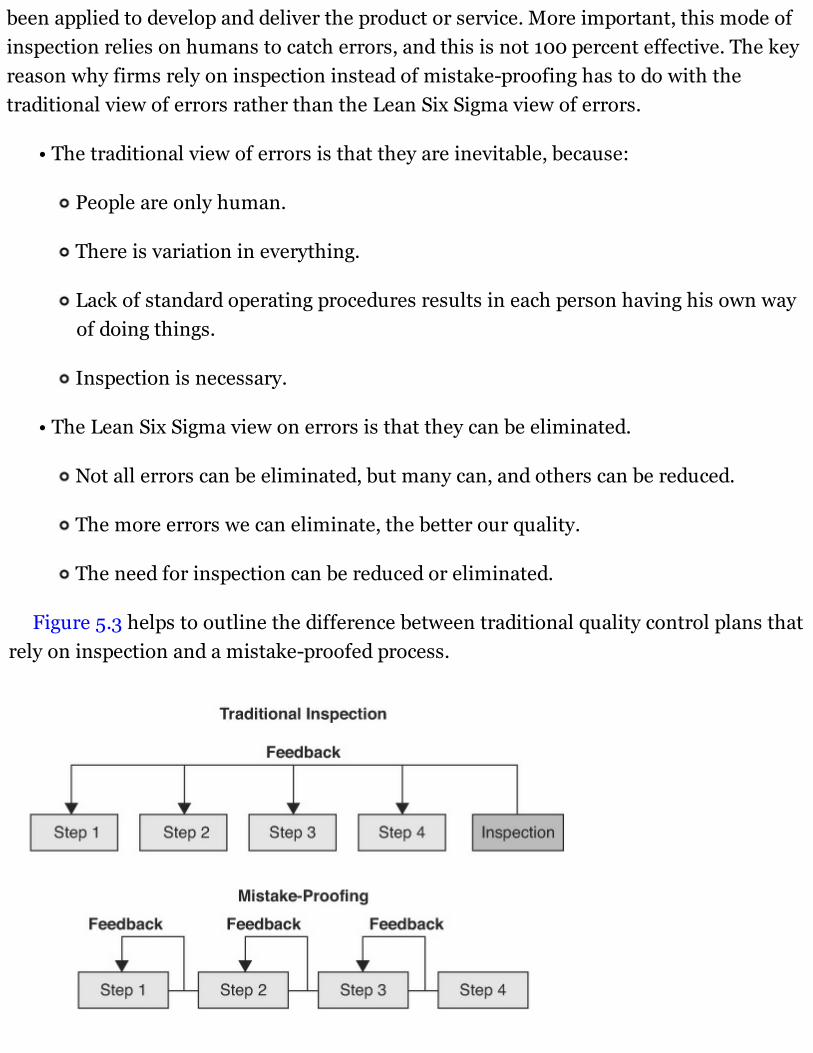
been applied to develop and deliver the product or service. More important, this mode ofinspection relies on humans to catch errors, and this is not 100 percent effective. The keyreason why firms rely on inspection instead of mistake-proofing has to do with thetraditional view of errors rather than the Lean Six Sigma view of errors.
• The traditional view of errors is that they are inevitable, because:
People are only human.
There is variation in everything.
Lack of standard operating procedures results in each person having his own wayof doing things.
Inspection is necessary.
• The Lean Six Sigma view on errors is that they can be eliminated.
Not all errors can be eliminated, but many can, and others can be reduced.
The more errors we can eliminate, the better our quality.
The need for inspection can be reduced or eliminated.
Figure 5.3 helps to outline the difference between traditional quality control plans thatrely on inspection and a mistake-proofed process.
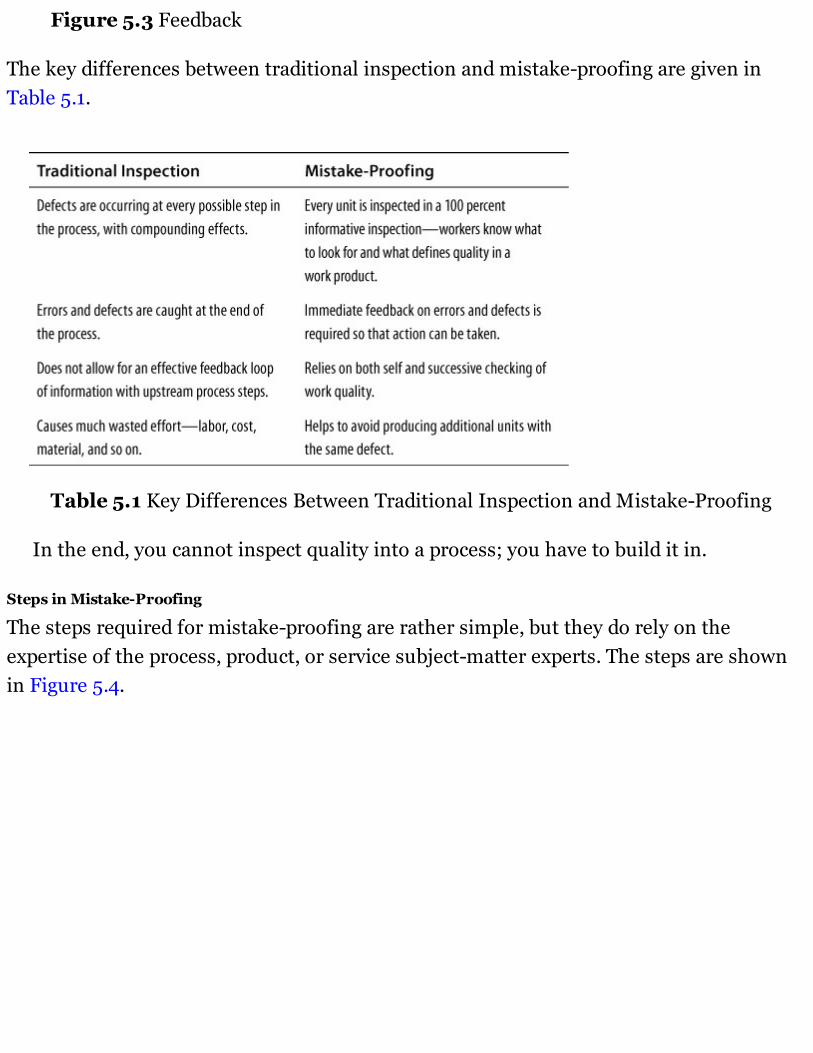
Figure 5.3 Feedback
The key differences between traditional inspection and mistake-proofing are given inTable 5.1.
Table 5.1 Key Differences Between Traditional Inspection and Mistake-Proofing
In the end, you cannot inspect quality into a process; you have to build it in.
Steps in Mistake-Proofing
The steps required for mistake-proofing are rather simple, but they do rely on theexpertise of the process, product, or service subject-matter experts. The steps are shownin Figure 5.4.
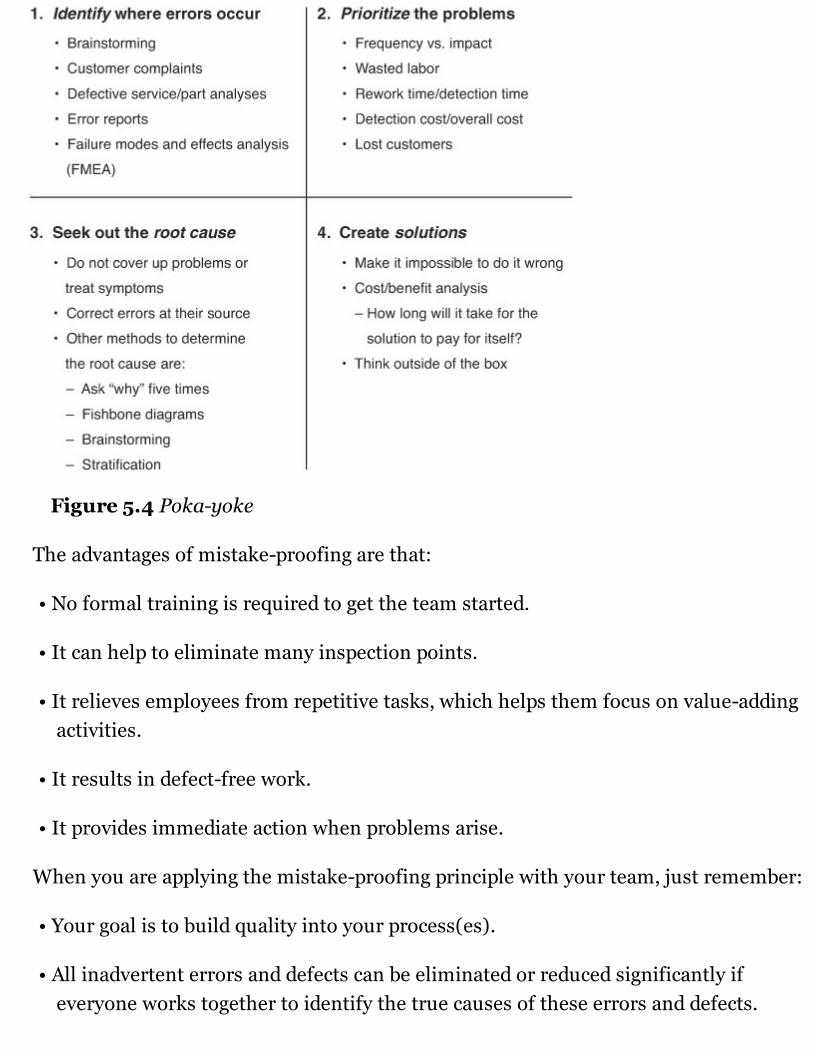
Figure 5.4 Poka-yoke
The advantages of mistake-proofing are that:
• No formal training is required to get the team started.
• It can help to eliminate many inspection points.
• It relieves employees from repetitive tasks, which helps them focus on value-addingactivities.
• It results in defect-free work.
• It provides immediate action when problems arise.
When you are applying the mistake-proofing principle with your team, just remember:
• Your goal is to build quality into your process(es).
• All inadvertent errors and defects can be eliminated or reduced significantly ifeveryone works together to identify the true causes of these errors and defects.
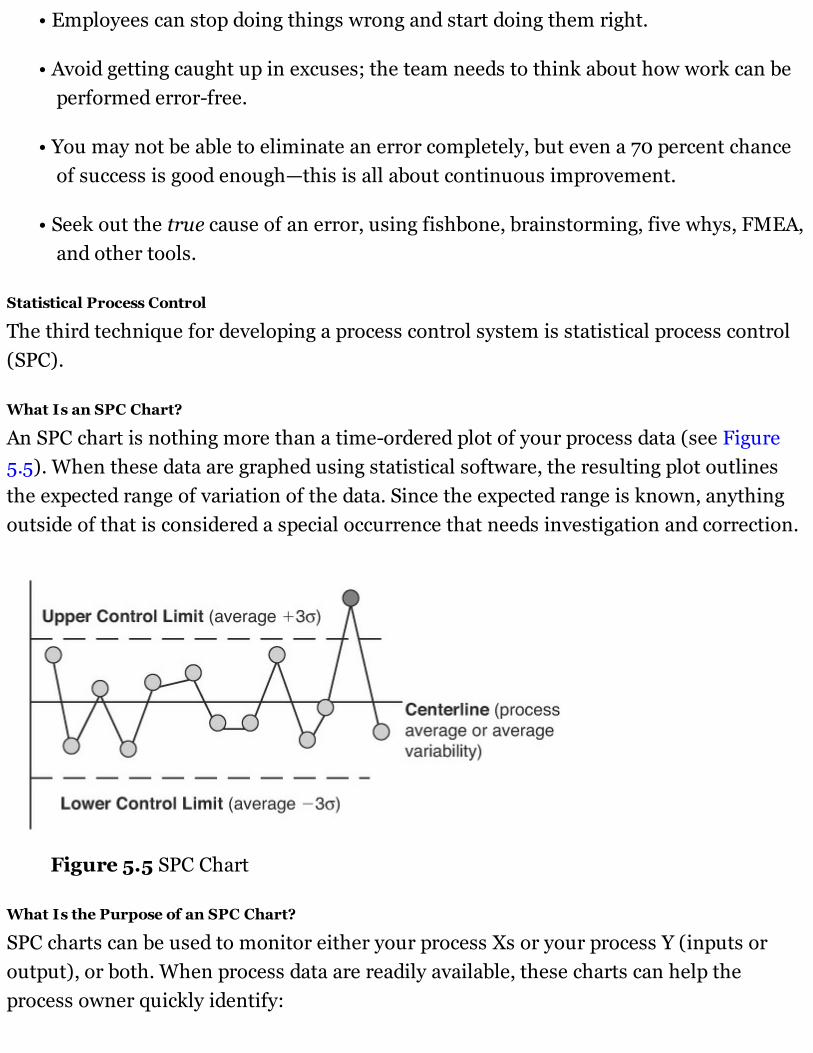
• Employees can stop doing things wrong and start doing them right.
• Avoid getting caught up in excuses; the team needs to think about how work can beperformed error-free.
• You may not be able to eliminate an error completely, but even a 70 percent chanceof success is good enough—this is all about continuous improvement.
• Seek out the true cause of an error, using fishbone, brainstorming, five whys, FMEA,and other tools.
Statistical Process Control
The third technique for developing a process control system is statistical process control(SPC).
What Is an SPC Chart?
An SPC chart is nothing more than a time-ordered plot of your process data (see Figure5.5). When these data are graphed using statistical software, the resulting plot outlinesthe expected range of variation of the data. Since the expected range is known, anythingoutside of that is considered a special occurrence that needs investigation and correction.
Figure 5.5 SPC Chart
What Is the Purpose of an SPC Chart?
SPC charts can be used to monitor either your process Xs or your process Y (inputs oroutput), or both. When process data are readily available, these charts can help theprocess owner quickly identify:
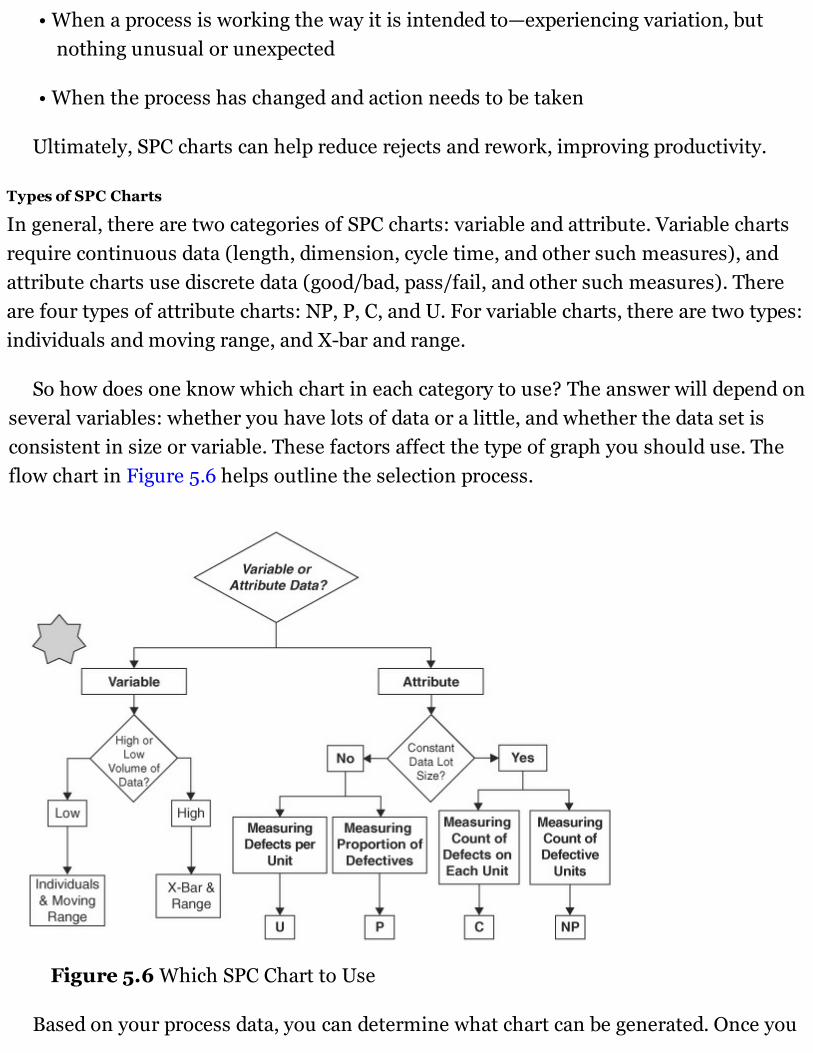
• When a process is working the way it is intended to—experiencing variation, butnothing unusual or unexpected
• When the process has changed and action needs to be taken
Ultimately, SPC charts can help reduce rejects and rework, improving productivity.
Types of SPC Charts
In general, there are two categories of SPC charts: variable and attribute. Variable chartsrequire continuous data (length, dimension, cycle time, and other such measures), andattribute charts use discrete data (good/bad, pass/fail, and other such measures). Thereare four types of attribute charts: NP, P, C, and U. For variable charts, there are two types:individuals and moving range, and X-bar and range.
So how does one know which chart in each category to use? The answer will depend onseveral variables: whether you have lots of data or a little, and whether the data set isconsistent in size or variable. These factors affect the type of graph you should use. Theflow chart in Figure 5.6 helps outline the selection process.
Figure 5.6 Which SPC Chart to Use
Based on your process data, you can determine what chart can be generated. Once you
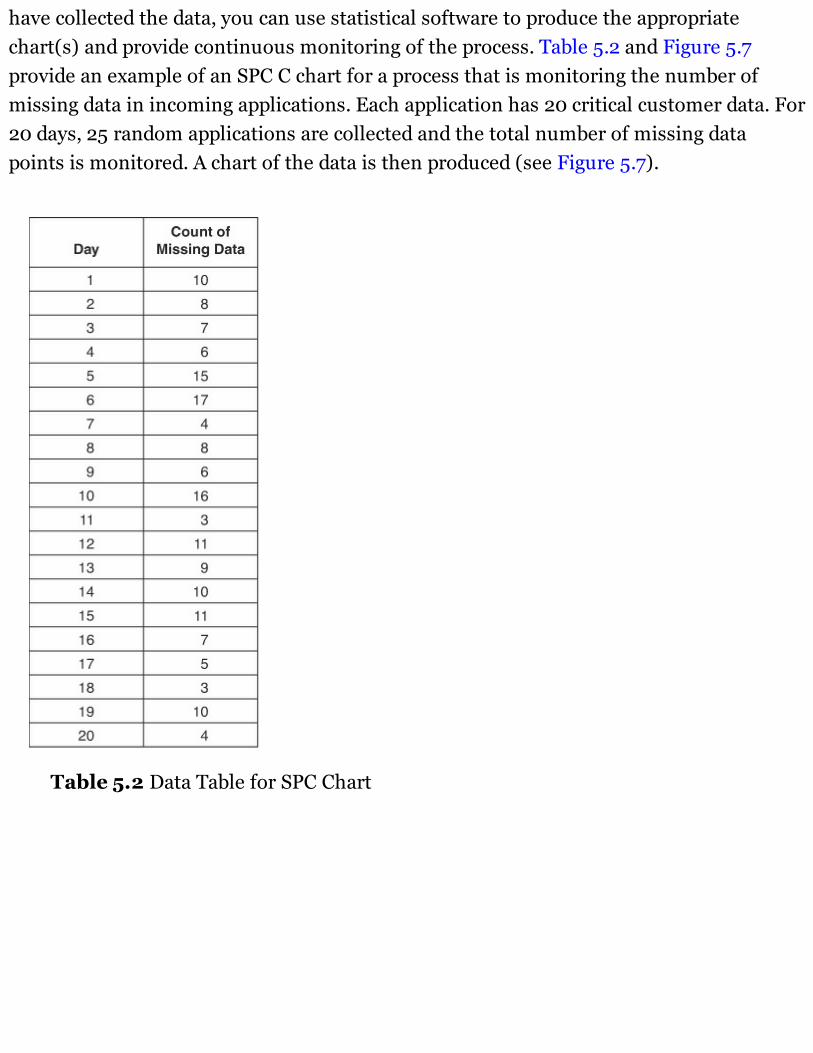
have collected the data, you can use statistical software to produce the appropriatechart(s) and provide continuous monitoring of the process. Table 5.2 and Figure 5.7provide an example of an SPC C chart for a process that is monitoring the number ofmissing data in incoming applications. Each application has 20 critical customer data. For20 days, 25 random applications are collected and the total number of missing datapoints is monitored. A chart of the data is then produced (see Figure 5.7).
Table 5.2 Data Table for SPC Chart
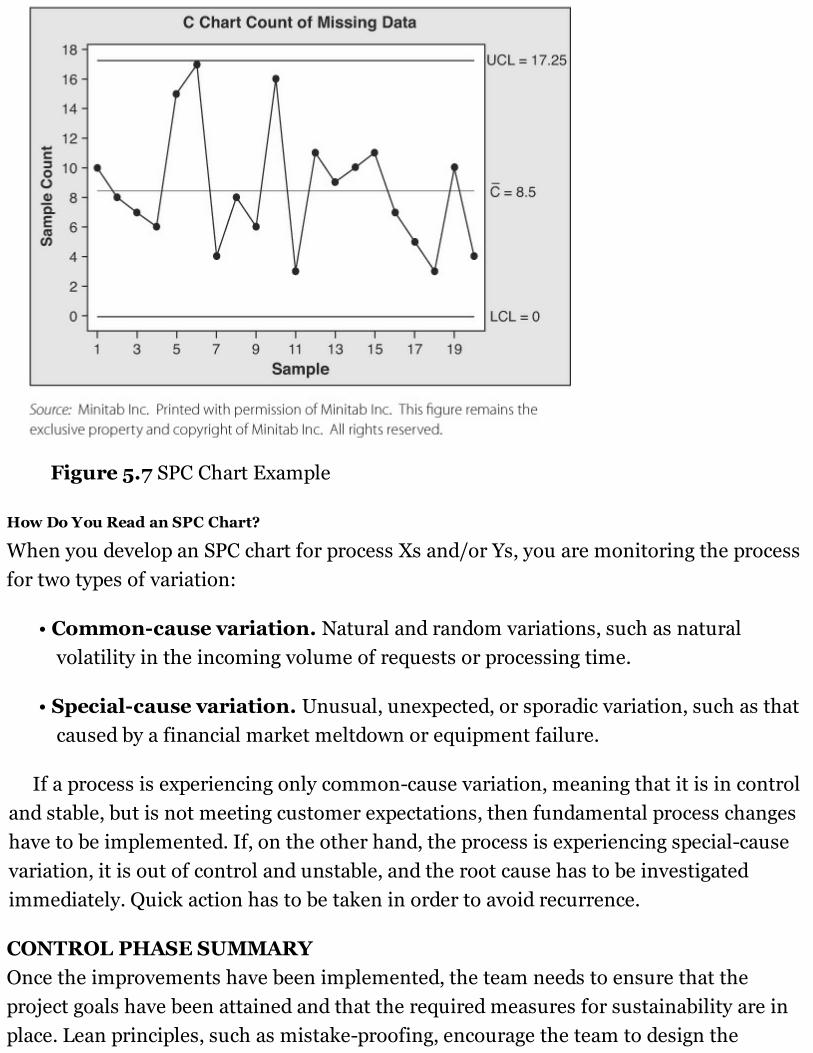
Figure 5.7 SPC Chart Example
How Do You Read an SPC Chart?
When you develop an SPC chart for process Xs and/or Ys, you are monitoring the processfor two types of variation:
• Common-cause variation. Natural and random variations, such as naturalvolatility in the incoming volume of requests or processing time.
• Special-cause variation. Unusual, unexpected, or sporadic variation, such as thatcaused by a financial market meltdown or equipment failure.
If a process is experiencing only common-cause variation, meaning that it is in controland stable, but is not meeting customer expectations, then fundamental process changeshave to be implemented. If, on the other hand, the process is experiencing special-causevariation, it is out of control and unstable, and the root cause has to be investigatedimmediately. Quick action has to be taken in order to avoid recurrence.
CONTROL PHASE SUMMARYOnce the improvements have been implemented, the team needs to ensure that theproject goals have been attained and that the required measures for sustainability are inplace. Lean principles, such as mistake-proofing, encourage the team to design the
process in a way that doesn’t permit errors to take place, while SPC charting allows theprocess outputs and inputs to be monitored. The availability of process data, the cost ofcollecting them, and the possibility of actually mistake-proofing a step are all keyconsiderations in determining what type of control plan to use. Regardless of the method,the common theme among all Control phase tools remains the same: the functionalowners of the improved process need to have bought into the new way of doing business.The buy-in is the ultimate Control plan that will ensure that the improvements will stayin place long after the team has been disbanded.
CONTROL PHASE CHECKLIST Validate that the measurement system is adequate for measuring your critical Xs.
Verify that the process improvements that you tested in the pilot have attained thegoals.
Hand off the process to the process owners.
Develop and implement a strategy for control, such as risk management or mistake-proofing.
QUESTIONS TO ASK AT THE END OF THE CONTROL PHASE1. Have you validated the measurement or just your ability to read the database?
2. How large is your measurement error (as a percentage of the allowable error)?
3. Did you meet the targets? Did you meet the prediction?
4. Did you change the value of the central tendency? If so, was this a deliberateprocess change? If it wasn’t, why did the value change?
5. What risks have you identified that could jeopardize your control strategy?
6. What actions are still required to guarantee sustainability?
APPLICATION OF LEAN SIX SIGMA CASE STUDY—CONTROL PHASEDELIVERABLESAfter the process change, the team knew that in order to meet customer expectations, ithad to make sure that the operations team completed the review of each packet within 36hours. To attain this operational goal, the incoming packet had to be received via e-mail,
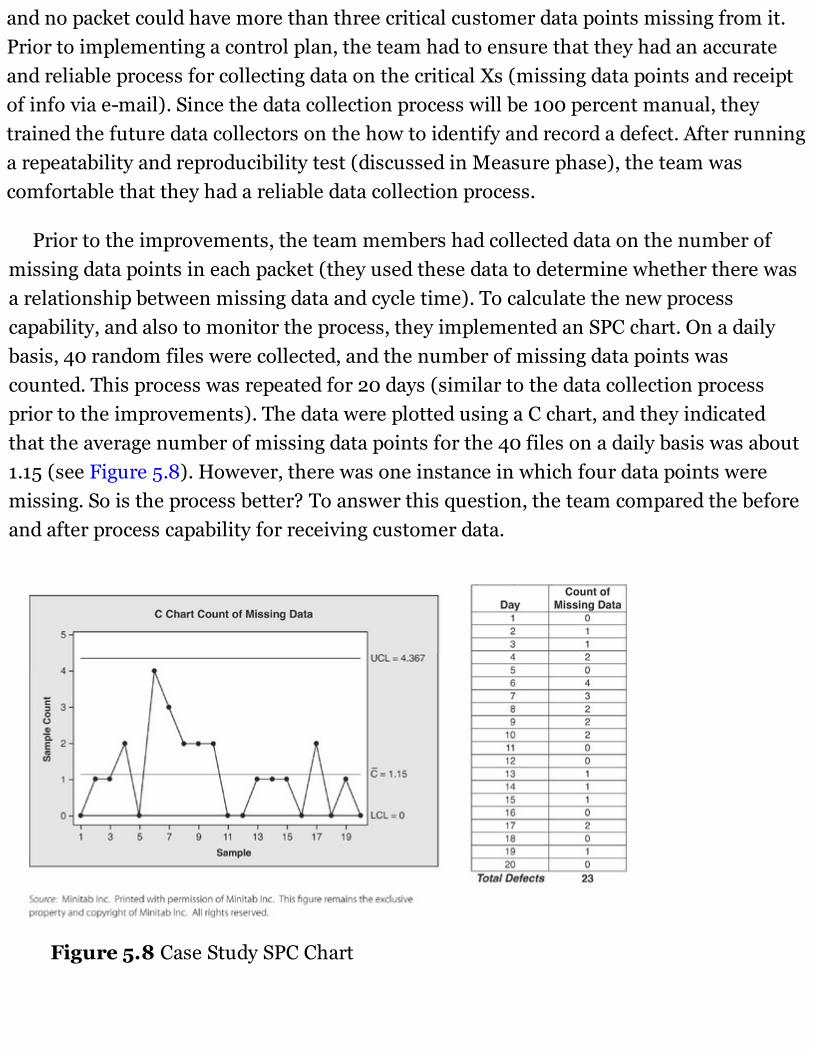
and no packet could have more than three critical customer data points missing from it.Prior to implementing a control plan, the team had to ensure that they had an accurateand reliable process for collecting data on the critical Xs (missing data points and receiptof info via e-mail). Since the data collection process will be 100 percent manual, theytrained the future data collectors on the how to identify and record a defect. After runninga repeatability and reproducibility test (discussed in Measure phase), the team wascomfortable that they had a reliable data collection process.
Prior to the improvements, the team members had collected data on the number ofmissing data points in each packet (they used these data to determine whether there wasa relationship between missing data and cycle time). To calculate the new processcapability, and also to monitor the process, they implemented an SPC chart. On a dailybasis, 40 random files were collected, and the number of missing data points wascounted. This process was repeated for 20 days (similar to the data collection processprior to the improvements). The data were plotted using a C chart, and they indicatedthat the average number of missing data points for the 40 files on a daily basis was about1.15 (see Figure 5.8). However, there was one instance in which four data points weremissing. So is the process better? To answer this question, the team compared the beforeand after process capability for receiving customer data.
Figure 5.8 Case Study SPC Chart
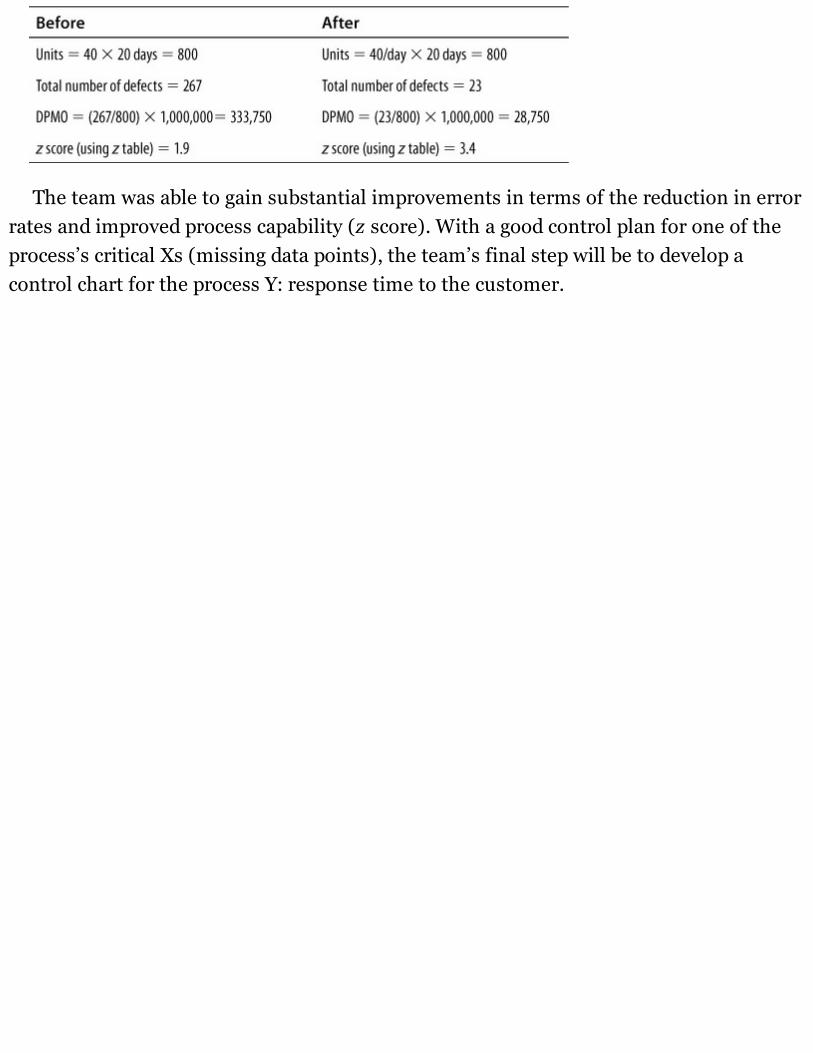
The team was able to gain substantial improvements in terms of the reduction in errorrates and improved process capability (z score). With a good control plan for one of theprocess’s critical Xs (missing data points), the team’s final step will be to develop acontrol chart for the process Y: response time to the customer.

CHAPTER 6
CONCLUSIONAs a project inches closer to completion, the Green and Black Belts must start thinkingabout how to wrap up all the work that they have put into the project. The end of a projectand the decommissioning of a project team is much like a “little death.” It is common forteam members to want to prolong the team’s existence beyond the time when it is useful.Often such a strong bond has been forged within the team that its members find itdifficult to let go.
If project completion is to go smoothly, the team leader will need to leverage variousresources that are available within the organization. The leadership team should alsohelp the team members bring the project to a graceful close. It will be critical for theleaders to recognize the different stages that people may go through. The leaders willneed to establish that the project has indeed come to an end and emphasize that there areother opportunities available for the team members to focus on. This is accomplishedthrough a sympathetic affirmation of the work the team has put into the project. It isimportant to establish the end of this group, even though its members will continue tohave contact with one another in other venues.
The project leader may have a celebration event that officially marks the end of theproject. He can provide a souvenir (coffee mug, plaque, T-shirt, or something similar) ofthe project team and its project, help members articulate their appreciation, andhopefully help them move on to other projects.
If this is to be accomplished, the team members must be confident of the following:
• The purpose of the project has been fulfilled.
• The original goals for improvement have been achieved and/or there has beensubstantial improvement in the process.
• It’s clear that any further improvement will require a new major breakthrough effort(for example, new technology).
• Staff members have incorporated the discoveries of the project team into their workand are now actively involved in further improvement efforts.
To make sure we are not being hasty in wrapping up the project, all the questions in
the following list generally need to be answered in the affirmative:
• Did the team achieve its goal?
• Do the data show that the new process is stable and under control?
• Do the data show that the new process is capable of meeting customerrequirements?
• Has the new sigma level met or exceeded the goal?
• Do the financials show the benefit to the organization?
• Has the team documented the new process?
• Has the team documented best practices?
• Have the dashboard vital signs or ongoing metrics been implemented?
• Has the process owner received all the documentation and does she understand themonitoring process, including how to respond to changes in the metrics?
For the project to be successful in ways that really get the leadership team excited, theteam needs to show that it has delivered a financial benefit. At the Improve phase of theproject, the anticipated financial benefits were based on best-guess estimates andassumptions, with the help of the finance team. But as the project comes to an end, thereshould be more evidence of the financial impact that the new process is having.Documenting the financial benefits justifies the value of the project—it shows that therewere real benefits from the effort.
PROJECT DOCUMENTATIONThe team has gained a significant amount of knowledge as it has followed the path ofDMAIC. This knowledge includes specific information concerning both content(discovering new information about the process, what the root cause is, and so on) andprocess (hypothesis testing, calculating sigma, writing CTQs, and so on). Otherindividuals and project teams can benefit from having access to both these types ofknowledge. Sharing both this information and best practices can help shorten thesubsequent learning curves for other teams.
Although you should be documenting your project as the team progresses throughDMAIC, the documentation package is really finalized at the end of the project. (At thispoint, all uncertainty concerning any of the issues involved must be cleared up.) Thefollowing checklist will facilitate the creation of the project binder:
• Make sure that you have documented your project using the DMAIC templates.
• All data supporting your findings and analysis should be included in your projectbinder.
• Project documentation is the record and history of the project through the DMAICphases.
• If additional opportunities for improvement were discovered, you should documentthem in the file.
• Project documentation saves and shares the steps taken, knowledge gained, lessonslearned, and best practices discovered during the course of the project.
PROJECT TRANSLATIONOne of the main reasons that teams are urged to create a binder that contains the criticalinformation regarding the project is to ensure that there is no duplication of effort shouldanother team be working on a tangentially related effort. Sharing best practices andtranslating findings to other parts of the organization become critical components ofwrapping up the project. If there are other projects that may flow out of the originalproject, it behooves the team to make all data and findings available to interested parties.
LAST THOUGHTSDMAIC is not a once-and-done journey. The quality path is one of recurrence andrevisiting. An organization is never stuck in a state of perfection; it is always experiencingchange and variation. Change and variation mean unhappy customers and lost revenue.For this very reason, the quality team must always be aware that there are opportunitiesawaiting its attention. Once a project has been completed, the team deserves to becelebrated, but this does not mean that it is time to stop looking for improvementopportunities. The most successful organizations are those that have an ingrained cultureof ongoing improvement and have empowered their staff members to take bold steps inaddressing their customer and organizational needs.

PROCESSARC COMPREHENSION TEST1. In the Analyze phase, one of the things you do is:
a. Define performance standards.
b. Establish operating tolerances and pilot a solution.
c. Establish process capability.
d. Define a process map.
2. Collecting VOC helps to:
a. Define how CTQs are linked to vital Xs.
b. Determine how customer CTQs become project CTQs.
c. Decide upon your improvement strategy.
d. Design your DOE.
3. The goal statement defines:
a. In broad terms, the measurable improvement objective.
b. The dollar benefits of the project.
c. The DPMO improvement required.
d. The sigma score expected upon completion of the project.
4. The part of team charter development that defines and places boundaries on theprocess is:
a. The business case.
b. The goal statement.
c. Defining team roles.
d. Assessing the project scope.
5. The purpose of a process map is:
a. To create a shared view of the process and help identify key inputs.
b. To provide a structure for finding the causes of an effect.
c. To identify ways in which a subprocess or product characteristic can fail.
d. All of the above.
6. Components of a good performance standard include:
a. Target performance.
b. Operational definition.
c. Specification limits.
d. All of the above.
7. What is the statistic used for central tendency with normal data?
a. IQR (interquartile range, Q3 – Q1)
b. Quartile 1 (Q1)
c. Median
d. Mean
8. The importance of validating a measurement system is to ensure that themeasurement does reflect the true variation of the process.
a. True
b. False
9. In the two-sample t test, you get a p value of 0.06. The results indicate that
a. You would fail to reject the null hypothesis.
b. You would reject the null hypothesis.
10. When you compare Process A to Process B, Process A has a z score of 3.6, whileProcess B has a z score of 2.8. Process B therefore is more capable in terms ofmeeting customer requirements.
a. True
b. False
11. Which of the following approaches is used to determine differences betweenpopulation sets?
a. Screening design of experiments
b. Optimization design of experiments
c. Hypothesis test
d. Process capability analysis
12. Takt time is:
a. The drumbeat of the process—the output required to meet demand.
b. The frequency of incoming customer requests.
c. The number of hours required to complete production of one piece.
d. The amount of resources or overtime required to meet demand.
13. The purpose of a failure modes and effects analysis (FMEA) is:
a. To provide a quantitative view used to identify a focus area.
b. To relate the customer CTQs to measurable subprocesses or productcharacteristics.
c. To identify ways in which a subprocess or product characteristic can fail.
d. To create a shared view of the process.
14. You have a unit with five opportunities. If any opportunity is bad, the whole unit is
bad—binomial distribution. You want to use SPC to monitor this unit. What controlchart would you use?
a. The X-bar R chart
b. The U chart
c. The P chart
d. The IMR chart
15. Mistake-proofing is:
a. A method of identifying potential defects.
b. A technique for eliminating errors by making it impossible to make mistakes inthe process.
c. A means of responding to defects before they leave the facility.
d. Part of statistical process control.
16. Which of the following is a measure of variation?
a. The upper specification limit
b. The standard deviation
c. The lower specification limit
d. Both (a) and (c)
17. The purpose of a kaizen event is to:
a. Define standard operations and eliminate NVA in a short period of time, usingthe expertise of everyday users.
b. Create a shared view of the process.
c. Provide a structure for finding the causes of an effect.
d. Provide a quantitative view used to identify a focus area.
18. In the Measure phase, one of the things you do is:
a. Conduct a DOE.
b. Establish process capability.
c. Define performance standards.
d. Define performance objectives.
19. In an FMEA, what is the RPN?
a. The product of the severity, occurrences, and detection numbers
b. The sum of the severity, occurrences, and detection numbers
c. The probability of making a Type I error
d. The probability of making a Type II error
20. If your USL is 100 days, your mean is 85 days, and your short-term standarddeviation is 5 days, what is your zst(± 0.1)?
21. If your zst is 4, your USL is 50, and your standard deviation is 2, what is yourmean?
22. The best that our process can achieve using current technology is called the:
a. Baseline.
b. Entitlement.
c. Sigma value.
d. Benchmark.
23. The null hypothesis generally presumes:
a. No change, or the status quo.
b. The need for immediate action.
c. The essential leadership of the Six Sigma project team.
d. The need for new process technology.
24. You have attribute data. Your defects are 29 out of 2,000 units with 2 qualitycharacteristics per unit. What is your short-term z?
25. Your DPMO is 326,558. What is your short-term z value (± 0.1)?
26. The first element of the team charter is to:
a. Establish the business case.
b. Choose the team members.
c. Evaluate possible improvement initiatives.
d. Design the DOE.
27. In defining a team, you should always define:
a. Roles, responsibilities, and salaries.
b. Roles and supervisory input.
c. Responsibilities and reporting structure.
d. Roles, responsibilities, and expectations.
28. The contents of the high-level process map include:
a. Customer requirements, outputs, process steps, costs, and suppliers.
b. Customer requirements, outputs, process steps, inputs, and suppliers.
c. Schedule factors, outputs, process steps, inputs, and suppliers.
d. None of the above.
29. The purpose of a Pareto chart is:
a. To identify ways in which a subprocess or product characteristic can fail.
b. To provide a quantitative view used to identify a focus area.
c. To provide a structure for finding the causes of an effect.
d. To create a shared view of the process.
30. You need to have an effective process control system because:
a. The process will have a tendency to degrade over time.
b. People outside of the Six Sigma team need to know how to manage the process.
c. Operators need to know what to do if the process gets out of control.
d. All of the above.
31. When validating the measurement system in the Control phase, we:
a. Focus on all the Xs.
b. Use historical data and process knowledge.
c. Focus on the critical Xs identified in the Improve phase.
d. Calculate overall measurement system repeatability, reproducibility, andaccuracy.
32. In the Improve phase, one of the things you do is:
a. Establish a data collection plan.
b. Establish process capability.
c. Discover variable relationships.
d. Implement a process control system and project closure.
33. In the Control phase, one of the things you do is:
a. Identify CTQs.
b. Establish process capability.
c. Discover variable relationships.
d. Implement a process control system and project closure.
34. A variable control chart tracks:
a. Discrete data, such as pass/fail or good/bad.
b. Continuous data, such as cycle time, length, or diameter.
c. Several characteristics of the same process.
d. Responses to defects.
35. For a test with a 90-minute time limit and a minimum passing grade of 70 percent,which of these is an acceptable performance standard?
a. Complete the final exam within 90 minutes, with an acceptable grade.
b. Score at least 70 percent on the final exam.
c. Complete the final exam within 90 minutes, with a score of at least 70 percentcorrect.
d. Pass the final exam.
36. What is the purpose of a data collection plan?
a. To provide a clear, documented strategy for collecting reliable data
b. To give all team members a common reference
c. To help to ensure that resources are used to collect only critical data
d. All of the above
37. If your X is usually changed in type or kind, rather than amount, it is a(n):
a. Operating parameter.
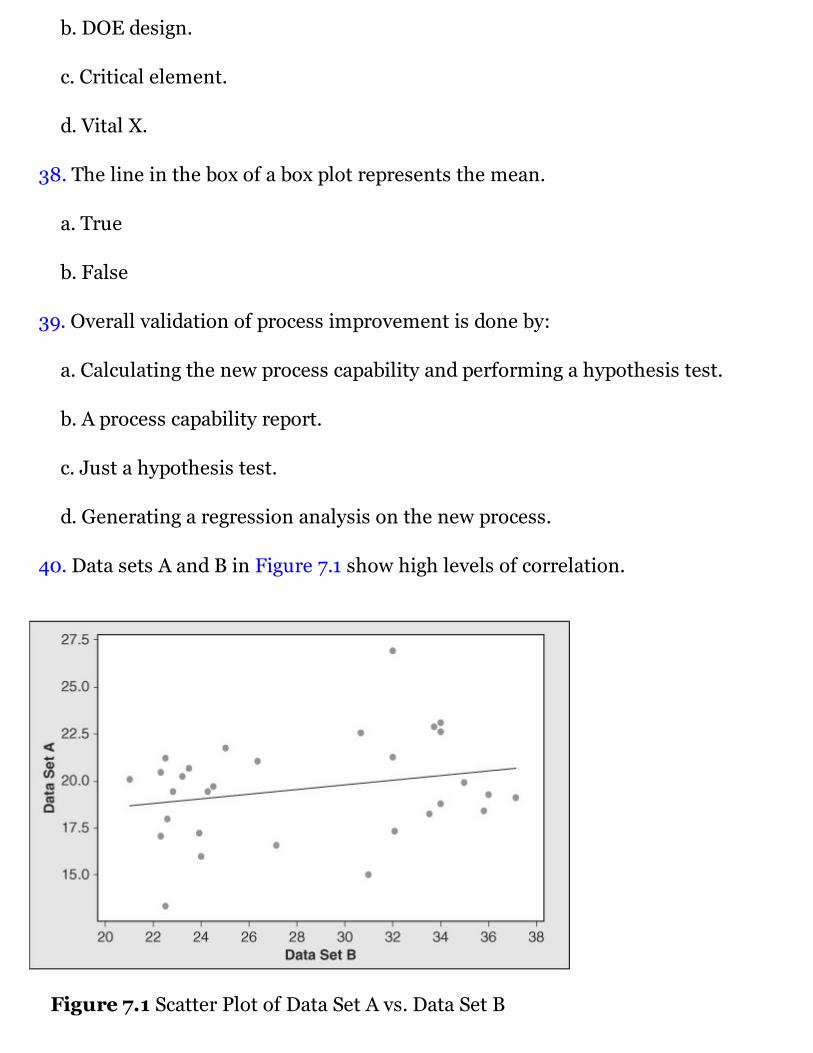
b. DOE design.
c. Critical element.
d. Vital X.
38. The line in the box of a box plot represents the mean.
a. True
b. False
39. Overall validation of process improvement is done by:
a. Calculating the new process capability and performing a hypothesis test.
b. A process capability report.
c. Just a hypothesis test.
d. Generating a regression analysis on the new process.
40. Data sets A and B in Figure 7.1 show high levels of correlation.
Figure 7.1 Scatter Plot of Data Set A vs. Data Set B

a. True
b. False


PROCESSARC COMPREHENSION TEST ANSWER KEY1. c
2. b
3. a
4. d
5. a
6. d
7. d
8. a
9. a
10. b. The higher the z score (sigma value), the lower the probability of making anerror. Therefore, Process A is more capable.
11. c
12. a
13. c
14. c
15. b
16. b
17. a
18. c
19. a
22. b
23. a
Using the z/DPMO table,
25. Using a z/DPMP table,
26. a
27. d
28. b
29. b
30. d
31. c
32. c
33. d
34. b
35. c
36. d
37. c
38. b. The line represents the median.
39. a
40. b. Based on the scatter plot, there seems to be no relationship between data sets Aand B. The data do not demonstrate any trends, that is, the performance level of Adoes not affect B.
INDEXA
ACAT (automated customer account transfer) process flow, 75
Accountability as pillar of success, 27–28
Accuracy of measurement system analysis, 98–101
Adding value [see Value-add (VA)]
Adequacy of measurement system analysis, 103–104
Alternative hypothesis, 144, 147, 153, 171
Analyze phase, 111–149
about, 111–113, 148–149
case study application, 150–153
checklist, 149
deliverables, 112–113
DMAIC problem solving, 15
kaizen, 158
Lean tools, 112
overview graphic, 112
ProcessArc comprehension test, 209
questions to ask at end of phase, 149
Six Sigma tools, 112
step 9: baseline process capability, 113–128
step 10: define performance objective, 129–132
step 11: variation, identify sources of, 132–149
Assignment description, business case, 50
Assurance, Six Sigma key deliverables, 16
Attainable in SMART criteria, 44
Attribute measurement system analysis, 98–104
Awareness, creating, 21, 22
B
Barrier busters, project champion, 48
Baseline process capability (Analyze phase), 113–128
about, 113, 128
graphical methods, 114–120
numerical methods, 120–128
Bell curves, 127–128
Benchmarking performance objectives, 129–132
Benefits:
of change management, 58–59
financial, business case, 44, 49–50
Best-in-class benchmarking, 129–131
Black Belts:
Analyze phase, 142
culture of continuous improvement, 11
Define phase, 47–48, 50–51, 64, 67
described, 25
Improve phase, 170
Lean Six Sigma implementation, 16, 20–24, 26
LLS organization, 23–25
penetration level, 24
Six Sigma, 16
wrapping up the project, 203
Bottlenecks, kaizen, 157
Box plot, 114, 117–119, 171, 216
Business case (Define phase), 43–51
about, 43, 50–51
business case components, 44
deliverables, 32, 43
financial benefit, 44, 49–50
goal statement, 44–46
overview graphic, 43
problem statement, 44–45
process, 31–32
project scope, 44, 46
team charter development, 32

team roles, 44, 47–49
tools, 32
C
Case studies:
Analyze phase, 150–153
Control phase, 199–201
Define phase, 65–67
Improve phase, 177–181
Measure phase, 105–109
Causation and correlation, 142
Cause-and-effect (fishbone) diagram, 72, 76–78, 107
Central tendency with normal data, 145–146, 210
Champions (see Project Champion/Sponsor)
Change agent, kaizen events, 161
Change leadership identification milestone, 59
Change management strategies (Define phase), 57–64
about, 57–59, 64
benefits, 58–59
change leadership identification milestone, 59
commitment mobilization milestone, 59
deliverables, 32
institutionalization and monitoring milestone, 59
key stakeholder analysis, 62–63
overview graphics, 58
process, 31–32
shared need identification milestone, 59
threat vs. opportunity matrix, 60–62
tools, 32, 58–63
vision elevator speech, 62
vision shaping milestone, 59
Charts (see Graphical methods, baseline process)
Checklists:
Analyze phase, 149
Control phase, 198
Define phase, 65
DMAIC problem solving, 206
Improve phase, 178
Measure phase, 105–106
Commitment mobilization milestone, 59
Common-cause variation, SPC, 195
Communication plan, LSS implementation, 22
Company, operational definitions of, 86
Complaints as tangible cost, 10
Consistent delivery, customer service, 10–11
Continuous data, 87, 122–128
Continuous improvement, building a culture of, 11
Control mechanisms:
implement process control, 187
mistake-proofing, 188–193
quality plans, process control, 187–188
statistical process control (SPC), 193–197
Control phase:
about, 197–198
case study application, 199–201
checklist, 198
deliverables, 199–201
DMAIC problem solving, 15
overview graphic, 184
ProcessArc comprehension test, 215
questions to ask at phase end, 198
step 13: validate measurement system analysis on the Xs, 183–185, 215
step 14: determine process capability, 183–185
step 15: implement process control, 183, 186–197
Core cross-functional team, 47, 49
Correlation:
in scatter plot, 216–217
variation, identify sources of, 133, 140–143
vs. causation, 142
Correlation coefficient, 141
Costs, 9–10, 12
Critical elements, vital xs, 156–157
Critical-to-quality (see CTQ)
CTQ, defined, 36
CTQ characteristics (Measure phase), 71–83
about, 69, 71–72, 82
failure modes and effects analysis (FMEA), 72, 78–82
fishbone diagram, 72, 76–78, 107
overview graphic, 70
process map, 71–76, 106–107
CTQ parameter, 36–42
CTQ project (Define phase), 31, 33–43
about, 31, 42–43
case study application, 66
CTQ parameter, 36–42
customer CTQ (Y), 37
customer identification, 36, 38–39
customer needs mapping, 40–42
deliverables, 32–42
opportunity for improvement, 33–35
overview graphic, 32
process, 31–32
tools, 32
voice of the customer (VOC), 37–42
Culture rollout, LSS, 20–23
Current process capability, 129
Customers:
ACAT process flow, 75
identification for CTQ project, 36, 38–39
needs mapping, 40–42
operational definitions of, 85–86
performance recall, 15–16
service, consistent delivery of, 10–11
SIPOC mapping, 52–54
voice of the customer (VOC), 37–42, 209
Cycle time:
Define phase, 49–50
operational definitions, 85–86
reduction/process enhancement, 133
vital Xs and implementable solutions, 157
D
Data collection (Measure phase), 90–96
about, 90–92
actions and monitoring, 92–93, 95–96
case study application, 107–109
data consistency and stability, 92–93, 95–96
goals establishment, 92–93
operational definitions/procedures, 86–87, 92–96
overview graphic, 70
ProcessArc comprehension test, 216
Data sampling, 93–94
Data-rich organization as pillar of success, 27
Defects:
cost of, 17
defined, 85, 89, 126
DPMO, 124–128
performance standards, 89
as waste, 18
Defects per million opportunities (DPMO), 112, 124–128
Define phase, 31–67
about, 31–32, 64–65
case study application, 65–67
checklist, 65
deliverables, 31–42
discovery of opportunities for improvement, 34–35
DMAIC problem solving, 15
kaizen, 158
overview graphic, 32
questions to ask at phase end, 65
step 1: CTQ project, 33–43
step 2: business case, 43–51
step 3: process mapping, 51–57
step 4: change management, 57–64
Deliverables:
Analyze phase, 112–113
change management, 32
Control phase, 199–201
CTQ project, 32–42
Define phase, 31–42
Improve phase, 155–156
Lean key, 19
Measure phase, 105–109
process mapping, 32
Six Sigma key, 16
Demand, takt time, 138
Determine process capability (Control phase), 184–185
Diamonds (decision) symbols on process map, 74
Differentiation, corporate strategy for, LSS purpose, 4–5
Discovery of opportunities for improvement, 34–35
Discrete data, 87, 122–128
DMAIC problem solving, 15, 205–206
DPMO (defects per million opportunities), 112, 124–128
E
Effective hours, takt time, 138
80/20 rule, nonmanufacturing sectors, 13–14
Elevator speech, 63
Empirical Evidence from Firms That Have Won Quality Awards (Hendricks & Singhal),3
End of project, 203–207
documentation, 205–206
ongoing improvement, 206–207
project translation, 206
review questions and accomplishments, 204–205
wrap-up celebration, 204
Expense reductions, Six Sigma key deliverables, 16
External opportunities for improvement, 34
F
Failure modes and effects analysis (FMEA), 72, 78–82, 211–212
Financial benefit, business case, 44, 49–50
Financial performance, quality award winners, 3
Fishbone diagram, 72, 76–78, 107
5S waste reduction, 157, 164–165
Flow in kaizen, 157
FMEA (failure modes and effects analysis), 72, 78–82, 211–212
Ford, Henry, 19
Form codes, compliance with, 99–104
Four sigma, 16
G
General Electric, 14
Goal statement in business case, 44–46
Goals:
establishment and data collection, 92–93
Lean Six Sigma, 8–11
LSS implementation, 20–22
operational variance reduction, 15, 17
statement of, ProcessArc comprehension test, 209–210
validate measurement system, 98–99
Graphical methods, baseline process, 114–120
box plot, 114, 117–119
histogram, 114–116
Pareto analysis, 114, 119–120
run chart, 114, 116–117
Green Belts:
Analyze phase, 142
culture of continuous improvement, 11
Define phase, 47–48, 64
described, 24–25
Improve phase, 170
Lean Six Sigma implementation, 16, 20–24, 26
LLS organization, 23–25
Measure phase, 82
penetration level, 24
Six Sigma, 16
wrapping up the project, 203
H
Hendricks & Singhal study on quality, 3
Histogram, 114–116
Hypothesis testing, 133, 143–148
I
Improve phase, 155–169
about, 155–156, 177–178
case study application, 179–181
checklist, 178
deliverables, 155–156
DMAIC problem solving, 15
overview graphics, 156
ProcessArc comprehension test, 215
questions to ask at the end of, 178–179
step 12: vital Xs and implementable solutions, 156–169, 179–181
tools, 155, 157
Information, business case, 50
Inputs, X-functional process map, 74
Inspection:
as tangible cost, 9
vs. mistake-proofing, 189–191
Institutionalization, LSS, 21, 23
Institutionalization and monitoring milestone, 59
Intangible costs, 10
Internal opportunities for improvement, 34
Inventory as waste, 18
K
Kaizen, 158–169
5S waste reduction, 157, 164–165
about, 158, 169
before and after, 167–169
bottlenecks, 157
described, 159
eight rules of, 163
flow, 157
kaizen events, 159–164
line balancing, 157, 165–168
NVA elimination, 167–169
process road map, 157
waste, 160–162
Kaizen events:
goals, 159–160
objectives and assessment, 159–160
ProcessArc comprehension test, 212
roles and responsibilities, 161–164
typical, 162–163
waste, 160–161
Key deliverables:
Lean, 19
Six Sigma, 16
Key stakeholders:
analysis of, 62–63
Analyze phase, 111, 114
Define phase, 32–33, 47–51, 57–58, 62–65, 67
described, 49
Improve phase, 163
Lean Six Sigma implementation, 22
role described, 47, 49
L
Lean:
described, 17–19
tools, 31, 51–57, 112, 133–135
Lean Six Sigma:
basis for, 1
continuous improvement culture, building, 8, 11
corporate strategy for differentiation, development of, 6
customer service, improving, 8, 10–11
defined, 19
DMAIC problem solving, 15
goals and success metrics, 8–11
implementation overview, 20–23
intangible costs, 10
learning objectives, 1
metrics, 2–3, 8–11
in nonmanufacturing sectors, 11–14
operational challenges, overcoming, 4, 6–8
operational cost and risk, reducing, 8–9
organizational structure, 23–26
pillars of long-term success, 26–28
productivity/process improvement, 20–22
project end, 203–207
purpose of, 3–4
quality culture, 2–5
revenue, increasing, 8, 10
sustainability, 5
tangible costs, 9–10
vs. traditional thinking, 28–29
Lean Six Sigma phases:
Define phase, 31–67
step 1: CTQ of project, 33–43
step 2: business case, 43–51
step 3: process mapping, 51–57
step 4: change management, 57–64
Measure phase, 69–104
step 5: CTQ characteristics, 69, 71–83
step 6: performance standards, 84–90
step 7: data collection, 90–96
step 8: validate measurement system, 97–104
Analyze phase, 111–149
step 9: baseline process capability, 113–128
step 10: define performance objective, 129–132
step 11: variation, identify sources of, 132–149
Improve phase, 155–169
step 12: vital Xs and implementable solutions, 156–169
Control phase, 183–201
step 13: validate measurement system analysis on the Xs, 184–185
step 14: determine process capability, 185
step 15: implement process control, 186–197
Line balancing, kaizen, 157, 165–168
Linear regression, 157, 174–177
Long-tailed distribution, 123
LSS (see Lean Six Sigma)
M
Mapping (see Process mapping)
Master Black Belts:
Define phase, 57
described, 25–26
Improve phase, 161, 170
Lean Six Sigma implementation, 16, 20–24, 26
LLS organization, 25–26
penetration level, 24
Six Sigma, 16
Mean, 140, 145, 147, 213
Measurable in SMART criteria, 44
Measure phase, 71–104
about, 69–71, 104–105
case study application, 105–109
checklist, 105
deliverables, 105–109
DMAIC problem solving, 15
kaizen, 158
overview graphic, 70
ProcessArc comprehension test, 213
questions to ask at phase end, 105–106
step 5: CTQ characteristics, 71–83
step 6: performance standards, 84–90
step 7: data collection, 90–96
step 8: validate measurement system, 97–104
time stamps, 109
Measurement system (see Validate measurement system)
Median, hypothesis testing, 118–119, 140, 145
Metrics:
goal and success, 8–11
intangible cost, 10
as operational challenge, 7
operations cost and risk, 8–9
quality, 2–5
revenue increases, 10
tangible cost, 9–10
Milestones:
change management, 59
CTQ parameters, Define phase, 38–42
“go/no-go” decisions, 57
LSS implementation, 20–22
Minitab, 123, 171
Mistake-proofing, 188–193, 212
Motion as waste, 18
N
Necessary non-value-add (NNVA)
defined, 135
usage, 135–137
variation, identify sources of, 133–134, 158
Needs of customer, mapping, 40–42
New processes/products as operational challenge, 7
NNVA [see Necessary non-value-add (NNVA)]
Nonmanufacturing sectors, LSS in, 4, 11–14
Non-value-add (NVA):
defined, 135
elimination of, 167–169
service costs, 12
usage, 135–137
variation, identify sources of, 133–134, 158
Normal process data and distribution, 123–128
Null hypothesis, 144–147, 213
Numerical methods, baseline process, 120–128
continuous data, 122–128
discrete data, 87, 122–128
DPMO number, 112, 124, 126–127
normal process data, 123–128
z score, 112, 120–122, 124–128, 150
NVA [see Non-value-add (NVA)]:
O
Operating parameters, vital Xs, 156–157
Operational challenges, overcoming, 4, 6–8
Operational cycle time (see Takt time)
Operational definitions, 84–88, 92–96
Opportunities:
DPMO, 126
for improvement, CTQ project, 33–35
threat vs. opportunity matrix, change management, 60–62
Optimization, vital Xs, 157
Organizational commitment as pillar of success, 26–27
Outlier in box plot, 119
Output:
customer needs mapping, 41–42
SIPOC mapping, 52–54
X-functional process map, 74
Ovals (start-stop) symbols on process map, 74
Overprocessing as waste, 18
Overproduction as waste, 18
P
P value:
Analyze phase, 144–145, 147, 153, 172
ProcessArc comprehension test, 211
Pareto analysis, 114, 119–120, 214
Pearson coefficient, 141
Performance objectives, defined (Analyze phase), 129–132
about, 129
benchmark best-in-class, 129, 131
current process capability, 129
overview graphic, 129
process entitlement, 129–131
Performance standards (Measure phase), 84–90
about, 84, 89–90
case study application, 106–108
defect definition, 85, 89
operational definition, 84–88
overview graphic, 70
ProcessArc comprehension test, 210, 215
specification limits, 85, 88
target performance, 85, 88–89
Piloting solutions, vital Xs, 172–173
Poka-yoke (mistake-proofing), 188–193, 212
Precision in measurement system analysis, 98–99, 100–103
Predictable metrics as pillar of success, 27–28
Prioritization in mistake-proofing, 192
Problem statements in business case, 44–45
Process:
business case, 31–32
change management, 31–32
CTQ project, 31–32
product synchronization map (PSM), 52, 54–57, 158
SIPOC mapping, 52–54, 56
y, Measure phase, 69, 71
Process capability, determining (Control phase), 184–185
Process control implementation (Control phase), 186–197
control mechanisms, 187
mistake-proofing, 188–193
overview graphic, 184
process control systems described, 186–187
quality plans, 187–188
statistical process control (SPC), 193–197
Process entitlement, performance objectives, 129–131
Process mapping (Define phase), 51–57
about, 51–52, 57, 158
ACAT process flow, 75
business case example, 66–67
CTQ characteristics, 71–76, 106–107
deliverables, 32
kaizen, 157
lean tools, 31, 51–57
overview graphic, 52
process, 31–32
ProcessArc comprehension test, 210
product synchronization map (PSM), 52, 54–57, 158
SIPOC mapping, 52–54
tools, 32, 51–57
vital Xs and implementable solutions, 157
X-functional, 72–76
Process road map (see Process mapping)
Process sigma (see Z score)
Process waste as tangible cost, 9
ProcessArc comprehension test
answers, 219–220
questions, 209–217
Product synchronization map (PSM), 52, 54–57, 158
Productivity/process improvement, LSS, 20–22
Project Champion/Sponsor:
Analyze phase, 114, 149
Define phase, 32–33, 36, 47–51, 57, 59, 67
described, 23, 26
Improve phase, 161, 163
LLS organization, 23–24, 26
role described, 47–48
Project leader:
end of project, 203–207
role described, 47–48
wrap-up celebration, 204
Project scope, business case, 44, 46
Q
Quality:
building sustainable culture of, 3–5
customer needs mapping, 41–42
metrics, 2–5
study of award winners, 3
Quality plans, process control, 187–188
Questions to ask at phase end (see specific phases)
R
Random sampling, 94
Rational subgrouping sampling, 95
Reactive one-at-a-time changes, as operational challenge, 7
Rectangle (step) symbols on process map, 74
Regression, 157, 174–177
Relevant in SMART criteria, 44
Repeatability, measurement system analysis, 99, 100–102
Reproducibility, measurement system analysis, 99, 102–103
Resources and support, business case, 50
Responsiveness, Six Sigma key deliverables, 16
Revenue, increased, 10, 16
Rework as tangible cost, 9–10
Risk priority number (RPN) calculation, 80–81, 83
Road map (see Process mapping)
Root cause, mistake-proofing, 192
RPN (risk priority number) calculation, 80–81, 83
Run chart, 114, 116–117
S
Sampling data, 93–96
Scatter plot, 143, 174
Seiketsu, 5S, 164–165
Seiri, 5S, 164–165
Seiso, 5S, 164–165
Seiton, 5S, 164
Service reliability, 16, 41–42

Service work, as invisible, 12–13
Shared need identification milestone, 59
Shitsuke, 5S, 164–165
Sigma, process (see Z score)
Sigma score, 15–16
Simple statistics, vital Xs, 170–177
Simplify, kaizen events, 159
SIPOC mapping, 52–54, 56, 73
Six Sigma:
about, 19
defined, 14–15
key deliverables, 16
sigma score, 15–16
Six Sigma tools:
Analyze phase, 112
cause-and-effect (fishbone) diagram, 72, 76–78, 107
variation, identify sources of, 133, 140–148
Skewed distribution, 123
SMART criteria, Define phase, 44
Solutions, mistake-proofing, 192
Sort, kaizen events, 159
SPC (statistical process control), 193–197
Special-cause variation, SPC, 196–197
Specific in SMART criteria, 44
Specification limits, performance standards, 85, 88
Sponsor, kaizen events, 161
Sponsors (see Project Champion/Sponsor)
Stakeholder (see Key stakeholders)
Standard deviation:
described, 124, 127–128
hypothesis testing, 140, 145
Standardize, kaizen events, 160
Statistical process control (SPC), 193–197
Strategy development, LSS, 20–22
Stratified random sampling, 94
Supplementary team, 47, 49
Suppliers, SIPOC mapping, 52–54
Support and resources, business case, 50
Sustain, kaizen events, 160
Sustainable quality culture, 3–5
Sweep, kaizen events, 159
Symbols on process map, 74
Systematic sampling, 95
T
Takt time, Analyze phase
calculation, 137–139
demand, 138
effection hours, 138
ProcessArc comprehension test, 211
usage, 139–140
variation, identify sources of, 133–134, 137–140, 158
Tangible costs, 9–10
Target performance standards, 85, 88–89
Team charter, 32, 210, 214
Team roles, 44, 47–49, 214
Test (see ProcessArc comprehension test)
Threat vs. opportunity matrix, change management, 60–62
Time-bound in SMART criteria, 44
Tools:
business case, 32
change management, 32, 58–63
correlation (Six Sigma tools), 133, 140–143
CTQ project, 32
fishbone diagram, 72, 76–78, 107
FMEA (failure modes and effects analysis), 72, 78–82
hypothesis test (Six Sigma tools), 133, 143–148
kaizen, 158–169
Lean, 112, 133–140, 158–169
line balancing, 157, 165–168
necessary non-value-add (NNVA), 133–137, 158
non-value-add (NVA), 12, 133–137, 158, 167–169
process mapping, 32, 51–57, 71–76, 106–107
simple statistics, 157, 170–177
SIPOC mapping, 52–54
Six Sigma, 112, 133, 140–148, 157, 170–177
takt time, line balancing (Lean tool), 133–134, 137–140, 158
value-add (VA), 13, 133–137, 158
voice of the customer (VOC), 37–42
Total Quality Control (TQC), 14
Total Quality Management (TQM), 14
Transportation, unnecessary, as waste, 18
T-test, 140, 145–146, 152–153, 211
U
Unit, DPMO, 126
V
VA [see Value-add (VA)]
Validate measurement system (Measure phase), 97–104
about, 97–98, 104–105
accuracy, 98–101
analysis on the Xs (Control phase), 184–185, 216
attribute measurement system analysis, 98–104
case study application, 107–109
goals, 98
overview graphic, 70
precision, 99, 100–103
reasons to understand, 98–99
repeatability, 99, 100–102
reproducibility, 99, 102–103
Value-add (VA):
defined, 135
nonmanufacturing sectors, 13
usage, 135–137
variation, identify sources of, 133–134, 158
Variation, identify sources of (Analyze phase), 132–149
correlation, 133, 140–143
cycle time reduction/process enhancement, 133
hypothesis test, 133, 143–148
Lean tools, 133–137, 158
overview graphic, 132
Six Sigma tools, 133, 140–148
takt time, line balancing, 133–134, 137–140, 158
variation reduction/performance enhancement, 133
z score, 132–133
Vision elevator speech, 62–63
Vision shaping milestone, 59
Vital Xs, 156–157
Vital Xs and implementable solutions (Improve phase), 156–169, 179–181
case study application, 179–181
critical elements, 156–157
cycle time or standardization, 157
kaizen, 158–169
operating parameters, 156–157
overview graphics, 156
piloting solutions, 172–173
process road map, 157
regression, 157, 174–177
simple statistics, 157, 170–177
vital Xs, 156–157
Voice of the customer (VOC), 37–42, 209
W
Waiting as waste, 18
Waste:
cost of, 17
elimination as, 17–18
kaizen, 160–162
kaizen events, 160–161
Lean, 17–18
as tangible cost, 9
Welch, Jack, 14
Wrap-up celebration, 204
(See also End of project)
X
X variables, data collection, 90–92, 216
(See also Vital Xs)
X-functional process map, 72–76
Y
y in Measure phase, 69, 71
Y output, CTQ characteristics, 69, 71–83, 90–92
Z
Z score:
baseline process capability, 112, 120–122, 124–128, 150
defined, 120
discrete and nonnormal data, 124–128
identify sources of variation, 132–133
normal continuous data, 124
ProcessArc comprehension test, 211, 214
reason to calculate, 121–122

ABOUT THE AUTHORSSheila Shaffie
For more than 10 years, Sheila held leadership positions in quality and processmanagement at three General Electric businesses: Plastics, Health Care, and Capital. Asthe cofounder of Process Arc, a Lean and Six Sigma training and consulting firm, a samplelist of her clients includes: GMAC, Associated Bank, US Bank, Guaranty Bank, ThomsonReuters, and Allied Capital.
Sheila has a proven track record in launching global quality initiatives, managing SixSigma process refinement, and delivering quantifiable customer satisfaction. As thedirector of quality, she pioneered the use of Lean and Six Sigma in GE Capital’stransactional environment. Her efforts led to an 80 percent improvement in customerservice levels. Sheila honed her Six Sigma, Transactional Lean, Change Management, andkaizen skills by closing out more than 250 Six Sigma projects and delivering $90 millionin cost reduction. In her career at GE, she trained and led more than 100 Six Sigma GreenBelts and Black Belts globally.
Sheila holds an MBA from the University of Chicago and a BS in chemical engineeringfrom the University of Waterloo. She is GE Six Sigma Green Belt, Black Belt, and MasterBlack Belt certified. She has received additional training in GE’s technical leadership andmanagement development programs, as well as its change acceleration process (CAP)and CAP facilitation.
Shahbaz Shahbazi
Prior to launching ProcessArc, Shahbaz was a leader in General Electric’s Global SixSigma Quality organization focused on strategic business growth. As an expatriate basedin Paris, France, he reformulated a sales and pricing strategy for a $250 million marketand streamlined the commercial launch of new products. He has also led global customersatisfaction initiatives. As the cofounder of ProcessArc, he has helped institutions likeRW Baird, BETA systems, Industrial Bank, Wauwatosa Savings Bank, and Metavantelaunch Lean Six Sigma in their respective organizations. During his career, he has trainedand mentored more than 120 Lean Six Sigma Green Belts and Black Belts globally.
Shahbaz has authored more than 40 strategy reports on product development andoperational efficiency. He has received professional education in transactional lean

methodology, CAP, import/export practices, and GE’s leadership essentials. He holds anMBA from Rensselaer Polytechnic Institute, a master’s in public policy from theUniversity at Albany, State University of New York, and BAs in French literature andMiddle Eastern history from the College at Oneonta, State University of New York. He isSix Sigma Green Belt, BlackBelt, and Master Black Belt certified.