learning, memory, and cognition journal of experimental psychologybhatiasu/bhatia 2017b...
TRANSCRIPT

Journal of Experimental Psychology:Learning, Memory, and CognitionComparing Theories of Reference-Dependent ChoiceSudeep BhatiaOnline First Publication, March 13, 2017. http://dx.doi.org/10.1037/xlm0000384
CITATIONBhatia, S. (2017, March 13). Comparing Theories of Reference-Dependent Choice. Journal ofExperimental Psychology: Learning, Memory, and Cognition. Advance online publication.http://dx.doi.org/10.1037/xlm0000384
Comparing Theories of Reference-Dependent Choice
Sudeep BhatiaUniversity of Pennsylvania
Preferences are influenced by the presence or absence of salient choice options, known as referencepoints. This behavioral tendency is traditionally attributed to the loss aversion and diminishing sensitivityassumptions of prospect theory. In contrast, some psychological research suggests that referencedependence is caused by attentional biases that increase the subjective weighting of the reference point’sprimary attributes. Although both theories are able to successfully account for behavioral findingsinvolving reference dependence, this article shows that these theories make diverging choice predictionswhen available options are inferior to the reference point. It presents the results of 2 studies that usesettings with inferior choice options to compare these 2 theories. The analysis involves quantitative fitsto participant-level choice data, and the results indicate that most participants are better described bymodels with attentional bias than they are by models with loss aversion and diminishing sensitivity.These differences appear to be caused by violations of loss aversion and diminishing sensitivity in losses.
Keywords: multiattribute choice, reference dependence, endowment effect, prospect theory, attention
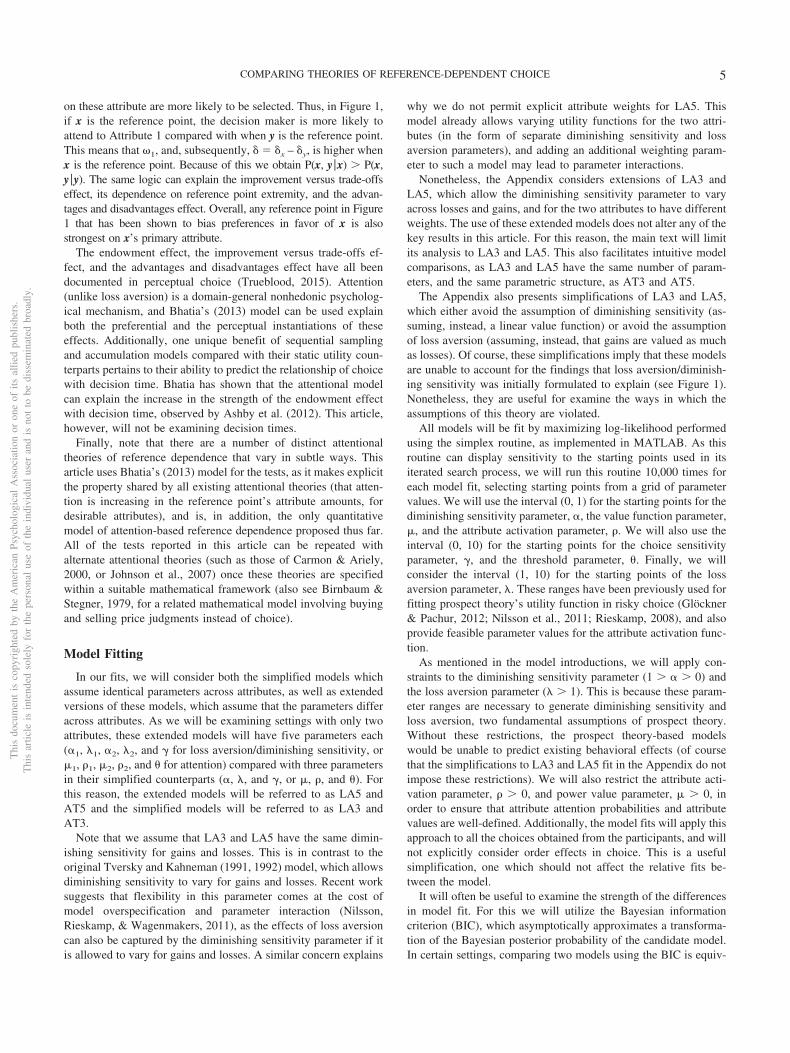
Reference dependence is one of the most studied phenomena inthe domain of multiattribute preferential choice. According toresearch on reference dependence, salient choice options such asendowments, expectations, and aspirations affect a decision mak-er’s preferences. Changing these reference points can reversechoices, subsequently violating choice consistency assumptionsfundamental to theories of rational choice (Kahneman, Knetsch, &Thaler, 1991; Knetsch, 1989; Knetsch & Sinden, 1984; Samuelson& Zeckhauser, 1988; Thaler, 1980; Tversky & Kahneman, 1991).These violations have powerful implications for economic andconsumer behavior, and, as a result, have received considerableattention from scholars of economics, marketing, and related fields(see, e.g., Hardie, Johnson, & Fader, 1993, and Kahneman, Knet-sch, & Thaler, 1990). Reference dependence is also a robustfeature of preferential choice. Subsequently, characterizing thecognitive mechanisms underlying reference dependence has be-come an important goal for psychologists interested in understand-ing human decision making (Ashby, Dickert, & Glöckner, 2012;Ashby, Walasek, & Glöckner, 2015; Bhatia, 2013; Carmon &Ariely, 2000; Herne, 1998; Johnson, Häubl, & Keinan, 2007;Trueblood, 2015; Tversky & Kahneman, 1991; Willemsen, Böck-enholt, & Johnson, 2011).
Reference dependence is typically explained using multiattrib-ute extensions of prospect theory (Köszegi & Rabin, 2006; Tver-sky & Kahneman, 1991). According to this account of referencedependence, decision makers process choice options in terms of
gains and losses relative to the attribute values of the referencepoint. Additionally, decision makers are assumed to display astrong aversion to losses as well as diminishing sensitivity in bothlosses and gains. These assumptions provide an explanation formany of the reference-dependent choice behaviors observed thusfar. These include the finding that reference points are oftenpreferred over competing options (e.g., the endowment effect), andthe finding that options that are clear improvements over thereference point and options that involve only small trade-offs fromthe reference point, are often chosen over options involving largetrade-offs from reference point (Herne, 1998; Kahneman et al.,1991; Trueblood, 2015; Tversky & Kahneman, 1991).
Loss aversion and diminishing sensitivity are not, however, theonly cognitive mechanisms capable of predicting reference-dependent choice. Recent work has argued that reference pointsalter the attention paid toward the attributes in the decision (Bhatia,2013; Carmon & Ariely, 2000; Johnson et al., 2007; see alsoBirnbaum & Stegner, 1979, for a very similar early theory).Making a certain object a reference point increases attention to-ward the attributes associated with the object. This increases theweighting of these attributes, subsequently biasing choice.
By now, there is considerable process-level data supporting thismechanism. Memory and attention biases in favor of the attributesof endowments have been observed for choice options as diverseas sports tickets (Carmon & Ariely, 2000), mugs (Johnson et al.,2007) and consumer goods (Nayakankuppam & Mishra, 2005),using thought-listing (Johnson et al., 2007), mouse-tracking (Wil-lemsen et al., 2011), eye-tracking (Ashby et al., 2015), recall(Nayakankuppam & Mishra, 2005), and a variety of other mea-sures. Additionally, key reference point effects have been repli-cated in perceptual decision making, indicating that the mecha-nisms underlying reference dependence may be more general thanloss aversion (which is fundamentally hedonic and typically ap-plies only to preferential choice; Trueblood, 2015). Finally, Bhatia(2013) has provided a formal model of the attentional theory ofreference dependence, and has shown that this model accurately
Funding was received from the Carnegie Mellon Center for BehavioralDecision Research. Thanks to Jerome Busemeyer, Russell Golman, GeorgeLoewenstein, and Robert Sugden for valuable comments, and to AllisonMa and Grace Chung for assistance with experiments.
Correspondence concerning this article should be addressed to SudeepBhatia, Department of Psychology, University of Pennsylvania, 3720 Wal-nut Street, Philadelphia PA, 19104. E-mail: [email protected]
Thi
sdo
cum
ent
isco
pyri
ghte
dby
the
Am
eric
anPs
ycho
logi
cal
Ass
ocia
tion
oron
eof
itsal
lied
publ
ishe
rs.
Thi
sar
ticle
isin
tend
edso
lely
for
the
pers
onal
use
ofth
ein
divi
dual
user
and
isno
tto
bedi
ssem
inat
edbr
oadl
y.
Journal of Experimental Psychology:Learning, Memory, and Cognition
© 2017 American Psychological Association
2017, Vol. 1, No. 2, 0000278-7393/17/$12.00 http://dx.doi.org/10.1037/xlm0000384
1
predicts a wide range of observed reference-dependent behaviors,including those generally attributed to loss aversion.
So is reference dependence caused by attentional bias or by acombination of loss aversion and diminishing sensitivity? Al-though process-level data does support the attentional account, thechoice predictions of these two theories have not yet been rigor-ously compared: Empirical work on this topic has examined onlythe settings in which the two theories make the same predictions,and this work has typically examined only qualitative choicepatterns. Predicting choice accurately is the primary goal of anyformal theory of decision making, and quantitatively comparingdiverging choice predictions of attention and loss-aversion/diminishing-sensitivity can provide a rigorous test of the twotheories of reference dependence.
This article attempts such a test. It presents the results of twostudies with choice data for participants under the influence ofreference points. These studies involve choices in settings in whichattention and loss aversion/diminishing sensitivity theories makediverging predictions (as well as settings in which they makeconverging predictions). In order to compare the two theories,various specifications of the theories are applied to data on aparticipant level and evaluated in terms of their overall quantitativefit.
Reference-Dependent Choice
Traditional economic theories of behavior assume that decisionmakers’ choices do not depend on salient but irrelevant options,such as their current endowments. Owning a particular optionshould not make that option more or less desirable compared withother options available to the decision maker. A very large numberof behavioral experiments have shown this assumption to beincorrect. Endowing decision makers with a particular option, andmaking that option a reference point, increases the overall choiceprobability of that option, potentially generating preference rever-sals (Bateman, Munro, Rhodes, Starmer, & Sugden, 1997; Birn-baum & Stegner, 1979; Kahneman et al., 1990; Knetsch, 1989;Loewenstein & Adler, 1995; Samuelson & Zeckhauser, 1988;Tversky & Kahneman, 1991).
This result has been the focus of much empirical enquiry inpsychology, economics, and marketing. Scholars of decision mak-ing in these fields have, by now, identified a series of systematicbehaviors associated with reference dependence. These behaviorspertain to the effects of different types of reference points onbinary forced choice, and serve as descriptive benchmarks for anyformal theory of reference-dependent decision making.
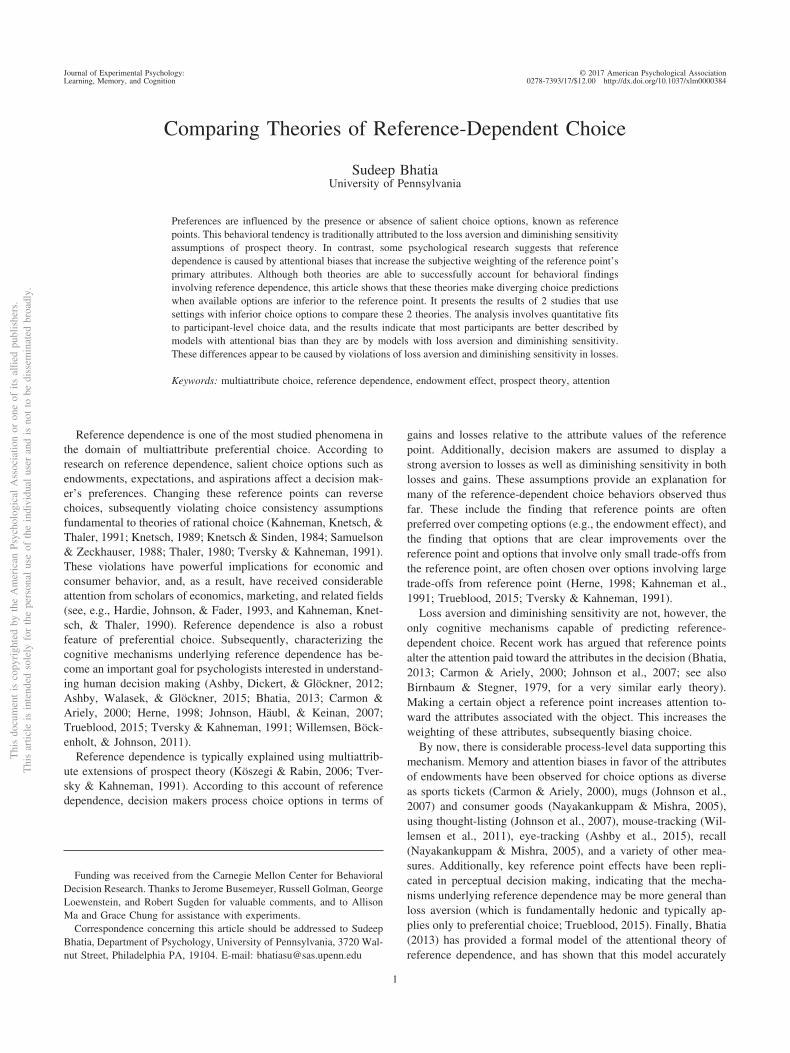
In the standard reference-dependent choice task, the decisionmaker is given a choice between two options, x and y. Theseoptions can be seen as being defined on a set of n attributes, andthus can be written in vector notation as x � (x1, x2, . . . xn) andy � (y1, y2, . . . yn). A reference point is some other salient optionr � (r1, r2, . . . rn) that affects the choice between x and y. For anychoice options x and y, and any reference point r, we can write theprobability of choosing x over y given r as P(x, y |r).
The best-known finding on reference dependence is the endow-ment effect. In the typical endowment effect experiment, partici-pants are given a choice between two everyday items. Prior to thischoice, they are told that they own one of the two items. Theseexperiments typically find that the choice probability of an item is
higher if decision makers are endowed with it compared with ifthey are not, and that altering the item that decision makers areendowed with often reverses the relative choice proportion of thetwo items. Thus, for example, Knetsch (1989) found that 89% ofparticipants preferred a mug over a candy bar if they were initiallyendowed with the mug. In contrast, only 10% of participantspreferred a mug over a candy bar if they were initially endowedwith the candy bar. Related experiments find similar results withwillingness-to-pay and willingness-to-accept measures (buyingand selling prices) for endowed and nonendowed items.
This type of result also holds for nonendowed but salient op-tions, such as past endowments, aspirations, endowments of oth-ers, objects in the immediate environment, and expected endow-ments (Bushong, King, Camerer, & Rangel, 2010; Clark &Oswald, 1996; Dhar & Simonson, 1992; Heath, Larrick, & Wu,1999; Krajbich, Armel, & Rangel, 2010; Strahilevitz & Loewen-stein, 1998). In all of these cases, making an option a referencepoint increases its choice probability. In a choice between twooptions x and y, as in Figure 1, this implies that P(x, y |x) �P(x, y |y), that is, x is more likely to be chosen over y if it is thereference point compared with if y is the reference point.
A second finding is known as the improvements versus trade-offs effect (Herne, 1998; Tversky & Kahneman, 1991). This find-ing has been demonstrated using experiments in which differentdecision makers are endowed with different items, although, likethe endowment effect, it also extends to reference points that arenot actual endowments. In all of these settings, the improvementsversus trade-offs effect refers to the increased preference for anoption if it dominates the reference point (that is, if it is better thanthe reference point on at least one attribute and not worse than thereference point on every other attribute) compared with if theoption involves trade-offs from the reference point. Thus, forexample, in Tversky and Kahneman’s (1991) study, 81% of par-ticipants initially endowed with a free dinner chose an option
Figure 1. Reference-dependent anomalies in choice. Here, x and y rep-resent choice alternatives, and r and s represent reference points.
Thi
sdo
cum
ent
isco
pyri
ghte
dby
the
Am
eric
anPs
ycho
logi
cal
Ass
ocia
tion
oron
eof
itsal
lied
publ
ishe
rs.
Thi
sar
ticle
isin
tend
edso
lely
for
the
pers
onal
use
ofth
ein
divi
dual
user
and
isno
tto
bedi
ssem
inat
edbr
oadl
y.
2 BHATIA
offering two free dinners over an option offering a photo portraitand a calendar. In contrast, only 52% of participants chose thisoption if they were first endowed with a single calendar. Ingeneral, this effect emerges both when the reference point isdominated on its primary attribute (Tversky & Kahneman, 1991)and when it is dominated on its secondary attribute (Herne, 1998).In Figure 1, this implies that P(x, y |r1) � P(x, y |s1) and P(x, y |r2) �P(x, y |s2), respectively, that is, making the reference point r1
instead of s1 or r2 instead of s2 increases the choice probability ofx over y.
A related set of findings pertain to the extremity of the domi-nated reference point. Particularly, Herne (1998) finds that areference point has a stronger effect on the choice probability of itsdominating option if the reference point has a higher value on itsprimary attribute or if it has a lower value on its secondaryattribute. Thus, increasing the relative amount of the referencepoint’s primary attribute should increase the choice probability ofthe option dominating the reference point. In Figure 1, this impliesthat P(x, y |r1) – P(x, y |s1) � P(x, y |r3) – P(x, y |s3) and P(x, y |r4) �P(x, y |s4) � P(x, y |r2) – P(x, y |s2), that is, the improvement in thechoice share of x over y is higher when the reference pointswitches from s1 to r1 and from s4 to r4, than when it switches froms3 to r3 or from s2 to r2, respectively.
A final finding is known as the advantages and disadvantageseffect (Tversky & Kahneman, 1991). This, too, has been demon-strated using experiments in which different decision makers areendowed with different items, although, again, this effect extendsto reference points that are not actual endowments. Overall, theadvantages and disadvantages effect refers to the increased pref-erence for an option if it involves small trade-offs from thereference point compared with if the option involves large trade-offs from the reference point. Thus, for example, in Tversky andKahneman’s (1991) experiment, 70% of participants preferred ajob offering small amounts of social contact and a 20-min com-mute time over a job offering moderate social contact and a 60-mincommute time, if they were first endowed with a job offeringalmost no social contact and a 10-min commute time. This choiceshare reduced to 33% if participants were endowed with a joboffering a lot of social contact and an 80-min commute time. InFigure 1, the advantages and disadvantages effect implies thatP(x, y |r5) � P(x, y |s5), that is- making the reference point r5
instead of s5 increases the choice probability of x over y.It is valuable to note that the improvements versus trade-offs
and advantages and disadvantages effects are very similar to theasymmetric dominance and compromise effects (Huber, Payne, &Puto, 1982; Simonson, 1989), which also involve divergent pref-erences based on dominance and trade-offs. Indeed, as outlined inthe Discussion section, it is likely that both sets of findings stemfrom the same mechanism. That said, the improvements versustrade-offs and advantages and disadvantages effects involve achange in the reference point while keeping the composition of thechoice set constant. Thus, participants in one condition may beendowed with an item dominated by x, and participants in a secondcondition may be endowed with an item dominated by y, but thechoice is between x and y in both conditions. In contrast, theasymmetric dominance and compromise effects involve a changein the composition of the choice set without any change inthe endowment. Thus, participants in one condition have to choosebetween x, y, and an item dominated by x, whereas participants in
another condition have to choose between x, y, and an itemdominated by y, but there are no changes to the endowments acrossconditions.
Theories of Reference Dependence
Loss Aversion and Diminishing Sensitivity
What are the psychological processes that generate these behav-iors? Tversky and Kahneman (1991) argued that these behaviorscan be explained using the key assumptions of prospect theory (seealso Kahneman et al., 1990, 1991; Köszegi & Rabin, 2006; Thaler,1980). According to Tversky and Kahneman, decision makersevaluate the available options not in terms of absolute amounts ofeach of the attributes in the options, but rather in terms of theseamounts relative to the reference point. Additionally, losses areassumed to be more undesirable than corresponding gains aredesirable (an assumption known as loss aversion), and both lossesand gains are assumed to display diminishing sensitivity.
The prospect theory account of reference dependence is formal-ized using a utility maximization model. Utility models describepreferences for the various options using deterministic, static util-ity functions. For any options x and y and any reference point r, wecan write the utilities for x and y under the influence of r as U(x |r)and U(y |r). The probability of choosing x over y is typically givenby a logistic transform of the difference in the utilities of x and y.This is formalized as
P(x, y |r) � 11 � e��·[U(x | r)�U(y | r)] (1)
In Equation 1, � is a constant that determines the decisionmaker’s sensitivity to the utility difference between x and y. Largevalues of � correspond to lower randomness in choice, and � � 0corresponds to perfectly random choice. For all � � 0, x is morelikely to be chosen over y whenever U(x |r) � U(y |r).
Overall, the utility for an option is assumed to be a simple sumof the option’s attribute values (Köszegi & Rabin, 2006; Tversky& Kahneman, 1991). This implies that we can write U(x |r) as
U(x |r) � �i�1N Ui�xi |ri� (2)
Here, Ui are utility functions that apply the assumptions of lossaversion and diminishing sensitivity separately to each attribute.Although there are many ways to formalize these assumptions, thestandard approach uses prospect theory’s valuation function pro-posed by Tversky and Kahneman (1992). This is written as
Ui(xi |ri) � ��xi � ri�� if xi � ri
�� · �ri � xi�� if ri � xi(3)
Prospect theory’s value function assumes that loss aversion, spec-ified by the parameter � � 1, applies multiplicatively for losses.Additionally, diminishing sensitivity on both gains and losses is givenby a power value function, specified by the parameter �: � is re-stricted to the interval (0, 1) to ensure diminishing sensitivity.
It is easy to see how this model is able to explain the endowmenteffect. With the assumption of loss aversion, negative deviationsfrom a reference point hurt more than equivalent positive devia-tions are desirable. Thus, in Figure 1, if x is the reference point,staying with x does not lead to an increase or decrease in utility,
Thi
sdo
cum
ent
isco
pyri
ghte
dby
the
Am
eric
anPs
ycho
logi
cal
Ass
ocia
tion
oron
eof
itsal
lied
publ
ishe
rs.
Thi
sar
ticle
isin
tend
edso
lely
for
the
pers
onal
use
ofth
ein
divi
dual
user
and
isno
tto
bedi
ssem
inat
edbr
oadl
y.
3COMPARING THEORIES OF REFERENCE-DEPENDENT CHOICE
and if y is the reference point, staying with y does not lead to anincrease or decrease in utility. Moving from x to y or from y to xcan, however, decrease utility because of loss aversion. This im-plies that it is more desirable to choose x over y when x is thereference point compared with when y is the reference point.
A similar logic can explain the improvements versus trade-offseffect and the advantages and disadvantages effect. With theadditional assumption that both gains and losses display diminish-ing sensitivity, this theory can also explain the extremity-basedmoderators of the improvements versus trade-offs effect, whichinvolves trading off gains and losses of different magnitudes.
Attentional Bias
A combination of loss aversion and diminishing sensitivity isnot the only mechanism that can be at play in reference-dependentchoice. As mentioned process-level data suggest that referencepoints determine the decision maker’s attention toward attributesand, subsequently, the weights decision makers place on the attri-butes (Ashby et al., 2012, 2015; Carmon & Ariely, 2000; Johnsonet al., 2007; Nayakankuppam & Mishra, 2005; Pachur & Scheibe-henne, 2012; Willemsen et al., 2011). Changing reference pointsaffects these attentional weights and can reverse choice.
Bhatia (2013) has specified an attentional theory of referencedependence within a sequential sampling model of preferenceaccumulation. These types of models are frequently used to un-derstand the psychological processes underlying preferentialchoice (Bhatia, 2014, in press; Bhatia & Mullett, 2016; Busemeyer& Townsend, 1993; Dai & Busemeyer, 2014; Krajbich et al., 2010;Roe, Busemeyer, & Townsend, 2001; Trueblood, Brown, &Heathcote, 2014; Tsetsos, Chater, & Usher, 2012; Usher & Mc-Clelland, 2004). They provide predictions regarding responsetimes and confidence, and are also able to instantiate optimalspeed–accuracy trade-offs for sequentially sampled information.Beyond this, sequential sampling and accumulation models pro-vide a biologically and physiologically plausible perspective ondecision making, and computations corresponding to sequentialinformation accumulation have been observed in human and ani-mal brains (see, e.g., Bogacz, Brown, Moehlis, Holmes, & Cohen,2006; Gold & Shadlen, 2007; Ratcliff & Smith, 2004).
According to Bhatia’s (2013) model, reference points activateattributes based on their associations with these attributes. Theassociation between an attribute and a reference point is assumedto be equal to the amount of the attribute in the reference point, andthe attention probability of an attribute is assumed to be equal tothe activation of the attribute compared with the activation of allother attributes. For an attribute i and a reference point r, thisattention probability is given by
i � � ri
�k�1n
� rk
(4)
Here, � determines the overall baseline activation of the attri-butes, independent of the reference point. Note that as � increases,the relative effect of the reference point on attribute activationdecreases. For very large values of � the reference point has almostno effect on choice. In this article, it is assumed that � � 0.
Once an attribute is attended to, it is evaluated and aggre-gated into the preferences for the available choice options. Fora choice option x, we can write the value functions that perform
this evaluation as Vi(xi), which we assume are a given by a(reference-independent) power function. For parameter - � 0this function is
Vi(xi) � xi� (5)
In Bhatia’s (2013) model, the decision maker is assumed toattend to each attribute sequentially. Changing reference points canalter choice by affecting attention probabilities. In order to facili-tate model fitting, we will simplify Bhatia’s sequential samplingassumption while nonetheless allowing for reference points toaffect attribute attention. In particular, we will assume that thedynamics of the preference accumulation process are specified bya basic form of decision field theory (Busemeyer & Townsend,1993; also see Bhatia, 2014, and Rieskamp, 2008). According tothis simplification, the change in relative preference at any giventime is normally distributed with mean � x – y and variance�2 � �x
2 � �y2 – 2 · �xy. Here, x is the expected sampling value for
x, given by �x � �i�1n i · Vi�xi�, and �x
2 is the variance of thesampling value of x, given by x
2 � �i�1n i · �Vi�xi� � �x�2; y and �y
2
are similarity defined, and �xy is the sampling covariance of the valuesof x and y, given by xy � �i�1
n i · �Vi�xi� � �x� · �Vi�yi� � �y�.Decision makers are assumed to use a single accumulator to
aggregate relative preferences to a positive threshold or a neg-ative threshold – . If is crossed, then the decision maker selectsx, and if – is crossed, the decision maker selects y. As in priorexperimental tests of decision field theory (such as Rieskamp,2008), we assume that corresponds to �/� of the originaldecision field theory model. With this structure, the overall choiceprobability of x over y given a reference point r is
P(x, y |r) � 1
1 � e�2·�·�
(6)
Equation 6 is highly similar to Equation 1, and if we restricted� � 2 we would obtain a utility based representation for theattentional model, that is passed through a logistic transform todetermine choice. This alternate specification of the attentionalmodel will not be studied in this article, as it lacks psychologicalrationale and additionally shares its modal choice predictions withthe specification described by Equation 6.
Note that the mathematical structure outlined here highlightssome of the key differences between the two theories. The majordifference is with loss aversion: The attentional theory does notdistinguish between gains and losses, and thus does not (explicitly)emphasize losses more than gains. For this reason, the attentionaltheory also does not impose diminishing sensitivity in both lossesand gains. The curvature of the value function is largely identical(either concave, reflecting diminishing sensitivity, or convex, re-flecting increasing sensitivity) for all attribute amounts, indepen-dent of the reference point. Instead of loss aversion and diminish-ing sensitivity in losses and gains, the attentional theory assumesbiased attention, which overweighs or underweighs the attributes,depending on the reference point.
It is easy to see how biased attention can explain the endowmenteffect. As attribute attention probabilities are increasing in theamounts of the attributes in the reference point, attributes that arehighly present in the reference point are most likely to be attendedto. These are the attributes that are then accumulated into prefer-ences. Subsequently, choice options that are particularly desirable
Thi
sdo
cum
ent
isco
pyri
ghte
dby
the
Am
eric
anPs
ycho
logi
cal
Ass
ocia
tion
oron
eof
itsal
lied
publ
ishe
rs.
Thi
sar
ticle
isin
tend
edso
lely
for
the
pers
onal
use
ofth
ein
divi
dual
user
and
isno
tto
bedi
ssem
inat
edbr
oadl
y.
4 BHATIA
on these attribute are more likely to be selected. Thus, in Figure 1,if x is the reference point, the decision maker is more likely toattend to Attribute 1 compared with when y is the reference point.This means that �1, and, subsequently, � x – y, is higher whenx is the reference point. Because of this we obtain P(x, y |x) � P(x,y |y). The same logic can explain the improvement versus trade-offseffect, its dependence on reference point extremity, and the advan-tages and disadvantages effect. Overall, any reference point in Figure1 that has been shown to bias preferences in favor of x is alsostrongest on x’s primary attribute.
The endowment effect, the improvement versus trade-offs ef-fect, and the advantages and disadvantages effect have all beendocumented in perceptual choice (Trueblood, 2015). Attention(unlike loss aversion) is a domain-general nonhedonic psycholog-ical mechanism, and Bhatia’s (2013) model can be used explainboth the preferential and the perceptual instantiations of theseeffects. Additionally, one unique benefit of sequential samplingand accumulation models compared with their static utility coun-terparts pertains to their ability to predict the relationship of choicewith decision time. Bhatia has shown that the attentional modelcan explain the increase in the strength of the endowment effectwith decision time, observed by Ashby et al. (2012). This article,however, will not be examining decision times.
Finally, note that there are a number of distinct attentionaltheories of reference dependence that vary in subtle ways. Thisarticle uses Bhatia’s (2013) model for the tests, as it makes explicitthe property shared by all existing attentional theories (that atten-tion is increasing in the reference point’s attribute amounts, fordesirable attributes), and is, in addition, the only quantitativemodel of attention-based reference dependence proposed thus far.All of the tests reported in this article can be repeated withalternate attentional theories (such as those of Carmon & Ariely,2000, or Johnson et al., 2007) once these theories are specifiedwithin a suitable mathematical framework (also see Birnbaum &Stegner, 1979, for a related mathematical model involving buyingand selling price judgments instead of choice).
Model Fitting
In our fits, we will consider both the simplified models whichassume identical parameters across attributes, as well as extendedversions of these models, which assume that the parameters differacross attributes. As we will be examining settings with only twoattributes, these extended models will have five parameters each(�1, �1, �2, �2, and � for loss aversion/diminishing sensitivity, or1, �1, 2, �2, and for attention) compared with three parametersin their simplified counterparts (�, �, and �, or , �, and ). Forthis reason, the extended models will be referred to as LA5 andAT5 and the simplified models will be referred to as LA3 andAT3.
Note that we assume that LA3 and LA5 have the same dimin-ishing sensitivity for gains and losses. This is in contrast to theoriginal Tversky and Kahneman (1991, 1992) model, which allowsdiminishing sensitivity to vary for gains and losses. Recent worksuggests that flexibility in this parameter comes at the cost ofmodel overspecification and parameter interaction (Nilsson,Rieskamp, & Wagenmakers, 2011), as the effects of loss aversioncan also be captured by the diminishing sensitivity parameter if itis allowed to vary for gains and losses. A similar concern explains
why we do not permit explicit attribute weights for LA5. Thismodel already allows varying utility functions for the two attri-butes (in the form of separate diminishing sensitivity and lossaversion parameters), and adding an additional weighting param-eter to such a model may lead to parameter interactions.
Nonetheless, the Appendix considers extensions of LA3 andLA5, which allow the diminishing sensitivity parameter to varyacross losses and gains, and for the two attributes to have differentweights. The use of these extended models does not alter any of thekey results in this article. For this reason, the main text will limitits analysis to LA3 and LA5. This also facilitates intuitive modelcomparisons, as LA3 and LA5 have the same number of param-eters, and the same parametric structure, as AT3 and AT5.
The Appendix also presents simplifications of LA3 and LA5,which either avoid the assumption of diminishing sensitivity (as-suming, instead, a linear value function) or avoid the assumptionof loss aversion (assuming, instead, that gains are valued as muchas losses). Of course, these simplifications imply that these modelsare unable to account for the findings that loss aversion/diminish-ing sensitivity was initially formulated to explain (see Figure 1).Nonetheless, they are useful for examine the ways in which theassumptions of this theory are violated.
All models will be fit by maximizing log-likelihood performedusing the simplex routine, as implemented in MATLAB. As thisroutine can display sensitivity to the starting points used in itsiterated search process, we will run this routine 10,000 times foreach model fit, selecting starting points from a grid of parametervalues. We will use the interval (0, 1) for the starting points for thediminishing sensitivity parameter, �, the value function parameter,, and the attribute activation parameter, �. We will also use theinterval (0, 10) for the starting points for the choice sensitivityparameter, �, and the threshold parameter, . Finally, we willconsider the interval (1, 10) for the starting points of the lossaversion parameter, �. These ranges have been previously used forfitting prospect theory’s utility function in risky choice (Glöckner& Pachur, 2012; Nilsson et al., 2011; Rieskamp, 2008), and alsoprovide feasible parameter values for the attribute activation func-tion.
As mentioned in the model introductions, we will apply con-straints to the diminishing sensitivity parameter (1 � � � 0) andthe loss aversion parameter (� � 1). This is because these param-eter ranges are necessary to generate diminishing sensitivity andloss aversion, two fundamental assumptions of prospect theory.Without these restrictions, the prospect theory-based modelswould be unable to predict existing behavioral effects (of coursethat the simplifications to LA3 and LA5 fit in the Appendix do notimpose these restrictions). We will also restrict the attribute acti-vation parameter, � � 0, and power value parameter, � 0, inorder to ensure that attribute attention probabilities and attributevalues are well-defined. Additionally, the model fits will apply thisapproach to all the choices obtained from the participants, and willnot explicitly consider order effects in choice. This is a usefulsimplification, one which should not affect the relative fits be-tween the model.
It will often be useful to examine the strength of the differencesin model fit. For this we will utilize the Bayesian informationcriterion (BIC), which asymptotically approximates a transforma-tion of the Bayesian posterior probability of the candidate model.In certain settings, comparing two models using the BIC is equiv-
Thi
sdo
cum
ent
isco
pyri
ghte
dby
the
Am
eric
anPs
ycho
logi
cal
Ass
ocia
tion
oron
eof
itsal
lied
publ
ishe
rs.
Thi
sar
ticle
isin
tend
edso
lely
for
the
pers
onal
use
ofth
ein
divi
dual
user
and
isno
tto
bedi
ssem
inat
edbr
oadl
y.
5COMPARING THEORIES OF REFERENCE-DEPENDENT CHOICE
alent to model selection based on Bayes factor. The BIC value fora particular model fit on a dataset is specified by
BIC � �2 · L � ln(m) · k (7)
Here, L is the best fit log-likelihood of the model in consider-ation, m is the number of data points, and k is the number offlexible parameters in the model. Models with lower BIC valuesare considered to have better fit.
Diverging Predictions
Before proceeding, let us consider the differences between thetwo theories of reference dependence. This is necessary to estab-lish both whether these two theories are distinguishable, as well asthe type of data we would need to perform an appropriate test ofthe theories.
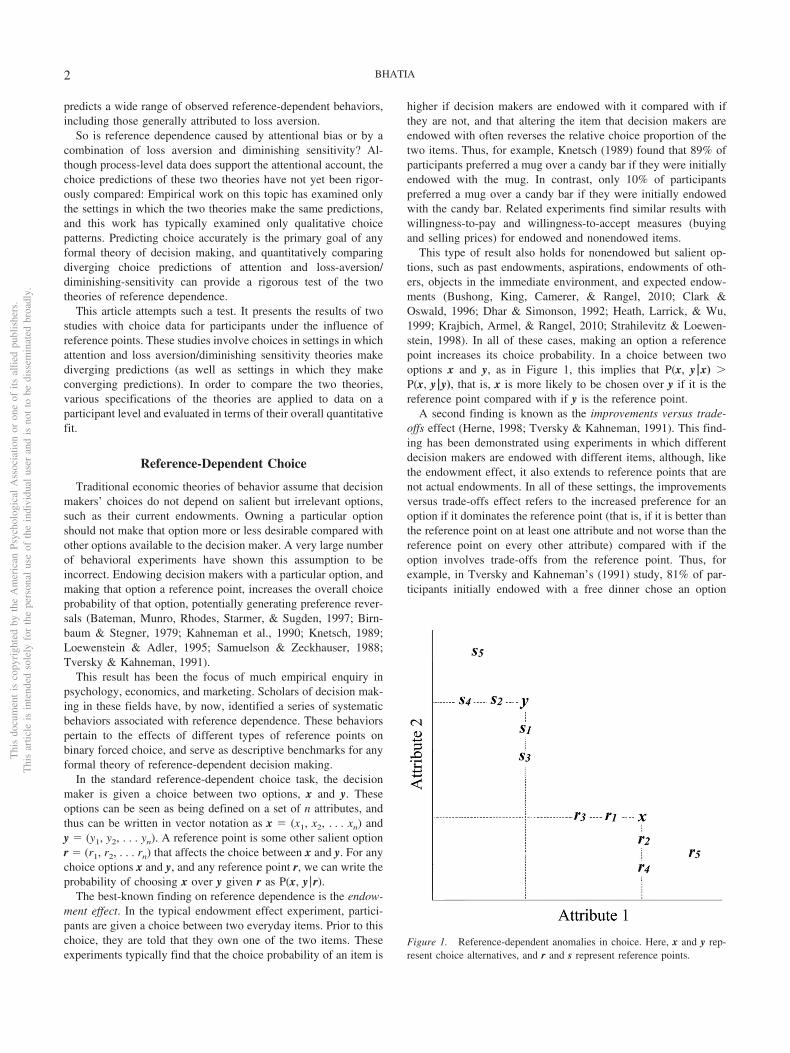
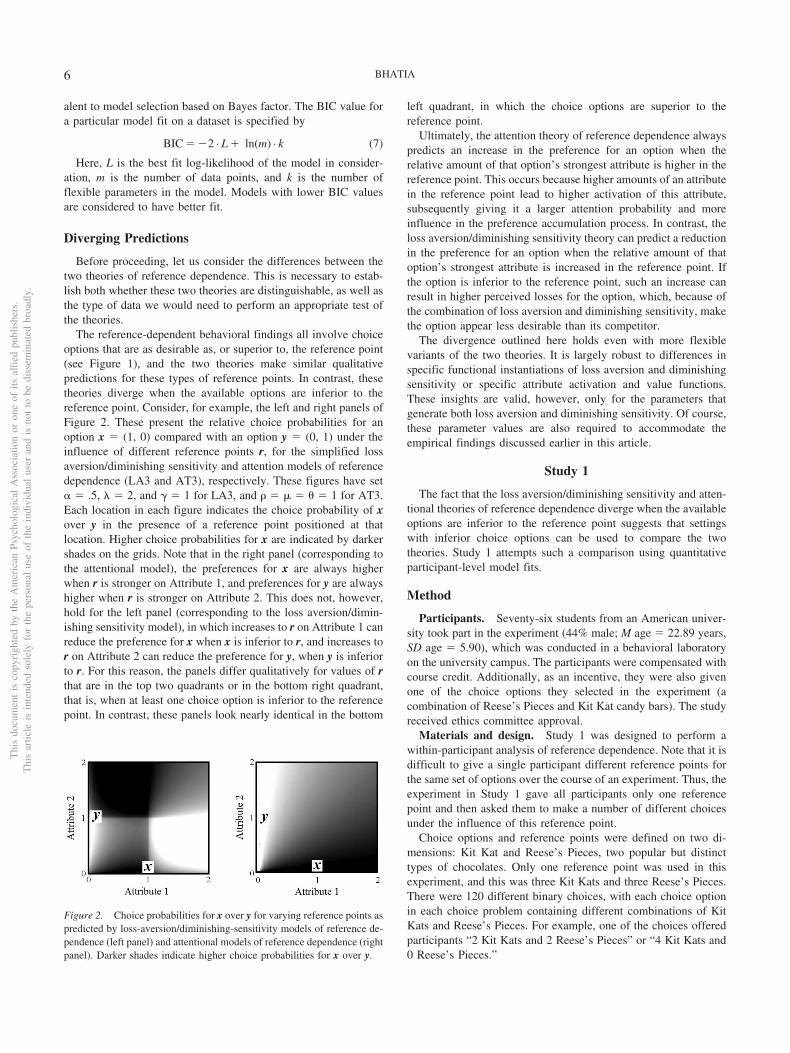
The reference-dependent behavioral findings all involve choiceoptions that are as desirable as, or superior to, the reference point(see Figure 1), and the two theories make similar qualitativepredictions for these types of reference points. In contrast, thesetheories diverge when the available options are inferior to thereference point. Consider, for example, the left and right panels ofFigure 2. These present the relative choice probabilities for anoption x � (1, 0) compared with an option y � (0, 1) under theinfluence of different reference points r, for the simplified lossaversion/diminishing sensitivity and attention models of referencedependence (LA3 and AT3), respectively. These figures have set� � .5, � � 2, and � � 1 for LA3, and � � � � 1 for AT3.Each location in each figure indicates the choice probability of xover y in the presence of a reference point positioned at thatlocation. Higher choice probabilities for x are indicated by darkershades on the grids. Note that in the right panel (corresponding tothe attentional model), the preferences for x are always higherwhen r is stronger on Attribute 1, and preferences for y are alwayshigher when r is stronger on Attribute 2. This does not, however,hold for the left panel (corresponding to the loss aversion/dimin-ishing sensitivity model), in which increases to r on Attribute 1 canreduce the preference for x when x is inferior to r, and increases tor on Attribute 2 can reduce the preference for y, when y is inferiorto r. For this reason, the panels differ qualitatively for values of rthat are in the top two quadrants or in the bottom right quadrant,that is, when at least one choice option is inferior to the referencepoint. In contrast, these panels look nearly identical in the bottom
left quadrant, in which the choice options are superior to thereference point.
Ultimately, the attention theory of reference dependence alwayspredicts an increase in the preference for an option when therelative amount of that option’s strongest attribute is higher in thereference point. This occurs because higher amounts of an attributein the reference point lead to higher activation of this attribute,subsequently giving it a larger attention probability and moreinfluence in the preference accumulation process. In contrast, theloss aversion/diminishing sensitivity theory can predict a reductionin the preference for an option when the relative amount of thatoption’s strongest attribute is increased in the reference point. Ifthe option is inferior to the reference point, such an increase canresult in higher perceived losses for the option, which, because ofthe combination of loss aversion and diminishing sensitivity, makethe option appear less desirable than its competitor.
The divergence outlined here holds even with more flexiblevariants of the two theories. It is largely robust to differences inspecific functional instantiations of loss aversion and diminishingsensitivity or specific attribute activation and value functions.These insights are valid, however, only for the parameters thatgenerate both loss aversion and diminishing sensitivity. Of course,these parameter values are also required to accommodate theempirical findings discussed earlier in this article.
Study 1
The fact that the loss aversion/diminishing sensitivity and atten-tional theories of reference dependence diverge when the availableoptions are inferior to the reference point suggests that settingswith inferior choice options can be used to compare the twotheories. Study 1 attempts such a comparison using quantitativeparticipant-level model fits.
Method
Participants. Seventy-six students from an American univer-sity took part in the experiment (44% male; M age � 22.89 years,SD age � 5.90), which was conducted in a behavioral laboratoryon the university campus. The participants were compensated withcourse credit. Additionally, as an incentive, they were also givenone of the choice options they selected in the experiment (acombination of Reese’s Pieces and Kit Kat candy bars). The studyreceived ethics committee approval.
Materials and design. Study 1 was designed to perform awithin-participant analysis of reference dependence. Note that it isdifficult to give a single participant different reference points forthe same set of options over the course of an experiment. Thus, theexperiment in Study 1 gave all participants only one referencepoint and then asked them to make a number of different choicesunder the influence of this reference point.
Choice options and reference points were defined on two di-mensions: Kit Kat and Reese’s Pieces, two popular but distincttypes of chocolates. Only one reference point was used in thisexperiment, and this was three Kit Kats and three Reese’s Pieces.There were 120 different binary choices, with each choice optionin each choice problem containing different combinations of KitKats and Reese’s Pieces. For example, one of the choices offeredparticipants “2 Kit Kats and 2 Reese’s Pieces” or “4 Kit Kats and0 Reese’s Pieces.”
Figure 2. Choice probabilities for x over y for varying reference points aspredicted by loss-aversion/diminishing-sensitivity models of reference de-pendence (left panel) and attentional models of reference dependence (rightpanel). Darker shades indicate higher choice probabilities for x over y.
Thi
sdo
cum
ent
isco
pyri
ghte
dby
the
Am
eric
anPs
ycho
logi
cal
Ass
ocia
tion
oron
eof
itsal
lied
publ
ishe
rs.
Thi
sar
ticle
isin
tend
edso
lely
for
the
pers
onal
use
ofth
ein
divi
dual
user
and
isno
tto
bedi
ssem
inat
edbr
oadl
y.
6 BHATIA
Choice problems were generated by selecting the number of KitKats and the number of Reese’s Pieces randomly and uniformlyfrom the interval [0, 6] for each choice option, and removingchoice problems in which one option had more of both types ofchocolate than the other, or in which choice options differed by atotal of more than three chocolates. Overall, half of the choiceproblems used in the experiment involved options that were rela-tively inferior to the reference point. As discussed, the attentionaland loss aversion/diminishing sensitivity theories of reference de-pendence make diverging predictions with inferior choice options,implying that the choices used in Study 1 permit a strong quanti-tative test of the two theories.
Note that the choices in this experiment can be described usingthe notation introduced earlier in this article. Particularly, thereference point can be written as r � (3, 3), and different choiceoptions can be written as x � (x1, x2) and y � (y1, y2), with x1 andy1 corresponding to the amount of Kit Kats in the two options andx2 and y2 corresponding to the amount of Reese’s Pieces in the twooptions. The various attentional and loss aversion/diminishingsensitivity models can subsequently be fit on the data obtained inthis experiment, with the techniques specified in Equations 1 to 6.
Procedure. Participants were endowed with the referencepoint, three Kit Kats and three Reese’s Pieces, at the start of theexperiment. This was done by placing the chocolates in front ofeach participant. The participants were told that the chocolateswere theirs (as additional compensation for taking part in theexperiment), but that they may be taken away at the end ofthe experiment. Participants then performed a filler task. After thefiller task, they were asked to answer the 120 choice questions.They were told that after answering the questions, a coin would beflipped. If the coin landed heads they would get their endowment(three Kit Kats and three Reese’s Pieces), but if the coin landedtails, they would not receive this endowment. Instead, one of the120 choice questions they answered would be randomly selectedand their choice in this question would be given to them. Thisdesign allowed us to obtain multiple incentivized choices fromindividual participants. All experimental tasks were performed ona computer interface in private cubicles, with no visual access toother participants. Finally, the reference point (three Kit Kats andthree Reese’s Pieces) was kept in front of the participants as theymade the 120 choices, ensuring that the reference point remainedsalient throughout the experiment.
Results
Choice proportions. Seventy-six participants answered 120choice problems in this experiment, generating a total of 9,120choices. Before examining quantitative model fits to these choices(the primary goal of this article), we can first qualitatively examinethe general patterns in these choices. Overall, participants shoulddisplay a preference for choice options that have a higher totalnumber of chocolates. Similarly, we would also expect participantsto prefer choice options consisting of roughly equal amounts of thetwo chocolates, over options with a high dispersion in the twotypes of chocolates (large amounts of one type of chocolate butsmall amounts of the other). We might also expect participants todisplay a preference for one of the two types of chocolates over theother.
These hypotheses were tested with a single logistic regressionon the entire data. The dependent variable was the choice of theleft option, and the independent variables captured the differ-ence in the total amount of chocolates in the left option relative tothe right option, the difference in dispersion in the left optionrelative to the right option, and whether the left option had moreKit Kats or more Reese’s Pieces relative to right option. Thedispersion of an option was formalized as the absolute value of thedifference between the number of Kit Kats and the number ofReese’s Pieces in that option. The analysis controlled for partici-pant heterogeneity by allowing for participant-level random inter-cepts in the logistic regression.
As expected, the regression revealed a preference for optionswith a higher total number of chocolates (� � 0.36, z � 20.77, p �.01) and a preference for options with a lower dispersion(� � �0.07, z � �9.43, p � .01). Additionally, participantsdisplayed an overall preference for choice options that have moreKit Kats compared with Reese’s Pieces (� � 0.45, z � 20.13, p �.01). Finally, as expected, participants did not have a preferencefor options displayed on the left or right side of the screen (p �0.10).
The analysis also examined whether being superior or inferior tothe reference point has a qualitative effect on the likelihood of achoice option being selected. This was done by separating the dataset into two subsets, the first involving choices between optionsthat dominate the reference point (have more of both types ofchocolates than the reference point) and options that do not dom-inate the reference point, and the second involving choices be-tween options that are dominated by the reference point (have lessof both types of chocolates than the reference point) and optionsthat are not dominated by the reference point. Two logistic regres-sions, testing whether a dominating option was more likely to beselected in the first set, and whether a dominated option was lesslikely to be selected in the second set, were then run. The regres-sions controlled for the difference in the total number of chocolatesin the dominating/dominated option relative to the competitor, thedispersion of the dominating/dominated option relative to thecompetitor, and whether the dominating/dominated option hadmore Kit Kats. These regressions also included participant-levelrandom intercepts. Consistent with the earlier analysis, both re-gressions found that dominating/dominated options with moretotal chocolates, less dispersion, and more Kit Kats than thecompetitor are significantly more likely to be chosen (p � 0.05 forall coefficients). There was not, however, any significant effect ofbeing dominating or being dominated (p � 0.10). This suggests thatthe rankings of attribute values of available options, relative to thereference point, may not play a role in determining choice. Note thatloss aversion/diminishing sensitivity models do assume changes inpreferences based on ordinal comparisons with the reference point,suggesting that these types of models may not be able to provide agood fit to the data.
Model fits. We can more rigorously test the models by fittingthem to choice data, using the techniques specified in the previoussection. For this analysis, each of the four models were fit sepa-rately for each participant, by finding the participant-level param-eters that maximized the log-likelihood of the model for theparticipant.
Using the BIC to compare the model performances of thesimplified models, 72% of participants were better fit by AT3,
Thi
sdo
cum
ent
isco
pyri
ghte
dby
the
Am
eric
anPs
ycho
logi
cal
Ass
ocia
tion
oron
eof
itsal
lied
publ
ishe
rs.
Thi
sar
ticle
isin
tend
edso
lely
for
the
pers
onal
use
ofth
ein
divi
dual
user
and
isno
tto
bedi
ssem
inat
edbr
oadl
y.
7COMPARING THEORIES OF REFERENCE-DEPENDENT CHOICE
whereas 28% were better fit by LA3. Similar differences wereobtained between the extended models, with 83% of participantsbeing better fit by AT5, and 17% being better fit by LA5. Overall,the best-performing of the four models was AT5, which had thelowest median BIC value and also provided the best BIC-based fitto 79% of the participants. Model performance is summarized inTable 1. The Appendix presents model performance for extensionsand simplifications of LA3 and LA5, and shows that relative fitsare largely unchanged.
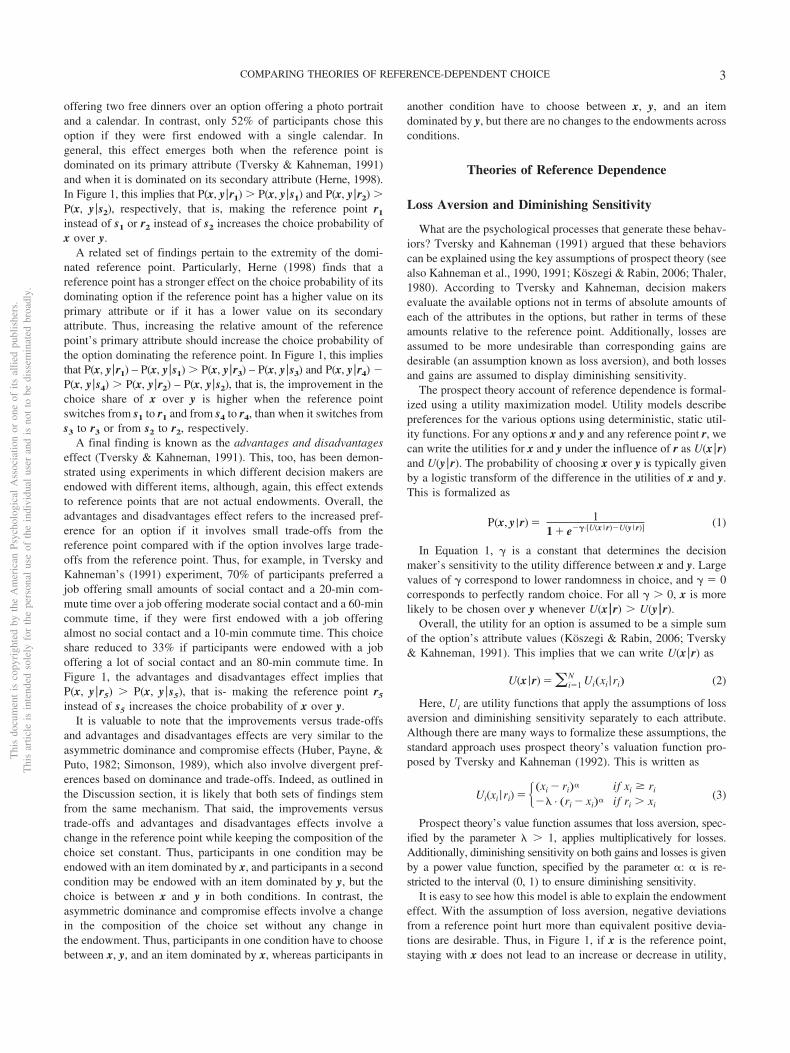
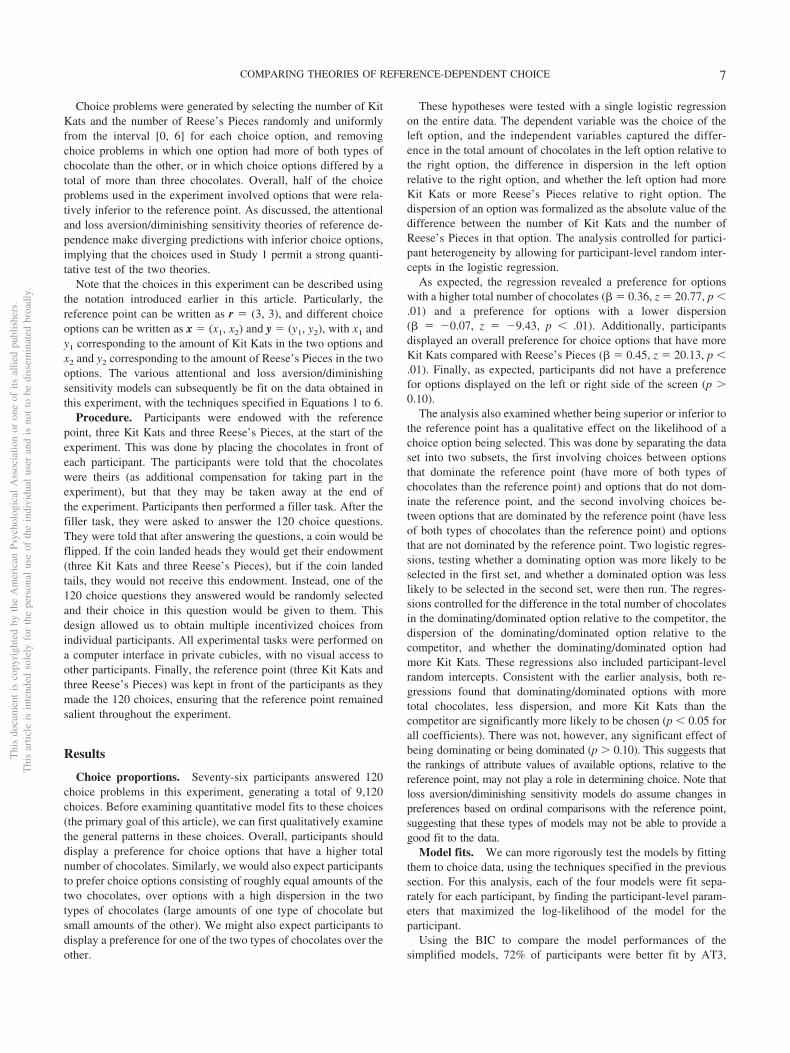
This paper also examined the predictions for each of the modelsfor each participant in each choice problem and compared thesepredictions with the actual choices of the participant. The predic-tions are considered to be accurate if they predict the participant’sactual choice with a probability higher than 0.5 (that is if the modalchoice prediction matches the participant’s actual choice). It foundthat the participant-level fits for the AT3 model could accuratelypredict 60% of all choices, whereas the fits for the LA3 modelcould accurately predict 62% of all choices. This did not reachstatistical significance when evaluated with a logistic regression(p � .05). For the extended models, participant-level fits for AT5were able to accurately predict 91% of all choices, and fits for LA5were able to accurately predict 84% of all choices, which is astatistically significant difference (� � 0.84, z � 17.33, p � .01).AT5 is the best-performing model according to the BIC, and thesetests show that it is also able to give a good overall account of thechoice data. This is displayed in Figure 3, which plots the aggre-gated choice probability for the left option in each of the 120choices, against the aggregated predicted choice probability for theleft option obtained using participant-level fits for AT5.
Parameters. To understand why the attentional models out-perform the loss aversion/diminishing sensitivity models, this pa-per examined the best-fitting parameter values. These parametersare displayed in Table 1. As can be seen in this table, the AT3 andAT5 models do seem to have reasonable values for their param-eters: All of these parameters are well above their lower bound ofzero. Additionally, although the baseline activation parameters forAT5 are fairly high, so is the threshold parameter (which offsetsthe impact of high levels of baseline activation).
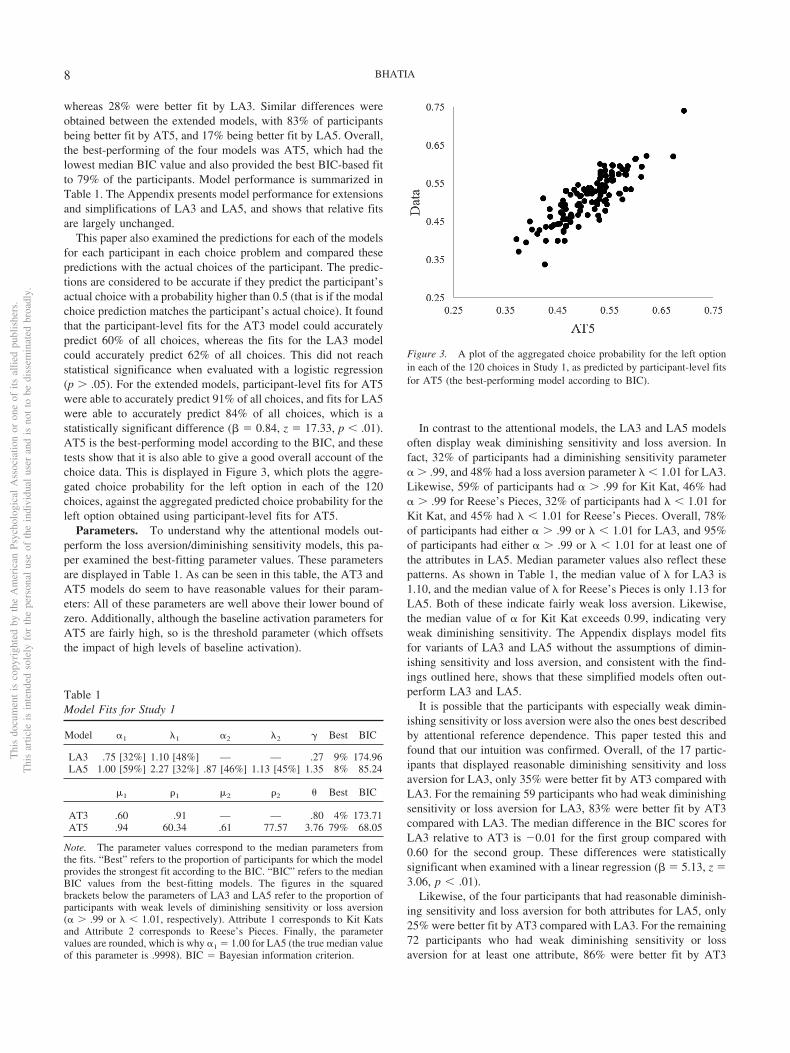
In contrast to the attentional models, the LA3 and LA5 modelsoften display weak diminishing sensitivity and loss aversion. Infact, 32% of participants had a diminishing sensitivity parameter� � .99, and 48% had a loss aversion parameter � � 1.01 for LA3.Likewise, 59% of participants had � � .99 for Kit Kat, 46% had� � .99 for Reese’s Pieces, 32% of participants had � � 1.01 forKit Kat, and 45% had � � 1.01 for Reese’s Pieces. Overall, 78%of participants had either � � .99 or � � 1.01 for LA3, and 95%of participants had either � � .99 or � � 1.01 for at least one ofthe attributes in LA5. Median parameter values also reflect thesepatterns. As shown in Table 1, the median value of � for LA3 is1.10, and the median value of � for Reese’s Pieces is only 1.13 forLA5. Both of these indicate fairly weak loss aversion. Likewise,the median value of � for Kit Kat exceeds 0.99, indicating veryweak diminishing sensitivity. The Appendix displays model fitsfor variants of LA3 and LA5 without the assumptions of dimin-ishing sensitivity and loss aversion, and consistent with the find-ings outlined here, shows that these simplified models often out-perform LA3 and LA5.
It is possible that the participants with especially weak dimin-ishing sensitivity or loss aversion were also the ones best describedby attentional reference dependence. This paper tested this andfound that our intuition was confirmed. Overall, of the 17 partic-ipants that displayed reasonable diminishing sensitivity and lossaversion for LA3, only 35% were better fit by AT3 compared withLA3. For the remaining 59 participants who had weak diminishingsensitivity or loss aversion for LA3, 83% were better fit by AT3compared with LA3. The median difference in the BIC scores forLA3 relative to AT3 is �0.01 for the first group compared with0.60 for the second group. These differences were statisticallysignificant when examined with a linear regression (� � 5.13, z �3.06, p � .01).
Likewise, of the four participants that had reasonable diminish-ing sensitivity and loss aversion for both attributes for LA5, only25% were better fit by AT3 compared with LA3. For the remaining72 participants who had weak diminishing sensitivity or lossaversion for at least one attribute, 86% were better fit by AT3
Table 1Model Fits for Study 1
Model �1 �1 �2 �2 � Best BIC
LA3 .75 [32%] 1.10 [48%] — — .27 9% 174.96LA5 1.00 [59%] 2.27 [32%] .87 [46%] 1.13 [45%] 1.35 8% 85.24
1 �1 2 �2 Best BIC
AT3 .60 .91 — — .80 4% 173.71AT5 .94 60.34 .61 77.57 3.76 79% 68.05
Note. The parameter values correspond to the median parameters fromthe fits. “Best” refers to the proportion of participants for which the modelprovides the strongest fit according to the BIC. “BIC” refers to the medianBIC values from the best-fitting models. The figures in the squaredbrackets below the parameters of LA3 and LA5 refer to the proportion ofparticipants with weak levels of diminishing sensitivity or loss aversion(� � .99 or � � 1.01, respectively). Attribute 1 corresponds to Kit Katsand Attribute 2 corresponds to Reese’s Pieces. Finally, the parametervalues are rounded, which is why �1 � 1.00 for LA5 (the true median valueof this parameter is .9998). BIC � Bayesian information criterion.
Figure 3. A plot of the aggregated choice probability for the left optionin each of the 120 choices in Study 1, as predicted by participant-level fitsfor AT5 (the best-performing model according to BIC).
Thi
sdo
cum
ent
isco
pyri
ghte
dby
the
Am
eric
anPs
ycho
logi
cal
Ass
ocia
tion
oron
eof
itsal
lied
publ
ishe
rs.
Thi
sar
ticle
isin
tend
edso
lely
for
the
pers
onal
use
ofth
ein
divi
dual
user
and
isno
tto
bedi
ssem
inat
edbr
oadl
y.
8 BHATIA
compared with LA3. The median differences in the BIC scores forLA5 compared with AT5 were �4.28 for the first group, comparedwith 19.75 for the second group. These differences were alsostatistically significant when examined with a linear regression(� � 22.21, z � 2.67, p � .01).
If we did not constrain the parameter ranges for LA3 and LA5,it is likely that we would observe � � 1 (indicating increasingsensitivity) or � � 1 (indicating loss seeking) for many partici-pants. This suggests that the key assumptions of the loss aversion/diminishing sensitivity models may be frequently violated for thechoice problems considered in this experiment—choice problemsin which choice options are often inferior to the reference point.
Discussion
Study 1 compared the attention and loss aversion/diminishingsensitivity theories of reference dependence on a participant level.It used a single reference point and gave each participant multiplechoices for options both inferior to and superior to this referencepoint. A qualitative analysis of choice proportions did not revealany preference for options dominating the reference point oraversion toward options being dominated by the reference point.Models based on loss aversion involve ordinal comparisons withthe reference point, indicating that these models may not be able todescribe participant behavior in this experiment.
This intuition was confirmed by formal model fitting. Overall,this paper found that the majority of participants were better fit bythe attention models compared with the corresponding loss aver-sion/diminishing sensitivity models, using the BIC as the criterion.The best-performing model of all four examined models was AT5,which had the best BIC score for 79% of the participants. Addi-tionally, the best-fit diminishing sensitivity parameters and lossaversion parameters for LA3 and LA5 were frequently very closeto 1, indicating that many participants may have had increasingsensitivity or may have been loss seeking. Indeed, participantswith very weak levels of diminishing sensitivity and loss aversionwere typically the ones that were better fit by the attentionalmodels. It would be possible to improve the fit of the LA3 andLA5 models by not constraining their parameters; however, suchmodels would then be unable to explain the existing behavioralfindings associated with reference dependence (which rely on bothloss aversion and diminishing sensitivity).
Study 2
Study 1 examined reference dependence on an individual level.In order to do so, it gave participants binary choices under theinfluence of a single reference point. This design is useful forstudying preferences for options that are superior to and inferior tothe reference point, and thus for comparing the attentional and lossaversion/diminishing sensitivity theories of reference dependence.However, it does not involve a varying reference point, and thuscannot be used to study how preferences change as a function ofthe reference point.
Study 2 attempts to address this problem. It involves the use oftwo different reference points, which contain different combina-tions of the attributes in consideration. Although every participantis given a single reference point, the specific reference point thateach participant is exposed to is determined randomly. All partic-
ipants, regardless of the reference point used, make the same set ofbinary choices. Study 2 also involves two other changes relative toStudy 1. First, in order to improve its ability to discriminatebetween the two theories, Study 2 uses only choice options that areinferior to the reference points (as discussed attentional and lossaversion/diminishing sensitivity theories make divergent predic-tions for these types of choices). Second, in order to verify whetherattention is in fact at play in the decision, Study 2 uses a mouse-tracking interface, which is able to record how decision makersattend to the various attributes when deliberating between thechoice options.
Method
Participants. Seventy-two students took part in the experi-ment (52% male; M age � 21.59 years, SD age � 4.09), whichwas conducted in a behavioral laboratory at a British university.The participants were compensated with money.
Materials and design. The choice options used in this exper-iment were hypothetical vacations in Spain. Each vacation wasdefined on two dimensions: nights in Ibiza (an island with avibrant nightlife) and nights in Barcelona (a city known for itscultural and artistic attractions). Participants were given either “6nights in Barcelona” or “6 nights in Ibiza” as their reference point,and, after being exposed to their reference point and some fillerquestions, made 83 different choices between vacations that in-volved different combinations of nights in Barcelona and nights inIbiza. For example, one of the choice problems used offeredparticipants the choice between “2 nights in Ibiza and 4 nights inBarcelona” and “5 nights in Ibiza and 2 nights in Barcelona.”Seventy-eight of the choice problems used were taken from Study1. These choice problems involved all vacation combinations thatdiffered by, at most, one total vacation day. An additional fivechoice problems were added to this list. These involved the choicebetween “k nights in Ibiza and 0 nights in Barcelona” and “0 nightsin Ibiza and k nights in Barcelona,” where k was an integerbetween 1 and 5. Changes in choices across these problems can beused to test the influence of the reference point.
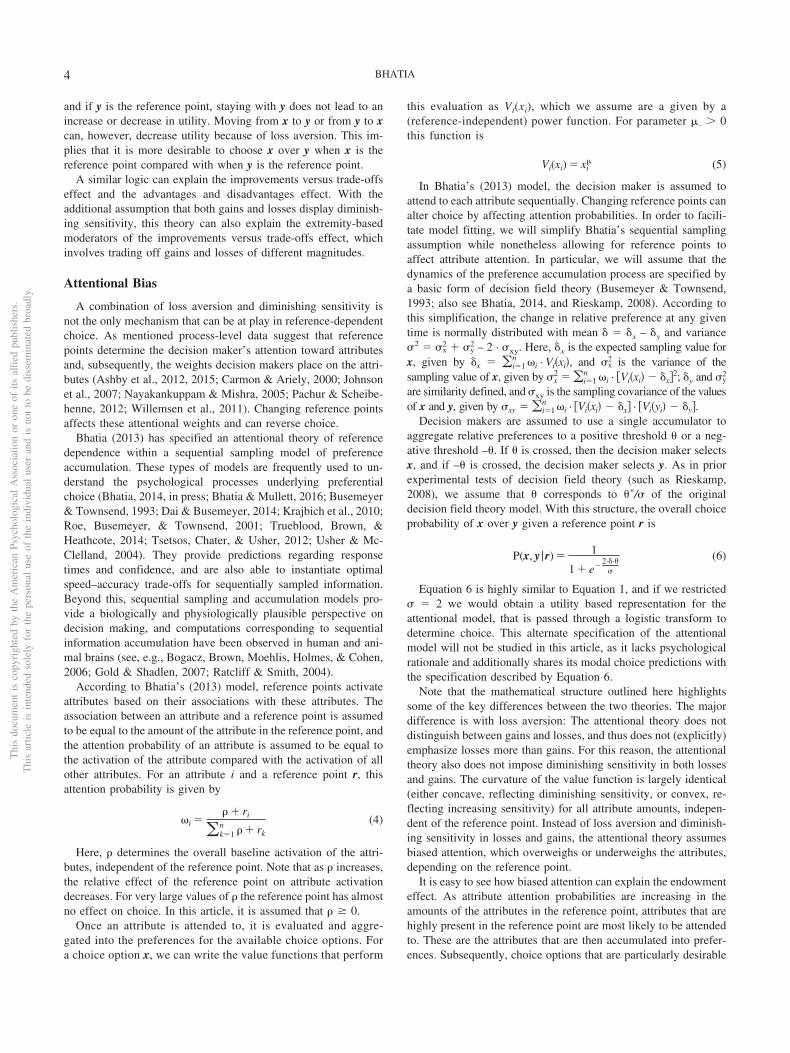
Unlike Study 1, Study 2 used a MouseLAB interface (Willem-sen & Johnson, 2011) in order to study the attentional biasespredicted by the attentional theory of reference dependence. Thisinvolved the presentation of the reference point and the twooptions in table format, with three rows, corresponding to thereference point, and the two choice options, and two columns,corresponding to the number of nights in each of the two locationsthat the choice options offered. The cells corresponding to theattribute values of the reference point were uncovered, but thosecorresponding to the attribute values of the choice options wereobscured by gray boxes. Participants had to click on individualgray boxes in order to determine the number nights the corre-sponding vacation offered in the corresponding location. Biases inattribute attention can be examined by recording the number oftimes participants clicked on the attributes, as well as the total timespent looking at these attributes. An example of this interface isdisplayed in Figure 4. Note that the order in which the attributeswere presented (i.e., whether the reference point’s primary attri-bute was in the left column or right column) was randomizedacross participants.
Thi
sdo
cum
ent
isco
pyri
ghte
dby
the
Am
eric
anPs
ycho
logi
cal
Ass
ocia
tion
oron
eof
itsal
lied
publ
ishe
rs.
Thi
sar
ticle
isin
tend
edso
lely
for
the
pers
onal
use
ofth
ein
divi
dual
user
and
isno
tto
bedi
ssem
inat
edbr
oadl
y.
9COMPARING THEORIES OF REFERENCE-DEPENDENT CHOICE

Again, the choices in this experiment can be described using thenotation introduced earlier in this article. Particularly, the refer-ence points can be written as r � (6, 0) or r � (0, 6), and differentchoice options can be written as x � (x1, x2) and y � (y1, y2), withx1 and y1 corresponding to nights in Barcelona, and x2 and y2
corresponding to nights in Ibiza. The various attentional and lossaversion/diminishing sensitivity models can subsequently be fit onthe data obtained in this experiment, with the techniques specifiedin Equations 1 to 6.
Procedure. Participants were told to imagine that they hadwon a free vacation to Spain. This vacation consisted of 6 nightsin Barcelona (if they were endowed with the first reference point)or 6 nights in Ibiza (if they were endowed with the secondreference point). After a filler task, the participants were then toldthat the vacation was unavailable and that they instead had tochoose between pairs of other vacation options. They were thenintroduced to the MouseLAB presentation format. After they werecomfortable with this format, they made the 83 choices in theexperiment. All experimental tasks were performed on a computerinterface in private cubicles, with no visual access to other partic-ipants. As can be seen in Figure 4, each choice problem displayedthe reference point at the top, ensuring that the reference point wassalient throughout the experiment.
Results
Choice proportions. As in previous studies, we can begin byexamining the general patterns in choices. Note that there were5,976 total choices in this experiment, and we have attention datafor each of these decisions. In 254 of these choices, participantsdid not click on any of the boxes before submitting their choices,
indicating that they did not have any attribute-level information onwhich to base their decisions. These 254 observations are excludedin all subsequent analysis. Also note that there was a decrease inclick counts as trials progressed. However, this is largely becauseof the first few trials (in which participants clicked a lot). Theeffect of trial number on click count disappeared after 10 trials.The subsequent analysis considers all trials, though the results donot change if we remove the first 10 trials from the analysis.
Using a logistic regression with participant-level random inter-cepts, this paper found that decision makers were more likely tochoose choice options with more total vacation days (� � 0.74,z � 18.34, p � .01), lower dispersion (� � �0.17, z � �16.13,p � .01), and fewer nights in Ibiza (� � �0.34, z � �12.50, p �.01).
We can also use the data from this experiment to test for theeffects of the reference points. As this experiment involves choicesbetween inferior options, the reference point is never offered tothe participants as a choice, and thus we cannot directly test for thestandard endowment effect. However, we can examine whether thechoice frequencies for the various options vary based on whetherthe participant was initially given 6 nights in Barcelona or initiallygiven 6 nights in Ibiza. Using a logistic regression with participant-level random intercepts and controls for the total vacation days anddispersion in vacation days, this paper found that decision makerswere significantly more likely to choose an option that had morenights in Ibiza, if their reference point was 6 nights in Ibizacompared with 6 nights in Barcelona (� � 1.17, z � 6.90, p �.01). A similar analysis found that there was a significant interac-tion effect between the number of nights a choice option offers inIbiza and exposure to the reference point that offered 6 nights in
Figure 4. Example of MouseLAB interface used in Study 2. Here, the participant is endowed with 6 nights inBarcelona. Attribute values obscured by the gray boxes can be uncovered by clicking on these boxes. At anytime, only one box can be opened. See the online article for the color version of this figure.
Thi
sdo
cum
ent
isco
pyri
ghte
dby
the
Am
eric
anPs
ycho
logi
cal
Ass
ocia
tion
oron
eof
itsal
lied
publ
ishe
rs.
Thi
sar
ticle
isin
tend
edso
lely
for
the
pers
onal
use
ofth
ein
divi
dual
user
and
isno
tto
bedi
ssem
inat
edbr
oadl
y.
10 BHATIA
Ibiza, on the choice probability of that option (� � 1.22, z �20.87, p � .01). Both these findings suggest that the referencepoints used in this experiment affect participants’ choices in favorof the primary attribute in the reference point.
Finally, this paper examined relative preferences for options thatwere dominated by the reference point (options with some nightsat the primary location of the reference point and zero nights in theother location) compared with options that were not dominated bythe reference point. The analysis revealed that decision makersdisplayed a preference for options that were dominated by thereference point (� � 1.92, z � 5.70, p � .01), controlling fordifferences in the total vacation days, dispersion, and relativenumber of nights in Ibiza, and additionally controlling for partic-ipant heterogeneity through random intercepts. This suggests thatunfavorable ordinal comparisons with the reference point did notreduce a choice option’s preference. This is largely contrary to thepredictions of the loss aversion/diminishing sensitivity models ofreference dependence.
Model fits. This paper fit the attention and loss aversion/diminishing sensitivity models to the data using the techniquesspecified at the start of this article. Note that in participant-levelfits, one of the loss aversion parameters in LA5 is redundant (asthere are losses on only one attribute). Thus, on the participantlevel, LA5 requires only four parameters. This is taken into ac-count when computing the BIC. Also note that two participantsmade the majority of their choices without searching for any of theattributes (clicking on any boxes). As these types of choices areexcluded in this article’s analysis, there is very little data withwhich to fit the models for these two participants. When discussingindividual-level model fits in this section, this paper excludes thefits for these two participants.
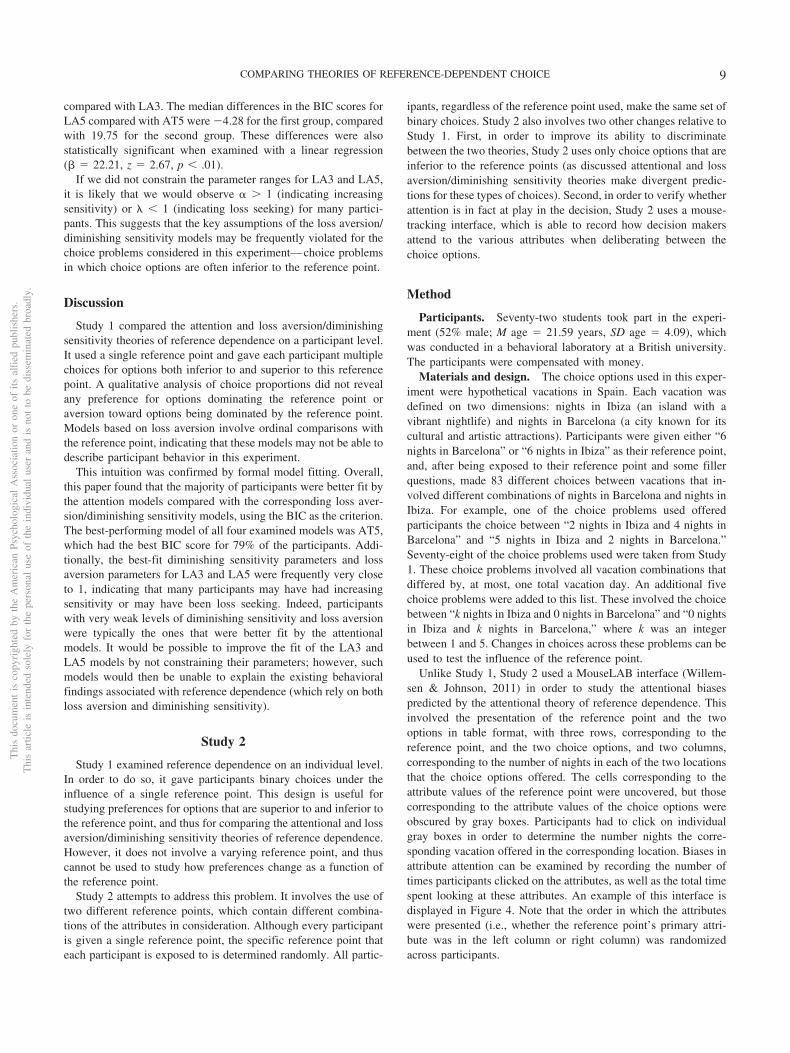
Using the BIC to compare the model performance of the sim-plified models, this paper found that 67% of participants werebetter fit by AT3 compared with 33% for LA3. Similarly, for theextended models, 63% were better fit by the AT5 compared with37% for LA5. Overall, the best-performing model of the fourmodels is AT3, which has the lowest median BIC and was addi-tionally able to provide the best fit to 64% of the participants.Model performance is summarized in Table 2. The Appendixpresents model performance for extensions and simplifications ofLA3 and LA5, and finds that relative fits are largely unchanged.
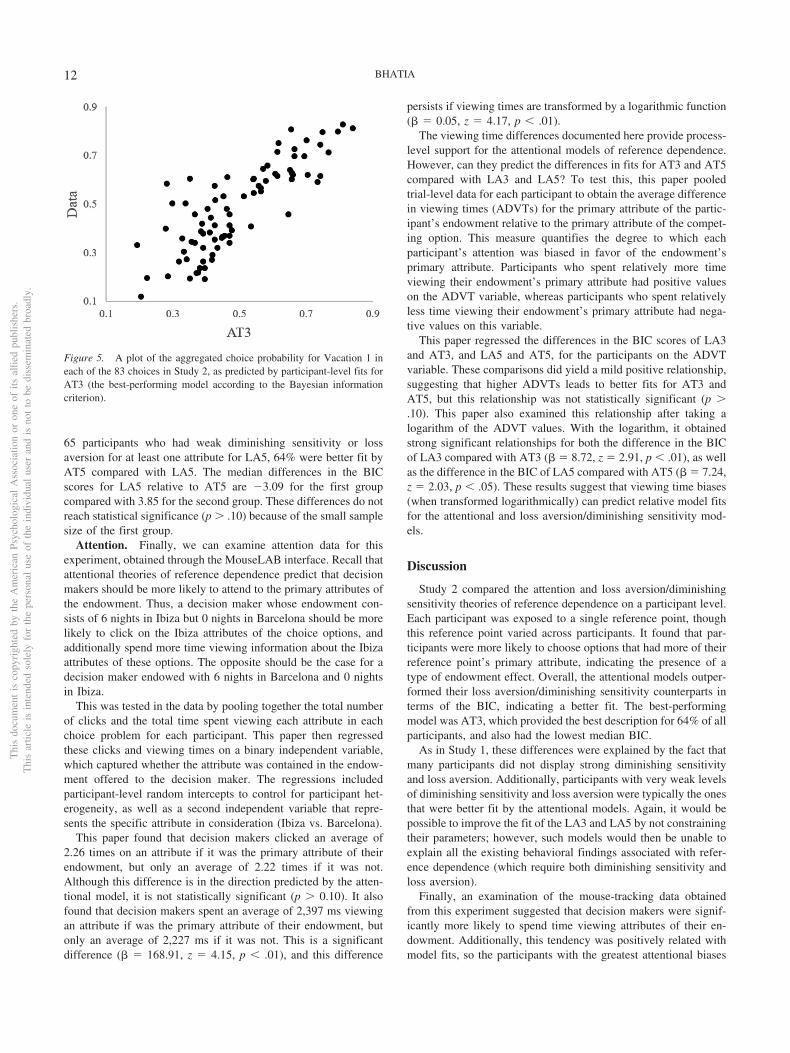
As in Study 1, this paper also compared the modal predictionsfor each of the models for each participant in each choice problem(using participant-level best-fit parameters) with the actual choicesof the participant. This revealed that the AT3 model was able toaccurately predict 78% of all choices, whereas the LA3 model wasable to accurately predict 75% of all choices. This is a statisticallysignificant difference when evaluated using a logistic regression(� � 0.22, z � 4.99, p � .01). Similarly, the AT5 model was ableto accurately predict 86% of all choices, and the LA5 model wasable to accurately predict 79% of all choices (� � 0.45, z � 9.39,p � .01). Again, this indicates that the best-performing modelaccording to the BIC, AT3, gives a good overall account of thechoice data. Figure 5 illustrates this by plotting the aggregatedchoice probability for Vacation 1 in each of the 83 choices, againstthe aggregated predicted choice probability for Vacation 1 ob-tained using participant-level fits for AT3.
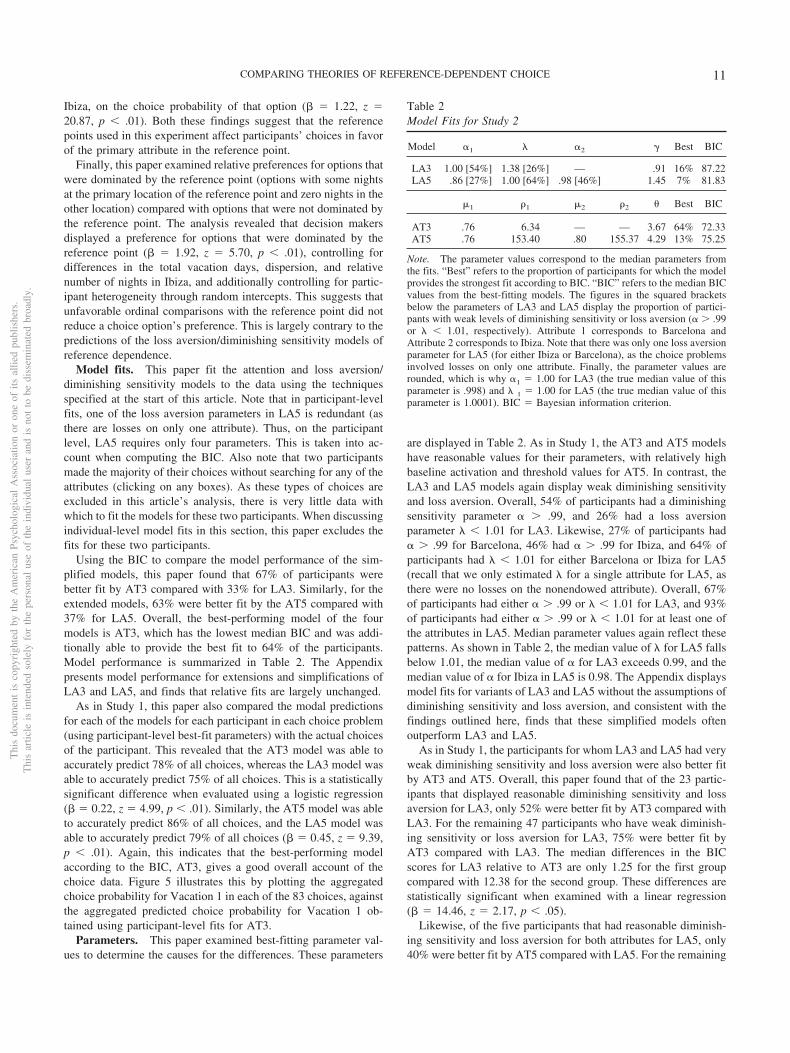
Parameters. This paper examined best-fitting parameter val-ues to determine the causes for the differences. These parameters
are displayed in Table 2. As in Study 1, the AT3 and AT5 modelshave reasonable values for their parameters, with relatively highbaseline activation and threshold values for AT5. In contrast, theLA3 and LA5 models again display weak diminishing sensitivityand loss aversion. Overall, 54% of participants had a diminishingsensitivity parameter � � .99, and 26% had a loss aversionparameter � � 1.01 for LA3. Likewise, 27% of participants had� � .99 for Barcelona, 46% had � � .99 for Ibiza, and 64% ofparticipants had � � 1.01 for either Barcelona or Ibiza for LA5(recall that we only estimated � for a single attribute for LA5, asthere were no losses on the nonendowed attribute). Overall, 67%of participants had either � � .99 or � � 1.01 for LA3, and 93%of participants had either � � .99 or � � 1.01 for at least one ofthe attributes in LA5. Median parameter values again reflect thesepatterns. As shown in Table 2, the median value of � for LA5 fallsbelow 1.01, the median value of � for LA3 exceeds 0.99, and themedian value of � for Ibiza in LA5 is 0.98. The Appendix displaysmodel fits for variants of LA3 and LA5 without the assumptions ofdiminishing sensitivity and loss aversion, and consistent with thefindings outlined here, finds that these simplified models oftenoutperform LA3 and LA5.
As in Study 1, the participants for whom LA3 and LA5 had veryweak diminishing sensitivity and loss aversion were also better fitby AT3 and AT5. Overall, this paper found that of the 23 partic-ipants that displayed reasonable diminishing sensitivity and lossaversion for LA3, only 52% were better fit by AT3 compared withLA3. For the remaining 47 participants who have weak diminish-ing sensitivity or loss aversion for LA3, 75% were better fit byAT3 compared with LA3. The median differences in the BICscores for LA3 relative to AT3 are only 1.25 for the first groupcompared with 12.38 for the second group. These differences arestatistically significant when examined with a linear regression(� � 14.46, z � 2.17, p � .05).
Likewise, of the five participants that had reasonable diminish-ing sensitivity and loss aversion for both attributes for LA5, only40% were better fit by AT5 compared with LA5. For the remaining
Table 2Model Fits for Study 2
Model �1 � �2 � Best BIC
LA3 1.00 [54%] 1.38 [26%] — .91 16% 87.22LA5 .86 [27%] 1.00 [64%] .98 [46%] 1.45 7% 81.83
1 �1 2 �2 Best BIC
AT3 .76 6.34 — — 3.67 64% 72.33AT5 .76 153.40 .80 155.37 4.29 13% 75.25
Note. The parameter values correspond to the median parameters fromthe fits. “Best” refers to the proportion of participants for which the modelprovides the strongest fit according to BIC. “BIC” refers to the median BICvalues from the best-fitting models. The figures in the squared bracketsbelow the parameters of LA3 and LA5 display the proportion of partici-pants with weak levels of diminishing sensitivity or loss aversion (� � .99or � � 1.01, respectively). Attribute 1 corresponds to Barcelona andAttribute 2 corresponds to Ibiza. Note that there was only one loss aversionparameter for LA5 (for either Ibiza or Barcelona), as the choice problemsinvolved losses on only one attribute. Finally, the parameter values arerounded, which is why �1 � 1.00 for LA3 (the true median value of thisparameter is .998) and � 1 � 1.00 for LA5 (the true median value of thisparameter is 1.0001). BIC � Bayesian information criterion.
Thi
sdo
cum
ent
isco
pyri
ghte
dby
the
Am
eric
anPs
ycho
logi
cal
Ass
ocia
tion
oron
eof
itsal
lied
publ
ishe
rs.
Thi
sar
ticle
isin
tend
edso
lely
for
the
pers
onal
use
ofth
ein
divi
dual
user
and
isno
tto
bedi
ssem
inat
edbr
oadl
y.
11COMPARING THEORIES OF REFERENCE-DEPENDENT CHOICE
65 participants who had weak diminishing sensitivity or lossaversion for at least one attribute for LA5, 64% were better fit byAT5 compared with LA5. The median differences in the BICscores for LA5 relative to AT5 are �3.09 for the first groupcompared with 3.85 for the second group. These differences do notreach statistical significance (p � .10) because of the small samplesize of the first group.
Attention. Finally, we can examine attention data for thisexperiment, obtained through the MouseLAB interface. Recall thatattentional theories of reference dependence predict that decisionmakers should be more likely to attend to the primary attributes ofthe endowment. Thus, a decision maker whose endowment con-sists of 6 nights in Ibiza but 0 nights in Barcelona should be morelikely to click on the Ibiza attributes of the choice options, andadditionally spend more time viewing information about the Ibizaattributes of these options. The opposite should be the case for adecision maker endowed with 6 nights in Barcelona and 0 nightsin Ibiza.
This was tested in the data by pooling together the total numberof clicks and the total time spent viewing each attribute in eachchoice problem for each participant. This paper then regressedthese clicks and viewing times on a binary independent variable,which captured whether the attribute was contained in the endow-ment offered to the decision maker. The regressions includedparticipant-level random intercepts to control for participant het-erogeneity, as well as a second independent variable that repre-sents the specific attribute in consideration (Ibiza vs. Barcelona).
This paper found that decision makers clicked an average of2.26 times on an attribute if it was the primary attribute of theirendowment, but only an average of 2.22 times if it was not.Although this difference is in the direction predicted by the atten-tional model, it is not statistically significant (p � 0.10). It alsofound that decision makers spent an average of 2,397 ms viewingan attribute if was the primary attribute of their endowment, butonly an average of 2,227 ms if it was not. This is a significantdifference (� � 168.91, z � 4.15, p � .01), and this difference
persists if viewing times are transformed by a logarithmic function(� � 0.05, z � 4.17, p � .01).
The viewing time differences documented here provide process-level support for the attentional models of reference dependence.However, can they predict the differences in fits for AT3 and AT5compared with LA3 and LA5? To test this, this paper pooledtrial-level data for each participant to obtain the average differencein viewing times (ADVTs) for the primary attribute of the partic-ipant’s endowment relative to the primary attribute of the compet-ing option. This measure quantifies the degree to which eachparticipant’s attention was biased in favor of the endowment’sprimary attribute. Participants who spent relatively more timeviewing their endowment’s primary attribute had positive valueson the ADVT variable, whereas participants who spent relativelyless time viewing their endowment’s primary attribute had nega-tive values on this variable.
This paper regressed the differences in the BIC scores of LA3and AT3, and LA5 and AT5, for the participants on the ADVTvariable. These comparisons did yield a mild positive relationship,suggesting that higher ADVTs leads to better fits for AT3 andAT5, but this relationship was not statistically significant (p �.10). This paper also examined this relationship after taking alogarithm of the ADVT values. With the logarithm, it obtainedstrong significant relationships for both the difference in the BICof LA3 compared with AT3 (� � 8.72, z � 2.91, p � .01), as wellas the difference in the BIC of LA5 compared with AT5 (� � 7.24,z � 2.03, p � .05). These results suggest that viewing time biases(when transformed logarithmically) can predict relative model fitsfor the attentional and loss aversion/diminishing sensitivity mod-els.
Discussion
Study 2 compared the attention and loss aversion/diminishingsensitivity theories of reference dependence on a participant level.Each participant was exposed to a single reference point, thoughthis reference point varied across participants. It found that par-ticipants were more likely to choose options that had more of theirreference point’s primary attribute, indicating the presence of atype of endowment effect. Overall, the attentional models outper-formed their loss aversion/diminishing sensitivity counterparts interms of the BIC, indicating a better fit. The best-performingmodel was AT3, which provided the best description for 64% of allparticipants, and also had the lowest median BIC.
As in Study 1, these differences were explained by the fact thatmany participants did not display strong diminishing sensitivityand loss aversion. Additionally, participants with very weak levelsof diminishing sensitivity and loss aversion were typically the onesthat were better fit by the attentional models. Again, it would bepossible to improve the fit of the LA3 and LA5 by not constrainingtheir parameters; however, such models would then be unable toexplain all the existing behavioral findings associated with refer-ence dependence (which require both diminishing sensitivity andloss aversion).
Finally, an examination of the mouse-tracking data obtainedfrom this experiment suggested that decision makers were signif-icantly more likely to spend time viewing attributes of their en-dowment. Additionally, this tendency was positively related withmodel fits, so the participants with the greatest attentional biases
Figure 5. A plot of the aggregated choice probability for Vacation 1 ineach of the 83 choices in Study 2, as predicted by participant-level fits forAT3 (the best-performing model according to the Bayesian informationcriterion).
Thi
sdo
cum
ent
isco
pyri
ghte
dby
the
Am
eric
anPs
ycho
logi
cal
Ass
ocia
tion
oron
eof
itsal
lied
publ
ishe
rs.
Thi
sar
ticle
isin
tend
edso
lely
for
the
pers
onal
use
ofth
ein
divi
dual
user
and
isno
tto
bedi
ssem
inat
edbr
oadl
y.
12 BHATIA
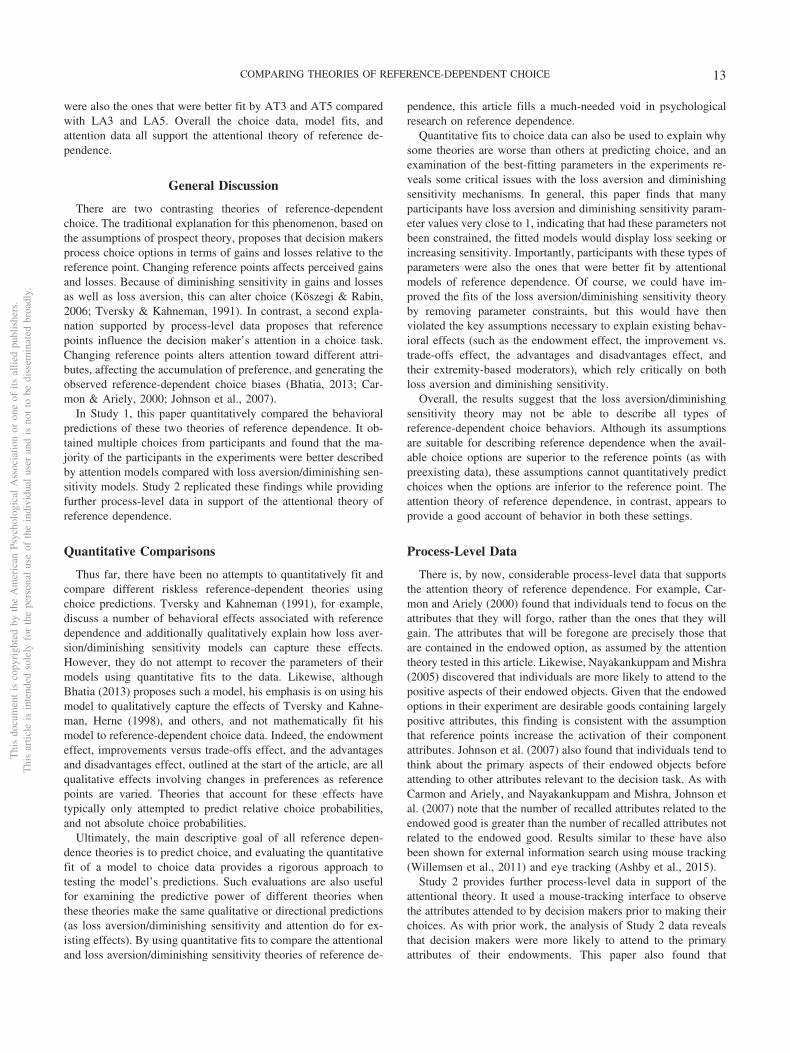
were also the ones that were better fit by AT3 and AT5 comparedwith LA3 and LA5. Overall the choice data, model fits, andattention data all support the attentional theory of reference de-pendence.
General Discussion
There are two contrasting theories of reference-dependentchoice. The traditional explanation for this phenomenon, based onthe assumptions of prospect theory, proposes that decision makersprocess choice options in terms of gains and losses relative to thereference point. Changing reference points affects perceived gainsand losses. Because of diminishing sensitivity in gains and lossesas well as loss aversion, this can alter choice (Köszegi & Rabin,2006; Tversky & Kahneman, 1991). In contrast, a second expla-nation supported by process-level data proposes that referencepoints influence the decision maker’s attention in a choice task.Changing reference points alters attention toward different attri-butes, affecting the accumulation of preference, and generating theobserved reference-dependent choice biases (Bhatia, 2013; Car-mon & Ariely, 2000; Johnson et al., 2007).
In Study 1, this paper quantitatively compared the behavioralpredictions of these two theories of reference dependence. It ob-tained multiple choices from participants and found that the ma-jority of the participants in the experiments were better describedby attention models compared with loss aversion/diminishing sen-sitivity models. Study 2 replicated these findings while providingfurther process-level data in support of the attentional theory ofreference dependence.
Quantitative Comparisons
Thus far, there have been no attempts to quantitatively fit andcompare different riskless reference-dependent theories usingchoice predictions. Tversky and Kahneman (1991), for example,discuss a number of behavioral effects associated with referencedependence and additionally qualitatively explain how loss aver-sion/diminishing sensitivity models can capture these effects.However, they do not attempt to recover the parameters of theirmodels using quantitative fits to the data. Likewise, althoughBhatia (2013) proposes such a model, his emphasis is on using hismodel to qualitatively capture the effects of Tversky and Kahne-man, Herne (1998), and others, and not mathematically fit hismodel to reference-dependent choice data. Indeed, the endowmenteffect, improvements versus trade-offs effect, and the advantagesand disadvantages effect, outlined at the start of the article, are allqualitative effects involving changes in preferences as referencepoints are varied. Theories that account for these effects havetypically only attempted to predict relative choice probabilities,and not absolute choice probabilities.
Ultimately, the main descriptive goal of all reference depen-dence theories is to predict choice, and evaluating the quantitativefit of a model to choice data provides a rigorous approach totesting the model’s predictions. Such evaluations are also usefulfor examining the predictive power of different theories whenthese theories make the same qualitative or directional predictions(as loss aversion/diminishing sensitivity and attention do for ex-isting effects). By using quantitative fits to compare the attentionaland loss aversion/diminishing sensitivity theories of reference de-
pendence, this article fills a much-needed void in psychologicalresearch on reference dependence.
Quantitative fits to choice data can also be used to explain whysome theories are worse than others at predicting choice, and anexamination of the best-fitting parameters in the experiments re-veals some critical issues with the loss aversion and diminishingsensitivity mechanisms. In general, this paper finds that manyparticipants have loss aversion and diminishing sensitivity param-eter values very close to 1, indicating that had these parameters notbeen constrained, the fitted models would display loss seeking orincreasing sensitivity. Importantly, participants with these types ofparameters were also the ones that were better fit by attentionalmodels of reference dependence. Of course, we could have im-proved the fits of the loss aversion/diminishing sensitivity theoryby removing parameter constraints, but this would have thenviolated the key assumptions necessary to explain existing behav-ioral effects (such as the endowment effect, the improvement vs.trade-offs effect, the advantages and disadvantages effect, andtheir extremity-based moderators), which rely critically on bothloss aversion and diminishing sensitivity.
Overall, the results suggest that the loss aversion/diminishingsensitivity theory may not be able to describe all types ofreference-dependent choice behaviors. Although its assumptionsare suitable for describing reference dependence when the avail-able choice options are superior to the reference points (as withpreexisting data), these assumptions cannot quantitatively predictchoices when the options are inferior to the reference point. Theattention theory of reference dependence, in contrast, appears toprovide a good account of behavior in both these settings.
Process-Level Data
There is, by now, considerable process-level data that supportsthe attention theory of reference dependence. For example, Car-mon and Ariely (2000) found that individuals tend to focus on theattributes that they will forgo, rather than the ones that they willgain. The attributes that will be foregone are precisely those thatare contained in the endowed option, as assumed by the attentiontheory tested in this article. Likewise, Nayakankuppam and Mishra(2005) discovered that individuals are more likely to attend to thepositive aspects of their endowed objects. Given that the endowedoptions in their experiment are desirable goods containing largelypositive attributes, this finding is consistent with the assumptionthat reference points increase the activation of their componentattributes. Johnson et al. (2007) also found that individuals tend tothink about the primary aspects of their endowed objects beforeattending to other attributes relevant to the decision task. As withCarmon and Ariely, and Nayakankuppam and Mishra, Johnson etal. (2007) note that the number of recalled attributes related to theendowed good is greater than the number of recalled attributes notrelated to the endowed good. Results similar to these have alsobeen shown for external information search using mouse tracking(Willemsen et al., 2011) and eye tracking (Ashby et al., 2015).
Study 2 provides further process-level data in support of theattentional theory. It used a mouse-tracking interface to observethe attributes attended to by decision makers prior to making theirchoices. As with prior work, the analysis of Study 2 data revealsthat decision makers were more likely to attend to the primaryattributes of their endowments. This paper also found that
Thi
sdo
cum
ent
isco
pyri
ghte
dby
the
Am
eric
anPs
ycho
logi
cal
Ass
ocia
tion
oron
eof
itsal
lied
publ
ishe
rs.
Thi
sar
ticle
isin
tend
edso
lely
for
the
pers
onal
use
ofth
ein
divi
dual
user
and
isno
tto
bedi
ssem
inat
edbr
oadl
y.
13COMPARING THEORIES OF REFERENCE-DEPENDENT CHOICE
participant-level attentional biases predicted the relative quantita-tive fits of the two theories to the participants: Ultimately, partic-ipants that were especially likely to attend to the endowment’sattributes were also those who are better fit by the attentionalmodels relative to the loss aversion/diminishing sensitivity mod-els. This second level of analysis draws a close link betweenprocess-level observations (which test the psychological mecha-nisms underlying a given theory) and quantitative fits (which testthe ability of the theory to describe choice data), and shows that thequantitative power of the attentional theory stems directly from itshypothesized psychological mechanism.
Attention in Other Domains
Memory and attention is considered to play a very importantrole in decision making (Kahneman, 2003; Weber & Johnson,2006), and biases in attribute activation have been shown toexplain a number of behavioral findings. These findings includethe anchoring effect, focus of comparison effects, and constraintsatisfaction effects (Chapman & Johnson, 1999; Dhar & Simon-son, 1992; Dhar, Nowlis, & Sherman, 1999; Glöckner, Betsch, &Schindler, 2010; Holyoak & Simon, 1999; Houston, Sherman, &Baker, 1989; Strack & Mussweiler, 1997). For all these effects,especially, salient alternatives bias attribute and cue activation in amanner similar to that assumed by the attentional theory of refer-ence dependence. Additionally, as with the attentional theory,these biases in attribute and cue activation affect choice, generat-ing preference reversals and other deviations from economic ra-tionality.
Memory and attention biases are also at play in variousjudgment and reasoning tasks. For example, similarity compar-isons are systematically biased by the concept that is subject ofthe comparison. It is this concept that determines the attributesthat are attended to, and subsequently, the outcome of thesimilarity judgment (Tversky, 1977). Likewise, focal hypothe-ses tend to increase the accessibility of information that ispositively associated with these hypotheses (Klayman & Ha,1987). Finally, biases in attribute activation caused by associ-ations with the judgment task have been shown to account for anumber of fallacies involving probabilistic inference and induction(Kahneman, 2003; Sloman, 1996).
Of course, the idea that attention affects cognitive processingis not at all unique to judgment and decision-making research.Feature (or sematic) priming plays an important role in anumber of other psychological domains, including semanticmemory, visual perception, and lexical decision making. In-deed, this type of priming can be seen as one of the keyproperties of human cognition and behavior, one which natu-rally influences preferential choice in the presence of salientreference points.
What Are Reference Points?
Although the importance of reference points in determiningchoice has been acknowledged for a long time, there is still somedebate about what reference points actually are. Current endow-ments (Knetsch, 1989; Knetsch & Sinden, 1984; Thaler, 1980),past endowments (Strahilevitz & Loewenstein, 1998), the endow-ments of neighbors and close others (Clark & Oswald, 1996), the
status quo (Samuelson & Zeckhauser, 1988), aspirations (Heath etal., 1999), expectations (Abeler, Falk, Goette, & Huffman, 2011;Köszegi & Rabin, 2006), and focal outcomes in the choice task(Bushong et al., 2010; Dhar et al., 1999; Dhar & Simonson, 1992;Krajbich et al., 2010) have all been shown to drive reference-dependent choice.
The discussion on the role of attention in judgment, decisionmaking, and other areas of psychology offers a simple definition ofa reference point. According to the attentional theory, any choiceoption that is more salient than the other options in the choice setwill operate like a semantic (or feature) prime, and exert a stronginfluence on attribute activation. This will alter the attention to-ward attributes in the decision task and bias final preferences. Bythis definition, any exceptionally salient option is a referencepoint, and will generate the endowment effect, the improvementsversus trade-offs effect, the advantages and disadvantages effect,and other reference-dependent phenomena.
This definition can be used to extend attention to study choiceset dependence. Preferences are strongly influenced by available,yet irrelevant, options. Adding, removing, or otherwise changingthese options can alter the decision maker’s choices and lead to arange of preference reversals (Huber et al., 1982; Simonson,1989). If a reference point is merely a choice option that isexceptionally salient, and we assume that available options aremore salient than those not in the choice set, then we can considerchoice set dependence to be a special case of reference depen-dence, in which every available option acts as a reference point.We can subsequently use the attention theory of reference depen-dence to make predictions regarding choice set effects in prefer-ential choice. Indeed, Bhatia (2013) shows that such an approachcan provide a comprehensive account of a very large range offindings regarding choice set dependence, including context ef-fects (Huber et al., 1982; Simonson, 1989; Tversky, 1972), align-ability effects (Markman & Medin, 1995; Slovic & MacPhillamy,1974), less-is-more effects (Hsee, 1998; Simonson, Carmon, &O’Curry, 1994), and related process-level findings (Pettibone,2012; Zhang & Markman, 2001). Of course, there are some sucheffects that prospect theory approaches, such as the one discussedhere, have also been applied to (e.g., Tversky & Simonson, 1993;Usher & McClelland, 2004). Bhatia (2013) outlines similaritiesand differences between attentional accounts of choice set depen-dence and prospect theory accounts of reference dependence.
Beyond Prospect Theory
The tests presented in this article are not the first to challengeprospect theory accounts of choice behavior. Closely related quan-titative tests were performed by Rieskamp (2008) for the domainof risky choice. As in the current article, Rieskamp comparedprospect theory with decision field theory (Busemeyer &Townsend, 1993), a prominent preference accumulation model.Indeed, much of the structure and the techniques in this articlerelate directly to those outlined in Rieskamp, and just likeRieskamp, this article finds that accumulation models outperformmodels based on the assumptions of prospect theory.
More generally, the notion that decision makers make riskydecisions using prospect theory has been refuted by a number ofresearchers (see Birnbaum, 2008, for a discussion). Others havedirectly questioned prospect theory’s assumption of loss aver-
Thi
sdo
cum
ent
isco
pyri
ghte
dby
the
Am
eric
anPs
ycho
logi
cal
Ass
ocia
tion
oron
eof
itsal
lied
publ
ishe
rs.
Thi
sar
ticle
isin
tend
edso
lely
for
the
pers
onal
use
ofth
ein
divi
dual
user
and
isno
tto
bedi
ssem
inat
edbr
oadl
y.
14 BHATIA
sion (Erev, Ert, & Yechiam, 2008; Ert & Erev, 2013; Harinck,Van Dijk, Van Beest, & Mersmann, 2007; Yechiam & Telpaz,2013). Indeed, much of this work suggests that attention may bethe driving mechanism underlying the effects that prospecttheory was initially formulated to explain (see, e.g., Bhatia,2014; Birnbaum, 2008; Yechiam, & Hochman, 2013a, 2013b).The findings in this paper complement this risky choice re-search, and suggest that the main assumptions of prospecttheory also fail to adequately describe riskless multiattributechoice, and additionally that attentional mechanisms may becompelling alternatives to mechanisms such as loss aversion.Note that a similar argument is outlined in Trueblood (2015),who finds that multiattribute reference point effects also emergein perceptual decision making, a domain in which loss aversionis unlikely to play a role.
These criticisms of prospect theory also suggest a way for-ward. Prospect theory was initially proposed as a mathematicaldescription of choice behavior. Although the approach it pre-sented was no doubt revolutionary, it nonetheless failed toformally incorporate the effect of basic cognitive processes,such as memory, attention, and information search and accu-mulation. These processes play a crucial role in decision mak-ing and, as shown in this article, are able, by themselves, topredict many of the behaviors that prospect theory was formu-lated to explain. Future work should attempt to test the effects of thesebasic cognitive processes in other decision-making settings, so as toprovide a comprehensive, cognitively grounded framework for study-ing preferential choice.
References
Abeler, J., Falk, A., Goette, L., & Huffman, D. (2011). Reference pointsand effort provision. The American Economic Review, 101, 470–492.http://dx.doi.org/10.1257/aer.101.2.470
Ashby, N. J. S., Dickert, S., & Glöckner, A. (2012). Focusing on what youown: Biased information uptake due to Ownership. Judgment and De-cision Making, 7, 254–267.
Ashby, N. J., Walasek, L., & Glöckner, A. (2015). The effect of consumerratings and attentional allocation on product valuations. Judgment andDecision Making, 10, 172–184.
Bateman, I., Munro, A., Rhodes, B., Starmer, C., & Sugden, R. (1997). Atest of the theory of reference-dependent preferences. The QuarterlyJournal of Economics, 118, 73–105.
Bhatia, S. (2013). Associations and the accumulation of preference. Psy-chological Review, 120, 522–543. http://dx.doi.org/10.1037/a0032457
Bhatia, S. (2014). Sequential sampling and paradoxes of risky choice.Psychonomic Bulletin & Review, 21, 1095–1111. http://dx.doi.org/10.3758/s13423-014-0650-1
Bhatia, S. (in press). Choice rules and accumulator networks. Decision.http://dx.doi.org/10.1037/dec0000038
Bhatia, S., & Mullett, T. L. (2016). The dynamics of deferred decision.Cognitive Psychology, 86, 112–151. http://dx.doi.org/10.1016/j.cogpsych.2016.02.002
Birnbaum, M. H. (2008). New paradoxes of risky decision making. Psy-chological Review, 115, 463–501. http://dx.doi.org/10.1037/0033-295X.115.2.463
Birnbaum, M. H., & Stegner, S. E. (1979). Source credibility in socialjudgment: Bias, expertise, and the judge’s point of view. Journal ofPersonality and Social Psychology, 37, 48–74. http://dx.doi.org/10.1037/0022-3514.37.1.48
Bogacz, R., Brown, E., Moehlis, J., Holmes, P., & Cohen, J. D. (2006). Thephysics of optimal decision making: A formal analysis of models of
performance in two-alternative forced-choice tasks. Psychological Re-view, 113, 700–765. http://dx.doi.org/10.1037/0033-295X.113.4.700
Busemeyer, J. R., & Townsend, J. T. (1993). Decision field theory: Adynamic-cognitive approach to decision making in an uncertain envi-ronment. Psychological Review, 100, 432– 459. http://dx.doi.org/10.1037/0033-295X.100.3.432
Bushong, B., King, L. M., Camerer, C. F., & Rangel, A. (2010). Pavlovianprocesses in consumer choice: The physical presence of a good increaseswillingness-to-pay. The American Economic Review, 100, 1556–1571.http://dx.doi.org/10.1257/aer.100.4.1556
Carmon, Z., & Ariely, D. (2000). Focusing on the forgone: How value canappear so different to buyers and sellers. Journal of Consumer Research,27, 360–370. http://dx.doi.org/10.1086/317590
Chapman, G. B., & Johnson, E. J. (1999). Anchoring, activation, and theconstruction of values. Organizational Behavior and Human DecisionProcesses, 79, 115–153. http://dx.doi.org/10.1006/obhd.1999.2841
Clark, A. E., & Oswald, A. J. (1996). Satisfaction and comparison income.Journal of Public Economics, 61, 359–381. http://dx.doi.org/10.1016/0047-2727(95)01564-7
Dai, J., & Busemeyer, J. R. (2014). A probabilistic, dynamic, and attribute-wise model of intertemporal choice. Journal of Experimental Psychol-ogy: General, 143, 1489–1514. http://dx.doi.org/10.1037/a0035976
Dhar, R., Nowlis, S., & Sherman, S. J. (1999). Comparison effects onpreference construction. Journal of Consumer Research, 26, 293–306.http://dx.doi.org/10.1086/209564
Dhar, R., & Simonson, I. (1992). The effect of the focus of comparison onconsumer preferences. Journal of Marketing Research, 29, 430–440.http://dx.doi.org/10.2307/3172709
Erev, I., Ert, E., & Yechiam, E. (2008). Loss aversion, diminishing sensi-tivity, and the effect of experience on repeated decisions. Journal ofBehavioral Decision Making, 21, 575–597. http://dx.doi.org/10.1002/bdm.602
Ert, E., & Erev, I. (2013). On the descriptive value of loss aversion indecisions under risk: Six clarifications. Judgment and Decision Making,8, 214–235.
Glöckner, A., Betsch, T., & Schindler, N. (2010). Coherence shifts inprobabilistic inference tasks. Journal of Behavioral Decision Making,23, 439–462. http://dx.doi.org/10.1002/bdm.668
Glöckner, A., & Pachur, T. (2012). Cognitive models of risky choice:Parameter stability and predictive accuracy of prospect theory. Cogni-tion, 123, 21–32. http://dx.doi.org/10.1016/j.cognition.2011.12.002
Gold, J. I., & Shadlen, M. N. (2007). The neural basis of decision making.Annual Review of Neuroscience, 30, 535–574. http://dx.doi.org/10.1146/annurev.neuro.29.051605.113038
Hardie, B. G., Johnson, E. J., & Fader, P. S. (1993). Modeling loss aversionand reference dependence effects on brand choice. Marketing Science,12, 378–394. http://dx.doi.org/10.1287/mksc.12.4.378
Harinck, F., Van Dijk, E., Van Beest, I., & Mersmann, P. (2007). Whengains loom larger than losses: Reversed loss aversion for small amountsof money. Psychological Science, 18, 1099–1105. http://dx.doi.org/10.1111/j.1467-9280.2007.02031.x
Heath, C., Larrick, R. P., & Wu, G. (1999). Goals as reference points.Cognitive Psychology, 38, 79–109. http://dx.doi.org/10.1006/cogp.1998.0708
Herne, K. (1998). Testing the reference-dependent model: An experimenton asymmetrically dominated reference points. Journal of BehavioralDecision Making, 11, 181–192. http://dx.doi.org/10.1002/(SICI)1099-0771(199809)11:3�181::AID-BDM295�3.0.CO;2-T
Holyoak, K. J., & Simon, D. (1999). Bidirectional reasoning in decisionmaking by constraint satisfaction. Journal of Experimental Psychology:General, 128, 3–31. http://dx.doi.org/10.1037/0096-3445.128.1.3
Houston, D. A., Sherman, S. J., & Baker, S. M. (1989). The influence ofunique features and direction of comparison of preferences. Journal of
Thi
sdo
cum
ent
isco
pyri
ghte
dby
the
Am
eric
anPs
ycho
logi
cal
Ass
ocia
tion
oron
eof
itsal
lied
publ
ishe
rs.
Thi
sar
ticle
isin
tend
edso
lely
for
the
pers
onal
use
ofth
ein
divi
dual
user
and
isno
tto
bedi
ssem
inat
edbr
oadl
y.
15COMPARING THEORIES OF REFERENCE-DEPENDENT CHOICE
Experimental Social Psychology, 25, 121–141. http://dx.doi.org/10.1016/0022-1031(89)90008-5
Hsee, C. K. (1998). Less is better: When low-value options are valuedmore highly than high-value options. Journal of Behavioral DecisionMaking, 11, 107–121. http://dx.doi.org/10.1002/(SICI)1099-0771(199806)11:2�107::AID-BDM292�3.0.CO;2-Y
Huber, J., Payne, J. W., & Puto, C. (1982). Adding asymmetrically dom-inated options: Violations of regularity and the similarity hypothesis.Journal of Consumer Research, 9, 90–98. http://dx.doi.org/10.1086/208899
Johnson, E. J., Häubl, G., & Keinan, A. (2007). Aspects of endowment: Aquery theory of value construction. Journal of Experimental Psychology:Learning, Memory, and Cognition, 33, 461–474. http://dx.doi.org/10.1037/0278-7393.33.3.461
Kahneman, D. (2003). A perspective on judgment and choice: Mappingbounded rationality. American Psychologist, 58, 697–720. http://dx.doi.org/10.1037/0003-066X.58.9.697
Kahneman, D., Knetsch, J. L., & Thaler, R. H. (1990). Experimental testsof the endowment effect and the Coase theorem. Journal of PoliticalEconomy, 98, 1325–1348. http://dx.doi.org/10.1086/261737
Kahneman, D., Knetsch, J. L., & Thaler, R. H. (1991). Anomalies: Theendowment effect, loss aversion, and status quo bias. The Journal ofEconomic Perspectives, 5, 193–206. http://dx.doi.org/10.1257/jep.5.1.193
Klayman, J., & Ha, Y. W. (1987). Confirmation, disconfirmation, andinformation in hypothesis testing. Psychological Review, 94, 211–228.http://dx.doi.org/10.1037/0033-295X.94.2.211
Knetsch, J. (1989). The endowment effect and evidence of nonreversibleindifference curves. The American Economic Review, 79, 1277–1284.
Knetsch, J. L., & Sinden, J. A. (1984). Willingness to pay and compensa-tion demanded: Experimental evidence of an unexpected disparity inmeasures of value. The Quarterly Journal of Economics, 99, 507–521.http://dx.doi.org/10.2307/1885962
Köszegi, B., & Rabin, M. (2006). A model of reference-dependent pref-erences. The Quarterly Journal of Economics, 121, 1133–1165.
Krajbich, I., Armel, C., & Rangel, A. (2010). Visual fixations and thecomputation and comparison of value in simple choice. Nature Neuro-science, 13, 1292–1298. http://dx.doi.org/10.1038/nn.2635
Loewenstein, G., & Adler, D. (1995). A bias in the prediction of tastes. TheEconomic Journal, 105, 929–937. http://dx.doi.org/10.2307/2235159
Markman, A., & Medin, D. L. (1995). Similarity and alignment in choice.Organizational Behavior and Human Decision Processes, 63, 117–130.http://dx.doi.org/10.1006/obhd.1995.1067
Nayakankuppam, D., & Mishra, H. (2005). The endowment effect: Rose-tinted and dark-tinted glasses. Journal of Consumer Research, 32, 390–395. http://dx.doi.org/10.1086/497550
Nilsson, H., Rieskamp, J., & Wagenmakers, E. J. (2011). HierarchicalBayesian parameter estimation for cumulative prospect theory. Journalof Mathematical Psychology, 55, 84–93. http://dx.doi.org/10.1016/j.jmp.2010.08.006
Pachur, T., & Scheibehenne, B. (2012). Constructing preference fromexperience: The endowment effect reflected in external informationsearch. Journal of Experimental Psychology: Learning, Memory, andCognition, 38, 1108–1116. http://dx.doi.org/10.1037/a0027637
Pettibone, J. C. (2012). Testing the effect of time pressure on asymmetricdominance and compromise decoys in choice. Judgment and DecisionMaking, 7, 513–523.
Ratcliff, R., & Smith, P. L. (2004). A comparison of sequential samplingmodels for two-choice reaction time. Psychological Review, 111, 333–367. http://dx.doi.org/10.1037/0033-295X.111.2.333
Rieskamp, J. (2008). The probabilistic nature of preferential choice. Jour-nal of Experimental Psychology: Learning, Memory, and Cognition, 34,1446–1465. http://dx.doi.org/10.1037/a0013646
Roe, R. M., Busemeyer, J. R., & Townsend, J. T. (2001). Multialternativedecision field theory: A dynamic connectionist model of decision mak-ing. Psychological Review, 108, 370–392. http://dx.doi.org/10.1037/0033-295X.108.2.370
Samuelson, W., & Zeckhauser, R. (1988). Status quo bias in decisionmaking. Journal of Risk and Uncertainty, 1, 7–59. http://dx.doi.org/10.1007/BF00055564
Simonson, I. (1989). Choice based on reasons: The case of attraction andcompromise effects. Journal of Consumer Research, 16, 158–174.http://dx.doi.org/10.1086/209205
Simonson, I., Carmon, Z., & O’Curry, S. (1994). Experimental evidence onthe negative effect of product features and sales promotions on brandchoices. Marketing Science, 13, 23–40. http://dx.doi.org/10.1287/mksc.13.1.23
Sloman, S. A. (1996). The empirical case for two systems of reasoning.Psychological Bulletin, 119, 3–22. http://dx.doi.org/10.1037/0033-2909.119.1.3
Slovic, P., & MacPhillamy, D. (1974). Dimensional commensurability andcue utilization in comparative judgment. Organizational Behavior &Human Performance, 11, 172–194. http://dx.doi.org/10.1016/0030-5073(74)90013-0
Strack, F., & Mussweiler, T. (1997). Explaining the enigmatic anchoringeffect: Mechanisms of selective accessibility. Journal of Personality andSocial Psychology, 73, 437–446. http://dx.doi.org/10.1037/0022-3514.73.3.437
Strahilevitz, M. A., & Loewenstein, G. (1998). The effect of ownershiphistory on the valuation of objects. The Journal of Consumer Research,25, 276–289. http://dx.doi.org/10.1086/209539
Thaler, R. (1980). Toward a positive theory of consumer choice. Journal ofEconomic Behavior & Organization, 1, 39–60. http://dx.doi.org/10.1016/0167-2681(80)90051-7
Trueblood, J. S. (2015). Reference point effects in riskless choicewithout loss aversion. Decision, 2, 13–26. http://dx.doi.org/10.1037/dec0000015
Trueblood, J. S., Brown, S. D., & Heathcote, A. (2014). The multiattributelinear ballistic accumulator model of context effects in multialternativechoice. Psychological Review, 121, 179–205. http://dx.doi.org/10.1037/a0036137
Tsetsos, K., Chater, N., & Usher, M. (2012). Salience driven valueintegration explains decision biases and preference reversal. PNASProceedings of the National Academy of Sciences of the United Statesof America, 109, 9659 –9664. http://dx.doi.org/10.1073/pnas.1119569109
Tversky, A. (1972). Elimination by aspects: A theory of choice. Psycho-logical Review, 79, 281–299. http://dx.doi.org/10.1037/h0032955
Tversky, A. (1977). Features of similarity. Psychological Review, 84,327–352. http://dx.doi.org/10.1037/0033-295X.84.4.327
Tversky, A., & Kahneman, D. (1991). Loss aversion in riskless choice: Areference-dependent model. The Quarterly Journal of Economics, 106,1039–1061. http://dx.doi.org/10.2307/2937956
Tversky, A., & Kahneman, D. (1992). Advances in prospect theory:Cumulative representation of uncertainty. Journal of Risk and Uncer-tainty, 5, 297–323. http://dx.doi.org/10.1007/BF00122574
Tversky, A., & Simonson, I. (1993). Context-dependent preferences. Man-agement Science, 39, 1179–1189.
Usher, M., & McClelland, J. L. (2004). Loss aversion and inhibition indynamical models of multialternative choice. Psychological Review,111, 757–769. http://dx.doi.org/10.1037/0033-295X.111.3.757
Weber, E. U., & Johnson, E. J. (2006). Constructing preferences frommemory. In P. Slovic & S. Lichtenstein (Eds.), The construction ofpreference (pp. 397–410). New York, NY: Cambridge University Press.http://dx.doi.org/10.1017/CBO9780511618031.022
Willemsen, M. C., Böckenholt, U., & Johnson, E. J. (2011). Choice byvalue encoding and value construction: Processes of loss aversion.
Thi
sdo
cum
ent
isco
pyri
ghte
dby
the
Am
eric
anPs
ycho
logi
cal
Ass
ocia
tion
oron
eof
itsal
lied
publ
ishe
rs.
Thi
sar
ticle
isin
tend
edso
lely
for
the
pers
onal
use
ofth
ein
divi
dual
user
and
isno
tto
bedi
ssem
inat
edbr
oadl
y.
16 BHATIA
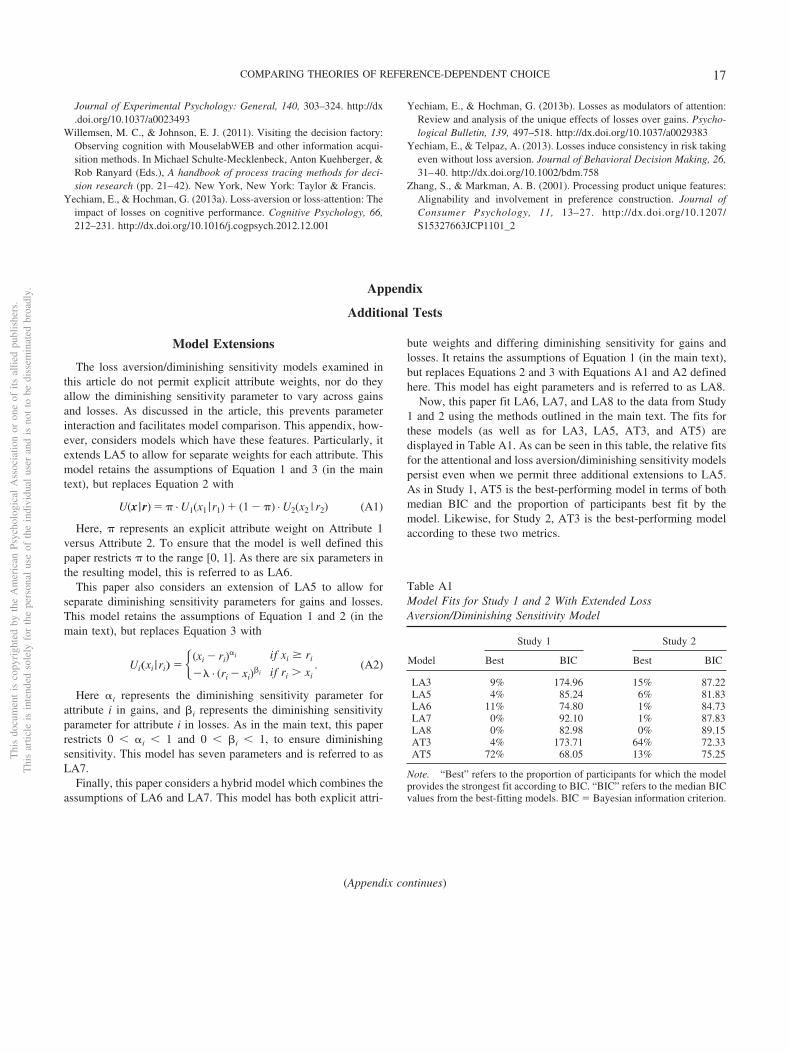
Journal of Experimental Psychology: General, 140, 303–324. http://dx.doi.org/10.1037/a0023493
Willemsen, M. C., & Johnson, E. J. (2011). Visiting the decision factory:Observing cognition with MouselabWEB and other information acqui-sition methods. In Michael Schulte-Mecklenbeck, Anton Kuehberger, &Rob Ranyard (Eds.), A handbook of process tracing methods for deci-sion research (pp. 21–42). New York, New York: Taylor & Francis.
Yechiam, E., & Hochman, G. (2013a). Loss-aversion or loss-attention: Theimpact of losses on cognitive performance. Cognitive Psychology, 66,212–231. http://dx.doi.org/10.1016/j.cogpsych.2012.12.001
Yechiam, E., & Hochman, G. (2013b). Losses as modulators of attention:Review and analysis of the unique effects of losses over gains. Psycho-logical Bulletin, 139, 497–518. http://dx.doi.org/10.1037/a0029383
Yechiam, E., & Telpaz, A. (2013). Losses induce consistency in risk takingeven without loss aversion. Journal of Behavioral Decision Making, 26,31–40. http://dx.doi.org/10.1002/bdm.758
Zhang, S., & Markman, A. B. (2001). Processing product unique features:Alignability and involvement in preference construction. Journal ofConsumer Psychology, 11, 13–27. http://dx.doi.org/10.1207/S15327663JCP1101_2
Appendix
Additional Tests
Model Extensions
The loss aversion/diminishing sensitivity models examined inthis article do not permit explicit attribute weights, nor do theyallow the diminishing sensitivity parameter to vary across gainsand losses. As discussed in the article, this prevents parameterinteraction and facilitates model comparison. This appendix, how-ever, considers models which have these features. Particularly, itextends LA5 to allow for separate weights for each attribute. Thismodel retains the assumptions of Equation 1 and 3 (in the maintext), but replaces Equation 2 with
U(x |r) � � · U1(x1 |r1) � (1 � �) · U2(x2 | r2) (A1)
Here, � represents an explicit attribute weight on Attribute 1versus Attribute 2. To ensure that the model is well defined thispaper restricts � to the range [0, 1]. As there are six parameters inthe resulting model, this is referred to as LA6.
This paper also considers an extension of LA5 to allow forseparate diminishing sensitivity parameters for gains and losses.This model retains the assumptions of Equation 1 and 2 (in themain text), but replaces Equation 3 with
Ui�xi |ri� ��(xi � ri)�i if xi � ri
�� · (ri � xi)�i if ri � xi
. (A2)
Here �i represents the diminishing sensitivity parameter forattribute i in gains, and �i represents the diminishing sensitivityparameter for attribute i in losses. As in the main text, this paperrestricts 0 � �i � 1 and 0 � �i � 1, to ensure diminishingsensitivity. This model has seven parameters and is referred to asLA7.
Finally, this paper considers a hybrid model which combines theassumptions of LA6 and LA7. This model has both explicit attri-
bute weights and differing diminishing sensitivity for gains andlosses. It retains the assumptions of Equation 1 (in the main text),but replaces Equations 2 and 3 with Equations A1 and A2 definedhere. This model has eight parameters and is referred to as LA8.
Now, this paper fit LA6, LA7, and LA8 to the data from Study1 and 2 using the methods outlined in the main text. The fits forthese models (as well as for LA3, LA5, AT3, and AT5) aredisplayed in Table A1. As can be seen in this table, the relative fitsfor the attentional and loss aversion/diminishing sensitivity modelspersist even when we permit three additional extensions to LA5.As in Study 1, AT5 is the best-performing model in terms of bothmedian BIC and the proportion of participants best fit by themodel. Likewise, for Study 2, AT3 is the best-performing modelaccording to these two metrics.
(Appendix continues)
Table A1Model Fits for Study 1 and 2 With Extended LossAversion/Diminishing Sensitivity Model
Model
Study 1 Study 2
Best BIC Best BIC
LA3 9% 174.96 15% 87.22LA5 4% 85.24 6% 81.83LA6 11% 74.80 1% 84.73LA7 0% 92.10 1% 87.83LA8 0% 82.98 0% 89.15AT3 4% 173.71 64% 72.33AT5 72% 68.05 13% 75.25
Note. “Best” refers to the proportion of participants for which the modelprovides the strongest fit according to BIC. “BIC” refers to the median BICvalues from the best-fitting models. BIC � Bayesian information criterion.
Thi
sdo
cum
ent
isco
pyri
ghte
dby
the
Am
eric
anPs
ycho
logi
cal
Ass
ocia
tion
oron
eof
itsal
lied
publ
ishe
rs.
Thi
sar
ticle
isin
tend
edso
lely
for
the
pers
onal
use
ofth
ein
divi
dual
user
and
isno
tto
bedi
ssem
inat
edbr
oadl
y.
17COMPARING THEORIES OF REFERENCE-DEPENDENT CHOICE
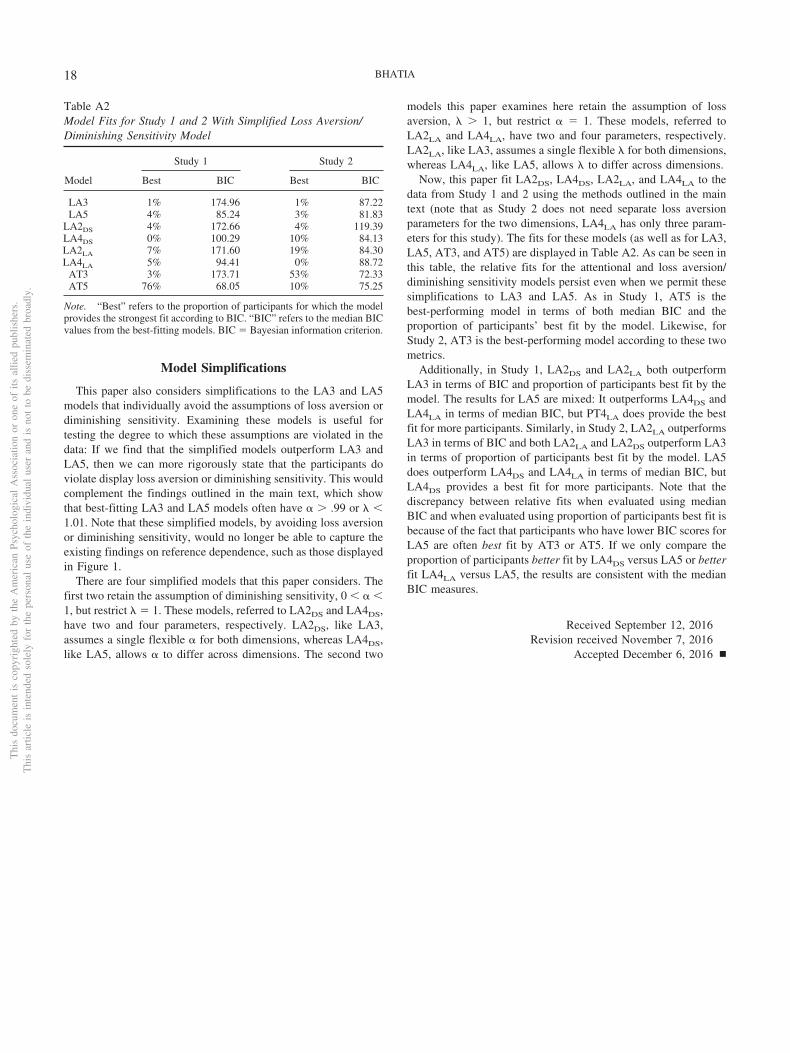
Model Simplifications
This paper also considers simplifications to the LA3 and LA5models that individually avoid the assumptions of loss aversion ordiminishing sensitivity. Examining these models is useful fortesting the degree to which these assumptions are violated in thedata: If we find that the simplified models outperform LA3 andLA5, then we can more rigorously state that the participants doviolate display loss aversion or diminishing sensitivity. This wouldcomplement the findings outlined in the main text, which showthat best-fitting LA3 and LA5 models often have � � .99 or � �1.01. Note that these simplified models, by avoiding loss aversionor diminishing sensitivity, would no longer be able to capture theexisting findings on reference dependence, such as those displayedin Figure 1.
There are four simplified models that this paper considers. Thefirst two retain the assumption of diminishing sensitivity, 0 � � �1, but restrict � � 1. These models, referred to LA2DS and LA4DS,have two and four parameters, respectively. LA2DS, like LA3,assumes a single flexible � for both dimensions, whereas LA4DS,like LA5, allows � to differ across dimensions. The second two
models this paper examines here retain the assumption of lossaversion, � � 1, but restrict � � 1. These models, referred toLA2LA and LA4LA, have two and four parameters, respectively.LA2LA, like LA3, assumes a single flexible � for both dimensions,whereas LA4LA, like LA5, allows � to differ across dimensions.
Now, this paper fit LA2DS, LA4DS, LA2LA, and LA4LA to thedata from Study 1 and 2 using the methods outlined in the maintext (note that as Study 2 does not need separate loss aversionparameters for the two dimensions, LA4LA has only three param-eters for this study). The fits for these models (as well as for LA3,LA5, AT3, and AT5) are displayed in Table A2. As can be seen inthis table, the relative fits for the attentional and loss aversion/diminishing sensitivity models persist even when we permit thesesimplifications to LA3 and LA5. As in Study 1, AT5 is thebest-performing model in terms of both median BIC and theproportion of participants’ best fit by the model. Likewise, forStudy 2, AT3 is the best-performing model according to these twometrics.
Additionally, in Study 1, LA2DS and LA2LA both outperformLA3 in terms of BIC and proportion of participants best fit by themodel. The results for LA5 are mixed: It outperforms LA4DS andLA4LA in terms of median BIC, but PT4LA does provide the bestfit for more participants. Similarly, in Study 2, LA2LA outperformsLA3 in terms of BIC and both LA2LA and LA2DS outperform LA3in terms of proportion of participants best fit by the model. LA5does outperform LA4DS and LA4LA in terms of median BIC, butLA4DS provides a best fit for more participants. Note that thediscrepancy between relative fits when evaluated using medianBIC and when evaluated using proportion of participants best fit isbecause of the fact that participants who have lower BIC scores forLA5 are often best fit by AT3 or AT5. If we only compare theproportion of participants better fit by LA4DS versus LA5 or betterfit LA4LA versus LA5, the results are consistent with the medianBIC measures.
Received September 12, 2016Revision received November 7, 2016
Accepted December 6, 2016 �
Table A2Model Fits for Study 1 and 2 With Simplified Loss Aversion/Diminishing Sensitivity Model
Model
Study 1 Study 2
Best BIC Best BIC
LA3 1% 174.96 1% 87.22LA5 4% 85.24 3% 81.83
LA2DS 4% 172.66 4% 119.39LA4DS 0% 100.29 10% 84.13LA2LA 7% 171.60 19% 84.30LA4LA 5% 94.41 0% 88.72
AT3 3% 173.71 53% 72.33AT5 76% 68.05 10% 75.25
Note. “Best” refers to the proportion of participants for which the modelprovides the strongest fit according to BIC. “BIC” refers to the median BICvalues from the best-fitting models. BIC � Bayesian information criterion.
Thi
sdo
cum
ent
isco
pyri
ghte
dby
the
Am
eric
anPs
ycho
logi
cal
Ass
ocia
tion
oron
eof
itsal
lied
publ
ishe
rs.
Thi
sar
ticle
isin
tend
edso
lely
for
the
pers
onal
use
ofth
ein
divi
dual
user
and
isno
tto
bedi
ssem
inat
edbr
oadl
y.
18 BHATIA