lesson plan: maths - stem.org.uk · lesson plan: maths maths ... as soon as a degree selec on has...
TRANSCRIPT
Lesson plan: Maths
Maths
This is an exercise aimed at students currently taking A-level Mathemacs and who are curious to knowwhat direcon it could lead them in terms of their higher educaon choices.
Individuals with an A-level in Mathemacs go on to enjoy a vast array of occupaons, but first let’s ex-plore the dierent degree opons for A-level Mathemacs students.
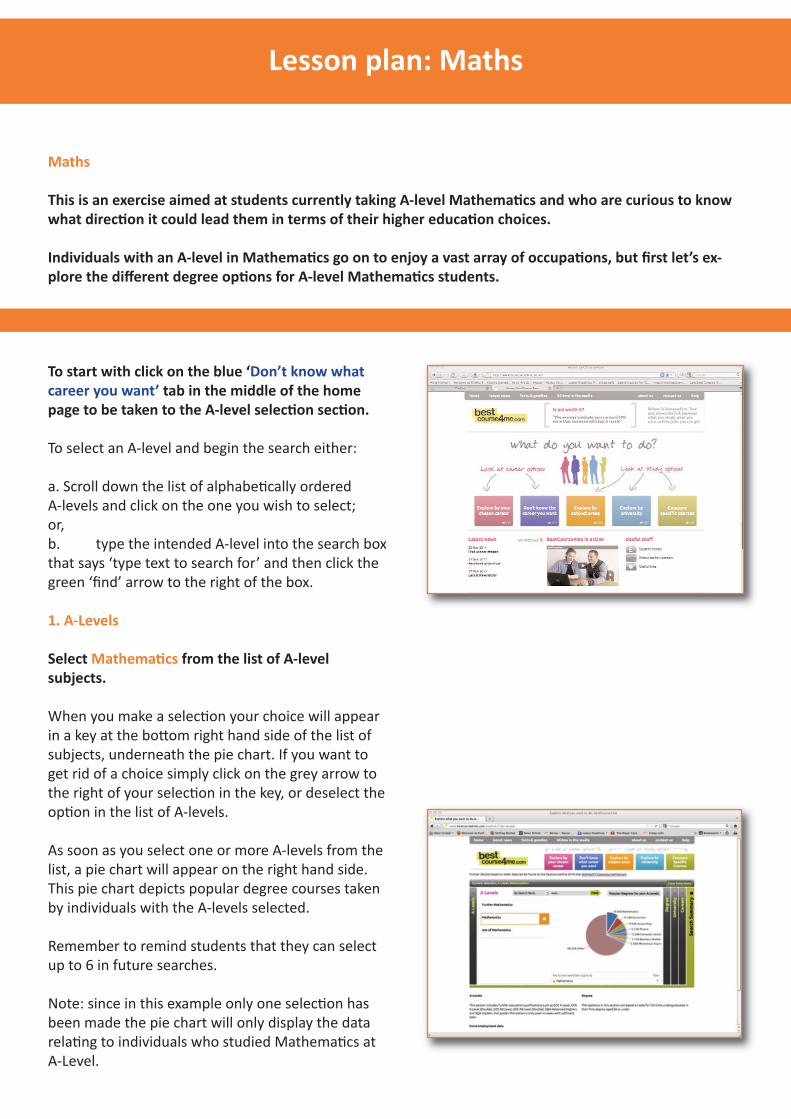
To start with click on the blue ‘Don’t know what career you want’ tab in the middle of the homepage to be taken to the A-level selecon secon.
To select an A-level and begin the search either:
a. Scroll down the list of alphabecally ordered A-levels and click on the one you wish to select;or,b. type the intended A-level into the search boxthat says ‘type text to search for’ and then click thegreen ‘find’ arrow to the right of the box.
1. A-Levels
Select Mathemacs from the list of A-level subjects.
When you make a selecon your choice will appearin a key at the boom right hand side of the list ofsubjects, underneath the pie chart. If you want toget rid of a choice simply click on the grey arrow tothe right of your selecon in the key, or deselect theopon in the list of A-levels.
As soon as you select one or more A-levels from thelist, a pie chart will appear on the right hand side.This pie chart depicts popular degree courses takenby individuals with the A-levels selected.
Remember to remind students that they can selectup to 6 in future searches.
Note: since in this example only one selecon hasbeen made the pie chart will only display the datarelang to individuals who studied Mathemacs atA-Level.
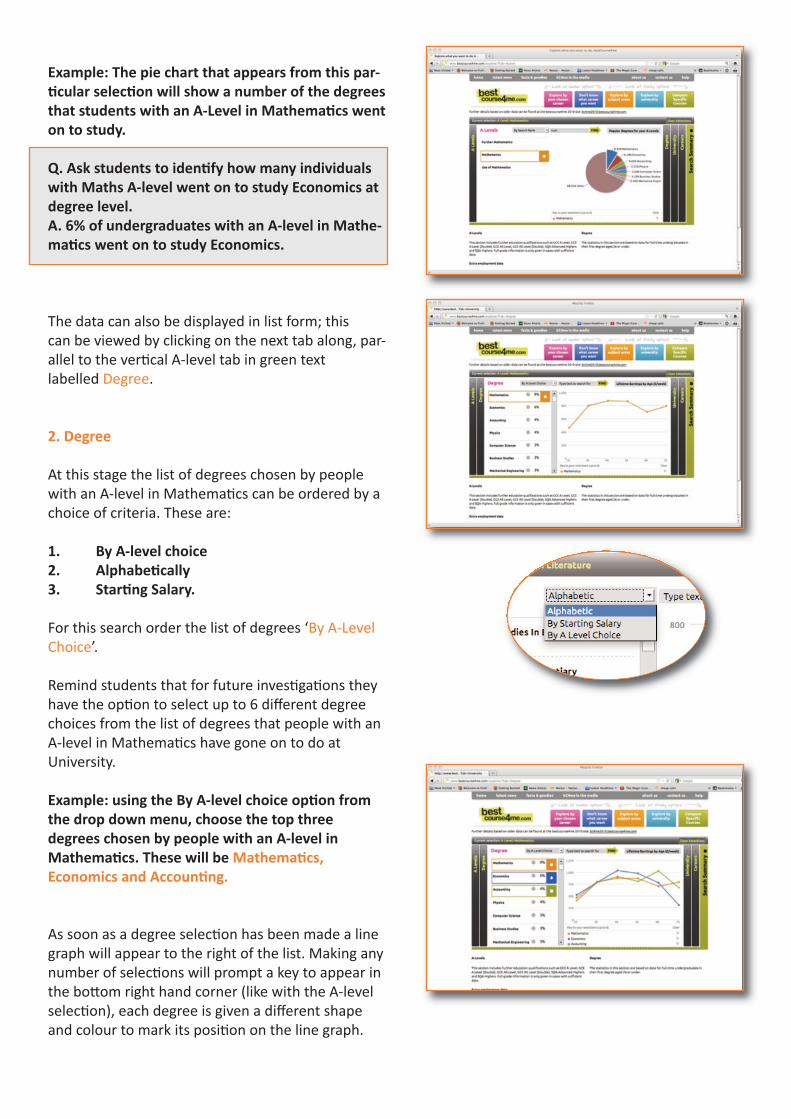
Example: The pie chart that appears from this par-cular selecon will show a number of the degreesthat students with an A-Level in Mathemacs wenton to study.
Q. Ask students to idenfy how many individualswith Maths A-level went on to study Economics atdegree level.A. 6% of undergraduates with an A-level in Mathe-macs went on to study Economics.
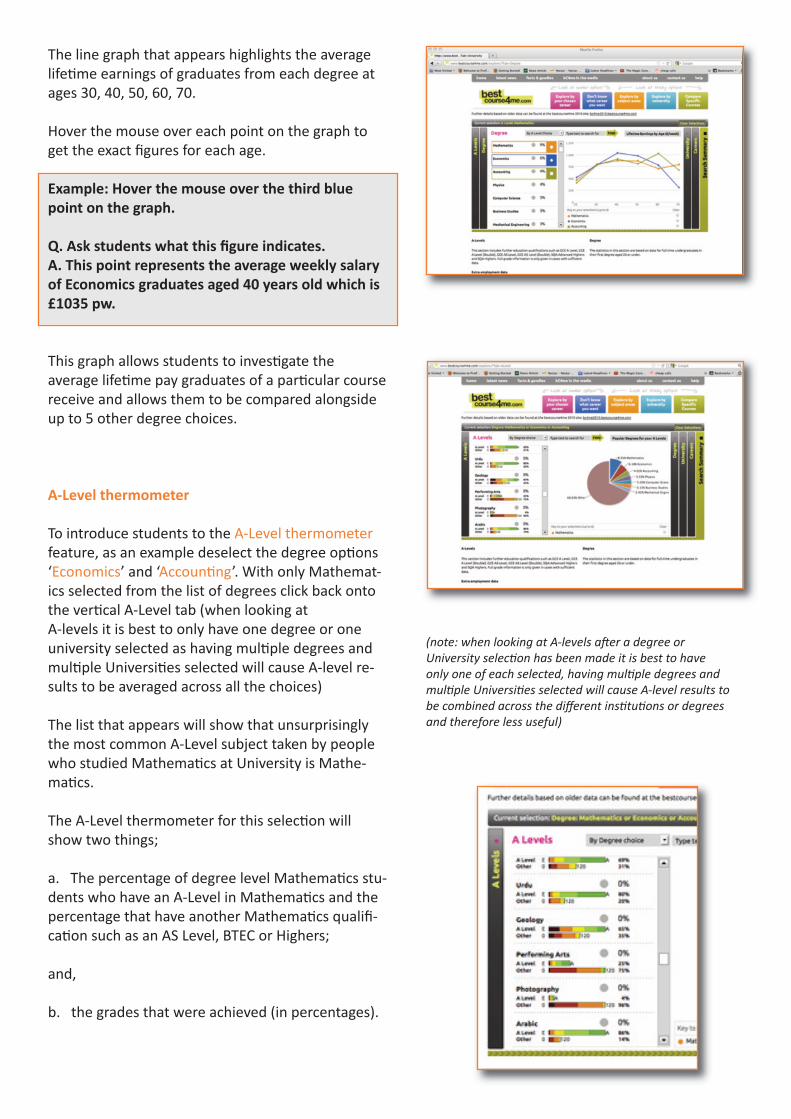
The data can also be displayed in list form; this can be viewed by clicking on the next tab along, par-allel to the vercal A-level tab in green text labelled Degree.
2. Degree
At this stage the list of degrees chosen by peoplewith an A-level in Mathemacs can be ordered by achoice of criteria. These are:
1. By A-level choice2. Alphabecally3. Starng Salary.
For this search order the list of degrees ‘By A-LevelChoice’.
Remind students that for future invesgaons theyhave the opon to select up to 6 dierent degreechoices from the list of degrees that people with anA-level in Mathemacs have gone on to do at University.
Example: using the By A-level choice opon fromthe drop down menu, choose the top three degrees chosen by people with an A-level in Mathemacs. These will be Mathemacs, Economics and Accounng.
As soon as a degree selecon has been made a linegraph will appear to the right of the list. Making anynumber of selecons will prompt a key to appear inthe boom right hand corner (like with the A-levelselecon), each degree is given a dierent shapeand colour to mark its posion on the line graph.
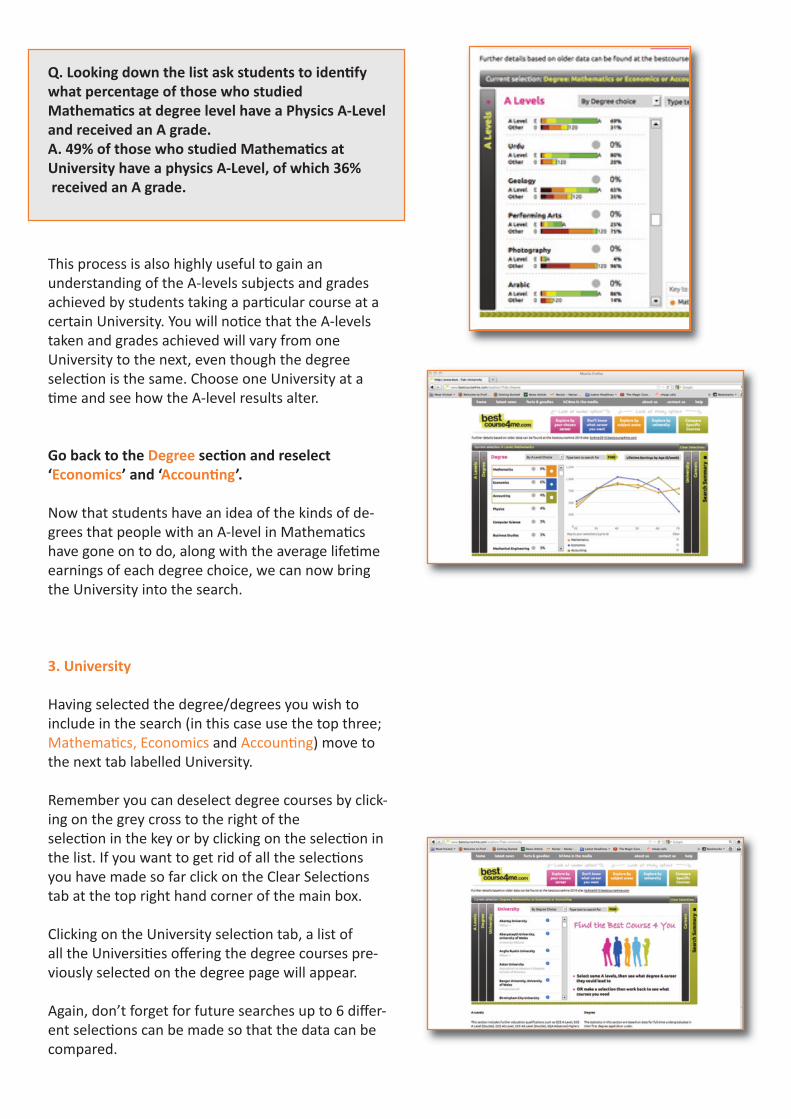
The line graph that appears highlights the averagelifeme earnings of graduates from each degree atages 30, 40, 50, 60, 70.
Hover the mouse over each point on the graph toget the exact figures for each age.
Example: Hover the mouse over the third bluepoint on the graph.
Q. Ask students what this figure indicates.A. This point represents the average weekly salaryof Economics graduates aged 40 years old which is£1035 pw.
This graph allows students to invesgate the average lifeme pay graduates of a parcular coursereceive and allows them to be compared alongsideup to 5 other degree choices.
A-Level thermometer
To introduce students to the A-Level thermometerfeature, as an example deselect the degree opons‘Economics’ and ‘Accounng’. With only Mathemat-ics selected from the list of degrees click back ontothe vercal A-Level tab (when looking at A-levels it is best to only have one degree or oneuniversity selected as having mulple degrees andmulple Universies selected will cause A-level re-sults to be averaged across all the choices)
The list that appears will show that unsurprisinglythe most common A-Level subject taken by peoplewho studied Mathemacs at University is Mathe-macs.
The A-Level thermometer for this selecon willshow two things;
a. The percentage of degree level Mathemacs stu-dents who have an A-Level in Mathemacs and thepercentage that have another Mathemacs qualifi-caon such as an AS Level, BTEC or Highers;
and,
b. the grades that were achieved (in percentages).
(note: when looking at A-levels aer a degree or University selecon has been made it is best to have only one of each selected, having mulple degrees andmulple Universies selected will cause A-level results tobe combined across the dierent instuons or degreesand therefore less useful)
Q. Looking down the list ask students to idenfywhat percentage of those who studied Mathemacs at degree level have a Physics A-Leveland received an A grade. A. 49% of those who studied Mathemacs at University have a physics A-Level, of which 36%received an A grade.
This process is also highly useful to gain an understanding of the A-levels subjects and gradesachieved by students taking a parcular course at acertain University. You will noce that the A-levelstaken and grades achieved will vary from one University to the next, even though the degree selecon is the same. Choose one University at ame and see how the A-level results alter.
Go back to the Degree secon and reselect ‘Economics’ and ‘Accounng’.
Now that students have an idea of the kinds of de-grees that people with an A-level in Mathemacshave gone on to do, along with the average lifemeearnings of each degree choice, we can now bringthe University into the search.
3. University
Having selected the degree/degrees you wish to include in the search (in this case use the top three;Mathemacs, Economics and Accounng) move tothe next tab labelled University.
Remember you can deselect degree courses by click-ing on the grey cross to the right of the selecon in the key or by clicking on the selecon inthe list. If you want to get rid of all the seleconsyou have made so far click on the Clear Seleconstab at the top right hand corner of the main box.
Clicking on the University selecon tab, a list of all the Universies oering the degree courses pre-viously selected on the degree page will appear.
Again, don’t forget for future searches up to 6 dier-ent selecons can be made so that the data can becompared.
Remember that if students have a parcular University in mind they can make a quick search bytyping their choice into the search box and clickingthe green ‘find’ arrow.
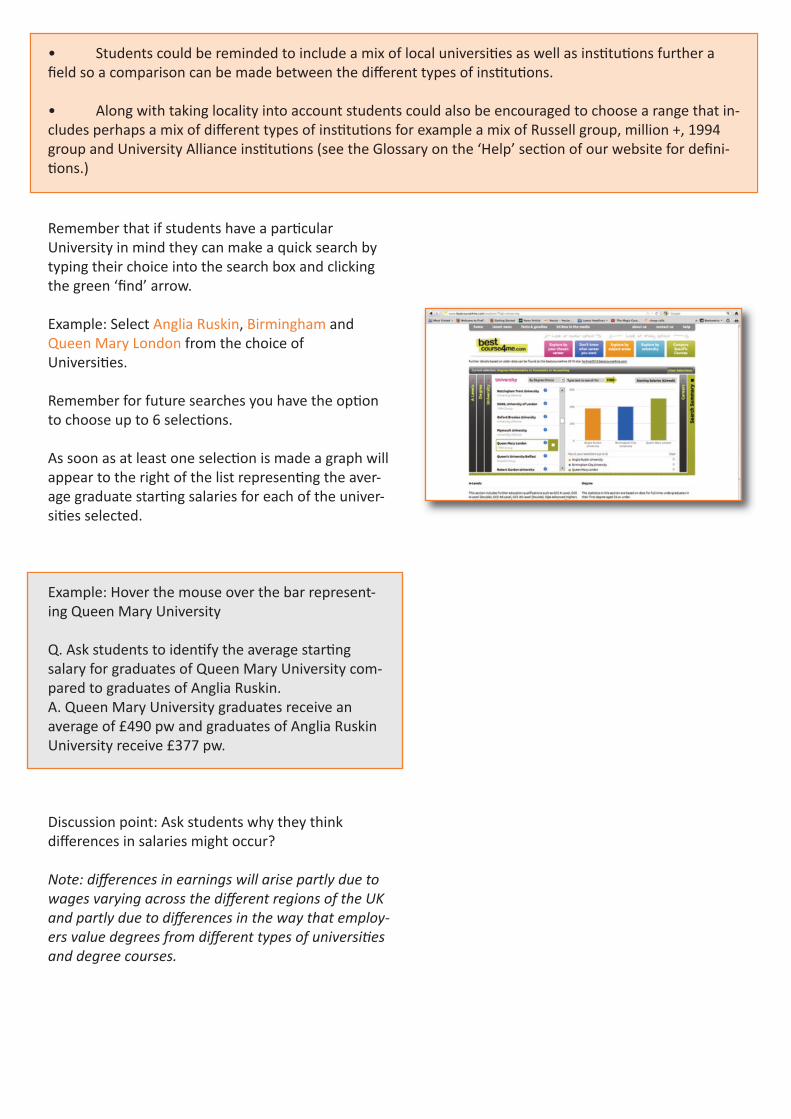
Example: Select Anglia Ruskin, Birmingham andQueen Mary London from the choice of Universies.
Remember for future searches you have the oponto choose up to 6 selecons.
As soon as at least one selecon is made a graph willappear to the right of the list represenng the aver-age graduate starng salaries for each of the univer-sies selected.
Example: Hover the mouse over the bar represent-ing Queen Mary University
Q. Ask students to idenfy the average starngsalary for graduates of Queen Mary University com-pared to graduates of Anglia Ruskin. A. Queen Mary University graduates receive an average of £490 pw and graduates of Anglia RuskinUniversity receive £377 pw.
Discussion point: Ask students why they think dierences in salaries might occur?
Note: dierences in earnings will arise partly due towages varying across the dierent regions of the UKand partly due to dierences in the way that employ-ers value degrees from dierent types of universiesand degree courses.
• Students could be reminded to include a mix of local universies as well as instuons further afield so a comparison can be made between the dierent types of instuons.
• Along with taking locality into account students could also be encouraged to choose a range that in-cludes perhaps a mix of dierent types of instuons for example a mix of Russell group, million +, 1994group and University Alliance instuons (see the Glossary on the ‘Help’ secon of our website for defini-ons.)
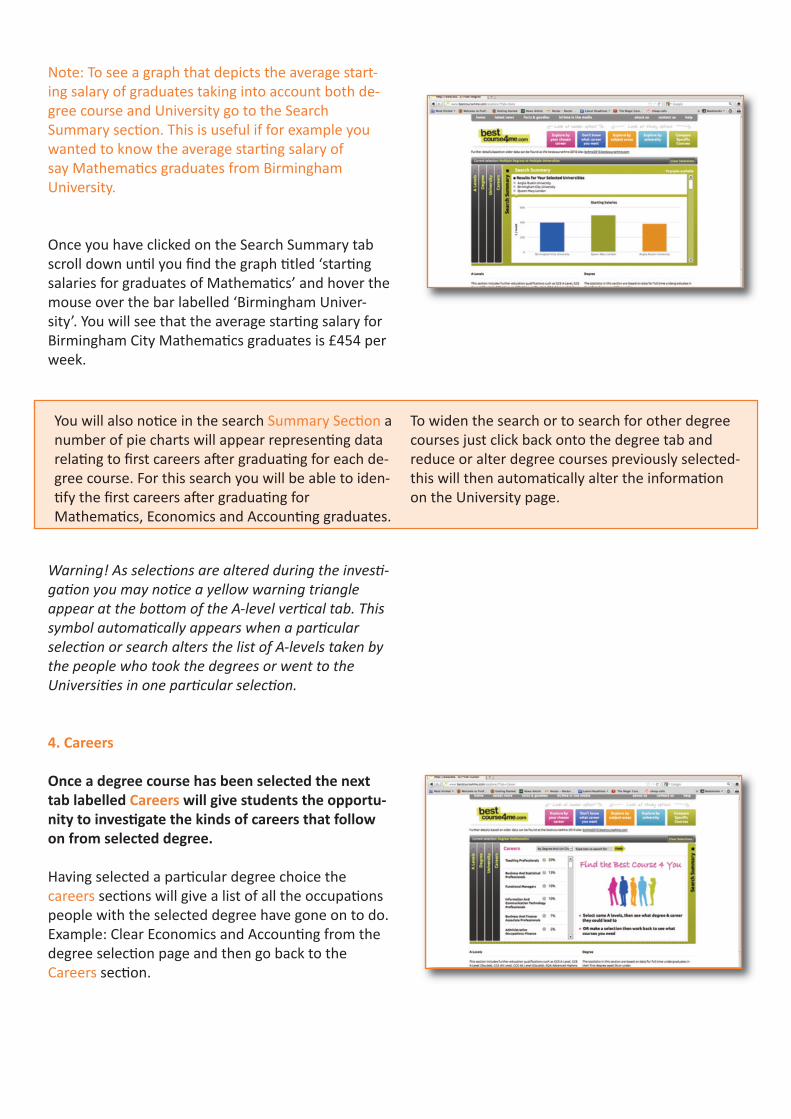
Note: To see a graph that depicts the average start-ing salary of graduates taking into account both de-gree course and University go to the SearchSummary secon. This is useful if for example youwanted to know the average starng salary of say Mathemacs graduates from Birmingham University.
Once you have clicked on the Search Summary tabscroll down unl you find the graph tled ‘starngsalaries for graduates of Mathemacs’ and hover themouse over the bar labelled ‘Birmingham Univer-sity’. You will see that the average starng salary forBirmingham City Mathemacs graduates is £454 perweek.
Warning! As selecons are altered during the inves-gaon you may noce a yellow warning triangle appear at the boom of the A-level vercal tab. Thissymbol automacally appears when a parcular selecon or search alters the list of A-levels taken bythe people who took the degrees or went to the Universies in one parcular selecon.
4. Careers
Once a degree course has been selected the nexttab labelled Careers will give students the opportu-nity to invesgate the kinds of careers that followon from selected degree.
Having selected a parcular degree choice the careers secons will give a list of all the occupaonspeople with the selected degree have gone on to do. Example: Clear Economics and Accounng from thedegree selecon page and then go back to the Careers secon.
You will also noce in the search Summary Secon anumber of pie charts will appear represenng datarelang to first careers aer graduang for each de-gree course. For this search you will be able to iden-fy the first careers aer graduang forMathemacs, Economics and Accounng graduates.
To widen the search or to search for other degreecourses just click back onto the degree tab and reduce or alter degree courses previously selected-this will then automacally alter the informaon on the University page.
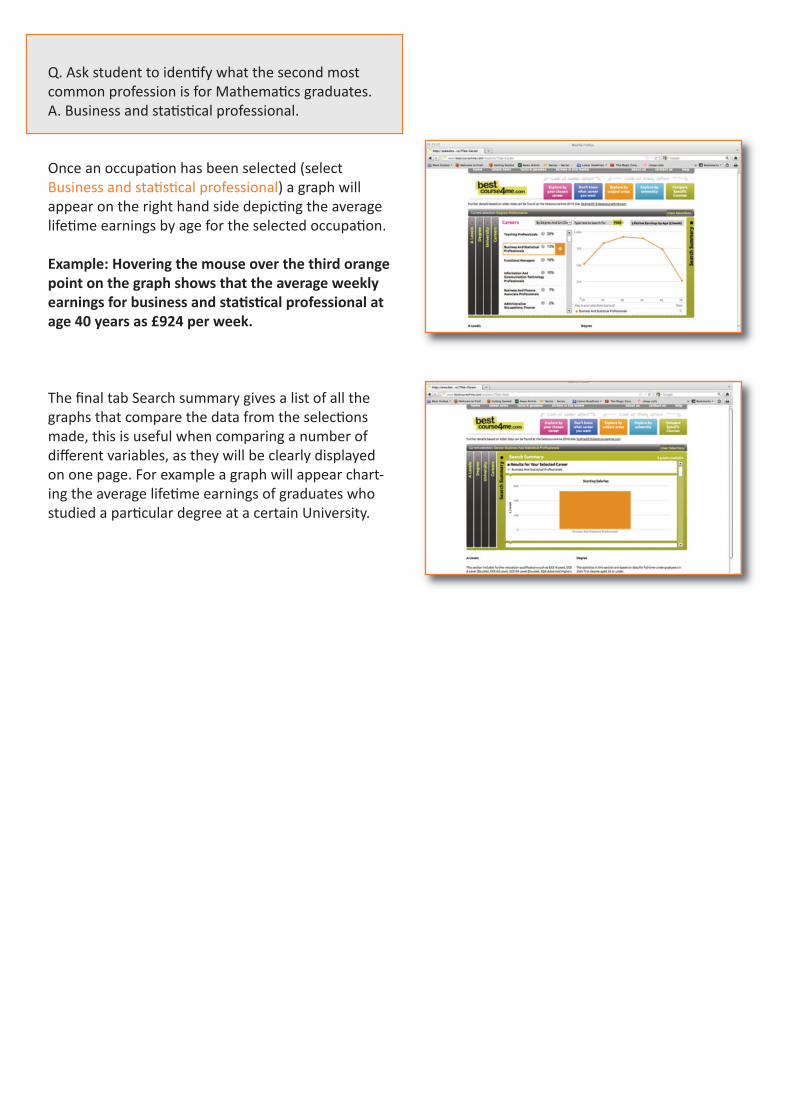
Q. Ask student to idenfy what the second mostcommon profession is for Mathemacs graduates.A. Business and stascal professional.
Once an occupaon has been selected (selectBusiness and stascal professional) a graph will appear on the right hand side depicng the averagelifeme earnings by age for the selected occupaon.
Example: Hovering the mouse over the third orangepoint on the graph shows that the average weeklyearnings for business and stascal professional atage 40 years as £924 per week.
The final tab Search summary gives a list of all thegraphs that compare the data from the seleconsmade, this is useful when comparing a number ofdierent variables, as they will be clearly displayedon one page. For example a graph will appear chart-ing the average lifeme earnings of graduates whostudied a parcular degree at a certain University.