life history of the sea lamprey of cayuga. lake, new …fishbull.noaa.gov/59-1/wigley.pdf · united...
TRANSCRIPT

UNITED STATES DEPARTMENT OF THE INTERIOR • Fred A. Seaton, Secretary
FISH AND WILDLIFE SERVICE • Arnie J. Suomela, C9mmislioner
LIFE HISTORY OF THE SEA LAMPREYOF CAYUGA. LAKE, NEW YORK
By ROLAND L. WIGLEY
FISHERY BULLETIN 154
From Fishery Bulletin of the Fish and Wildlife'Service
yOLUME 59
PUBLISHED BY U.S. FISH AND WILDLIFE SERVICE. WASHINGTON. 1959
PRINTED AT U.S. GOVERNMENT PRINTING OFFICE, WASHINGTON
For sale by the Superintendent of Documents, U.S. Government Prlntlnl1 Office,WashlnlUon l5, D.C. Price 40 cents

Wigley, Roland LLife history of the sea lamprey of Cayuga Lake, New
York. Washingto~, U. S. Govt. Print. Off., 1959.
lv, 561-617 p. lIlus., map. diagrs., tables. 26 em. (U. S. Fishand Wildlife Service. Fishery bulletin 154)
"I<'rom Fishery bulletin of the Fish and Wildlife Service, \'olume 59."Bibliography: p. 616-617.
1. Lampreys. I. Title. (Series: U. S. Fish and WildlifeService. Fishery bulletin, v. 59, no. 154)
[SHll.A25 vol. 59, no. 154] Int 59-88
U. S. Dept. of the Interior. Libraryfor Library of Congress
~ibrary of Congress catalog card for this bulletin:
u. S. Fish and, Wildlife S6f"lJice.Fishery bulletin. v. 1-
Washington, U. S. Govt. Print. Off., 1881-19T. in UlWl., maPII (part fold.) 28-28 em.
Some volB. luued in the congreulonallel'les as SeDate or Rouedocuments.
Bulletins compoeiDg T. 4'1- a1Bo numbered 1-Title varleB: T. 1-49, Bullet1D.VolB. 1-49 lB8ued by Bureau of FlBherles (called JI'I8b Oomm l-9II,
T.1-2S)
1. Flsherl_U. S. 2. JI'I8h-culture-U. S. L Title.
SHll.A25
Llbr&r7 of Congrea
639.206178
II
Library of Congress catalog card for the series, Fishery Bulletin of the Fishand Wildlife Service:
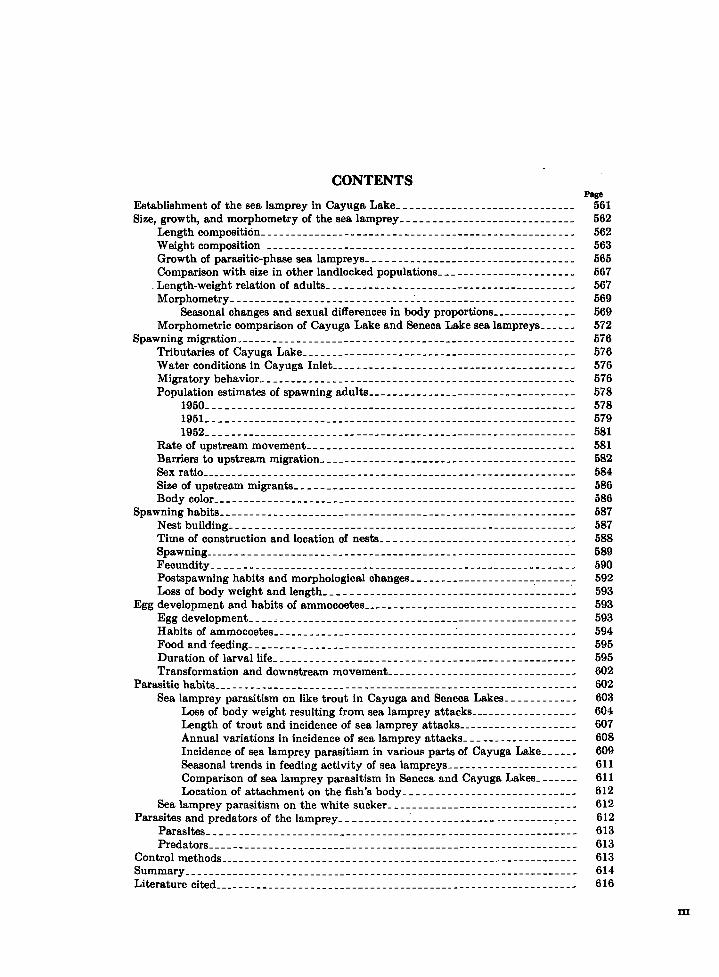
CONTENTSEstablishment of the sea lamprey in Cayuga Lake _Size, growth, and morphometry of the sea lamprey _
Length composni6n _Weight composition _Growth of parasitic-phase sea lampreys _Comparison with size in other landlocked populations _
"Length-weight relation of adults _~orphometry ~ _
Seasonal changes and sexual differences in body proportions _~orphometric comparison of Cayuga Lake and Seneca Lake sea lampreys _
Spawning migration _Tributaries of Cayuga Lake _Water conditions in Cayuga Inlet _Migratory behavior "_Population estimates of spawning adults _
1950 _1951 _1952 _
Rate of upstream movement _Barriers to upstream migration _Sex ratio _Size of upstream migrants _Body color _
Spawninghabns _Nest building. _Time of construction and location of nests •Spawning ~_
Fecundity _
Postspawning habits and morphological changes _Loss of body weight and length " "_
Egg development and habits of ammocoetes _Egg development " _Habits of ammocoetes ~ _Food and"feeding _Duration of larval life _Transformation and downstream movement _
Parasitic habits _
Sea lamprey parasitism on like trout in Cayuga and Seneca Lakes _Loss of body weight resulting from sea lamprey attacks _Length of trout and incidence of sea lamprey attacks _Annual variations in incidence of sea lamprey attacks - __ - - - - - - - - --Incidence of sea lamprey parasitism in various parts of Cayuga Lake _Seasonal trends in feeding activity of sea lampreys. --Comparison of sea lamprey parasitism in Seneca and Cayuga Lakes_ - - - - --Location of attachment 011 the fish's body _
Sea lamprey parasitism on the white sucker - __ - - - - - - - - --Parasites and predators of the lamprey ~ . ~ _
parasites _Predators _
Control methods _Summary _Literature cited _
Page561562562563565567567569569572576576576576578578579581581582584586586587587588589590592593593593594595595602602603604607608609611611612612612613613613614616
m

IV
ABSTRACTA life history study of the sea lamprey, Petromyson marinus Linnaeus, in Cayuga
Lake, N.Y., was conducted during 1950, 1951, and 1952. One of the major objectives was to obtain biological data concerning this endemic stock of sea lampreysfor comparison with the newly established stocks in the Great Lakes.
Sexually mature sea lampreys captured on their spawning migration in CayugaInlet were the basis of much of this study. Such items as meristic counts, bodyproportions, body color, sex ratios, lengths and weights, fecundity, rate of upstreamtravel, effect of dams in retarding upstream movement, nesting habits, parasites,predators, estimates of abundance, and morphological changes were based onmature upstream migrants. Sea lampreys were procured by weir and trap operations and captured by hand. Tagging and marking' programs each spring madeit possible to determine movements and morphological changes of individual lampreys, in addition to estimating the number of upstream migrants.
Growth of parasitic-phase sea lampreys was estimated from measurements ofspecimens captured in Cayuga Inlet and Cayuga Lake proper.
The incubation period of lamprey eggs and the habits of ammocoetes and transforming lampreys were ascertained from specimens kept in hatchery troughs andraceways. Length-frequency and weight-frequency distributions, together with thelength-weight regression, of ammocoetes from Cayuga Inlet were utilized for estimating the duration of their larval life.
Lake trout, Salvelinus n. namayc"Ush (Walbaum), from Cayuga Lake and SenecaLake were the subject of an inquiry into the effects of sea lamprey attacks.Incidence of sea lamprey attacks on the white sucker, Catosto7llus c. commerson/:(LacepMe), was investigated.
Three methods are suggested for reducing the number of sea lampreys in CayugaLake.
LIFE HISTORY OF THE SEA LAMPREY OF CAYUGA LAKE (N.Y.)
By Roland L. Wigley, Fullery Research Biologist. BUREAU OF COMMERCIAL FISHERIES
In recent. years the sea lamprey, Petromyzonmari.nu8 Linnaeus, has attracted the attention ofcommercial fishermen, sportsmen, and fishery biologists because of the destruction of food and gamefishes attributed to this parasite. It was the invasion and rapid multiplication of the sea lamprey inthe upper Great Lakes, coincident with the drasticdecline of food fishes, especially lake trout in LakeHuron and Lake Michigan, which stimulated interest in the life-history study of the sea lamprey.One phase of the Great Lakes sea lamprey investigation was to obtain detailed information on bio":'logical characteristics of an endemic sea lampreypopulation in order to make comparisons with thenewly expanding Great Lakes population.
Cayuga Lake has been inhabited by a thrivingsea lamprey population for centuries. In addition to offering a natural habitat of limited size,Cayuga Lake has only one tributary that is extensively used by the sea lamprey for spawning.Thus, a study of the Cayuga Lake sea lamprey wasundertaken in order to obtain comparative dataand basic information pertaining to the life cycleof the sea lamprey.
The yeR! 1875 marks the beginning of scientificinquiry into the taxonomic status and life historyof the Cayuga Lake sea lamprey. In the spring ofthat year, a large male lamprey 'Yas captured inCascadilla Creek, a tributary of Cayuga Lake nearIthaca. This specimen was unusually large andits coloration and large ropelike dorsal ridge weregreatly different from immature specimens previously taken from the lake. Wilder studied thisspecimen and, after he obta.ined others, named itPetromyzon marinus d(J"l's;'tus (Jordan and Gilbert,1883).
Meek (1889) summarized observations onspawning habits and gave some dat.a on size composit.ion and sex ratio of the 1886 spawning run inCayuga Inlet. Surface (1898, 1899) reported considerable information on natural enemies, hostspedes, and control methods. Gage (1893, 1928)contributed much to our knowledge of the sea
lamprey of Cayuga Lake. His studies encompassed the anatomical and physiological aspects aswell as its life history. His works have long beenconsidered an authoritative source of informationconcerning the sea lamprey.
Profs. Edward C. Raney, Dwight A. Webster,and John C. Ayers, De.partment of Conservation,Cornell University, guided and assisted in theorganization of this study. William F. Carbine,Dr. James W. Moffett, Dr. Ralph Hile, Dr. Vernon C. ~pplegate, and other members of the GreatLakes fishery investigations, the U.S. Fish andWildlife Service, generously provided equipment,technical a.dvice, and aid in preparing the manuscript. Members of the New York State Conservation Department, especially Dr. U. B. Stone,W. G. Bentley, and Dr. R. M. Roecker, aided incollecting lamprey data; C. W. Lyon, J. P. Galligan, Dr. R. D. Sut.tkus, Dr. R. M. Yerger, andmany other associates assisted with the fieldwork;and Douglas S. Robson gave statistical advice.
ESTABLISHMENT OF THE SEA LAMPREYIN CAYUGA LAKE
Prior to 1921, the known range of the sea lamprey in North America extended from the Maritime Provinces of. Canada southward along theAt.la.ntic coast to northern Florida, an<,l westwardup the St. Lawrenc;e drainage into Lake Ontarioand four inland lakes in New York State. In recent times (1921 and later) this range has been extended westward throughout the Great Lakes.Detailed information on this invasion. has beenrecorded by Hubbs and Pope (1937), Radforth(1944), MacKay and MacGillivray, (1949), Shetter (1949), Trautman (1949), Applegate (1950),and Loeb and Hall (1952).
Early accounts in the litera.ture (Goode 1884)describe the capture of large numbers of sea lampreys in some New England rivers for utilizationas food, and indicate that at one time they wereabundant in that region. The sea lamprey is
561

562 FISHERY BULLETIN OF THE FISH AND WILDLIFE SERVICE
anadromous, and until several decades ago wasconsidered to be primarily a marine species. Inrecent years it. has been demonstrated t,hat lampreys can adapt themselves successfully to a lakestream habitat where conditions are suitable, as isevidenced by their recent success in the upperGreat' Lakes. Moreover, several lakes in NewYork, including Cayuga Lake, have supported.landlocked populations of sea lampreys for centuries
During the Pleistocene period, when the glacialGreat Lakes were forming, glacial Cayuga Lakewas also passing through some profound alterations. Ohanges in the outlet drainage of glacialOayuga Lake are of primary importance in thisdiscussion of the sea lamprey's establishment inOayuga Lake. ,
Marine-dwelling sea lampreys may have penetrated into Oayuga Lake through anyone of threedrainages. .
1. The drainage of glacial Oayuga Lake southward into the Susquehanna River. This outletopened up relatively early in the formative periodof the Great Lakes, but was later cut off by a lowerlevel drainage opened to the north and eastthrough the Syracuse, Mohawk, and St. Lawrenceoutlets.
2. At a later date, the Syracuse outlet (via theHudson River) may have permitted access toglacial Cayuga Lake.
3. A still later development was the final disappearance of the ice in the St. Lawrence Valleywhich permitted an arm of the sea to extend upthe St. Lawrence into Lake Champlain. Thissituation would have permitted passage of the sealamprey from the Atlantic Ocean, via the "Ohamplain Sea," into glacial Lake Iroquois and on intoCayuga 'Lake. Another alternative passage inexistence during this same time was from the Atlantic Ocean to the Hudson-Champlain estuary, tothe Mohawk outlet, into glacial Lake Iroquois, andinto Oayuga Lake.
Because the first two routes mentioned abovewould have permitted the sea lamprey to establishitself in all' t,he 'Great Lakes, which did not occuruntil approximately the present century, it wouldappear that the third route was the most probablepath of entrance. The fact that Niagara Fallswould have blocked their movement into LakeErie, and the other upper Great Lakes, lendscredence to the belief that the sea lamprey entered
Cayuga Lake by way of the "Champlain Sea" orthe Hudson-Champlain estuary and Mohawk outlet. Presumably, a sufficient supply of large hostfishes in the lake made possible the establishmentof a landlocked form of the sea lamprey.
To date, size is the only morphological difference recorded between the marine form and thelandlocked form. The landlocked sea lamprey inOayuga Lake attains approximately one-half totwo-thirds the length of the marine form.
SIZE, GROWTH, AND MORPHOMETRY OFTHE SEA LAMPREY
Length Composition
The sea lamprey of Cayuga Lake has often beentermed the dwarf form of the species. A misconception of its relatively small size was one of theprincipal factors that prompted many authors toconsider it a separate subspecies.
During the 3-year period 1950-52 the meantotal length of 3,363 sea lampreys captured inCayuga Inlet was 15.4 inches; extreme lengthswere 8.4 and 21.4 inches. Only unspent, upstream migra.nts are considered in this discussion.A summary of length measurements, recorded intable 1, is listed according to sex and year of capture. To facilitate a comparison of mean valuesand their associated variation, these data are diagramed in figure 1. These diagrams are a modification of the type originally employed by Hubbsand Perlmutter (1942). The significance of differences between samples can be judged by com-
TABLE i.-Summary of length measurements of sea lampreyscaptured in Cayuga Inlet
I Length (Inches)
Year Number Iof Stand·and specl· ard Stand·sex mens Mean Range devla· ardlion error
----------------1960
1.72 0.139Male ............ _.. 153 15.2 9.0-19.5Female....... _...... 92 14.8 10.7-18.7 1.54 .160
-----------------TotaL..... _.. 508 15.0 8.4-20.7 1.84 .081
=1961
1. 61 .052Male................ 961 15.3 11.0-20.8Female.......... _... 591 15.2 11.3-20.2 1.54 .063
----------------TotaL..... _.. 1.917 15.3 11.0-20.8 1.56 .036
---1961
1.24 .054Male................ 519 15.9 11.1-21. 0Female...... _...... _ 419 15.8 11.5-21.4 1.86 .091
--- ---TotaL. __ ..... 938 15. 9 11.1-21.4 1.75 .057

SEA LAMPREY OF CAYUGA LAKE
TOTAL LENGTH IN INCHES
8 10 12 14 16 18 20 22, , i , I , i i
1950I • IMALE
FEMALE I • I
MALE and FEMALE I • I
1951I • IMALE
FEMALE I • I
MALE and FEMALE I • I
1952I • IMALE
FEMALE I • I
MALE and FEMALE I • I
I I I , , , I ,200 250 300 350 400 450 500 550
TOTAL LENGTH IN MILLIMETERS
563
FIGURE I.-Length composition of Cayuga Lake sea lampreys. The horizontal line represents the total range of variation;the mean is indicated by a vertical bar; the hollow rectangle on each side of the mean represents one standard deviation; the solid rectangle on each side of the mean represents twice the standard error.
I Refer to p. 578 for details pertaining to population estimates.
For 1950, the mean length was calculated frommeasurements of 508 lampreys. These lampreyswere taken relatively early in the migratory periodand are thought to be biased in favor of largespecimens. Mean lengths for 1951 and 1952 weredetermined from samples taken regularly throughout the entire migratory period. The 1,917 specimens measured in 1951 represent 20 percent of theestimated spawning population for that year. The
paring the standard errors. If the solid rectangles, which represent twice the standard error, ofthe two samples are of nearly equal length andoverlap one another by 10 percent. or less, the difference between the means may be considered significant; that is, the probability that the twosamples cltme from the same statistical populationis 0.08 or less.
Annual mean lengths for the sexes combined,together with the estimated abundance of sea lampreys, were as follows:
Year
11160 • • • _11151. • . • • _11152 •• •• _• • _
Totallength(inches)
15.015.315.\1
Estimatedabundance I
10-15, 00011,3904,435
938 specimens measured in 1952 represent 21 percent of the total number in the run.
Mean length' of Cayuga Lake sea lampreys increased slightly during the period 1950-52. Thesuccessive annual increases in length, 0.3 and 0.6inch, were statistically significant. In these threeyears body length was inversely related to thetotal number of lampreys in each year class.
Total lengths of male lampreys consistentlyaveraged longer than those of females. This difference was small, however, between 0.1 and 0.4 inch,and was not statistically significant..
The histogram of the length composition ofadult Cayuga Lake sea lampreys (fig. 2) is based onlength measurements of 1,9i7 'specimens capturedon their spawning migration in Cayuga Inlet during the spring of 1951.
Weight Composition
The average weight of 3,135 adult sea lampreyscaptured in Cayuga Inlet in 1950-52 was 4.5ounces. Extreme weights were 1.4 and 12.1ounces. A· summary of weight measurements(table 2) is recorded according to the year of capture and sex. Diagrams of these data in figure 3facilitate a comparison of the groups. Only unspent upstream migrants are included in this disCUSSion.

564 FISHERY BULLETIN OF THE FISH AND WILDLIFE SERVICE
TOTAL LENGTH IN INCHES10 I I I 2 13 14 I 5 I 6 17 18 19 20 21
100
80
60
40
20
ol-_----".....EZI:::M:j~
FEMALES
MALESand
FEMALES
MALES
500 540
100
80
60
40
2~L_---e~~~~~~
wuzwc:::c::::::>uuoI.L..o>-uzw 200:::>o 180wc::: I ~Ou.
140
120
100
80
60
40
20
0L..:;.~26-0~~L44~~(JL;~~~
TOTAL LENGTH IN MILLIMETERS
FIGURE 2.-Length-frequency distribution of adult.sea lampreys taken in Cayuga Inlet, 1951.

SEA LAMPREY' OF CAYUGA LAKE
WEIGHT IN OUNCESI 2 3 4 5 6 7 8 9 10 II 12I i I I i i I I i I I i
1950 I • IMALE
FEMALE I • I
MALE and FEMALE I " I
1951 I • IMALE
FEMALE I • I
MALE and FEMALE I • I
1952 I • IMALE
FEMALE I • I
MALE and FEMALE I • I
I I . i , I , I . I , I . I
0 50 100 150 200 250 300 350
WEIGHT IN GRAMS
565
FIGURE 3.-Weight composition of Cayuga Lake sea lampreys.
TABLE 2.-Summary of weight measurements of sea lampreyscaptured in CaY'ltga Inlet .
Number Weight (ounces)Year ofandsex spec;· Standard Standardmcns Mean Range deviation error
----------- ---1950Male________ , _______ 153 4.8 2. a- 9.5 1.81 0.146Female________ . _____ 92 5.1 2. 2-11. 3 1.91 .199
TotaL________ " . 2:45, '5.0 2. a-11. 3', 1. 95 .124== =
1951Male____ . ___________ 961 4.4 1.4-11.7 1.22 .039Female. _____________ 604 4.3 1.4-10.3 1.65 .. 067
'fotaL. ________ I,OOS 4.3 I. 4-11. 7 1.63 .037=
1952Male_______________ . 507 5.1 1.8-12.1 1. 73 .077Female________ ._. ___ 416 " 4.8 1. 8-11. ~ 2.08 .102
TotaL __ .. ____ 922 4.9 1.8-12.1 1.90 .063
Annual. mean body weights for the sexes combined, together with the estimated abundance 'oflampreys follow.
(Desc.riptiOli of sYIUbols is given in the ca.ption of fig. 1.)
believed that this sample is biased in favor of unusually large specimens. Mean weights for 1951and 1952 represent specimens taken throughoutthe migratory period, and each year 21 percent ofthe estimated total number were weighed.
The mean weight of sea lampreys differed significantly.from year to year. Except for 1950, abiased value, these variations appear to be inversely related to their abundance.
"No significant difference could be detec.ted between weights of male and female specimens. Inthe seasons during which representative sampleswere measured, however, 'the females were heavierthan males.
During the spring of 1951 a total of 1,968 sealampreys from Cayuga Inlet were weighed. Thesedata are depicted in figure 4 to illustrate theweight composition of the adult, population ofCayuga Lake sea lampreys.
I Refer to p. 57S for details pertaining to population estimates.
Mean weight for the 1950 sample, shown inparentheses, was based on 245 speeimens, which is'approximately 2 percent of the estimated numberin the spawning migration. $ince they were,takenduring the early part of the migratory peri~d, it is
Mean weight Estimated(ounces) abundance I
Year
1950 . ..• . _1951 . _. ," . _1952_ -' : ._
(5.0)4.34.9
10-15,0009,3904,435
Growth of Parasitic-Phase Sea Lampreys
, Evidenc.e has' been presented by Applegate(1950) that the sea lamprey in Lakes Huron andMichigan spend between 12 and 20 months in theparasitic. phase of life in the lakes proper. Applegate's conclusion was based' on measurements ofspecimens taken from the lakes throughout a 1~-'
year period. In the spring the newly transformedlampreys and the large mature individuals thatwere ready to enter the tributaries for spawning,differed ~arkedly in' size. After the spawning

566 FISHERY BULLETIN OF THE FISH AND WILDLIFE SERVICE
WEIGHT IN OUNCES2 3 4 5 6 7 8 9 10 II 12
100
220
200
UJ
~ 180
UJ0:: 1600:::;:)U. 140U
o 120LLo>UZ 80IJJ:;:) 60oUJ0:: 40LL
20
MALES and FEMALES
WEIGHT IN GRAMS
FIGURE 4.-Weight-frequency distribution of adult sea la.mprey's 'taken in 1951.
I Recently transformed lampreys captured in Cayuga Inlet.• Mature lampreys captured on their spawning migration in Cayuga Inlet.
TABLE 3.-Lengths of parasitic-phase sea lamprey,s. fromCayuga Lake
t.o 15.4 inches in April:-May, 13 t.o 14 monthslater (table 3). Data given here include adequate
season only t.he small newly t.ransformed lampreyswere found in t.he. lake.
Parasitic-phase sea lampreys taken from CayugaLake show the same trend of growth asLake Huron and Lake Michigan specimens (t,able3). These lampreys were captured during the gillnetting of lake trout in 1948-51. Some lampreyswere entangled in the net and others adhered tothe netted trout.. .Since bot.h large and small lam..,preys are caught by t.his method,·t,hese specimensare considered to be represent.at.ive of the population. Lampreys captured during the several yearshave been combined because of the small-numbertaken in anyone season.
The mean length :of parasitic-phase sea lampreysin Cayuga Lake increased from 5.5 inches in March
Month ofcapture .
August-March , . _
tf:~l:::::::::::::::::: ::June •__ .• . - _July • • : _August_ .••••.•..•....•..•
~':R=..~~~::::'::::::::~:November. :_January. . , __April-May·_:_: ."__
Length lincheslNumber ofspecimens
Mean Minimum Maximum
68 5. 6. 4.6 5.42 6.1 6.0 5.22 9.6 8.2 10.82 B.3 10.6 12. 06 10.3 '8.4 12. 97 13.1 . n.5 14.5
13 .. 12.5 8.4 18.0 .38 13.9 9.1 19.6
1 19.1 19.1 19.12 16.7 14.6 15. 7
3,363 16.4 8."'4 21.4
SEA LAMPREY OF CAYUGA LAKE 567
------------ ------------
TABLE 4.-Length-frequency distributions of sea lampreysfrom Cayuga and Seneca Lakes
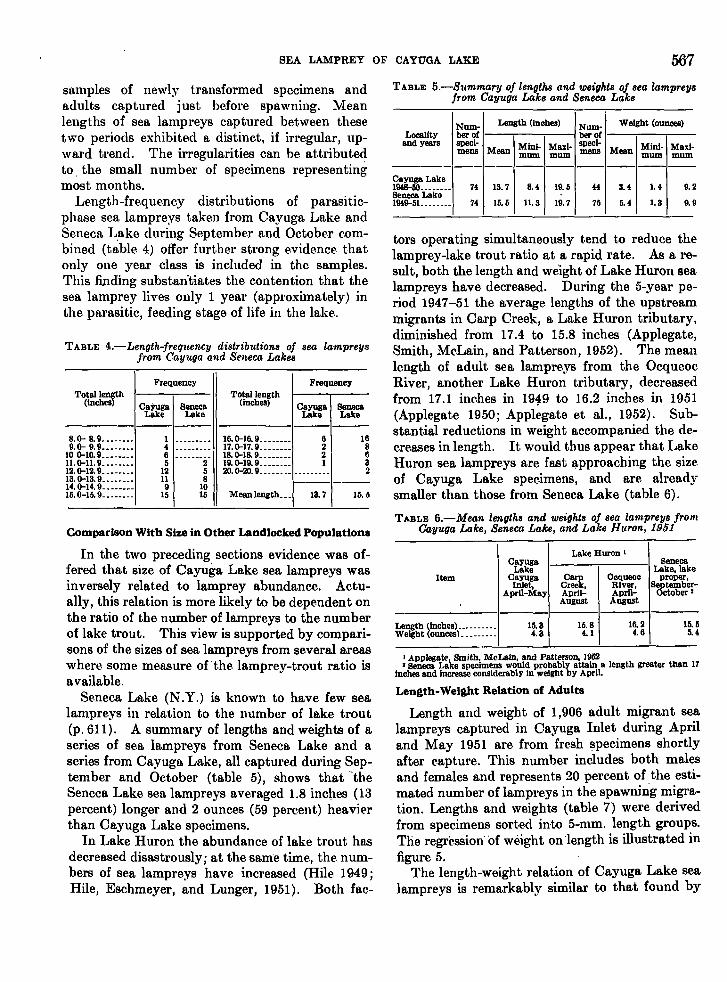
samples of newly transformed specimens andadults captured just before spawning. Meanlengths of sea lampreys captured between thesetwo periods exhibited a distinct, if irregular, upward trend. The irregularities can be attributedto. the small number of specimens representingmost months.
Length-frequency distributions of parasiticphase sea lampreys taken from Cayuga Lake andSeneca L.ake during September and October combined (table 4) offer further strong evidence thatonly one year class is included in the samples.This finding substan'tiates the contention that thesea lamprey lives only 1 year (approximately) inthe parasitic, feeding stage of life in the lake.
MeBIIlength_ __ 13. 7 15. 5
TABLE 5.-Summary of lengths and weights of sea lampreysfrom Cayuga Lake and Seneca Lake
tors operating simultaneously tend to reduce thelamprey-lake trout ratio at a rapid rate. As a result, both the length and weight of Lake Huron sealampreys have decreased. During the 5-year period 1947-51 the average lengths of the upstreammigrants in Carp Creek, a Lake Huron tributary,diminished from 17.4 to 15.8 inches (Applegate,Smith, McLain, and Patterson, 1952). The meanlength of adult sea lampreys from the OcqueocRiver, another Lake Huron tributary, decreasedfrom 17.1 inches in 19-;1:9 to 16.2 inches in 1951(Applegate 1950; Applegate et al., 1952). Substantial reductions in weight accompanied the decreases in length. It would thus appear that LakeHuron sea lampreys are fast l!-pproaching the sizeof Cayuga Lake speeimens, and are alreadysmaller than those from Seneca Lake (table 6).
Num- Length (inches) Num- Weight (ounces)Locality bero( berof
and years speci- Mini· Maxi· speci- Mini- Maxi-mens MeaD mum mum mens Mean mum mum----------------------Cayuga Lake1948-60________ 74 13.7 8.4 19.5 44 3.4 1.4 9.2Seneca Lake1949-51.. ______ 74 15.5 11.3 19.7 75 5.4 1.3 9.9
Frequency
Cayuga SenecaLake Lake
Total length(inches)
16.IH6.9________ 6 1617.IH7.9 .___ 2 818.0-18.9________ 2 619.0-19.9________ 1 320.0-20.9._._ •. . .. 2
146 _. •• _5 2
12 511 89 10
15 15
Frequency
CaYuga SenecaLake Lake
Total length(inches)
8.0- 8.9•• •9.0- 9.9_. __ ._._
100-10.9 _11.0-11.9_. •__12.0-12.9 • _13.0-13.9_ •••• _14.0-14.9 •• _15.0-15. 9 _
Comparison With Size in Other Landlocked Populations
In the two preceding sections evidence was offered that size of Cayuga Lake sea lampreys wasinversely related to lamprey abundance. Actually, this relation is more likely to be dependent onthe ratio of the number of lampreys to the numberof lake trout. This view is supported by comparisons of the sizes of sea lampreys from several areaswhere some measure of 'the lamprey-trout ratio isavailable.
Seneca Lake (N .Y.) is known to have few sealampreys in relation to the number of lake trout(p.611). A summary of lengths and weights of aseries of sea lampreys from Seneca Lake and aseries from Cayuga Lake, all captured during September and October (table 5), ghows that "-theSeneca Lake sea lampreys averaged 1.8 inches (13percent) longer and 2 ounces (59 percent) heavierthan Cayuga Lake specimens.
In Lake Huron the abundance of lake trout hasdecreased disastrously; at the same time, the numbers of sea lampreys have increased (Hile 1949;Hile, Eschmeyer, and Lunger, 1951). Both fae-
TABLE 5.-Mean lengths and weights of sea lampreys fromCayuga Lake, Seneca Lake, and Lake Huron, 1951
Lake Huron 1Cayuga Seneca
Lake Lake, lakeItem Cayuga ca~ Ocqueoe proper,
Inlet, Cree, River, s3:tember-April-May Aprll- Aprll- ctober •
August August
Length (lnches} __ . _____ ._ 15. 3 15.8 16.2 15. 5Weight (ounces). ________ 4.3 4.1 4.6 5.4
I Applegate, Smith, McLain, and Patterson, 1952• Seneca Lake specimens would probably attain a length greater tban 17
inches and increase considerably in weight by April.
Length-Weight Relation of Adults
Length and weight of 1,906 adult migrant sealampreys captured in Cayuga Inlet during Apriland May 1951 are from fresh specimens shortlyafter ('.apture. This number includes both malesand females and represents 20 pereent ofthe estimated number of lampreys in the spawning migration. Lengths and weights (table 7) were derivedfrom specimens sorted into 5-mm. length groups,The regression"of weight on "length is illustrated infigure 5.
The length-weight relation of Cayuga Lake sealampreys is remarkably similar to that found by

568 FISHERY BULLETIN OF THE FISH AND WILDLIFE SERVICE
TOTAL LENGTH IN MILLIMETERS
9
2
8
en7
ILlUZ~
0
z6 ....
:I:~-ILl~
5
o
4
3
22 ..
500400
12 14 16 18.20
TOTAL LENGTH IN INCHES
300
10
, ,rTF
01 __I-- I
0
00 0
0 0
0
0
0
1I
j/
0
)J
j-,0
"'Il- .,..I
01./I o~
/-v1,,: .\ .{
100
50
250
300
en 200::E«It:~
Z
....:I:~
ILl~ 150
.. , ."
FIGURE 5.-Length-weight relation of adult sea lampreys from. Cayuga Inlet, 195.1.. .

SEA LAMPREY OF CAYUGA LAKE 569
Applegate (1950) for Lake Huron specimens. At alength of 10-12 inches their weight increased at arate of approximately one-half ounce per inch oflength. When they reached a length of 18-20inches their weight increased at a rate of 1 ounceper inch. There was little difference in the lengthweight relation between sexes.
TABLE 7.-Length-weight relation of mature sea lampreysfrom Cayuga Inlet, April and May 1951
1________ •___ 10.7 1.62 79•••• _________ 16.0 4.781.. ____ . _____ 11.1 1.80 68. ____________ 16.2 5.102______ . _____ 11.3 I. ~152 ____ •_______ • 16.4 5.186____ •. ______ 11.5 1.76 69_______ •_____ 16.6 5.466_______ • ____ 11. 7 1.94 56_____________ 16.8 5.5010____________ 11.9 2.00 53_____ • _______ 17.0 5.695___ •_______ • 12.0 2.09 42•• ___________ 17.2 5.9213 ____ • _______ 12.3 2.16 39 _____________ 17.4 6.2217 ___ •________ 12.5 2.22 36___________ •• 17.6 6.5022_._. ________ 12.7 2.29 29___ • _________ 17.8 6.74
18. _. _. _____ ._ 12.9 2.62 26_____________ 18.0 6.9644__ •__ .__ •. __ 13.1 2.61 19_._. _________ 18.2 7.2538 __________ ._ 13.3 2.76 11_._. _________ 18.4 ,7,5653_________ • __ 13.5 2.80 12. ____________ 18.6 7.9063_______ •. ___ 13.7 3.06 9. _. _____ • ____ 18.8 7.6872 ___ •____ . ___ 13.9 3.12 3_ •.• _____ • ___ 19.0 8.4775. ___________ 14.0 3.24 6_. _______ •• __ ,19.1 7.7888 ____________14.2 3.44 8. ____ • _______ 19.4 8.6592 ____________ 14.4 3.49 2_____________ 19.5 8.5296____________ 14.6 3.62 2_. __ ._. ______ 19.7 8.0278___ . ________ 14.8 3.82 2_____________ 20.0 8.47118____________ 15.0 3.99 L_. __ . _______ 20.1 11.6789___ •________ 15.2 4.15 L _____ •______ 20.3 8.9694_. ____ •_____ 15.4 4.27 I. ____________ 20.5 10.1677 ___ •______ ._ 15.6 4.50 2_______ •_____ 20.7 9.91100____________ 15.8 4.66
Detailed data, not given here, revealed a ratherwide variation in weight among individuals of thesame length and sex. The range was approximately"an ounce for specimens 12 inches long and increased to 4 ounces for 20-inch specimep.s.
Morphometry
Taxonomists 'frequently employ body propurtions as an aid in determining the taxonomicstatus of many animal groups, including thelampreys. Inasmuch as body proportions differbetween the sexes and change with age and size,it becomes necessary first to determine the extentof these differences before valid comparisons between taxonomic categories can be undertaken.From the systematist's point of view it is just asimportant to know which characteristics remainconstant as to know the degree of variation of thechanging characterist.ics.
The methods of measurement and much of theterminology are those described by Hubbs andTrautman (1937).
Number ofspecimens
Meanlength
(inches)
Meanweight
(ounces)
Number ofspecimens
Meanlength
(inches)
Meanweight
(ounces)
Seasonal changes and seJ:ual differences in body proportions
In this discussion, each of the principal sectionsof the sea lamprey's body has been dealt withseparately to describe the relative size and sexualdimorphism during three significant periods of itslife: September-October, May, and June. InSeptember to October the sea lamprey is considered to have reached "normal" adult form.Changes accompanying sexual maturity becomeevident during May. By June, gross morphological modifications that are typical of spawningadults have been attained.
All measurements of body parts have been expressed as thousandths of the total length. Separate tables (nos. 8-12) have been compiled foreach body section. The data in these tables arelisted according to sex and collecting period, andinclude a frequency distribution, mean values, andmeasures of variation. (See figure 6.) It should bekept in mind that changes in proportional measurements of a particular body section that ostensibly appear to be increases or decreases insize, may be the result of changes in other bodysections that affect the total body length.
Length over gill openings.-Length over the gillopenings was the only body section that differedsignificantly between the sexes during the September-october period; males had the larger compo-
" nent (table 8). During May and June there was nodifference between the sexes in this characteristic.As the season progressed, the relative length over
TABLE S.-Relative length over gill openings of Cayuga Lakesea lampreys in S collecting periods
[Expressed as thousandths of the totallengthl
September- May JuneRelative length October
o\'er gill ------openings-Male Fe-I Total Male Fe- Total Male Fe- Total
male male male------------80-89 ___________ 8 9 17 ------ ----ii- ------ --- .-. ------00-99_ •.• _______ 27 12 39 12 21 ---27-100-109_______ ._ 2 2 4 15 7 22 13 40110-119. ___ •• ___ -- ---- --~ -. ~ --- --. 1 --- --. 1 29 16 45
"120-129 _________ ------ -- ---- ---- -. --- --. ------ --- --. -.---- 3 3---------------- ~.-
Mean ratio _____ 93 88 91 101 99 100 110 111 110Standard
4.6 5.9 5.7 5.8deviation_. ___ 4.2 6.9 5.9 3.6 4.1Standard error __ 0.7 1.4 0.8 0.7 1.0 0.7 0.8 1.0 0.6Number of
44 56 32 88specimens. ___ 37 23 60 28 16Mean total
length13.6 13.7 15.9 14.8 15.5 14.5 13.3 14.1(inches)_. ____ 13.7

570 FISHE,RY BULLETIN OF THE FISH AND WILDLIFE SERVICE
SEPTEMBER- I:
j ~
OCTOBER !MMJ d
MAY ~ ~
ii8J r!
JUNE j • I ~
I • I r/I j j j I
80 90 100 110 120LENGTH OVER GI LL OPEN I NGS
SEPTEMBER- I!
I ~
" OCTOBER I!
I rf'
MAY I!
I ¥I
!I ~
JUNE I!
I ~
i h I atI , , , , I I
50 60 70 80 90 100 110BODY DEPTH
SEPTEMBER- I!
I ~
OCTOBER iI
I at
MAY I • I ~
iWNJ at
JUNE j!
I !fI • I rI'
I I I I ! I
50 60 70 80 90 100DISC LENGTH
SEPTEMBER- iW.J Sf'OCTOBER I .. I rI'
MAY i!
I !fI
I jr/
i!
I ~JUNEI • , cI'
I I I I I I
80 90 100 110 120 130SNOUT LENGTH
, SEPTEMBER- I:
I Sf
OCTOBER I!
I d'
MAY I!
I ~
j!
I r/JUNE
I!
I ~
I!
I ~j i I I I I i I j I
220 230 240 250 260 270 280 290 300 310TAIL LENGTH
FIGURE 6.-Graphic comparison of proportional measurements of male (d") and female (~) sea lampreys captured inCayuga Lake and Cayuga Inlet. Measurements are given in thousandths of the total length. (Description ofsymbols in caption of fig. 1.)

SEA LAMPREY OF CAYUGA LAKE 571
50-59. __________ I 1 2 .- .. -- ~ -----60-69. __________ 19 13 32 7 '-'-7- ---'3' 2 570-79__ ._. ___ •__ 13 8 21 17 ·---6- 23 14 10 2480-89•• ___ •_____ 3 I 4 4 9 13 32 14 4690-99•• _________ 1 I ------ 1 1 8 3 11100-109. ________ .--.-- -.---- .----- 1 1 2no-n9_________ 1 1-------------------
Mean ratlo. ____ 70 68 69 73 81 76 83 83 83Standard
devlation_.. __ 8.4 6.9 8.5 6.3 6.6 7.4 8.1 10.0 8.8Standard error.. 1.4 1.4 1.1 1.2 1.6 1.1 1.1 1.8 0.9Number of
specimens...• 37 23 60 28 16 44 58 31 89Mean total
length(Inches) _..• __ 13.7 13.6 13.7 15.9 14.8 15.5 14.5 13.4 14.1
the gill openings increased from about ninety onethousandths of the ·total body length in S~ptember-October to approximatdy one hundred andten one·thousandths in June.
Body depth.-Body depth of male and femalespecimens was approximately equal in SeptemberOctober and June, but in May, before egg deposition, the females were considerably deeper bodiedthan males (table 9). Males increased in bodydepth at a nearly constant rate from SeptemberOctober through June. However, the females increased in depth very rapidly prior to spawning(May), but changed very little thereafter.
Disc length.-Males and females had discs(mouths) of about the same relative size duringSeptember-October and May (table 10). In June,the proportional disc length of male specimens wasconsiderably larger than that for females. The disesize remained nearly constant throughout the entire year except for a slight decrease in both sexesin May and a great enlargement in male specimensin June. This difference was distinct enough to beuseful in the field as an aid in determining sexes.
Snout length.-Length of the snout changed inmuch the same manner as the disc length (table11). Only in June did the proportional snout:length differ greatly between the sexes j in thismonth the males possessed the larger snouts. Onlyminor seasonal changes were evident except for theJune specimens, at which time the size of the snoutof males increased considerably.
TABLE 9.-Relath le body depth of Cayuga Lake sea lampreysin 3 collecting periods
[Expressed as thousandths of the totallengthj
Male Fe· Total Male Fe· Total Male Fe' Totalmale male male
TABLE n.-Relative. length of the 8nol~t of Cayuga Lake se.alampreys in S collecting periods -
[Expressed as thousandths of the totallengthj
JuneMaySeptemberOctober
Male Fe· Total Malel Fe· Total Male 1"e· Totalmale male male
Relativelengthof disc
September- May JuneRelative Octoberlength -of snout
Male Fe· Total Male Fe· Total Male Fe· Totalmale male male------------------
80-89__ •• __ . ____ 6 I 7 1 2 3 -.---- 3 390-99__ .•• _. ____ 17 18 35 18 14 32 ---is- 10 10100-109. ________ 12 4 16 9 0 9 14 32no-n9•. _______ 2 -._--- 2 ------ ------ .-.--- 30 4 24120-129___ •• __ ._ --_.-- ------ 10 ------ 10
------------------Mean ratlo __ •. _ 97 96 97 97 93 96 113 101 109Standard
deviatlon_____ 8.5 4.7 6.9 6.0 4.3 5.2 6.9 9.5 10.4Standard error•• 1.4 1.0 0.9 1.1 1.1 0.8 0.9 1.7 1.1Number of
specimens. ___ 37 23 60 28 16 44 58 31 89Mean total-
length(inches). _____ 13.7 13.6 13.7 15.9 14.8 15.5 14.5 13.3 14.1
Mean ratio ____ . 70 67 69 65 62 64 77 67 73Standard
deviatlon_. ___ 9.7 7.2 9.0 3.8 5.6 3.0 7.5 9.0 9.4Standard error__ 1.6 - 1.5 1.2 0.7 1.4 0.5 1.0 1.6 1.0Number of
specimens ____ 37 23 60 28 1R 44 58 32 90Mean total
length(inches)_. ____ 13.7 13.6 13.7 15.9 14.8 15.5 14.5 13.3 14. I
TABLE lO.-Relativ6 length of the disc of Cayuga Lake sealampreys in S collecting periods
[Expressed as thousandths of the totallengthj
50-59 .______ 2 3 5 I 4 5 ' __ "_ 8 86tHl9 __ • .___ 18 12 30 24 12 36 7 10 1770-79 •. 11 7 18 3 3 32 12 4480-89 .• 6 1 7 ._ 16 2 1890-99 ._. • _••• . • 3 ._____ 3
Ta.illength.-Taillength of male lampreys averaged larger than that for females during each c.ollec.ting period (table "12). The differences werenot large, however, until June. As the seasonsprogressed from fall to spring, the relative taillength consistently decreased. Tail length wasthe only body section in which relative size de-
-creased. From September-October to May thechange was small, but a marked decrease tookplace between May and June, especially infemales.
Summary.-Sexual dimorphism during September-October was exhibited only by the length overthe gill openings. In May, only body depthshowed any appreciable differences in the sexes.
JuneMayScptembcrOctober
Relativebody depth

572 FISHERY BULLETIN OF THE FISH AND WILDLIFE SERVICE
Length clallses
In the June collections the disc length, snoutlength, and tail length showed dist,inct. differencesbetween males and females. .
Seasonal changes in t.he various body sectionswere somewhat. erratic. In general, tl~e relat.ivesize of all body sections except. tail length tendedto increase as the seasons progressed from September-Gctober through June. The t,ail length decreased during t.his period.
T.4.BLE 12.-Relative length of the tail of Cayuga Lake sealampreys during 3 collecting periods[Expressed as thousandths of the total length)
T .4.BLE l3.-Relative body depth, disc length, snollt lengthand length over gill openings of sea lampreys from CaYllg~,Lake and Sen.eca Lake .
[Expressed as thousandths 01 the t....tal length)
Body depthIDisc length Sn....ut !Length over__I __I length gill opening~
Ca- Sen- Ca- Sen- Ca- sen-I Ca-" Senyuga eca yuga eea yUl!3 eca yuga ecaLake Lake Lake Lakc ILake Lake Lake Lake----1------1---1--
50--59 • • ~___ 922 ----2- 350 1467 ------ ------ ------ ------6lHi9 .______________;> _ I
~~mm~:::::m: ::}: :::~: ,,} :~r:::~: :--d- :--~: ::::~
Relativelength of tail I I . I I
Male Fe- Total Male Fe- TotallM3le l"e- Totalmale male male
-----11-- -----------------
!~l:::::::::::::: ~:::~: :::~~~ :::::: :::::: :::~:: ---T J l!250--269_________ 4 4 8 ---OJ' ----5- ---·ii- 10 9 19260-269 ,_____ 4 4 8 11 6 17 23 6 29270-279_________ 11 2 13 12 5 17 17 1 18280-:9_________ 8 3 11 4 __ ._._ ,4 2 _•• _,_ 2
~t::::::: ::::i: ::::~: ----;-I~:::: :::::: :::::: :::::: :::::: ~::::~:~.:;.~iO-,--- 274 266 272 271 264 269 264 249 259
d,-vlallon 12. 2 14. I. 14.0 8.8 7.9 9.2 10.8 13.3 14.9~~~~:~~rror-.1 2.3 3.5 2.1 1.6 2.0 1.4 1. 4 2.4 1.6
specimens . 28 16 44 28 16 44 58 32 90Mean total I
length(inches) , _____ 14.3 14. 3 14.3 15. 9 14.8 15. 5 H. 5 13.3 14. 1
I I
. T.4.BLE 14.-Relat-iI'e length of tail of sea lampreys fromCayuga Lake and Seneca IJake
[Expressed lIS thousandtlis of the total length]
Mean ratio____________ 69 80 69 63 97 95 91 92Standard deviation.. _"_ 8.S 6.8 9.0 5,8 6.\1 5.5 5.9 5.1Standard error ______ 00 1.1 0.8 1.2 0.7 0.9 1.3 0.8 0.6Numher ofspecimens__ 60 "74 60 74 60 74 60 74Mean total length(inches), ___ •________ 13.71 15. 5 13.7 15.5 13.71 15. 5 13.7 15.5
SenecaLake
CayugaLake
Length classes
JuneMaySeptemberOctober
snout length, length over the gill openings, andtail length (tables 13 and 14; fig. 7). Comparisonof these data revealed a very close agreement inthe relat.ive size of snout length, lengt,h over gillopenings, and tail length in speeimens from thetwo lakes. Dis.tinct differences bet.ween the twosamples were diselosed in t,he relative length of t,hedise and body depth.
In the previous section it was shown t.hat disclength decreased proport,ionately wit,h normal(nonbreeding) growth, and t.hat body depth inereased proportionately with normal growth.Since the Seneea Lake speeimens were larger a.ncltheir body proportions were consistent, withehanges aecompanying additional growth-i.e.,dise length was smaller and body depth greaterthese differenees were eonsidered to be of environmental rather t.han genetic origin.
Morphometric Comparison of Cayuga Lake and SenecaLake Sea Lampreys
Sea lampreys from Seneca Lake superficiallyappeared t.o be longer and proportionat.ely great,erin body girth than specimens from Cayuga Lake.Even though t.he two lakes are conilect.ed by theSeneca River (Barge Canal), because of the'location of the int.erconnecting river in relation to thedeepwater areas of the lake, it was thought. thatlitt,le interchange of sea lampreys takes place between the two. In view of these conditions it. wasdesirable t.o make a taxonomic eomparison of speeimens from t.he two lakes. Body proportions andthe number of t.eet.h 3 and myomeres were com-pared. . ,
Body pl'opol'tio'1l8.-Measurements of the following body sections were t,aken from collections ofsea lampreys eaptured in both lakes during September and Oc~ober: body depth, dise length,
• The terms "tooth" and "teeth" are used in the broade~t sense of their'meaning; the sea 'lamprey's dental armature, consisting of cornified epithelium, does not represent true teeth.
Mean ratio. __ . . ._.Standard deviation .Standard error • :.Number of specimens . •Mean total length (inches) , .
" 27214.02.144
14.3
27013.51.675
15. 5

CAYUGA
SENECA
SEA LAMPREY OF CAYUGA LAKE
•
573
CAYUGA
SENECA
50I I I
60 70 80LENGTH 0 F DISC
•
90
CAYUGA
SENECA·
CAYUGA
. SENECA'
I I I I
80 90 .I 00· I 10 120LE·NGTH ·OF SNOUT
••70 . 80 90'00 110
LENGTH ..OV~R GILL .0Pf;NINGS
• ., .•CAYUGA
SENECA
50
220
60
240
I I I
70 80 90BODY. DE.PTH
•I I I
260 280 300TAIL LENGTH
100
320
FIGURE 7.-Comparison of body sections of sea lampreys from Cayuga Lake and Seneca Lake. Measurements are givenin thousandths of the total body· length. (Description of symbols in caption of fig. 1.)
Teeth and myomeres.-Methods out.lined byHubbs and Trautman (1937) were followed in.counting teeth and myomeres. Many of the difficulties they encountered in work on Icthyomyzonwere present also in work on Petrornyzon. Mosttroublesome was the myomere count on immature specimens, especially those that had beenpreserved fo~ several years. In such specimens,the myomeres were nearly indistinguishable externally. It was neces'sary to slit the abdomen
498325 0-59-2
lengthwise, in the ventrolateral area, and countthe muscle bands.
In addition to the myomeres the following seriesof teeth or cusps were counted: Cusps on thesupraoral lamina; number of biscuspid circumorals; teeth in the anterior row; cusps on thelateral lingual lamina; cusps on the transverselingual lamina; teeth in the lateral row; teeth inthe circumoral row;' and cusps on the infraorallamina.

574 FISHERY BULLETIN OF THE FISH AND WILDLIFE SERVICE
Variation was nil or slight in three characters:supraoral cusps; bicuspid circumorals; and theanterior row. The number of cusps on the supraoral lamina was 2 in all of the 176 specimens fromCayuga Lake and 106 from Seneca Lake. The'number of bicuspid circumorals .was 8 in 171specimens of a sample of 173 from Cayuga Lake(the other 2 counts were 6 and 9) and in all 75from Seneca Lake. The number of t.eeth in theanterior row was 3 in all 73 Cayuga Lake specimens. In Seneca Lake lampreys t.he anterior rowcount was 3 in 164 of 174 specimens; 9 had a countof 4, and 1 a count of 2, which gave a mean of 3.05.
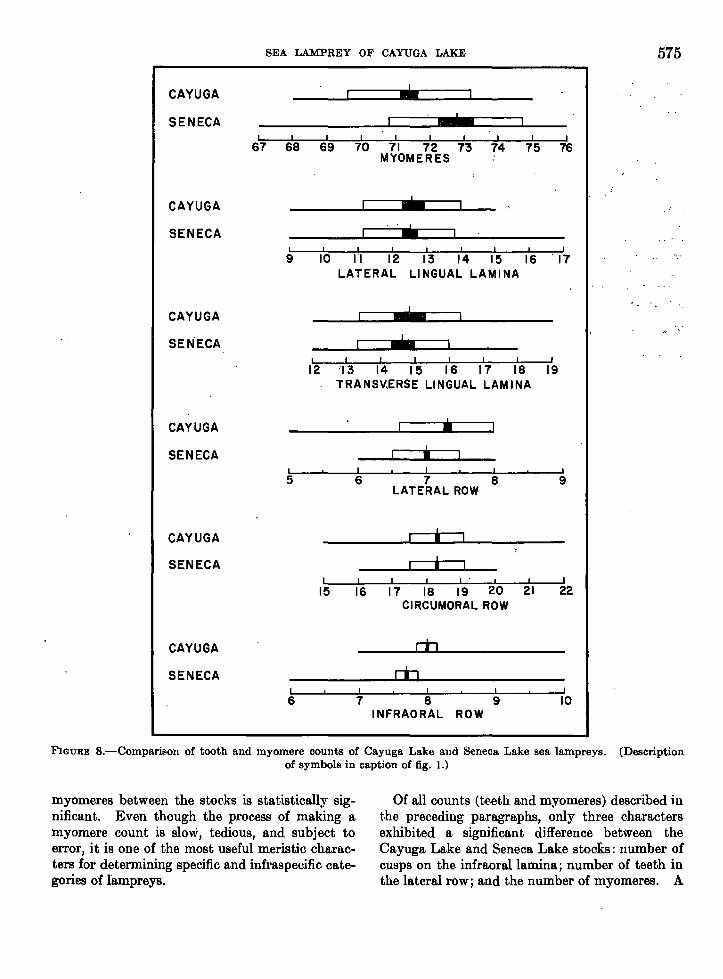
Other tooth counts exhibited greater variabilit,y(table 15; fig. 8). The number of infraoral cuspsranged from 7 to 10 in Cayuga Lake lampreys(average of 8.02) and from 6 to 10 in Seneca Lakespecimens (average of 7.69). In specimens whoseinfraoral cusps had been worn down, the out.ercovering was ready to be sloughed off. Invariably the distal ends of the lamina in these specimens were so constricted as to make it difficult tocount the cusps. Removal of this outer sheath,however, exposed the underlying sharp, distinctcusps that could be counted accurately.
The number of teeth in the circumoral row averaged 18.3 for both Cayuga Lake and Seneca Lakesamples. The number of circumoral teeth rangedfrom 15 to 22 in Cayuga Lake specimens and from16 to 20 for Seneca Lake specimens. Undoubtedly the greater number of specimens examined
from Cayuga Lake (174), as opposed to 75 fromSeneca Lake, contributed to the greater range ofthis charaeter observed in t.he Cayuga Lakesample.. The number of teeth in the lateral row variedlittle. Cayuga Lake specimens had an averageof 7.3 lateral teeth (range, 5 to 8). Seneca Lake
. specimens had significantly fewer teeth in thelateral row, an average of 7, with extremes of 6and 8.
Denticulations on the lingual lamina are welldeveloped and never seemed to be so dull or wornas t.he circumoral teeth. For ease and accuracyin making counts of both the transverse andlateral lingual lamina, the tongue was excised.
The number of cusps on the transverse linguallamina of Cayuga Lake specimens ranged from 12to 19, and averaged 14.8. In Seneca Lake specimens the count varied from 12 t018 and averaged14.6. This small difference between the twogroups was not significant.
Cusps on the lateral lingual lamina of CayugaLake specimens ranged from 9 to 15 and averaged12.6. In Seneca Lake specimens the count variedfrom 9 to 17, with an average of 12.5. This difference between Cayuga Lake and Seneca Lakespecimens was not statistically significant.
Sea lampreys from Seneca Lake had a greaternumber of myomeres (average, 72.7; range, 67-76)than Cayuga Lake specimens (average 71.4; range,68-75: table 16). This difference in number of
TABLE I5.-Counts of Cl'SpS and lam.inae on sea lampr/:-ys from Cayuga Lake and Seneca, Lake
Number of cuspsor laminae
Laterallingual lamina
Cayuga SenecaLake Lake
Transverselingual lamina
Cayuga SenecaLake Lake
Lateral row
Cayuga SenecaLake Lake
Circumoral row
Cayuga I SenecaLake Lake
Infraoral cusps
Cayuga SenecaLake Lake
L::::::::::::::::::::::=:::::: ==:::::::::: :::::::::::: :::::::::::: ::::::::-::: 1~ ••---.·--14 ::::::::_::: :::::::::::: :::::::::::: --·_-··--·-27•. • • • ._. ••••• _. __ •• • ••• .___ 95 52 •• _•• • ••. 47 2"8. .• ••• _••• • .•• ••• _. ••••• • • 63 9 __ •••• _. __ • • •• 81 379 • __ . __ . __ ._______________ 2 I _._ ••• ••.• •• ._. • _. •• 46 1010•• • ._. • ._.___ 2 4 ._. __ •• • •••• _._ •. ,-- • • • •• 2 111_•. _••• • ._._._. __ • 13 24 • • •• _ •••• _•• • __ • ._ •• ._ •• • •• -----._._. __12_ •. __ . • ._. ._ 27 46 1 3 ••••• •• •__ •• •• __ • -. ._._._.13_. • .__________________ 27 39 11 11 ._ •••••••••• •••••• ••• • •• - __ ._. _14•• __ ••• __ . .______________ 17 24 10 22 •••• • •• _••• _. • • __ •• _._. __ ••••_._._._ •• _15•• __ ._. .__________________ 5 2 10 23 _. : •••••• _••• 1 _. •• ._ •• _._. _16_. __ ._. . •• _._ ••••. __ 1 9 9 ••••_.________ 1 1 __ ._._ •• ---------- ••17•• __ :_. ._•••• 1 5 4 •. __ ._. • •• 12 2 ••••• _•• • ••••••18•• ._. ._._._. .• __ ••••_. ••• ._••• 1 2 •• __ ._. •__ ••• _._.____ 96 43 • • ••• _19., · • •• 1 ._. •• _••• __ •• 59 26 __. • __•••. •__ ••20•• • • ••• • • • •• _•• _••• 4 3 •••• ._. __ ••21•• . • .. _•• •• • _ • '" •• _. ••• " • ._. __ • • ••••• __ • ••22•• • ~---.-------, • • • •• • •• 1 __ •••••• __ • • •••• _. _
Mean•• ____ .. ___ . _____ . ___ .____ 12.6 12.5 14:8 14.6 7.3 7.0 18.3 18.3 8.0 7.7Standard devlatlon._. __________ 1.4 1.3 1.5 1.3 0.7 0.6 0.8 0.8 0.8 0.8Standard error__ •___ . __ •__ . ____ - 0.1 0.1 0.2 0.2 0.1 0.1 0.1 0.1 0.1 0.1N,!-m~rof speclmens•• ____ " __ 148 171 48 74 174 75 174 75 176 74
I Both left and right lateralllnguallam1nae are grouped together. The discrepancy in numbers results from broken laminae.
CAYUGA
SENECA
CAYUGA
SENECA
CAYUGA
SEN"ECA
CAYUGA
SENECA
CAYUGA
SENECA
CAYUGA
SENECA
SEA LAMPREY OF CAYUGA LAKE
....-------,.....-------,
I I I I I I I I I I
67 68 69 70 71 72 73 74 75 76MYOMERES
I
".I I I I I I I I I
9 10 n 12 13 14 15 16 "17LATERAL LINGUAL LAMINA
eM
•I I I I I I I I
12 '"13 14 15 16 17 18 19TRANSV,ERSE LINGUAL LAMINA
riJ
cbI I I I I6 7 8 9 10
INFRAORAL ROW
575
FIGURE S.-Comparison of tooth and myomere counts of Cayuga Lake and Seneca Lake sea lampreys. (Descriptionof symbols in caption of fig. 1.)
myomeres between the stocks is statistically significant. Even though the process of making amyomere count is slow, tedious, and subject toerror, it is one of the most useful meristic characters for determining specific and infraspecific categories of lampreys.
Of all counts (teeth and myomeres) described inthe preceding paragraphs, only three charactersexhibited a significant difference between theCayuga Lake and Seneca Lake stockS: number ofcusps on the infraorallamina; number of teeth inthe lateral row; and the number of myomeres. A

576 FISHERY BULLETIN OF THE FISH AND WILDLIFE SERVICE
TABLE 16.-Myo?nere counts on sea lampreys from CayugaLake and Seneca Lake
117 • • __ 168 .__ __ 7 -. ---- --.-69 •• __ • , _. _. • 20 -- - - - - - - --. - --70 • . __ • . • __ 28 771. • . . ______ 34 872 • • 42 973_ _ __ __ _____ __ ____ ______ _________ 26 1774_ __ __ __ _ __ ________ __ __ ___ 19 875_ __ __ __ __ _____ __ ______ 4 1276 " . •••-•• __ • __ •• _._ 1
better grasp of the magnitude of differences between Cayuga Lake and Seneca Lake stocks is .gained by further analysis of these three characters.
A divergence between the two 'populations innumber of cusps on' the infraoral lamina wasfound to be 56.2 percent. The divergence innumber of teeth in the lateral row was 62.5 percent, and the divergence in the number of myomeres was 66.8 percent. Since the number oflaminae cusps, teeth, and myomeres are believedto be genetic, and since the average divergence ofthese characters' differ at the racial level, it" followsthat Cayuga Lake sea lampreys are to be considered a separate race from Seneca Lake sealampreys.
Each spring the sea lampreys pass from thedepths'of Cayuga Lake into the tributary streamsto find suitable spawning sites. Practically allthe tributaries of the lake have natural barriersnear the mouth, a circumstance which substantially limits the available spawning area. Theonly tributaries that could posl;libly provide anappreciable amount of nesting territory are: Sawyer Creek, Salmon Creek, Fall Creek, CascadillaCreek, Sixmile Creek, Cayuga Inlet, TaughannockCreek, and Canoga Creek (fig. 24).
Sea lampreys have never been reported fromSawyer Creek, Salmon Creek, or Canoga Creek,nor were they found in thes~ creeks during thisstudy.. A few adults were seen in all the remaining streams mentioned except. Sixmile Creek.However, nesting or spawning lampreys werefound only in Taughannock Creek and· Cayuga
Inlet.. Just four pairs of nesting lampreys areknown to have utilized Taughannock Creek,whereas each year thousands of lampreys havebeen observed spawning in Cayuga Inlet. Thus,Cayuga Inlet is the only tributary of CayugaLake that has significant value for lampreyreproduction.
Water Conditions in Cayuga Inlet
• Sea lampreys are believed to have arrived In Cayuga Inlet at least 1 week:prior to their capture in 1950.
The middle and lower portions of Cayuga Inletexhibit water conditions typical of a marginaltrout stream. At the U.S. Geological Survey dam,
.5 miles upstream from the lake, the waterflowvaried between 63 and 18 cubic feet per secondduring the period April ~5 to May 23, 1951 (fig. 9).The minimum and maximum morning (7 to 8 a.m.)water temperatures during this period were 42°and 64° F. Volume of flow was greatest early inthe season and decreased steadily throughout theperiod, with the exception of a flood which occurred on May 11. As the water volume decreased the water temperature gradually increased, reaching its highest value (64° F.) on May22, the time of lowest waterflow (18 c.f.s.).
Migratory Behavior
Sea lampreys are believed to assemble at themouth of Cayuga Inlet in early spring (Februaryand March). When water from Oay~ga Inlet b&comes warmer than the lake water, they beginmoving into the deep lower portion of the inlet.They do not move into shallow waters until theevening water temperatures reach nearly 50° F.,a value usually not attained until the latter partof April. The year's first specimens were captured in Cayuga Inlet on May 4, 1950,' April 22, .1951, and April 19, 1952.
Water temperature and lamprey activity areclosely correlated. After the lampreys arrive inthe shallow portions of the stream, a drop in watertemperature to the low forties drastically retardsactivity. Upstream migration nearly ceases, andeven when handled the lampreys do not react withas much vigor as they show wh~n temperaturesare higher.
Early migr8dlts move upstream only duringdarkness, hiding under rocks, logs, and debris during the daylight hours. As the season progressestheir aversion to light gradually disappears and
72.72.00.263
SenecaLake
71.41.80.1179
CaYWlaLake.
Number of myomeres
Tributaries of Cayuga Lake
SPAWNING MIGRATION
Mean . . . -- -- -- -- --- -.-Standard devlation • _Standard error -' ------.-----Number of specimens__ , _

SEA LAMPREY OF 'CAYUGA LAKE· 577
29
20
30
40
60 /\ !\50 \j',
, \'''''"'\
~ I"""'-.J
0-z0Ul&l(/)
0::l&lQ.
I-l&ll&l
I- u.W U:J:Z IIIl&l ~
0:: U:J:
65c(u. 3=(/) 0
...J::J 60 u.0:: u.(!) 0
(/)300 ~ 55 l&l
>- ~l&l
l&l 50~
0:: 250 ...Ja- 0::. 0:::!E ~ >c( I-...J 200 : 45c( l&l
'w a-(/) 150 ~ 40
wu. I-0 100 Ir
W0:: I-l&l c(III 50 3=~
~
Z0
FIGURE 9.-Daily morning water temperature, average daily waterflow, and number of upstream-migrant sea lampreyscaptured at the U.S. Geological Survey dam, 1951.
blindness afflicts many; consequently, late arrivalsmove upstream during the day~ime~.
In favorable locations, lampreys often hideduring tl;l.e day in groups of severall;l.undred. Theindiviquals in these groups usualiy maintain th~irposition by adhering with. their buccal discs tosolid objects below ~hich they ar.e hiding, or to.each other. Notable exceptions were clusters ofapproximately 25 or 30 which were hiding duringthe daytime under the (,loncrete' apron (fig. 11) ofthe U.S. Geological Survey dam.. Th~se lampreyswere packed side by side bet~een the underside 'ofthe apron and the stream .bottom, forming a massapproximately 6 inches deep and 10 inches wide.The mouths of many were plainly seen; they wereopen, but were not attached to any object. Thisbehavior was observed on several occasions between May 9 and 16, 1952.
. . .Upstream-migrant sea lampreys held in hatchery
troJIghs invariably clung to the ,en.d. of the troughwhere the water entered. They were so aggressivewhen disturbed that cover screens had to be heldin place by cleats. These confined lampreys performed a search pattern of varying intensity thatwas closely associated with their state of nervousn~ss. . In ~an u~disturbed group, a single lampreyleft its position in the mass, backed out, slowlyexplored. the sides of the trough, and returned. tothe mass. About the tiII;le one retmned anotherbacked out and explored the trough. This routinewas, repeated c~ntinually although not· alwayswith such precision. The number of exploringlampreys and the rapidity of their moyementswere in d,irect proportio.n to. their state of excitement. If the group was greatly excited, all specimens frantically searched the trough for an exit.
578 FISHERY BULLETIN OF THE FISH AND· WILDLIFE SERVICE
5
I p_Zo4B.~C
• The 95-percent con1ldence limits are 4,210 and 12,950.
• The formula and meaning of the letters and symbols are givell in table 17,
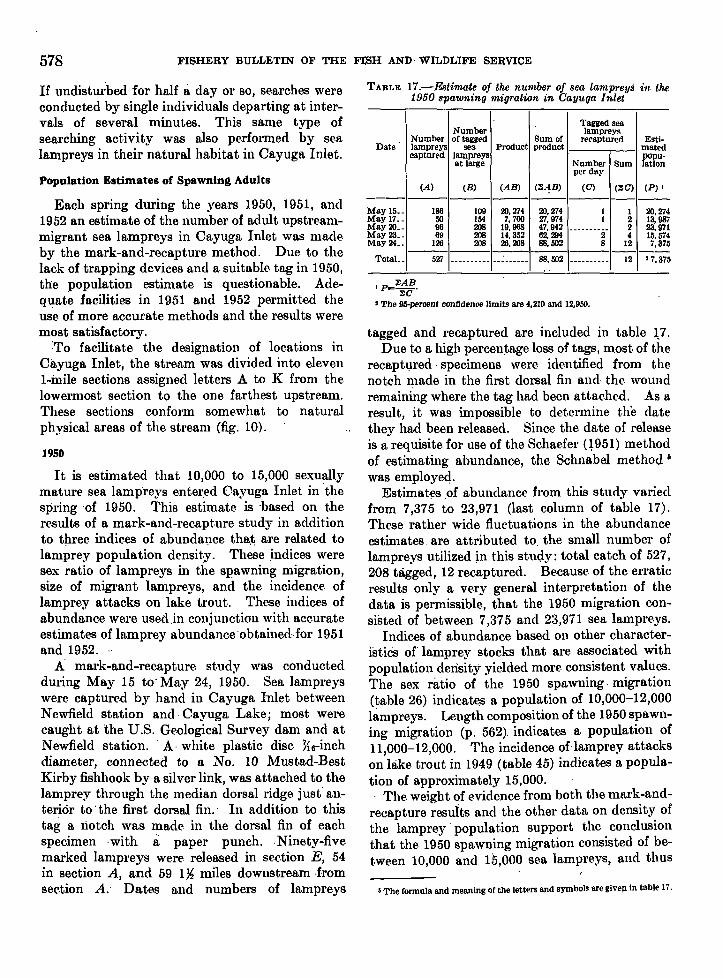
tagged and recaptured are included in table 1.7.Due to a high percen.tage loss of tags, most of the
recapt1,lred .specimens were idelltified from thenotch made in the first dorsal fin and· the woundremaining where the tag had been attached. As aresult, it was impossible to determine the datethey had been released. Since the date of releaseis a'requisite for use of the Schaefer n951) methodof estimating abundance, the Schnabel method 5
was employed.Estimat~s .of abundance from this study varied
from 7,375 to 23,971 (last column of table 17).These rather wide fluctuations in the abundanceestimates are attributed to. the small number oflampreys utilized in this stu<;l.y: total catch of 527,208 tagged, 12 recaptured. Because of the erraticresults only a very general interpretation of thedata is permissible, that the 1950 migration consisted of between 7,375 and 23,971 sea lampreys.
Indices of abundance based on other characteristics of lamprey stocks that are associated withpopulation density yielded more consistent values.The sex ratio of the 1950 spawning. migration(table 26) indicat~s a population of 10,000-12,000lampreys. Length composition of the 1950 spawning migration (p. 562). indicates a population of11,000-12,000. The incidence oHamprey attackson lake trout in 1949 (table 45) indicates a popula-tion of approximately 15,000. .. The weight of evidence from both the mark-and
recapture resuits and the other data on density ofthe lamprey population support the conclusionthat the 1950 spawning migration consisted of bet,ween 10,000 and 15,000 sea lampreys, and thus
TABI.E 17.-Estimate of the number of sea lampreys in the1950 spawning migration in Cayuga Inlet
Tagged seaNumber lampreys
Number of tagged Sum of re~aptured Esti·Date lampreys sea Product product mated
captured lampreys floPu•at large Number Sum ationper day
(A) (8) (o4B) (~.~B) (G) (~G) (P)'---------------------May IS.. 186 109 20,274 20,274 1 I 20,274May 17•. 50 1M 7,700 27,974 1 2 13, 987May 20.. 96 208 19.968 47,942 --------2- 2 23,971May 23.. 69 208 14.352 62,294 4 15.574May 24.. 126 208 26,208 88,502 8 12 7,37-----------------
TotaL. 527 -------.-- --------- 88.502 ---------- 12 '7,37.'
Population Estimates of Spawning Adults
Each spring during the years 1950, 1951, and1952 an estimate of the number of adult upstreammigrant sea lampreys in Cayuga Inlet was madeby the mark-and-recapture method. Due to thelack of trapping devices and a suitable tag in 1950,the population estimate is questionable. Adequate fa.cilities in 1951 and 1952 permitted theuse of more accurate methods and the results weremost satisfactory.
:To facilitate the designation of locations inCayuga Inlet, the stream was divided into elevenl-illile sections assigned letters A to K from thelowermost section to the one farthest upstream.These sections conform somewhat to naturalphysical areas of the stream (fig. 10).
1950
It is estimated that 10,000 to 15,000 sexuallymature sea lamp'reys entered Cayuga Inlet in 'thespring 'of 1950. This estimate is 'based on theresults of a mark-and-recapture study in additionto th.ree indices of abunda~lCe tha~ are related tolamprey population density; These .indices weresex ratio of lampreys in the spawning migration,size of migrant lampreys, and the incidence oflamprey attacks on lake trout. These indices ofabundance were usedin conjunction with accurateestimates of lamprey abundance·obtained··for 1951and 1952..
A mark-and-recapture study was conductedduring May 15 to' May 24, 1950. Sea lampreyswere captured by hand in Cayuga Inlet betweenNewfield station and Cayuga Lake; most werecaught at the U.S. Geological Survey dam and atNewfield station.. A- white plastic disc }~6-inch
diameter, connected to a No. 10 Mustad-BestKirby fishhook by a silver link, was attached to thelamprey through the median dorsal ridge just' anterior to' the first dorsal fin.' In addition to thistag a liotch was made in the dorsal fin of eachspecimen ·with Ii paper punch. .Ninety-fivemarked lampreys were released in section E, 54in section A, and 59 1~ miles downstream ·fromsection A.' Dates and numbers of lampreys
If undistu~bed for half Ii. day or so, searches wereconducted by single individuals departing at intervals of several minutes. This same type ofsearching activity was also performed by sealampreys in their natural habitat in Cayuga Inlet.

SEA LAMPREY OF CAYUGA LAKE 579
___F__ORDWA)"
BUTTERNUTCREEK U.S.G.S. DA M
2 "!
SCALE ·IN MILES
CREEK
3·I
FIGURE 1O.-Map of Cayuga Inlet and vicinity showing the I-mile sections of the stream and localities mentioned inthe text. "
should be "considered the largest migration duringthe 1950-52 period.1951
The number of upstream-migrant sea lampreysthat entered Cayuga Inlet in the spring of 1951was estimated to be 9,390. This estimate is
based on 9~0 tagged ~pecimens and a total catchof 5,559.
During the period April 19 to June 13, migrantlampreys were captured by means of a weir, threeportable lamprey traps, and"by liand. "The weirconsisted of a barrier net placed diagonally across

580 FISHERY BULLETIN OF THE FISH AND WILDLIFE SERVICE
the stream with a boxlike trap at the upstream end.The net, 60 feet long and 3~ feet high, was madeof two layers of netting for added strength. Onelayer of netting was ~-inch mesh, bar measure, theother was I}, inches, bar measure. A trap box 3feet square, constructed of }~-inch galvanized.hardware cloth on a wooden' frame, had a. conical entrance on the downstream face with a I-inch opening at the apex. Rectangular portable traps (36Xl8Xl8 inches), were constructed of X-inch galvanized hardware cloth over a wooden frame.Conical entranc~s at each end were 16 inches deepand had 2-inch openings at the apex. A removable top was held in place with dowels and cleats.
A Petersen tag consisting of two YI&-inchdiameter plastic discs, one red and one white, wasattached to the first dorsal fin by means of a brasspin. One disc was numbered so that identificationof individual specimens was possible. Taggedspecimens were released as follows: 257 in sectionE; 417 in section A; and 286 one and one-half milesdownstream from section A. Date and numberof lampreys tagged and captured are included intable 18.
Schaefer's method for estimating the total number of specimens in a migratory population wasemployed. This method is well adapted for estimating the numbers of adult lampreys on theirspawning run because it takes into considerationthe changing abundance of lampreys in the tributary stream during the several weekly periods oftagging and recovery. Even though a variablenumber of. tagged or marked lampreys was released in the stream during the marking periods,this number was directly proportional to the totalcatch of unmarked or untagged lampreys. In
table 18 is a summary, by weekly periods, of thenumber of lampreys tagged, number of taggedlampreys recaptured, and total number of lampreys captured.
An estimate·of the number of sea lampreys onthe 1951 spawning run (table 19) was computedfrom the formula:
where, 1tal=the estimated number of lampreysbased on the a"' tagging period and the i lll recoveryperiod; mat=the number of lampreys taggedduring the alII period of tagging and recoveredduring the i lll period of recovery; Ta=the numberof lampreys tagged during the alII tagging period; ma=the total number of tagged lampreysrecovered during each alII recovery period; Gl=thetotal number of lampreys recovered during the i lll
recovery period; m'l= the total number of taggedlampreys recovered during each i lll recovery period. The summation of nat values gave a population estimate (N) of 9,390.
Fiducial limits at the 95-percent level were calculated from the formula:
. ~N-n pqP=p±'A --.-N-I n
where, P=the population estimate at the 95-percent confidence level; N = the populatiol1 estimate;p=the total number of tagged lampreys dividedby the population estimate N; q=l-p; n=thetot,al number of lampreys captured; 'A-:-1.96 forthe 95-percent confidence limits. Upper and
TABLE 18.-Tagging-and-ruapture record of sea lampreys in the 1951 spawning l/I'igratian ill Cayuga Inlet
Number of tagged sea lampreys recaptured
Week tagged (a)Week of capture (I)
Apr. 19-25 Apr. 26May2
May 3-9 May 10-16
Total(m.,)
Totalnumber
of sealampreyscaptured.(Cil
Cdm.,
tfl~ ~~:~~:~~~=~=~===========:::::::::=:::::::::::=:====::::::::::: ::::=::::::: ~--------tr ::::::::::~: ::::====:::: ---------g.May 10-16_:__________________________________________________________ 1 81 26 80 188May 17-23__ • .____ 59 31 130 220May 24-30____________________________________________________________ 8 1 1 10May 31-June 6_______________________________________________________ 25 15 20 60June 7-13_: :______________ 3 2 2 7
7 _
1,538 33.43626 22.36
1,718 9.141,390 6.32
18 1.80212 3.53
50 7.14
Total tagged lampreys recaptured (m •. ) .' _Total number of lampreys tagged (T.) _
T Jm •. , ..-__c _
1 .66
241384
I. 59
84176
2.10
233394
1.69
559 5,559

SEA LAMPREY OF CAYUGA LAKE 581
lower population limits were determined to be9,897 and 8,972.1952
The number of upstream-migrant lampreys thatentered Cayuga Inlet in 1952 was estimated to be4,435.. This estimate is based on 1,773 markedspecimens and a total catch of 3,413. A total of1;234 marked specimens were recaptured.
table 21 are the population estimates recorded byweekly periods.. The number of lampreys in the1952 spawning run was calculated to be 4,435,with 95-percent fiducial limits of 4,108 and 4,818.
These population estimates for the 1951 and.1952 seasons are considered to be reliable. Alltheoretical assumptions are believed to have beenadequately fulfilled.
TABLE 19.-Estimate of the number oj sea lampreys in the1961 spallming migration ,:n Cayuga Inlet
TABLE 21.-Estimate of the number oj sea lampreys in the1955 spawning migration in Cayuga Inlet
Calculated number of sea lampreys I Calculated number of sea lampreys I
-------1---------------Apr. 19-26 • _Apr. 26-May 2________ 2,446 2,445May 3-9_______________ 675 423 1,098May 10-16.. 55 1,177 499 ----i. 236 2, 967May 17-23 593 411 1,388 2,392May 24-30_ 23 4 3 30May 31-June 6 .______ 140 III 119 370June 7-13._____________ 34 30 24 88
------1------------------Apr.3D- May May May May 28-May 6 7-13 14-20 21-27 June 3
4,435
1,529880743464819
Total
246702
I, ~~ -----398- =====:=== ==:====== =========278 465 _79 164 221 _30 62 481 246
2,398 1,089 _
Week of capture Week tagged (a)(i)
Apr. 3D-May 6.. __May 7-13 _May 14-20. _May 21-27 _May 28-June 3. _
TotaL _
Total
Week tagged (al
Apr. Apr. 26- May 3-9 May19-26 May 2 10-16
Week of capture(I)
55 5,087 1,478 2, 770 9,390I Values computed from data in table 20 and the formula given on p. 580.
I Values computed from data In table 18 and tbe formula given on p. 580.
All lampreys utilized for this population estimatewere cap~ured at the U.S. Geological Survey damor at Newfield station during April 30 to June 3.They were CRQght by a portable lamprey trap andby hand. The lampreys were marked by a system of notches made in the dorsal and caudal fins,and were all released at the U.S. Geological Surveydam. They were subsequently recaptured at thedam or upstream at Newfield station. Dates andnumbers of lampreys marked and captured areincluded in table 20. .
The Schaefer method was again used t~ estima.tethe number of lampreys. Weekly summaries oftagging and recapture are listed in ta~le 20. In
Rate of Upstream Movement
The tagging and recapture of many lampreys atsbc locations along Cayuga Inlet during the springof 1951 provided an opportunity to measure therate at which they proceed upstream on theirspawning migration (table 22).
Sea lampreys· traversed the slow-moving portions of Cayuga Inlet at a rate of 1 to 2 miles perday. Farther upstream where the current isswifter, their rate of travel decreased to approximately one-third to 1 mile per day. Actualswimming velocity under average conditionsapproximates 1 foot per second, but frequent "restperiods" account for a large share of their time.
W'hen the occasion demands, the lamprey is
TABLE 20.-'-Tagging-and-recapture record of sea la,,~preys in the 1965 spawning migration in Cayuga Inlet
Number of tagged sea lampreys recaptured
Week of capture (il
Apr. 3DMay 6
Week tagged (a)
May 7-13 May 14-20 May 21-27 May 28June 3
Total(m••)
Totalnumber
of sealampreyscaptured·
(C.)
C;/m••
334 1,511 4.52365 817 2.24310 688 2.16133 253 1.9092 164 1.78
1,234 3,413-~~~--- ... ----2
13869.00
63386
6.13
429 _515 _
1.20 • _
~~ --------i48- ===========: ============ ============130 180 _42 72 .______ 19 _17 29 44 2
740734
0.99
tray ~~_a:.:~ =:================ ===:===========: === :==
a:~ ~~;=i:::~::::::::::::::::::::::::::::::::::::::1----1----=..:...1:.:.::.:.:.:.:.:=1----1----==--1----1----1---
Total tagged lampreys recaptured (m••) _Total number oflampreys tagged (T,J _
T "'m•. _

582 FISHERY BULLETIN OF THE FISH AND WILDLIFE SERVICE
capable of swimming rapidly. Sometimes, whena group of lampreys is frightened, they scatter soswiftly that a few may wriggle onto dry land topoints several feet from the shore. Also, when
. rapids and swift eurrents are encountered, theyascend quickly though not without considerableeffort.
TABLE 22.-Rate of upstream movement of sea lampreys inthe 1961 spawning migration in Cayuga Inlet
Number DIs- Minl· AverageArea traveled of specI· tance mum number Stream
mens (stream· number 01 days I gradientmiles) of days
--------------Alffiort to weir ' ___ . ___ 21 2.0 1 2.3 Very low.US Sdam toNewfteld_____ ._. ____ 56 2.0 2 6.0 High.Lighthouse to weir____ 6 2.2 1 2.0 Very low.Weir to USGS dam. __ 105 2.11 1 8.2 Medium.Cascadllla Fallsto weir. __ . __________ 5 2.9 8 12.8 Low.Weir to Newfteld __ . ___ 37 4.11 4 . 13.11 MediumJ,lghthouse to and h:fh.USGS dam.... ______ 10 5.1 4 8.6 Low an
medium.
I Not a true a"erage rate of upstream movement because all specimenswere not always captured Immedilltely upon entering a station.
'Locations mentioned in this column are Identified on 8 map of Cayugafnlet (ftg. 10, p. 5711).
Late migrants ascended the stream morerapidly than did early migrants. The averaget,ime for travel from the weir upstream 2.9 milesto the U.S. Geological Survey dam was 11 days(minimum, 2 days), during the period April 22-29.Specimens that traveled the same section ofstream during May 10-15 averaged 4 days (minimum of 1 day). Daily morning water temperatures at the U.S. Geological Survey dam averaged46° F. for the April 22-29 period and 59° F. for theMay 10-15 period. The stimulating effects of increased water temperatures on the lamprey'smetabolie rate and spawning urge are believed theeause of the faster rate of upstream movementduring the warmer period.
Barriers to Upstream Miaration
Diurnal and nocturnal observations of the sealamprey's behavior throughout the 1951 sp~wning
migration indicated that a "partial-barrier" damis effective in retarding upstream movement andserves as a bloek to some individuals.
A small dam constructed for the U.S. GeologicalSurvey, Water Resources Division, across CayugaInlet 5 miles upstream from the lake offered anexcellent place for observations of the lamprey'sreaction to a barrier. This dam consists of a concrete wall 30 feet long and 1 foot wide (fig. 11) withan irregular concrete apron which extends 3 to 6
feet downstream. A drop of approximately 1 footin water level is ereated by the dam, but the fallvaries inversely with the volume of waterflow.
When early migrants first eneountered thissmall dam they reacted by searching aetively backand forth along the base for a bypass. After several days of investigation, many proceeded downstream, and were observed as mueh as one-halfmile below the dam, slowly moving downstream,seemingly in seareh of a tributary.
To learn the fate of spawning-run sea lampreyswhich were prevented from ascending a tributarystream, Applegate and Smith (1951) eaptured andtagged specimens that entered the CheboyganRiver in which upstream movement was bloekedby a power dam. Tag returns indicated that sealampreys will return to the lake from which theycame, and then seareh for another tributary.
A tagging experiment on the Cayuga Lake sealamprey indicated a reaction similar to that foundby Applegate and Smith. Recovery of taggedlampreys in Cayuga Inlet proves they will returndownstream at least 1 mile. In 1951, one of 59tagged lampreys which were captured in CayugaInlet and released in Fall Creek (fig. lOY was recaptured in Cayuga Inlet. This lamprey had totravel 1 mile downstream to Cayuga Lake, andone-half mile in the lake to the mouth of CayugaInlet. Of the 92 tagged lampreys released in Cascadilla Creek, a tributary of Cayuga Inlet, 23 (25percent) were later recaptured in Cayuga Inletproper. They had moved 1 mile downstream.
Early arrivals in the spawning tributary attemptto reach the headwaters, whereas late arrivalsoccupy the lowermost reaches of the stream. Possibly the early arrivals, which are the larger, arestronger and hence more able to progress upstream farther than late arrivals. Or, the greateramount of time available to them may permit theearly migrants to travel farther.
Waterflow also is a factor in upstream movement. High waters in 1952 permitted lampreysto cross the barriers and ascend to the very headwaters of Cayuga Inlet; as a result the density ofnests was low throughout the stream. In 1951,moderate waterflow made the barriers more effective. That year the density of nests was high inthe lower and middle section of the inlet and practically no nesting took place in the headwaters.
With the passage of time the spawning urgebecomes inereasingly strong. About mid-May,

SEA ~PR~Y OF CAYUGA LAKE 583
. -.
".'::-.'.......
. :.....;~.. '.r........~' .
. -:"'>l::a~ ".•
~~.. ".
" ". ~ . ".; . ~
.:.11;,.i~.~:> 0::,
FIGURE n.-u.s. Geologica.l Survey Damon Cayuga Inlet.
when the evening water temperatures approach55°-60° F. lampreys can be found adhering'to theapron below the U.S. Geological Survey dam (fig.11). Water flowing over the dam is shallow andswift (roughly 1 to 6 inches deep, flowing at 2 feetper second), but some lampreys make their wayup to the brink of the dam and rest there untilcapable of attempting to cross. Some individualsswim over; others slowly maneuver their body perpendicular to the current and parallel to thestream bottom, while still attached to the dam bythe suctorial mouth. A,fter sufficient rest, theyquickly release their hold, swing the head upstream, and make a few very rapid swimmingmotions which usually carry them over the dam.Characteristically, they rest several minutes justa few feet upstream from the dam before continuing their migration.
It should be emphasized that the U.S. GeologicalSurvey dam is by no means a complete barrier.It is surmounted by many lampreys as well as byteleost fishes. A lO-inch (estimated length) small-
mouth bass, Micropte1'U8 dolomieu, easily swamover this dam under normal water conditions.
In 1952, between April 30 and May 6, 872lampreys were marked and released just below theU.S. Geological Survey dam. During the 4-weekperiod (May 7-June 3) following their release,many of these marked specimens were recapturedat the same locality where they were liberated;i.e., on the downstream side of the dam. Recorded in table 23 are the date, number, and percentage of the original number of specimens recaptured there. Since the fishing effort of the trapremained constant and the total catch decreasedsteadily, the decreased percentage of markedlampreys recaptured is the rate of emigration,either upstream or down. A large number ofmarked specimens found upstream from the damindicates that most of the movement was upstream. Approximately 3 to 7 percent of th~
marked lampreys departed from below the dameach week. The most notable fact is that 10 percent of the 872 lampreys marked prior to May 6

584 FISHERY BlTLLETIN OF THE FISH AND WILDLIFE SERVICE
remained below the dam for more than 4 weeks.By that time (June 3) the nesting season was wellunderway and upstream migration was pr~ctically
nil. Thus, considering the· other traits displayedby upstream-migrant sea lampreys, approximately10 percent of the early arrivals were unable tonegotiate the partial barrier created by the U.S.Geological Survey dam.
TABLE 23.-E7Iligration of 87B sea lampreys marked andreleased below the U.S. Geological Surl.ey dam on CayugaInlet, between Apr. 30 and May 6, 195B
Total Number PercentageRecovery period number of of marked of marked
lampreys lampreys' lampreyscaptured recaptured In catch
May 7-May 13_. _____________________ 817 217 26.6May 14-May 31... ___________________ 668 130 19.5May 21-May 71..• ________________ •__ 253 42 16.6May 28-June 3_______________________ 164 17 10.4
The effect of barriers on lamprey migration inCayuga Inlet is brought out in figure 12, whichshows the number of lamprey nests in each I-milesection of Cayuga Inlet at the height of the 1951spawning season. The numbers of nests weredetermined by a complete count in a section orestimated from a large sampled portion. Thesedata are listed in Table 31.
Large concentrations of nests immediately belowthe obstacles readily suggest their restraining effecton the upstream migration of lampreys. Thepresence of few nests· above the Newfield stationis indicative of a nearly impassible barrier. Absence of lamprey nests in sections A and B is dueto t,he unsuitable composition of the substrate.
Sell: Ratio
The sex ratio of adult sea lainpreys in the spawning run in Cayuga Inlet was first measured by
en 300.-enILlz
.I.L.0 200a::1LIa:l::E:::lZ 100
0 ~ ~ ~
GRADIENT ....::::::::::: .-::::::. .-::::::. L L... L L iLLA B C 0 E F G H I J K
SECTIONS OF CAYUGA INLET
400
FIGURE 12.-Number of sea lamprey nests in each I-mile section of Cayuga Inlet at the height of the 1951 spawningseason. An index of stream gradient is given. for each section, and obstacles to upstream movement are shown intheir respective locations..

SEA LAMPREY OF CAYUGA LAKE 585
TABLE 25.-Sex raUo of sea lampreys in the spawning. migration in Cayuga Inlet during 1950,1951, and 1958
TABLE 24.-Se:z; ratio of 746 sea lampreys in the spawningmigration in Cayuga Inlet, 1886
[Data from Meek, 18891
As is shown in tables 24 and 25, samples containing a small number of specimens yield apparently inconsistent estimates of the sex ratio.
180:100107:100157:100155:100116:100
Sex ratio(mal...~: females)
Estimatednumber of sea
lampreysYear
I Meek (1889)., Surface (1899).
1886 ' _1898'____________________________________ 1.6861950_ 10,000-15,0001951-____________________________________ 9,3901952_____________________________________ 4,435
TABLE 26.-Se:z; ratio and estimates of the number of sea. lampreys in the spawning migrations in Cayuga Inlet
Some of these values are undependable because ofthe small sample. Others can be attributed todifferential activity and availability of the sexesand to fluctuations in the actual sex ratio. Apparently, discrepant values should not be rejectedarbitrarily, however, because, as suggested below,they may repres~nt true fluctuations of the population that are not well understood.
Surface reported (1899) that males predominateamong early migrants, and females among latemigrants. This general trend was found in Cayuga Inlet during the present study. For instance,in 1951, the year in which the samples were largest,the ratio changed from 210 males per 100 femalesin late April to 131 males per 100 females in midMay.
In addition to the general trend of a changingsex ratio, there was a secondary rise in the abundance of males that led to two "cycles" similar tothe main trend. These secondary pulses occurredeach year for which sex ratio data are available(last column in tables 24 and 25). Whether thissecondary rise was created by segments of thepopulation delayed in fruitless searches in or forother tributaries, is not known.
Annual differences in the sex ratio are relatedto the abundanee of lampreys (table 26). Malespecimens were relatively more abundant in yearswhen lampreys were plentiful, approximately 3males to 2 females. In years when lampreys werefew, the sex ratio was nearly 50-50. These annualchanges are large and well defined.
Other sea la.mprey populations likewise exhibita changeable sex ratio. In Lake Huron the relative abundance of male sea lampreys increasedsteadily from 165 to 258 males per 100 femalesduring the years 1947-51 (Applegate, Smith,McLain, and Patterson, 1952). Over this sameperiod the numbers of sea .lampreys were increasing.
226: 100120:100286:100175:100
180:100
691103749
265
15613210686
480
Number of Number of Sex ratiomales females (males: females)
Number of Number of Sex ratiomales females (males:females)
135 88 154:1(1034 24 142:10026 14 186: 10032 19 169:100
227 145 157:100
120 57 210:100490 314 166:100158 92 172:Ml8336 247 131:1
1,107 713 155:100
450 348 . 117:10019 18 106:100
220 166 132:10013 36 36:100
702 604 116:100
Date
May 21- _
ra~~r2ti)--::::::::::::::::::::::Later (7) _1----1----1·-----Total _
Date
Meek (1889) in 1886. Throughout a 2-week period beginning May 21, he determined the sex of745 lampreys, of which 480 were males and 265were females, a ratio of 180 males per 100 females(table 24).
Surface (1899) made sex determinations for alarger sample from Cayuga Inlet during the springof 1898. In a total of 1,686 specimens 589 weremales, 551 were females, and the sex was undetermined in 546.. These figures give a sex ratio of 107males per 100 females.
Collections of 372 adult lampreys on theirspawning migration in Cayuga Inlet, made in thisstudy between May 5 and June 12, 1950, gave asex ratio of 157 males per 100 females (table 25).Similar collect.ions in 1951 gave a sex ratio of 155males per 100 females (1,820 specimens, table 25).Finally, comparable collections made in 1952 had116 males per 100 females (1,306 specimens, table25).
1960May 5-7 _May 15-17 _May 24....3(1.. _June &-12. _
TotaL • _
1961Apr. 22-28 _Apr. 29-May 11 _May 6-12 _May 13-19 _
Total _
196.May 7-10 _
E~~ ~=:=::::::=:=::==::==::::=TotaL • _

586 FISHERY BULLETIN OF THE FISH AND WILDLIFE SERVICE
Size of Upstream Miarants
Early arrival of the larger sea lampreys in thespawning migration was observed by Surface(l899) in Cayuga Inlet and by Applegate (1950)for Lake Huron stocks. During 1950, 1951, and1952 the early upstream-migrants in Cayuga Inletwere again found to be both longer and heavierthan late migrants (tables 27, 28). Comparisonof average lengths of early with late migrants reveals that the former averaged 0.2 to 0.7 inchlonger. In weight, the early migrants averaged0.2 and 0.6 ounce heavier in 1950 and 1952, respectively, but in 1951 their weight averaged 0.4ounce less than that of late migrants. Althoughthe sex ratio of upstream-migrants changed duringthe season, this change had no effect on the size ofearly and late migrants as the sexes had the samemean size.
TAELE 27.-Mean lengths of adult sea lampreys taken earlyand late in the spawning migration in Cayuga Inlet
Length (Inches)Date Numheror
specimensMean Minimum Maximum
1960May 5______ •____________ III 15.2 n.5 19.8May 15__________________45 15.0 12.0 18. 7
1961Apr. 28___________________124 15.3 12.4 19.7May 14_. ________________ 162 15.0 n.4 20.3
196.May 7-9_________________516 16.2 12.0 21. 3May 21. _________________423 15.5 11.5 20.8
TAELE 28.-Mean weights of adult sea lampreys taken earlyand late in the spawning migration in Cayuga Inlet
Weight (ounces)Date Numher or
specimensMean Minimum Maximum
1960May 5-7_________________203 5.1 2.2 n.3May 15________•• ________ 32 4.9 2.5 7.6
1961Apr. 28__________________124 4.3 1.8 8.3May 15__________________138 4.7 2.0 9.5
196.May 7-9. ________________506 5.2 1.9 12.1May 21. _________________419 4.6 1.8 10.7
Body Color
Recently transformed sea lampreys are bluishblack 8 dorsally and laterally and silvery-whiteventrally. With increasing age the epidermis becomes dark olive. The body is mottled by blackpigment in the dermal layer, especially on the
I Color standards employed In this description are those given by Ridgway (1912>.
dorsal surface; the ventral surface is nonpigmented. At the height of the spawning seasonthe dark-olive epidermal layer changes to a medalbronze on the majority of individuals, althoughthere is much variation. A few lampreys, oftenthe largest and most mature, develop a xanthineorange coloration. Others, often the smallest andleast mature, remain bluish-black or dark-olive.
Pigmentation on the dorsal fin is sparse andrather indistinct in comparison with that on thetrunk. A band of skin along the base of bothdorsal fins' is pigmented much the same as thetrunk. An indistinct band, approximately onefourth the fin height, on the margin of the. dorsalfins is nonpigmented. The caudal fin bears darkpigmentation on its posterior portion which diminishes anteriorly. A ridgelike continuation of theventral portion of the caudal fin forward to theurogenital opening is nonpigmented.
In 1951 a study was made of the correlationsbetween color and size. sex, and time during thespawning period. To facilitate the recording andcalculation, five color categories were establishedand given index numbers as follows: (l) xanthineorange; (2) raw sienna; (3) medal bronze; (4) darkolive; and (5) bluish-black. This series is listedhere in reverse order of color changes that occur assexual maturity is approached. Numbers of specimens were: 183 males and 110 females'captured onthe spawning run in Cayuga Inlet, during theperiod April 26-30, 1951; 152 males and 144 females taken during the period May 13-16, 1951.
The linear regressions of color on length (fig. 13)illustrates the tendency for large lampreys to belighter and more colorful than small ones. Maleswere lighter and a more golden color than femalesof similar size. Early migrants were approximately one color category lighter than late. migrants. A measure of doseness of the relation between color and total length is provided by thecorrelation coefficient. Correlation coefficients forthe April collections, as shown in the tabulation,indicate considerable variation. Correlation coefficients for the May collections are rather high,indicating relatively iitt.Ie variation; however, onlythe females in the May collee.tions have a significantly high value (indicated by asterisk).
Individual records of 20 specimens whose colorwas recorded when they were captured on their upstream migration and tagged, and again recordedafter spawning was completed, were used as an

SEA LAMPREY OF CAYUGA LAKE 587
14TOTAL LENGTH IN INCHES
15 16 17 18
MALE
FEMALE
I I I
,. ,,. ,,. I,. ,
" II,,
II
I,I,,,,,,
II
II
II
II
II
/APRIL
XANTHINE ORANGE
DARK OLi VE
BLUISH BLACK
>oom
~ RAW SIENNA
I-et0::o...J
8 MEDAL BRONZE
350I I I
375 . 400 425
TOTAL LENGTH IN MILLIMETERS
450
FIGURE l3.-Regression of body coloration on total length of mature sea lampreys during April and May Aprilcollections represent early migrants; May collections represent late migrants.
indication of color transition that occurs duringthe spawning period. All migrants acquired alighter eolor of from one-half to two color categories. The late migrants which were generallydarker made the greatest change.
SPAWNING HABITS
The spawning habits of the Cayuga Lake. sealamprey have been reported by Gage (1893) andSurface (1899). Coventry (1922) and Applegate(1950) hltve reported on the spawning habits of sealamprey populations in the Great Lakes. In viewof the considerable available data on this subject,only a brief summary will be presented here of
Date collected and sex
AprilMale. _Female _
Mall ..Male. . •Female. ' _
Correlationcoefficient
0.6568.5722
.8428
.8901
Probabilitylevel
0.21.28
.08'.04
observations made in Cayuga Inlet during thepresent investigation.
Sea lampreys that arrive in the spawning tributary in mid-April spend 4 to 5 weeks in the streambefore they begin nest construction. Those that, donot arrive until mid-May spend less than a dayin the spawning tributary before nrsting. Practically all of the prespawning period is occupied inmoving upstream to suitable nesting sites. Latearrivals utilize the low reaches of the stream, andtherefore spend little time in upst,ream travel(p. 582).
Nest Building
Water temperature seems to have a strong influence on the time of spawning. In Cayuga Inlet,nest building usually starts toward the latte.r partof May, when the evening water temperaturesapproaeh 65° F. During the first few evenings <:Ifnest building, the lampreys' movements are slowand, if·the water eools enough during the. evening,nest excavation may last for only a few hours.These abortive attem:pts at nest eonstruction

588 FISHERY BULLETIN OF THE FISH AND WILDLIFE SERVICE
--,-------1---------------
I Size of material in the floor ofeach nest was recorded in order of dominance'P pca gravel, ~i. to ~, inch in diameter; M marble gravel, H to 1 inch indiameter; E egg gra\"e1, H. to 2H inches in diameter; R rubble; S sand.
TABLE 29.-Meawrement'l (-inches) and materials in thejl.oorof sea lamprey nests as observed in section E of CayugaInlet on May 30, 1951
of the nesting season suggests that the arrangementmay be. a timesaving device of late spawners.
Time of Construction and Location of Nests
P,M.!" M.M,P.E.M,P,E,R.M,P,E.M,P,E.M,P.M,P,E.EiM,P.1\, E, P. R.~J :\1, P, R.M,P,R.M,S.P.P,M, E.1\1, P.M.R,P.E, R,P.R,M.E.E,M,R.M,P.R.R,M.P.R,E,M.
Bottom typein floorof nest I
8.58.57.09.07.57.08.07.57.58.06.05.54.04.0
11.011.08.55.59.08.5
10.010.0
1187
14101589
101715959
121112139
169
19
18101013101912131314161211112122131910181329
Dimensions of nest Depth todown·stream
I.ength Width summit
Depth in center
The first nesting activity of the 1951 season wasobserved on the night of May 21 in section E ofCayuga Inlet. Four male sea lampreys were seenon nests in the earliest stage of construction.Large-scale nest building started on May 25. ByMay 30 a majority of the nests had been constructed, and spawning reached a pe.ak May 30June 1. After June 1, nest building dropped offrapidly and consisted mostly of enlarging previously existing nests. No spawning or nestbuilding was observed after June 10.
During the 1951 spawning period, May 21 toJune 7, counts were made of the number of nestsin each of eleven I-mile sections (fig. 10) of CayugaInlet. All sections were examined at least twice,and the most heavily populated areas as many assix times. Some nest counts include an examination of the entire section; most counts however,were based on samples of one-quarter to threequarters of a section. To provide a measure ofnest-building and spawning aetivity, nests wereclassified as occupied or unoccupied (table 30).Any nest in which one or more lampreys werefound was considered occupied. On May 21, allnests were occupied. The percentage of occupiednests decreased irregularly to about 50 percent onMay 24-25 and approximately 20 percent by the
11. 5 • ., • • _11 •_. __ •••• _••• •_._11.5 __•_•••• _. _•• _. __ •••. _13.5••_. • _12. 5••. _12•••• __ • • _. _10_ .•• • _. •9.5_. ._. • • _10.5 •_••••.• _. • _. _12 • _. __ •••• • _11 ••__ • _. . _. __ . __ ,. _. __ '0.5. __ .••_•. . . _8.5. • __ • . __8.5_. . • __16••_. __ ., _16.5 __ . • _13 _. • ._ • _12 ••• • _13 _. • • _. _15 •••_._., • _15.5_.__ ••• _._ ••• _17•• •• .. - --
usually result in small pockets that are later abandoned, though they may be enlarged by otherlampreys at a later date.
Sea lampreys utilize only certain portions of thestream for spawning. The principal physicalcharacters that affect the suitability of an area asa nesting site are the type of substrate and watervelocity. For successful spawning the lampreyrequires a substrate of stones small enough to bemoved and some fine sand to help sink and coverthe eggs. Also, a rather swift flow of water seemsto be required. The nests are commonly locatedat the downstream end of a pool, where the rate offlow is at least 2 feet per second. In CayugaInlet, the center of the stream presents more attractive nesting sites than do areas along the bank.
The lamprey nest is a shallow, irregular, bowlshaped pocket excavated in the streambed. Fornest construction the lamprey attaches its suctorialmouth to a stone to be moved; if necessary thesto~e is loosened from the bottom by a few violentjerks. It is then carried to the edge of the nestand dropped. Most stones are placed in acrescent-shaped pile at the downstream edge, buta few are carried to the upstream edge. Gravelusually less than 1 inch in diameter remains tomake the nest floor. Most of the silt particles arestirred up by the writhing bodies and carried outof the nest by the current during the excavation.Rocks comprising the streambed of Cayuga Inletare predominantly shales. In table 29 are listeda number of nest measurements and the size ofstones lining the nest floor. The stone diametersof the rubble represent only the larger flat surfaces.
The nests are usually oval with the long axisparallel with the water current. Nest size variesgreatly but most are approximately 1 to i ~ feet indiameter, and 3 to 5 inches deep. Nearly all nestsare located in water one-half to 2 feet deep.
Customarily, males begin the nest constructionand are later joined by a female who assists withthe work. Males habitually start several nestswhich they abandon. Usually they proceed upstream as the nests are constructed and deserted.
Occasionally several males or several females aretogether in one nest. These communal nests arelarge, often 2 to 3 feet in diameter. Lack qfsuitable nesting are.a does not appear to be thecause of communal nesting. The fact that theyare more commonly found toward the latter part

SEA LAMPREY OF CAYUGA LAKE 589
TABLE 30.-0ccupan_cll of sea lamprey nests in Cllyuga Inlet,between May 11 and June 7, 1951
[NC!.observatlons on May 28 or June 2-S)
end of the month. On June 6 and 7 the percentageof occupied nests had decreased to 12.
In sections (! through G where the spawningpopulation was high, superimposition of one neston another and the indefinite boundaries betweenadjoining nests prevented accurate determinationof the total number of nests. In areas wherespawners were less numerc,ms, nest building andspawning were orderly. In such areas no superimposition or consolidation of nests was observedand usually but one pair of lampreys was seen inone nest.
The number of nests per section of stream as ofMay 3o-June 1 is considered a reliable index to thetotal number (table 31 and fig. 12). This periodwas chosen because it was the last date whenaccurate nest counts could be made. The figuresgiven are believed to be only slightly lower thanthe actual total numbers.
The greatest density of nests, one per 15 feet ofstream, was found in section E, the area immediately.downstream from the U.S. Geological Survey dam. The first nest.building activities werein this section. Section G, the area just belowNewfield station, ranked second in nesting densitywith one nest per 17 feet of stream. Sections D,F, and (! followed in decreasing order. Densitieswere extremely low in sections H, I, J, and K, alllocated upstream from the Newfield station.These sections may be considered as of little importance for lamprey spawning when low or moderate water levels, similar to those of 1951, prevail(see fig. 9 for water volumes).
Some nests were not used for spawning, whereasothers were utilized by several pairs. An invesItigation into the number of nests actually utilized
TABLE 31.-Number and density of sea lamprey nests ineach 1-mile section of Cayuf1a Inlet, May SO-June 11951 '
[Bee fig. 10 for locations of sections)
Number Feet ofof neBts stream
per nestsection
o 0_____________ 311 17o H_____________ 19 278
223 24 1. :_ 19 278264 20 1._____________ 'Z1 189343 15 K. 1 5,280261 20 ;._. • __
Number Feet ofsection of neBts stream
per nest
Gage (1893 and 1928) and Surface (1899) havepreviously reported on the spawning of the CayugaLake sea lamprey. A recent and more detaileddescription was given by Applegate (1950) ofspawning in the Ocqueoc River, a tributary ofLake Huron. Since Applegate's description agreeswell with observations made in Cayuga Inlet, comments are limited here to an explanation of figure14. (A) The female, on the left, is securely anchored by her oral disc to a stone at the upstreamedge of the nest; the male is brushing his oral discalong the dorsolateral portion of the female fromthe region of the first dorsal fin forward to thehead; (B) the male, above and to the right, hasjust adhered to the top of the female's head andhas bent the posterior portion of his body to theleft in preparation to hold the female; (0) the
was made June 9 and 12, 1951, when 137 nestswere examined for eggs. A shallow rectangula.rfunnel, its mouth 18 inches square, made of brassscreen, 60 meshes per inch, was placed downstream from each nest. A few large stones wereplaced alongside and slightly behind each nest toguide the water current into the funnel. Whenthe funnel was in position the sand and gravel inthe nest pocket was scooped up with a shovel,lifted to the water's surface, then slowly pouredback into the nest to free the lamprey eggs. Thisprocess was repeated until some eggs were obtained or until all material in and around the nesthad been thoroughly sifted. Lamprey eggs andoccasionally sucker eggs from the nest site drifteddownstream into the screen. The results revealed59 (43 percent) nests with sea lamprey eggs, and78· (57 percent) nests without. Five nests contained an estimated 10,000 eggs or more. Only afew hundred were recovered from most nestswhich contained eggs.
Spawninl&
A _B _C _D. _E _F • _
Number of neBts Percentage of nests
Occupied Unoccupied Occupied Unoccupied
4 0 100 03 2 60 404 10 29 716 6 SO SO
110 129 46 M88 170 34 6634 48 41 6933 131 20 8091 160 36 6449 339 13 8762 187 22 7828 22S 11 8931 213 13 87
May 21- _May 22 _May 23 _May 24 _May 25 _May 26 _May'Z1 _May 29 _May 30 _
~~~ ~~::::::::::::::::::June 6 • _June 7•• __• _
Date
498325 0-59----3

590 FISHERY BULLETIN OF THE FISH AND WILDLIFE SERVICE
\.", I
~'."""': .:
.• !I
..... '. 1
.. :.."
,..
- ;... . ..
~.. -.
, .
, _., r - --- :--_ ".
"- oj..: •.-'~
;.~~I::..~:., .>..~.. ' .: ,:', I· t· .'. (!, .•~ ..- .~''''~. ..:~ ~ i. ..~.,I.'.'. ... . :J".. I .:
t • -!.~.. .
-:-f!_~: ~-~.~. -~~. '1..", : .
.... I. .,. -:C·., .::.~ ::.~~
FIGURE 14.-A pair of spawning sea lampreys in Cayuga Inlet, May 1951.. . "or· -.
male, above, has completely encircled the femaleby spiraling the posterior· portion of his' trunkabout her (note the thin opaque covering of themale's eye; he is blind); (D) iIi the final stage, the'male, above and to· the right, 'and the femalerapidly ·vibrate their bodies as both eggs andsperm are emitted from their closely approximatedvents (fine particles of sand stirred from the floorof the nest by the' vibrating lampreys adhere tothe sticky surface of the eggs and aid considerablyin retaining· them in the nest).' .
Actual copulation lasts only a few' seconds" butis repeated at intervals of one minute to one-halfhour depending on water temperature, time withinthe spawning season, and other factors. Spawning by a pair of sea lampreys commonly lasts about'1~ to 2 daYs. .
Fecundi~y
Surface (1899) placed the production ·of eggs byCayuga Lake sea ,lampreys at an average of27,500 '(range of 25,000 to 30,000), and Gage(1928) gave .the fecundity of three specimens as63,000; 65,000, ·a·nd 108,270 eggs. Applegate(1950) determined a mean of 61,500 eggs (cor:·:respondIng mean length of 17.4 inches) and arange of 24;021 to 107,138 in sea lampreys fromLake Huron tributaries. Vladykov's (1951) estimates of 72,870 eggs for 'sea lampreys from LakeMichigan"and 55,913 for Lake .Huron specimensagree well with Applegate's findings.
The gravimetric method' has been found to hethe 'IilOst desirable means for calculating the number of 'eggs in' a sea lamprey ovary. Detailed~.tudies· by· Applegate (1950) on the ovary of the

SEA LAMPREY .OF CAYUGA LAKE 591
sea lamprey from Lake Huron· tributaries, revealed no appreciable size differenees of ova fromthe anterior, middle, and posterior portions. Inaccordance with the results of Applegate's studies,the method used in calculating the number ofeggs eontained in Cayuga Lake specimens was asfollows: total body lengt.h and we~ghtof the specimen were. measured; t.he ovary was dissected fromthe body, weighed, and preserved in 5-percentformalin; at a later date, the ovary was removedfrom the preservative, drained, and blott.ed dryas. possible; the entire ovary was weighed to thenearest 0.01 gram; a small port.ion (1.00-1.55grams) from the midsection of the ovary was removed and weighed to the nearest 0.01 gram; thetotal number of eggs in the sitmple was count,ed'and the number of eggs in the entire ovary wascomputed..
Determinations of fecundity were made for 29sea lampreys eollected in Cayuga Inlet on April 30,1951. The size of each specimen and the numberof eggs each contained are listed in table 32.
These lampreys averaged. 15.6 inches in length;minimum and maximum lengths, 11.7 and 20.. 1inches; tot.al body weight averaged 5.1 ounces; andweight extremes were 1.8 and 11.7 ounces. Noneof the lampreys had deposit.ed any eggs prior t.ocapture, since spawning did not. take pXace until 1month after t.hey were collected. The regressionof number of eggs on t.he total length of lampreyis presented in figure 15. The regression line wasfitted mat.hemat.ieally. Ext,reme egg counts amongthe specimens were 14,000 and 85,000.
Average lengt.h of female lampreys in the 1951spawning migrat.ion in Cayuga Inlet was 15.2inches. A female of this size produces approximately 43,000 eggs.
It is obvious from figure 15 t.hat great. variationin egg number oceurred even among ·lampreys ofthe same length. The major source of t.his variation wa~ diversit.y in ovary size. Large fenialest.ended to have a proport.ionat.ely larger ovary andfewer eggs per unit weight. of ovary.
BODY LENGTH IN INCHES
90,00012 13 14 15 16 17
80,000
70,000 • •II) •(!) • • •(!) 60,000ILl • •LL. •0 50,000 •a:ILlCD
4<?,OOO~:::l •z
30,000• •
20,000 /'" • .-•
10,000
Ol--..l.----L_L-....I.----'-_L--....L---L----'_...L.----L.---IL--....L---L----'..-:..J....,..-J.-----i_.J.--...l....---L_L-....L...---J300 320 340 360 380 400' 420 460 480 500 520
BODY LENGTH IN MILLIMETERS
FIGURE 15.,-Regression.of'the number of eggs per female sea lamprey on total length.
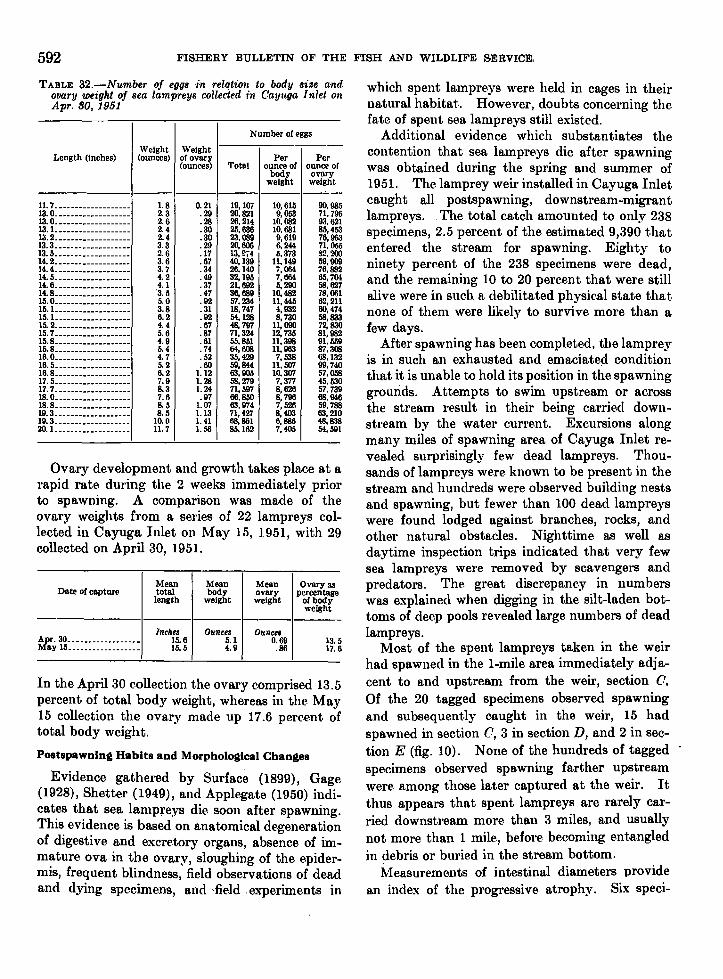
592 FISHERY BULLETIN OF THE FISH AND WILDLIFE SERVICE,
-------- --------------"-
TABLE 32.-Number of eggs in relation to body size andovary weight of sea lampreys collected in Cayuga Inlet onApr. 30, 1951
In the April 30 collection the ovary comprised 13.5percent of total body weight, whereas in the May15 collection the ovary made up 17.6 percent oftotal body weight.
Mean Mean Mean Ovary asDate of capture total body ovary percentage
length weight weight of bodyweight
Inches Ounces Ounces
tf.:y~~~~~::::::::::::::=15.6 5.1 0.69 13.515.5 4.9 .86 17.6
which spent lampreys were held in cages in theirnatural habitat. However, doubts concerning thefate of spent sea lampreys still existed.
Additional evidence which substantiates thecontention that sea lampreys die after spawningwas obtained during the spring and summer of1951. The lamprey weir installed in Cayuga Inletcaught all postspawning, downstream-migrantlampreys. .The total catch amounted to only 238specimens, 2.5 percent of the estimated 9,390 thatentered the stream for spawning. Eighty toninety percent of the 238 specimens were dead,and the remaining 10 to 20 percent that were stillalive were in such a debilitated physical state thatnone of them were likely to survive more than afew days.
After spawning has been completed, the lampreyis in such an exhausted and emaciate4 conditionthat it is unable to hold its position in the spawninggrourids. Attempts to swim upstream or acrossthe stream result in their being carried downstream by the water current. Excursions alongmany miles of spawning area of Cayuga Inlet revealed surprisingly few dead lampreys. Thousands of lampreys were known to be present in thestream and hundreds were observed building nestsand spawning, but fewer than 100 dead lampreyswere found lodged against branches, rocks, andother natural obstacles. Nighttime as well asdaytime inspection trips indicated that very fewsea lampreys were removed by scavengers andpredators. The great discrepancy in numberswas explained when digging in the silt-laden bottoms of deep pools revealed large numbers of deadlampreys.
Most of the spent lampreys taken in the weirhad spawned in the I-mile area immediately adjacent to and upstream from the weir, section O.Of the 20 tagged specimens observed spawningand subsequently caught in the weir, 15 hadspawned in section 0, 3 in section V, and 2 in section E (fig. 10). None of the hundreds of taggedspecimens observed spawning farther upstreamwere among those later captured at the weir. Itthus appears that spent lampreys are rarely carried downstream more than 3 miles, and usuallynot more than 1 mile, before becoming entangledin debris or buried in the stream bottom.
l\feasurements of intestinal diameters providean index of the progressive atrophy. Six speci-
Number of eggs
Per PerTotal ounce of ounce of
body O\"Bryweight weight
Weight Weight(ounces) of ovary
(ounces)Length (inches)
11.7___ • _______________ 1.8 0.21 19,107 10,615 90,98513.0__ •____ ._._________ 2.3 .29 20,821 9,053 71,79613.0__ •____ •___________ 2.6 .28 26,214 10.082 93,62113.1. __________________ 2.4 .30 25,636 10.681 85,45313.2__ •_. ____ •_________ 2.4 .30 23,089 9,619 76,96313.3_______ ._._._______ 3.3 .29 20. 606 6.244 71,05513.5_. _. _______ • _______ 2.6 .17 13, ~'4 5.373 S2.2oo14.2___ •__ •___________ • 3.6 .67 40,139 11.149 59,90914.4________ ._ •__ •_____ 3.7 .34 26.140 7,064 .6,88214.5__ •__________ •_____ 4.2 .49 32,195 7,664 65,70414.6. _. _____ •____ •_____ 4.1 .37 21,692 5,290 58,62714.8____ •_. _. _•• _•_____ "3.5 .47 36, 689 10,482 78,06115.0__ •_____ • __ • _. _____ 5.0 .92 57.234 11,445 62,21116.1___________________
3.8 .31 18,747 4,932 60,47415.1. __________ •_______ 6.2 .92 54,128 8,730 58,83315. 2__________ •____ •___ 4.4 .67 48, 797 11,090 72, 83015.7__ •• _______ • _______ 5.6 .87 71,324 12,735 81,98215.8__ •_______ •_. ______ 4.9 .61 55.851 11,398 91.55915.8___ • __________ •____ 5.4 .74 64,608 11,963 87,30816.0_________ • _________ 4.7 .52 35,429 7,538 68,13216.5 __ • ______ • _________ 5.2 .60 59,844 11.507 99,74016.8__________________ • 6.2 1.12 63,905 10.307 57,05817.5_ •• ___ ._ •• _____ •___ 7.9 1.28 58,279 7,377 45.53017.7____ •___ •__ • _______ 8.3 1.24 71,597 8,626 57.73918.0___________ • _. _____ 7.6 .97 66.850 8,796 68.94618.8____ •_. ____ • ___ • ___ 8.5 1. 07 63,974 7,526 59,78819.3__________ •___ •• ___ 8.5 1.13 71,427 8,403 63,21019.3____ • ______________ 10.0 1. 41 68,861 6,886 48,8-3820.1. _______ • __________ 11.7 1.56 85,162 7,405 54,591
Postspawning Habits and Morphological Changes
Evidence gathered by Surface (1899), Gage(1928), Shetter (1949), and Applegate (1950) indicates that sea lampreys die soon after spawning.This evidence is based on anatomical degenerationof digestive and excretory organs, absence of immature ova in the ovary, sloughing of the epidermis, frequent blindness, field observations of deadand dying specimens, and "field "experiments in
Ovary development and growth takes place at arapid rate during the 2 weeks immediately priorto spawning. A comparison was made of theovary weights from a series of 22 lampreys collected in Cayuga Inlet on May 15, 1951, with 29collected on April 30, 1951.

SEA LAMPREY OF CAYUGA LAKE 593
mens captured in August had a mean intestinaldiameter of 0.67 inch. In 55 spent lampreys captured in June the mean intestinal diameter was0.06 inch. Since the intestine had no noticeable~aper, this measurement was taken at approximately the midregion. These values indicate ashrinkage of nearly 94 percent in the diameter ofthe sea lamprey's intestine prior to and during thespawning period.
Loss of Body Weight and Length
Length measurements and weights of 27 maleand 37 female sea lampreys that were tagged ontheir upstream migration and recaptured afterspawning, provided information on the absoluteand percentage loss in weight and length (table 33).
Loss in weight during the spawning seasonamounted to 8.5 percent for males and 34.1 percent for females. There is little evidence of correlation between prespawning weight and subsequent percentage loss of weight.
Greater weight of sex products discharged byfemales at spawning accounts for part, but by nomeans all, of the sex difference in total loss ofweight (table 34). In prespawning samples thetestis made up 2.9 percent of the total weight ofmales and the ovary 17.5 percent of the totalweight of females. The gonads did not disappearentirely, however, at spawning. An estimated26 percent of the testis and 1 percent of the ovarieswere present in the postspawning lampreys; consequently, the maximum estimated losses throughdischarge of sex products were 2.1 (2.9XO.74)percent for males and 17.3 (17.5XO.99) percentfor females. Additional weight losses are accordingly 6.4 (8.5-2.1) percent for males and 16.8(34.1-17.3) percent for females. The loss ofweight in females, in addition to that attributableto discharge of sex products, is between 2 and 3times that of males.
TABLE 33.-Losses in length and wel:ght of matl/re sealampreys during the spawning season
Prespawning Decrease Percentage ofvalue decrease
Item and sex -Aver- Mini· Maxi· Aver- Mini· Maxi· Aver· Mini· Maxi-age mum mum age mum mum age mum mum
----------------Length (inches) :
Males __ .... _. 14.9 12.6 18.0 1.7 0.8 2.6 10.9 5.9 16.8Females.... _. 15.6 13.1 18.6 2.8 1. S 3.9 17.9 12. 5 23.6
Weight (ounces):Males_ ..... __ 3.30 2.26 6.35 .33 .04 1.06 8.5 .9 19.3Females. __ . _. 4.52 2.29 7.80 1.54 .49 2.72 34.1 16.7 48.5
TABLE 34.-Mean percentage composition of total weightmade up by gonads a'lId percentage losses in weight dueto deposition of reproductive prodl/cts alld from. other ca'uses
[Figures in parentheses are the numher of specimensupon which the mean values are based)
Perct'ntage
Loss in Gonad Unaccount·Sex Body weight made· weight remaining able los~
up by gonad during after in weightspawning spawning
Apr. 19 May 15 May 30- May3Q- May 15-June 8 June 8 June 8
Male.••. __ .. 1.5 (l0l 2.9 (10) 8.5 (27) 26 (10) 6.4Female.. ___ . 12. 8 (26) 17.5 (41) 34.1 (37) 1 (16) 16. 8
Loss in lengt,h was 11 percent in males and 17.9percent in females. In absolut,e measures thisshrinkage amounted to a loss of several inches intotal length. The sex difference in percentageloss of length was smaller than in percentage lossin weight. The percentage loss in length tendedto be greater among the longer than among theshorter males, but in females' no correlation between length and relative decrease in length wasdetectable.
EGG DEVELOPMENT AND HABITS OFAMMOCOETES
Egg Development
Freshly deposited sea lamprey eggs are light tanQr cream color, nearly spherical, and have an average diameter of approximately 1 millimeter. Thissmall size permits them to fall int,o, the intersticesof the gravel in the nest bottom where they arecovered and protected during incubation.
An experiment in artificial propagation was conducted at the Cornell Experimental FisliHatchery.One large partially spent female and several ripemale sea lampreys were used. Milt from one malelamprey was expelled into a basin which cont,aiIled approximately one teaspoonful of water.Then the eggs, an estimated 15,000, were discharged into the basin, and milt from another malewas added. The eggs were stirred wit,h a featherfor 1 minute. Next. 1 cupful of water was addedand the contents stin'ed for 10 minutes. Theliquid was then decanted and replaced by 1 quartof water. After the eggs were stirred ratherslowly for one-half hour t.hey were placed in aDowning hatching jar. The water volume passingt,hrough the jar was adjusted to keep the eggs in

594 FISHERY BULLETIN OF THE FISH AND WILDLIFE SERVICE.
motion without danger of flushing them from thejar.
One-third of the eggs hatched on June 17 (13days), and the remainder the following day (14days). Daily morning water temperatures duringthis period averaged 60.7° F. (extremes of 57° and65° F.). 'rhe source of water used in hatchingthese eggs was Ca,scadilla Creek, in which watertemperatures are similar to those of Cayuga Inlet.
At hatching, the anterior portion of the trunkemerges from the chorion. The posterior portionnJ,ay remain wit,hin·the ~gg case ·for as long as 1 dayafter the anterior end emerges. The yolk sac,which is located ventrally on the posterior half ortwo-thirds of the body, is expanded only slightlyat· its anterior portion, but ends in a globular massposteriorly. This enlargement of the yolk sactends to hold the posterior end of the ammocoete'sbody within the shell.
Habits of Ammocoetes
The first'2 days after hatching, the ainmocoetesremained rather inactive. At this time they were4 mm. long, still opaque, and of cream or light tancolor. The caudal portjon of the tr.unk, whichwas made ul'dargely' of yolk sac at this stage., wascurved ventrally arid' anteriorly to give them ahooked appearance. This hook shape disappearedthe thi~d da.y after hatching, when the ammocoeteshad absorbed most of the yolk. They very soon:became so~newhat translucent with a light suffusion of brown pigment dorsally and dorsolaterally.
.After the yolk had been absorbed the ammocoetes became active and burrowed rapidly intothe soft bottom. Partially buried specimens exhibited a negative phototropism. Newly hatchedammocoetes remain in t.he nest for several days,but later emerge in search of other niches. InMichigan, Applegate (1950) found that newlyhatched ammocoetes left the nest between 18 and22 days after fertilization. In Cayuga Inlet, thenewly hatched ammo.coetes were located along thestream margins, buried in the fine sand'-silt sediine~t. Possibly they were present in the deeperwa~,ers also, but they may have been overlookedbecause of the difficulty in seeing such small crea-tures in deep water. .
Larger ammocoetes occupy various habitats,but most commonly are found in sand and siltdeposits into which'they can easily burrow. Portions of the stream with medium to strong water
currents' and suitable sediments appear to be mostsatisfactory. Ammocoetes and transforming lampreys do not emerge from their burrows unlessdisturbed or unless radical changes occur in waterconditions.
Observations on ammocoetes held in aquariumsrevealed their method of burrowing. They penetrate the bottom sediments by thrusting the headdownward perpendicular to the bottom and making very rapid undulatory motions. As soon asthe snout and head enter the bottom they draw thebody downward by constant undulation of thehead and snout in an S-shaped pattern. Aft,er thetrunk is approximately two-thirds buried, t,heswimming motions of the posterior end cease, butthe undulations of the anterior end continue topull the ·body into the sediment. The ammocoetesbegin to turn in a horizontal direction after approximately half t,he body is buried. They thengradually move toward the surface of the sedimentuntil a second opening to the water has been made.This maneuver forms a U- or crescent-shaped burrow. The sediment fills in the burrow behind theposterior end of the ammocoete. All the waterwhich provides food and oxygen passes throughthe remaining entrance.
Mucus secreted by the ammocoete lines theburrow and holds the particles of the bottom material in place. This lining prevents the entranceto the burrow from collapsing when. the ammocoete· retracts within it. The burrow is believedto be a stable ,excavation within which the ammocoete lives until driven from it, or until it is destroyed by floods or other forces. Once the ammocoete leaves the burrow it constructs a new oneimmediately. The length of the burrow is usuallyless than twice the occupant's length and commonlyonly 1X times its length. When mildly disturbed, the ammocoete moves backward, awayfrom the mouth of the burrow. When severelydisturbed it leaves the burrow and swims rapidlyaway to enter the bottom sediment at anotherlocation.
Details of the respiration and feeding processesare not thoroughly known. E.xpansion and contraction of the branchial chamber, together withaction of the velum, pump a continuous stream ofwater into the ammocoete's oral chamber and outthe gill openings. The oral papillae spreadbranchlike across the entrance to the oral hood.These papillae constitute an excellent strainer to
SEA LAMPREY OF CAYUGA LAKE 595
prevent large undesirable matter from entering,·and a coating of mucus adds to its effectiveness.Water passes through the branchlike sieve intothe gill chambers, and after leaving the gillpouches continues to move backward along theammocoete's body and gradually filters" upwardthrough the sediment.Food and Feeding
Creaser and Hann (1928) reported micro-organisms, primarily algae, in the digestive tracts ofammocoetes. The most common kinds of algaewere diatoms and desmids. Sand grains werefound in all ammocoetes examined. Although thenumber of protozoans was small, the authors believed that they probably furnished a generousportion of the diet, but were more quickly digestedthan the hard diatoms· and desmids. Analysis ofthe water and bottom deposits from the habitatin which the larvae were living indicated thatlamprey larvae obtained their food from thewater and not (rom the sediments in which theyburrowed.
Results of analyses for a few ammocoetes fromCayuga Inlet correspond closely with the observations made by Creaser and Hann. The only important difference was that Cayuga Inlet specimens contained a relatively large amount ofperiphyton. Crystals of sand were common al-,though as a rule the particles were very fine(0.125-0.062 mm.), only a fraction the size of sand'grains predominant in the area.
Of importance in feeding is the endosytle, amucus-secreting gland, located in the floor of thepharynx. According to Newth (1930), dorsoventral ridges lead out of the endostyle to form ahollow cone of mucus threads to which the foodparticles adhere as the water passes through. Themucus thread, with its adherent particles, is slowlydrawn caudally into the alimentary tract. Theaccumulated mat of foreign particles is periodicallythrown off the oral papillae by a reversal of thewater current. Thus it appears that the only selection of "food" by ammocoetes is on the basisof particle size.Duration of Larval Life
Past estimates of the duration of larval life ofthe sea lamprey have been based on different sizesof ammocoetes taken at anyone time and, in morecritical studies, on the identification of age groupsdetermined from modes in length-frequency dis-
tributions. Use of the Petersen method is so wellestablished that detailed comments on it need notbe given here. Ordinarily the youngest agegroups can. be identified easily and accurately.InterpretatIOns become less dependable in oldergroups in which extensive overlap of the distribution of adjacent age groups tends more and moreto obscure the modes.
Schultz (1930) explored three statistical methods for evaluating the significance of modes asi~dic.ato~ of age groups in the length-frequencydIstributIOn of several" thousand ammocoetes ofLampetra planeri. Results of this work are summarized by his statement: "A statistical analysisof the ~ata shows the minor modes are not significant and do not represent year classes. They arerather accidental modes owing to sampling."Other workers, however, among them" Okkelberg(1921 and 1922) and Hardisty (1951), have employed this method with apparently satisfactoryresults. The lack of a better method compelledits use in the present inquiry.
Earlier investigators of the sea lamprey in Cayuga Lake gave no quantitative data upon whichtheir estimates of length of larval life were based.
"Surface (1899) stated that the ammocoete stagelasted at least 3 or possibly 4 years. Gage (1928),who based his opinion on observations of ammocoetes.captured throughout the year, believed thatthe duration of larval life "could not be less than4 years."
The most detailed studvof the duration of larvallife of the sea lamprey ;vas that carried "out byApplegate (1950) in Michigan. Length-frequencydistributions of extensive collections made duringAugust, October, and May led him to conCludethat the length of larval life, including the periodwhen transformation is occurring, was 4 years.He also stated that a rest period of 1 year; thelast year of larval life, was possible.
The present study of the duration of larval lifeof Cayuga Lake sea lampreys was based on ammocoetes taken from a I-mile stretch, section C, ofCayuga Inlet (fig. 10) located approximately 2miles upstream from Cayuga Lake. Water depthin this section approached a maximum of 5 feetin the deepest pools; however, most of the areawas considerably shallower, so that ammocoetecollections were made with reasonable efficiency.Collections were made during July 1950 and 1951by digging, seining, and with the aid of an electric

596 FISHERY BULLETIN OF THE FISH AND WILDLIFE SERVICE,
shocker. Collections in August 1951 were madeentirely by use of the electric shocker. Smallammocoetes (young of t,he year and yearlings)were not readily collected by this met.hod. However, since young and yearlings form distinctgroups in the length-frequency distribution, relatively few specimens were necessary to establishtheir modal lengths.
Total length, from the anterior tip of the oralhood to the posterior margin of the caudal fin, wasmeasured to the nearest mm. Weight was recorded to the nearest 0.01 gram. All measurements were made on fresh specimens anesthetizedin a 1- to 3-percent solution of urethane.
Characteristics described by Vladykov (1950)made it possible to distinguish sea lamprey ammocoetes from larvae of the American brook lamprey,Lampetra lamottei, the only species of lampreyother than the sea lamprey that occurs in CayugaInlet. If any misidentifications of species tookplace, they were among the young of the year andyearlings.
In the discussion of the data on the lengthfrequency distribution of Cayuga Lake ammocoetes (table 35), attention is given first to meas-
urements made on specimens collected in July(cols. 3, 4, 5, table 35; fig. 16) since in these collections only members of age groups 0 and I weretaken in sufficient numbers to establish their modallengths. Distinct modes at lengths of 0.47 and1.46 inches represent age group 0 (approximately1 month old) and age group I, respectively. Lessdefinite modes at lengths of 2.64, 3.54 (estimatedfrom minor peaks at lengths of 3.23 and 3.82inches), 4.21,5,5.59, and 6.10 inches are presumedto represent the average lengths of age groups IIt,hrough VII. It is recognized that some of thesemodes are based on a few specimens and could hedue to ehance variation alone. Specimens in thestage of transformation were not present in theJuly collections since metamorphosis does notbegin until August, or at least it is not externallydetectable until then.
Comparison of length frequencies of sea lampreyammocoetes collected in July and in August 1951indicat.es definitely that young-of-the-year (agegroup 0) ammocoetes were not represented in theAugust collection; furthermore, few if any 1-yearolds (age group I) were taken in August. Thisjudgment, based primarily on comparisons with
TOTAL LENGTH IN INCHES
0 2 3 4 5 6
IY14
...uz 12...rrrr::::l 10uu0
IL80
>-uz 6...::::l0...rr 4IL
2
00 170
TOTAL LENGTH IN MI LLI MET ERS
FIGURE 16.-Length-frequency distribution of sea lamprey ammocoet~s taken from Cayuga Inlet during July.

SEA LAMPREY OF CAYUGA LAKE 597
1950 1951 Total
Length·frequency ~istributionof ammocoetes
TABLE 35.-Length-frequency distribution of ammocoetes andtransforming sea lampreys collected in Cayuga Inlet duringJ11ly and August
[The lengths are grouped by 5-mm. Intervals)
Tra.ns·Mldpolnt, --,-__--,- I fanning
Length class of length specl·(millimeters) class July Total mens,
(inches) I----,---r--I August JUlya.nd August1951 August 1951
<5_•• _. __ •••• 0.085-9••_. ___ ._._ .2710-14••• _••• _. .47 5 ------ 5 --- ... ---- 5 --.-------UH9••• ____ ._ .67 ------ ------ ------ ----~.---- ---------- ------ .. ---20-24••• ___ •• _ .87 -- ... --- ------ ------ ---------- ---------- ----------25-29••_•• _._. 1.06 1 I ---------- I .. -.. -------30-34••• _••_._ 1.26 5 5 ---------- 5 ----------35-39••_•••• _. 1.46 10 10 "'--'-'if 10 ----------40-44••_._•••• 1.65 4 4 6 ---.-.----45-49. ___ •__ •• 1.85 3 "--3' 3 2 5 -------_ .. -50-54••• ____ •• 2.05 3 6 6 1255-59••_•• __ •• 2.24 5 I 6 5 II60-64••••• __ •• 2.44 8 8 5 1365-69••_. _••,. 2.64 12 I 13 4 1770-74._••••••• 2.83 10 10 1075-79••••• _•• _ 3.03 6 I 7 3 1080-84,.._••• __ 3.23 11 I 12 10 2285-89••• _••• _. 3.43 7 3 10 1 11 ----------llO-94••• __ •••• 3.62 9 9 6 15 ----------95-99••_____ •• 3.82 7 3 10 8 18100-104._. __ •• 4.02 6 2 8 10 18105-109••__ ._. 4.21 10 4 14 13 27110-114••• ____ 4.41 2 7 9 15 24115-119••• ___ • 4.61 5 5 10 10 20 1120-124... __ ._ 4.80 3 3 6 23 29 1125-129__._•• _ 5.00 3 8 1\ 21 32 3130-134..._••_ 5.20 1 6 7 14 21 5135-139__._••• 5.39 I I 7 8 12140-144..••• _. 5.59 I 3 4 7 II II145-149._•••• _ 5.79 ~.-.-- 6 6 7150-154..••••• 5.98 1 I 2 3 5155-159___ ••• _ 6.18 ------ 1 I 1 2 2180-164__••• __ 6.38 ------ ------ ------ ---------- --- .... --- 3
July collections from Cayuga Inlet, is also supported by data presented by Applegate (1950),who demonstrated that in Michigan the 0 grouphad a mean length of 0.63 inch and age group Ihad a length of 1.77 inches. It seems reasonableto assume, therefore, that the mode at 2.24 inchesin figure 17 represents age-group II. It followsthen, that modes at lengths of 3.23,4.21 (correctedfrom the asymmetrical mode at 4.41)" 4.80, and5.51 inches represent age groups III through VI.Transforming ammocoetes (VII group) form amode at approximately 5.51 inches.
Grouping of the July and August catches ofammocoetes and transforming sea lampreys resulted in a somewhat smoother length-frequencydistribution (cols. 7, 8, table 35; fig. 18). Distinctmodes at 0.47, 1.46, 2.36 (corrected from minormodes at 2.05 and 2.64), 3.23, 4.21, 5, and 5.59inches represent age groups 0 through VI. Thetransforming lampreys form a nearly normal distribution with a modal length of 5.39 inches (agegroup VII).
Weights as well as lengths are available forammocoetes and transforming sea l~mpreys collected from Cayuga Inlet during August 1951(table 36; fig. 19). Six definite modes are present
170
6
,..,I ,I \
\E: \
\\',\
\\
\\,-,'\
\\
5
::ll: -- X TRANSFORMING
-0 AMMOCOETES
4
TOTAL LENGTH IN INCHES
3
n
2
I
0
24IIIuZIII
20It:It:
.::;)
Uu 160
...0
12>-uz
0III::;) BaIIIIt:...
4
00
TOTAL LENGTH IN MILLIMETERS
FIGURE 17.-Length-freq"i"ency distribution of sea lamprey ammocoetes and transforming specimens taken from Cayuga, Inlet .during August.

598 FISHERY BULLETIN OF THE FISH AND WILDLIFE SERVICE·
FIGURE lS.-Length-frequency distribution of sea lamprey ammocoetes (solid line) and transforming specimens (brokenline) taken from Cayuga Inlet during July and August.
WEIGHT IN OUNCES
- 0 AMMOCOETES
--- X TRANSFORMI NG
0.25.0.20
"I "\ / \\ / ,\ / ,\/ \
\ A" ,/
"1\1\"I \ I \, \ II \ /I V,II
0.150.100 0.05
l&J ]Iu 12zl&Ja::a:::::) 10uu0
... 80
>-u 6zl&J:::)
0l&J 4a::...
2
00
WEIGHT IN GRAMS
FIGURE 19.-Weight-frequency distribution of sea lamprey ammocoetes and transforming specimens taken from CayugaInlet, August 1951.

SEA LAMPREY OF CAYUGA LAKE 599
TABLE 36.-lVe1:ght-frequency distribution of amlllocoetesand transforming sea lampreys collected in Cayuga Inletduring August
[Weights are grouped by 0.25-gram Intervals]
in the weight-frequency graph, the largest ofwhich is composed of the t,ransforming ammocoetes (believed to be only one age group). Sinceage groups 0 and I were established to be lackingin the August collections, a justified assignment ofages to the modes on the weight-frequency graphis as follows: 0.013 ounce, age group II; 0.031ounce, age group III; 0.066 ounce, age group IV;0.101 ounce, age group V; 0.154 ounce, age groupVI; 0.172 ounce, age group VII (the transformingammocoetes).
The distinctiveness of. the modes in the weightfrequency distribution (fig. 19) is st.riking. Evenmore significant is the agreement between estimates of age made independently from length andweight distributions. From the data on t.helength-weight ·relation of ammocoetes (table 37;fig. 20) it is seen that modal lengths and modalweights agree; it may be concluded that the samegeneral groups of ammocoetes were identified bythe two methods. Although analyses of thelength and weight frequencies led to the same results, the weight-frequency method seems to bethe better because of greater precision in definingage groups.
Ammo- Transform-coetes Ing sea
lampreys
0.167.173.198.207.183.207.221.204.215.243.209.213.258.258.228
Length Weight(Inches) (ounces)
5.79 _5. 79 ._ -- __5.79. _5. 79 _5.83.. _5. 90 - _5.98 _6.02 _6.06 _6.06 • __6.22. _6.26 _6.3L _6.42 _6. 46 _
0.159.151.160.166.173.148.169.188.173.156.167.171.172.188.168.192
Length Weight(inches) (ounces)
4.13 _4.13 _4.17 _4.17.. _4.17.. _4.17 • __4.2L _4.2L _4.25 _4. 29 _4.33 _4.33 _4.33 _4.37.. •4.4L _4.4L _4.45 • _4.45 ._4.45.. _4.49 • _4.49 _4.49 _4.57.. _4.57 _4.57.. _4.57.. _4.65 ._.4. 65__ ~ •__4.65.. _4.72 _4.76 • __4.80 _4.80 ._4.84 _4.84 _4.88 _4.92 _4.92 _4.92 _4.92 _4.96 _4.9lL _
0.117 5.43.. _.102 5.47.. _.123 5.47.. _.133 5.5L •.134 5. 51.. _.127 5.55.. _.133 5.59 _.155 5. 59 •.139 5.63 _.155 5.67.. _.139 5.67.. _.151 5.67.. _.152 5.67 •.165
1
5.67--------- ..172 5. 7L _.1st 5. 75.. _
0.006.009.009.012.010.011.013.012.016.015.015.016.017.018.019.021.023.028.030.029.032.032.032.036.038.031.045.038.045.045.059.057.050.057.055.048.048.050.056.057.060.003
Length Weight(Inches) (ounces)
4. r>9 _4.88 ._5. 00 _5.12 _5.-12 _5.20 • _5. 20_. _6. 20_. _5.24__ • _5.27 _5.35.. .5. 35 _5.39 _5.39. _5.39 _5.43 _
-. -------1----11------
AMMOCOETES
Length Weight Length Weight Length IWeight_(_In_C_he_S)_I._(_ou_n_ce_s_)_11__(_in_Ch_e_SI_I_(~un('t's) ~~ (ounces.!
0.063 4.96_________ 0.102.065 4.96_________ .106.056 5.00_________ .092.063 5.00________ _ .098.067 5.00_________ .099.069115.0L------- .103.060 5.0L_______ .108.066 5. OL_______ .127.06~ '. 5.08_________ .098.040 ;' 5.08_________ .099.067 5.08_________ .103.073 5.08_________ .106.074 5.12 • .110.062 5.12_________ .115.060 5.16 ._ .106.079 5.16_________ .107.069 5.16_________ .110.070 5.20 .___ .110.078 5.20 • .111.066 5.20_. • .115.077 5. 24 • .104.079 5.24 .__ .108.078 5.27 .___ .112.080 5.27 •• __ .117.080 5.27_____ .124.068 5.3L ._ .109.079 5.43_________ .142.082 5.47.. ._ .132.095 5.51.._______ .136.082 5.51.. ._ .150.082 5.55 . _ .143.086 5.55_________ .147.091 5. 59 • .152.089 5.63 ._ .131.090 5.71.. ._ .163.095 5.83.._______ .158.089 5.87.. .__ .168.096 5. 87.._______ .168.099 5.94_________ .193.106 6. 02 • .162.097 6.14 •• __ .185.100
TRANSFORMING SEA LAMPREYS
The most questionable aspect in the interpretation of the length-frequency data on Cayuga Lakeammocoetes concerns the validity of age group VI,a group for which the mode was little apparent inthe August frequencies and whose size was slightly,if at all, greater than that of transforming lampreys. Evidence that the VI group is valid wasobtained from experiments with. marked specimens. In this experiment a series of sea. lamprey
TABLE 37.-Length-weight relationship of ammocoetes andtrallsforming sea lampreys from Cayuga Inlet
1. 65 _I. 97_. _2.05 _2.09__ . _2.13__ . _2.20 •__ . __2.20 •__'2.24__ • •__2.32 _2.40 • _2.40__ • • __2.40 •__2. 40 _2.68 _2.68 . __ •• _2.72__ . • __2.95. _3. 07-. _3.11•• __ •• _3.23. • _3.23_._. _3.27 • _3.31.. _3.31 _3.31 _3. 39 _3.62 _3.66 _3.66 _3.74,. •__3.74_. _3.78. _3. 86 _3.86 _3.90 _3.98 _3.98. ._4.02 ._4.06 •__4.09__• •__4.09_. •4.13_. _
0.04 2.13 12.22 2 ---- - --- - - --.31 8 ------------.40 4
-----~---~--
.48 7 .--_.--_.~--
.57 11 .---- ----. --
.66 12 .-._---_.._-
.75 8 --._--------
.84 7 --._--------:92 9 .-----------
1. 01 13 11.10 10 .-----------1.19 4 21.28 4 11.36 2 51. 45 3 11. 54 3 81.63 3 51.72 1 71. 81 1 11.89 1 41. 98 ------------ 12.07 ---_.-_.._-- 42.16 ---------.-- 32,25 ------------ 12.33 ------ ---.-- ------------2.42
--~---------1
2.51 -_. --------- ------------2.00 --.------._- 2
Midpoint Frequencyof cl~~ht 1 ---.,. _
(tenths ofounces)
Weight class (grams)
<0. 25. __ • __ • •• __ • " _•• - -_O. 2IHl. 49•• __ •••• • • •O. 5lHl. 74__ •••• __ •• •• _O. 75-0. 99. __ •••• __ • •_. _1. 00-1. 24••• _••• • • _1. 25-1. 49•• __ • __ •__ • • • •1.50-1.74••• •__ •• • • __1.7,;-1.99••••• _•• __ •• • •__ • •2. 00-2. 24••• _. __ •• • .' --_2.25-2.49••••• _. • •__ •__2.50-1. 74••••• __ • __ •• __ • • •2..7';-2.99__ , •• • ,, ._.3.00-3. 24. • • • "_3. 25-3. 49. •• • • • _3.50-3.74•••• _. • • • • _3. 7H. 99. ". __ • • • •__ •__ "4.00-·4. 24•• • •• _•• _4. 2.;-4. 49 •• ' •• _•• __ • • • • _4.50-4. 74 • • " __ • _4. 7H, 99 • • •• _5.00-5. 24 • • _5. 25-5. 49••• __ • • •__ •• __ • _5.50-5.74••• _._. • • _5.7,;-5.99 __ ••• __ • ._6.00-6. 24_ •• _6. 25-1\. 49 • • _6. 5(H;. 74 •• • _6.7';-6.99 •• •7.00-7. 24. • _7. 2';-7. 49. • •

600 FISHERY BULLETIN OF THE FISH AND WILDLIFE SERVICE
LENGTH IN INCHES
8 I 2 :3 4 5 6I I I I I I
XX
7f- .25X
II X
X I6f- X X
xx, X
xl .20 en(/) .~/ w~ 5f- IX U
X I X Z<t x x ~x•• :::>0:: a(,!)
X~~? . .15 zz 4 .4c x- : l-I- ~ /. II x. C).(,!) x I • -
I. ... -. W1LI :3 3:3:
. .,... r ' -.I 0./)..
2.J( ...
J: .:-... .-~/( ,. -- x TRANSFORMING
.05
1- • AMMOCOETES./. .
I~
I• I I
0 20 40 60 80 100 120 140 160
LENGTH IN MILLIMETERS
FIGURE 20.-Length-weight relationship of sea lamprey ammocoetes and transforming specimens taken from CayugaInlet during August. Regression formulas: for ammocoetes; Y= 1.63-0.0354 X +0.0004 X 3 j for transforminglampreys, }"=5.02+0.1667 X-O.OOO3)('1..
ammocoetes captured in Cayuga Inlet were markedwith cadmium sulfide or mercuric sulfide, as described by Wigley (1952), and installed in an outdoor hatchery raceway. The raceway bottom wascovered with several inches of sand and silt, andwater was supplied from Cascadilla Creek.Marked specimens with body lengths of 5.43,5.43,5.59, 5.91, and 6.02 inches (approximately thelength of age group VI) on August 24, 1951,began transforming in August 1952. Furthermore, marked specimens 4.80, 4.80, 4.92, 4.92, and5.12 inches long (about the length of age group V)on August 6, 1951, kept in the same raceway withthe previous group, did not transform in 1952.
These specimens are plotted in the length- andweight-frequencies of figures 17 and 19. This information and the modes indicated in all lengthand weight-frequency distributions not only giveconvincing evidence that t,he recognition of agegroup VI is valid, but lends support to the validation of recognizing other modes in the length- andweight-frequency distributions.
Although the present study has yielded thestrongest evidence for a larval life of 7 years, ascompared with 3 to 5 years propounded by previous investigators, these findings should be accepted with reservation. It should be emphasized, however, that most of the estimates of the

SEA LAMPREY OF CAYUGA LAKE 601
Transformation and Downsweam Movement
TABLE 38.-Growth of alllmoco~tes i-n Cayuga Inlet as estimated from length-frequencies of specimens collected duringJuly and August
The anatomical changes that take place duringthe transformation from the larval to the parasiticstage have been described by Gage (1928). According to Gage, transformation starts betweenmid-July and early September. This statementagrees with my observations. Few sea lampreyswere found in the transforming' stage in early
Body weight of ammocoetes increased slowlyduring their early years but increased progressivelywith age. The annual increments in weight during the third through seventh years of life were:0.018, 0.035, 0.035, 0.053, and 0.018 ounce. Ammocoetes in age group VII weighed 0.183 ouncejust prior to tra~lsformation.
August. In late August numerous specimenswere in an advanced stage of transformation butfew were in the early stage. "These observationssuggest that gross, externally visible morphological changes are completed within a period of 1 or2 weeks after transformation begins. In contrast, it appears that internal changes are notcompleted before January and probably not untilMarch.
Progress of transformat,ion was followed in ~
group of sea lampreys kept in a hatehery trough;the bottom of which was provided with sedimentfrom a streambed. From time to time duringOctober, November, and December five specimens were dug from the sediment and put in company with a 7,-inch rainbow trout, Salmo ga-irdneri,for a 10-day period. None of the lampreys fedupon or attempted to feed upon the trout. ByMarch 13 all transforming or transformed sealampreys kept in the trough had emerged from thebottom sediment and were clinging to the headend of the trough. A 7.8-inch brook trout"SalveUnus jonti'nalis, placed in the trough on thatday, was immediately attacked by two of the lampreys. Later examination proved they had beEmfeeding.
Measurements and weights of marked transforming sea lampreys kept in hatchery troughsunder conditions corresponding to those deseribedin the preceding paragraph provided informationon changes in length and weight during transformation. Of 14 transforming specimens installed on August 24, 1951, and reweighed and remeasured on March 13, 1952, all lost weight (table39). The individual losses ranged from 0.011 to0.026 ounce, an average 0.019 ounce. Length,however, increased in 13 (the length of one specimen did not ehange). Increases in length rangedfrom 0.09 to 0.51 inch and averaged (for all 14)0.28 inch.
Transforming sea lampreys in Cayuga Inletwere commonly found in bottom sediments composed of gravel one-fourth to three-fourth inch indiameter. Smaller ammocoetes, as has beenshown, usually inhabit sediments of sand and siltwhere the particle size is much smaller.
The capture of transforming and large-sizedammocoetes in the very headwaters of CayugaInlet, in the vicinity of West Danby (fig. 10, section K), indicates that no important downstreammovement takes place during the larval period in
0.47 • __1.46 0.992.36 .903.23 .874.21 .985.00 .795.59 .69
I 5.39 (-.20)
July and August
Length Incre(Inches) ment or
length
August
g~ "-"0:00'4.21 .984.80 .595.51 .71
15.51 0
Length Incre·(Inches) ment of
length
0.991.18.90.67.79.59.51
July
0.471.462.643.544.215.005.696.10
Length Incre·(Inchcs) ment of
length
I Transforming sea lampreys.
Age group
0••••• _•• _._1. •••• _•... _11. ••. ._.111. ••• __IV.••• _V ••••• _Vr..._. _VII•• __ • _
duration of larval life which have been made werenothing more than subjective estimates based onrelatively small samples. Moreover, prior to 1950zoologists were unable to identify ammocoetes ofthe several species of lampreys. In view of themethods employed in the present investigation,and the consistency of the results, the findingspresented herein are believed to be reliable.
Growth of sea lamprey ammocoetes was suchthat the annual increqlent i~ body length decreased with age, whereas the annual increment inbody weight increased with age (table 38). Theyearly increase in body length during the first 2years of life was approximately 1 inch. Then,from the second year until time of transformationat the age of 7 years, the annual increase in lengthdeclined steadily. During the seventh year of life(age group VI) the length increment was approximately one-half inch. A loss in length of nearlyone-half inch took place during the initial stagesof transformation.

602 FISHERY BULLETIN OF THE FISH AND WILDLIFE SE·RVIeE
PARASITIC HABITS
Sea Lamprey Parasitism on Lake Trout in Cayuga and. Seneca Lakes
TABLE 3g.-Length and weight oj transforming Ilea lampreysmeasured Aug. 24, 1951, a'nd Mar. 13, 1952
[The lampreys were marked Individua.lly]
5.00. ______ •___ •• 5.51 +0.51 0.123. ____ •• _,_ 0.112 -0.0115.20. ___ ••• __ ._ •• 5.28 +.09 0.127•• ____ •___ .105 -.0225.28. __ •__ •• _•••• 5.51 +.24 0.155•• _••.• ___ .135 -.0195.35_ •• __ ••• _. __ • 5.79 +.43 0.151.. _____ •__ .136 -.0145.39_ •• ___ •• _._._ 5.67 +.28 0.152••• _______ .128 -.0245.43 ___ •• _._. ____ 5.43 0 0.142__ •_______ .124 -.0185.47 __ •• ______ ._. 5.67 +.20 0.15L._______ .133 -.0185.67 __ • ______ ._ •• 5.75 +.09 0.172__ •_______ .146 -.0265.79__ ••• _______ • 6.02 +.24 0.167__________ .153 -.0145.79_____________ 6.14 +.35 0.172______ •• __ .152 -.0205.79__ ••• ___ ••••• 6.22 +.43 0.207_. ________ .186 -.0226.02_ •• _______ • __ 6.26 +.24 0.204 __________ .183 -.0206.10__ ••• _____ ._. 6.42 +.31 0.215__ • _____ .• .195 -.0206.22._._. ________ 6.69 +.47 0.209__________ .187 -.022------ ------Mean•• _______ --------_. +.28 Mean. _____ •
--------~--.019
Lake. According to Surface, more than· 90 percent of the brown bullheads, [ctalurus [Ameiu7Us]nebulosus, nearly 80 percent of the white suckers,Oatostomus commersoni, and nearly all the laketrout, Salvelinus [Cristivomel'] namayc·ush; had suffered attacks by the sea lamprey.
Three decades later, Gage (1928) calculatedthat approximately 3 pounds of fish blood werenecessary to· feed one lamprey from youth tomaturity. In his. aquari:um studies, Gage alsofound that most fish of relatively large size survived the lamprey's attack; small ones succumbed.
In 1949, Webster 7 placed rainbow trout, smallmouth bass, and white suckers, all 18 inches or lessin length, in aquariums with nearly full-grown sealampreys. One attack by a large (9 to 17 inches)lamprey was usually suffic.ient to cause death tofish of all three species.
More dminous evidence of the sea lamprey'sdevastating capabilities comes from -the GreatLakes. Commercial lake trout eatches declineddisastrously in both Lake Huron and Lake Miehigan during the years of tremendous inerease in thesea lamprey population (Hile, 1949; Hile, Eschmeyer, and Lunger, 1951).
Royce (1950) compared t.he body weights of laketrout from Seneea Lake in which the species hadsuffered varying degrees of lamprey parasitism.He found no statistical differences in weight related to lamprey parasitism. The lake troutstudied by Royce were relatively large, 22 ·to 33inehes long.
Information for the present study .on the lamprey's effect on the lake trout in Cayuga Lake wasgathered during 1949-51 activities of the New YorkState Conservation Department, Finger Lakes invest.igations,8 whieh included the capture of la~e
trout from Cayuga Lake each summer and fall.Th~ trout were taken by means of experimentalgill nets with mesh sizes that ranged from 1 to 6inches, extension measure. L~ke trout 5 to 31inches in fork length were caught. Nets. were setduring the afternoon and lifted the followingmorning. Possibly the congregation of lake troutcaught in the net.s attracted the sea lamprey .tothem in unnatural numbers, and, of course, t.helake' trout were helpless to eseape .attac~; . Be-
I Mortality caused by lamprey eels in aquarium experiments. Unpub·llshed research memorandum, Department of ·Conser\"aUon. Cornell Uni·versity, January 17, 1949.4 pages. .
• Data from the ~'inger Lakes invi>stigations are published with permissionfrom Dr. D. A. Webster.
Weight (ounces)
Aug. 24, 1951 ·Mar. 13, Differ·1952 ence
Mar. 13, Differ·1952 ence
--:...--1-----1---
Length (Inches)
Aug. 24, 1951
The direct estimation of possible harmful effectsof the sea lamprey upon populations of lake troutis made difficult by the deepwater habitat of bothlampreys and trout. Biologists have long recognized the sea lamprey as a dangerous predator onfood and game fishes. Half a century ago Surface(1898) made the statement, ,,* * * we have nodoubt that in this region [Finger Lakes] the lampreys destroy more fish than do all the other enemies of fish or all of the fishermen combined."
He based this statement on the frequency oflamprey scars and wounds on fish from Cayuga
Six transforming sea lampreys captured inCayuga Inlet during August 1951 were examinedfor food content. None of the digestive tractscontained food; in fact, they were almost withouta lumen. That newly .transformed sea lampreyscan endure long periods without food was indicated by the survival of two specimens in ahatchery raceway from August until the followingMay, a 9-month period.
that .portion of the stream. Since the stream issmall in that area, roughly 2 to 6 feet wide andwit.h a flow of 1 to 5 cubic feet per second, it isdoubtful whether floods are severe enough to washout the ammocoetes and force them downstream.In the middle and lower reaches of Cayuga Inlet,severe floods surely must be capable of such action,but data on actual effects of flooding are notavailable.

SEA LAMPREY OF CAYUGA LAKE 603
----1-------------------
TABLE 40.-Mean adjusted weights and rank order ofweight classes of 9 I1roups of lake trout
0____ • ______ 0 27.1 1 1~--------- --.-------
l' 25.6 4 2 ~ ------ -_. ----------2+ 23.7 8 3 25.4 lor 2
1. __________ 0 26.0 3 1~--------- ._._-----~
1 25.2 5 2~--------- --~- ------
2+ 25.1 6 3 25.4 1 01'22+________ , 0 26.8 2 1 -----~--~- ----------
1 25.1 7 2 --- --- --~ ~
2+ 23.7 9 3 25.1 3
The hypothesis that. there was no difference inweight among the scar classes or among the woundsubclasses was tested by an analysis of covariance.The analysis for scars'produced an F value thatwas not significant, thus indicating that the nullhypot.hesis should be accept,ed (t,able 40). Theadjusted weights of the scar classes indicate thatlake trout with the highest incidence of lampreyscars are the thinnest, but, as is shown by the scarclass rank ordei', the trend is not consistent.
Wound ilcl!r elass Scar classrank adJusted rankorder weIght order
. (ounces)
Totalrankorder
Class-----;----1 Adjusted
weightNumber of . NU~ber (ounces)
scars wounds
losses in body weight would result. Furthermore,it was reasoned that any immediate weight losswould be direct:ly correlated with the number oflamprey wounds, and a permanent weight losswould be directly cOITelated with the number oflamprey scars.
Royce (1950) demonstrated that t,hinness wasnot correlated with the number of lamprey attackson relatively large lake trout. The possibility remained, however, that small lake trout mightsuffer adverse effects from lamprey attacks; consequently the present study was restricted' to laketrout ranging from 9 to 22 inches in length.
Lake trout, whose lengths were within the sizerange just mentioned were divided intot.!u,eemajordasses based on the number of scars borne by eachtrout. Each class was subdivided into threeclasses based on the number of wounds borne byeach trout (table 40). The major dasses were asfollows: Trout without lamprey scars; trout withone lamprey scar; and tlout with two or morelamprey scars. Subdasses were: trout withoutlamprey wounds; trout with one lamprey wound;and trout with two or more lamprey wounds.Fifteen lake trou t were taken at random fromeach ca·tegory to provide a total of 135 specimensfor the analysis. .
• The ronversion formula for t.ransforming fork length to total length is:T-Ul82 F-i-0.045. where T equals total length and F equals fork length.Initial study on the recovery and relative survival of flngerling and yearlinglake trout stocked In Cayuga Lake, by William G. Bentley. M.S. thesis,Cornell University. June 1950.
cause of the relatively short time the nets werefishing, it is. believed that the data are not undulybiased by attacks on trout in the nets.
A' total of 1,372 lake trout were examined forlamprey scars and wounds. All were measured,but to minimize injury from handling during warmweather, only about 700 were weighed. Forklength 9 was measured to the nearest 0.1 inch andweight was measured on a ChatiUon spring balanceto the nearest ounce.
In this discussion, a wound is any place of lamprey attachment where the skin has been perforated and has not healed. Hemorrhaged bloodvessels and inflamed tissues produce a red appear·ance.. A scar is a wound that has healed. Thelacerated tissues have coalesced. and the redcoloration. has disappeared. The condition ofmarks· was rarely such as to make the classification(s~ar or wound) questionable.. That initial healing may take place within a few days was indicatedby' observations on brook trout held in hatcherytroughs.
Loss of body weillht resulting from sea lamprey. attacks . .
Before analysis to detect and measure possibleeffects of sea lamprey aUacks on the weight of laketrout could be undertaken, it was necessary todetermine' whether or not the length-weight relation differed between t,he sexes or from year to year.For this purpose 19 unscarred males and 19 unscarred females were selected at random fromeach of the collections made in 1949, 1950, and1951. The analysis of covariance (after transformation of lengths and weights to logarithms toassure approximately linear regression) disdosedno significant differences among the severalgroups. Data for the sexes and the differentyears of capture could accordingly be combined inall further analyses.
Relation betw~en body weight and '1J,1l-mber of scarsand wou?:I-ds.-Death is not inevitable to all laketrout that are attacked by a sea lamprey. Thenumerous trout that possess scars or wounds resulting from sea lamprey attacks offer proof.However, trout which have survived an attackmayor may'not have suffered a setback in growth.From the lc;>ss of blood alone it seemed likely that
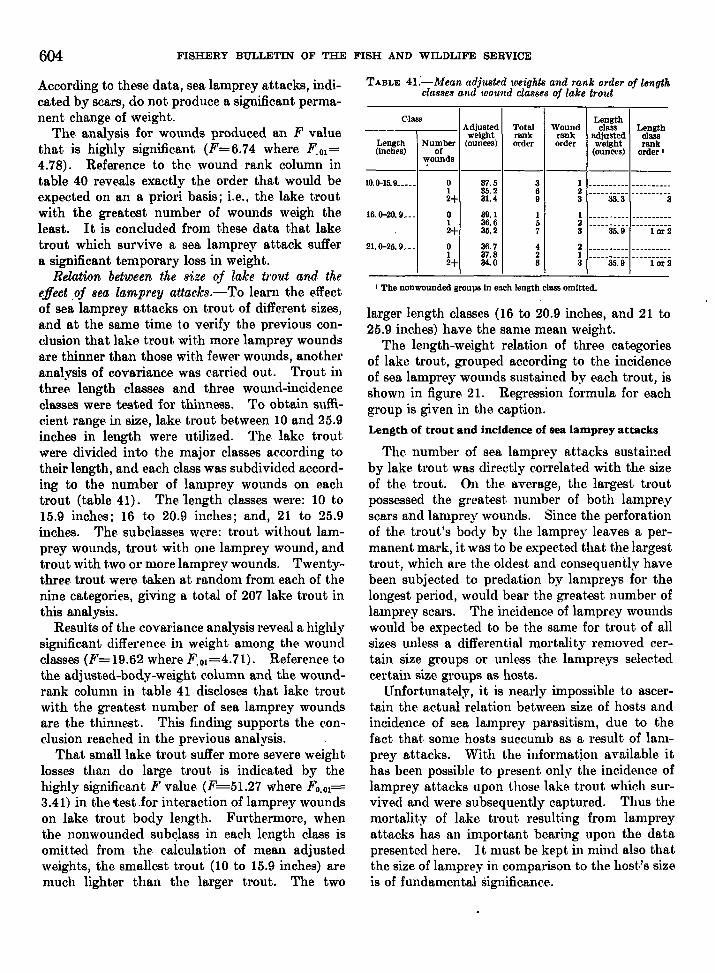
604 FISHERY BULLETIN OF THE FISH AND WILDLIFE SERVICE
TABLE 4l:-Mean adjusted weights and rank order oj lengthclasses and wound classes of lake trout
10.0-15.9_____ 0 37.5 3 1 ---------- ----------1 35.2 6 22+ 31. 4 9 3 33.3 3
16.0-20.9___ 0 39.1 1 1 ----- ----- -..._-----1 36.6 5 2 ---------- ----------2+ 35.2 7 3 35.9 lor 2
21. 0-25. 9. __ 0 36.7 4 2 ---------- -..._-----1 37.8 2 1 ----.----- ~ - --------2+ 34.0 8 3 35.9 lor 2
larger length classes (16 to 20.9 inches, and 21 to25.9 inches) have the same mean weight.
The length-weight relation of three categoriesof lake trout, grouped according to the incidenceof sea lamprey wounds sustained by each trout, isshown in figure 21. Regression formula for eachgroup is given in the caption.
Length of trout and incidence of sea lamprey attacks
The number of sea lamprey attacks sustainedby lake trout was directly cOITelated with the sizeof the trout. OIl the average, the largest troutpossessed the greatest number of both lampreyscars and lamprey wounds. Since the perforationof the trout's body by the lamprey leaves a permanent mark, it was to be expected that the largesttrout, which are the oldest and consequently havebeen subjec.ted to predation by lampreys for thelongest period, would bear the great,est number oflamprey scars. The incidence of lamprey woundswould be expected to be the same for trout of allsizes unless a differential mortalit,y removed certain size groups or unless the lampreys selectedcertain size groups as hosts.
Unfortunately, it is nearly impossible to ascertain the actual relation between size of hosts andincidence of sea lamprey parasitism, due to thefact that some hosts succumb as a result of lamprey attacks. With the information available ithas been possible to present only the incidence oflamprey attacks upon those lake trout which survived and were subsequently captured. Thus themortalit.y of lake trout. result.ing from lampreyattacks has an important. bearing upon the datapresented here. It must. be kept in mind also thatthe size of lamprey in comparison t.o the host!s sizeis of fundamental significance.
I The nonwounded groups In pach length class omitted.
Lpngl;hclassrank
order I
Lpngthclass
adjustedweight
(ounl'es)
Woundrankordpr
Totalrankorder
Class
Lpngth(Inchps)
_____._-,-- AdjustedwPlght
Number (ounces)or
wounds
According to these data, sea lamprey attacks, indicated by scars, do not produce a significant permanent change of weight.
The analysis for wounds produced an F valuethat is highly significant (F=6.74 where F. 01 =4.78). Reference to the wound rank column intable 40 reveals exactly the order that would beexpected on an a priori basis; Le., the lake t,routwith the greatest number of wounds weigh theleast. It is concluded from these data that laketrout which survive a sea lamprey attack suffera significant temporary loss in weight.
Relation between the s1.ze oj lake trout and theeffect oj sea lamprey attacks.-To learn the effectof sea lamprey attacks on trout of different sizes,and at the same time to verify the previous conclusion that lake trout, wit,h more lamprey woundsare thinner than those with fewer wounds, anotheranalysis of covariance was carried out. Trout inthree length classes and three wound-incidenceclasses were tested for thinness. To obtain sufficient range in size, lake trout between 10 and 25.9inches in length were utilized. The lake troutwere divided into the major classes according totheir length, and each class was subdivided according to the number of lamprey wounds on eachtrout (table 41). The 'length classes were: 10 to15.9 inches; 16 to 20.9 inches; and, 21 to 25.9inches. The subclasses were: trout without lamprey wounds, trout with one lamprey wound, andtrout with two or more lamprey wounds. Twentythree trout were taken at random from each of thenine categories, giving a total of 207 lake trout inthis analysis.
Result.s of the covariance analysis reveal a highlysignificant difference in weight among the woundclasses (F=19.62 where F. 01 =4.71). Reference tothe adjusted-body-weight c.olumn and the woundrank column in table 41 discloses that lake troutwith the greatest number of sea lamprey woundsare the thinnest. This finding supports the conelusion reached in the previous analysis.
That small lake trout suffer more severe weight,losses than do large trout is indicated by thehighly significant F value (F 51.27 where Fo.01=3.41) in the test for interaction of lamprey woundson lake trout body length. Furthermore, whenthe nonwounded sub~lass in each length class isomitted from the calculation of mean adjustedweights, the smallest trout (10 to 15.9 inches) aremuch lighter than the larger t,rout. The two

SEA ~PREY OF CAYUGA LAKE
100/
80 //
60 /
50 I /
/40 /
/30 I
I
(/)II
w 20 Iu /z /::::> 15·0 /z /.. It- 10 '1:I: /(,!) 8- Iw3= /
6 /I
'15 1/4
3 ,/0 LAM PREY WOUNDSt/ 1 LAMPREY WOUND2+ LAMPREY WOUNDS
2
1:.r.' II I I I 1
' 6 8 10 II 15. 18 20 25
FORK LENGT H I N INC HES
605
FIGURE 21.-Length-weight relation of 132 lake trout from Cayuga Lake, separated into 3 groups according to the numberof sea lamprey wounds sustained by each trout. Regression formulas: unwounded trout (solid line), log W = 1.5557 +3.169 log L; trout with one lamprey wound (broken line), log W= 1.5765+3.1057 log L; trout with two or more lamprey wounds (dashed line), log W=1.5325+3.1432 log L.
498325 0-59--4
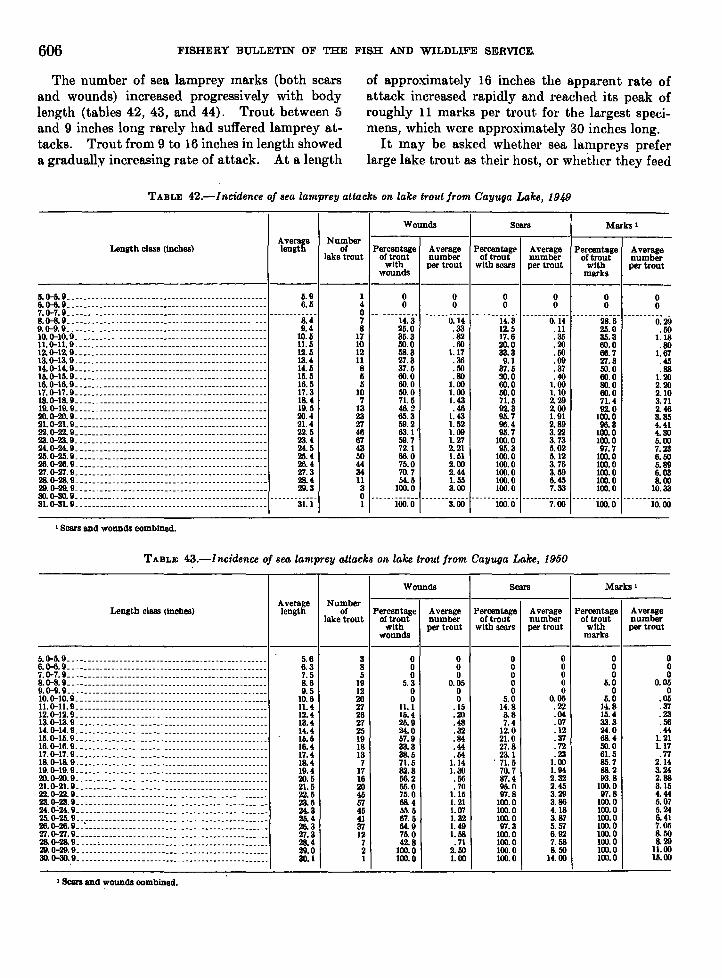
606 FISHERY BULLETIN OF THE FISH AND WILDLIFE SERVICE,
The number of sea lamprey marks (both scarsand wounds) increased progressively with bodylength (tables 42, 43, and 44). Trout between 5and 9 inches long rarely had suffered lamprey attacks. Trout from 9 to 16 inches in length showeda gradually increasing rate of attack. At a length
of approximately 16 inches the apparent rate ofattack increased rapidly and reached its peak ofroughly 11 marks per trout, for the largest specimens, which were approximately 30 inches long.
It may be asked whether sea lampreys preferlarge lake trout as their host, or whe'ther they feed
TABLE 42.-Incidence oj sea lamprey attack~ on lake trout jrom Cayuga Lake, 1949
Wounds Scars Marks I
Length class (Inches)Averagelength
Numberof Percentage
lake trout of troutwith
wounds
Averagenumberper trout
Percentageof trout
with sears
Averagenumberper trout
Percentageof trout
withmarks
Averagenumberper trout
II. CHi. 9 . . .___ _ 5.9 I6.lHI. 9 • • • . __ ___ 6.5 47.0-7.9 . . • • . . . __ ___ ___ 08.0-8.9 .. • • . ____ _ 8. 4 79.0-9.9 . . ._ 9.4 810.0-10.9 . . • __ ___ _________ ___ ______ __ 10.5 1711.0-11.9 • . ._ ___ 11.5 1012.0-12.9__ • • __ ___ _____ _ ______ ___ 12.5 1213.0-13.9__ • . _. • ._ ___ 13.4 1114.0-14.9__ . • __ • ._ ______ ____ ____ 14.6 815.0-15.9 __ . . . . . • 15.5 I;16.0-16.9 __ • • . __ __ __ ___ 16.5 517.0-17.9__ • • ._ __ __ _____ ___________ ____ ____ 17.3 1018.0-18.9 . . ._ ______ __ ___ 18.4 719.0-19.9_. . __ __________ ______ _ 19.5 1320.0-20.9 __ • . ._ __ ____ _______ __ _____ _ 20.4 2321.0-21.9 • • . _ 21. 4 2722.0-22.9_ _ ___ ___ __ ___ __ _________ ________ _ _ 22.5 4623.0-23.9 • • ._ ______________ ____ 23.4 6724.0-24.9. _. • _. . . __ ____ 24.5 4325.0-25.9 __ . • . __ __________ ____ 25.4 5026.0-26.9 __ • .. • • . __ _ 26.4 4427.0-27.9 __ • . • ._ . __ • ._ _ _ 27.3 3426.0-28. 9 __ • . .• • . _. _ 28. 4 1129.0-29.9__ • . • . ____ _ 29.3 330.0-30.9 . . _. .. ._ _ 031.0-31.9 • • 31.1 I
I Scars and wounds combined.
0 0 0 0 0 00 0 0 0 0 0
---------- .. ------------ --_. ------ _. -- --- ---- --- ------ ------ ---------~ - -14.3 0.14 14.3 0.14 28.6 0.2925.0 .33 12.5 .11 25.0 .5035.3 .82 17.6 .35 35.3 1.1850.0 .60 20.0 .20 60.0 .8058.3 1.17 33.3 .50 66.7 1.6727.3 .36 9.1 .09 27.3 .4537.5 .50 37.5 .37 50.0 .8860.0 .80 20.0 .40 60.0 1.2060.0 1.00 60.0 1.00 80.0 2.2050.0 1.00 50.0 1.10 60.0 2.1071. 5 1.43 71.5 2.29 71.4 3.7146. 2 .46 92.3 2.00 92.0 2.4665.3 1.43 95.7 1.91 100.0 3.3559.2 I. 52 96.4 2.89 96.3 4.4163. I ' 1.09 95.7 3.22 100.0 4.3059.7 1. 27 100.0 3.73 100.0 5.0072. I 2.21 95.3 5.02 97.7 7.2366.0 I. 51 100.0 5.12 100.0 6.5075.0 2.00 100.0 3. 76 100.0 5.8970.7 2.44 100.0 3.59 100.0 6.0354.5 1.55 100.0 6.45 100.0 8.00
100.0 3.00 100.0 7.33 100.0 10.33.-.. _. ------ -- ------- --- ----._------ ------------ ------- --_.- -... --------
100.0 3.00 100.0 7.00 100.0 10.00
TABLE 43.-Incidence oj sea lamprey attacks on lake trout jrom Cayuga Lake, 1950
Wounds Scars Marks!
Length class (Inches)Averagelength
Numberof Percentage
lake trout of troutwith
wounds
Averagenumberper trout
Percentageof trout
with scars
AverageDumberper trout
Percentageof trout
withmarks
Averagenumberper trout
5.0-5.9 . • . . .6.lHI. 9 . . • . _7.0-7.9 . _. . . • . . _8. o-s. 9 • . . . _9.0-9.9 __ . _. . • ._. . _10.0-10.9 __ . . . . . _11.0-11.9 . . • _12.0-12.9 . • . . . • _13.0-13.9 __ . . . . ._14.0-14.9 . . _. • _15.0-15.9__ • . . _16.0-16.9 . • ._17.0-17.9__ . _• • . . _18.0-18.9__ . . . _. • _. ._19.0-19.9 __ • . • _. _._. . __20.0-20.9 . _. . . _. _21.0-21.9 . . . . _22.0-22.9 __ . . . .23.0-23.9 __ . . . • . _24. ~24. 9 . . • . __25. 0-25. 9. . . . . . __26.0-26.9 __• . . . • _. • •27.0-27.9 • . • _28.0-28. 9 : __ . _. _. . . ._. • . __29.0-29.9_.• • ._. __ . • . _. _. _. _30.0-30.9 . . ... . .
I Scars and wounds combined.
5.66.37.58.69.5
10.611.412.413.414.415.516.417.418.419.420.521.522.523.524.325.426.327.328.429.030.1
385
191220272627251918137
17162045574541371272I
ooo
5.3oo
11.115.425.924.057.933.338.571.582.356.255.075.068.455.567.564.975.042.8
100.0100.0
ooo
0.05oo
.15
.20
.48,32.84.44.54
1.141.30.56.70
1.15I. 211.071.321.491.58.71
2.501.00
ooooo
5.014.83.87.4
12.021.027.823. I
. 71.570.787.495.097.8
100.0100.0100.097.3
100.0100.0100.0100.0
ooooo
0.05.22.04.07.12.37.72.23
1.001.942.322.453.293.864.183. 875.576.927.588.50
14.00
ooo
5.0o
5.014.815.433.324.068.450.061.585.788.293.8
100.097.8
100.0100.0100.0100.0100.0100.0100.0100.0
ooo
0.05o
.05
.37
.23
.56
.441.211.17.77
2.143.242.883.154.445.075.246. 417.058.508.29
11.0015.00

SEA LAMPREY OF CAYUGA LAKE
TABLE 44.-Inc-idence of sea lamprey attacks 011 lake trout fr01ll Cayuga Lake, 1951
607
Wounds Scars Marks I
Length class (inches)Averagelength
Number01 PerCf>.ntage
lake trout of troutwith
wounds
Averagenumberper trout
PerCf>ntageof trout
with scars
Averagenumberper trout
Percentageof trout
withmarks
Averagenumberper trout
------------------11----'-----1----1----1-----1----- ---------5.0-5.9__________________________________________________ 5.5 2 0 0 0 0 0 06.0-6.9__________________________________________________ 6.5 2 0 0 0 0 0 07.0-7.9 -- _8.0-8.9_________________________________________________ 8.5 6 0 0 0 0 0 09.0-9.9__________________________________________________ 9.4 4 0 0 0 0 0 010.0-10.9________________________________________________ 10.6 7 0 0 0 0 0 011.0-11.9________________________________________________ 11.3 16 6.3 0.06 0 0 6.3 0.0612.0-12.9________________________________________________ 12.5 15 13.3 .20 6.7 0.07 20.0 .2713.0-13.9________________________________________________ 13.4 10 10.0 .10 30.0 .50 40.0 .6014.0-14.9________________________________________________ 14.5 22 13.6 .18 4.5 .05 18.2 .2315.0-15.9________________________________________________ 15.5 9 22.2 .22 11.1 .11 33.3 .3316.0-16.9________________________________________________ 16.4 12 58.3 .58 16.6 .25 58.3 .8317.0-17.9________________________________________________ 17.4 4 0 0 50.0 .75 50.0 .7518.0-18.9________________________________________________ 18.4 7 28.5 .29 57.2 86 57.1 1.1419.0-19.9________________________________________________ 19.5 14 71.4 1.00 57.2 i.OO 92.9 2.0020.0-20.9________________________________________________ 20.6 14 42.8 .50 78.5 •. 71 78.6 2.2121.0-21.9________________________________________________ 21.4 24 50.0 .67 79.3 ::.00 91.7 2.6722.0-22.9________________________________________________ 22.5 30 30.0 .40 8Ii_7 a.33 90.0 3.7323.0-23.9________________________________________________ 23.4 41 39.0 .63 100', ~.51 100.0 4.1524.0-24.9_ 24.5 52 57.7 .86 9F..l! ~. 49 \18.1 5.2525.0-25.9________________________________________________ 25.4 25 52.0 .72 9".0 .S.2O 100.0 5.9226.0-26.9________________________________________________ 26.2 20 50.0 1.05 100.0 5.95 100.0 7.00'27.0-27.9________________________________________________ 27.3 8 62.5 1.63 100.0 '\.38 100.0 8.0028.0-28.9________________________________________________ 28.3 2 50.0 1.00 100.0 1O..'iO 100.0 11.5029.0-29.9________________________________________________ 29.3 I 0 0 100.0 ".00 100.0 6.00
I Scars and woundJ combined.
at random on any trout they encounter. Since thelargest trout possessed the highest incidence oflamprey attacks, the data presented in the preceding sections suggest preference for large trout.However, if lampreys do prefer large hosts, thepercentage of trout bearing lamprey wounds(scars not considered) would be expected to increase progressively from t,he smallest trout to thelargest.
The percentage of lake trout that possessedlamprey wounds' was calculated separately foreach of the three years 1949-51 (tables 42--44,fig. 22). The few specimens between 14 and 20inches long cause rather wide fluctuations in thepercentages of wounded trout within that range,Because small trout are known to have a considerably higher mortality than large ones, the relation between the size of trout and incidence ofattacks is probably most unreliable for the smallspecimens. Since the inflections of the line fittedto the data in figure 22 were a critical part of this·relation, especially that portion pertaining to thelarge trout, it was necessary to employ statisticalmethods rigorous enough to show the less obvioustrends in this regression. A test of the orthogonalpolynomial series (F test) revealed that the thirddegree polyn~mial regression was required (regression formulas are given in the caption of fig.22). .
The percentage of wounded lake trout leveledoff at the greater lengths in 2 of the 3 years, 1950and 1951; in 1949 the percentage continued toincrease. If only the larger lake trout (20 inchesor greater) are considered, it is apparent that verylittle increase in the percentage of wounded troutaccompanies the increased body length. Thelack of a continued increase in the incidence oflamprey wounds on the largest trout suggests thatthere is no selection for size of host, specimens inthis size range. The evidence is not conclusive,but it is definitely known that lampreys prey upontrout 8.2 inches up to the very largest. There issome indication that they do not necessarily preferthe large trou t, at least not over the size rangewhere they may reasonably be expected to survivean attack.
Annual variations in incidence of sea lamprey attacks
Incidence of sea lamprey attacks upon laketrout differed noticeably from year to year, andwas directly correlated with the abundance oflampreys. Yearly differences in the incidence oflamprey wounds were especially noticeably because wounds are inflicted by only one year classof lampreys. During anyone year the rate ofwounding can be expected to reveal annual fluctuations more clearly than scars, which are accumumulated over a period of years. For this reason

ing lamprey wounds are 60, 46, and 38 for theyears 1949-51. Each year the percentage ofwounded trout exhibited a marked decrease; however, the yearly differences in this relation are lesspronounced than are those of the number ofwounds because of the high incidence of parasitismamong the large trout in all years.
The most plausible explanation of the declinein sea lamprey parasitism upon lake trout fromthe high incidence in 1949 to the low in 1951 isthat it resulted primarily from the decline inabundance of lampreys. This view is supportedby the data in table 45 in which are listed theestimated numbers of sea lampreys, mean numbers of lamprey wounds per lake trout, and minimum lengths of lake trout bearing lamprey woundsfor each year from 1949 through 1951.
Since the number of lampreys varied widelyfrom one year to another, it is reasonable to assume that the ratio of lampreys to lake trout wasprincipally dependent on the fluctuation in lamprey abundance. An estimate of the number ofsea lampreys in the lake during a particular yearcan be determined from the number of spawningmigrants. Except for a brief period in earlyspring, only one year class of parasitic-phase sealampreys is present in the lake. Their abundancecan be closely estimated by determining the number of migrants that enter Cayuga Inlet for spawning the following spring. Thus, the number ofsea lampreys in Cayuga Lake during 1950 and1951 was determined from the number of sea lampreys in the spawning migration in 1951 and 1952,respectively.
All three measures of lamprey parasitism indicate more intensive feeding in years when lampreys were most abundant, and less feeding whenlampreys were fewer. As shown in table 45, theaverage number of lamprey wounds per troutdecreased as the number of lampreys decreased.Also, the percentage of lake trout bearing sealamprey wounds decreased as the number of lampreys decreased. The small size of the shortesttrout bearing lamprey wounds when lampreyswere most numerous further indicates more intensive feeding when lampreys are abundant.
Incidence of Sea Lamprey Parasitism'in Various Partsof Cayuga Lake
Lake trout. taken in July and August 1949-51from five sections of Cayuga Lake differed consid-
1949
1950
1951
~.
FISHERY BULLETIN OF THE FISH AND WILDLIFE SERVICE.
13 15 .7 19 2' 23 25 27 29
13 15 17 19 21 23 25 27 29
FORK LENGTH IN INCHES
FIGURE 22.-Regressions of t.he percentage of lake troutpossessing sea lamprey wounds on body length of laketrout for 1949, 1950, and 1951. Regression formulas:1949, Y=88.7628+18.8330 X-0.8337 '\'+0.0132 X 3 ;
1950, y= 28.7041-11.1589 X+1.1443 X2 -O.0252 .\'3;1951, Y=16.2757-6.3353 X+0.6322 .\"2-0.0128 .P.
further discussion is based entirely on the wounds,except to mention that annual variations in attacks on trout are evident also in the incidence ofscarrmg.
Annual differences in the rate of lamprey parasitism show most clearly in the average numberof lamprey wounds borne by lake trout. Thevalues listed in column 5 of tables 42, 43, and 44have been smoothed by a moving average of 3and plotted in figure 23. It is readily apparentthat the average number of wounds per trout decreased steadily during the period 1949-51.Trout of almost all sizes showed t4is trend.
AilOther measure of the intensity of lampreypa~asitism iB' the 'percentage. of lake trout possessing lamprey wounds (column 4 in tables 42, 43,and 44; fig. 22). The percentages of trout bear-
608
805 7 9 II
70
60Ul<>z 50::::>0 40~
>-'" 300:Q.::ll 20
'"..J'0'"'"Ul
" 80zUlUl 70'"UlUl 600Q.
... 50::::>0 400:...'" 30
'"'" 20..JU.0 '0
'""'"...z7l'"u
0: 60
'"Q.
50
40
30
20
10.
5 7 9
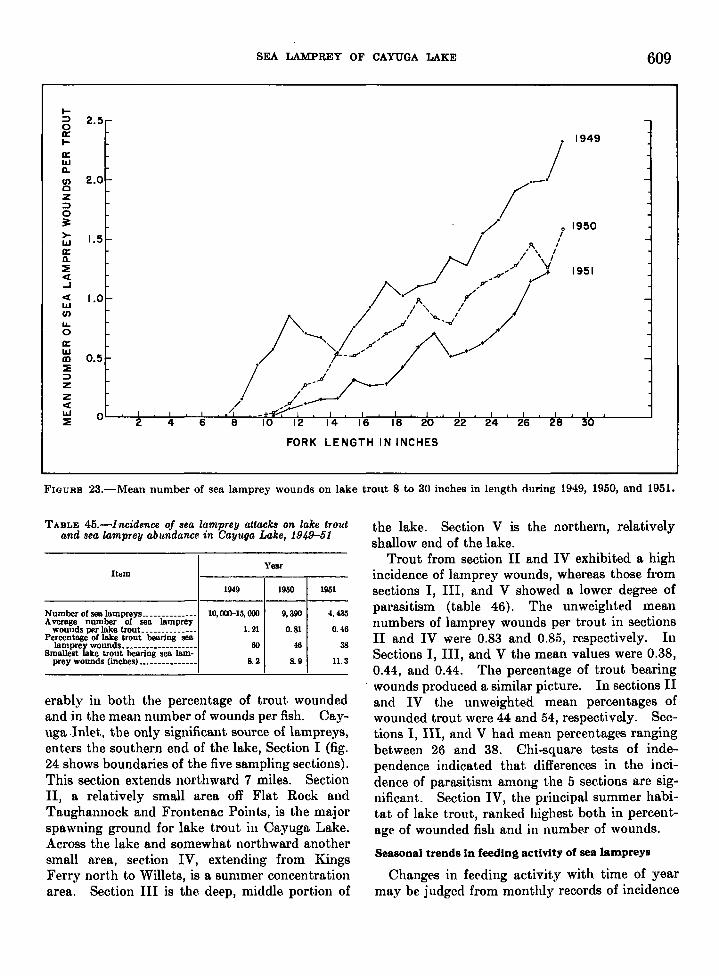
SEA LAMPREY OF CAYUGA LAKE 609
I-~ 2.5-0a: 1949l-
i/a:wn.II) 2.01- -CZ;:)
0~ / . 1950>- I1.51-
/ I
-W,1\ /a:
/ /\1n.:::!!: 1951« -",,' .,-/+..J r /~ /« 1.01- . , -w • ,1\, I
II)
/" / j '''---/ /LL0
______ / ,a' /\ /a:
- ;---//.--w0.5m -
:::!!:;:) / /'-J+-Zz« / *.--W 0 /. ....-sr.':::!!: 2 4 6 8 10 12 14 16 18 20 22 24 26 28 30
FORK LENGTH IN INCHES
FIGURE 23.-Mean number of sea lamprey wounds on lake trout 8 to 30 inches in length during 1949, 1950, and 1951.
TABLE 45.-Incidence of 8ea lam~rey attack8 on lake troutand 8ea lamprey abundance in Cayuga Lake, 1949-51
YearItom
1949 1950 1951
---Number or sea lampreys ______________ 10, 000-15, 000 9,390 4.435Average number or sea lamprey
wounds per lake trout ______________ 1. 21 0.81 0.46PercentBgc or lake trout bearing sea
38lamprey wounds... ___ •____________ 60 46Smallest lake trout bearing sea lam-
8.2 8.9 11.3prey wounds (inches)._. ____________
erably in both the percentage of trout woundedand in the mean number of wounds per fish. Cayuga .Inlet, the only significant source of lampreys,enters the southern end of the lake, Section I (fig.24 shows boundaries of the five sampling sections).This section extends northward 7 miles. Sect,ionII, a relatively small area off Flat Rock andTaughannock and Frontenac Points, is the majorspawning ground for lake trout in Cayuga Lake.Across the lake and somewhat northward anothersmall area, section IV, extending from KingsFerry north to Willets, is a summer concentrationarea. Section III is the deep, middle portion of
the lake. Section V is the northern, relativelyshallow end of the lake.
Trout from section II and IV exhibited a highincidence of lamprey wounds, whereas those fromsections I, III, and V showed a lower degree ofparasitism (table 46). The unweighted meannumbers of lamprey wounds per trout in sectionsII and IV were 0.83 and 0.85, respectively. InSections I, III, and V the mean values were 0.38,0.44, and 0.44. The percentage of trout bearing
. wounds produced a similar picture. In sections IIand IV the unweighted mean percentages ofwounded trout were 44 and 54, respectively. Sections I, III, and V had mean percentages rangingbetween 26 and 38. Chi-square tests of independence indicated that differences in the incidence of parasitism among the 5 sections are significant. Section IV, the principal summer habitat of lake trout, ranked highest both in percentage of wounded fish and in number of wounds.
Seasonal trends in feedina activity of sea lampreys
Changes in feeding activity with time of yearmay be judged from monthly records of incidence

610 FISHERY BULLETIN OF THE FISH AND WILDLIFE SERVICE
FIGURE 24.-Cayuga Lake and its major tributaries showing the five sampling sections of the lake. (Modifiedfrom Galligan, 1950; footnote 10.)
N
5 MILES
TR I BUTARI ES
A SAWYER CREEK
B SALMON CREEK·
C FALL CREEK
D CASCADI LLA CREEK
E SIXMILE CREEK
F CAYUGA INLET
G TAUGHANNOCK CREEK
H CANOGA CREEK
KINGS FERRY
o
E
F
TABLE 46.-lncidence oj sea lamprey wounds on lake troutJrom 5 sections oj Cayuga Lake
[Boundarlcs of sections are shown in fig. 24)
Number Percent- MeanLength Number of trout age of number
Section of lakp (inches) of trout with trout ofwounds with wounds
wounds per trout----------------
L .••••.••........• 7.0-12.9 16 3 19 0.1913.0-19.9 7 5 71 .7120.0-30.9 12 3 25 .25
----------Total or mean••• ... _---.------- 35 11 38 .38---------
IL.............••. 7.0-12.9 17 4 24 .5913.0-19.9 22 12 55 .9620.0-30.9 19 10 53 .95
---------Total or mean._. ----_ .. ------- 58 26 44 .83---------
IlL •......••.. __ •. 7.0-12.9 45 6 11 .1613.0-19.9 M 18 33 .4120.0-30.9 12 8 67 .75
---------Total or mean ... ------------.- III 32 37 .44
---------IV................ 7.0-12.9 30 12 40 .67
13.0-19.9 56 33 59 .8020.0-30.9 142 90 63 1.90
---------Total or mean .._ ------------ .. 228 135 M .85
---------V................. 7.0-12.9 11 1 9 .09
13.0-19.9 22 4 18 .2320.0-30.9 2 1 50 1.00---------
Total or mean ... -------------- 35 6 26 .44
A chi-square test of independence for the 5 monthsgave a value corresponding to p=0.03. It is to beconcluded that monthly variations in the percentage of wounded lake trout in the 20- to 31-inchsize group are significant.
TABLE 47.-lncidence oj sea lamprey wounds ~n lake troutduring July-November
[All trout were 20.0 to 30.9 inches long.Bee fig. 24 for location of sections II and IV)
o6
6053
Lake trout in the 13- to 19-inch length groupresembled t.hose of the 20- t.o 31-inch group inshowing highest. incidence of lamprey attacksduring August and September.
The percentages of wounded lake trout in the7- to 12-ineh length group during July and Augustwere 22 and 23 percent, respectively. None, however, of the small number of speeimens in this sizegroup captured during September, October, andNovember possessed a lamprey wound. Since thelampreys have more than doubled in length and
Section Number Average Percent·of Number of number age of
Month of capture Cayuga of trout wounded of troutLake trout wounds with
wounds------------------ -July....•.• _........ __ . IV 76 43 1. 07 57August............. __ . IV 66 47 1. 12 7Sepwmbcr ___ ......... II 177 117 I. 72 6October.•. _......... _. II 366 218 1. 25November. _........ __ II 55 29 1. 05
II The distrlhutlon of lake trout and associated species In Cayuga Lake.by James P. Galligan. M.B. thesis, Cornell University, September 1951.
of lamprey wounds (table 47). To reduce biasarising from size differences, only large trout (between 20 and 31 inches long) were employed in thepreparation of the table. As a further precautionthe data are given only for lake trout from sectionsII and IV of Cayuga Lake to avoid bias from·locality differences. Lake trout in these twoareas are believed to form a single population.According to Galligan,IO large trout gather insection IV during the summer and migrate to section II in the fall for spawning.
Feeding activity appeared to have reached apeak during August and September. A decline infeeding started in September and continuedthrough October and November. In July thefeeding activity was considerably less than maximum and was on a level with that for November.

SEA LAMPREY OF CAYUGA LAKE 611
685
Location of attachment on the fish's body
Sea lampreys attach themselves most frequentlyto certain particular areas on their hosts' bodies.By recording the location of each lamprey scar andwound, according to the plan indicated in figure25, the concentration of attachment in variousbody areas was determined. Fish for this analysiswere 103 lake trout taken by gill nets in SenecaLake on October 12 and 17,1950. The percentageof scars was by far the highest (45 percent) in thepectoral region, section B (table 49). Next inorder of scarring incidence were: prepelvic region(26 percent), section C; pelvic region (23 percent),section D; head region (5 percent), section A; and,caudal region (l percent), section E. Only 10scars and 2 wounds of the total number of attacks(310) were above the lateral line. Lennon (1954)reported a similar distribution of lamprey attachments on brook, brown, and rainbow trout fromLake Huron.
Wounds were distributed over the body muchthe same as scars. The principal difference lay inthe greater incidence of wounds in the head andpectoral regions (chi-square test of independence
Trout with Trout withlamprey Average lamprey Averagewounds number scars numberLake of ------- of
Num· Per· wounds Num· Per· scarsbet centage ber centage-----------
Cayuga.____ .• ______ 86 65.7 1.34 130 99.3 4.SeneCB_.__ •• _•. _____ 33 18.2 .28 152 84.0 2.4
TABLE 48.-lncidence of sea lamprey parasitism on lake troutfrom Seneca Lake and Cayuga Lake
[Based on trout caught In gill nets In September and October 1950. Samplesinclude only trout between 21.0 Bnd 31.9 Inches long)
increased in weight more than tenfold by October,..perhaps the lower incidence of predation on smalltrout reflects a shift in the size of host they prefer,or, an attack after September may have been fatalbecause of the lamprey's greater size.
Comparison of sea lamprey parasitism in Seneca andCayuga Lakes
Lake trout in Cayuga Lake suffer a muchhigher iqcidence of sea lamprey parasitism thando lake trout in Seneca Lake. Evidence on thissubject was gathered from both lakes in September and October 1950. Gill-net fishing by NewYork State personnel in Seneca Lake for spawninglake trout provided a total of 181 lake trout forexamination. All trout, were between 21.0 and31.9 inches long. From Cayuga Lake 131 laketrout ranging in length from 21.0 to 30.9 incheswere gill-netted.
The records of lamprey parasitism on these twogroups of fish (table 48) reveal that the percentageof lake trout bearing sea lamprey wounds was only18.2 for Seneca Lake specimens but was 65.7 forCayuga Lake fish. The averag{~ number ofwounds per trout was 0.28 in Seneca Lake and 1.34in Cayuga Lake. Incidence of sea lamprey scarson lake trout was also much higher in Cayuga Lake(4.68 per fish) than in Seneca Lake (2.45 per fish).Since sea lamprey sears persist for many years, thedifference in scarring rate indicates that lampreydepredations on lake trout were the higher inCayuga Lake not only in 1950, but also during several preceding years. It may be inferred that thenumber of lampreys in proportion to the numberof lake trout is three to five times higher in CayugaLake than in Seneca Lake.
A B c D E
FIGURE 25.-0utline of a lake trout showing the 5 body regions for designating thE' locat.ion of sea lampreyattachrllent.

612 FISHERY BULLE'flN OF THE FISH AND WILDLIFE SE,RVleE
TABLE 49.-Location of sea lamprey attachments on laketrout
[The areas of attachment are indicated in flg. 25]
Area of attachmentItem 1'otal
A B C D E
-----------SCARS:'
Number.............. 13 127 71 65 2 278w~~:~~age ...... _.. ,- 5 45 26 23 1 100
Numoor._ ........ _.. _ 7 17 3 4 1 32Percentage........... 22 53 9 13 3 100
yielded a value corresponding to p=0.008). Twoe~planations may be offered for this disparity.FIrst, the superimposition of lamprey attachmentover a previously existing scar .would obliteratethe original scar. Secondly, the mortality maybe higher from wounds in the head and pectoralregion than from wounds in other sections of thebody.
Sea Lamprey Parasitism on the White Sucker
Information on the incidence of sea lampreyattacks on white suckers was obtained by theexamination of spawning-run fish collect~d bymeans of an electric shocker from ButternutCreek, a tributary of Cayuga Inlet, on May 3,1951, and May 6, 1952. Most of these suckersare believed to have been lake-dwelling fish thathad ascended the stream to spawn. Possibly somestream-resident suckers were included.
The data on attacks on white suckers give noindication of difference between 1951 and 1952.White suckers less than 11 inches long bore noscars or wounds in either 1951 (15 fish) or 1952(22 fish). At the greater lengths the percentageof scarred or wounded fish tended to increasewith increase in size, as is brought out clearlyby the following comparison of incidence of att,acksin suckers 11.0-13.9 inches long and in fish 14inehes long or longer.
1951 1952
Forkleri~th Number Number
(ill.C es) Number with Percent- Number with Percent-of fish scarS or age of fish scars or age
wounds wounds----------------------11.0-13.9.. _ 109 21 19 76 17 22>13.9...•.. 49 20 41 47 18 38
This trend toward a greater incidence of sea lamprey attacks among the larger white suckers is the
same as that observed by Hall and Elliott (1954)in Lake Huron.
The eause for the increase in the incidence of sealamprey attacks with increase in the size of whitesuckers is not known. Possibly the smaller fishare less able than larger on~s to survive attack.~gain, mechanical diffieuIt.ies of attachment maygIve the smaller suckers a degree of immunityfrom lamprey predation. .
PARASITES AND PREDATORS OF THELAMPREY
Parasites
. In the one previously published report on paraSItes of the sea lamprey in the Finger Lakes area,Van Cleave and Mueller (1934), who examined 12sea lampreys from Oneida Lake, found trematodelarvae. In more extensive studies, on mature sealampreys from the Oequeoe River and CarpCreek, tributaries of Lake Huron, Applegate(1950) and McLain (1952) reported parasitizationto be rather low, generally less than 20 pereent.Most common internal parasites were acanthocephalans of the genus Echinorhynchus, eestodes(Tl'iaenophorus) , and nematodes (Cmnmallanu.s).Externally, the leeeh Pis'icola milnel'i was occasionally present.
The examination of 25 sexually mature sea lampreys from Cayuga Inlet during 1951 and of 53 in1952 disclosed only one internal parasite, a small(1.5 mm.) acanthocephalan of the family N eoeehinorhynchidae in the intestinal tract of a mediumsized female from the 1952 collection.
No external parasites were evident, at any timeduring the 1950 spawning migration, but an epidemic ofleeehes occurred during the 1951 and 1952migrations. The leech, Pis·icola zebra Moore,1Iis approximately }~-inch long and }i6-inch wide.These leeches usually adhered in clusters to thedorsal and posterior edges of the first andsecond dorsal fins and the tip of the caudal fin.The leeches reached a peak of abundance on May14, 1951, when they were present on 93 perce~tof the. lampreys. At this time it was estimat,edthat most of the infest,ed lampreys carried approximately 50 to 300 leeehes. The onlv visible damage to the lamprey was a slight er~sion of the finmargins where the leeches had been attached.
II Id~ntified by Dr. Marvin C. Meyer, University of Maine.

SEA ~PREY OF CAYUGA LAKE 613
Predators
Numerous mammals and birds, a few reptiles,amphibians., and fishes were cited as predators onthe sea lamprey by Surface (1899). He gave definite evidence of predation on the sea lamprey forthe little green heron, the common water snake,and minnows of the genera Rhinichthys andNotropis. In Michigan, Applegate (1950) reported that walleye, northern pike, brown trout,raccoon, dogs, great blue. heron, and sea gullspreyed on sea lampreys. The sea gull was theonly predator of importance.
Daily excursions along Cayuga Inlet throughout the sea lamprey migratory and spawning season of 1951 and numerous visits during the 1950and 1952 seasons, revealed amazingly little evidence of predation on spawning lampreys. Lampreys are especially vulnerable to predation whilein the shallows of the tributary streams. I t wouldbe easy for almost any of the common predaceousanimals to capture them. Nevertheless, the onlyanimal actually witnessed devouring a sea lampreywas the common water snake, Natrix sipedon.In addition, six partially eaten lamprey c·arcasseswere found along Cayuga Inlet during the threeseasons of study. They appeared to have beenkilled by carnivores.
The ~nly evidence of predation on sea lampreysin Cayuga Lake by fish was an unconfirmed reportby a fisherman that he had found a sea lampreyi~ the stomach of a lake trout. Stomach anal~rsisof hundreds of fish from Cayuga Lake, especiallylake trolit, have not produced a single instance ofpredation on the sea lamprey.
The only important predators on the sea lamprey in Cayuga Inlet are the small minnows thatfeed on the eggs. At the time of egg deposition,groups of these small fish gather just below thedownstream rims of the nests. When the eggsare emitted, they quickly dart into the nest andseize as many eggs as possible before being frightened away by the spawners. Spawning lampreys never make an effort to drive tp.ese intrudersfrom the nest, but the spawning actions seem tofrighten the minnows. On June 4, 1951, thestomachs of six blacknose dace., Rhi-nichthysatratulu8, contained numerous lamprey eggs.
CONTROL METHODS
Interrelationships between the sea lamprey andtheir host species in Cayuga Lake are only par
49&3.25 00-59-----8
tially understood. In Lake Michigan and LakeHuron this parasite is very destructive to food andgame fishes, and the sea lamprey is undoubtedlythe cause of the destruction of many lake troutin Cayuga Lake. Their depredation on this fishin Cayuga Lake is compensated in part by theirusefulness as an extraordinary, primitive creaturefor study by st,udents in neighboring educationalinstitutions. It is the writer's view that a program for reduc.tion of numbers of sea lampreys inCayuga Lake may be desirable, but that a supplyshould be maintained for scientific use.
Trapping operations in Cayuga Inlet have indicated the feasibility of reducing and possiblyeradicating the Cayuga Lake population of sealampreys by capturing spawning-run migrants.Also, the importance of extensive breeding andnursery areas as a factor in the abundance of thesea lamprey suggests the possibility of loweringthe population level by reducing the spawningarea available to them. Three methods of control appear to be practical:
1. Construction of a small barrier dam acrossCayuga Inlet, 3 miles upstream from CayugaLake, would cut off extensive spawning areas.The initial expenditure would amount to severalthousand dollars, but in the long run the damwould be more economical than traps or weirssince a barrier dam requires little or no maintenance. It blocks the migration of sea lampreys,but permits migration of game fishes. A head of1~ to 2 feet should be effective under normal waterconditions. A dam similar in design to the U.S.Geological Survey dam (fig. 11) would be suitable.A better but more expensive structure was described' by Applegate and Smith (1950). An ove~
hanging lip on the downstream side of the dam IS
essential.2. An electromechanical weir and trap, similar
to the one operated on t,he Kewaunee River, Wis.(Applegate, Smith, and Nielson 1952)1 should bethe most efficient. The major disadvantage ofthis method is the expense. The device wouldcost several thousand dollars to purchase andinstall, and operational expenses would amountto several hundred dollars each spring.
3. Construction of a lamprey trap on thedownstream side of the U.S. Geological Surveydam would provide an inexpensive control. Thismethod would limit t,he lamprey to about, 3 milesof spawning territory and bar it from 7 miles of

614 FISHERY BULLETIN OF THE FISH AND WILDLIFE SERVICE
spawning stream above the dam. It is est.imat.edthat. about 75 percent. of the entire spawning runcould be captured. A trap suit.able for this purpose would cost less than $50 and would requireless t.han 50 man-hours annually for maintenanceand operation.
SUMMARY
The recent. invasion of t.he upper Great. Lakesby the !;lea lamprey, and its depredation on t.hefood and game fish have necessit.ated an invest.igation to discover methods of controlling this parasite. One aspect of the program was the presentstudy of a long-established population of the landlocked sea lamprey.
Geological formation of the Great Lakes andt,he ~~inger Lakes of New York State, and the.present distribution of the sea lamprey, lead tothe conclusion that t.he lamprey entered CayugaLake by way of the "Champlain Sea" or theHudson-Champlain estuary and Mohawk outlet.during the latt.er part of the Pleist.ocene period.
Fieldwork was conducted from May 1950 toAugust 1952. Mat.ure lampreys were capt.uredin Cayuga Inlet by a weir, portable traps, and byhand. In all, 9,480 adult. lampreys were captured.Of this number, 1,168 were tagged and 1,773 werefin-clipped and released in Cayuga Lake tributaries. Lake trout were taken by gill net.s fromCayuga and Seneca Lakes. Immature, parasiticphase lampreys were collected by removal of thoseadhering to lake trout taken in gill nets. Digging,seining, and electric shocking were employed forcollecting larval lampreys in Cayuga Inlet.
In 1950, 1951, and 1952 the mean t.ot.allengthsof adult., upstream-migrant lampreys were 15.0,15.3, and 15.9 inches, respect.ively. The annualdifferences in length were significant, but. the differences in length between males and females werenot. Mean weights of upstream-migrant sea lampreys for 1950,1951, and 1952 were 4.97, 4.34, and4.94 ounces, respectively. In 1951, Cayuga Lakesea lampreys were approximately the. same size asthose taken in Carp Creek, a tributary of LakeHuron. This same year the largest landlockedsea lampreys were taken in Seneca Lake, N.Y.Mean length and weight. of parasitic-phase sealampreys captured in Cayuga Lake in Sept.emberand October were 13.7 inches and 3.8 ounces.Mean length and weight of Seneca Lake sea lam-
preys captured during the same months were 15.5inches and 5.3 ounces.
Transformation from the ammocoete to theadult stage began in August" and terminated inMarch. Parasitic feeding began in March andcontinued approximately 14 mont,hs. During theearly t.ransformat.ion stage t.he sea lamprey decreased approximately one-half inch in length.For the following 6 or 7 months, while buried inthe st.ream bottom and in a nonfeeding phase oflife, they increased approximately one-fourth inchin length and at the same time lost about 0.02ounee in weight. After emerging from the bottom and st.art.ing their parasitie phase of life int.he lake, they inereased in length from 5.5 inchesin March t.o 15.4 inches in April-May of the following year. Length-frequency distributions ofspec.imens from both Cayuga and Seneca Lakesprove t.hat lampreys spend only 1 full yenr in t.helake. Essentially only one age group is present.in the lake at anyone time.
The length-weight relat.ion was determinedfrom 1,906 adult lampreys captured in CayugaInlet during April and May 1951.
Body proportions changed wit,h the at.t.ltinmentof maturity. These proportions differed signifieantly bet.ween sexes at one t.ime or anot,her between September-October and the following June,and a majority of these proportions differed mostat spawning time. Teeth, tooth-cusp, and myomere counts of Cayuga Lake specimens andSeneea Lake spec.imens reveal a divergence of thetwo populations at a racial level.
Of eight tributaries available to the lamprey forspawning, Cayuga Inlet was the only one used toany appreciable extent. The sea lampreys usuallyenter Cayuga Inlet during the last 2 weeks ofApril. Sea lampreys t.hat arrived in t.he tributaries for spawning in mid-April spent 4-5 weeksin the stream before initiating nest construction.Activity of lampreys on the spawning migrationwas closely assoc.iated wit,h water t.emperature.
Estimate.s of the number of lampreys in thespawning migrat.ion were: 1950, 10,000-15,000;1951, 9,390; 1952, 4,435. Estimates were basedon marking and recapture.
The rate of upstream travel was about 1 to 2miles per day in the slow-moving portions ofCayuga Inlet. In the swifter, upst.ream area therate of travel decreased to approximately one-
SEA LAMPREY OF CAYUGA LAKID 615
third to 1 mile per day. Upstream movementwas slower during the early part of the migratoryperiod than later. Low dams effectively retardedand sometimes blocked upstream migration ofadult lampreys.
The numbers of males per 100 females in thespawning migrations were: 1950, 157; 1951, 155;1952, 116. The relative abundance of malesvaried directly with the estimated total number oflampreys in the spawning run. Males were predominant among early migrants and femalesamong late arrivals.
Coloration of mature lampreys during thespawning season varied with size, sex, and thetime within the season.
Selection of nesting sites was affected by barriers to upstream migration, current velocities,substrate composition, and nesting densities.Some well-situated and apparently completednests were not used for spawning, whereas otherswere utilized b~y several pairs. In a sample of 137nests, only 43 percent contained lamprey eggs.
A female of average size produces approximately43,000 eggs. Maximum and minimum numberswere: 85,162 for a 20.1-inch, 11.7-ounce lamprey,and 13,974 for a 13.5-inch, 2.6-ounce specimen.
The incubation period was 14 days at an averagewater temperature of 60.7° F.
A pronounced decrease in both length (11 percent for males; 18 percent for females) and weight(9 percent for males; 34 percent for females) tookplace during the spawning period.
Cayuga Lake sea lampreys die within a few daysafter spawning. Only 2.5 percent (238) of theestimated number of lampreys in the 1951 spawning run returned downstream to the weir duringand after the spawning season. All were spentand approximately 80 or 90 percent were dead;the remainder were so debilitated that all werebelieved incapable of recuperating. Tagged ormarked lampreys were not observed in the spawning runs in subsequent years. Although thousands of spent lampreys die in Cayuga Inlet eachspring, few are seen without a thorough search ofthe deep pools.
A larval life of 7 years, including the period ofmetamorphosis, was ascertained from length- andweight-frequency distributions of ammocoetes.Mean lengths and weights in August for agegroups II-VII were: II, 2.24 inches and 0.013ounce; III, 3.23 inches and 0.031 ounce; IV, 4.21
inches and 0.066 ounce; V, 4.80 inches and 0.101ounce; VI, 5.51 inches and. 0.154 ounce; VII, 5.51inches and 0.172 ounce. Weight-frequency distributions produced more definite modes for recognizing age groups than the more commonly employed length-frequency method.
Intensity of lamprey parasitism upon lake troutdiffered substantially from year to year, and wasdireetly correlated wit,h the abundance of lampreys. In Cayuga Lake the percentage of troutbearing lamprey wounds was 60 percent in 1949,46 in 1950, and 38 percent in 1951. Lampreyscars, which are a.ccumulated over the years, hada higher rate of occurrence: 82 percent in 1949,60 in 1950, and 65 in 1951.
Lake trout in Cayuga Lake suffered a loss inweight that was d.irectly related to the number oflamprey attacks and inversely related to the sizeof trout. Size of lamprey as well as of host fish isof great importance in determining damage by thesea lamprey. Also, mortality from lamprey attacks appears to be higher among small fish thanamong large ones. Incidence of lamprey woundson lake trout from Cp.yuga Lake in July andAugust was greater in deepwater areas in whichthe trout concentrate in summer. Feeding activity of parasitic-phase lampreys reached a peak inAugust. Attachments of lampreys on lake troutwere most numerous in the ventral half of thebody, between the pectoral fin and the anus. Thearea immediately posterior to the pectoral fin wasespecially favored.
Lake trout are attacked much more frequentlyby sea lampreys in Cayuga Lake than in SenecaLake. Evidence exists that the ratio of the number of lampreys to lake trout is 3 to 5 times higherin Cayuga Lake than in Seneca Lake.
White suckers from a tributary of Cayuga Inletexhibited a 26-percent incidence of lamprey attacks in 1951, and a 29-percent incidence in 1952.
Numerous leeches, Pisicola zebra Moore, wereattached to spawning-run lampreys in CayugaInlet in 1951 and 1952. An acanthocephalan wasthe only other parasite found in adult lampreys.
The only important predators on the sea lamprey in the Cayuga Lake basin are the minnowsRMnichthys a. atratulus and Notropis c. cornutus,which feed on lamprey eggs.
Control of the sea lamprey in Cayuga Lakecould be accomplished at a moderate cost. Threecontrol methods appear to be practical: barrier
616 FISHERY BULLETIN OF THE FISH AND WILDLIFE SERVICE
dam, elect.romechanical weir and trap, and mechanical t.rap.
LITERATURE CITEDApPLEGATE, VERNON C.
1950. Natural hist.ory of t.he sea lamprey (Petromyzonmarinus) in Michigan. U.S. Fish and Wildlife Service, Spec. Sci. Rept. :-Fisheries, No. 55, 237 pp.
ApPLEGATE, VERNON C., and BERNARD R. SMITH.1951. Sea lamprey spawning runs in the Great Lakes,
1950. U.S. Fish and Wildlife Service, Spec. Sci.Re.pt.:-Fisheries, No. 51, 49 pp.
ApPLEGATE, VERNON C., BERNARD R. SMITH, ALBERTON L.McLAIN, and MATT PATTERSON.
1952. Sea lamprey spawning runs in the Great Lakes,1951. U.S. Fish and Wildlife Service, Spec. Sci.Rept. :-Fisheries, No. 58, 37 pp.
ApPLEGATE, VERNON C., BERNARD R. SMITH, and WILLISL. NIELSEN.
1952. Use of electricit.y in the cont.rol of sea lampreys:electromechanical weirs and traps and electrical barriers. U.S. Fish and Wildlife Service, Sp. Sci. Rept.Fisheries, No. 92, 52 pp.
COVENTRY, A. F.1922. Breeding habits of the landlocked sea lamprey.
Univ. Toronto Stud., BioI. Ser., No. 20. Publ. Ont.ario Fish. Res. Lab., No.9, pp. 129-136.
CREASER, CHARLES W., and CLARE S. HANN.1929. The food of larval lampreys. Pap. Mich. Acad.
Sci., Arts, and Lett. Vol. 10 (1928), pp. 433-437.GAGE, SIMON H.
1893. The lake and brook lampreys of New York,especially those of Cayuga and Seneca Lakes. InWilder Quarter-Century Book. Ithaca, 1893, pp.421-493. .
1928. The lan,preyf.< of New York State--life hist.oryand economics. In: BioI. Survey of the Oswego RiverSystem, N.Y. Conservation Dept. Suppl. 17t.h Ann.Rept.. (1927), pp. 158-191.
GOODE, GEORGE B.1884. The lampreys--Petromyzontidae. In: The Fish
eries and the Fishery Industries of the U.S., byGeorge B. Goode and associates. Sect. 1, Pt.. III,pp. 677-681.
HALL, A. E., Jr., and OLIVER R. ELLIOTT.1954. Relationship of length of fish to incidence of sea
lamprey scars on white suckers, Catostomus COlll1llersoni, in Lake Huron. Copeia, 1954, No.1, pp. 73-74.
HARDISTY, M. W.1951. Duration of the larval period in the brook lam
prey (Lampetra planeri). Nature, vol. 167, pp.38-39.
HILE, RALPH.1949. Trends in the lake t.rout. fishery of Lake Huron
through 1946. Trans. Amer. Fish. Soc., vol. 76(1946), pp. 121-147.
HILE, RALI'H, PAUL H. ESCHMEYER, and GEORGE F.LUNGER.
1951. Decline of the lake trout fishery in Lake Michigan. Fish. Bull., U.S. Fish and Wildlife Service, vol.52, pp. 77-95.
HUBBS, CARL L., and ALFRED P}:RLMUTTER.1942. Biometric comparison of several samples, with
particular reference to racial invest.igat.ions. Amer.Nat.., vol. 76, pp. 1-11.
HUBBS, CARL L., and T. E. B. POPE.1937. The spread of the sea lamprey through t.he
Great Lakes. Trans. Amer. Fish Soc., vol. 66 (1936),pp.172-176.
HlTBBS, CARL L., and MILTON B. TRAUTMAN.1937. A revision of the lamprey genus lchthyomyzon.
Misc. Publ. Mus. Zool., Univ. Mich., No. 35, 109 pp.JORDAN, DAVID S., and CHARLES H. GILBERT.
1883. Synopsis of the fishes of North America. Bull.U.S. Nat.. Mus., vol. 16, 1,018 pp.
LOEB, HOWARD A.• and ALBERT E. HALL, Jr.1952. Sea lamprey spawning: Michigan streams of
Lake Superior. U.S. Fish and Wildlife Service, Ap.Sci. Rept.:-Fisheries, No. 70, 68 pp.
LENNON, ROBERT E.1954. Feeding mechanism of the sea lamprey and its
effect on host fishes. Fish. Bull., U.S. Fish and Wildlife Service, vol. 56, pp. 247-293.
MAcI\:AY, H. H., and EARL MACGILLIVRAY.1949. Recent invest.igations on the sea lamprey, Petro
myzon tnarinus, in Ontario. Trans. Amer. Fish. Soc.,vol. 76 (1946), pp. 148-159.
MEEK, SETH E.1889. The fishes of the Cayuga Lake basin. Anll.
N.Y. Acad. Sci., vol. 4, pp. 297-316.McLAIN, ALBERTON L.
1952. Diseases and parasites of the sea lamprey, Petromyzon mari-nus, in the Lake Huron basin. Trans.Amer. Fish. Soc., vol. 81 (1951), pp. 94-100.
NEWTH, H. G.1930. The feeding of anUllocoetes. Nature, vol. 126,
pp.94-95.OKKELBERG, PETER.
1921. The early history of the germ cell ill the brooklamprey, Entosphenu8 waderi <Gage), up to and including the period of sex differentiation. Jour.Morph., vol. 35, pp. 1-151.
OKKELBERG, PETER.1922. Notes on the life-history of the brook lamprey,
ichthyomyzon uni,:olor. Occ. Pap. Mus. Zool., Univ.Mich. No. 125, 14 pp.
RADFORTH, IsOBEL.1944. Some considerat.ions on the dist.ribution of fishes
in Ont.ario. Contrib. Royal Ontario Mus. Zool., No.25, 116 pp.
RIDGWAY, ROBERT.1912. Color standards and color nomenclature. Pub
lished by the author, Washington, D.C., 131 pp.ROYCE, WILLIAM F.
1950. The effect of lamprey attacks upon lake trout. inSeneca Lake, New York. Trans. Amer. Fish. Soc.,vol. 79 (949), pp. 71-76.
SCHAEFER, MILNER B.1951. Estimation of size of animal populations by
marking experiments. Fish. Bull., U.S. Fish andWildlife Service, vol. 52, pp. 191-203.

SEA ~PREY OF CAYUGA LAKE 617
SCHULTZ, LEONARD P.1930. The life history of Lampel.ra planeri Bloch, with
a statistical analysis of the rate of growth of thelarvae from western Washington. Occ. Pap. Mus.Zool., Univ. Mich. No. 221, 35 pp.
SHETTER, DAVID S.
1949. A brief history of the sea lamprey problem inMichigan waterR. TranR. Amer. Fish. Soc., vol. 76(1946), pp. 160-176.
SURFACE, H. A.1898. The lampreys of Central New York. Bull. U.S.
Fish COll1m., vol. 17 (1897), pp. 209-215.
1899. Removal of lampreys from the interior waters ofNew York. In 4th Ann. Rept. of the Comm. ofFisheries, Game and Forests of the State of New York(1898), pp. 191-245.
o
TRAUTMAN, MILTON B.1949. The invasion, present status, and life history of
the sea lamprey in the waters of the Great Lakes,especially the Ohio waters cif Lake Erie. FranzTheodore Stone Lab., Ohio State Univ., 7 pp. [Mimeographed].
VAN CLEAVE, HARLEY J., and JUSTUS F. MUELLER.
1934. Parasites of Oneida Lake fishes. Pt. Ill. Abiological and ecological survey of the worm parasites. Roosevelt Wild Life Ann., vol. 3, pp. 161-334.
VLADYKOV, VADIM D.
1950. Larvae of eastern American lampreys (Petromyzonidae). Naturaliste Canad., vol. 77, pp. 73-95.
1951. Fecundity of Quebec lampreys. Canad. FishCulture, Issue 10, pp. 1-14.
WIGLEY, ROLAND L.
1952. A method of marking larval lampreys. Copeia,1952. No.3, pp. 203-204.