listen, understand, respond
TRANSCRIPT

Listen,understand, respond.
The Annual Report and Accounts as at Decem
ber 31, 2013
www.fi neco.it
The Annual Report and Accountsas at December 31, 2013


This report expresses UniCredit’s approach to banking by telling everyday stories about our interactions with Customers, innovations in products
and adaptability in services. These brief but meaningful stories come directly from our colleagues. They are examples of the tangible benefi ts and concrete solutions offered by UniCredit, demonstrating how we make a difference in people’s lives. Our clear goal to improve everyday circumstances is rooted in our complete commitment to outcomes that ensure Customer satisfaction. At UniCredit, listening to our Clients and engaging with them to offer simple, direct results lies at the heart of our commercial banking operations. It is part of our determined effort to contribute to the economic and social well-being of our Customers as well as the communities where we work. We will continue with this commitment to all of you, every day.
2013 Consolidated Reports and AccountsThe Annual Report and Accounts
as at December 31, 2013

Transactional Products and PartnershipsUniCredit - ITALY
Today’s Customers have less time to go to the branch, even though their needs are the same as ever. They need high-tech ways to access their bank services at any time, in any place. The answer to their needs? Subito Banca, which includes an app designed with input from our Customers. It facilitates a wide range of online banking processes and offers an opportunity to buy new Samsung smartphones and tablets at discounted prices.
SimplifyThe bank within easy reach.

3FinecoBank · The Annual Report and Accounts as at December 31, 2013
Contents
Board of Directors and Board of Statutory Auditors 5
Report on Operations 7Introduction to the Accounts 8Summary data 9Key figures 14Business performance and main initiatives during the year 16Commercial activities and development of new products and services 18
Brokerage 19Banking 21Investing 23Financial advisers network 24
Operating structure 26Human resources 26Technology infrastructure 28Internal control system 29Main risks and uncertainties 32Organizational Structure 32Business continuity plan (BCP) 32
Main balance sheet aggregates 36Regulatory capital and prudential requirements 46Income Statement Figures 47Transactions with Group companies 55Subsequent Events and Outlook 56Proposal for the approval of the accountsand allocation of profit for the year 57Reconciliation of Condensed Accountsto Mandatory Reporting Schedule 58Report of the Board of Statutory Auditors 60Report of the External Auditors 65
Bank Financial Statements 69Balance Sheet 70Income statement 71Statement of Comprehensive Income 71Statement of Changes in Shareholders’ Equity 72Cash Flow Statement 73
Notes to the Accounts 75Part A • Accounting Policies 77Part B • Balance Sheet 105Part C • Income Statement 137Part D • Comprehensive Income 153Part E • Information on risks and related risk management policies 155Part F • Shareholders’ Equity 195Part G • Business Combinations 203Part H • Related-Party Transactions 205Part I • Share-Based Payments 215Part L • Segment Reporting 221

Innovate Processes and time savings that serve people’s goals.
Legal Support for the Area Corporate BankingUniCredit Bank Banja Luka - BOSNIA AND HERZEGOVINA
Thanks to us, farmers can now get funds more rapidly. The Ministry of Agriculture has developed a faster method to make state incentive payments, based on a proposal from our bank. The method is related to an existing program that allows Customers who meet certain requirements to obtain a fast-track loan. When the loan is approved, they can access their funds on the same day. This innovative solution is meeting the needs of more than 2,300 farmers.

5FinecoBank · The Annual Report and Accounts as at December 31, 2013
Board of Directors and Board of Statutory Auditors
Board of Directors
Enrico Cotta Ramusino Chairman
Girolamo Ielo Vice Chairman
Alessandro Foti Managing Director
Alfredo Michele Malguzzi Directors Alberto Viappiani Emilio Lombardi Laura Stefania Penna Mariangela Grosoli Stefano Landi
Board of Statutory Auditors
Gian-Carlo Noris Gaccioli Chairman
Barbara Aloisi Statutory Auditors Marziano Viozzi
Marzio Duilio Rubagotti Stand-in Statutory Auditors Francesca Muserra
Deloitte & Touche S.p.A. External Auditors
Share capital€200,070,430.89 fully paid-up, divided into 606,274,033 shares with a par value of €0.33, 100.00% held by UniCredit S.p.A..
Registered officePiazza Durante 11, 20131 Milan, Italy
“FinecoBank Banca Fineco S.p.A.” in abbreviated form “FinecoBank S.p.A.”, or “Banca Fineco S.p.A.” or “Fineco Banca S.p.A.”Company controlled by UniCredit S.p.A., Gruppo Bancario UniCredito, Register of Banking Groups no. 2008.1, Member of the National Guarantee Fund and National Interbank Deposit Guarantee Fund, Italian Banking Association Code 03015, Tax Code and Milan Company Register no. 01392970404 - R.E.A. (Economic and Administrative Index) no. 1598155, VAT No. 12962340159
On January 22, 2013, following the resignation of the Director Mr. Frederik Geertman, effective from December 17, 2012, the Board of Directors co-opted Mr. Emilio Lombardi as a new Director.
On January 25, 2013 the Statutory Auditor Mr. Genta Giandomenico submitted his resignation from the position; on the same date, in accordance with the Civil Code, the Alternate Statutory Auditor Ms. Francesca Muserra took over the role.
On April 16, 2013, the Shareholders’ Meeting of FinecoBank appointed:
- Mr. Emilio Lombardi, already co-opted by the Board on January 22, 2013, as Board Director;
- Mr. Marziano Viozzi as Permanent Auditor;
- Ms. Francesca Muserra as Alternate Auditor.

Sometimes our Customers may encounter some diffi culty, either at a branch or when banking online. These diffi culties require quick solutions. To help our Customers quickly, we offer them a questionnaire after every banking transaction. If they tell us they are not satisfi ed with the quality of a product or service, their branch manager contacts them directly within 48 hours, with a solution. In a six-month period, 15 percent of our Customers fi lled out the questionnaires, with 87 percent saying they were satisfi ed with our resolution of their issue.
AccelerateResponse times and problem solving.
Customer Sactisfation Unit - UniCredit Bank - RUSSIA

7FinecoBank · The Annual Report and Accounts as at December 31, 2013
Report on Operations
Introduction to the Annual Report and Accounts 8Summary data 9Key figures 14Business performance and main initiatives in the period 16Commercial activities and development of new products and services 18
Brokerage 19Banking 21Investing 23The financial advisers network 24
Operating structure 26Human resources 26Technology infrastructure 28Internal control system 29Main risks and uncertainties 32Organisational structure 32Business Continuity Plan (BCP) 35
Main balance sheet aggregates 36Regulatory capital and prudential requirements 46Income statement figures 47Transactions with Group companies 55Subsequent events and outlook 56Proposal for the approval of the accounts and allocation of profit for the year 57Reconciliation of condensed accounts to mandatory reporting schedule 58Report of the Board of Statutory Auditors 60Report of the External Auditors 65

8
Report on Operations
The Annual Report and Accounts as at December 31, 2013 · FinecoBank
Introduction to the Annual Report and Accounts
The Annual Report and Accounts as at December 31, 2013 of FinecoBank Banca Fineco S.p.A. (hereinafter FinecoBank), in implementation of the Legislative Decree 38 of February 28, 2005, have been prepared in accordance with accounting standards (hereinafter “IFRS”, “IAS” or international accounting standards) issued by the International Accounting Standards Board (IASB), including the related interpretation documents issued by the SIC and the IFRIC, and endorsed by the European Commission, pursuant to EU regulation 1606/2002of July 19, 2002, which was incorporated into Italian legislation through Legislative Decree no. 38 of February 28, 2005, and in force as at December 31, 2013.
The Bank of Italy, based on the above-mentioned decree which confirmed its powers already set forth by Legislative Decree no. 87/92 as regards the financial statements of banks and financial companies subject to supervision have been further confirmed by said decree - established the formats for the financial statements and the related notes used to prepare these Accounts in its Circular no. 262 of December 22, 2005 as amended.
The Annual Report and Accounts includes:• the bank’s financial statements, presented with a comparison to
those of 2012;• the Notes to the Accounts.It is accompanied by the Report on Operations, which contains the condensed accounts, the main results of business areas and comments on the results for the period.Also included are the:• report of the Board of Statutory Auditors;• report of the External Auditors.
On January 1, 2013, IAS 19 revised (‘IAS 19R’) and IFRS 13 revised came into effect, as described in Part A - Accounting Policies of Section 2 - General Criteria for preparing the Notes to the Accounts, to which reference is made for further details. Regulations on the first-time adoption of IAS 19R have meant that figures for the periods prior to January 1, 2012 have been restated, while the first-time adoption of IFRS 13 has not had any impact on the Balance Sheet, Income Statement and Statement of Comprehensive Income.

9FinecoBank · The Annual Report and Accounts as at December 31, 2013
Condensed Accounts
Balance Sheet (Amounts in € thousand)
ASSETS 12.31.2013 12.31.2012
CHANGES
AMOUNT %
Cash and cash equivalents 5 7 (2) -28.6%
Financial assets held for trading 4,700 7,589 (2,889) -38.1%
Loans and receivables with banks 16,330,912 17,271,573 (940,661) -5.4%
Loans and receivables with customers 641,250 553,606 87,644 15.8%
Financial investments 93,114 69,430 23,684 34.1%
Hedging instruments 179,265 73,745 105,520 143.1%
Property, plant and equipment 10,772 8,700 2,072 23.8%
Goodwill 89,602 89,602 - -
Other intangible assets 8,014 8,177 (163) -2.0%
Tax assets 67,934 46,299 21,635 46.7%
Other assets 256,629 162,042 94,587 58.4%
Total assets 17,682,197 18,290,770 (608,573) -3.3%
(Amounts in € thousand)
LIABILITIES AND SHAREHOLDERS’ EQUITY 12.31.2013 12.31.2012
CHANGES
AMOUNT %
Deposits from banks 1,648,675 2,065,153 (416,478) -20.2%
Deposits from customers and debt securities in issue 15,054,820 15,339,334 (284,514) -1.9%
Financial liabilities held for trading 2,301 7,177 (4,876) -67.9%
Hedging instruments 178,574 73,251 105,323 143.8%
Provisions for risks and charges 109,354 103,085 6,269 6.1%
Tax liabilities 37,701 66,588 (28,887) -43.4%
Other liabilities 231,623 188,714 42,909 22.7%
Shareholders’ equity 419,149 447,468 (28,319) -6.3%
- capital and reserves 329,719 318,309 11,410 3.6%- revaluation reserves for available-for-sale financial assets 641 285 356 124.9%- revaluation reserves actuarial gains (losses) from defined
benefit plans 3,573 3,407 166 4.9%- net profit 85,216 125,467 (40,251) -32.1%Total liabilities and shareholders’ equity 17,682,197 18,290,770 (608,573) -3.3%
Comparative data as at December 31, 2012 have been restated to reflect the effects of the application of IAS 19R, as described in Part A - Accounting Policies of Section 2 - General Criteria for preparing the Notes to the Accounts. Specifically:• assets recognised as Tax assets decreased by €1,700 thousand;• liabilities recognised under the item Other liabilities increased by €784 thousand, while liabilities recognised as Provisions for risks and charges
decreased by €5,891 thousand;• the balance of the item Valuation reserves from actuarial gains (losses) relative to defined benefit plans increased by €3,407 thousand.
Summary data

10
Report on Operations
The Annual Report and Accounts as at December 31, 2013 · FinecoBank
Summary data (Continued)
Balance Sheet - Quarterly data (Amounts in € thousand)
ASSETS 12.31.2013 09.30.2013 06.30.2013 03.31.2013 12.31.2012
Cash and cash equivalents 5 7 8 8 7
Financial assets held for trading 4,700 5,600 5,606 9,134 7,589
Loans and receivables with banks 16,330,912 16,305,247 17,008,411 17,230,117 17,271,573
Loans and receivables with customers 641,250 550,292 561,002 551,278 553,606
Financial investments 93,114 92,406 102,329 98,413 69,430
Hedging instruments 179,265 160,226 158,275 95,866 73,745
Property, plant and equipment 10,772 9,615 8,697 8,438 8,700
Goodwill 89,602 89,602 89,602 89,602 89,602
Other intangible assets 8,014 7,683 7,879 7,919 8,177
Tax assets 67,934 43,089 44,178 46,663 46,299
Other assets 256,629 201,573 178,414 192,295 162,042
Total assets 17,682,197 17,465,340 18,164,401 18,329,733 18,290,770
(Amounts in € thousand)
LIABILITIES AND SHAREHOLDERS’ EQUITY 12.31.2013 09.30.2013 06.30.2013 03.31.2013 12.31.2012
Deposits from banks 1,648,675 1,459,707 1,673,720 1,753,883 2,065,153
Deposits from customers and debt securities in issue 15,054,820 15,067,680 15,573,002 15,607,068 15,339,334
Financial liabilities held for trading 2,301 4,998 4,853 8,599 7,177
Hedging instruments 178,574 159,649 157,436 94,554 73,251
Provisions for risks and charges 109,354 101,031 99,860 101,936 103,085
Tax liabilities 37,701 52,593 37,475 84,024 66,588
Other liabilities 231,623 206,909 228,392 205,516 188,714
Shareholders’ equity 419,149 412,773 389,663 474,153 447,468
- capital and reserves 329,719 329,718 329,718 443,776 318,309- revaluation reserves for available-for-sale financial assets 641 229 276 (54) 285- revaluation reserves actuarial gains (losses) from defined
benefit plans 3,573 3,407 3,407 3,407 3,407- net profit 85,216 79,419 56,262 27,024 125,467Total liabilities and shareholders’ equity 17,682,197 17,465,340 18,164,401 18,329,733 18,290,770
As already mentioned above the comparative data as at December 31, 2012 have been restated to reflect the effects of the application of IAS 19R, as described in Part A - Accounting Policies of Section 2 - General Criteria for preparing the Notes to the Accounts.

11FinecoBank · The Annual Report and Accounts as at December 31, 2013
Income statement (Amounts in € thousand)
12.31.2013 12.31.2012
CHANGES
AMOUNT %
Net interest 180,278 243,469 (63,191) -26.0%
Net fees and commission income 166,736 143,611 23,125 16.1%
Net trading, hedging and fair value income 28,281 28,069 212 0.8%
Net other expenses/income (4,964) (5,368) 404 -7.5%
OPERATING INCOME 370,331 409,781 (39,450) -9.6%Payroll costs (63,338) (61,022) (2,316) 3.8%
Other administrative expenses (174,636) (148,670) (25,966) 17.5%
Recovery of expenses 56,997 31,474 25,523 81.1%
Amortisation, depreciation and impairment losses on intangible and tangible assets (8,081) (8,245) 164 -2.0%
Operating costs (189,058) (186,463) (2,595) 1.4%OPERATING PROFIT (LOSS) 181,273 223,318 (42,045) -18.8%Net impairment losses on loans and provisions for guarantees and commitments (3,275) (2,852) (423) 14.8%
NET OPERATING PROFIT (LOSS) 177,998 220,466 (42,468) -19.3%Provisions for risks and charges (16,059) (18,356) 2,297 -12.5%
Net income from investments (6) (3) (3) 100.0%
PROFIT (LOSS) BEFORE TAX FROM CONTINUING OPERATIONS 161,933 202,107 (40,174) -19.9%Income tax for the period (76,717) (76,640) (77) 0.1%
PROFIT (LOSS) AFTER TAX FROM CONTINUING OPERATIONS 85,216 125,467 (40,251) -32.1%NET PROFIT (LOSS) FOR THE PERIOD 85,216 125,467 (40,251) -32.1%
12
Report on Operations
The Annual Report and Accounts as at December 31, 2013 · FinecoBank
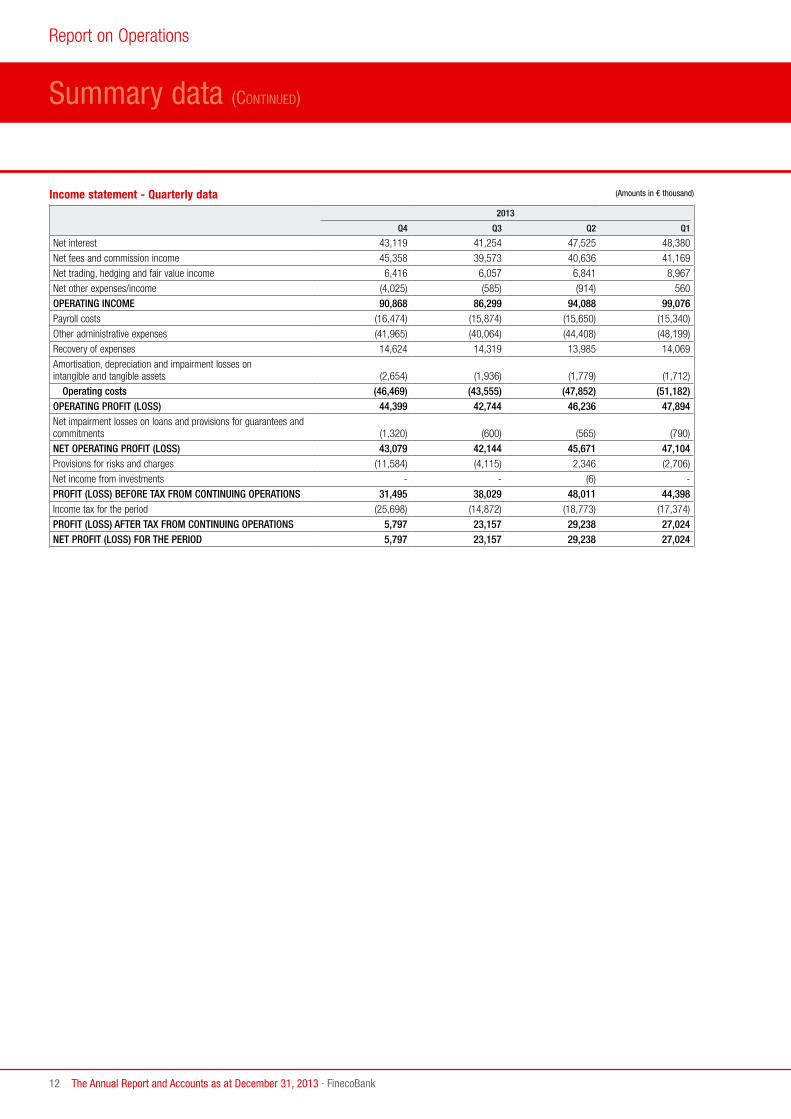
Summary data (Continued)
Income statement - Quarterly data (Amounts in € thousand)
2013
Q4 Q3 Q2 Q1
Net interest 43,119 41,254 47,525 48,380
Net fees and commission income 45,358 39,573 40,636 41,169
Net trading, hedging and fair value income 6,416 6,057 6,841 8,967
Net other expenses/income (4,025) (585) (914) 560
OPERATING INCOME 90,868 86,299 94,088 99,076 Payroll costs (16,474) (15,874) (15,650) (15,340)
Other administrative expenses (41,965) (40,064) (44,408) (48,199)
Recovery of expenses 14,624 14,319 13,985 14,069
Amortisation, depreciation and impairment losses onintangible and tangible assets (2,654) (1,936) (1,779) (1,712)
Operating costs (46,469) (43,555) (47,852) (51,182)OPERATING PROFIT (LOSS) 44,399 42,744 46,236 47,894 Net impairment losses on loans and provisions for guarantees and commitments (1,320) (600) (565) (790)
NET OPERATING PROFIT (LOSS) 43,079 42,144 45,671 47,104 Provisions for risks and charges (11,584) (4,115) 2,346 (2,706)
Net income from investments - - (6) -
PROFIT (LOSS) BEFORE TAX FROM CONTINUING OPERATIONS 31,495 38,029 48,011 44,398 Income tax for the period (25,698) (14,872) (18,773) (17,374)
PROFIT (LOSS) AFTER TAX FROM CONTINUING OPERATIONS 5,797 23,157 29,238 27,024 NET PROFIT (LOSS) FOR THE PERIOD 5,797 23,157 29,238 27,024

13FinecoBank · The Annual Report and Accounts as at December 31, 2013
Income statement - Quarterly data (Amounts in € thousand)
2012
Q4 Q3 Q2 Q1
Net interest 56,685 57,434 66,683 62,667
Net fees and commission income 36,482 36,116 31,227 39,786
Net trading, hedging and fair value income 4,689 7,391 7,747 8,242
Net other expenses/income (2,451) (2,783) (943) 809
OPERATING INCOME 95,405 98,158 104,714 111,504 Payroll costs (16,214) (14,989) (15,177) (14,642)
Other administrative expenses (36,933) (34,263) (35,978) (41,496)
Recovery of expenses 7,169 8,187 7,031 9,087
Amortisation, depreciation and impairment losses onintangible and tangible assets (2,220) (2,053) (2,005) (1,967)
Operating costs (48,198) (43,118) (46,129) (49,018)OPERATING PROFIT (LOSS) 47,207 55,040 58,585 62,486 Net impairment losses on loans and provisions for guarantees and commitments (880) (738) (373) (861)
NET OPERATING PROFIT (LOSS) 46,327 54,302 58,212 61,625 Provisions for risks and charges (6,328) (4,682) (1,953) (5,393)
Net income from investments - - (2) (1)
PROFIT (LOSS) BEFORE TAX FROM CONTINUING OPERATIONS 39,999 49,620 56,257 56,231 Income tax for the period (12,173) (20,532) (21,900) (22,035)
PROFIT (LOSS) AFTER TAX FROM CONTINUING OPERATIONS 27,826 29,088 34,357 34,196 NET PROFIT (LOSS) FOR THE PERIOD 27,826 29,088 34,357 34,196
Main balance sheet figures (Amounts in € thousand)
12.31.2013 12.31.2012
CHANGE
AMOUNT %
Loans and receivables with customers (1) 421,784 371,765 50,019 13.5%
Total assets 17,682,197 18,290,770 (608,573) -3.3%
Customer direct deposits (2) 12,518,293 12,043,736 474,557 3.9%
Customer indirect deposits (3) 31,088,364 27,767,418 3,320,946 12.0%
Total customer (direct and indirect) deposits 43,606,657 39,811,154 3,795,503 9.5%
Shareholders’ equity 419,149 447,468 (28,319) -6.3%
(1) Ordinary loans and receivables with customers refer solely to loans granted to customers.(2) Customer direct deposits include overdrawn current accounts, Supersave repos and the Cash Park deposit account.(3) Indirect deposits from customers consist of products placed online or through the sales networks of FinecoBank.

14
Report on Operations
The Annual Report and Accounts as at December 31, 2013 · FinecoBank
Key figures
Operating Structure
12.31.2013 12.31.2012
No. of Employees 965 931
No. of Human Resources 976 949
No. of Financial Advisers 2,438 2,317
No. of Operating financial outlets 311 298
Number of human resources: includes permanent employees, atypical employees, Directors and Group employees seconded to FinecoBank, net of FinecoBank employees seconded to the Group.Number of operating financial stores: financial stores managed by the Bank and financial stores managed by financial advisers (Fineco Center).
Profitability, productivity and efficiency ratios (Amounts in € thousand)
12.31.2013 12.31.2012
Net interest/Operating income 48.68% 59.41%
Income from brokerage and other income/Operating income 51.32% 40.59%
Income from brokerage and other income/Operating costs 100.53% 89.19%
Cost/income ratio 51.05% 45.50%
ROE 23.58% 38.72%
EVA 68,142 110,736
RARORAC 39.38% 83.28%
ROAC 49.25% 94.36%
Total customer deposits/Average resources 45,306 42,533
Total customer deposits/(Average resources + PFA) 13,056 12,261
ROE: the shareholders’ equity used for the ratio is the average figure for the period excluding dividends to be distributed and valuation reserves. EVA (Economic Value Added): expresses the ability to create value in monetary terms, as the difference between net operating profit and the figurative cost of the allocated capital.RARORAC (Risk Adjusted Return on Risk Adjusted Capital): is the ratio of EVA to Allocated Capital and expresses the ability to create value by risk unit as a percentage.ROAC (Return on Allocated Capital): is the ratio of Net Operating Profit and Allocated Capital and expresses the value generated by the Allocated Capital as a percentage.Allocated Capital: is the higher of internal capital (share of capital needed to cover risks, periodically provided by the Parent Company) and regulatory capital. Regulatory capital used to calculate the indicators EVA, RARORAC and ROAC is calculated on a consolidated basis, without considering the “Basel I floor” or the reduction of 25% for belonging to banking Groups. To calculate the indicators as at December 31, 2013, the figure for internal capital is that at September 30, 2013, and is the latest available figure provided by the Parent Company.Income from brokerage and other income: Net fee and commission income, Net trading, hedging and fair value income and Net other expenses/income.
Balance Sheet indicators
12.31.2013 12.31.2012
Loans and receivables with ordinary customers/Total assets 2.39% 2.03%
Loans and receivables with banks/Total assets 92.36% 94.43%
Financial assets/Total assets 0.55% 0.42%
Direct deposits/Total liabilities 70.80% 65.85%
Shareholders’ equity (including profit)/Total liabilities 2.37% 2.43%
Loans and receivables with ordinary customers/Customer direct deposits 3.37% 3.09%
Solvency indicators
12.31.2013 12.31.2012
Tier 1 capital/Risk-weighted assets -TIER 1 capital ratio 12.25% 9.34%
Regulatory capital/Risk-weighted assets - Total capital ratio 12.25% 9.34%
Risk-weighted assets are calculated by multiplying total prudential requirements by 12.5 (the inverse of the minimum compulsory coefficient of 8%). FinecoBank calculates its capital requirement for operational risk using advanced approaches, integrating total capital requirements for the floor set by Bank of Italy regulations. FinecoBank has applied a floor corresponding to the positive difference between 80% of the capital requirements calculated on the basis of regulations in force as at December 31, 2006, and the sum of capital requirements for credit, counterparty, market and operational risks, calculated using the current provisions of Basel II.

15FinecoBank · The Annual Report and Accounts as at December 31, 2013
Market share
TRADING ON ITALIAN STOCK MARKET (ASSOSIM) 12.31.2013 12.31.2012
Third party volumes traded on MTA 22.98% 19.70%
Classification of third party volumes traded on MTA 1° 1°
PERSONAL FINANCIAL ADVISERS NETWORK (ASSORETI) 12.31.2013 12.31.2012
Share ranking 3° 3°
PERSONAL FINANCIAL ADVISERS NETWORK (ASSORETI) 12.31.2013 12.31.2012
Net Deposits ranking 2° 2°
TOTAL DEPOSITS (BANK OF ITALY) 09.30.13 12.31.2012
Share of Total Deposits market 1.28% 1.22%
Share of Direct Deposits market 0.98% 0.97%
Share of Indirect Deposits market 1.48% 1.41%
The figures for “Total Deposits (Bank of Italy)” refer to September 30, 2013, which is the latest available data. * On the basis of the 2012 Assosim Report, FinecoBank ranks in 3rd place for third party volumes traded on the MTA, with a market share of 11.39% compared to 14.75% in 2011. However, considering total
volumes trading for the Italian shares segment and recalculating the market shares to take account of internalised orders (following the introduction of MIFID, financial brokers are permitted to handle orders internally, following the best execution policy), FinecoBank has again confirmed its position as the number 1 broker on the Italian market, with a share of 19.7%.

16
Report on Operations
The Annual Report and Accounts as at December 31, 2013 · FinecoBank
Business performance and main initiatives in the period
FinecoBank is a bank operating in Italy providing banking and financial services and investment services, focused almost exclusively on the retail customer segment, which employs an integrated multi-channel service consisting of the financial advisers network, the online channel and the mobile channel.In addition to consolidating its leadership position at domestic and European level in the trading segment, FinecoBank is the UniCredit group’s Asset Gathering bank, with over 2,400 personal financial advisers dedicated to customers who prefer to deal with professionals, focused on providing advice and asset management.
FinecoBank offers a full range of banking services (current account, payment services and issue of debit and credit cards) and investment services, including services of placement and trading of financial products. In particular, with regard to investment services, at December 31, 2013, the Issuer offered its customers, on one hand, an investment platform with almost 5,000 mutual investment funds and SICAV sub-funds managed by 63 international and Italian investment houses and, the other hand, direct access to major global equity markets and the opportunity to invest in CFDs (on Forex, indices and shares), futures, options, bonds, ETFs and investment certificates.
In 2013, FinecoBank continued to be the leading broker in Italy, holding a market share of 22.98% of third party volumes traded on the MTA, and was also leading online broker in Europe in terms of the number of orders executed on financial markets and range of products offered through a single account.
In 2013, approximately 86,000 new bank accounts were opened, confirming the market’s interest in the products and services offered by Fineco.
Performance of balance sheet aggregatesTotal (direct and indirect) customer deposits reached €43,607 million, as at December 31, 2013, with an increase of 9.5% compared to the end of 2012, thanks to net deposits of approximately €2,500 million and a positive effect related to market performance. Indirect customer deposits (Assets under Management-AUM plus Assets under Custody-AUC) were equal to €31,088 million, compared to €27,768 million as at December 31, 2012, going up by 12% (of which AUM were up 16%) and confirming a constant growth trend, as well as an on-going improvement in the quality of deposits. The number of active bank accounts exceeds 715 thousand.
39,811
12,044
16,875
19,538
12.31.2012
-350
Net assets under administration
2,417
Net assetsunder management
415
Net direct deposits
1,314
Marketeffect
43,607
12,518 Direct
AUM
AUC
12.31.2013
10,893 11,550
AUC = Assets under custody.AUM = Assets under management.TFA = Total Financial Assets (direct and indirect deposits).

17FinecoBank · The Annual Report and Accounts as at December 31, 2013
The table above shows the figures for assets under management and under administration of Fineco customers, including both those linked to a financial adviser and on-line customers. The figures shown refer to the Bank’s own products and to those of third parties placed on-line or through the personal financial advisers network.
Performance of income statement aggregatesProfit before tax amounted to €162 million.The result, although down on the previous year, is very positive considering the significant reduction in the interest margin (-€63 million) related to the fall in market rates, as well as general reduction in customer transactions on financial markets with negative impacts on net fee and commission income. Also positive was the result from placement and management of securities, UCIT units and segregated accounts, which was up €19 million (+21.9%). The success of a strategy that since years has targeted diversification and the introduction of new products and services is confirmed. Thanks to this positioning, customers have maintained and strengthened their relations with FinecoBank, because they have found all the products and services they need to diversify their operations and their investment and trading strategies, with the support of the related platform or through financial advisers.Despite the considerable expansion of the Bank (development of new products and services, increase of 3,780 million TFAs, recruitment of 128 new financial advisers, opening of 13 financial stores, increase in personnel by 34 employees), operating costs were only up by €2.6 million (+1.4%), highlighting on-going improvements in the efficiency of the operating structure and functions supporting the business.
Communications and external relationsThe positioning of “La Banca che semplifica la banca” (The Bank that Simplifies Banking) was launched and gained ground throughout 2013, with three major campaign flights in January, featuring the slogan “Semplice come respirare” (As simple as breathing), and “Semplice come sorridere” (As simple
Assets under administration and under management (Amounts in € thousand)
12.31.2013 % 12.31.2012 % CHANGE % CHANGE
Current accounts in euro, foreign currencies, repos and deposit account 12,518,293 28.7% 12,043,736 30.3% 474,557 3.9%
DIRECT DEPOSITS 12,518,293 28.7% 12,043,736 30.3% 474,557 3.9%
Segregated accounts 41,901 0.1% 212,583 0.5% (170,682) -80.3%
UCITS and other investment funds 17,691,343 40.6% 14,940,556 37.5% 2,750,787 18.4%
Insurance products 1,805,235 4.1% 1,721,404 4.3% 83,831 4.9%
ASSETS UNDER MANAGEMENT 19,538,479 44.8% 16,874,543 42.3% 2,663,936 15.8%Government securities, bonds and stocks 11,549,885 26.5% 10,892,875 27.4% 657,010 6.0%
ASSETS UNDER ADMINISTRATION 11,549,885 26.5% 10,892,875 27.4% 657,010 6.0%TOTAL ASSETS 43,606,657 100.0% 39,811,154 100.0% 3,795,503 9.5%
as smiling) in the April/September period. The communications strategy covered all the media, in particular TV, with 70% of planning focused on information content, in addition to: radio, cinema, the economic and financial press, the web and social media. An annual economic/financial press monitoring plan was implemented, targeting all major publications.
At the end of the first half of 2013, the “Bankology” campaign was launched in the press and on the web, with a streamlined key concept that still went into detail about the products and services that can really simplify the life of Fineco customers.
In the second half of the year, a powerful advertising flight was re-proposed, with the theme “smile”, along with a trading campaign online and a campaign to launch the new “MoneyMap” service, which was also advertised on hoardings nationwide, publicised in dynamic advertising and in the national press.
Spontaneous awareness of the Fineco brand increased: from +2% recorded in March to +5% in April.
In 2013, the Member Get Member campaign continued to be the driving force behind the opening of new bank accounts, along with social media that expanded the campaign’s scope and effectiveness.
Other promotional initiatives included the share transfer campaign and the “Spendi e vinci” (Spend and win) contest (for customers limiting ATM withdrawals and opting for their credit cards instead), active throughout the year.
Fineco is still the Italian bank with the most followers on Twitter, while its fan page on Facebook is continually evolving, without push or other types of advertising. It has nearly 18,000 fans - with very high level of interaction and engagement (over 50 replies and over 100 likes for each post).A considerable focus was placed on classroom and online training (webinars), with excellent returns from up-selling and cross-selling on active customers, and from new business with new traders. More than 1,100 local marketing and acquisition/up-selling events (“format” events) were held throughout Italy by Fineco financial advisers, proving to be a powerful tool for customer engagement and prospects.

18
Report on Operations
The Annual Report and Accounts as at December 31, 2013 · FinecoBank
Commercial activities and development of new products and services
The main commercial activities, products and services released in 2013, which involved all the Bank’s departments and units, within their respective areas, and consisted of feasibility studies, subsequent implementation and sale/placement, are summarised below: - extension of the “Member Get Member” and “Bring Securities and
Funds to Fineco” campaigns; - possibility to directly request online the transfer of Telepass
(electronic motorway toll payment system) billing from another bank to Fineco, without having to change the Telepass device installed in the vehicle;
- release of the new version of PowerDesk. The leading trading platform in Italy now has a whole host of new features, including: trading on main world indexes, with no commission and no disclosure costs, in over 20 countries; Customisable workspace; even better graphics, with new customisable historical series, over 90 technical indicators and the display of up to 6 charts in a MultiCharts window; advanced Chart Trading to enter, amend and delete orders, including stop loss and take profit orders, directly from the chart; new dynamic and self-excluding orders; yield from main Government Bonds in real time; a more powerful advertising engine and more extensive news, also covering bonds and Forex; a fee which can be reset with just 5 orders executed a month;
- introduction of the “Credit line with authorisation to sell through administration and SICAVs”. By opening an active bank account and signing authorisation to sell securities, resident customers who are Fineco current account holders and have securities with the Bank, may obtain a current account credit line in proportion to the amount of securities they hold, for which the Bank has received an authorisation to sell;
- release of the new version of the Fineco application for smartphones and iPads, that can be downloaded free of charge from the App Store on iTunes and from Google Play, with additional functions, such as: making payments using post office payment slips and photographing the bar code; transfers; MAV (payment against order) or RAV (special paying in slip issued by government
collection agencies) payments; ATM/Branch search; privacy option, to conceal assets; total credit card spending in previous months; statement of transactions, with a search function by date; confirmation of bank transfers with a PIN text message; adding recipients of transfers to the contacts book, with a description and alias; the possibility to buy and sell bonds; foreign exchange service (with the multicurrency service active); CashPark service; plus bug fixing and an improved stability and performance;
- issue of the new Fineco “Small Business” current account for small businesses and professionals;
- release of MoneyMap, Fineco’s Household Budgeting service. This innovative service, fully integrated in the Fineco site, lets users track household spending in a fully automated way. Incomings and outgoings are itemised by category and located, statistics are given on expenditure and preferred retail outlets, and a budget can be configured and monitored;
- release of the Fineco App for Windows 8, which can be directly downloaded from Windows Phone Market. With this new application for Windows Phone 8, users can manage account transactions, order bank transfers, buy and sell Italian and foreign securities on main world markets, also setting trading margins, with charts, indexes and quotations in real time;
- release of the Logos App for iPads and Android tablets;- a wider choice of bonds, with access to the new Euronext market.
More than 1,000 new securities have been made available on MOT, EuroMOT, EuroTLX and Hi-MTF, for a total basket of more than 6,000 instruments.
The following pages contain the main indicators and results of the product macro-areas: Brokerage, Banking and Investing.All the activities were carried out with the aim of obtaining economic results from the “industrial” management of the businesses, to minimise their financial risk. The financial management of FinecoBank is oriented towards risk management aimed at protecting the industrial returns on various businesses and not assuming risk positions on its own account.

19FinecoBank · The Annual Report and Accounts as at December 31, 2013
In 2013, FinecoBank further consolidated its leadership position on the Italian online trading market. In the first few months of the year, transactions increased considerably, on the Italian market; from March onwards, trading volumes fell, as the Tobin Tax became effective.
The heavy traders segment continued to be affected by the downturn in volumes and generally by a changed domestic market structure. However total fees and commission income and expense generated were higher than expected, thanks to contributions from the US, Forex and Logos markets, and new CFDs on indices.
The contribution from US equity increased, with some of the orders previously executed in Italy being transferred, due to market dynamics, the effect of the Tobin Tax and repricing in January 2013.
The contribution from derivatives and interest on leverage was better than expected, while Forex and bonds, after an excellent first half, were affected by a poor volatility and low volumes.
Besides accounting for a significant part of net commissions, the new products, Logos and CFDs on indices, reported growth rates entirely against market trends compared to traditional business segments.
Besides repricing on US markets and the release of CFDs on indices, the range of bonds was expanded, with new markets added and the OTC service implemented. Fineco continued its strategy to consolidate, innovate and develops its products, introducing the new Powerdesk platform, Logos app, Equiduct German market and evolutionary apps for iPhones, iPads, Android and Windows Phone.
Specifically:• the Logos platform is now available using apps, the look & feel have
been entirely restyled and the number of instruments that can be traded increased to more than 100, from the 50 of the desktop version;
• CFDs enable customers to trade on indices of 20 different countries without having to connect to relative stock markets and without paying additional costs, plus they also benefit from the leverage effect and no commission;
• the new Powerdesk platform, with its restyled look and feel, now features integrated content, such as a customisable workspace, new graphs, a government bonds spread display, economic calendar and better usability with a predictive search function, multicharts and preference contextualisation;
• the Equiduct markets enables all our customers to use the listings of main German securities free of charge;
• the Hi MTF and Euronext Bond markets and OTC service have further expanded bond products, with more than 7,000 instruments now available;
• evolutionary apps enable users to access services such as payments using post office payment slips, trade bonds, search for ATMs and currency exchange from their mobile devices.
Information feeds have also been changed, to reduce costs on share markets of little importance to our customers.
Brokerage
22,513,118 22,090,734
Dec 2012 Dec 2013
Total number of orders executed

20
Report on Operations
The Annual Report and Accounts as at December 31, 2013 · FinecoBank
Commercial activities and development of new products and services (Continued)
In general, the results achieved confirm the success of a business model focused on offering very easy to use innovative services in an all-round solution for all target customers.
Thanks to this positioning, customers maintained and consolidated relations with Fineco, because they have a bank that always listens to their needs for new products (for example Forex, multiday leverage, derivatives, bonds, CFDs) and for usability and interfaces.
The total number of orders executed refers to the transactions of retail and institutional customers to buy and sell shares, bonds, derivatives, forex, DFCs, provisions and repos.
Number of orders executed on line broken down by stock market
3,00
0,00
00
6,00
0,00
0
9,00
0,00
0
12,0
00,0
00
15,0
00,0
00
18,0
00,0
00
Germany France USA Other marketsItaly (MTA+AH)
Dec 2012
Dec 2013
DEC 2012 DEC 2013
Other markets 143,956 109,317
Italy (MTA+AH) 12,251,904 11,114,412
USA 1,523,324 2,121,466
France 209,197 153,738
Germany 235,981 377,994

21FinecoBank · The Annual Report and Accounts as at December 31, 2013
Banking
Main new products and services include the digital signature service for signing documents and contracts with the Bank online, the online launch of the Small Business account for professionals and small businesses, the launch of the MoneyMap service and introduction of the digital signature for financial advisers.
The digital signature service is only available for bank customers. After obtaining a Qualification Certificate issued by the Accredited Certification Body (In.te.Sa S.p.A.), the customer can sign bank documents and contracts directly online, entering, in addition to the device PIN, the PIN text code, which is sent to the certified mobile phone number.At present, contracts can be signed by customers with a digital signature for:- ATM cards;- top-up credit cards;- changing accounts, to request the transfer of accounts held in one
name to a new economic profile with no fees and no interest;- enabling derivatives, before increasing transactions on Logos, CFDs and
Forex trading services.
The new Small Business account, launched in May, aims to diversify the business, with the monitoring of new market segments. The account can be directly opened online or via a financial adviser.
MoneyMap is Fineco’s household budgeting service, fully integrated in current accounts, to enable customers to track household spending in a fully automated way. MoneyMap itemises incomings and outgoings by category, locates credit card transactions, provides statistics on expenditure and preferred retail outlets, and lets users configure and monitor their own budget. The service is an exclusive of Fineco and really helps customers control their expenses.
The digital signature service exclusively for financial advisers enables them to sign digital documents. Simple, quick and above all secure, the service guarantees the authenticity of the signature and that documents cannot be edited.
Optimisation and expansion of the range of services offered to customers includes new F24 forms online to pay taxes and the launch of the online transfer service for Telepass payments.
At the same time, activities to design and manage marketing campaigns continued, targeting online and member get member initiatives. The activities are complex, combining creative, promotional and logistics activities, as well as monitoring.
CreditIn 2013, in line with the performance figures for last year, the indicators relating to the credit card sector showed an upward trend.Specifically, a 5% increase was recorded in the number of active credit card holders with full repayment of balance at term, whilst an 8% increase was recorded in the number of customers holding credit cards with instalment payment plans (also known as revolving credit cards).Furthermore, the figure relating to spending, which continues to be the main profitability driver, rose by 9.7% compared to the previous year, recording an overall sum of more than €2 billion. The spending of revolving cards represented 2% of the total.
At present, Fineco cards comprise 46.5% cards operating on the Visa circuit, and the remaining 53.5% on the MasterCard circuit. Relative spending amounts to 57% on the Visa circuit and 43% on the MasterCard circuit.
As part of the programme to migrate cards to technologies necessary for credit card holders to make “proximity payments”, during the last quarter of 2013, the certification process to enable Visa circuit cards to use contactless technology (PayWave) was started. All newly issued MasterCards are already enabled to use contactless technology (Paypass).
Banking
27,767
31,088
661,389
712,976
0
5,000
10,000
15,000
20,000
25,000
30,000
35,000
40,000
Dec 2012 Dec 2013550,000
570,000
590,000
610,000
630,000
650,000
670,000
690,000
710,000
730,000
750,000
No. of current accounts and balance of direct and indirect deposits (Amounts in € thousand)
direct depositsindirect depositsno. of current accounts
12,044 12,518

22
Report on Operations
The Annual Report and Accounts as at December 31, 2013 · FinecoBank
Commercial activities and development of new products and services (Continued)
In addition, from April, all rechargeable cards will be issued with Chip and PIN. Chip & PIN technology allows purchases to be made by entering a PIN instead of signing the receipt. This feature is a new security standard aimed at further strengthening the protection against the risk of fraud in the event of loss, theft or counterfeiting.
Lastly, from February, FinecoBank has expanded the range of credit facilities with the opening of a new current account credit service with mandate to sell securities.
Payment systems
New developments in payment systems include the updating of payments services to requirements introduced by the new EU SEPA Directive.Sepa Direct Debit (SDD) is a pre-authorised direct debit payment service to make payments in SEPA countries (the 27 countries of the EU, plus Iceland, Liechtenstein, Norway, Switzerland and the Principality of Monaco). Inside this area, all payments are considered as domestic and so no distinction is made between “national” and “cross-border” payments. The service enables customers to request automatic direct debit for payments from their current account, based on previous authorisation arranged with the recipient of the payment. This service is similar to the Italian RID (pre-authorised debit instructions).
As provided for by EU regulation no. 260/2012 of March 14, 2012, the migration of all Italian and cross-border bank transfers to SEPA (Single Euro Payments Area) has been completed. SEPA transfers are used to pay bank transfers in euros between customers who have accounts in the SEPA; as from February 28, 2014, this will be the only valid method of bank transfers in euros for all countries that are in the SEPA.
Number of valid activated Credit Cards
FinecoBank Cards
609,436
557,571
Dec 2012 Dec 2013
Credit Card spending (cash and revolving)(Amounts in € thousand)
Dec 2012 Dec 2013
43.000
42.000
41.000
40.000
39.000
38.000
37.000
36.000
35.000
34.000
2,150,000
1,950,000
1,750,000
1,550,000
1,350,000
1,150,000
950,000
750,000
Spending cashSpending revolving
37,010
1,831,908 2,009,288
42,059

23FinecoBank · The Annual Report and Accounts as at December 31, 2013
As part of its business, FinecoBank uses an open architecture business model to offer customers an extremely wide range of asset management products - comprised of collective asset management products, such as units of UCITS and SICAV - from carefully selected Italian and international investment houses.At December 31, 2013, FinecoBank had signed placement agreements with 63 Italian and international investment houses for the distribution of approximately 5,000 UCITS and SICAV sub-funds.To facilitate the identification of the best products to offer customers within its range of products, thereby optimising service levels, FinecoBank, in monitoring its range of products, has developed an additional selection process to identify the best products available on the market at any time.With this goal in mind, investment programmes were created starting in 2011, in partnership with Pioneer Investments acting as the manager. Exclusively targeted to the bank’s customers, the investments take the form of funds of funds (“Core Series”) which invest in the best funds out of those distributed by the Bank per individual asset class.
Through its financial advisers, FinecoBank offers its customers the traditional investment advisory service and, since 2010, an advanced advisory service called Fineco Advice.
Fineco Advice is an advisory platform that enables financial advisers to:• run diagnostics on the customer portfolio invested with
FinecoBank, as well as with other banks, and conduct detailed mapping of asset allocation, the risk/return profile of the customer’s portfolio, the cost of each individual instrument the portfolio is invested in and the overall efficiency of the portfolio;
• monitor portfolios invested in FinecoBank, which takes the form of on-going advice on asset allocation of investments, the selection of individual financial instruments (strongly focused on high quality instruments in terms of ratings and liquidity, among other aspects) and their consistency over time with the risk/return profile selected by the customer.
Through its financial advisers FinecoBank also offers customers the option to subscribe different types of insurance asset management products and supplementary pension products offered by numerous insurance companies or investment houses. Customers can thus benefit from a healthy competitive scenario, which reflects on the quality of the products and services offered, and have their varying needs met in relation to different levels of risk appetite.
(Amounts in € thousand)
12.31.2013 % 12.31.2012 % CHANGE %
Mutual investment funds and other funds 17,691,343 90.6% 14,940,556 88.5% 2,750,787 18.4%
Insurance products 1,805,235 9.2% 1,721,404 10.2% 83,831 4.9%
Discretionary accounts 41,901 0.2% 212,583 1.3% (170,682) -80.3%
Total asset management 19,538,479 100.0% 16,874,543 100.0% 2,663,936 15.8% of which Guided products & services
- Core series 3,748,067 67.6% 2,715,403 69.4% 1,032,664 38.0%
- Advice 1,792,844 32.4% 1,197,409 30.6% 595,435 49.7%
Investing

24
Report on Operations
The Annual Report and Accounts as at December 31, 2013 · FinecoBank
The Company’s consolidated position in the Wealth Management segment was a major focus in 2013, with advertising campaigns and promotions in the year targeting this area.In particular, the advertising campaign (launched at the start of 2013 and re-proposed with a new flight in the spring and last quarter), promotes brand awareness and focuses on the status the Bank is aiming for in terms of positioning.
Network promotions targeted top-end customers, with dedicated campaigns including MGM Apex and Tax-free Advice concerning the TOP advisory service. Other more traditional campaigns, with a softer focus, were also run to acquire new customers, including periodic MGM campaigns and the “Porta titoli e fondi” (Bring Securities and Funds to Fineco) campaign.
More than 1,100 customer events were held, proving to be important acquisition and cross-selling channels; new formats were also introduced for this customer segment, with exclusive events being held.
The Fineco Wealth Advisor Forum was also relaunched during the year, comprising 140 advisers who target their financial advice
services at private customers, that make up a significant part of the Network, accounting for 6% in terms of number of customers, and 26% in terms of assets. At the end of 2013, the number of private segment customers totalled more than 11,000 (equal to approximately 2% of the customer base) with total assets of €12.8 billion.
In 2013:- total net deposits as at December 31, 2013 amounted to:
€2.5 billion;- new accounts opened in the year totalled: around 70,000
The new accounts contributed to a considerable increase in deposits, with the addition of 128 new advisers generating total net deposits equal to €618 million and 70 “beginners” from the “young people project” generating €33 million.
As at December 31, 2013, the network was made up of 2,438 personal financial advisers, who operate countrywide through 311 financial stores (Fineco Centres), managed directly by the Company or by the financial advisers themselves.
Personal Financial Advisers Network - assets (Amounts in € thousand)
12.31.2013 % 12.31.2012 % CHANGE %
Current accounts in euro, foreign currencies, repos and deposit account 8,709,498 24.1% 8,207,751 25.2% 501,747 6.1%
DIRECT DEPOSITS 8,709,498 24.1% 8,207,751 25.2% 501,747 6.1%Segregated accounts 41,901 0.1% 211,267 0.6% (169,366) -80.2%
UCITS and other investment funds 17,344,996 47.9% 14,617,192 45.0% 2,727,804 18.7%
Insurance products 1,703,434 4.7% 1,611,812 5.0% 91,622 5.7%
ASSETS UNDER MANAGEMENT 19,090,331 52.7% 16,440,271 50.6% 2,650,060 16.1%Government securities, bonds and stocks 8,392,123 23.2% 7,866,546 24.2% 525,577 6.7%
ASSETS UNDER ADMINISTRATION 8,392,123 23.2% 7,866,546 24.2% 525,577 6.7%TOTAL ASSETS 36,191,952 100.0% 32,514,568 100.0% 3,677,384 11.3%
Commercial activities and development of new products and services (Continued)
The financial advisers network
The table above shows the breakdown of the managed assets attributable to the personal financial advisers network as at
December 31, 2013. Total assets, amounting to €36,192 million, increased by 11.3% compared to December 31, 2012.

25FinecoBank · The Annual Report and Accounts as at December 31, 2013
Personal Financial Advisers Network - total net deposits (Amounts in € thousand)
FY 2013 % FY 2012 % CHANGE % CHANGE
Current accounts in euro, foreign currencies, repos and deposit account 429,446 16.8% 1,014,751 51.1% (585,305) -57.7%
DIRECT DEPOSITS 429,446 16.8% 1,014,751 51.1% (585,305) -57.7%Segregated accounts (167,871) -6.6% (140,970) -7.1% (26,901) 19.1%
UCITS and other investment funds 2,582,231 101.3% 2,018,315 101.7% 563,916 27.9%
Insurance products (23,595) -0.9% (276,573) -13.9% 252,978 -91.5%
ASSETS UNDER MANAGEMENT 2,390,765 93.8% 1,600,772 80.6% 789,993 49.4%Government securities, bonds and stocks (270,881) -10.6% (630,353) -31.8% 359,472 -57.0%
ASSETS UNDER ADMINISTRATION (270,881) -10.6% (630,353) -31.8% 359,472 -57.0%TOTAL NET DEPOSITS - PFA NETWORK 2,549,330 100.0% 1,985,170 100.0% 564,160 28.4%
Net deposits for the year increased considerably compared to the previous year (+28.4%), with significant growth in assets under management (+49.4%).
Composition of Total Stock of Assets PersonalFinancial Advisers Network as at December 31, 2013 (%)
47.3
4.7
52.7
0.1
47.9
Administred/DirectManaged
FundsFunds/Real Estate MgtInsurance
Composition of Total Stock of Assets PersonalFinancial Advisers Network as at December 31, 2012 (%)
49.4
5.0
50.6
0.6
45.0
Administred/DirectManaged
FundsFunds/Real Estate MgtInsurance

26
Report on Operations
The Annual Report and Accounts as at December 31, 2013 · FinecoBank
Operating structure
At the end of 2013, FinecoBank’s workforce consisted of 976 people, 27 more than the 949 as at December 31 2012, an increase of 2.8%. The breakdown is shown in the table below:
HUMAN RESOURCES 12.31.2013 12.31. 2012
FinecoBank employees 965 931
Workers with atypical contracts* (+) 1 3
Group employees seconded to FinecoBank (+) 4 9
FinecoBank employees seconded to the Group (-) (2) (1)
Total human resources excluding Directors 968 942Directors (+) 8 7
Total human resources 976 949
* 1 project-based staff member as at December 31 2013, 1 project-based staff member and 2 temporary staff members as at December 31 2012.
As in previous years, the workforce was consolidated and optimised in 2013. 72 people were hired during the year, of which 11 from other Group Companies and 61 from the market.Of the 61 new recruits from the market, over half were employed in the CRM area. These were mainly young graduates, who are offered the chance to start a process of professional development, which allows them to get to know the company and puts them in a position, going forward, to be able to take on different positions with increasing responsibility.In 2013 there was significant use of internal job rotation, which involved 75 people. This system provided cover for vacant positions in the Company, while also ensuring on-going professional development of personnel.
In 2013, a total of 38 people left the bank, of which:- 16 due to resignations;- 17 due to transfers to Group companies.
The total staff turnover rate was 11.6%.
The Bank’s workforce can be broken down as follows:
As at December 31 2013 part-time staff totalled 65, accounting for 6.7% of the workforce, with the female employees representing around 42.6%. The number of female Managers and Senior Managers increased by 18.5% compared to the previous year.Average staff seniority was 6.6 years, while the average age was approximately 38 years.
Employee trainingWhen suitably structured and integrated into human resource development systems, employee training is a fundamental tool for acquiring and consolidating the distinctive skills of each role, required to meet company needs. In 2013, approximately 20,000 hours of training were delivered, covering the entire company population.The details are shown below:
TRAINING AREA HOURS OF TRAINING
Mandatory 2,967
Technical 6,856
Foreign Language 8,890
Behavioural/Managerial 1,149
Total 19,862
Mandatory trainingIn 2013, the Bank continued its focus on mandatory training required for all its employees. The attendance of all mandatory courses was constantly monitored though the Group UCILearning Platform.In collaboration with the Compliance Officer, the mandatory course on the Anti-Money Laundering Service. The “Suspicious transaction reporting” module was re-tailored to the specific features of the Bank. As a result of this change, a new online course (“Advanced Anti-Money Laundering”) was produced and launched in the second half of the year, which is mandatory for all employees.Again in collaboration with the Compliance Officer, training was intensified on compulsory regulations by organizing specialised classroom-based training courses for Managers and people most affected by the subjects covered by the courses (“Anti-money laundering and combating the financing of terrorism”).
Human resources
CategoryMEN WOMEN TOTAL
12.31.2013 12.31.2012 12.31.2013 12.31.2012 12.31.2013 12.31.2012
Senior Managers 20 18 3 2 23 20
Managers 195 189 74 63 269 252
Professional Areas 339 332 334 327 673 659
Total 554 539 411 392 965 931
27FinecoBank · The Annual Report and Accounts as at December 31, 2013
Technical trainingDuring the year, specialised training sessions were organised for the acquisition of technical skills needed to improve company productivity and the level of employee specialisation. In the Customer Care area, approximately 2,000 hours of training courses were held for “new recruits” on technical subjects, as well as “on-going” training courses on technical and behavioural subjects (relating to Communication and Service), with a view to maintaining high quality service standards and a constant customer focus. Training on Microsoft Office, which began in 2011, continued, with specific training labs on Excel, Word and PowerPoint, which are all widely used by Bank staff.In addition, all employees were involved in training sessions on the Evaluation System, to clarify objectives, stages and particular aspects. Training was on a voluntary basis and was held by staff from the Human Resources Department.Particular attention was paid to specialist training for all employees, with the aim of guaranteeing on-going updates concerning laws, processes and procedures.The Bank’s Business Continuity training plan continued, with on-the-job training throughout the year, certified in company registers.
Foreign language trainingFinecoBank continued its major focus on language training, also in view of its international operating environment. Around 240 employees participated in English courses (classroom or telephone courses), considering the importance of English in their work. Senior Managers received “one-to-one” training courses in Business English. German courses continued for around 30 employees.
Management trainingIn 2013, FinecoBank continued to invest in middle management and in specific categories of employees (Executives, Talents), with a view to supporting the development of management skills through highly-focused courses on subjects such as leadership, team management, emotional skills, time management, and problem-solving.
Trade union relations2013 was marked by events that strained trade union relations at all levels. Following the Italian Banking Association’s announcement last September that it was cancelling the Collective Labour Agreement for the Sector, the General Secretaries of Trade Unions made the freeze on industrial relations, nationwide and for all Companies, official. Only in the last few days of the year was an agreement reached to resume negotiations, at a national, Group and company level.

28
Report on Operations
The Annual Report and Accounts as at December 31, 2013 · FinecoBank
Operating structure (Continued)
The Bank’s architectural technology has been designed to provide services with a view to Business Continuity, so as to give customers the best level of service possible, at all times, minimising technological and/or operating discontinuity.
FinecoBank develops internally all the transactional and investment platforms offered to customers, the network of promoters and applications that enable banking operations and trading in securities through the mobile channel, in managing the entire technological infrastructure it employs in substantial independence.
The information system of FinecoBank is comprised of six essential elements:- banking application software;- On-line Trading system (dedicated applications for the real-time
sale/purchase of securities and financial instruments on the main European and American markets);
- a management system for the operations room and for institutional investors, and access to the information/order sections of numerous Italian/foreign markets;
- a management system for investment services such as Funds, SICAVs and Bank Insurance;
- a credit card management system, with the issue of cards for VISA and MasterCard circuits, and processing of relative transactions;
- a personal financial advisers network management system, enabling advisers to operate together on all FinecoBank products through a single portal.
In 2013, the ICT Area carried out technological upgrading, consolidation and development of the Information System in order to provide new and more versatile added value services to customers.Specifically, from an architectural perspective, work continued on optimising infrastructure and applications, as well as the continuous improvement and fine-tuning of the applications security architecture.
Technology infrastructure

29FinecoBank · The Annual Report and Accounts as at December 31, 2013
FinecoBank has an internal control system to guarantee the sound and prudential management of the Bank’s activities, while also achieving company objectives, specifically monitoring risks and basing operations on criteria of fairness. The internal control system comprises rules, procedures and organisational structures that involve all company levels, established to achieve the objectives of effective, efficient company processes (administration, production, distribution processes, etc.), safeguarding the value of activities and protecting from losses, ensuring the reliability and integrity of accounting and operating information, the compliance of operations with laws in force, as well as with policies, plans, regulations and internal procedures, and the consistency of organisational monitoring as regards developments of company strategies and changes in the reference context. The internal control system is based on four types of controls:• The first level controls are incorporated into operating
procedures and are known as “line controls”. These controls are consequently included in the Services and Bank segments responsible for performing various work tasks by following specifically created executive procedures. To ensure efficient performance of these controls, the procedures have been formally set out in internal regulations, which have been documented and published on the Bank’s Intranet in order to facilitate access by staff to the instructions issued by the Bank. Monitoring and continuously updating these processes is entrusted to “process supervisors” who are charged with devising controls able to ensure the proper performance of daily activities by the staff concerned, as well as the observance of any delegated powers. Formal processes regard both customer contact (financial advisers) and head office functions.
• Second level controls are associated with day-to-day operations applied to quantifiable risks; they are carried out on an on-going basis by functions separate from operating functions. Controls of market, credit and operational risks, as regards compliance with limits assigned to operating functions and the consistency of operations of individual production areas with established risk/yield objectives, are assigned to the “Risk management” function which operates according to methodologies issued by the Parent Company; controls on compliance risk are usually managed by the Compliance function, which operates according to a Competence Line model, centralised at the Parent Company, with a Compliance Manager monitoring risk at the Bank and applying Group methodologies to evaluate and monitor compliance risk.
- Third level controls are associated with internal auditing, based on analysis of information from databases or company reports and on-site inspections, also among financial advisers, conducted with the aim of assessing the functionality of the overall internal control system and identifying any anomalies and infringement of procedures and regulations. These controls
are assigned to the “Internal Audit” function, centralised at the Parent Company, that operates on the basis of a specific service agreement.
• Lastly, institutional supervisory controls, including those of the Board of Statutory Auditors and the Supervisory Body pursuant to Legislative Decree 231/2001, are also included.
The following organisational structures are involved in defining and managing the internal control system:
Corporate bodies• The Board of Directors, responsible for approving strategic
guidelines and risk management policies, as well as the organisational structure of the Bank, approves the internal control system structure. It periodically evaluates the functionality, effectiveness and efficiency of the internal control system, promptly adopting corrective measures for deficiencies and/or anomalies identified by control functions. In particular, the Board promotes a company culture that empowers controls, in compliance with the indications and principles contained in the Supervisory Instructions; it defines and approves the strategies for identifying and evaluating risk; it approves strategic guidelines and risk management policies; it approves the Bank’s organisational structure, ensuring that duties and responsibilities are clearly and appropriately assigned - as regards authorisation mechanisms in particular - also providing the means for controlling delegated powers; it ensures that the Managing Director defines the internal control system in line with the risk appetite selected; it checks that control functions have an appropriate degree of autonomy within the structure, ensuring that adequate resources are provided for its proper functioning; it checks that relative structures have defined an information system that is correct, complete and timely; it periodically evaluates the functionality, effectiveness and efficiency of the controls system, promptly taking action in the event of deficiencies and/or anomalies.
• To assist the Board in its duties, an Audit Committee, appointed by the Board of Directors and comprising non-executive board directors has been established. The Audit Committee, which has information, advisory, recommendation and investigation functions, operates using a risk-oriented approach, to identify the guidelines for the entire internal control system and assess its effectiveness and efficiency, so that main risks are correctly identified, and adequately measured, managed and monitored, while the Board of Directors still has responsibility for all relative decisions. The Audit Committee has the following duties, among others: as regards the model for outsourcing audit activities, adopted by the Bank, it acts as an interface between the Bank and audit function, centralised at the Parent Company, in keeping with indications of the Supervisory Authority; it ensures that service levels regulated by the audit outsourcing agreement are
Internal control system

30
Report on Operations
The Annual Report and Accounts as at December 31, 2013 · FinecoBank
Operating structure (Continued)
complied with at all times, assisting the Board of Directors in evaluating the adequacy of the service and checking that audit activities conducted by the internal audit function are mainly based on risk assessment analysis, updated on an on-going basis. The Audit Committee also: helps identify internal control system guidelines, based on a risk-oriented approach, so that main risks concerning the Company are correctly identified and adequately measured, managed and monitored; reports to the Board of Directors, at least every six months, when the financial statements and interim financial statements are approved, on activities carried out, and also describes the essential elements of the internal control system, rating its adequacy, effectiveness and actual functioning; evaluates the guidelines and annual plan for controls prepared by the internal audit function, and checks compliance; examines periodic reports and audit reports produced by the internal audit function, and evaluates any findings, following actions taken to remedy deficiencies/anomalies identified, as well as the implementation of corrective measures proposed and adoption of suggested recommendations; it evaluates the adequacy of accounting standards used and their uniformity for preparing the consolidated financial statements, in conjunction with the company financial reporting officer and external auditors; on specific request of the Board of Directors, it evaluates related-party transactions, as well as transactions in which conflicts of interest exist directly or indirectly.
• The Managing Director has the following duty, among others: establish a company configuration that ensures compliance with all laws and regulations comprising the legal/corporate and regulatory framework of the Company, including guidelines from the Board for a code of ethics to adopt in the Company, with the contribution of all personnel; arrange necessary measures to ensure that an efficient and effective Internal Controls System is established and maintained; ensure effective risk management of nonconformities.
• The Board of Statutory Auditors, without prejudice to any other or more specific duty and power assigned to it by primary and secondary laws and regulations in force, monitors compliance with laws, regulations and the Articles of Association, as well as the correct administration, adequacy of organisational and accounting arrangements of the Bank, of the risk management and control system, as well as the functioning of the overall internal control system. The Statutory Board of Auditors, in carrying out its duties, works with the Internal Audit function and Audit Committee, on the basis of continual dialogue and the proactive exchange of information. The Statutory Board of Auditors also works with the External Auditors, the Compliance Manager and the Anti-Money Laundering Function Manager.
Control Functions• The Internal Audit function, pursuant to supervisory regulations
for banks, is independent of other company functions and reports directly to the Board of Directors (also through the Audit Committee) and to the Board of Statutory Auditors on a quarterly basis as regards its activities; it also attends Audit Committee meetings, which are usually held monthly. According to the UniCredit group’s organisational model, the Internal Audit function is outsourced to the Parent Company based on a specific service agreement that regulates its activities. This ensures the uniform application of Group audit methods. The purpose of audits is to provide an independent assessment of the adequacy and functionality of the Bank’s internal control systems (line or operating controls, or risk management controls), by evaluating the efficiency and effectiveness of information systems, organisational processes and company procedures, as well as the models and mechanisms for controlling and managing risks, including compliance risk. The methodology used is based on the following main stages: definition of the “Audit Universe”, i.e. organisational and process analysis to identify elements involved in audit activities; Risk Assessment, i.e. identifying, assessing and measuring risks to which elements of the “Audit Universe” are exposed; defining the annual audit plan, on the basis of risk assessment results; the plan establishes the objectives, type and frequency of audits and resources to use. Audits, of Bank processes, and the personal financial advisers network, may be conducted: remotely - mainly using electronic data extractors, to identify potential risks situations that may require further investigation in situ; in situ - with inspections at the offices and organisational units of Fineco, using conventional audit techniques such as document control, interviews and sampling; through particular investigations - concerning individual conduct or types of operations. After completing audits and based on findings, the Function makes suggestions to relevant company structures; the resolution of identified anomalies and deficiencies is monitored by a systematic audit tracking process, and in the case of particular risk situations and/or internal control system weaknesses, by a specific follow-up. The annual evaluation of the Company’s internal control system, conducted by the Internal Audit function, based on evidence of audits conducted from 2010-2012, has always been “satisfactory”.
• The Risk Management function prevents and monitors different components of Bank risks. The function specifically controls credit, market and operational risks to which the Bank is exposed. The Risk Management function also monitors business, reputation and liquidity risks.

31FinecoBank · The Annual Report and Accounts as at December 31, 2013
The function supports the Chief Risk Officer (CRO), in the area of responsibility of the Department, in monitoring and reporting to Corporate Bodies (Managing Director, Board of Directors, Audit Committee and Statutory Board of Auditors) and to the Risk Committee1.The Risk Management function also develops the ICAAP - Internal Capital Adequacy Assessment Process, in compliance with the Basel regulatory framework and Parent Company regulations.Specifically, the function has the following main duties: implement processes and activities for better risk control in compliance with regulations, instructions of the Parent Company and indications from the Board of Directors; define methodologies and tools to control different types of risk and coordinate risk control teams; put in practice Parent Company policies, ensuring they are adopted within the Bank; ensure that operating limits comply with proposals made to the Managing Director and CRO to change risk reduction measures; validate and verify that information flows periodically sent to the Parent Company are complete and correct, in order to calculate regulatory capital, where required, and Pillar 2 capital; monitor and carry out sensitivity analysis of the banking portfolio, as part of the measurement of liquidity risk, and control relative information flows to the Parent Company; with reference to Basel II obligations (ICAAP), evaluate the Bank’s risk profile and measure risk, in conjunction with the Parent Company, in order to evaluate capital adequacy and monitor risk appetite; with reference to the management of market and operational risk, define mitigation and hedging policies; with reference to Basel II obligations (ICAAP) and the management of credit risk, monitor the application of credit strategies and polices established by the Parent Company.Reporting to corporate bodies consists of the quarterly report on the Bank’s risk exposure; specific reporting is also prepared for the Risk Committee, containing operating information in relation to key risk indicator performance and consequent corrective measures.
• The Compliance function manages compliance risk through: - Proactive and on-request advice concerning laws,
regulations, codes, practices, products, business lines and existing, proposed or future geographic monitoring, including the implementation of organisational structures.
- Communication concerning (i) the issue of guidelines, procedures, memos, notes and opinions, as well as (ii) updates and training for employees on Compliance, on areas in its responsibility (iii) the promotion of a culture that fosters compliance with standards, internal regulations and Global Rules of the Group.
- Monitoring, surveillance and reporting, with second level controls to identify compliance risks (“Compliance Risk
Assessment”), classify these risks, remotely track them, monitor identified criticalities as well as start escalation procedures to remedy them and provide advice/information and reporting for corporate bodies concerning this risk.
- Work with authorities, within its area of responsibility, in managing / being involved in requests, inspections, self-assessment and consultations set up by the Supervisory Authorities, and in developing and managing relations with these Authorities.
- Involvement in Group projects and work teams, within its areas of responsibility, if requested.
According to the organisational model adopted by the UniCredit group, FinecoBank’s Compliance function is centralised at the Parent Company based on a specific service agreement. The position of Compliance Manager has been established at Fineco, and is responsible for assisting the Company, corporate bodies and personnel in managing compliance risk, by: - mapping compliance risk relative to each regulatory area,
within the responsibility of the function; conducting self-assessment of the compliance level, and defining and monitoring risk mitigation actions;
- carrying out second level controls to verify the correct application of procedures to monitor risk compliance;
- assisting the Group Compliance Manager and the Bank’s operating and business structures in assessing the impact of compliance risk on regulations, due to the introduction of new services, products, processes and business initiatives.
The main areas of responsibility of the function refer to regulations on: banking and financial services, banking transparency and consumer credit, consumer protection, credit brokerage, usury, payment services, privacy, company liability for offences committed by employees in the interest of the company, anti-money laundering and combating the financing of terrorism, sanctions and embargoes, corruption and the unlawful receipt of goods, money or other utilities, antitrust, investment services and activities, management of conflicts of interest in the Group, regulations on financial instrument markets, the centralised management of financial instruments, the placement of financial instruments, market abuse, the promotion and distribution of (financial and non-financial) insurance products, material equity investments, risk activities as regards related parties and equity investments held by banks and banking groups.The Compliance function includes the Anti-Money Laundering Service, responsible for managing the correct application of regulations on anti-money laundering and combating the financing of terrorism.
1. The Risk Committee, composed of the Managing Director, Head of GBS, CFO, CRO, Head of the Risk Management Unit, Head of the Legal & Corporate Affairs Unit, Head of the Human Resources Unit, Head of the Compliance Officer Unit, Head of Information Security & Fraud Management, and CAE, performs advisory and recommendation functions, to aid the decisions of Managing Director with regard to the strategic guidelines and policies related to any type of risk, within the scope of the instructions issued by the Parent Company.
32
Report on Operations
The Annual Report and Accounts as at December 31, 2013 · FinecoBank
Operating structure (Continued)
For more details of the risks and uncertainties handled by the Bank in the current market situation, reference is made to
Part E - Information on risks and hedging policies of the Notes to the Accounts.
Organisational structure
The organisational structure of the Bank is consistent with the Group Organization Guidelines issued by the Parent Company UniCredit S.p.A.The Guidelines set out organisational principles and rules designed to ensure their uniform application across all Group Legal Entities.
The Group Organization Guidelines set out structured organisational rankings on four levels (Division, Department, Unit and Team) based on their size and the organisational complexity of the operations overseen.
In the first half of 2013, the Network Services Department switched to directly reporting to the Managing Director, in order to provide adequate support for second level controls of the activities of financial advisers. In the previous organisational model, the Network Services Department reported directly to the Head of the Global Banking Services (GBS) Department. In addition:- “Network Services” has been renamed “Network Controls,
Monitoring and Services”);- the “Commercial Monitoring, Incidents and Controls” Unit has been
divided into two new Units: a) “Commercial Monitoring”, responsible for monitoring network
development and composition, and the relative economic impact; b) “Incidents & Controls”, responsible for analysing reports of
anomalous conduct of individual advisers, identified from controls by Risk Management, Information Security and Fraud Management Team, the Compliance Manager and other Bank departments.
The Complaints Unit now reports directly to Legal & Corporate Affairs.
Main risks and uncertainties
Organisational Model
The current organisational structure adopted by FinecoBank of the functional type.A functional model promotes the seeking of economies of scale and facilitates the development of skills and vertical knowledge within each area. The model guarantees the necessary decision-making mechanisms, whist maintaining the “horizontal link” between the various functions. Although the current arrangement applies the concept of “functional” specialisation, a project-based approach is maintained for every phase of definition and release of products and services.The horizontal links are guaranteed by the work of specific committees that monitor business lines and the progress of the most important projects, also to guarantee the necessary synergies of distribution channels.Based on the Guidelines issued by the Parent Company UniCredit S.p.A., under the organisation model all structures of the Bank interact with the corresponding functions of the Parent Company through the Group managerial/functional system, which assigns the Managers of the Parent Company departments specific responsibilities in relation to the corresponding functions of the Bank.
The organisational model identifies four functional lines, which govern:- the sales network- investment services- direct banking - operational functioning;

33FinecoBank · The Annual Report and Accounts as at December 31, 2013
The PFA Commercial Network Department has been set up, reporting directly to the Managing Director. This Department heads the “Commercial Support”, “Territorial Coordination” and “PFA Network Hiring, Professional Development & Training” Units, with the goal of ensuring the correct flow of information on products and services and overseeing geographical coordination and the selection and training of the Sales Network. The Investment Services Department, the Direct Banking Department and the GBS Department also report to the Managing Director. The Investment Services Department is responsible for monitoring the development of products placed by the Bank and the advisory services provided to all Customers.The Direct Banking Department is responsible for monitoring the development of new products and services in Brokerage and Banking and establishing the methods for their distribution through direct channels (online and mobile).
The Investment Services and Direct Banking Departments work closely with each other in order to develop a combined and synergistic offering of products and services to customers, in line with the Bank’s marketing and business strategies.The GBS Department coordinates the organizational units in charge of monitoring the organizational/operating processes and the IT and logistics systems needed to ensure the effective and efficient operation of business support systems. The following report to the GBS Department: ICT - Information & Communication Technology, the Information Security & Fraud Management Team, CRM - Customer Relationship Management, Bank Organization & Operations and Securities Trading, the Network Logistics Unit and the General Services Unit.
The synergies between the distribution channels and the monitoring of cross-cutting decision-making processes are
ensured by a Management Committee, which assists the Managing Director.
The Chief Financial Officer (CFO), Chief Risk Officer (CRO), Legal & Corporate Affairs Department, Network Controls Department, Monitoring and Network Services Department, Human Resources Unit, Identity & Communications Team and the Compliance Unit also report to the Managing Director.
As regards the Compliance Unit, which assists the Company, Corporate Bodies and personnel in managing compliance risk, the Banking Group the Bank belongs to has adopted an organizational model which centralizes the compliance activities of Italian Banks at the Parent Company.This model, in compliance with indications from the Bank of Italy, defines an agreement to outsource the compliance function and appoint a Manager within the Bank.For this purpose, a Unit has been established to provide ongoing support for the Compliance Group Manager, and specifically as regards the adoption within the company of management policies established at Group level.
Lastly, as regards audit activities, FinecoBank, in line with the instructions of the Parent Bank, has adopted an outsourcing method based on a specific service agreement signed with UniCredit. Under the model, the Audit Committee has been established, liaising with the Bank and UniCredit, in addition to supporting the Board of Directors - with information, advisory, recommendation and investigation functions - using a risk-oriented approach to identify the guidelines for the entire internal control system and the assessment of its effectiveness and efficiency.

34
Report on Operations
The Annual Report and Accounts as at December 31, 2013 · FinecoBank
Operating structure (Continued)
MANAGING DIRECTOR
CHAIRMANBoard of Directors
AUDIT COMMITEE
IDENTITY & COMMUNICATION
UNIAUDIT
LEGAL & CORPORATE AFFAIRS
CHIEF RISK OFFICE
CHIEF FINANCIAL OFFICE
HUMAN RESOURCES
COMPLIANCE OFFICER
NETWORK CONTROLS,
MONITORING AND NETWORK SERVICES Anti-Money
laundering and Anti-Terrorism Office
Legal AffairsHead Office
Risk Function
Treasury
Corporate Affairs
Complaints
Risk Management
Commercial Monitoring
Commissioning and Network Assistance
Legal PFA Network
Information Security & Fraud Mgt.
Personal loans and Credit Cards
Financial Reports and Regulatory
Reporting
Administration Banking and PFA
Network
Tax Affairs
Administration Trading and
Intermediation
Planning and Management Control
Loans and Head Office Branch
HR Management, Planning &
Professional Development
HR Planning, Legal/ Labor Relations &
Administration
CUSTOMER RELATIONSHIP MANAGEMENT
BANK ORGANISATION & OPERATIONS
SEURITIES TRADING
- ICT Coordination and Planning- On-line Banking Development- TLC Networking - On-line Trading Development- Back Office Development - Datawarehouse - Banking Development- Order Routing Development- Insurance Banking Development - On-line Architectures- Windows Architectures- Legacy Systems- Data Center Management- On-line Operations- Investing and Network Development
- Customer Business Development- Market Trading Support- Customer Care
- Operational Developments- Organisation, Sizing and Process Development- Business Process Re-engineering & PMO - Payment Systems - Banking and Network Operations- Insurance and Pension Fund Operations- E-money
- Back Office Institutional Securities - Back Office Retail Securities
NETWORK LOGISTICS
GENERAL SERVICES
GBS DEPT.*
Territorial Coordination
Commercial Support
PFA Network Hiring, Professional Development & Training
PFA Network
PFA COMMERCIAL
NETWORK DEPT.
Events
Investment Products and Third-Party Relations
Advice
Markets
Marketing
Products
International Projects & Business Implementation
DIRECT BANKING DEPT.
-
Chairman
Managing Director
Department
Unit
Team
Network
* Position held by the Deputy General Manager
The organisational structure of FinecoBank is as follows:
Incidents and Controls
Legal Searches
INVESTMENT SERVICES DEPT.
ICT DEPARTMENT

35FinecoBank · The Annual Report and Accounts as at December 31, 2013
As required by the applicable regulations, the Bank has adopted a model that comprises organisational units dedicated to managing Business Continuity and Crises, both in normal operating conditions and in emergency situations.FinecoBank’s Business Continuity and Crisis Management framework includes the Business Continuity Plan (hereinafter also “BCP Plan”), the Disaster Recovery Plan (hereinafter also “DR Plan”), the Pandemic Management Plan and the Crisis Management Plan. These plans describe how crises are to be managed in FinecoBank and/or how the impacts on the UniCredit group are to be managed through predefined
“stages”, made up of objectives, activities and expected results. In particular, the BC Plan sets out the strategies and procedures adopted by the Bank to guarantee the continuity of critical services in emergencies, while the DR Plan (incorporated in the BC Plan) establishes the measures to recover applications and information systems hit by “disaster”. To guarantee the effectiveness and adequacy of the BC and DR plans, identifying any areas for improvement, test plans were drawn up at the start of 2013, with tests carried out during the year. Outcomes were positive.
Business Continuity Plan (BCP)

36
Report on Operations
The Annual Report and Accounts as at December 31, 2013 · FinecoBank
Main balance sheet aggregates
(Amounts in € thousand)
ASSETS 12.31.2013 12.31.2012
CHANGES
AMOUNT %
Cash and cash equivalents 5 7 (2) -28.6%
Financial assets held for trading 4,700 7,589 (2,889) -38.1%
Loans and receivables with banks 16,330,912 17,271,573 (940,661) -5.4%
Loans and receivables with customers 641,250 553,606 87,644 15.8%
Financial investments 93,114 69,430 23,684 34.1%
Hedging instruments 179,265 73,745 105,520 143.1%
Property, plant and equipment 10,772 8,700 2,072 23.8%
Goodwill 89,602 89,602 - -
Other intangible assets 8,014 8,177 (163) -2.0%
Tax assets 67,934 46,299 21,635 46.7%
Other assets 256,629 162,042 94,587 58.4%
Total assets 17,682,197 18,290,770 (608,573) -3.3%
(Amounts in € thousand)
LIABILITIES AND SHAREHOLDERS’ EQUITY 12.31.2013 12.31.2012
CHANGES
AMOUNT %
Deposits from banks 1,648,675 2,065,153 (416,478) -20.2%
Deposits from customers and debt securities in issue 15,054,820 15,339,334 (284,514) -1.9%
Financial liabilities held for trading 2,301 7,177 (4,876) -67.9%
Hedging instruments 178,574 73,251 105,323 143.8%
Provisions for risks and charges 109,354 103,085 6,269 6.1%
Tax liabilities 37,701 66,588 (28,887) -43.4%
Other liabilities 231,623 188,714 42,909 22.7%
Shareholders’ equity 419,149 447,468 (28,319) -6.3%
- capital and reserves 329,719 318,309 11,410 3.6%- revaluation reserves for available-for-sale financial assets 641 285 356 124.9%- revaluation reserves actuarial gains (losses) from defined
benefit plans 3,573 3,407 166 4.9%- net profit 85,216 125,467 (40,251) -32.1%Total liabilities and shareholders’ equity 17,682,197 18,290,770 (608,573) -3.3%
Comparative data as at December 31, 2012 have been restated to reflect the effects of the application of IAS 19R, as described in Part A - Accounting Policies of Section 2 - General Criteria for preparing the Notes to the Accounts.

37FinecoBank · The Annual Report and Accounts as at December 31, 2013
Financial assets held for trading
Financial assets held for trading consist of:• bonds, equities and Units in investment funds classified as Fair
Value Through Profit or Loss (FVTPL), amounting to €2 million, held in the Bank’s portfolio as a result of trading activity, and intended to be traded in the short term;
• the positive valuation of spot contracts for securities in the HFT portfolio and currencies to regulates in times established by market practices (“regular way”) for €1.8 million, which correspond to negative valuations booked under item 40 “Financial liabilities held for trading”;
• the positive valuation of CFDs on indices and Forex for €0.9 million.
CFDs on indices and currencies are “Over the counter” derivative contracts that require the payment of a differential generated by the difference between the opening and closing price of the financial instrument. The bank in operational terms covers the imbalance of customer positions, by underwriting futures on the indexes underlying the CFDs on indices, or through Forex transactions with institutional counterparties to hedge CFD transactions in open currencies with customers’ currency; consequently, the positive valuation booked under “Financial assets held for trading” more or less balanced the negative valuations booked under “Financial liabilities held for trading”.
Loans and receivables with banks (Amounts in € thousand)
12.31.2013 12.31.2012
CHANGES
AMOUNT %
Current accounts and demand deposits 9,433,356 8,473,441 959,915 11.3%
Time deposits 3,563,334 4,385,279 (821,945) -18.7%
Other loans:
1 Reverse repos 5,584 182,274 (176,690) -96.9%
2 Other 6,022 4,672 1,350 28.9%
Debt securities 3,322,616 4,225,907 (903,291) -21.4%
Total 16,330,912 17,271,573 (940,661) -5.4%
Loans and receivables with banks for current accounts and demand deposits mainly consist of accounts held with UniCredit S.p.A., with a book value of €9,415 million and to a lesser extent, by current accounts held with non-Group Banks for transactions in securities.The time deposits recognised under assets consist of the deposit held with UniCredit S.p.A. for compulsory reserves, with a book value of €124 million, in addition to time deposits held with UniCredit S.p.A. of €3,439 million, opened to employ the funds collected through repos and CashPark transactions with retail customers and repos with credit institutions in the same time-frame.In the item Other Loans, the item Other relates to the amount of the initial margins placed with credit institutions from derivative transactions as well as from current receivables associated with the provision of financial services.
The debt securities held in the portfolio are mainly represented by debt securities issued by the Parent Company, and amount to €3,323 million. They were subscribed in order to invest liquid funds and to be used for repos with retail customers.
In September debt securities held by Fineco and issued by UniCredit S.p.A. were sold to UniCredit S.p.A. for a book value of €750 million; at the same time securities issued by FinecoBank and subscribed by UniCredit S.p.A. were repurchased for the same amount. The transaction also resulted in the closure of the related hedging derivatives and the recognition in the income statement of changes in fair value of portfolio-hedged items.

38
Report on Operations
The Annual Report and Accounts as at December 31, 2013 · FinecoBank
Main balance sheet aggregates (Continued)
Loans and receivables with customers, amounting to €641 million, can essentially be broken down as follows:• €422 million in loans to ordinary customers; • €121 million in reverse repos;• €32 million in collateral deposits, initial and variance margins with
clearing houses for derivative transactions;• €66 million relating to current receivables associated with the
provision of financial services.
Reverse repos are represented by “Multiday leverage” transactions, securities lending transactions guaranteed by sums of money readily available to the lender and which are basically the equivalent of repos on securities. Other loans mainly consist of collateral deposits, initial and variance margins with clearing houses for derivative transactions, mostly on behalf of third parties, as well as current receivables associated with the provision of financial services.
Loans and receivables with customers (Amounts in € thousand)
12.31.2013 12.31.2012
CHANGES
AMOUNT %
Current accounts 101,195 68,683 32,512 47.3%
Reverse repos 120,860 100,783 20,077 19.9%
Mortgages 76 65 11 16.9%
Credit cards and personal loans 319,087 301,766 17,321 5.7%
Other loans 100,031 82,308 17,723 21.5%
Debt securities 1 1 - 0.0%
Total 641,250 553,606 87,644 15.8%
(Amounts in € thousand)
LOANS AND RECEIVABLES WITH CUSTOMERS(MANAGEMENT RECLASSIFICATION) 12.31.2013 12.31.2012
CHANGES
AMOUNT %
Current accounts 98,455 66,117 32,338 48.9%
Impaired current accounts 2,740 2,566 174 6.8%
Use of credit cards 219,010 193,168 25,842 13.4%
Use of impaired credit cards 130 134 (4) -3.0%
Impaired mortgages 76 65 11 16.9%
Personal loans 98,241 106,929 (8,688) -8.1%
Impaired personal loans 1,706 1,535 171 11.1%
Other loans 1,402 1,229 173 14.1%
Other impaired loans 24 22 2 9.1%
Ordinary loans and receivables with customers 421,784 371,765 50,019 13.5%Reverse repos 120,804 100,686 20,118 20.0%
Reverse repos - impaired 56 97 (41) -42.3%
Collateral deposits and initial and variation margins 32,007 22,563 9,444 41.9%
Current receivables associated with the provision of financial services 66,598 58,494 8,104 13.9%
Debt securities 1 1 - 0.0%
Loans and receivables with customers 641,250 553,606 87,644 15.8%
The ordinary customer loan portfolio mainly consists of receivables for personal loans, current accounts and credit card use; overall, loans to ordinary customers increased by 13.5%,
due to a greater use of current account credit lines and credit cards with full payment of the balance at term.

39FinecoBank · The Annual Report and Accounts as at December 31, 2013
Impaired assetsThe amount of impaired loans net of impairment losses was €4.7 million, €3.2 million of which in non-performing loans, €0.7 million in doubtful loans and €0.8 million in past-due loans. Impaired loans mostly relate to current account overdrafts, credit card use and personal loans.
Impaired customer loans represent 1.12% of ordinary customer loans, down against the figure of 1.19% as at December 31, 2012.
(Amounts in € thousand)
CATEGORY
GROSS AMOUNT IMPAIRMENT PROVISION NET AMOUNT
12.31.2013 12.31.2012 12.31.2013 12.31.2012 12.31.2013 12.31.2012
Non-performing loans 17,664 14,985 (14,387) (11,852) 3,277 3,133
Doubtful loans 2,065 1,384 (1,392) (948) 673 436
Past-due loans 1,444 1,529 (663) (678) 781 851
Total 21,173 17,898 (16,442) (13,478) 4,731 4,420
Financial investments (Amounts in € thousand)
12.31.2013 12.31.2012
CHANGES
AMOUNT %
Financial assets at fair value through profit or loss 3,199 10,516 (7,317) -69.6%
Available-for-sale financial assets 89,915 58,914 31,001 52.6%
Total 93,114 69,430 23,684 34.1%
Financial assets at fair value through profit or loss consist solely of debt securities issued by banks with a book value of €3.2 million, of which €1.2 million of bonds issued by UniCredit S.p.A..
Available-for-sale financial assets comprise debt securities issued by the Italian Central Government, with a book value of €80 million, debt securities issued by the French Central Government, with a book value of €10 million and investments in companies in which the Bank does not exercise control or significant influence, amounting to
€5 thousand, including the 20 shares of UniCredit Business Integrated Solutions S.c.p.A. totalling €172.22.On February 20, 2013, FinecoBank sold to UniCredit S.p.A. its share certificates of Unicredit Audit S.C.p.A., merged by incorporation in UniCredit S.p.A. on March 1, 2013, representing 20 ordinary shares for a total of €220.63 euro.The debt securities classified in the Available-for-sale financial assets portfolio are entirely used as collateral for bankers’ drafts or guarantees with third parties.

40
Report on Operations
The Annual Report and Accounts as at December 31, 2013 · FinecoBank
Main balance sheet aggregates (Continued)
Hedged assets consist of receivables for personal loans due from retail customers and bonds issued by UniCredit S.p.A. belonging to the Loans and Receivables category.
Hedged liabilities refer to bonds issued by FinecoBank, entirely subscribed by the Parent Company and recognised as securities in issue.
Accruals relating to asset and liability hedging derivatives amount respectively to €2 million and €2.7 million, and are included in net interest income.
Positive and negative valuations of hedging derivatives relate solely to derivative contracts that the Bank has entered into to provide a macro-hedge against interest rate risk inherent in the above-mentioned assets and liabilities, whose income statement effect is zero.
Hedging instruments(Amounts in € thousand)
12.31.2013 12.31.2012CHANGES
AMOUNT %
Asset hedging derivatives - positive valuations 47,784 171,550 (123,766) -72.1%Liability hedging derivatives - positive valuations 75,359 19,022 56,337 296.2%Adjustment to the value of assets under macro-hedge 56,122 (116,827) 172,949 n.d.Total assets 179,265 73,745 105,520 143.1% of which:Positive valuations 125,197 189,468 (64,271) -33.9%Related accrued assets and liabilities (2,054) 1,104 (3,158) -286.1%Adjustments to the value of hedged assets 56,122 (116,827) 172,949 n.d.Total assets 179,265 73,745 105,520 143.1%
12.31.2013 12.31.2012CHANGES
AMOUNT %
Asset hedging derivatives - negative valuations 93,987 41,881 52,106 124.4%Liability hedging derivatives - negative valuations 47,814 172,004 (124,190) -72.2%Adjustment to the value of assets under macro-hedge 36,773 (140,634) 177,407 n.d.Total liabilities 178,574 73,251 105,323 143.8% of which:Negative valuations 144,546 213,275 (68,729) -32.2%Related accrued assets and liabilities (2,745) 610 (3,355) -550.0%Adjustments to the value of hedged liabilities 36,773 (140,634) 177,407 n.d.Total liabilities 178,574 73,251 105,323 143.8%
(Amounts in € thousand)
SUMMARY OF HEDGING DERIVATIVE VALUATIONS 31-DEC-2013 ASSETS LIABILITIES DIFFERENCE
Valuation of asset and liability hedging derivatives 125,197 144,546 (19,349)Change in fair value of hedged assets/liabilities 56,122 36,773 19,349Total 181,319 181,319 -
Property, plant and equipmentAs in previous financial years, investments in electronic machines were made to guarantee the on-going update of the hardware used by all FinecoBank departments, and in particular by the IT department. Investments in furniture, fittings and equipment are primarily intended for use in new financial stores.The book value of property, plant, and equipment includes the historical cost and the accumulated depreciation of assets obtained under finance lease, as per IAS 17.
Property, plant and equipment (Amounts in € thousand)
BALANCE 01.01.2013
INVESTMENTS AS AT 12.31.2013
OTHERCHANGES-SALES
AMORTISATION AND WRITE-DOWNS AS
AT 12.31.2013BALANCE
12.31.2013
Properties 2,846 - - (112) 2,734Electronic machines 3,743 3,899 (18) (1,778) 5,846Furniture and fixtures 732 1,072 14 (984) 834Plant and machinery 1,379 522 7 (550) 1,358TOTAL 8,700 5,493 3 (3,424) 10,772

41FinecoBank · The Annual Report and Accounts as at December 31, 2013
GoodwillAnnual impairment testing on goodwill, carried out at December 31, 2013, did not identify any impairment.
As at December 31, 2013, the goodwill recorded in the financial statements was made up as follows:
(Amounts in € thousand)
12.31.2013 12.31.2012
Goodwill relating to Fineco On Line Sim S.p.A. 16,087 16,087
Goodwill relating to the trading and banking division of Banca della Rete 2,034 2,034
Goodwill relating to PFA division formerly FinecoGroup S.p.A. 3,463 3,463
Goodwill relating to PFA division formerly UniCredit Xelion Banca S.p.A. 68,018 68,018
Total 89,602 89,602
Goodwill relating to Fineco On Line Sim S.p.A.On April 3, 2001 the merger of Fineco On Line Sim S.p.A., the business division of Fineco Sim S.p.A., into FinecoBank was completed.This merger was carried out on the basis of a share swap ratio of 3.7 shares of the acquiring company for each share of the acquired company, with a consequent increase in the share capital of FinecoBank. The difference between the increase in capital of the acquiring company and the amount of shareholders’ equity of the acquired company gave rise to a share swap loss recorded under goodwill.The balance, amounting to €16 million, is equal to the balance at January 1, 2004, the date of transition to IAS, plus the unamortised amount of the substitute tax, paid for recognition of the loss for tax purposes.
Goodwill relating to the Trading and Banking division of Banca della ReteOn September 1, 2003, FinecoBank acquired the “On-line Banking” and “On-line Trading” business divisions of Banca della Rete, as part of the business plan to rationalise the reorganisation of Banca della Rete, in accordance with the directives of the then Parent Company Capitalia S.p.A.. The amount of €2 million recorded in the balance sheet is the same as the amount as at January 1, 2004, the date of transition to IAS.
Goodwill relating to PFA division formerly FinecoGroup S.p.A.On October 1, 2005, FinecoBank acquired the Personal Financial Advisers business division from FinecoGroup S.p.A., which was created from the progressive merger of three different group networks: FinecoBank S.p.A., former Bipop Carire S.p.A. and Banca Manager S.p.A..
he transaction was carried out for a consideration mutually agreed by the parties and subject to a ‘fairness opinion’, leading to the recognition of €3.5 million of goodwill.
Goodwill relating to PFA division formerly UniCredit Xelion Banca S.p.A.As a result of the merger of UniCredit Xelion Banca S.p.A. into FinecoBank on July 7, 2008, FinecoBank S.p.A. recorded goodwill of €68 million under intangible assets, arising from previous extraordinary transactions carried out by UniCredit Xelion Banca S.p.A., more specifically:• year 2000: acquisition of the personal financial advisers
division, formerly Fida SIM, by UniCreditSIM, later merged into Xelion Sim S.p.A., which then became UniCredit Xelion Banca S.p.A.. The balance, amounting to €1 million, is equal to the balance at January 1, 2004, the date of transition to IAS;
• year 2001: merger of UniCreditSIM into Xelion Sim S.p.A., which then became UniCredit Xelion Banca S.p.A.. The balance, amounting to €13,8 million, is equal to the balance at January 1, 2004, the date of transition to IAS;
• year 2003: spin-off of the personal financial advisers division, formerly Credit, Rolo and CRT by UniCredit Banca to UniCredit Xelion Banca S.p.A.. The balance, amounting to €19,1 million, is equal to the balance at January 1, 2004, the date of transition to IAS;
• year 2004: acquisition of the personal financial advisers division from Ing Italia. This transaction resulted in the recognition of goodwill of €34.1 million.
It should be noted that all the goodwill (totalling €90 million) relates to acquisitions of divisions or companies carrying out trading activities or the distribution of financial, banking and insurance products through personal financial advisers.These activities have been fully integrated with FinecoBank’s ordinary operations, as a result it is no longer possible to isolate the contribution of each company/business division from the Bank’s overall income; this means that to establish the reasonableness of the value of goodwill recognised in the financial statements it is necessary to take account of the Bank’s overall income. The Cash Generating unit (CGU) is therefore the Bank as a whole.In fact, in view of the specific business model adopted by FinecoBank, which envisages a high level of integration between personal financial advisers and the trading and banking platform, the allocation of costs/revenues to the business units is not considered relevant or meaningful; the personal financial advisers network is an integral part of the overall offer, together with banking, brokerage and investment services.

42
Report on Operations
The Annual Report and Accounts as at December 31, 2013 · FinecoBank
Main balance sheet aggregates (Continued)
Other intangible assets
Other intangible assets solely include purchases and the implementation of information technology procedures with useful lives of several years, required in order to manage the development and the constant offer of by the Bank of new and more versatile
added value services for customers, as well as infrastructure and application optimisations, enhancements to architecture for application security, and the developments needed to meet the new regulatory requirements.
(Amounts in € thousand)
INTANGIBLE ASSETSBALANCE
01.01.2013INVESTMENTS
AS AT 12.31.2013OTHER
CHANGES-SALES
AMORTISATION AND WRITE-DOWNS AS AT
12.31.2013BALANCE
12.31.2013
Software 6,994 4,208 (2) (4,347) 6,853
Other intangible assets 1,183 295 (7) (310) 1,161
TOTAL 8,177 4,503 (9) (4,657) 8,014
Tax Assets and Other Assets(Amounts in € thousand)
12.31.2013 12.31.2012
CHANGES
AMOUNT %
Tax assetsCurrent assets 25,264 3,069 22,195 723.2%
Deferred tax assets 39,197 40,071 (874) -2.2%
Deferred tax assets pursuant to Law 214/2011 3,473 3,159 314 9.9%
Total 67,934 46,299 21,635 46.7%Other assetsItems in processing 9,488 14,348 (4,860) -33.9%
Definitive items not recognised under other items 62,491 40,238 22,253 55.3%
Current receivables not related to the provision of financial services 1,707 2,827 (1,120) -39.6%
Tax items other than those included in the item “Tax assets” 160,908 87,168 73,740 84.6%
Prepayments 10,940 6,868 4,072 59.3%
Improvement and incremental expenses incurred on leasehold assets 10,962 10,467 495 4.7%
Other items 133 124 9 7.3%
Total 256,629 162,040 94,589 58.4%
The increase in “Current tax assets”, of €22 million, was due, primarily, to the increase from 100% to 130% of the IRES and IRAP advances paid to the tax authorities.With regard to the “Other assets”, there was an increase in “Items deemed definitive but not-attributable to other items”,
relating to tax credits for stamp duty to be collected from customers, and the “Tax items other than those recognised under the item Tax assets”, as a result of the higher tax advances paid, as a withholding agent, for the stamp tax and withholding tax on other income.

43FinecoBank · The Annual Report and Accounts as at December 31, 2013
Deposits from banks(Amounts in € thousand)
12.31.2013 12.31.2012
CHANGES
AMOUNT %
Deposits from central banks - - - -Deposits from banksCurrent accounts and demand deposits 29,139 39,403 (10,264) -26.0%
Loans
1 Repos 1,619,295 2,025,627 (406,332) -20.1%
Other liabilities 241 123 118 95.9%
Total 1,648,675 2,065,153 (416,478) -20.2%
The item current accounts and demand deposits mainly consists of reciprocal current accounts and loans with UniCredit group companies, with a book value of €24 million, as well as reciprocal current accounts and loans with banks outside the Group of €5 million.
Repos include €1,535 million of transactions performed with the UniCredit S.p.A. and €6 million of transactions with UniCredit AG Monaco.
Deposits from customers and debt securities in issue
The balance of direct deposits from customers, raised through bank accounts, the Cash Park deposit account and Supersave
repos, totalled €12,518 million, an increase of 3.9% compared to December 31, 2012.
(Amounts in € thousand)
12.31.2013 12.31.2012
CHANGES
AMOUNT %
Current accounts and demand deposits 10,666,363 9,551,550 1,114,813 11.7%
Time deposits 1,699,635 2,277,460 (577,825) -25.4%
Loans
1 Repos 304,380 382,241 (77,861) -20.4%
Other liabilities 61,931 52,291 9,640 18.4%
Total Deposits from customers 12,732,309 12,263,542 468,767 3.8%Of which direct customer deposits 12,518,293 12,043,736 474,557 3.9%Debt securities in issue 2,322,511 3,075,792 (753,281) -24.5%Deposits from customers and debt securities in issue 15,054,820 15,339,334 (284,514) -1.9%
In September 2013 securities issued by UniCredit S.p.A. were repurchased for a book value of €750 million. At the same time debt securities held by Fineco’s and issued by UniCredit S.p.A. were sold to UniCredit S.p.A. for the same amount.The transaction also resulted in the closure of the related hedging
derivatives and the recognition in the income statement of the changes in fair value of portfolio hedged items.
Customer direct deposits include overdrawn current accounts, Supersave repos and the Cash Park deposit account.

44
Report on Operations
The Annual Report and Accounts as at December 31, 2013 · FinecoBank
Main balance sheet aggregates (Continued)
Financial liabilities held for trading
Financial liabilities held for trading consist of:• technical overdrafts classified under as HFT (held for trading),
held in the Bank’s portfolio as a result of trading activity, for an immaterial amount;
• the negative valuation of spot contracts for securities in the HFT portfolio and currencies to regulates in times established by market practices (“regular way”) for €1.7 million, which correspond to negative valuations booked under item 20 “Financial liabilities held for trading”;
• the negative valuation of CFDs on indices and Forex for €0.6 million.
CFDs on indices and currencies are “Over the counter” derivative contracts that require the payment of a differential generated by the difference between the opening and closing price of the financial instrument. The bank in operational terms covers the imbalance of customer positions, by underwriting futures on the indexes underlying the CFDs on indices, or through
Forex transactions with institutional counterparties to hedge CFD transactions in open currencies with customers’ currency; consequently, the negative valuations booked under “Financial assets held for trading” more or less balanced the positive valuations booked under “Financial liabilities held for trading”.
Provisions for risks and chargesProvisions for risks and charges include allowances for a total of €109 million, for which, given a liability of uncertain amount and expiry, a current obligation was identified as the result of a past event and it was possible to make a reliable estimate of the amount resulting from the fulfilment of said obligation.The disbursements, with estimated maturity exceeding 18 months, were discounted to present value using a rate equal to the time value of money. For further information, see Part B - Balance Sheet - Section 12 - Liabilities of the Notes to the Accounts.
(Amounts in € thousand)
12.31.2013 12.31.2012
CHANGES
AMOUNTS %
Legal disputes 55,578 51,774 3,804 7.3%- On-going disputes 40,573 41,514 (941) -2.3%
- Complaints 15,005 10,260 4,745 46.2%
Other 53,776 51,311 2,465 4.8%- Supplementary customer indemnity provision 32,178 29,375 2,803 9.5%
- Provision for contractual payments and payments under non-competition agreements 1,916 2,477 (561) -22.6%
- Tax disputes 7,439 5,943 1,496 25.2%
- Other provisions 12,243 13,516 (1,273) -9.4%
Total Provisions for risks and charges - other provisions 109,354 103,085 6,269 6.1%
The balances as at December 31, 2012 differ from those presented in the annual report as at that date due to the application of the new IAS 19R, which decreased Provisions
for risks and charges by €5.9 million, as described in Part A - Accounting Policies of Section 2 - General Criteria for preparing the Notes to the Accounts.

45FinecoBank · The Annual Report and Accounts as at December 31, 2013
Tax liabilities and Other liabilities(Amounts in € thousand)
12.31.2013 12.31.2012
CHANGES
AMOUNT %
Tax liabilitiesCurrent liabilities 16,842 47,268 (30,426) -64.4%Deferred tax liabilities 20,859 19,320 1,539 8.0%Total 37,701 66,588 (28,887) -43.4%Other liabilitiesItems in processing 47,398 53,942 (6,544) -12.1%Definitive items not recognised under other items 34,396 23,111 11,285 48.8%Other liabilities relative to employees 15,229 14,073 1,156 8.2%Liabilities due to Directors and Statutory Auditors 244 166 78 47.0%Current payables not related to the provisions of financial services 27,400 20,094 7,306 36.4%Tax items other than those inluded in the item “Tax liabilities” 83,854 60,313 23,541 39.0%Social security contributions payable 4,853 4,699 154 3.3%Adjustments for illiquid portfolio items 13,847 7,067 6,780 95.9%Other items 640 1,339 (699) -52.2%Total 227,861 184,804 43,057 23.3%
The decrease in “Current liabilities”, was due, primarily, to the increase from 100% to 130% of the IRES and IRAP advances paid to the tax authorities, which resulted in a lower payable for tax liabilities.With regard to the “Other assets”, there was an increase in “Items deemed definitive but not-attributable to other items”, relating to securities and coupons to be settled, and the “Tax items other than those recognised under the item Tax assets”, as a result of the higher tax payable recognized towards the tax authorities for stamp tax.
Shareholders’ equityAs at December 31, 2013, the Bank’s share capital came to €200 million, and was divided into 606.274.033 shares with a par value
of €0.33 each. Reserves are represented by the legal reserve, amounting to €28.8 million, and the extraordinary reserve, amounting to €98.7 million and unavailable retained earnings, for an amount of €0.2 million.
The Bank does not hold any of its own shares in the portfolio.
Following the Shareholders’ Meeting resolution of April 16, 2013, the 2012 profit before tax of €125.5 million was allocated as follows:• €6.3 million to the legal reserve;• €4.9 million to the extraordinary reserve;• €0.2 million to the unavailable retained earnings reserve;• €111.9 million to the sole shareholder;• €2.2 million to charitable donations.
Shareholders’ equity(Amounts in € thousand)
ITEM/AMOUNT 12.31.2013 12.31.2012
CHANGES
AMOUNT %
Share capital 200,070 200,070 - -Share premium reserve 1,934 1,934 - -Reserves - - Legal reserve 28,800 22,527 6,273 27.8% - Extraordinary reserve 98,744 93,773 4,971 5.3% - Other reserves 171 5 166 3320.0%Revaluation reserves 4,214 3,692 522 14.1%Net Profit (Loss) for the year 85,216 125,467 (40,251) -32.1%Total 419,149 447,468 (28,319) -6.3%
The balances as at December 31, 2012 differ from those presented in the annual report as at that date due to the application of the new IAS 19R , which decreased Provisions
for risks and charges by €3.4 million, as described in Part A - Accounting Policies of Section 2 - General Criteria for preparing the Notes to the Accounts.

46
Report on Operations
The Annual Report and Accounts as at December 31, 2013 · FinecoBank
(Amounts in € thousand)
12.31.2013 12.31.2012
Tier 1 capital 316,008 251,095
Tier 2 capital - -
Items to be deducted - -
Regulatory capital 316,008 251,095Prudential requirements 206,448 215,064
Risk-weighted assets 2,580,595 2,688,301
Tier 1 12.25% 9.34%
Tier 2 0.00% 0.00%
Regulatory capital/risk-weighted assets 12.25% 9.34%
As at December 31, 2013, regulatory capital amounted to €316 million. Risk-weighted assets were calculated by multiplying total prudential requirements by 12.5 (the inverse of the minimum compulsory coefficient of 8%), using the traditional standardised approach set forth in the Basel II supervisory provisions. FinecoBank calculates its capital requirement for operational risk using advanced approaches, integrating total capital requirements for the floor set by Bank of Italy regulations. FinecoBank has applied a floor corresponding to the positive difference between 80% of the capital requirements calculated on the basis of the regulations in force as at December 31, 2006 and the sum of capital requirements for credit, counterparty, market and operational risks, calculated using the current provisions of Basel II. As at December 31, 2013, the floor was €90.8 million, net of the 25% reduction granted to banks belonging to a Banking group.On June 26, 2013, the official version of CRD IV was issued, and on June 27, 2013, the texts of the EU Regulation no. 575/2013 (hereinafter “Regulation” or “CCR”) and of the Directive 2013/36/EU (hereinafter “Directive” or “CRD IV”) were published in the Official Journal of the European Union; the Regulation and Directive introduce the regulations defined by the Basel Committee in December 2010 on banking supervision to the European Union, in order to promote a banking system that is more solid and resistant to financial shock. These new measures
- which wholly replace Directive 2006/48/EC (“CRD”) on access to the activity of credit institutions and the prudential supervision of credit institutions and investment firms and Directive 2006/49/EC (“CAD”), on the capital adequacy of investment firms and credit institutions- comprise the reference regulatory framework in the European Union for banks and investment companies (Investment Companies) as from January 1, 2014.The adoption in Italy of EU Regulation no. 575/2013 and the Directive 2013/36/EU as from January 1, 2014 has led, in particular, to the elimination, on an individual basis, of the broader limit for risk concentration purposes (40% compared to 25%), the elimination of the reduction in capital requirements (25%) granted to banks belonging to a banking group and the introduction of a preservation of capital reserve.The elimination of the 25% reduction granted to banks belonging to a banking group will considerably increase the total capital requirements of FinecoBank. For this reason, the Bank proposed to allocate a considerable portion of 2013 profit to increase the value of these reserves.Tier 1 capital as at December 31, 2013 therefore includes the share of 2013 net profit, which the Bank’s bodies responsible for strategic supervision and management have allocated to increasing the value of reserves, corresponding to €63 million, with consequent increase in the Tier 1 Ratio and Total Capital Ratio.
Regulatory capital and prudential requirements

47FinecoBank · The Annual Report and Accounts as at December 31, 2013
Condensed Income Statement
(Amounts in € thousand)
12.31.2013 12.31.2012
CHANGES
AMOUNT %
Net interest 180,278 243,469 (63,191) -26.0%
Net fees and commission income 166,736 143,611 23,125 16.1%
Net trading, hedging and fair value income 28,281 28,069 212 0.8%
Net other expenses/income (4,964) (5,368) 404 -7.5%
OPERATING INCOME 370,331 409,781 (39,450) -9.6%Payroll costs (63,338) (61,022) (2,316) 3.8%
Other administrative expenses (174,636) (148,670) (25,966) 17.5%
Recovery of expenses 56,997 31,474 25,523 81.1%
Amortisation, depreciation and impairment losses on intangible and tangible assets (8,081) (8,245) 164 -2.0%
Operating costs (189,058) (186,463) (2,595) 1.4%OPERATING PROFIT (LOSS) 181,273 223,318 (42,045) -18.8%Net impairment losses on loans andprovisions for guarantees and commitments (3,275) (2,852) (423) 14.8%
NET OPERATING PROFIT (LOSS) 177,998 220,466 (42,468) -19.3%Provisions for risks and charges (16,059) (18,356) 2,297 -12.5%
Net income from investments (6) (3) (3) 100.0%
PROFIT (LOSS) BEFORE TAXFROM CONTINUING OPERATIONS 161,933 202,107 (40,174) -19.9%Income tax for the period (76,717) (76,640) (77) 0.1%
PROFIT (LOSS) AFTER TAX FROM CONTINUING OPERATIONS 85,216 125,467 (40,251) -32.1%NET PROFIT (LOSS) FOR THE PERIOD 85,216 125,467 (40,251) -32.1%
Income statement figures

48
Report on Operations
The Annual Report and Accounts as at December 31, 2013 · FinecoBank
Income statement figures (Continued)
Net interest margin
The interest income as at December 31, 2013 was € 180 million, down 26% compared to the same period of 2012, due to a reduction in market rates.
(Amounts in € thousand)
INTEREST INCOME 12.31.2013 12.31.2012
CHANGES
AMOUNT %
Financial assets held for trading 3 8 (5) -62.5%
Available-for-sale financial assets 1,798 1,653 145 8.8%
Loans and receivables with banks 266,077 406,015 (139,938) -34.5%
Loans and receivables with customers 26,155 25,794 361 1.4%
Financial assets at fair value through profit or loss 84 243 (159) -65.4%
Other assets 48 26 22 84.6%
Total interest income 294,165 433,739 (139,574) -32.2%
(Amounts in € thousand)
INTEREST EXPENSE 12.31.2013 12.31.2012
CHANGES
AMOUNT %
Deposits from banks (9,621) (13,191) 3,570 -27.1%
Deposits from customers (78,920) (119,238) 40,318 -33.8%
Debt securities in issue (19,936) (52,700) 32,764 -62.2%
Other liabilities (2) (4) 2 -50.0%
Hedging derivatives (5,408) (5,137) (271) 5.3%
Total interest expense (113,887) (190,270) 76,383 -40.1%Net interest 180,278 243,469 (63,191) -26.0%
The following table provides a breakdown of interest income associated with banks and customers:(Amounts in € thousand)
BREAKDOWN OF INTEREST INCOME 12.31.2013 12.31.2012 CHANGES %
Interest income on loans and receivables with banks 266,077 406,015 -34.5%- current accounts 140,311 168,267 -16.6%
- reverse repos 743 1,022 -27.3%
- time deposits for compulsory reserve 671 938 -28.5%
- time deposits 90,933 160,079 -43.2%
- other loans 12 16 -25.0%
- debt securities 33,407 75,693 -55.9%
Interest income on loans and receivables with customers 26,155 25,794 1.4%- current accounts 3,659 3,139 16.6%
- reverse repos 9,731 9,962 -2.3%
- credit cards 3,430 2,986 14.9%
- personal loans 9,215 9,589 -3.9%
- other loans 120 118 1.7%
Interest income on loans and receivables with banks amounted to €266 million, down €140 million compared to December 31, 2012, due to a reduction in the benchmark rate to which the remuneration of deposits held with the Parent Company is linked.
Interest expense on loans and receivables with customers amounted to €26 million and was basically unchanged compared to the same period of the previous year.

49FinecoBank · The Annual Report and Accounts as at December 31, 2013
The following table provides a breakdown of interest expense related to banks and customers:
(Amounts in € thousand)
BREAKDOWN OF INTEREST EXPENSE 12.31.2013 12.31.2012
CHANGES
AMOUNT %
Interest expense on deposits from banks (9,621) (13,191) 3,570 -27.1%- current accounts (74) (82) 8 -9.8%
- time deposits - (119) 119 -100.0%
- other loans (21) (26) 5 -19.2%
- reverse repos (9,526) (12,964) 3,438 -26.5%
Interest expense on deposits from customers (78,920) (119,238) 40,318 -33.8%- current accounts (13,931) (35,534) 21,603 -60.8%
- demand deposits (71) (16) (55) 343.8%
- time deposits (59,159) (65,804) 6,645 -10.1%
- reverse repos (5,759) (17,884) 12,125 -67.8%
Interest expense on deposits from banks amounted to €10 million, down by €3.6 million compared to the same period of the previous year, attributable to lower interest accrued on repurchase agreements due to the reduction in volumes and benchmark rates.
Interest expense on payables to customers amounted to €79 million, down by €40 million compared to December 31, 2012, due to the effect of the reduction in the benchmark rate to which the remuneration of customer deposits is linked, and to the reduction in the rate and volumes of repurchase agreement and Cash Park transactions.
Income from brokerage and other income(Amounts in € thousand)
12.31.2013 12.31.2012
CHANGES
AMOUNT %
Net interest 180,278 243,469 (63,191) -26.0%Net fees and commissions 166,736 143,611 23,125 16.1%
Net trading, hedging and fair value income 28,281 28,069 212 0.8%
Net other expenses/income (4,964) (5,368) 404 -7.5%
Operating income 370,331 409,781 (39,450) -9.6%

50
Report on Operations
The Annual Report and Accounts as at December 31, 2013 · FinecoBank
Net fee and commission income(Amounts in € thousand)
MANAGEMENT RECLASSIFICATION 12.31.2013 12.31.2012
CHANGES
AMOUNT %
Management, brokerage and consultancy services:
1. securities trading and order collection 70,278 72,539 (2,261) -3.1%
2. currency trading (375) (302) (73) 24.2%
3. custody and administration of securities (3,073) (2,701) (372) 13.8%
4. placement of securities, investment fund units and segregated accounts 106,967 87,752 19,215 21.9%
6. investment advisory services (8) 429 (437) -101.9%
7. distribution of insurance products 12,282 12,587 (305) -2.4%
8. distribution of other products (230) 12 (242) -2,016.7%
Collection and payment services 10,814 9,170 1,644 17.9%
Holding and management of current/deposit accounts (7,524) (7,378) (146) 2.0%
Other fee expense personal financial advisers (23,125) (21,394) (1,731) 8.1%
Securities lending (3,346) (10,978) 7,632 -69.5%
Other Services 4,076 3,875 201 5.2%
Total 166,736 143,611 23,125 16.1%
Net fee and commission income amounted to €167 million, increasing by 16.1% compared to the same period of the previous year. This increase was mainly attributable to the increase in net fee and commission income from trading and asset management, UCIT units and discretionary accounts, thanks to the increase in deposits under
management and lower commission expense for securities lending transactions.
Net trading, hedging and fair value income is mainly determined from gains realised from securities and currency trading, and CFDs.
Income statement figures (Continued)

51FinecoBank · The Annual Report and Accounts as at December 31, 2013
Operating costs(Amounts in € thousand)
BREAKDOWN OF OPERATING COSTS 12.31.2013 12.31.2012
CHANGES
AMOUNT %
Payroll costs (63,338) (61,022) (2,316) 3.8%
Other administrative expenses (174,636) (148,670) (25,966) 17.5%
Recovery of expenses 56,997 31,474 25,523 81.1%
Amortisation, depreciation and impairment losses on intangible and tangible assets (8,081) (8,245) 164 -2.0%
Total operating costs (189,058) (186,463) (2,595) 1.4%
(Amounts in € thousand)
PAYROLL COSTS 12.31.2013 12.31.2012
CHANGES
AMOUNT %
1) Employees (61,283) (59,220) (2,063) 3.5% - wages and salaries (41,721) (39,943) (1,778) 4.5%
- social security contributions (11,323) (10,609) (714) 6.7%
- severance pay (803) (735) (68) 9.3%
- allocation to employee severance pay provision (139) (165) 26 -15.8%
- payments to external pension funds:
a) defined contribution (2,276) (2,179) (97) 4.5%
- costs related to share-based payments (465) (588) 123 -20.9%
- other employee benefits (4,556) (5,001) 445 -8.9%
2) Other staff (101) (97) (4) 4.1%3) Directors and statutory auditors (864) (764) (100) 13.1%4) Early retirement costs - - - n.c.5) Recovery of expenses for employees seconded to other companies 71 91 (20) -22.0%6) Recovery of expenses for employees seconded to the Company (1,161) (1,032) (129) 12.5%Total (63,338) (61,022) (2,316) 3.8%
Following the issue of the second update of Circular no. 262 of January 21, 2014, employee severance fund payments to other defined contribution funds were booked under “payments to supplementary pension funds”, previously booked to the item “employee severance fund”. In addition, from 2013, the remuneration for long-term incentives has been recognised under the item “other employee benefits”, which was previously recognised under “wages and salaries”.To enable a like-for-like comparison, 2012 data were also reclassified.
Personnel expenses as at December 31, 2013 went up by 3.8%, mainly due to the increase in the number of resources from 949 as at December 31, 2012 to 976 as at December 31, 2013.
Note that item h) “costs resulting from share-based payments involving own equity instruments”, refers to the costs incurred by FinecoBank for share-based payments involving financial instruments issued by UniCredit S.p.A..
There were no significant changes compared to the previous year in other administrative expenses net of recovery of expenses.
Indirect taxes and duties net of the Recovery of taxes decreased by €5.7 million, as promotions were run during 2012 offering free stamp duty on securities accounts for all customers activating the Portafoglio Remunerato (remunerated portfolio) service. The promotion had ended as at December 31, 2012.Advertising - marketing and communication expenses increased by €2.6 million, due to greater investments in advertising.Other functioning costs increased by €3.5 million.

52
Report on Operations
The Annual Report and Accounts as at December 31, 2013 · FinecoBank
(Amounts in € thousand)
OTHER ADMINISTRATIVE EXPENSES AND RECOVERY OF EXPENSES 12.31.2013 12.31.2012CHANGES
AMOUNT %
1) INDIRECT TAXES AND DUTIES (59,389) (39,306) (20,083) 51.1%2) MISCELLANEOUS COSTS AND EXPENSES A) Advertising expenses - Marketing and communication (19,541) (16,891) (2,650) 15.7% Mass media campaigns (13,903) (12,491) (1,412) 11.3% Marketing and promotions (5,566) (4,303) (1,263) 29.4% Sponsorships (46) (65) 19 -29.2% Conventions and internal communications (26) (32) 6 -18.8% B) Expenses related to credit risk (914) (739) (175) 23.7% Credit recovery expenses (495) (431) (64) 14.8% Commercial information and company searches (419) (308) (111) 36.0% C) Expenses related to personnel (12,663) (12,373) (290) 2.3% Personnel training (361) (408) 47 -11.5% Car rental and other payroll costs (51) (40) (11) 27.5% Personal financial adviser expenses (11,724) (11,321) (403) 3.6% Travel expenses (457) (512) 55 -10.7% Premises rentals for personnel (70) (92) 22 -23.9% D) ICT expenses (29,458) (29,674) 216 -0.7% Lease of ICT equipment and software (5,083) (6,069) 986 -16.2% Software expenses: lease and maintenance (6,441) (5,639) (802) 14.2% ICT communication systems (3,996) (3,673) (323) 8.8% ICT services: external personnel/outsourced services (6,685) (6,778) 93 -1.4% Financial information providers (7,253) (7,515) 262 -3.5% E) Consulting and professional services (3,023) (3,468) 445 -12.8% Consultancy for ordinary operations (886) (764) (122) 16.0% Consultancy for strategy, business development and organisational optimisation (45) (34) (11) 32.4% Legal expenses (11) (56) 45 -80.4% Legal disputes (2,081) (2,614) 533 -20.4% F) Real estate expenses (21,646) (21,112) (534) 2.5% Real estate services (685) (671) (14) 2.1% Repair and maintenance of furniture, machinery, and equipment (159) (157) (2) 1.3% Maintenance of premises (1,294) (1,155) (139) 12.0% Premises rentals (16,428) (15,457) (971) 6.3% Cleaning of premises (485) (549) 64 -11.7% Utilities (2,595) (3,123) 528 -16.9% G) Other functioning costs (28,002) (25,107) (2,895) 11.5% Surveillance and security services (295) (105) (190) 181.0% Money counting services and transport (1) (2) 1 -50.0% Postage and transport of documents (3,048) (2,617) (431) 16.5% Administrative and logistic services (13,711) (13,536) (175) 1.3% Insurance (3,892) (2,766) (1,126) 40.7% Printing and stationery (747) (651) (96) 14.7% Association dues and fees (6,078) (5,212) (866) 16.6% Other administrative expenses (230) (218) (12) 5.5% H) Recovery of costs 56,997 31,474 25,523 81.1% Recovery of ancillary expenses 166 407 (241) -59.2% Recovery of taxes 56,831 31,067 25,764 82.9%Total (117,639) (117,196) (443) 0.4%
Income statement figures (Continued)
Impairment losses on intangible assets refer mainly to the amortisation of software with a long-term useful life and decreased compared to the previous year, due to a reduction in assets that may be amortised.
Impairment losses on tangible assets refer to the depreciation applied to electronic machines, plant and machinery, furniture and fittings.

53FinecoBank · The Annual Report and Accounts as at December 31, 2013
Profit (loss) before tax from continuing operations(Amounts in € thousand)
12.31.2013 12.31.2012
CHANGES
AMOUNT %
Operating profit (loss) 181,273 223,318 (42,045) -18.8%Net impairment losses on loans and provisions for guarantees and commitments (3,275) (2,852) (423) 14.8%
Net operating profit (loss) 177,998 220,466 (42,468) -19.3%Provisions for risks and charges (16,059) (18,356) 2,297 -12.5%
Net income from investments (6) (3) (3) 100.0%
Profit before tax 161,933 202,107 (40,174) -19.9%
Net impairment losses on loans increased by €0.4 million compared to December 31, 2013.
Compared to the same period in 2012, Provisions for risks and charges registered fewer provisions, despite the extraordinary negative effect related to the contribution to the National Interbank Deposit Guarantee Fund (FITD) to support banks under extraordinary administration and greater reallocations to profit or loss for reversals
related mainly to activities being stepped up to successfully settle disputes, the outcome of favourable sentences and insurance payouts.
Profit before tax amounted to €162 million, decreasing by 19.9% compared to December 31, 2012, due to the decreased interest margin previously described, only partially offset by the increase in net commissions.

54
Report on Operations
The Annual Report and Accounts as at December 31, 2013 · FinecoBank
Income tax for the period
(Amounts in € thousand)
BREAKDOWN OF TAXES FOR THE YEAR 12.31.2013 12.31.2012
CHANGES
AMOUNT %
Current IRES income tax charges (59,001) (57,120) (1,881) 3.3%
Current IRAP corporate tax charges (13,536) (16,402) 2,866 -17.5%
Adjustment to current tax of prior years (2,500) (4,000) 1,500 -37.5%
Total current taxes (75,037) (77,522) 2,485 -3.2%Change in deferred tax assets 121 2,712 (2,591) -95.5%
Change in deferred tax liabilities (1,355) (1,384) 29 -2.1%
Total deferred tax liabilities (1,234) 1,328 (2,562) -192.9%Gain from substitute tax exemption (446) (446) - -
Income tax for the period (76,717) (76,640) (77) 0.1%
Current income taxes were calculated according to the legal provisions introduced by Legislative Decree no. 38 of February 28, 2005, issued following the incorporation of IAS/IFRS into Italian legislation and of Decree no. 48 of April 1, 2009, which established provisions for the implementation and coordination of tax requirements for IAS Adopter parties. The amount of taxes was affected by provisions contained in Law Decree 133/2013 converted by law no. 5 of 29.1.2014. This Decree, for the 2013 tax period only, introduced an additional 8.5 percentage points for credit and financial institutions on the tax base minus the increase relating to 4/5 of losses on receivables and write-downs, established in article 106 paragraph 3 of the Consolidated Tax Act. This paragraph established that write-downs and losses on loans and advances to customers, net of write-backs are deductible in equal instalments during the year in which they are recognised and in the next four years.
Law no. 2/2009 introduced the option, through the payment of a substitute tax, to recalculate the tax deductible amounts of goodwill. On the instructions of the Parent Company, in 2008 FinecoBank realigned the goodwill recognised following the merger of UniCredit Xelion Sim into UniCredit Xelion Banca S.p.A..
The redeemed goodwill may be amortised off the books for an amount not exceeding one ninth for 2010 and one tenth from 2011 onwards. As per the instructions of the Parent Company, in 2008, the tax benefit expected from the future deductibility of off-the-book amortisation, corresponding to €4 million, was recognised in the accounts. A tenth of this amount will be recognised through profit or loss for each year of the tax deduction of tax-related amortisation of goodwill.
For the three-year period 2013-2015, FinecoBank, in its capacity as consolidated company, was subject to “national tax consolidation”, as established by Legislative Decree no. 344 of December 12, 2003, which was carried out by the Parent Company, UniCredit S.p.A..
Net Profit (Loss) for the periodNet profit came to €85.2 million, down compared to the previous year, due to the reduction in the interest margin, only partially offset by the positive trend of net commissions, trading, and lower net provisions for risks and charges, and to the effect of the additional 8.5% tax on corporate income.
Income statement figures (Continued)

55FinecoBank · The Annual Report and Accounts as at December 31, 2013
The following table provides a summary of outstanding assets, liabilities, guarantees and commitments as at 31 December 2013 in relation to Group companies.
(Amounts in € thousand)
ASSETS LIABILITIESGUARANTEES AND
COMMITMENTS
Transactions with the Parent Company UniCredit S.p.A. 16,448,012 3,963,574 266,070
Transactions with companies controlled by UniCredit S.p.A. 13,630 18,707 -
Transactions with Group companies
With reference to paragraph 8 of Article 5 “Disclosure of related-party transactions” of the Consob Regulation on related-party transactions (adopted by Consob with resolution no. 17221 of
March 12, 2010 and subsequently amended with resolutions no. 17389 of June 23, 2010), see Part H - Related-Party Transactions of the Notes to the Accounts.

56
Report on Operations
The Annual Report and Accounts as at December 31, 2013 · FinecoBank
Outlook
As part of the examination aimed at identifying instruments and means capable of fully leveraging FinecoBank’s activities, assessments were initiated regarding the possibility of listing the Company’s shares on a market organised and managed by Borsa Italiana S.p.A. and in particular on Borsa Italiana S.p.A.’s Electronic Stock Market. FinecoBank has succeeded, among other things, in creating a unique business model that combines an efficient and innovative online platform with a top class network of financial advisers, in increasing the range and quality of the products and services it offers, in maintaining and strengthening a leading role in terms of technological know-how and innovations and, more generally, of establishing and reinforcing its position in its market, through progressive and steady growth. In this scenario, the listing is a necessary step in the efforts aimed at the Company’s growth. The expansion of the shareholding structure, which will result, will enable the Bank to increase the
visibility of its business model and, accordingly, augment its market standing, also through the introduction of Italian and international professional investors, thereby accelerating its path of growth.On March 27, 2014 Board of Directors of FinecoBank approved and requested to submit for approval to the Ordinary Shareholders’ Meeting the proposal for admission for listing on the Stock Exchange of the Company’s ordinary shares.
Number of treasury shares of the Parent company
FinecoBank does not hold, and did not hold during the year ended December 31, 2013, even through other companies or third parties, own shares or shares of the Parent Bank.
Subsequent events and outlook
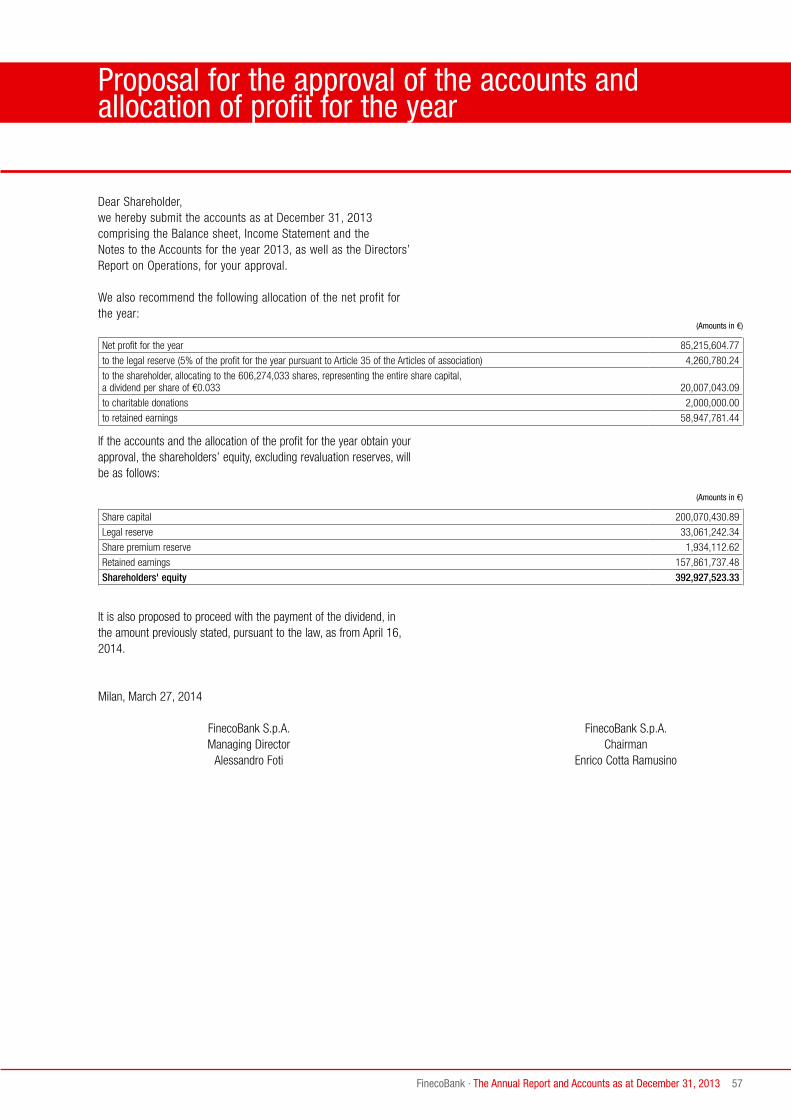
57FinecoBank · The Annual Report and Accounts as at December 31, 2013
Dear Shareholder, we hereby submit the accounts as at December 31, 2013 comprising the Balance sheet, Income Statement and the Notes to the Accounts for the year 2013, as well as the Directors’ Report on Operations, for your approval.
We also recommend the following allocation of the net profit for the year:
Proposal for the approval of the accounts and allocation of profit for the year
(Amounts in €)
Net profit for the year 85,215,604.77
to the legal reserve (5% of the profit for the year pursuant to Article 35 of the Articles of association) 4,260,780.24
to the shareholder, allocating to the 606,274,033 shares, representing the entire share capital,a dividend per share of €0.033 20,007,043.09
to charitable donations 2,000,000.00
to retained earnings 58,947,781.44
If the accounts and the allocation of the profit for the year obtain your approval, the shareholders’ equity, excluding revaluation reserves, will be as follows:
(Amounts in €)
Share capital 200,070,430.89
Legal reserve 33,061,242.34
Share premium reserve 1,934,112.62
Retained earnings 157,861,737.48
Shareholders' equity 392,927,523.33
It is also proposed to proceed with the payment of the dividend, in the amount previously stated, pursuant to the law, as from April 16, 2014.
Milan, March 27, 2014
FinecoBank S.p.A. FinecoBank S.p.A. Managing Director Chairman Alessandro Foti Enrico Cotta Ramusino

58
Report on Operations
The Annual Report and Accounts as at December 31, 2013 · FinecoBank
(Amounts in € thousand)
ASSETS 12.31.2013 12.31.2012
Cash and cash equivalents = item 10 5 7
Financial assets held for trading = item 20 4,700 7,589
Loans and receivables with banks = item 60 16,330,912 17,271,573
Loans and receivables with customers = item 70 641,250 553,606
Financial investments 93,114 69,430
30. Financial assets at fair value through profit or loss 3,199 10,516 40. Available-for-sale financial assets 89,915 58,914Hedging instruments 179,265 73,745
80. Hedging derivatives 123,143 190,572 90. Changes in fair value of portfolio hedged items 56,122 (116,827)Property, plant and equipment = item 110 10,772 8,700
Goodwill = item 120. Intangible assets of which: goodwill 89,602 89,602
Other intangible assets = item 120 net of goodwill 8,014 8,177
Tax assets = item 130 67,934 46,299
Other assets = item 150 256,629 162,042
Total assets 17,682,197 18,290,770
(Amounts in € thousand)
LIABILITIES AND SHAREHOLDERS’ EQUITY 12.31.2013 12.31.2012
Deposits from banks = item 10 1,648,675 2,065,153
Deposits from customers and debt securities in issue 15,054,820 15,339,334
20. Deposits from customers 12,732,309 12,263,542 30. Debt securities in issue 2,322,511 3,075,792Financial liabilities held for trading = item 40 2,301 7,177
Hedging instruments 178,574 73,251
60. Hedging derivatives 141,801 213,885 70. Changes in fair value of portfolio hedged items 36,773 (140,634)Provisions for risks and charges = item 120 109,354 103,085
Tax liabilities = item 80 37,701 66,588
Other liabilities 231,623 188,714
100. Other liabilities 227,862 184,805 110. Employee severance pay provision 3,761 3,909Shareholders’ equity 419,149 447,468
- capital and reserves 329,719 318,309
160. Reserves 127,715 116,305 170. Share premium reserve 1,934 1,934 180. Share capital 200,070 200,070- revaluation reserves 4,214 3,692
130. Revaluation reserves of which: Available-for-sale financial assets 641 285 130. Revaluation reserves actuarial gains (losses) from defined benefit plans 3,573 3,407- net profit = item 200 85,216 125,467
Total liabilities and shareholders’ equity 17,682,197 18,290,770
Reconciliation of condensed accounts to mandatory reporting schedule

59FinecoBank · The Annual Report and Accounts as at December 31, 2013
(Amounts in € thousand)
INCOME STATEMENT 12.31.2013 12.31.2012
Net interest 180,278 243,469
30. Net interest income 180,278 243,469 Dividends and other income from equity investments - -
70. Dividend income and similar revenue 3 1 less: dividends from held for trading equity instruments included in item 70 (3) (1)Net fees and commissions = item 60 166,736 143,611
60. Net fees and commission income 166,736 143,611 Net trading, hedging and fair value income 28,281 28,069
80. Gains (losses) on financial assets and liabilities held for trading 27,937 26,264 + dividends from held for trading equity instruments (from item 70) 3 1 90. Fair value adjustments in hedge accounting - - 110. Gains (losses) on assets and liabilities at fair value through profit and loss 341 1,804 Net other expenses/income (4,964) (5,368)
190. Other net operating income 52,068 26,107 less: other operating income - of which: recovery of costs (56,997) (31,474) 100. Gains (losses) on disposal or repurchase of: a) loans and receivables 52,446 56,984 100. Gains (losses) on disposal or repurchase of: d) financial liabilities (52,481) (56,985)OPERATING INCOME 370,331 409,781 Payroll costs (63,338) (61,022)
150. Administrative costs - a) payroll costs (63,338) (61,022)Other administrative expenses (174,636) (148,670)
150. Administrative costs - b) other administrative expenses (174,636) (148,670)Recovery of expenses 56,997 31,474
190. Other net operating income - of which: recovery of costs 56,997 31,474 Amortisation, depreciation and impairment losses on intangible and tangible assets (8,081) (8,245)
170. Impairments/write-backs on property, plant and equipment (3,424) (2,996) 180. Impairments/write-backs on intangible assets (4,657) (5,249) Operating costs (189,058) (186,463)OPERATING PROFIT (LOSS) 181,273 223,318 Net impairment losses on loans and provisions for guarantees and commitments (3,275) (2,852)
130. Impairment losses on: a) loans and receivables (3,275) (2,852)NET OPERATING PROFIT (LOSS) 177,998 220,466 Provisions for risks and charges (16,059) (18,356)
160. Provisions for risks and charges (16,059) (18,356)Net income from investments (6) (3)
240. Gains (losses) on disposal of investments (6) (3)PROFIT (LOSS) BEFORE TAX FROM CONTINUING OPERATIONS 161,933 202,107 Income tax for the period (76,717) (76,640)
260. Tax expense (income) related to profit or loss from continuing operations (76,717) (76,640)PROFIT (LOSS) AFTER TAX FROM CONTINUING OPERATIONS 85,216 125,467 NET PROFIT (LOSS) FOR THE PERIOD 85,216 125,467

60
Report on Operations
The Annual Report and Accounts as at December 31, 2013 · FinecoBank
Dear Shareholder.
Pursuant to art. 2429, paragraph 2, of the Italian Civil Code and art. 153 of Italian Legislative Decree no. 58 of February 24, 1998 and subsequent amendments and integrations, the Board reports on its supervisory activity performed in the financial year ended on December 31, 2013.
The Board carried out its supervisory activity prescribed by the law in force, in accordance with the instructions issued by the Bank of Italy and Consob, and in compliance with its own role.
On the basis of its schedule, the Board held numerous meetings with the Top Management and the Heads of the management areas, examining in depth all the principal issues concerning the Company’s management and organisation and overseeing the adequacy of the organisational structure and its proper operation. In particular, an analysis was conducted not only of the processes relating to the internal control system and the administrative-accounting system, but also the issues concerning credit, investment services, organisation and commercial activity as well as the Company’s business plans.
Said supervisory activities, and the information requested and received from the Company did not reveal any facts or irregularities worthy of mention or such that they required to be reported to the competent Authorities or Supervisory and Control Bodies.
Pursuant to the indications given by Consob in communication DEM 1025564 of April 6, 2001, we also specify the following.
Correct management practicesThe Board oversaw proper compliance with the law and the Articles of Association as well as correct management practices both at meetings of the Board of Directors and of the other bodies, and at the meetings with the Top Management and the Heads of the various Areas and Functions of the Bank. The Board can assert that, on the basis of the information obtained, the resolutions passed comply with legal regulations and with the Articles of Association, do not appear to be in conflict of interest, are in line with administrative prudence and do not jeopardise the Bank’s financial stability.
Our examinations did not reveal that the Bank entered into blatantly risky or irresponsible transactions or transactions which may prejudice the integrity of the Company’s capital.
Organisational structureThe Board of Statutory auditors assessed the adequacy of the organisational structure and its proper functioning through various meetings with top management and with the heads of the various areas and functions; no organisational shortcomings emerged from said assessment.
Specifically, in 2013, the Board supervised initiatives aimed at improving the business management and took note of the amendments made to the Bank’s central management and network structures, to the organisational chart, which clearly identifies functions, tasks and lines of responsibility, and to the Bank’s internal regulations, also with a view to compliance with Bank of Italy provisions containing implementation instructions on the organisation, procedures and internal controls needed to prevent and identify money laundering and the funding of terrorist activities. With regard to the findings and observations made by the Bank of Italy in March 2013 after the inspection of FinecoBank, they were all of an operational nature rather than punitive. The Bank has finalised the corrective measures which have either been fully implemented or have been planned and started, for completion by the first half of 2014.
The Board took note of the continuous implementation of the Guidelines issued by the Parent Company - which plays a management and coordination role vis-à-vis the Bank - and of the consequent organisational changes made by the Bank to improve the effectiveness and efficiency of its management as well as to align its structure to the target organisational model of the Group.
The Board of Statutory Auditors also assessed the adequacy of the Bank’s organisational structure as regards the internationalisation and trading margins activities, implemented as part of a specific internal policy containing adequate limits - which have always been observed - to mitigate the relative risks. The Board acknowledges that the Business Continuity Plan has been regularly updated and implemented, also for the purposes of conformity with regulatory provisions (15th update of Bank of Italy Circular no. 263/2006), and notes that the annual business continuity and disaster recovery tests were successfully concluded.
Internal control systemThe Board notes that the internal auditing of FinecoBank is outsourced to the Internal Audit Department of UniCredit S.p.A. under a service agreement, in accordance with the Group Audit Mandate authorised by the Board of Directors of FinecoBank.
Report of the Board of Statutory Auditors

61FinecoBank · The Annual Report and Accounts as at December 31, 2013
During its assessment, the Board verified compliance with the Audit Plan - in terms of both central structures and processes as well as Network structures - originally established also based on recommendations of the Board, and approved by the Board of Directors as part of the acknowledgement of the Guidelines issued by the Audit Department of the Parent Company.
The Board has successfully and systematically interacted with the Chief Audit Executive (CAE), the head of the internal audit function; the meetings held looked at, inter alia, the interim/quarterly and annual reports specifically drawn up for the Board of Directors and the Board of Statutory auditors. Based on its supervisory activities, the Board expressed a positive opinion on the internal auditing, deemed the internal control system and the work carried out by the persons in charge of internal control to be adequate.
The Company also has a Chief Risk Officer whose purpose is to assess and monitor the adequacy of the systems to measure, control and manage credit, market and operational risks as well as business risks, reputational and liquidity risks, and to check that risk mitigation operations are carried out. During its assessment, the Board met the Head of the CRO Area on a number of occasions to evaluate, among other things, its operations and to examine the quarterly reports prepared by the same. The Board expressed a positive opinion on the work carried out by the Head of the Chief Risk Office Area, noting that the “Annual Report on FinecoBank’s Risk Exposure as at December 31, 2013”, presented by the “CRO Risk Management Department” also acknowledges, inter alia, that for the Bank’s internalisation operations the various expected loss limits were never overrun in 2013. The Board verified that the Risk Management function elaborates a process for assessing capital adequacy (ICAAP) in line with the directions of the regulatory bodies and the parent company.
As part of its work, the Board met frequently with the Bank’s Compliance Manager (compliance services provided under an outsourcing agreement). The reports, plans and work of the Function were approved, and special attention was paid to compliance with the deadlines envisaged in the periodic C.A.M.P. (Compliance Assessment Mapping & Planning) for the closure of corrective actions identified from time to time, and to the contents of the FinecoBank Compliance Function Report for 2013, prepared in accordance with the “New provisions for Prudential supervision for banks” concerning the system of internal controls issued by the Bank of Italy on July 02, 2013. During 2013 the Group project on the Level 2 controls on Compliance was completed. In the final quarter of 2013, these
controls were also incorporated into the Compliance risk self-assessment process (CAMP). Using the results of the monitoring of the Bank’s units and adopting the recommendations emerging from the audit reports systematically examined by the Board and used in implementing the recommended measures, the Board also supervised the process by which the Single Group Delegate is granted powers relating to suspicious transactions, respect for those powers, the trend in complaints received by FinecoBank in 2013 and material compliance with MIFID and AML provisions - despite the presence of several areas for improvement which were mainly connected to the review or updating of internal regulations and compliance with rules on Market Abuse, which required intervention for the elimination of various inefficiencies in the reporting of suspicious transactions. In general, no issues emerged from the Compliance Function’s activities in 2013.
The Board also examined reports received from the Bank of Italy to the Bank’s Compliance function regarding claims and/or complaints sent by FinecoBank customers, and met with the function to provide clarification and details in this regard.In 2013 the Board attended 8 meetings of the Audit Committee, with which it has worked closely, given the common objectives of the two entities.
The Board of Statutory Auditors also supervised the effective functioning of the Products Committee - which reports to the Board of Directors, set up with the objective of guaranteeing compliance with legislation and preventing the reputational risks linked to the distribution of the Bank’s products and services - and of the Risks Committee.
The Chairman of the Board of Statutory Auditors also attended the meetings of the Supervisory Authority set up pursuant to Italian Legislative Decree no. 231 of 2001 and to this end, acknowledged the new version of the Bank’s Organisation and Management Model approved in 2011 by the Supervisory Authority and by the Board of Directors, and the relative Decision protocols, and retains the assessments and the recommendations of the Supervisory Authority appropriate and adequate. The “Report on the Activities Performed by the Supervisory Body under Legislative Decree no. 231 of June 08, 2011 as at December 31, 2013” revealed that the updating of decision-making protocols can be considered complete. With reference to the need to update the Organisational and Management Model following the introduction of the Anti-corruption Law (Law 190/2012) and the inclusion of two new offences in the scope of legislative decree 231, the Board decided to ask the Parent Company for guidance on the updating of the Model of FinecoBank in line with the changes made by UniCredit.

62
Report on Operations
The Annual Report and Accounts as at December 31, 2013 · FinecoBank
Report of the Board of Statutory Auditors (Continued)
Administrative - accounting systemThe Board oversaw - also by visiting the Functions and by holding regular meetings with the officers in charge - the administrative-accounting system and verified that it was adequate and reliable to provide a correct, complete and timely view of the company’s business activity.
The Board acknowledges that the financial statements as at December 31, 2013 have been drawn up in accordance with the accounting standards issued by the International Accounting Standards Board (IASB), including the SIC and IFRIC interpretation documents, approved by the European Commission as established by European Union Regulation no. 1606 of July 19, 2002, implemented in Italy through Legislative Decree no. 38 of February 28, 2005, up to December 31, 2013.
Furthermore, for the Annual Report and Accounts as at December 31, 2013 the Bank adopted the formats for the financial statements and notes, as well as the provisions set forth by the Bank of Italy through Circular no. 262 of December 22, 2005, as amended, without any exceptions, and providing due evidence and disclosure of the reclassifications carried out. The accounts also reflected the clarification received from the Bank of Italy on February 14, 2012 concerning securities lending transactions without cash guarantees, and the 2nd update of Circular no. 262/2005 implementing the changes in the principal IAS/IFRS as approved by the European Commission and applicable to financial statements closing or pending on December 31, 2013.
As at December 31, 2013 FinecoBank S.p.A. had no subsidiaries.
The Board of Statutory Auditors also assessed compliance with legislative provisions set forth in Law no. 262/2005 regarding the internal control procedures and the internal control system implemented in terms of financial reporting and the truthful representation of operational events, and found that the “Report on the Internal Control System for Financial Reporting, in compliance with Law no. 262/2005 (known as the Savings Law)”, approved by the Board of Directors on March 10, 2014. It confirms that the administrative and accounting procedures are adequate and effectively applied.
During 2013, the Administration Area sent the Parent Company periodic reports for the calculation of regulatory capital and Second Pillar capital. On 12.31.2013 the TIER 1 Capital Ratio was 12.25%.
Transactions with related parties and atypical and/or unusual transactionsFinecoBank belongs to the UniCredit S.p.A. group and is subject to the management and coordination of UniCredit S.p.A..In 2013, the Bank renewed the option for national tax consolidation for 2013-2015.
FinecoBank had no subsidiaries on 12.31.2013, nor during the year.
Relations with Group Companies and information on related party transactions, including guarantees issued at the Parent Company’s request are indicated in the Accounts, particularly in the Notes and the Report on Operations, in accordance with current laws and regulatory provisions.
The Board notes that on 01.27.2014 the Bank approved the Global Operational Instructions prepared by the Parent Company for the management of operations with parties in conflict of interest, in accordance with CONSOB Regulation 17221/2010, Bank of Italy Circular no. 263/2006 and art. 136 of legislative decree no. 385/1993 and resolved to draw up an identical document for internal use. The internal document will replace the existing procedures for the management of operations with related and affiliated parties, already approved by the Board of Directors of FinecoBank S.p.A. on June 27, 2012 after they were approved by the Board of Statutory Auditors on June 26, 2012.
With regard to application of the above procedures, the Board notes that in 2013 the Audit Committee (as the “Committee of independent directors for operations with minor affiliated parties for non-significant amounts”) only gave a single (non-binding) favourable opinion in relation to the Bank’s interest in carrying out a specific operation for a non-significant amount, and on the appropriateness and fairness of its conditions.
The Board also notes that the obligations set out in relation to parties that perform administrative, management and control functions were the subject of resolutions, pursuant to the provisions of Article 136 of Legislative Decree no. 385/1993 (TUB - Consolidated Law on Banking).
No atypical and/or unusual transactions are reported. The Notes show that the infra-group transactions were carried out on the basis of an evaluation of the value to both parties. The conditions were defined in accordance with the principles of fairness, with the common objective of creating value for the whole of the UniCredit Group. The same principle was also applied to the provision of infra-group services.

63FinecoBank · The Annual Report and Accounts as at December 31, 2013
Relations with the External AuditorsIn accordance with Article 150, paragraph 3, of Legislative Decree no. 58/98, and the provisions of Legislative Decree 39/2010, the Board held periodic meetings with the External Auditors - promptly exchanging any data or information that could be used in their respective assignments - which did not highlight any particular facts worthy of notice. The Notes contained details of the fees paid for legal accounts auditing and for the other services provided to FinecoBank during the year ending December 31, 2013 by the external auditors and other organisations in its network.
The Board notes that Deloitte & Touche S.p.A. duly completed its legal audit of the annual accounts and ensured that the company’s accounts were in order, and that management events were correctly reported. Within the scope of its remit, the firm also signed tax returns and carried out a limited accounts audit of the six-monthly financial statement, prepared for the purpose of determining regulatory capital.
The Board also received confirmation from the external auditors (under Article 17(9) of legislative decree no. 39/2010) that between 04.16.2013 and 03.28.2014 there were no situations that may have compromised the independence of the Company or resulted in incompatibilities as defined in Articles 10 and 17 of legislative decree no. 39/2010.
As regards relations with the Independent Auditors, the Board acknowledges that it has received the report in accordance with Articles 14 and 16 of Italian Legislative Decree 39/2010, and that no findings were raised. It has also received the report under Article 19(3) of the same decree, concerning fundamental issues arising during the audit, with particular regard to the significant shortcomings found in the system of internal controls on the financial reporting process, which revealed no facts or situations that need to be reported to the Board.
Complaints pursuant to art. 2408 of the Italian Civil Code - ReportsIn 2013 no complaints were filed pursuant to Article no. 2408 of the Civil Code, nor were any reports filed by third parties.
Opinions issued in accordance with the lawThe Board of Statutory Auditors has not issued any opinions in accordance with the law, as the need for the same did not arise.
Meetings held by the Shareholders, the Board of Directors, the Audit Committee and the Supervisory BodyIn 2013, the Board of Statutory auditors in office attended 2 Shareholders’ meetings, 9 Board of Directors’ meetings and 8 Audit Committee meetings. Attendance of said meetings enabled the Board, among other things, to ensure that the delegated parties had reported on transactions performed within the powers awarded to the same.
The Board of Statutory Auditors met 22 times, in addition to a number of meetings held by the Board with the managers of several of the Bank’s Organisational Units.
The Chairman of the Board took part in meetings of the Supervisory Body established pursuant to Italian Legislative Decree no. 231 of 2001.
Conclusions - Observations on the financial statements and on the proposed allocation of profit or loss as at December 31, 2013The Board, based on the supervisory activity performed, can reasonably state that the business activities carried out by FinecoBank S.p.A. were conducted in accordance with the Law and the Articles of Association. The Board also reports that it did not encounter any irregularities, omissions or reprehensible events, in fulfilling its function.
The financial statements for the year ending December 31, 2013, and the Report on Operations were received from the Board of Directors on March 10, 2014, and an amended version was then received on March 27, 2014. The additional information contained in the accounts showed that as part of the review carried out to identify the best methods of fully valuing the assets of FinecoBank, a study has been launched on the possibility of listing the Bank’s shares on a regulated market run by Borsa Italiana S.p.A. namely the Electronic Bond and Securities Market. The Board of Directors of FinecoBank, meeting on March 27, 2014, approved the proposal that the Bank’s ordinary shares be listed on the stock exchange, and requested that the proposal be submitted to the Ordinary Meeting of Shareholders.This report was filed today, as the Board has waived the period stipulated in Art. 2429 of the civil code in consideration of the prior analysis.

64
Report on Operations
The Annual Report and Accounts as at December 31, 2013 · FinecoBank
Having acknowledged the results stated in the Annual Report and Accounts, the compliance of their structure with the applicable provisions, the inclusion of the mandatory content in the report on operations and the specific independent and advance approval by the Management Body of the impairment procedure relating to goodwill recognised in the Accounts and confirming their sustainability; and having also received the Report of the External Auditors under Articles 14 and 16 of legislative decree no. 39/2010 which contained no reservations or remarks, the Board expresses its favourable opinion on the approval of the Annual Report and Accounts and the proposal for the allocation of the profit or loss for the year expressed by the Board of Directors.
Milan, March 28, 2014
The Statutory Auditors Gaccioli Giancarlo Noris - Chairman Aloisi Barbara Viozzi Marziano
Report of the Board of Statutory Auditors (Continued)

65FinecoBank · The Annual Report and Accounts as at December 31, 2013
Report of the External Auditors


With a smile and a desire to help.
Rita Pattuelli - Private Banking Bologna Centro - UniCredit SpA
“One of my Customers had just gotten married and was about to set off on her honeymoon when she called me in a panic: her credit card had been cloned. I immediately arranged for her to be sent a new card, but several days passed and the card did not turn up. I was worried, but I didn’t let on to the Customer. I kept looking into it and found out that the courier had sent the card to the wrong address. I tracked down the courier and made sure the card was delivered to the right address in time. I called the Customer, who was delighted that she could now enjoy her honeymoon!”
Respond

69FinecoBank · The Annual Report and Accounts as at December 31, 2013
Bank financial statements
Balance sheet 70Income statement 71Statement of comprehensive income 71Statement of changes in shareholders’ equity 72Cash flow statement 73

70
Bank financial statements
The Annual Report and Accounts as at December 31, 2013 · FinecoBank
BALANCE SHEET - ASSETS 12.31.2013 12.31.2012 01.01.2012
10. Cash and cash equivalents 4,634 7,002 4,29320. Financial assets held for trading 4,700,335 7,589,438 11,412,85230. Financial assets designated at fair value though profit or loss 3,199,399 10,515,659 10,408,82140. Available-for-sale financial assets 89,914,773 58,914,664 47,375,20560. Loans and receivables with banks 16,330,912,207 17,271,572,800 16,282,014,24070. Loans and receivables with customers 641,249,951 553,605,715 524,546,98980. Hedging derivatives 123,142,677 190,572,506 329,933,29590. Changes in fair value of portfolio hedged financial assets (+/-) 56,122,418 (116,827,012) (251,643,402)
110. Property, plant and equipment 10,771,844 8,700,120 9,361,514120. Intangible assets 97,615,790 97,779,193 98,320,498
of which
- goodwill 89,601,768 89,601,768 89,601,768130. Tax assets 67,934,309 46,299,707 42,879,820
a) current tax liabilities 25,264,179 3,069,769 3,515,381b) deferred tax assets 42,670,130 43,229,938 39,364,439out of which for purposes of Law 214/2011 3,473,290 3,158,837 2,978,064
140. Non-current assets and disposal groups classified as held for sale - - 144,608150. Other assets 256,629,063 162,040,083 168,991,660Total assets 17,682,197,400 18,290,769,875 17,273,750,393
BALANCE SHEET - LIABILITIES AND SHAREHOLDERS’ EQUITY 12.31.2013 12.31.2012 01.01.2012
10. Deposits from banks 1,648,675,366 2,065,152,551 1,198,063,57920. Deposits from customers 12,732,308,955 12,263,541,879 10,702,031,72930. Debt securities in issue 2,322,511,058 3,075,792,027 4,577,285,72540. Financial liabilities held for trading 2,301,409 7,177,382 3,630,31960. Hedging derivatives 141,800,654 213,885,004 370,769,51970. Changes in fair value of portfolio hedged financial liabilities (+/-) 36,773,395 (140,633,867) (295,346,384)80. Tax liabilities 37,700,727 66,588,492 58,735,710
a) current tax liabilities 16,841,629 47,268,875 40,875,739b) deferred tax liabilities 20,859,098 19,319,617 17,859,971
100. Other liabilities 227,861,470 184,804,492 182,982,044110. Provision for employee severance pay 3,760,989 3,909,356 3,289,697120. Provisions for risks and charges 109,354,461 103,084,660 88,578,539
b) other provisions 109,354,461 103,084,660 88,578,539130. Revaluation reserves 4,214,349 3,691,949 5,845,649160. Reserves 127,714,418 116,304,721 113,116,020170. Share premium reserve 1,934,113 1,934,113 1,934,113180. Share capital 200,070,431 200,070,431 200,070,431200. Net Profit (Loss) for the year 85,215,605 125,466,685 62,763,703Total liabilities and shareholders’ equity 17,682,197,400 18,290,769,875 17,273,750,393
Comparative data as at December 31, 2012 have been restated to reflect the effects of the application of IAS 19R, as described in Part A - Accounting Policies of Section 2 - General Criteria for preparing the Notes to the Accounts.Specifically:• assets booked to Item 130 - Deferred tax assets decreased by €1,699,741;• liabilities booked to Item 110 - Provision for employee severance pay increased by €784,000, while liabilities booked to Item 120 - Provisions for
risks and charges decreased by €5,891,000: b) other provisions• the balance of Item 130 - Valuation reserves increased by €3,407,259 and refers to the recognition of the positive net imbalance referred to
Valuation Reserves relative to actual gains (losses) on defined benefit plans.
As required by IAS 1 the tables above show the figures as at January 1, 2012 restated following the retrospective application of IAS 19 (‘IAS 19R’).Specifically:• assets booked to Item 130 - Deferred tax assets decreased by €3.138.251;• liabilities booked to Item 110 - Provision for employee severance pay increased by €153,348, while liabilities booked to Item 120 - Provisions for
risks and charges decreased by €9,782,000: b) other provisions• the balance of Item 130 - Valuation reserves increased by €6,490,401 and refers to the recognition of the positive net imbalance referred to
Valuation Reserves relative to actual gains (losses) on defined benefit plans.
Balance sheet

71FinecoBank · The Annual Report and Accounts as at December 31, 2013
Income statement
INCOME STATEMENT 12.31.2013 12.31.2012
10. Interest income and similar revenues 294,165,037 433,738,493
20. Interest expenses and similar charges (113,886,814) (190,269,926)
30. Net interest income 180,278,223 243,468,56740. Fee and commission revenues 359,631,069 324,378,253
50. Fee and commission expenses (192,895,035) (180,767,687)
60. Net fee and commission income 166,736,034 143,610,56670. Dividend income and similar revenue 3,026 1,091
80. Gains (losses) on financial assets and liabilities held for trading 27,937,157 26,264,072
90. Fair value adjustments in hedge accounting - -
100. Gains (losses) from disposal or repurchase of: (35,263) (793)
a) loans and receivables 52,445,828 56,984,452
d) financial liabilities (52,481,091) (56,985,245)
110. Gains (losses) on financial assets/liabilities at fair value through profit or loss 340,613 1,804,235
120. Operating income 375,259,790 415,147,738130. Impairment losses on: (3,274,680) (2,851,632)
a) loans and receivables (3,274,680) (2,851,632)
140. Net profit from financial activities 371,985,110 412,296,106150. Administrative costs (237,974,609) (209,691,852)
a) payroll costs (63,338,282) (61,022,097)
b) other administrative expenses (174,636,327) (148,669,755)
160. Net provisions for risks and charges (16,058,777) (18,355,623)
170. Impairment/Write-backs on property, plant and equipment (3,424,154) (2,995,769)
180. Impairment/write-backs on intangible assets (4,657,306) (5,249,629)
190. Other net operating income 52,068,615 26,106,460
200. Operating costs (210,046,231) (210,186,413)240. Gains (losses) on disposal of investments (6,301) (2,623)
250. Total profit (loss) before tax from continuing operations 161,932,578 202,107,070260. Tax expense (income) related to profit or loss from continuing operations (76,716,973) (76,640,385)
270. Total profit (loss) after tax from continuing operations 85,215,605 125,466,685290. Net Profit (Loss) for the year 85,215,605 125,466,685
Statement of comprehensive income
12.31.2013 12.31.2012
10. Net Profit (Loss) for the year 85,215,605 125,466,685Other comprehensive income after tax without reclassification through profit or loss40. Defined benefit plans 165,957 (3,083,142)
Other comprehensive income after tax with reclassification through profit or loss100. Available-for-sale financial assets 356,443 929,442
130. Total Other comprehensive income after tax 522,400 (2,153,700)140. Comprehensive income (item 10+130) 85,738,005 123,312,985
The comparative figures as at December 31, 2012 have been restated to incorporate the effects of the application of IAS 19 (‘IAS 19R’) as described in Part A - Accounting Policies in Section 2 - General Criteria for preparing the Notes to the Accounts.In particular, a negative income component was recognised, after tax, for the defined benefit plans, of €3,083,142.

72
Bank financial statements
The Annual Report and Accounts as at December 31, 2013 · FinecoBank
Statement of Changes in Shareholders’ Equity as at 12.31.2013
BALA
NCE
AS A
T 12
.31.
2012
CHAN
GE IN
OPE
NING
BAL
ANCE
BALA
NCE
AS A
T 01
.01.
2013
ALLOCATION OF PROFIT FROM PREVIOUS YEAR
CHANGE DURING THE YEAR
SHAR
EHOL
DERS
’ EQU
ITY
AS A
T 12
.31.
2013
CHAN
GES
IN R
ESER
VES
SHAREHOLDERS’ EQUITY TRANSACTIONS
COM
PREH
ENSI
VE IN
COM
E AS
AT
12.3
1.20
13
RESE
RVES
DIVI
DEND
S AN
D OT
HER
DIST
RIBU
TION
S
ISSU
ES O
F NE
W S
HARE
S
PURC
HASE
OF
OWN
SHAR
ES
DIST
RIBU
TION
OF
EXTR
AORD
INAR
Y DI
VIDE
NDS
CHAN
GES
IN E
QUIT
Y IN
STRU
MEN
TS
OWN
SHAR
E DE
RIVA
TIVE
S
STOC
K OP
TION
S
Share capital: a) ordinary shares 200,070,431 200,070,431 200,070,431 b) other sharesShare premium reserve 1,934,113 1,934,113 1,934,113Reserves: a) from profits 116,304,721 116,304,721 11,409,126 571 127,714,418 b) otherRevaluation reserves 3,691,949 3,691,949 522,400 4,214,349Equity instrumentsTreasury sharesNet Profit (Loss) for the period 125,466,685 125,466,685 (11,409,126) (114,057,559) 85,215,605 85,215,605Shareholders’ equity 447,467,899 - 447,467,899 - (114,057,559) 571 - - - - - - 85,738,005 419,148,916
The amount of the dividend distributed among shareholders in 2013, totalling €111,857,559.09, corresponds to €0.1845 per share.
Figures as at December 31, 2012 differ from figures published in the annual report as at that date due to retroactive the application of IAS 19R, which increased Shareholders’ equity (restated) by €3,407,259 following the recognition of net actuarial gains (after deducting related components of deferred tax assets/liabilities) under valuation reserves, as described in Part A - Accounting Policies of Section 2 - General Criteria for preparing the Notes to the Accounts.
Statement of Changes in Shareholders’ Equity as at 12.31.2012
BALA
NCE
AS A
T 12
.31.
2011
CHAN
GE IN
OPE
NING
BAL
ANCE
BALA
NCE
AS A
T 01
.01.
2012
ALLOCATION OF PROFIT FROM PREVIOUS YEAR
CHANGE DURING THE YEAR
SHAR
EHOL
DERS
’ EQU
ITY
AT 1
2.31
.201
2
CHAN
GES
IN R
ESER
VES
SHAREHOLDERS’ EQUITY TRANSACTIONS
COM
PREH
ENSI
VE IN
COM
E AS
AT
12.3
1.20
12
RESE
RVES
DIVI
DEND
S AN
D OT
HER
DIST
RIBU
TION
S
ISSU
ES O
F NE
W S
HARE
S
PURC
HASE
OF
OWN
SHAR
ES
DIST
RIBU
TION
OF
EXTR
AORD
INAR
Y DI
VIDE
NDS
CHAN
GES
IN E
QUIT
Y IN
STRU
MEN
TS
OWN
SHAR
E DE
RIVA
TIVE
S
STOC
K OP
TION
S
Share capital: a) ordinary shares 200,070,431 200,070,431 200,070,431 b) other sharesShare premium reserve 1,934,113 1,934,113 1,934,113Reserves: a) from profits 113,116,020 6,490,401 113,116,020 3,188,361 340 116,304,721 b) otherRevaluation reserves (644,752) 5,845,649 (2,153,700) 3,691,949Equity instrumentsTreasury sharesNet Profit (Loss) for the period 62,763,703 62,763,703 (3,188,361) (59,575,342) 125,466,685 125,466,685Shareholders’ equity 377,239,515 6,490,401 383,729,916 - (59,575,342) 340 - - - - - - 123,312,985 447,467,899
The amount of the dividend distributed among shareholders in 2012, totalling €59,075,341.78 euro, corresponds to €0.09744 per share.
The amount of €6.490.401 in the column “Opening adjustment” refers to the change in valuation reserves, following the introduction of IAS 19R, which resulted in the restatement of certain line items for the previous years from January 1, 2012, as described in Part A - Accounting Policies of Section 2 - General Criteria for preparing the Notes to the Accounts.
Statement of changes in shareholders’ equity

73FinecoBank · The Annual Report and Accounts as at December 31, 2013
Indirect methodA. OPERATING ACTIVITIES 12.31.2013 12.31.2012
1. Operations 147,723,676 163,504,816 - profit (loss) for the year 85,215,605 125,466,685 - capital gains/losses on financial assets/liabilities held for trading and on assets/liabilities at fair value through profit and loss (453,694) (1,488,544) - capital gains/losses on hedging operations - - - net write-offs/write-backs due to impairment 3,597,402 2,926,862 - net write-offs/write-backs on tangible and intangible assets 8,081,460 8,245,398 - provisions and other income/expenses 16,184,777 19,381,783 - duties, taxes and tax credits not paid 2,945,612 36,588,520 - net impairment/write-backs on disposal groups classified as held for sale after tax - - - other adjustments 32,152,514 (27,615,888)2. Cash flows from/used by financial assets 1,393,554,411 388,269,828 - financial assets held for trading 5,506,298 10,761,441 - financial assets at fair value through profit or loss 7,428,349 1,586,766 - available-for-sale financial assets (30,139,814) (9,841,650) - loans and receivables with banks: on demand - - - loans and receivables with banks: other loans and receivables 1,619,105,443 407,718,763 - loans and receivables with customers (91,123,760) (31,951,695) - other assets (117,222,105) 9,996,2033. Cash flows from/used by financial liabilities (684,539,106) 1,022,772,480 - deposits from banks: on demand - - - deposits from banks: other payables (402,798,040) 1,036,932,074 - deposits from customers 474,515,264 1,529,308,125 - debt securities in issue (750,000,000) (1,500,000,000) - financial liabilities held for trading (7,177,375) (3,623,090) - financial liabilities at fair value through profit and loss - - - other liabilities 921,045 (39,844,629)Net cash flows from/used in operating activities 856,738,981 1,574,547,124B. INVESTMENT ACTIVITIES1. Cash flows from - sales of equity investments - - - collected dividends on equity investments - - - sales of financial assets held to maturity - - - sales of tangible assets 229 82 - sales of intangible assets - - - disposal of businesses - -2. Cash flows used in - purchases of equity investments - - - purchases of financial assets held to maturity - - - purchases of tangible assets (5,493,421) (2,124,504) - purchases of intangible assets (4,503,485) (4,778,170) - purchases of businessesNet cash flows from/used in investing activities (9,996,677) (6,902,592)C. FINANCING ACTIVITIES - issue/purchase of treasury shares - - - issue/purchase of equity instruments - - - dividends and other distributions (114,057,559) (59,575,342)Net cash flows from/used in financing activities (114,057,559) (59,575,342)NET CASH FLOWS FROM/USED DURING THE YEAR 732,684,745 1,508,069,190
ReconciliationBALANCE SHEET ITEMS
Cash and cash equivalents at the beginning of the year 9,305,413,792 7,797,344,602Total cash flows from/used during the year 732,684,745 1,508,069,190Cash and cash equivalents at the end of the year 10,038,098,537 9,305,413,792
The term “Cash and cash equivalents” means cash recorded under item 10 of assets “Cash and cash equivalents” and the cash balances represented by short-term financial investments and other cash recorded under item 60 of assets “Loans and receivables with banks” (represented by current accounts and deposits within 3 months), net of short-term financial investments and other liquidities recorded under item 10 of liabilities “Deposits from banks” (represented by current accounts and deposits within 3 months).
Cash flow statement

CollaborateA long-standing Client of UniCredit, had been owned since 2008 by a US private equity fund. The Company consistently recorded good results and after four years, the equity fund began to consider the best options for maximizing its investment. The transaction was quite complex, involving many teams in UniCredit who worked in unison, like an orchestra, to achieve the same objective, that of satisfying all the clients involved. Our intervention enabled all of the potential buyers to be well supported and the deal was concluded in a very short time, allowing the Company to continue its growth path under a new shareholder, also a key Client of UniCredit. The US equity fund managed to achieve a very successful investment. One deal, more satisfi ed Clients. Working together for the same objective produces excellent results.
CIB Financial Sponsor Solutions - ITALY
More effi ciency, better results.

75FinecoBank · The Annual Report and Accounts as at December 31, 2013
Part A - Accounting Policies 77 Part B - Balance Sheet 105 Part C - Income Statement 137 Part D - Comprehensive Income 153 Part E - Information on risks and related risk management policies 155 Part F - Shareholders’ Equity 195 Part G - Business Combinations 203 Part H - Related-Party Transactions 205 Part I - Share-Based Payment 215 Part L - Segment Reporting 221
Notes to the Accounts


77FinecoBank · The Annual Report and Accounts as at December 31, 2013
A.1 General 78A.2 The main items of the accounts 81A.3 Information on transfers between portfolios of financial assets 97A.4 Information on fair value 98A.5 Day one profit/loss 103
Part A - Accounting Policies

78
Notes to the Accounts
The Annual Report and Accounts as at December 31, 2013 · FinecoBank
A.1 General
Section 1 - Statement of Compliance with IFRSThese Financial Statements (“Accounts”) as at December 31, 2013 have been prepared in accordance with the International Financial Reporting Standards issued by the International Accounting Standards Board (IASB), including the interpretative documents issued by the SIC and the IFRIC, and endorsed by the European Commission (“IFRS”), pursuant to EU regulation 1606/2002 of July 19, 2012, which was incorporated into Italian legislation through Legislative Decree no. 38 of February 28, 2005, and in force as at December 31, 2013 (see also Section 4 - Other Matters).
In its Circular 262 of December 22, 2005 the Bank of Italy - whose powers, already set forth by Legislative Decree 87/92, regarding the financial statements of banks and other regulated financial companies were confirmed by the above mentioned Legislative Decree 38/05 - laid down the formats for the financial statements and the related explanatory notes used to prepare these Accounts.
On January 21, 2014, the Bank of Italy issued a second revision to the Circular 262 in order to incorporate new IFRS and amendments to IFRS, as endorsed by the European Commission, effective for reporting periods beginning on or after January 1, 2013.
See also Section 2 - Preparation criteria and Part A.2 concerning the main items of the Accounts.
Section 2 - Preparation criteria As mentioned above, these Accounts have been prepared in accordance with the IFRS endorsed by the European Commission. The following documents have been used to interpret and support the application of IFRS, even though they have not all been endorsed by the European Commission:• Framework for the Preparation and Presentation of Financial Statements issued by the IASB in 2010;• Implementation Guidance, Basis for Conclusions, IFRIC and any other documents prepared by the IASB or IFRIC (International Financial Reporting
Interpretations Committee) supplementing the IFRS;
Interpretative documents on the application of IFRS in Italy prepared by the Organismo Italiano di Contabilità (OIC);• ESMA (European Securities and Markets Authority) and Consob documents on the application of specific IFRS provisions• documents prepared by the Associazione Bancaria Italiana (ABI).The Accounts comprise the Balance Sheet, the Income Statement, the Statement of Comprehensive Income, the Statement of Changes in Shareholders’ Equity, the Cash Flow Statement (compiled using the indirect method), and these Notes to the Accounts.They are accompanied by the Directors’ report on operations and the status of the Bank.
Items included in these Accounts are measured using Euro as it is the functional currency of the Bank. The presentational currency of these Accounts is the Euro.
All figures in the financial statements are provided in euros, and in thousands of euros in the Notes to the Accounts, unless when otherwise indicated. In accordance with the Bank of Italy Circular 262/2005, items in the Balance Sheet, Income Statement and Statement of Comprehensive Income for which there is no figures to be disclosed both for the year being reported and for the previous year are not shown.
In addition, the tables in the Notes to the Accounts for which there is no significant information to be disclosed both for the year being reported and for the previous year are not included.
These Accounts have been prepared on a going concern basis, in accordance with the provisions of IAS 1, as there are no doubts or uncertainties as to the Bank’s ability to continue its business operations and to continue operating for the foreseeable future (at least for the next 12 months).
The measurement criteria adopted are therefore consistent with this assumption and with the principles of accrual based accounting, the relevance and materiality of accounting information, and the prevalence of economic substance over legal form. These criteria have not changed with respect to to the previous year, except for the modifications described in Part A.2 “The main items of the Accounts”, with reference to new standards and interpretations becoming effective.
Part A - Accounting Policies

79FinecoBank · The Annual Report and Accounts as at December 31, 2013
2nd revision of January 21, 2014, to Bank of Italy Circular 262/2005 The second revision to the Bank of Italy Circular 262/2005 introduced the following main changes to the formats for the financial statements and explanatory Notes to the Accounts:- items included in the Statement of Comprehensive Income are divided into two categories, which reflect the possibility of reclassifying or not
reclassifying them to the income statement in a subsequent financial year;- new information on defined benefit plans;- further qualitative and quantitative information on fair value and its hierarchical levels;- further information in Part E on impaired financial assets, as well as quantitative data on own assets, recognised or not recognized in the financial
statements, divided into encumbered and unencumbered assets.
Section 3 - Subsequent eventsAs part of the examination aimed at identifying instruments and means capable of fully leveraging FinecoBank’s activities, assessments were initiated regarding the possibility of listing the Company’s shares on a market organised and managed by Borsa Italiana S.p.A. and in particular on Borsa Italiana S.p.A.’s Electronic Stock Market. FinecoBank has succeeded, among other things, in creating a unique business model that combines an efficient and innovative online platform with a top class network of financial advisers, in increasing the range and quality of the products and services it offers, in maintaining and strengthening a leading role in terms of technological know-how and innovations and, more generally, of establishing and reinforcing its position in its market, through progressive and steady growth.
In this scenario, the listing is a necessary step in the efforts aimed at the Company’s growth. The expansion of the shareholding structure, which will result, will enable the Bank to increase the visibility of its business model and, accordingly, augment its market standing, also through the introduction of Italian and international professional investors, thereby accelerating its path of growth.
On March 27, 2014 Board of Directors of FinecoBank approved and requested to submit for approval to the Ordinary Shareholders’ Meeting the proposal for admission for listing on the Stock Exchange of the Bank’s ordinary shares.
No events have occurred after December 31, 2013 that would make it necessary to change any of the information given in the Accounts.
The Accounts were approved by the Board of Directors’ meeting of March 27, 2014, which authorised their publication.
Section 4 - Other MattersInternational accounting standards in force since January 1, 2013 applied by the Bank, where required- Amendments to IAS 1 - Presentation of Financial Statements - Presentation of Items of Other Comprehensive Income (EU Regulation 475/2012);- Amendments to IAS 12 - Deferred Tax: Recovery of Underlying Assets (EU Regulation 1255/2012);- Amendments to IAS 19 - Employee Benefits (EU Regulation 475/2012);- Amendments to IAS 32 - Offsetting Financial Assets and Financial Liabilities (EU Regulation 1256/2012);- Amendments to IFRS 1 - Severe Hyperinflation and Removal of Fixed Dates for First-Time Adopters (EU Regulation 1255/2012);- Amendments to IFRS 1 - First-time adoption of International Financial Reporting Standards- Government Loans (Commission Regulation (EU)
183/2013);- Amendments to IFRS 7 - Financial Instruments: Disclosures - Offsetting Financial Assets and Financial Liabilities (EU Regulation 1256/2012);- IFRS 13 - Fair value measurement (EU Regulation 1255/2012);- IFRIC 20 - Stripping Costs in the Production Phase of a Surface Mine (EU Regulation 1255/2012);- Annual Improvements to the International Financial Reporting Standards, 2009-2011 Cycle (EU Regulation 301/2013).
In particular, the application with effect from January 1, 2013, of the Amendments to IAS 19 (IAS 19R) regarding “post-employee benefits” (including employee severance pay provisions) resulted in the following changes:• the elimination of the “corridor method”, with
(i) the changes in “Defined Benefit Obligation” recognised in the Balance Sheet when they occur based on the relative actuarial valuation and (ii) all the actuarial gains/losses resulting from the valuation of the defined benefit obligation immediately recognised through other comprehensive
income in the Balance Sheet under Revaluation reserves;• revaluation reserve changes disclosed in the “Statement of Comprehensive Income”;• extended disclosures describing the methods and assumptions used for the measurement of the commitments also providing sensitivity analyses of
the “Defined Benefit Obligation” upon change of the actuarial assumptions.

80
Part A - Accounting Policies (Continued)
Notes to the Accounts
The Annual Report and Accounts as at December 31, 2013 · FinecoBank
The retroactive application of IAS 19R - also requiring the restatement of the previous periods starting from January 1, 2012 - to the recognition of the employee severance pay provision (TFR) and, under “Other provisions for risks and charges” to the supplementary customer indemnity provision and the contractual payments for financial advisers, led to the remeasurement and restatement of certain line items of the previous periods presented for comparative purposes, as detailed here below:
BALANCE SHEET - ASSETS12.31.2011
PRE IAS 19RADJUSTMENT
IAS 19R 01.01.201212.31.2012
PRE IAS 19RADJUSTMENT
IAS 19R 12.31.2012
130. Tax assets 46,018,071 (3,138,251) 42,879,820 47,999,448 (1,699,741) 46,299,707
b) deferred tax assets 42,502,690 (3,138,251) 39,364,439 44,929,679 (1,699,741) 43,229,938Total assets 17,276,888,644 (3,138,251) 17,273,750,393 18,292,469,616 (1,699,741) 18,290,769,875
ITEMS OF LIABILITIES AND SHAREHOLDERS’ EQUITY 12.31.2011
ADJUSTMENT IAS 19R 01.01.2012 12.31.2012
ADJUSTMENT IAS 19R 12.31.2012
110. Allocation to employee severance pay provisions 3,136,349 153,348 3,289,697 3,125,356 784,000 3,909,356
120. Provisions for risks and charges 98,360,539 (9,782,000) 88,578,539 108,975,660 (5,891,000) 103,084,660
b) other reserves 98,360,539 (9,782,000) 88,578,539 108,975,660 (5,891,000) 103,084,660130. Revaluation reserves (644,752) 6,490,401 5,845,649 284,690 3,407,259 3,691,949
Total liabilities and shareholders’ equity 17,276,888,644 (3,138,251) 17,273,750,393 18,292,469,616 (1,699,741) 18,290,769,875
STATEMENT OF COMPREHENSIVE INCOME12.31.2012
PRE IAS 19RADJUSTMENT
IAS 19R 12.31.2012
Other comprehensive income after tax without reclassification through profit or loss40. Defined benefit plans - (3,083,142) (3,083,142)
130. Total other comprehensive income after tax 929,442 (3,083,142) (2,153,700)140. Comprehensive income (item 10+130) 126,396,127 (3,083,142) 123,312,985
The first-time adoption - prospective from January 1, 2013 - of IFRS 13 “Fair value measurement”, which establishes a single source of guidance for fair value measurements and disclosures about fair value measurements, keeps substatntially unchanged the concept of fair value and introduces new practical guidelines enhancing the financial statement disclosures, has not had any material impact on the amounts recognized in the Balance sheet, Income Statement and Statement of comprehensive income of the Bank, other than additional disclosures.
International accounting standards endorsed by the European Commission but not yet effective and not applied in advance by the BankIn 2012 and 2013 the European Commission also endorsed the following accounting standards, which will be effective for reporting periods beginning on or after January 1, 2014:- IAS 27 revised - Separate Financial Statements (EU Regulation 1254/2012);- IAS 28 revised - Investments in Associates and Joint Ventures (EU Regulation 1254/2012);- IFRS 10 - Consolidated Financial Statement (EU Regulation 1254/2012);- IFRS 11 - Joint Arrangements (EU Regulation 1254/2012);- IFRS 12 - Disclosure of Interests in Other Entities (EU Regulation 1254/2012);- Amendments to IAS 36 - Recoverable Amount Disclosures for Non-Financial Assets (EU Regulation 1374/2013);- Amendments to IAS 39 - Novation of Derivatives and Continuation of Hedge Accounting (EU Regulation 1375/2013);- Amendments to IFRS 10, IFRS 11 and IFRS 12 - Transition Guidance (EU Regulation 313/2013);- Amendments to IFRS 10, IFRS 12 and IAS 27 - Investment Entities (EU Regulation 1174/2013).
International accounting standards not yet endorsed by the European CommissionAs at December 31, 2013, the IASB issued the following accounting standards, amendments and interpretations, the adoption of which is however subject to endorsement by the European Commission:- IFRS 9 - Financial Instruments (November 2009, amended as at October 2010) and the following subsequent amendments:
• Amendments to IFRS 9 and IFRS 7 - Mandatory Effective Date and Transition - December 2011);• Hedge accounting and amendments IFRS9, IFRS7 and IAS 39 - November 2013;
- IFRIC 21 - Levies (May 2013);- Amendments to IAS 19 - Defined Benefit Plans: Employee Contributions (November 2013);- Annual Improvements to the International Financial Reporting Standards, 2010-2012 Cycle (December 2013); - Annual Improvements to the International Financial Reporting Standards, 2011-2013 Cycle (December 2013).
These Accounts are audited by Deloitte & Touche S.p.A. pursuant to Legislative Decree 39 of January 27, 2010 and the resolution passed by the Shareholders’ Meeting on April 16, 2013. The entire document is lodged with the competent offices and entities as required by law.

81FinecoBank · The Annual Report and Accounts as at December 31, 2013
Risks and uncertainties related to the use of estimatesIn the application of the accounting policies the management is required to make judgments, estimates and assumptions about the carrying amounts of certain assets and liabilities as well as the information regarding potential assets and liabilities. The estimates and associated assumptions are based on historical experience and other factors that are considered to be relevant. Actual results may differ from these estimates.
Estimated figures have been used for the recognition of some of the largest value-based items in the Accounts as at December 31, 2013, as required by the accounting standards and regulations described above. These estimates are largely based on calculations of future recoverability of the values recognised in the accounts according to the rules laid down in current legislation and have been made on the assumption of a going concern, i.e. without contemplating the possibility of the forced sale of the estimated items.
The processes adopted support the carrying values at December 31, 2013. Valuation is particularly complex given the uncertainty in the macroeconomic and market environment, characterized by the significant volatility in the financial parameters used in the valuation process and still high signs of deterioration in credit quality.The parameters and information used to check the above-mentioned values are therefore significantly affected by such factors, which could change rapidly in ways that are currently unforeseeable, such that further effects on future carrying values cannot be ruled out.
The estimates and underlying assumptions are reviewed on an ongoing basis. Revisions to accounting estimates are recognised in the period in which the estimate is revised if the revision affects only that period or in the period of the revision and future periods if the revision affects both current and future periods.
Uncertainty affecting estimates is generally inherent in the determination of: - fair value of financial instruments not listed in active markets;- loans and receivables, and in general, all other financial assets/liabilities;- severance pay and other employee benefits;- provisions for risks and charges;- goodwill; - deferred tax assets; and - tax liabilities;whose quantification may be significantly influenced by trends in domestic and international socio-economic conditions and by the performance of the financial markets which affect interest rates, price fluctuations, actuarial assumptions and, more generally, the creditworthiness of borrowers and counterparties, as well as the progress and development of on-going or potential litigation.
With particular reference to projections of future cash flows used in the valuation of goodwill, it should be noted that the parameters and information used are significantly affected by the macroeconomic market context, which may change in unpredictably way. For further information, see Part B - Balance Sheet - Section 12 - Intangible assets.
With particular reference to valuation techniques and methodologies, unobservable inputs used in the fair value measurement and sensitivity to changes in those inputs, please see section Qualitative information.<
A.2 The main items of the accounts1 - Financial Assets held for trading (HfT)A financial asset is classified as held for trading if it is:• acquired or incurred principally for the purpose of selling or repurchasing it in the near term;• part of a portfolio of identified financial instruments that are managed together and for which there is evidence of a recent actual pattern of short-
term profit-taking;• a derivative (except for derivatives which constitute financial guarantees, see Section 17, and derivatives designated as hedges - see Section 6).
Like other financial instruments, on initial recognition, at settlement date, a held-for-trading financial asset is measured at its fair value, usually equal to the amount paid, excluding transaction costs and income, which are recognised through profit or loss even when directly attributable to the financial assets. Trading book derivatives are recognised on trade date. After initial recognition, these financial assets are measured at their fair value through profit or loss. An exception is represented by derivatives settled by delivery of an unlisted equity instrument whose fair value cannot be reliably measured, and which are therefore measured at cost.

82
Part A - Accounting Policies (Continued)
Notes to the Accounts
The Annual Report and Accounts as at December 31, 2013 · FinecoBank
A gain or loss arising from sale or redemption or a change in the fair value of a HfT financial asset is recognised in profit or loss in item 80 “Gains (losses) on financial assets and liabilities held for trading”, with the exception of financial derivatives relating to a fair value option of which gains and losses, whether realised or measured, are booked in item 110 “Gains (losses) on financial assets/liabilities at fair value through profit and loss” (see Section 5). If the fair value of a financial asset falls below zero, which may happen with derivative contracts, it is recognised in item 40 “Financial liabilities held for trading”.
A derivative is a financial instrument or other contract with all three of the following characteristics:• its value changes in response to the change in a specified interest rate, financial instrument price, commodity price, foreign exchange rate, index of
prices or rates, credit rating or credit index, or other variable (usually called the “underlying”) provided that, in the case of a non-financial variable, it is not specific to one of the contractual parties;
• it requires no initial net investment or an initial net investment that is smaller than would be required for other types of contracts that would be expected to have a similar response to changes in market factors;
• it is settled at a future date.
An embedded derivative is a component of a hybrid (combined) instrument that also includes a non-derivative host contract, with the effect that some of the cash flows of the combined instrument vary in a way similar to a stand-alone derivative.
An embedded derivative is separated from the host contract and recognised as a derivative if:• the economic characteristics and risks of the embedded derivative are not closely related to those of the host contract;• a separate instrument with the same terms as the embedded derivative would meet the definition of a derivative;• the hybrid (combined) instrument is not measured entirely at fair value through profit or loss.
If it is necessary to separate an embedded derivative from its host contract, but it is not possible to measure the embedded derivative separately either at acquisition or at a subsequent financial reporting date, the entire combined contract is treated as a financial asset or financial liability at fair value through profit or loss.
When an embedded derivative is separated, the host contract is recognised according to its accounting classification.
A derivative that is attached to a financial instrument but is contractually transferable independently of that instrument, or has a different counterparty from that instrument, is not an embedded derivative, but a separate financial instrument.
2 - Available-for-sale Financial Assets (AfS)Available-for-sale financial assets are those non-derivative financial assets that are designated as available for sale or are not classified as loans and receivables, held-to-maturity investments, financial assets held for trading or financial assets at fair value through profit or loss. These assets are held for an indefinite period of time and meet the need to ensure liquidity and face changes in interest rates, exchange rates and prices.
AfS financial assets are money market instruments, other debt instruments (including the primary component of structured instruments after the embedded derivative has been separated) or equity instruments; they include shares held as minority stakes where these do not constitute controlling or associate interests, or joint control.
On initial recognition, at settlement date, an AfS financial asset is measured at fair value, which is usually equal to the consideration of the transaction, plus transaction costs and income directly attributable to the instrument.
In subsequent periods, AfS assets are measured at fair value, the interest on interest-bearing instruments being recognized at amortized cost in the income statement. Gains or losses arising from changes in fair value are recognised in equity item 130. “Revaluation reserves”, except losses due to impairment and exchange rate gains or losses on monetary items (debt instruments) which are recognised under item 130.b) “Impairment losses on AfS financial assets” and item 80. “Gains (losses) on financial assets and liabilities held for trading” respectively, until the financial assets are sold, at which time cumulative gains and losses are recognised in profit or loss in item 100.b) “Gains (losses) on disposal or repurchase of AfS financial assets”.
The fair value changes recorded in item 130. “Revaluation reserves” are reported in the Statement of Comprehensive Income.
Equity instruments (shares) not listed in an active market and whose fair value cannot be reliably determined, because information to determine fair value is not available or is unreliable, are valued at cost, corresponding to the last fair value reliably determined.
If there is objective evidence of an impairment loss on an available-for-sale financial asset, the cumulative loss that had been recognised directly in equity item 130 “Revaluation reserves”, is removed from equity and recognised in profit or loss under item 130.b) “Impairment losses on available-for-sale financial assets”.

83FinecoBank · The Annual Report and Accounts as at December 31, 2013
In respect of debt instruments, any circumstances indicating that the borrower is experiencing financial difficulties which could prejudice the collection of the principal or interest, represent an impairment loss.
Lasting loss of value of equity instruments is assessed on the basis of indicators such as fair value below cost and adverse changes in the environment in which the company operates, as well as the issuer’s debt service difficulties.
The loss of value is normally considered lasting if fair value falls to less than 50% of cost or lasts for more than 18 months.If, however, the fall in the fair value of the instrument is over 20% but less than or equal to 50% or continues for no less than 9 but no longer than 18 months, the Bank reviews further income and market indicators. If the results of the review are such as to prejudice the recovery of the amount originally invested, a lasting loss of value is recognised.The amount taken to profit and loss is therefore the difference between the carrying amount (value of initial recognition less any impairment loss already recognised in profit or loss) and current fair value.Where instruments are valued at cost, the amount of the loss is determined as the difference between their carrying value and the present value of estimated future cash flows, discounted at the current market yield on similar financial assets (i.e. the recoverable value).
If, in a subsequent period, the fair value of a debt instrument increases and the increase can be objectively related to an event such as an improvement in the debtor’s credit worthiness occurring after the impairment loss was recognized in profit or loss, the impairment loss is reversed and the amount of the reversal is recognized in the same profit or loss item. The reversal cannot result in a carrying amount that exceeds what the amortised cost would have been had the impairment not been recognised.
Impairment losses recognised in profit or loss for an investment in an equity instrument classified as available for sale are not reversed through profit or loss, but recognised at equity.
3 - Held-to-Maturity Investments (HtM)Held-to-maturity investments are non-derivative financial assets with fixed or determinable payments and fixed maturity for which there is the positive intention and ability to hold them to maturity (including the primary component of structured instruments after the embedded derivative has been separated).
If, during the financial year, more than an insignificant amount of held-to-maturity investments are sold or reclassified before maturity, the remaining HtM financial assets shall be reclassified as available-for-sale and no financial assets shall be classified as HtM investments for the two following financial years, unless the sales or reclassifications:- are so close to maturity or the financial asset’s call date that changes in the market rate of interest would not have a significant effect on the
financial asset’s fair value;- occur after substantially all of the financial asset’s original principal has been collected through scheduled payments or prepayments; or- are attributable to an isolated event that is beyond the reporting entity’s control, is non-recurring and could not have been reasonably anticipated. After initial recognition at its fair value, which will usually be the price paid including transaction costs and income directly attributable to the acquisition or provision of the financial asset (even if not yet settled), a held-to-maturity financial asset is measured at amortised cost using the effective interest method. In the case of sale/elimination, the difference in the book value and amount collected is recognised in profit or loss under item 100.c) “Gains (losses) from disposal or repurchase”.
If there is objective evidence that a held-to-maturity investment is impaired, the impairment loss is measured as the difference between the asset’s carrying amount and the present value of the estimated future cash flows discounted using the original effective interest rate of the financial asset. The carrying amount of the asset is reduced accordingly and the loss is recognised in profit or loss under item 130(c) “Impairment losses on held-to-maturity investments”.
If, in a subsequent period, the amount of an impairment loss decreases and the decrease can be related objectively to an event such as an improvement in the debtor’s credit worthiness occurring after the impairment loss was recognized, the previously recognized impairment loss is reversed. The reversal cannot result in a carrying amount that exceeds what the amortised cost would have been had the impairment not been recognised. The amount of the reversal is recognised in the same profit or loss item.Held-to-maturity investments cannot be hedged for other than the credit/non-performance risk.
At the balance sheet date, the Bank did not hold any financial assets classified as “Held-to-maturity investments”.

84
Part A - Accounting Policies (Continued)
Notes to the Accounts
The Annual Report and Accounts as at December 31, 2013 · FinecoBank
4 - Loans and ReceivablesLoans and AdvancesLoans and receivables are non-derivative financial assets with fixed or determinable payments that are not quoted in an active market. Loans and receivables are recognised on the date of contract signing, which normally coincides with the date of disbursement to the borrower.These items include debt instruments with the above characteristics (including the primary component of structured instruments after the embedded derivative has been separated) or those subject to portfolio reclassification in accordance with IAS 39 (see Part A.3.1 below - Transfers between portfolios).
After initial recognition at fair value, which usually is the price paid including transaction costs and income which are directly attributable to the acquisition or issuance of the financial asset (even if not paid), a loan or receivable is measured at amortized cost, allowances or reversals of allowances being made where necessary on remeasuring. A gain or loss on loans and receivables, where not hedged, is recognised in profit or loss:• when a loan or receivable is de-recognised: in item 100 (a) “Gains (losses) on disposal”;or:• when a loan or receivable is impaired (or the impairment loss previously recognized is reversed): in item 130. a) “Impairment losses on loans and
receivables”.
Interest on loans and receivables is recognised in profit or loss on an accrual basis by using the effective interest rate method under item 10 “Interest income and similar revenue”.Delay interest is taken to the Income Statement on collection or receipt.
Loans and receivables are reviewed in order to identify those that, following events occurring after initial recognition, show objective evidence of possible impairment. These impaired loans are reviewed and analysed periodically at least once a year.
A loan or receivable is deemed impaired when it is considered that it will probably not be possible to recover all the amounts due according to the contractual terms, or equivalent value.
Allowances for impairment of loans and receivables are based on the present value of expected cash flows of principal and interest; in determining the present value of future cash flows, the basic requirement is the identification of estimated collections, the timing of payments and the rate used.
The amount of the loss on impaired exposure classified as non-performing, doubtful or restructured according to the categories specified below, is the difference between the carrying value and the present value of estimated cash flows discounted at the original interest rate of the financial asset. If the original rate is not immediately available, or if obtaining it is too burdensome, its best approximation will be applied.
For all fixed rate exposures, the interest rate so determined is kept constant also in subsequent financial years, while for floating rate positions the interest rate is updated with respect to the floating component used as a reference while keeping the spread originally set constant.
Recovery times are estimated on the basis of any repayment schedules agreed with the borrower or included in a business plan or in forecasts based on historical recovery experience observed for similar classes of loans, taking into account the type of loan, the geographical location, the type of security and any other factors considered relevant.
Any subsequent change with respect to initial expectations of the amount or timing of expected cash flows of principal and interest causes a change in allowances for impairment and is recognised in profit or loss in item 130. (a) “Impairment losses on loans and receivables”.
In the Notes to the Accounts, write-downs of impaired loans are classified as specific in the relevant Income Statement item even when the calculation is flat-rate or statistical, as indicated below.
When the reasons for the impairment no longer exist, and this assessment is objectively attributable to an event such as an improvement in the debtor’s credit worthiness occurred after the impairment, a reversal is made in the same profit or loss item, within the amount of the amortized cost that there would have been if there had been no impairments.
Derecognition of a receivable in its entirety is made when the receivable is deemed to be irrecoverable or is written off. Write-offs are recognised directly in profit or loss under item 130(a) “Impairment losses on loans and receivables” and reduce the amount of the principal of the loan or receivable. Reversals of all or part of amounts previously written off are recognised in the same item.
According to Bank of Italy regulations, impaired loans and receivables are classified into the following categories:- Non-performing loans - formally impaired loans, being exposure to insolvent borrowers, even if the insolvency has not been recognised in a court
of law, or borrowers in a similar situation. Measurement is generally on a loan-by-loan basis or, for loans singularly not significant, on a portfolio basis for homogeneous categories of loans;

85FinecoBank · The Annual Report and Accounts as at December 31, 2013
- Doubtful loans - exposure to borrowers experiencing temporary difficulties, which the Group believes may be overcome within a reasonable period of time. Doubtful loans also include loans not classified as non-performing granted to borrowers other than government entities where the following conditions are met:• they have fallen due and remained unpaid for more than 270 days (or for more than 150 or 180 days for consumer credit exposure respectively
with an original term of less than or equal to and over 36 months);• the amount of the above exposure to the same borrower and other defaulted payments that are less than 270 days overdue, is at least 10% of the
total exposure to that borrower.
Doubtful loans are valued individually when special elements make this advisable or by individually applying flat percentages on a historical or stochastic basis in the remaining cases;- restructured loans, - exposure to borrowers with whom a rescheduling agreement has been entered into including renegotiated pricing at interest
rates below market, the conversion of part of a loan into shares (debt to equity swap) and/or reduction of principal; measurement is on a loan-by-loan basis, including discounted cost due to renegotiation of the interest rate at a rate lower than the original contractual rate. Restructured exposures can be reclassified under unimpaired loans only after two years have passed from the date of signing of the restructuring agreement and a resolution has been adopted by the competent corporate bodies declaring that the debtor’s full solvency has been restored and that there are no outstanding balances on all existing lines of credit.
- past-due loans - total exposure to any borrower not included in the other categories, which at the balance-sheet date has expired facilities or unauthorised overdrafts that are more than 90 days past due and meet the requirements set out by supervisory regulations (ref. Bank of Italy’s Circular No. 263 of December 27, 2006 “New regulations for the prudential supervision of banks” as amended) for their classification under the “past due exposures” category (TSA banks).
Total exposure is recognised in this category if, at the balance-sheet date, either:• the expired or unauthorised borrowing;or:• the average daily amount of expired and/or unauthorised borrowings during the last preceding quarter is equal to or exceeds 5% of total exposure. Past-due exposures are valued using a statistical approach based on historical data, applying where available the degree of risk as measured by the risk factor used for Basel II reporting (loss given default).
For information about forbearance loans, see Part E - section 1 - credit risk below.
Collective assessment is used for groups of loans for which individually there are no indicators of impairment: to these portfolios a latent impairment can be attributed, according to the method described below, inter alia on the basis of the risk factors used under Basel II.
Each loan with similar characteristics in terms of credit risk - in relation to loan type, the borrower’s sector of economic activity, type of security or other relevant factors - is assessed in terms of its probability of default and loss given default; these are uniform for each class of loan.
The methods used combine Basel II recommendation and IFRS. The latter exclude future loan losses not yet sustained, but include losses already sustained even if they were not manifest at the time of measurement, on the basis of past experience of losses on assets having a similar risk profile to the assets being measured.
The average time elapsed from deterioration of borrowers’ financial conditions to the recognition of impairment losses, in relation to any homogeneous group of exposures, is the loss confirmation period.
The portfolio valuation is the product of the risk factors derived from the parameters used under Basel II requirements (with a one-year time horizon) and the above loss confirmation periods expressed as part of a year and diversified according to asset class on the basis of the characteristics and development level of the credit processes.
If these indicators are not available, estimated value and standard loss percentages, based on internal historical series and sectorial studies, shall be used.
Allowances for impairment reduce the loan or receivable’s carrying amount. The risk inherent in off-balance-sheet items, such as loan commitments, losses due to impairment of guarantees and comparable credit derivatives under IAS 39, is recognized in profit or loss under item 130(d) “Impairment losses (d) other financial assets” offsetting, offsetting item 100 “Other liabilities”).

86
Part A - Accounting Policies (Continued)
Notes to the Accounts
The Annual Report and Accounts as at December 31, 2013 · FinecoBank
5 - Financial Instruments at Fair Value through Profit or Loss (FIaFV)Any financial asset may be designated, in accordance with the provisions of IAS 39 as a financial instrument measured at fair value through profit and loss on initial recognition, except for the following:- investments in equity instruments for which there is no price quoted in active markets and whose fair value cannot be reliably determined;- derivatives.
FIaFV includes financial assets:- not belonging to regulatory trading book, whose risk is:
• connected with debt positions measured at fair value (see also section 15 “Financial liabilities at fair value through profit and loss”); and• managed by the use of derivatives not treatable as accounting hedges.
- represented by hybrid (combined) instruments containing embedded derivatives that otherwise should have been separated from the host contract.
FIaFV are accounted for in a similar manner to HfT financial assets (see Section 1), however gains and losses, whether realised or unrealized, are recognized in item 110 “Gains (losses) on financial assets and liabilities measured at fair value”.
6 - Hedge AccountingHedging derivatives are those created to hedge market risks (interest-rate, currency and price) to which the hedged positions are exposed. They may be described as follows:- Fair value hedge: a hedge of the exposure to changes in fair value of a recognised asset or liability, or an identifiable portion of such an asset or
liability;- cash flow hedge: a hedge of the exposure to variability in cash flows that is attributable to a particular risk associated with a recognized asset or
liability or a highly probable forecast transaction which could affect profit or loss in future periods;- Hedge of a net investment in a foreign entity whose operations are located or run in a non-EU country or whose transactions are carried out in a
currency other than the euro.
Hedging derivatives are initially recognised on trade date and are valued at their fair value.
A hedging relationship qualifies for hedge accounting if there is formal designation and documentation of the hedging relationship including the risk management objective, the strategy for undertaking the hedge, and how the hedging instrument’s prospective and retrospective effectiveness will be assessed. It is necessary to assess the hedge’s effectiveness, at inception and in subsequent periods, in offsetting the exposure to changes in the hedged item’s fair value or cash flows attributable to the hedged risk.
A hedge is regarded as highly effective if, at the inception of the hedge and in subsequent periods, it is determined prospectively to remain highly effective, and the retrospectively verified that the hedge ratio (i.e. the changes in fair value of hedged items and hedging instruments) is within a range of 80-125 per cent. The hedge is assessed on an on-going basis and thus must prospectively remain highly effective throughout the financial reporting periods for which it has been designated.
The assessment of effectiveness is made at each balance-sheet date or other reporting date. If the assessment does not confirm the effectiveness of the hedge, from that time on hedge accounting is discontinued in respect of the hedge and the hedging derivative is reclassified as a held-for-trading instrument.In addition, the hedging relationship ceases when the hedging instrument expires or is sold, terminated or exercised; the hedged item is sold, expires or is repaid; or it is no longer highly probable that the forecast transaction will occur.
Hedging derivatives are measured at fair value. Specifically:- Fair Value hedging - an effective fair value hedge is accounted for as follows: the gain or loss from remeasuring the hedging instrument at fair
value is recognised through profit or loss in item 90. “Fair value adjustments in hedge accounting”; the gain or loss on the hedged item attributable to the hedged risk adjusts the carrying amount of the hedged item and is recognised through profit or loss in the same item. If the hedging relationship is terminated for reasons other than the sale of the hedged item, this is measured according to the original criterion dictated by the accounting standard applied to the relevant portfolio. In the case of interest-bearing instruments, the difference between the carrying amount of the hedged item on termination of the hedging and the carrying amount it would have had if the hedge had never existed, is recognised through profit or loss in interest receivable or payable over the residual life of the original hedge. The difference in fair value of the hedging derivative since the latest effectiveness testing date is recognised in profit or loss under item 90 “Fair value adjustments in hedge accounting”. If the hedged item is sold or repaid, the portion of fair value which is still unamortised is at once recognised through profit or loss in the item 100. “Gains (losses) on disposal or repurchase”;
- Cash Flow Hedging - hedges are valued at fair value Change in the fair value of a hedging instrument that is considered effective is recognised in equity item 130 “Revaluation reserves”. The ineffective portion of the gain or loss is recognised through profit or loss in item 90 “Fair value adjustments in hedge accounting”. If a cash flow hedge is determined to be no longer effective or the hedging relationship is terminated, the cumulative gain or loss on the hedging instrument that remains recognised in “Revaluation reserves” from the period when the hedge was effective

87FinecoBank · The Annual Report and Accounts as at December 31, 2013
remains separately recognised in “Revaluation reserves” until the forecast hedged transaction occurs or is determined to be no longer possible; in the latter case gains or losses are transferred through profit or loss to item 80. “Gains (losses) on financial assets and liabilities held for trading”. The fair value changes recorded in item 130 “Revaluation reserves” are also disclosed in the Statement of Comprehensive Income.
- Hedging a Net Investment in a Foreign Company - hedges of a net investment in a company whose operations are located or managed in a foreign country or in a currency other than the euro are accounted for similarly to cash flow hedges. The gain or loss on the hedging instrument relating to the effective portion of the hedge that has been recognized directly in equity is recognized through profit or loss on disposal of the foreign entity. The fair value changes recorded in item 130 “Revaluation reserves” are also disclosed in the Statement of Comprehensive Income, whereas the ineffective portion of the gain or loss is recognized through profit or loss in item 90. “Fair value adjustments in hedge accounting”.
- Macro-hedged Financial Assets (Liabilities) - IAS 39 allows a fair-value item hedged against interest rate fluctuations to be not only a single asset or liability but also a monetary position contained in a number of financial assets or liabilities (or parts of them); accordingly, a group of derivatives can be used to offset fair-value fluctuations in hedged items due to changes in market rates. Macro hedging may not be used for net positions resulting from the offsetting of assets and liabilities. As for fair value micro hedging, macro hedging is considered highly effective if, at the inception of the hedge and in subsequent periods, changes in the fair value attributable to the hedged position are offset by changes in fair value of the hedging instrument and if the hedge ratio is retrospectively assessed falling within the range of 80-125 per cent. Net changes - gains or losses - in the value of the macro-hedged assets and liabilities attributable to the hedged risk are recognised in asset item 90 and liability item 70 respectively and offset the profit and loss item 90 “Fair value adjustments in hedge accounting”.The ineffectiveness of the hedging arises to the extent that the change in the fair value of the hedging item differs from the change in the fair value of the hedged monetary position. The extent of hedge ineffectiveness is in any case recognised in profit and loss item 90. “Fair value adjustments in hedge accounting”. If the hedging relationship is terminated, for reasons other than the sale of the hedged items, cumulative gain or loss in items 90 (Assets) and 70 (Liabilities) is recognised through profit or loss in interest income or expenses, along the residual life of the hedged financial assets or liabilities.If the latter are sold or repaid, unamortised fair value is at once recognised through profit and loss in item 90. “Fair value adjustments in hedge accounting”.
As of the balance sheet date, the Bank only had macro-hedges against interest rate risk in place.
7 - Equity InvestmentsAt the end of the reporting period, the Bank held no investments in subsidiaries, associates and joint ventures regulated by IAS 27 Consolidated and Separate Financial Statements, IAS 28 Investments in Associates, and IAS 31 Interests in Joint Ventures.Remaining interests other than subsidiaries, associates and joint ventures, and interests recognized in items 150 “Non-current assets and disposal groups classified as held for sale” are classified as financial assets available for sale”.
8 - Property, Plant and Equipment (Tangible Assets)The item includes:- buildings- furniture and fixtures- plant and machinery- other machinery and equipment
and is divided between:- assets used in the business;- assets held as investments.
Assets used in the business are held for use in the production or supply of goods or services or for administrative purposes and are expected to be used during more than one period. This item includes also assets used by the Bank as lessor through finance lease contracts.
Property, plant and equipment also include leasehold improvements relating to assets which can be which can be separately identified. They are classified according to the specific sub-items relating to the asset type (e.g. plants). Leasehold improvements are usually borne in order to make leased premises fit for the expected use. Improvements and additional expenses relating to property, plant and equipment identifiable but not separable are recognised in item 150 “Other assets”.
Assets held for investment purposes are properties covered by IAS 40, i.e. properties held (owned or under a finance lease) in order to derive rentals and/or a capital gain.

88
Part A - Accounting Policies (Continued)
Notes to the Accounts
The Annual Report and Accounts as at December 31, 2013 · FinecoBank
Property, plant and equipment are initially recognised at cost including all costs directly attributable to bringing the asset into use (transaction costs, professional fees, direct transport costs incurred in bringing the asset to the desired location. installation costs and dismantling costs).Subsequent costs are added to the carrying amount or recognised as a separate asset only when it is probable that there will be future economic benefits in excess of those initially foreseen and the cost can be reliably measured. Other expenses borne at a later time (e.g. normal maintenance costs) are recognised in the year they are incurred in profit and loss items:- 150. b) “Other administrative expenses”, if they refer to assets used in the business;or:- 190. “Other net operating income”, if they refer to property held for investment.
After being recognized as an asset, an item of property, plant and equipment is carried at cost less any accumulated depreciation and any cumulative impairment losses.
An item with a finite useful life is subject to straight-line depreciation.
The depreciation rates used for the main categories of property, plant and equipment are as follows: • Furniture 12 percent• Fittings 15 percent• Ordinary office equipment 12 percent• Miscellaneous machines, devices and equipment 15 percent• Alarm systems and camera and television circuits 30 percent• Electronic machines 20 percent• Hoisting systems and equipment 7.5 percent• Motor vehicles 25 percent• Buildings 3 percent
Land and buildings, if separately quantifiable, are recognised separately, even if acquired together. Land is not depreciated since it usually has an indefinite useful life. Buildings, conversely, have a finite useful life and are therefore subject to depreciation. The estimate of the useful life of an asset is reviewed at least at each accounting period-end on the basis inter alia of the conditions of use of the asset, of maintenance conditions and expected obsolescence, and, if expectations differ from previous estimates, the depreciation amount for the current and subsequent financial years is adjusted accordingly.If there is objective evidence that an asset has been impaired, the carrying amount of the asset is compared with its recoverable value, equal to the greater of its fair value less selling cost and its value in use, i.e. the present value of future cash flows expected to originate from the asset. Any value adjustment is recognised in profit and loss item 170. “Impairment/ write-backs on property, plant and equipment”.
If the value of a previously impaired asset is restored, its increased carrying amount cannot exceed the net carrying amount it would have had if there had been no losses recognised on the prior-year impairment.An item of Property, plant and equipment is de-recognised from the Balance sheet upon disposal or when no further economic benefits are expected to be generated by its use or its disposal and any difference between the disposal or recoverable value and the book value is recognised in the Income Statement under item 240 “Gains (losses) on disposal of investments”.
9 - Intangible assetsIntangible assets are non-monetary assets for long-term use that are identifiable, although not physically tangible and which are likely to produce future economic benefits.
Intangible assets consist of goodwill, software and costs incurred for the creation of the new Fineco website.
Intangible assets other than goodwill are recognised at purchase cost, i.e. including any cost incurred to bring the asset into use, less accumulated amortisation and impairment losses.
An intangible asset with a finite life is subject to straight-line amortisation over its estimated useful life.
Residual useful life is usually assessed as follows:- software maximum 3 years;- other intangible assets maximum 5 years.Intangible assets with an indefinite life are not present, with the exception of goodwill.
If there is objective evidence that an asset has been impaired, the carrying amount of the asset is compared with its recoverable value, equal to the greater of its fair value less selling cost and its value in use, i.e. the present value of future cash flows expected to originate from the asset. Any impairment loss is recognised in profit and loss item 180 “Impairment/ write-backs on intangible assets”.

89FinecoBank · The Annual Report and Accounts as at December 31, 2013
If the value of a previously impaired intangible asset, other than goodwill is restored, its increased carrying amount cannot exceed the net carrying amount it would have had if there were no losses recognised on the prior-year impairment.
An intangible asset is de-recognised on disposal or when no economic benefits are expected from its use or sale in the future and any difference between sale proceeds or recoverable value and carrying value is recognised in the profit and loss item 240 “Gains (losses) on disposal of investments”.
GoodwillIn accordance with IFRS3, goodwill is the excess of the acquisition cost of a business combination over the net fair value of the assets and liabilities acquired at the acquisition date.
At a subsequent financial reporting date, goodwill is recognised net of any cumulative impairment losses and is not amortised.
Goodwill is tested for impairment annually, as for other intangible assets with an indefinite useful life.
All goodwill relates to buy-outs of divisions or companies engaged in trading activities or the distribution of financial, banking and insurance products through personal financial advisers.These activities have been fully integrated with FinecoBank’s ordinary operations, as a result it is not possible to isolate the contribution of each company/business division from the Bank’s overall income; this means that to establish the reasonableness of the value of goodwill recognised in the financial statements it is necessary to take account of the Bank’s overall income. The Cash Generating Unit (CGU) is the Bank as a whole.In fact, in view of the specific business model adopted by FinecoBank, which envisages a high level of integration between personal financial advisers and the trading and banking platform, the allocation of costs/revenues to the business unit is not considered relevant or meaningful; the personal financial advisers network is an integral part of the overall offer, which includes banking, brokerage and other investment services.
Impairment losses on goodwill are recognised in profit and loss item 230 “Impairment losses on goodwill”. In respect of goodwill, no write-backs are allowed.
Please see Section 12.3 Intangible assets - Other information in Part B below for further information on goodwill and related impairment tests.
10 - Non-current assets classified as held for saleNon-current assets or groups of associated assets/liabilities (i.e. a group of units generating financial cash flow) whose sale is highly probable, are recognised in item 140. “Non-current assets and disposal groups as held for sale” and item 90. “Liabilities included in disposal groups classified as held for sale” respectively at the lesser of the carrying amount and fair value net of disposal costs.The balance of revenue and expense relating to discontinued assets and liabilities (dividends, interest, etc.) and the measurement as determined above of disposal groups held for sale disclosed in this balance sheet item, net of current and deferred tax liabilities, is recognised in the item 280 “Profit (loss) after tax from discontinued operations”.
The revaluation reserves relating to Non-current assets classified as held for sale, which are recorded as a contra item to changes in value relevant for this purpose), are reported separately in the Statement of Comprehensive Income (see Part D - Comprehensive Income).
At the reporting date, the Bank did not hold any Non-current assets classified as held for sale.
11 - Current and Deferred TaxTax assets and tax liabilities are recognised in the Balance Sheet respectively in item 130 of assets (“Tax assets”) and item 80 of liabilities (“Tax liabilities”).
In compliance with the “Balance sheet liability method”, current and deferred tax liabilities items include: - current tax assets, i.e. amount of tax paid in excess of income tax due in accordance with local tax regulations;- current tax liabilities, i.e. amount of corporate tax due in accordance with local tax regulations;- deferred tax assets, i.e. amounts of income tax recoverable in future fiscal years and attributable to:
• deductible temporary differences; • the carry-forward of unused tax losses; • the carry-forward of unused tax credits;
- deferred tax liabilities, i.e. the amounts of income tax due in future fiscal years in respect of taxable temporary differences.
Current and deferred tax assets and tax liabilities are calculated in accordance with local tax regulations and are recognized in profit or loss on an accrual basis.

90
Part A - Accounting Policies (Continued)
Notes to the Accounts
The Annual Report and Accounts as at December 31, 2013 · FinecoBank
In general, deferred tax assets and liabilities arise when there is a difference between the accounting treatment and the tax treatment of the carrying amount of an asset or liability.
Deferred tax assets and liabilities are recognised applying tax rates that at the balance sheet date are expected to apply in the period when the carrying amount of the asset will be recovered or the liability will be settled on the basis of tax regulations in force, and are periodically reviewed in order to reflect any changes in regulations.
Furthermore, deferred tax assets are recognized only to the extent that it is probable that sufficient taxable profit will be generated by the entity. In accordance with the provisions of IAS 12, the probability that sufficient future taxable profit against which the deferred tax assets can be utilised will be available is reviewed periodically. The carrying amount of deferred tax assets should be reduced to the extent that it is not probable that sufficient taxable profit will be available.
Current and deferred taxes are recognised in profit and loss item 260. “Tax expense (income) related to profit or loss from continuing operations”, except for tax referred to items that in the same or in another fiscal year are credited or charged directly to equity, such as those relating to gains or losses on available-for-sale financial assets and those relating to changes in the fair value of cash flow hedging instruments, whose changes in value are recognised directly in the Statement of Comprehensive Income - Revaluation reserves.
12 - Provisions for risks and chargesRetirement Payments and Similar ObligationsRetirement provisions - i.e. provisions for employee benefits paid after leaving employment - are identified as defined-contribution plans or defined benefit plans according to the economic nature of the plan.
In detail:- defined benefit plans provide a series of benefits depending on factors such as age, years of service and compensation policies. Under this type of
plan actuarial and investment risks are borne by the company;- defined contribution plans are plans under which the company makes fixed contributions. Benefits are the result of the amount of contributions paid
and return on contributions invested. The employer bears no actuarial and/or investment risks connected with this type of benefit as it has no legal or implicit obligation to make further contributions, should the plan not be sufficient to provide benefit to all employees.
Defined benefit plans are present-valued by an external actuary using the “Unit credit projection method”.This method distributes the cost of the benefit evenly over the employee’s working life. The liability is determined as the present value of average future payments adjusted according to the ratio of years of service to the theoretical total years of service at the time of payment of the benefit.
The amount recognised as an asset/liability in item 120.a) Provisions for risks and charges - a) postretirement benefit obligations is the present value of the obligation at the Balance Sheet Date, less any pension charges relating to benefits already provided but not recognised, less the fair value at the Balance Sheet Date of plan assets other than those due to settle the obligations directly due to asset ceiling effects (limiting the amount of the net asset recognisable to the maximum of assets available to the entity). Actuarial gains/losses arising from the valuation of liabilities from defined benefits are recognised as a balancing entry of Shareholders’ equity under Revaluation reserves.
The discount rate used to present-value obligations (whether financed or not) relating to benefits to be provided after retirement varies according to the country/currency where the liabilities are allocated and is determined on the basis of market yield at the Balance Sheet Date of prime issuers bonds with an average life in keeping with that of the relevant liability.
At the balance sheet date, the Bank did not have provisions for retirement payments and similar obligations.
Other provisionsProvisions for risks and charges are recognised when:- the entity has a present obligation (legal or constructive) as a result of a past event;- it is probable that an outflow of resources embodying economic benefits will be required to settle the obligation; and- a reliable estimate can be made of the amount of the obligation.The amounts recognised as provisions are the best estimate of the expenditure required to settle the present obligation. The risks and uncertainties that inevitably surround the relevant events and circumstances are taken into account in reaching the best estimate of a provision.Where the effect of the time value of money is significant, the amount of the provision should be the present value of the best estimate of the cost required to settle the obligation. The discount rate used reflects the current market assessments.
Provisions are reviewed periodically and adjusted to reflect the current best estimate. If it becomes clear that it is no longer probable that an outflow of resources embodying economic benefits will be required to settle the obligation, the provision is reversed.
Provisions are used only for expenses for which they were originally recognised.
91FinecoBank · The Annual Report and Accounts as at December 31, 2013
Allocations made in the year are recognized in profit and loss item 160 “Provisions for risks and charges” and include increases due to the passage of time; they are also net of any reversal.
“Other provisions” also include obligations relating to benefits due to financial advisers, specifically supplementary customer indemnity provision (indennità supplettiva di clientela), contractual payments, which are measured as defined benefit plans and whose obligations are calculated using the unit credit projection method (see above under “Retirement Payments and Similar Obligations”), and the non-competition clause.
In certain cases, provisions for risks and charges have been classified under their own item of the income statement to better reflect their nature.
13 - Liabilities, Securities in Issue and Subordinated LoansThe items Deposits with banks, Deposits with customers and Debt securities in issue are used for all forms of third-party funding other than trading liabilities or those valued at fair value.
These financial liabilities are recognised on the settlement date principle initially at fair value, which is normally the consideration received less transaction costs directly attributable to the financial liability. Subsequently these instruments are measured at amortised cost using the effective interest method.
Hybrid debt instruments relating to equity instruments, foreign exchange, credit instruments or indexes, are treated as structured instruments. The embedded derivative is separated from the primary contract and represents a stand-alone derivative if the separation requirements are met. The embedded derivative is recognised at fair value and subsequently measured. Any subsequent changes in fair value are recognised in profit and loss item 80. “Gains (losses) on financial assets and liabilities held for trading”.
The difference between the total amount received and the initial fair value of the embedded derivative is attributed to the host contract.
Debt securities in issue are recognised net of repurchased amounts; the difference between the book value of the liability and the amount paid to purchase it is recorded in the Income Statement under item 100.d) “Gains (losses) on repurchase of financial liabilities”. Subsequent disposal/sale by the issuer is considered as a new issue which does not produce gains or losses. The Bank’s debts do not include covenants that would cause default or restructuring events. There are no debt instruments involving convertibility to equity instruments (under IASB IFRIC 19 Extinguishing Financial Liabilities with Equity Instruments).
14 - Financial liabilities held for tradingFinancial liabilities held for trading include:- derivatives that are not designated as hedging instruments;- obligations to deliver financial assets borrowed by a short seller (i.e., an entity that sells financial assets it does not yet own);- financial liabilities issued with an intention to repurchase them in the near term;- financial liabilities that are part of a portfolio of financial instruments considered as a unit and for which there is evidence of a recent pattern of
trading.
An HfT liability, including a derivative, is measured at fair value initially and for the life of the transaction, except for a derivative liability settled by delivery of an unlisted equity instrument whose fair value cannot reliably be measured, and which is therefore measured at cost.

92
Part A - Accounting Policies (Continued)
Notes to the Accounts
The Annual Report and Accounts as at December 31, 2013 · FinecoBank
15 - Financial Liabilities at Fair Value through Profit and Loss
*According to IAS 39, financial liabilities, as well as financial assets, may also be designated on initial recognition as measured at fair value, provided that:- this designation eliminates or considerably reduces the discrepancy that could arise from the application of different methods of measurement of
assets and liabilities and related gains or losses;or- a group of financial assets, financial liabilities or both are managed and measured at fair value under risk management or investment strategy which
is internally documented with the entity’s Board of Directors or equivalent body.
This category may also include financial liabilities represented by hybrid (combined) instruments containing embedded derivatives that otherwise should have been separated from the host contract.These transactions are recognised in the same way as “HfT financial liabilities”, with any gains and losses, whether realised or valued, being recognised in item 110 “Gains (losses) on financial assets and liabilities measured at fair value”.
At the reporting date, the Bank did not hold any financial liabilities classified as “Financial liabilities at fair value through profit and loss”.
16 - Foreign currency transactionsA foreign currency transaction is recognised at the spot exchange rate of the transaction date.
Foreign currency monetary assets and liabilities are translated at the closing rate of the period.
Exchange differences arising from settlement of monetary items at rates different from those of the transaction date and unrealised exchange rate differences on foreign currency assets and liabilities not yet settled, other than assets and liabilities designated as measured at fair value and hedging instruments, are recognized in profit and loss item 80 “Gains and losses on financial assets and liabilities held for trading”.
Non-monetary assets and liabilities recognised at historical cost in a foreign currency are translated using the exchange rate at the date of the transaction. Non-monetary items that are measured at fair value in a foreign currency are translated at the closing rate. The exchange differences are recognised:- in profit and loss if the financial asset is HfT;- in revaluation reserves if the financial asset is AfS.
Hedges of a net investment in a foreign operation are recognised similarly to cash flow hedges.
All exchange differences recorded under revaluation reserves in shareholders’ equity are also reported in the Statement of Comprehensive Income.
17 - Other informationBusiness CombinationsA business combination is a transaction through which an entity obtains control of a company or of a business segment, thus bringing together different businesses into one reporting entity.
A business combination may result in a Parent-subsidiary relationship in which the acquirer is the Parent and the acquiree a subsidiary of the acquirer a business combination may involve the purchase of the net assets of another entity - in which case goodwill can arise - or the purchase of the equity of the other entity (mergers).IFRS 3 requires that all business combinations shall be accounted for by applying the purchase method, which involves the following steps:- identifying an acquirer;- measuring the cost of the business combination;and- allocating, at the acquisition date, the cost of the business combination to the assets acquired and liabilities and contingent liabilities assumed.
The cost of a business combination is the aggregate of the fair value, at the date of exchange, of assets given, liabilities incurred or assumed and equity instruments issued by the acquirer, in exchange for control of the acquiree.
The acquisition date is the date on which the acquirer effectively obtains control of the acquiree. When this is achieved through a single exchange transaction, the date of exchange coincides with the acquisition date.

93FinecoBank · The Annual Report and Accounts as at December 31, 2013
A business combination may involve more than one exchange transaction; nevertheless, the cost of the business combination remains equal to the fair value of the entire investment acquired. This involves the revaluation at fair value - and the recognition of the effects in the Income Statement - of the equity investments previously held in the acquired entity.
The cost of a business combination is allocated by recognising the assets, the liabilities and the identifiable contingent liabilities of the acquired company at their acquisition-date fair value. Exceptions to this principle are deferred income tax assets and liabilities, employee benefits, indemnification assets, reacquired rights, non-current assets held for sale, and share-based payment transactions that are subject to review in accordance with the principle applicable to them.
Positive difference between the cost of the business combination and the acquirer’s interest in the net fair value of the identifiable assets, liabilities and contingent liabilities so recognized is accounted for as goodwill.
After initial recognition, goodwill is tested for impairment at least annually.
A new measurement is carried out in the event of a negative difference. This negative difference, if confirmed, is immediately recorded as revenue through profit or loss.
If the acquisition concerns a percentage less than 100% of the assets of the acquired company, minorities are recognized.At the acquisition date, minorities are valued:- at fair valueor- as a proportion of minority interests in the assets, liabilities and identifiable contingent liabilities of the acquired company.
De-recognition of financial assetsDe-recognition is the removal of a previously recognised financial asset or financial liability from an entity’s balance sheet.
Before evaluating whether, and to what extent, de-recognition is appropriate, under IAS 39 an entity should determine whether the relevant conditions apply to a financial asset in its entirety or to a part of a financial asset. The standard is applied to a part of financial assets being transferred if, and only if, the part being considered for de-recognition meets one of the following conditions:- the part comprises only specifically identified cash flows from a financial asset (or a group of assets), e.g. interest cash flows from an asset;- the part comprises a clearly identified percentage of the cash flows from a financial asset, e.g., a 90 per cent share of all cash flows from an asset;- the part comprises only a fully proportionate (pro rata) share of specifically identified cash flow, e.g. 90 per cent share of interest cash flows from an
asset.In all other cases, the standard is applied to the financial asset in its entirety (or to the group of similar financial assets in their entirety).An entity shall de-recognise a financial asset when the contractual rights to the cash flows from the financial asset expire or it transfers the contractual rights to receive the cash flows of the financial asset to a third party.Rights to cash flow are considered to be transferred even if contractual rights to receive the asset’s cash flow are retained but there is an obligation to pay this cash flow to one or more entities and all the following conditions are fulfilled (pass-through agreement):- there is no obligation for the Bank to pay any uncollected amounts associated with the original asset;- sale or pledge of the original asset is not allowed, unless it secures the obligation to pay cash flow;- the Bank is obliged to transfer forthwith all cash flows received and may not invest them, except for liquidity invested for the short period between
the date of receipt and that of payment, provided that the interest accrued in that period is paid on.
Recognition is also subject to verification of effective transfer of all the risks and rewards of ownership of the financial asset. If the entity transfers substantially all the risks and rewards of ownership of the financial asset, the entity shall de-recognise the asset (or group of assets) and recognise separately as assets or liabilities any rights and obligations created or retained in the transfer.Conversely, if the entity substantially retains all the risks and rewards of ownership of the asset (or group of assets), the entity shall continue to recognise the transferred asset(s). In this case, it is necessary to recognise a liability corresponding to the amount received under the transfer and subsequently recognise all income accruing on the asset or expense accruing on the liability.The main transactions that do not allow, under the above rules, total de-recognition of a financial asset are securitisations, repurchase transactions (buy-ins) and stock lending.In the case of repurchase transactions and stock lending, the assets transacted are not derecognized since the terms of the transaction entail the retention of all their risks and rewards.Lastly, it should be noted that securities lending transactions collateralized by other securities or not collateralized were recorded as off-balance sheet items.
94
Part A - Accounting Policies (Continued)
Notes to the Accounts
The Annual Report and Accounts as at December 31, 2013 · FinecoBank
ReposSecurities received in a transaction that entails a contractual obligation to sell them at a later date or delivered under a contractual obligation to repurchase are neither recognized nor derecognized. In respect of securities purchased under an agreement to resell, the consideration is recognized as a loan to customers or banks, or as an asset held for trading. In respect of securities held in a repurchase agreement, the liability is recognized as due to banks or customers, or as an HfT financial liability. Revenue from these loans, being the coupons accrued on the securities and the difference between the sale/purchase and resale/repurchase prices, is recognised in profit or loss through interest income and expenses on an accruals basis.
These transactions can only be offset if, and only if, they are carried out with the same counterparty and provided that such offset is provided for in the underlying contracts.
The same rules apply to securities lending transactions with the exception, starting from December 31, 2011, of the type of securities lending transactions collateralized by other securities or not collateralized, as specified by the Bank of Italy.
Counterparty risk related to such securities lending or borrowing transactions is shown under item “E. Other” of the tables of Part E - Section 1 - Credit risk - A.2.Internal and external ratings.
Treasury sharesThe Bank does not hold, and did not hold during the year, any of its own shares in the portfolio.
Italian Staff Severance Pay (Trattamento di fine rapporto - “TFR”)The “TFR” provision for Italy-based employee benefits is to be construed as a “post-retirement defined benefit”. It is therefore recognised on the basis of an actuarial estimate of the amount of benefit accrued by employees discounted to present value. This benefit is calculated by an external actuary using the “Unit credit projection method” (see Section 12 - Provisions for Risks and Charges - Retirement Payments and Similar Obligations). This method distributes the cost of the benefit evenly over the employee’s working life. The liability is determined as the present value of average future payments adjusted according to the ratio of years of service to total years of service at the time of payment of the benefit.
Following pension reform by Law 252/2005, TFR instalments accrued to December 31, 2006 (or to the date between 01-Jan-2007 and 30-Jun-2007 on which the employee opted to devolve their TFR to a supplementary pension fund) stay in the employer and are considered a post-employment defined benefit plan therefore incurring actuarial valuation, though with simplified actuarial assumptions, i.e., forecast future pay rises are not considered.
TFR instalments accrued since January 1, 2007 (date of Law 252 coming into effect) (or since the date between January 1, 2007 and June 30, 2007) are, at the employee’s discretion, either paid into a pension fund or left in the company and (where the company has in excess of 50 employees) paid into an INPS Treasury fund by the employer, and are considered a defined-contribution plan.
Costs relating to TFR are taken to income statement item 150.a) “Administrative costs: payroll costs” and include, for the part of the plan with defined benefits ((i) interest accrued in the year (interest cost), for the part of the plan with defined contributions, and (ii) portions accrued in the year and paid to Supplementary Pension Schemes or to the INPS Treasury Fund.
Actuarial gains and losses, defined as the difference between the liability’s book value and the present value of the obligation at the end of the period, are recognised as Shareholders’ equity under Revaluation reserves. Share-Based PaymentEquity-settled payments made to employees in consideration of services rendered, using equity instruments of the Parent Company comprise:- Stock options- Performance shares (i.e. awarded on attainment of certain objectives)- Restricted shares (i.e. subject to a lock-up period).
Considering the difficulty of reliably measuring the fair value of the services acquired against equity-settled payments, reference is made to the fair value of the instruments themselves, measured at the date of the allocation. The existence of these agreements between the Bank and the Parent Company relating to the monetary settlement of payments to its employees based on shares of the Parent Company, and assigned by the latter to the employees and that involve the granting of shares of the Parent Company, entails their fair value measurements through profit or loss as a cost under item 150.a) Administrative costs: payroll costs, as a contra-entry to item 100. “Other liabilities”, on an accrual basis in proportion to the period in which the benefit is provided.
95FinecoBank · The Annual Report and Accounts as at December 31, 2013
Other Long-term Employee BenefitsLong-term employee benefits - e.g. long-service bonuses, paid on reaching a predefined number of years’ service - are recognised in item 100 “Other liabilities” on the basis of the measurement at the Balance Sheet Date of commitments undertaken, also in this case determined by an external actuary using the “Unit credit projection method” (see Section 12 - Provisions for Risks and Charges - Retirement Payments and Similar Obligations). Gains (losses) on this type of benefit are recognised through profit or loss.
Guarantees and Credit Derivatives in the Same ClassGuarantees and credit derivatives in the same class measured under IAS 39 (i.e. contracts under which the issuer makes pre-established payments in order to compensate the guaranteed party or buyer of protection for losses sustained due to default by a debtor on the maturity of a debt instrument) are initially and subsequently (on remeasurement following impairment losses) recognized in item 100 “Other liabilities”.
On first recognition, guarantees given are recognized at fair value, which usually corresponds to the amount received when the guarantee is issued.
After initial recognition, guarantees given are recognized at the greater of the initially recognized value, net of any amortized portion, and the estimated amount required to meet the obligation.
The effects of valuation, related to any impairment of the underlying, are recognised in the same balance-sheet item contra item 130.d “Write-downs and write-backs due to impairment of other financial transactions” in the Income Statement.
Offsetting financial assets and liabilitiesAssets and liabilities are offset based on IAS 32, after establishing that the following requirements have been met:(a) an exercisable right to offset recognised amounts is held;(b) the entity intends settling the assets and liabilities on a net basis, or realising the asset and concurrently settling the liability.
In compliance with IFRS 7, more information is given in the tables of the Notes to the Accounts, in Part B - Other Information.
RECOGNITION OF INCOME AND EXPENSESInterest Income and ExpenseInterest income and expense and similar income and expense items relate to monetary items - i.e., liquidity and debt , financial instruments held for trading, measured at fair value through profit or loss or available for sale-, HtM financial assets, loans and receivables, deposits, and debt securities in issue.
Interest income and expense are recognised through profit or loss with respect to all instruments measured at amortised cost, using the effective interest method.Interest also includes the net credit or debit balance of differentials and margins on financial derivatives:- hedging interest-bearing assets and liabilities;- HfT but linked for business purposes to assets and liabilities measured at fair value (fair value option) and interest-bearing;- linked for business purposes to HfT assets and liabilities paying differentials or margins on different maturities.
Fees and CommissionsFees and commissions are recognised according to the provision of the services from which they have arisen.Securities trading commissions are recognised at the time the service is rendered. Investment portfolio management fees, advisory fees and investment fund management fees are recognised on a pro-rata temporis basis.Fees included in amortised cost used to calculate effective interest rates are not included under fees and commissions, since they are part of the effective interest rate.
DividendsDividends are recognised in profit or loss in the financial year in which their distribution has been approved.

96
Part A - Accounting Policies (Continued)
Notes to the Accounts
The Annual Report and Accounts as at December 31, 2013 · FinecoBank
RELEVANT IFRS DEFINITIONSThe main definitions introduced by IFRS are described below, other than those dealt with in previous sections.
Amortised costThe amortised cost of a financial asset or financial liability is the amount at which the financial asset or financial liability is measured at initial recognition minus principal repayments, plus or minus the cumulative amortisation using the effective interest method of any difference between that initial amount and the maturity amount, and minus any reduction (directly or through the use of an allowance account) for impairment or uncollectibility.
The effective interest method is a method of allocating the interest income or interest expense over the life of a financial asset or liability. The effective interest rate is the rate that exactly discounts estimated future cash payments or receipts through the expected life of the financial instrument to the net carrying amount of the financial asset or financial liability. The calculation includes all fees and points paid or received between parties to the contract that are an integral part of the effective interest rate, transaction costs, and all other premiums or discounts.
Commissions forming an integral part of the effective interest rate include loan draw-down fees or underwriting fees relating to a financial asset not designated at fair value, e.g., fees received as compensation for the assessment of the issuer’s or borrower’s financial situation, for valuation and registration of security, and generally for the completion of the transaction (management fees).
Transaction costs include fees and commissions paid to agents (including employees acting as selling agents), advisers, brokers and dealers, levies by regulatory agencies and securities exchanges, and transfer taxes and duties. Transaction costs do not include debt premiums or discounts, financing costs or internal administrative or holding costs.
Impairment of financial assetsAt each balance sheet date, an entity assesses whether there is any objective evidence that a financial asset or group of financial assets is impaired.
A financial asset or a group of financial assets is impaired and impairment losses are incurred if, and only if, there is objective evidence of impairment as a result of one or more events that occurred after the initial recognition of the asset (a “loss event”) and that loss event (or events) has an impact on the estimated future cash flows of the financial asset or group of financial assets that can be reliably estimated.
It may not be possible to identify a single, discrete event that caused the impairment. Rather the combined effect of several events may have caused the impairment.
Losses expected as a result of future events, no matter how likely, are not recognised.
Objective evidence that a financial asset or group of assets is impaired includes observable data that comes to our attention about the following loss events:- significant financial difficulty of the issuer or obligor;- a breach of contract, such as a default or delinquency in interest or principal payments;- the lender, for economic or legal reasons relating to the borrower’s financial difficulty, granting a concession to the borrower which the lender would not
otherwise consider;- it becoming probable that the borrower will enter bankruptcy or other financial reorganisation;- the disappearance of an active market for that financial asset because of financial difficulties; however, the disappearance of an active market due to the
fact that a company’s financial instruments are no longer traded publicly is no evidence of impairment;- observable data indicating that there is a measurable decrease in the estimated future cash flows from a group of financial assets since the initial
recognition of those assets, although the decrease cannot yet be identified with the individual financial assets in the group, including:• adverse changes in the payment status of borrowers; or• national or local economic conditions that correlate with defaults on the assets in the group.
Objective evidence of impairment for an investment in an equity instrument includes information about significant changes with an adverse effect that have taken place in the technological, market, economic or legal environment in which the issuer operates, and indicates that the cost of the investment may not be recovered. A significant or prolonged decline in the fair value of an investment in an equity instrument below its cost is also objective evidence of impairment. If there is objective evidence that an impairment loss on loans and receivables or held-to-maturity investments carried at amortized cost has been incurred, the amount of the loss is measured as the difference between the asset’s carrying amount and the present value of estimated future cash flows (excluding future credit losses that have not been incurred) discounted at the financial asset’s original effective interest. The amount of the loss is recognized in profit and loss item 130 “Impairment losses” and the asset’s carrying value is reduced.

97FinecoBank · The Annual Report and Accounts as at December 31, 2013
For instruments classified as available for sale, this amount is equal to the balance of the negative Revaluation reserve (see chapter 2).If the terms of a loan, receivable or held-to-maturity investment are renegotiated or otherwise modified because of financial difficulties of the borrower or issuer, impairment is measured using the original effective interest rate before the modification of terms. Cash flows relating to short-term receivables are not discounted if the effect of discounting is immaterial. If a loan, receivable or held-to-maturity investment has a variable interest rate, the discount rate for measuring any impairment loss is the current effective interest rate determined under the contract.
The calculation of the present value of the estimated future cash flows of a collateralised financial asset reflects the cash flows that may result from foreclosure less costs for obtaining and selling the collateral, whether or not foreclosure is probable.A reduction in the fair value of a financial asset below its cost or amortised cost is not necessarily an indication of impairment (e.g. reduction in the fair value of an investment in a debt instrument resulting from an increase in the risk-free interest rate).
Objective evidence of impairment is initially assessed individually; however, if it is determined that there is no objective evidence of individual impairment, the asset is included in a group of financial assets with similar credit risk characteristics and assessed collectively.
Formula-based approaches and statistical methods may be used to assess impairment losses on a group of financial assets. Models used incorporate the time value of money, and consider cash flows over the entire residual life of the asset (not just the following year) and do not give rise to an impairment loss on initial recognition of a financial asset. They take into account losses already sustained but not manifest in the group of financial assets at the time of measurement, on the basis of past experience of losses on assets having a similar credit risk to the group of assets being measured.The process of estimating impairment losses considers all credit exposures, not only those of low credit quality, which reflect a serious impairment.
Reversals of impairment lossesIf, in a subsequent period, the amount of an impairment loss decreases and the decrease can be related objectively to an event occurring after the impairment loss was recognised (such as an improvement in the debtor’s credit rating), the previously recognised impairment loss is reversed. The amount of the reversal is recognised through profit or loss under item 130. “Net value adjustments/write-backs for impairment”, unless otherwise specified for equities classified as available-for-sale financial assets (see chapter 2).The reversal shall not result - at the date the impairment is reversed - in a carrying amount of the financial asset that exceeds what the amortised cost would have been had the impairment not been recognised.
A.3 Information on transfers between portfolios of financial assetsA.3.1 Reclassified financial assets: book value, fair value and effects on comprehensive incomeThe amendments to IAS 39 and to IFRS 7 “Reclassification of financial assets” approved by the IASB in 2008 make it possible to reclassify certain financial assets, after their initial recognition, out of the “Held for Trading” (HfT) and “Available for Sale” (AfS) portfolios.
In particular, the following may be reclassified:- those HfT or AfS financial assets that would have satisfied the definition specified by the international accounting standards for the loan portfolio
(if such assets were not classified as HfT or AfS respectively on initial recognition) if the entity intends, and is able, to hold them for the foreseeable future or until maturity;
- “only in rare circumstances” those HfT financial assets which, at the time of their recording, did not satisfy the definition of loans.
FinecoBank has not reclassified any financial assets from the HfT or the AfS portfolios to the loan portfolio.
A.3.2 Reclassified financial assets: Impact on comprehensive income before transferNo data to report.
A.3.3 Transfer of financial assets held for tradingNo data to report.
A.3.4 Effective interest rate and cash flows expected from reclassified assetsNo data to report.

98
Part A - Accounting Policies (Continued)
Notes to the Accounts
The Annual Report and Accounts as at December 31, 2013 · FinecoBank
A.4 Information on fair valueQUALITATIVE INFORMATIONThis section presents a disclosure on fair value hierarchy as required by IFRS 13.
Fair value is the price that would be received to sell an asset or paid to transfer a liability in an orderly transaction between market participants in the principal market at the measurement date (i.e. an exit price).
The fair value of a financial liability with a demand feature (e.g. a demand deposit) is not less than the amount payable on demand, discounted from the first date that the amount could be required to be paid.
For financial instruments listed in active markets, fair value is determined on the basis of official prices in the principal (or the most advantageous) market to which FinecoBank has access (Mark to Market).
A financial instrument is regarded as quoted in an active market if quoted prices are readily and regularly available from a pricing service, dealer, broker, agency that determines prices or regulatory agency, and those prices represent actual and regularly occurring market transactions on an arm’s length basis. If a published price quotation in an active market does not exist for a financial instrument in its entirety, but active markets exist for its component parts, fair value is determined on the basis of the relevant market prices for the component parts.
Where observable prices in active market or other observable inputs, such as quoted prices for similar instruments in an active market, are not available, FinecoBank uses alternative valuation techniques, such as: (i) a market approach (e.g. using quoted prices for similar liabilities or equity instruments held by other parties as assets);(ii) a cost approach (e.g. it reflects the amount that would be required currently to replace the service capacity of an asset, that is the current
replacement cost);(iii) an income approach (e.g. a present value technique that takes into account the future cash flows that a market participant would expect to receive
from holding the liability or equity instrument as an asset).
FinecoBank uses valuation models (Mark to Model) in line with the methods generally accepted and used by the market. Valuation models include techniques based on the discounting of future cash flows and on volatility estimates, and they are subject to revision both during their development and periodically in order to ensure their consistency with the objectives of the valuation.
These methods use inputs based on prices set in recent transactions for the instrument being valued and/or prices/quotations for instruments having similar characteristics in terms of risk profile.
Indeed, these prices/quotations are relevant for determining significant parameters in terms of the credit risk, liquidity risk and price risk of the instrument being valued. Reference to these “market” parameters makes it possible to limit the discretionary nature of the valuation, and ensures that the resulting fair value can be verified.
If, for one or more risk factors it is not possible to refer to market data, the valuation models employed use estimates based on historical data as inputs.As a further guarantee of the objectivity of valuations derived from valuation models, FinecoBank employs:• independent price verifications (IPVs);• fair value adjustments (FVAs).
Independent price verification requires that the prices for trading positions are verified by the Risk Management unit that is independent from the units that assume the risk exposure. This verification calls for comparing and adjusting the daily price in line with valuations obtained from independent market participants.
For instruments not quoted in active markets, the above verification process uses prices contributed by infoproviders as a reference, and assigns a greater weighting to those prices that are considered representative of the instrument being valued.
This valuation includes: the “executability” of the transaction at the price observed, the number of contributors, the degree of similarity of the financial instruments, the consistency of prices from different sources, and the process followed by the infoprovider to obtain the information.

99FinecoBank · The Annual Report and Accounts as at December 31, 2013
A.4.1 Levels 2 and 3 of fair value: valuation techniques and inputs usedSpecific valuation techniques are used to value positions for which a market price is not directly observable from market sources. FinecoBank uses well known valuation techniques for determining fair values of financial and non-financial instruments that are not actively traded and quoted. The valuation techniques used for Level 2 and 3 assets and liabilities, are described below.
Discounted cash flow Discounted cash flow valuation techniques generally consist of developing an estimate of future cash flows that are expected to occur over the life of an instrument. The model requires the estimation of the cash flow and the adoption of market’s parameters for the discounting: discount rate or discount margin reflects the credit and/or funding spreads required by the market for instruments with similar risk and liquidity profiles to produce a “present value”. The fair value of the contract is given by the sum of the present values of future cash flow.
Adjusted NAVNet asset value is the total value of a fund’s assets less liabilities. An increase in net asset value would result in an increase in a fair value measurement.
Fair Value Adjustment (FVA)Fair Value Adjustment is defined as the amount that needs to be added either to the market observed mid-price or the theoretical price generated by a valuation model in order to obtain a fair value of the position. The FVA takes account of the uncertainty in the measurement of a financial instrument in order to: reduce the risk of using incorrect measurements; ensure that the fair value reflects the realizable value of an actual market transaction; and incorporate possible future costs.
For the type of instruments held by FinecoBank, it was deemed necessary to adopt the Credit and Debit Valuation Adjustment.
Credit and Debit Valuation Adjustment (CVA/DVA)Credit valuation adjustments (CVAs) and debit valuation adjustments (DVAs) are incorporated into derivative valuations to reflect the impact on fair value of counterparty credit risk and FinecoBank own credit quality respectively.
The CVA/DVA methodology used by the Parent Company, which is responsible for the calculation, is based on the following inputs: • EAD derived from simulation techniques. Simulated exposures also take into account Specific Wrong Way Risk that arises for transactions where
there is a correlation between counterparty credit risk and the underlying derivative risk factors;• PD derived from actual historic default rates or implied by current market default rates, obtained from credit default swaps;• LGD based on the estimated level of expected recovery should a counterparty default and obtained from a bank’s own historical experience or
implied by current market default rates, obtained from credit default swaps.
A.4.2 Valuation processes and sensitivities FinecoBank verifies that the value attributed to each trading position appropriately reflects the current fair value. Fair value measurements of assets and liabilities are determined using different techniques, including, but not limited to, discounted cash flows model. On the basis of the observability of inputs used, all the measurements are classified as Level 1, Level 2 or Level 3 of the fair value hierarchy. When a financial instruments, measured at fair vale, is valued through the use of one or more significant inputs that are not directly observable on the market, further price verification procedures are applied. These procedures may include, among others, reviewing the relevant historical data, analysing of profits and losses, valuing each component for structured products , and benchmarking. According to tParent Company Market Risk Governance Guidelines, in order to ensure the adequate separateness of the functions in charge of the model development activities and those in charge of the validation processes, all valuation models developed by the company’s front offices are centrally and independently tested and validated by the Group Internal Validation functions. The aim of this independent control structure is of assessing the model risk from a theoretical solidity, calibration techniques eventually applied and the appropriateness of the model for a specific product in a defined market point of views. In addition to the daily mark to market or mark to model valuation, the Independent Price Verification (IPV) is applied with the aim of guaranteeing a fair value whoich is independent from Market Risk perspective for all illiquid instruments.
100
Part A - Accounting Policies (Continued)
Notes to the Accounts
The Annual Report and Accounts as at December 31, 2013 · FinecoBank
A.4.3 Fair Value HierarchyIFRS 13 establishes a fair value hierarchy according to the observability of the inputs used in the valuation techniques adopted for valuations. Three levels are considered:• Level 1: the fair value for instruments classified within this level is determined according to the quoted prices observed in active markets;• Level 2: the fair value for instruments classified within this level is determined according to the valuation models which use observable inputs on
active markets;• Level 3: the fair value for instruments classified within this level is determined according to the valuation models which primarily use significant
unobservable inputs on active markets.
The Risk Management Unit verifies, on a monthly basis, events that may result in a transfer between fair value levels (listing in an active market, delisting, etc…).
Information required by IFRS 13 about the accounting portfolios measured at fair value on a recurring basis is provided below.
Fixed Income SecuritiesFixed Income Securities are priced in a two tier process depending on the liquidity in the respective market. Liquid instruments traded in active markets are marked to market and consequently positions in these instruments are disclosed in reference to fair value hierarchy under Level 1.Instruments not traded in active markets are marked to model based on implied credit spread curves derived from the Level 1 instruments. The model maximizes the use of observable input and minimizes the use of unobservable inputs. In this respect, depending on the proximity of the credit spread curve applied, the bonds are disclosed as Level 2 or Level 3 respectively; Level 3 is applied in case a significantly unobservable credit spread curve is used.
In the global bond IPV process market prices of Level 1 bonds and pricing models for illiquid bonds are regularly verified for accuracy.
Structured financial productsThe Bank determines the fair value of structured finance products not quoted on actrive markets using the appropriate method of valuation given the nature of the embedded structure. These instruments are classified as Level 2 or Level 3 depending on the observability of the significant inputs to the model.
OTC derivativesFair value of derivatives not traded in an active market is determined using a mark to model valuation technique. In such cases, where active markets exist for its component parts, fair value is determined on the basis of the relevant market prices for the component parts. Valuation techniques that are based on inputs that are observable are referred to as Level 2 valuations. Valuation techniques that use significant unobservable inputs are referred to as Level 3 valuations.
Equity instrumentsEquity instruments are assigned to Level 1 when a quoted price is available on an active market and to Level 3 when no quotations are available or quotations have been suspended indefinitely. Equity instruments are classified as Level 2 only when trading volume on the market where the instrument is quoted has decreased significantly.For equity instruments measured at cost, an impairment is recognized if the carrying amount exceeds the recoverable amount significantly and/or over a prolonged period of time.
Investment fundsThe Bank holds investments in certain investment funds that publish the Net Asset Value (NAV) per unit, included investment funds managed by the Group to which the Level 1 of the fair value hierarchy has been assigned because quoted prices are available on an active market.
A.4.4 Other informationNo additional information to report.

101FinecoBank · The Annual Report and Accounts as at December 31, 2013
QUANTITATIVE INFORMATION
The following tables show, for assets and liabilities that are measured at fair value on a recurring basis, the level of the fair value hierarchy (Level 1, 2 or 3) within which the fair value measurement are categorised in their entirety, the amount of any transfers between level 1 and level 2, as well as the reconciliation from the opening balances to the closing balances for fair value measurement categorised within Level 3.The level of the fair value hierarchy within which classes of assets and liabilities that are not measured at fair value in the balance sheet but for which the fair value is disclosed is also provided in table A.4.5.4.
A.4.5 Fair Value Hierarchy
A.4.5.1 Assets and liabilities measured at fair value on a recurring basis: breakdown by level of fair value (Amounts in € thousand)
ASSETS/LIABILITIES MEASURED AT FAIR VALUE
12.31.2013 12.31.2012
L1 L2 L3 L1 L2 L3
1. Financial assets held for trading 3,717 969 14 5,043 2,532 14
2. Financial assets at fair value through profit or loss 3,199 - - 10,516 - -
3. Available-for-sale financial assets 89,910 - - 58,909 - -
4. Hedging derivatives - 123,143 - - 190,573 -
5. Property, plant and equipment - - - - - -
6. Intangible assets - - - - - -
Total 96,826 124,112 14 74,468 193,105 141. Financial liabilities held for Trading 1,709 592 - 4,529 2,648 -
2. Financial liabilities at fair value through profit and loss - - - - - -
3. Hedging derivatives - 141,801 - - 213,885 -
Total 1,709 142,393 - 4,529 216,533 -
Key:L1 = Level 1.L2 = Level 2.L3 = Level 3.
A.4.5.1.1 Assets and liabilities measured at fair value on a recurring basis: transfers between levels of fair value hierarchy (level 1 and level 2)
(Amounts in € thousand)
CHANGES 2013
LEVEL 1 LEVEL 2
Financial Assets measured at fair value Financial assets held for trading
Transfer from Level 1 X -
Transfer from Level 2 28 X
Financial assets at fair value through profit and loss
Transfer from Level 1 X -
Transfer from Level 2 - X
Available-for-sale financial assets
Transfer from Level 1 X -
Transfer from Level 2 - X
Hedging derivatives
Transfer from Level 1 X -
Transfer from Level 2 - X
Financial liabilities measured at fair value Financial liabilities held for Trading
Transfer from Level 1 X -
Transfer from Level 2 11 X
Financial liabilities at fair value through profit and loss
Transfer from Level 1 X -
Transfer from Level 2 - X
Hedging derivatives
Transfer from Level 1 X -
Transfer from Level 2 - X

102
Part A - Accounting Policies (Continued)
Notes to the Accounts
The Annual Report and Accounts as at December 31, 2013 · FinecoBank
A.4.5.2 Assets measured at fair value on a recurring basis (level 3): annual changes (Amounts in € thousand)
FINANCIAL ASSETS HELD FOR
TRADING
FINANCIAL ASSETS AT FAIR VALUE
THROUGH PROFIT AND LOSS
AVAILABLE-FOR-SALE FINANCIAL
ASSETSHEDGING
DERIVATIVESPROPERTY, PLANT AND EQUIPMENT
INTANGIBLE ASSETS
1. Opening balances 14 - - - - -2. Increases 2.1 Purchases 1,410 - - - - - 2.2 Profits recognised in: 2.2.1 Income Statement 35 - - - - - - of which Unrealised gains 2 - - - - - 2.2.2 Equity - - - - 2.3 Transfers from other levels - - - - - - 2.4 Other increases - - - - - -3. Decreases 3.1 Sales (1,433) - - - - - 3.2 Redemptions - - - - - - 3.3 Losses recognised in: 3.3.1 Income Statement (6) - - - - - - of which Unrealised losses (4) - - - - - 3.3.2 Equity - - - - 3.4 Transfers to other levels - - - - - - 3.5 Other decreases (6) - - - - -4. Closing balances 14 - - - - -
The sub-items 2.2.1 Gains recognised in the Income Statement and 3.3.1 Losses recognised in the Income Statement are recognised in the line item 80 - Gains and losses on financial assets held for trading of the Income statement.
A.4.5.3 Liabilities measured at fair value on a recurring basis (level 3): annual changes (Amounts in € thousand)
FINANCIAL LIABILITIES HELD FOR TRADING
FINANCIAL LIABILITIES AT FAIR VALUE
THROUGH PROFIT AND LOSS
HEDGING DERIVATIVES
1. Opening balances - - -2. Increases 2.1 Issuance - - -
2.2 Losses recognised in:
2.2.1 Income Statement 8 - -
- of which Unrealised losses - - -
2.2.2 Equity -
2.3 Transfers from other levels - - -
2.4 Other increases - - -
3. Decreases 3.1 Redemptions - - -
3.2 Purchases (8) - -
3.3 Profits recognized in:
3.3.1 Income Statement - - -
- of which Unrealised gains - - -
3.3.2 Equity -
3.4 Transfers to other levels - - -
3.5 Other decreases - - -
4. Closing balances - - -

103FinecoBank · The Annual Report and Accounts as at December 31, 2013
A.4.5.4 Assets and liabilities not measured at fair value or measured at fair value on a non-recurring basis: breakdown by level of fair value
(Amounts in € thousand)
ASSET/LIABILITIES NOT MEASUREDAT FAIR VALUE OR MEASURED AT FAIR VALUE ON A NON-RECURRING BASIS
12.31.2013 12.31.2012
BV L1 L2 L3 BV L1 L2 L3
1. Held-to-maturity investments - - - - - - - -
2. Loans and receivables with banks 16,330,912 - 16,425,906 - 17,271,573 - 17,172,204 -
3. Loans and receivables with customers 641,250 - 650,772 4,731 553,606 - 569,310 4,420
4. Property, plant and equipment held for investment 2,734 - - 4,813 2,846 - - 4,810
5. Non-current assets and disposal groups disposal groups classified as held for sale - - - - - - - -
Total 16,974,896 - 17,076,678 9,544 17,828,025 - 17,741,514 9,2301. Deposits from banks 1,648,675 - 1,648,675 - 2,065,153 - 2,065,153 -
2. Deposits from customers 12,732,309 - 12,739,102 - 12,263,542 - 12,295,879 -
3. Debt securities in issue 2,322,511 - 2,422,470 - 3,075,792 - 3,043,081 -
4. Liabilities associated with assets classified as held for sale - - - - - - - -
Total 16,703,495 - 16,810,247 - 17,404,487 - 17,404,113 -
Key:L1 = Level 1.L2 = Level 2.L3 = Level 3.BV = Book value
Financial instruments not measured at fair value, including payables and receivables with customers and banks, are not managed on a fair value basis.
For these instruments, the fair value is calculated for disclosures purposes only and do not impact the balance sheet or the profit or loss. In addition, since these instruments are not generally traded, the determination of fair value as defined by IFRS 13 is significantly based on management judgement and the use of internal parameters not directly observable on the market.
Loans and receivables with banks and customers Fair value for loans and receivables with banks and customers, recognised at amortised cost, is primarily determined using a credit risk-adjusted model of present value. Some portfolios are valued according to simplified approaches, which, however, take into account the financial features of the financial instruments.
Liabilities Fair value for liabilities, recognised at amortised cost, is determined using a model of present value adjusted for issuer credit risk. The credit spread is determined using UniCredit’s subordinated and non-subordinated risk curves.
Property, plant and equipment held for investment purposesFair value for property, plant and equipment held for investment purposes is determined on the basis of a valuation by an independent valuer which perform its valuation mainly on the basis of an indirect knowledge of the assets through the information made available by the owner and relative to the localization, consistency, destination and in consideration of the analysis of significant market parameters.
Cash and cash equivalents Due to their short-term nature and generally negligible credit risk, cash and cash equivalents are carried at amounts the approximates fair value.
Debt securities in issueFair value for debt securities in issue, recorded ad amortized cost, is determined using a discounted cash flow model adjusted for issuer credit risk. The credit spread is determined using UniCredit’s subordinated and non-subordinated risk curves.
A.5 Day one profit/lossThe value at which financial instruments are recognised is equal to their fair value on the same date.
The fair value of financial instruments, other than those measured at fair value through profit and loss, at the date of their initial recognition is usually assumed to be equal to the amount collected or paid. For financial instruments held for trading and for financial instruments measured at fair value, any difference from the amount collected or paid is recognised under the appropriate line items of the income statement.


105FinecoBank · The Annual Report and Accounts as at December 31, 2013
Assets 106Section 1 - Cash and cash balances - Item 10 106Section 2 - Financial assets held for trading - Item 20 106Section 3 - Financial assets at fair value through profit or loss - Item 30 108Section 4 - Available-for-sale financial assets - Item 40 109Section 5 - Held-to-maturity investments - Item 50 110Section 6 - Loans and receivables with banks - Item 60 110Section 7 - Loans and receivables with customers - Item 70 111Section 8 - Hedging derivatives - Item 80 112Section 9 - Changes in fair value of portfolio hedged items - Item 90 113Section 10 - Investments in associates and joint ventures - Item 100 113Section 11 - Property, plant and equipment - Item 110 115Section 12 - Intangible assets - Item 120 116Section 13 - Tax Assets and Tax Liabilities - Asset item 130 and liability item 80 119Section 14 - Non-current assets and disposal groups classified as held for sale and associated liabilities - Assets item 140 and liabilities item 90 122Section 15 - Other assets - Item 150 123
Liabilities 124Section 1 - Deposits from banks - Item 10 124Section 2 - Deposits from customers - Item 20 124Section 3 - Debt securities in issue - Item 30 125Section 4 - Financial liabilities held for trading - Item 40 125Section 5 - Financial liabilities at fair value through profit and loss - Item 50 126Section 6 - Hedging derivatives - Item 60 126Section 7 - Changes in fair value of portfolio hedged items - Item 70 127Section 8 - Tax liabilities - Item 80 127Section 9 - Liabilities included in disposal groups classified as held for sale - Item 90 127Section 10 - Other liabilities - Item 100 127Section 11 - Allocation to employee severance pay provision - Item 110 128Section 12 - Provisions for risks and charges - Item 120 129Section 13 - Redeemable shares - Item 140 130Section 14 - Bank’s shareholders’ equity - Items 130, 150, 160, 170, 180, 190 and 200 131Section 15 - Other information 133
Part B - Balance Sheet

106
Notes to the Accounts
The Annual Report and Accounts as at December 31, 2013 · FinecoBank
AssetsSection 1 - Cash and cash balances - Item 10
1.1 Cash and cash balances: breakdown
12.31.2013 12.31.2012
(a) Cash 5 7
(b) Demand deposits with Central Banks - -
Total 5 7
Section 2 - Financial assets held for trading - Item 20
2.1 Financial assets held for trading: breakdown by category
ITEM/AMOUNT
12.31.2013 12.31.2012
LEVEL 1 LEVEL 2 LEVEL 3 LEVEL 1 LEVEL 2 LEVEL 3
A. On-balance sheet assets1. Debt securities
1.1 Structured securities 4 - - 6 117 -
1.2 Other debt securities 44 - - 93 71 1
2. Equity instruments 9 - 14 354 - 13
3. Units in investment funds. 1,936 - - 1 - -
4. Loans
4.1 Reverse repos - - - - - -
4.2 Other - - - - - -
Total A 1,993 - 14 454 188 14B. Derivative instruments1. Financial derivatives
1.1 trading derivatives 1,724 969 - 4,589 2,344 -
1.2 related to the fair value option - - - - - -
1.3 other - - - - - -
2. Credit derivatives
2.1 trading derivatives - - - - - -
2.2 related to the fair value option - - - - - -
2.3 other - - - - - -
Total B 1,724 969 - 4,589 2,344 -Total (A+B) 3,717 969 14 5,043 2,532 14
Trading financial derivatives refer to the positive valuation of Forex Contracts for Difference (CFDs), CFDs on indices and relative Futures on indices used to hedge CFDs.
Sub-item B.1.1 Derivative instruments - Trading financial derivatives includes the positive valuations of spot contracts for securities classified in the HFT portfolio and currencies to be regulated in times established by market practices (“regular way”). CFDs on indices and currencies are “Over the counter” derivative contracts that require the payment of a differential generated by the difference between the opening and closing price of the financial instrument. In operational terms, the bank covers customer positions, by underwriting futures on the indexes underlying the CFDs on indices, or through Forex transactions with institutional counterparties to hedge CFD transactions in open currencies with customers’ currency.
Part B - Balance Sheet (Amounts in € thousand)

107FinecoBank · The Annual Report and Accounts as at December 31, 2013
2.2 Financial assets held for trading: breakdown by debtors/issuers
ITEM/AMOUNT 12.31.2013 12.31.2012
A. ON-BALANCE SHEET ASSETS1. Debt securities a) Governments and Central Banks 11 67
b) Other public entities - -
c) Banks 35 197
d) Other issuers 2 24
2. Equity instruments a) Banks 4 153
b) Other issuers:
- insurance companies - -
- financial companies 1 1
- non-financial companies 18 213
- other - -
3. Units in investment funds 1,936 14. Loans a) Governments and Central Banks - -
b) Other public entities - -
c) Banks - -
d) Other entities - -
Total A 2,007 656B. DERIVATIVE INSTRUMENTS a) Banks 559 1,152
b) Customers 2,134 5,781
Total B 2,693 6,933Total (A+B) 4,700 7,589
Item B Derivative instruments includes the positive valuations of spot contracts for securities in the HFT portfolio and currencies to regulate in times established by market practices (“regular way”).
Sub-item A.3. Units in investment funds relate to a single fund that invests primarily in bonds.
The Bank has classified equity instruments issued by subjects with default status for a total book value of €10 thousand as non-performing.
2.3 On-balance sheet financial assets held for trading: annual changes
DEBT SECURITIES
EQUITY INSTRUMENTS
UNITS IN INVESTMENT
FUNDS LOANS TOTAL
A. Opening balance 288 367 1 - 656B. Increases B.1. Purchases 244,616 25,151,974 4,034 - 25,400,624
B.2. Positive changes in fair value - 4 - - 4
B.3. Other changes 214 7,899 1 - 8,114
C. Decreases C.1. Sales (244,834) (25,160,093) (2,035) - (25,406,962)
C.2. Redemptions (115) - - - (115)
C.3. Negative changes in fair value (4) (2) (64) - (70)
C.4. Transfers to other portfolios - - - - -
C.5. Other changes (117) (126) (1) - (244)
D. Closing balance 48 23 1,936 - 2,007
Other increases and decreases include the variation in interest accrued relating to Financial assets held for trading, the gains or losses made, and any technical overdrafts relating to the end and beginning of the period.

108
Part B - Balance Sheet - Assets (Continued)
Notes to the Accounts
The Annual Report and Accounts as at December 31, 2013 · FinecoBank
Section 3 - Financial assets at fair value through profit and loss - Item 30
3.1. Financial assets at fair value through profit and loss: breakdown by category
ITEM/AMOUNT
12.31.2013 12.31.2012
LEVEL 1 LEVEL 2 LEVEL 3 LEVEL 1 LEVEL 2 LEVEL 3
A. On-balance sheet assets1. Debt securities
1.1 Structured securities 844 - - 8,244 - -
1.2 Other debt securities 2,355 - - 2,272 - -
2. Equity instruments - - - - - -
3. Units in investment funds. - - - - - -
4. Loans
4.1 Structured - - - - - -
4.2 Other - - - - - -
Total 3,199 - - 10,516 - -Cost 3,211 - - 10,903 - -
The “fair value option” has been used to internally manage a portfolio of financial assets comprising securities, on a fair value basis. No derivatives on related receivables or similar instruments are used to mitigate maximum exposure to credit risk.
3.2. Financial assets at fair value through profit and loss: breakdown by debtors/issuers
ITEM/AMOUNT 12.31.2013 12.31.2012
1. Debt securities a) Governments and Central Banks - -
b) Other public entities - -
c) Banks 3,199 10,516
d) Other issuers - -
2. Equity instruments a) Banks - -
b) Other issuers:
- insurance companies - -
- financial companies - -
- non-financial companies - -
- other - -
3. Units in investment funds. - -4. Loans a) Governments and Central Banks - -
b) Other public entities - -
c) Banks - -
d) Other entities - -
Total 3,199 10,516
3.3 Financial assets at fair value through profit and loss: annual changes
DEBT SECURITIESEQUITY
INSTRUMENTSUNITS IN
INVESTMENT FUNDS LOANS TOTAL
A. Opening balance 10,516 - - - 10,516B. Increases B.1. Purchases 6,220 - - - 6,220
B.2. Positive changes in fair value 128 - - - 128
B.3. Other changes 391 - - - 391
C. Decreases C.1. Sales (13,861) - - - (13,861)
C.2. Redemptions - - - - -
C.3. Negative changes in fair value - - - - -
C.4. Other changes (195) - - - (195)
D. Closing balance 3,199 - - - 3,199
Other increases and decreases include the variation in interest accrued relating to Financial assets measured at fair value and the realised trading income.

109FinecoBank · The Annual Report and Accounts as at December 31, 2013
Section 4 - Available-for-sale financial assets - Item 40
4.1 Available-for-sale financial assets: breakdown by category
ITEM/AMOUNT
12.31.2013 12.31.2012
LEVEL 1 LEVEL 2 LEVEL 3 LEVEL 1 LEVEL 2 LEVEL 3
1. Debt securities
1.1 Structured securities - - - - - -
1.2 Other debt securities 89,910 - - 58,909 - -
2. Equity instruments
2.1 Carried at fair value - - - - - -
2.2 Carried at cost - - 5 - - 5
3. Units in investment funds. - - - - - -
4. Loans - - - - - -
Total 89,910 - 5 58,909 - 5
Equity instruments carried at cost as at December 31, 2013 refer to investments in associates and joint ventures in which the Bank does not exercise control or have a significant influence, for an amount equal to €5 thousand. These instruments are not listed, therefore the fair value may not be reliably determined.
Other debt securities are issued by the Central Government of Italy, for a book value of €79,871 thousand and by the Central Government of France, for a book value equal to €10,039 thousand.
Debt securities classified in the Available-for-sale financial assets portfolio are entirely used as collateral for bankers’ drafts or guarantees with third parties.
On February 20, 2013, FinecoBank sold to UniCredit S.p.A. its share certificates of UniCredit Audit S.C.p.A., merged by incorporation with UniCredit S.p.A. on March 1, 2013, representing 20 ordinary shares, for a total of €220.63.
4.2 Available-for-sale financial assets: breakdown by debtors/issuers
ITEM/AMOUNT 12.31.2013 12.31.2012
1. Debt securities a) Governments and Central Banks 89,910 58,909
b) Other public entities - -
c) Banks - -
d) Other issuers - -
2. Equity instruments a) Banks - -
b) Other issuers:
- insurance companies - -
- financial companies - -
- non-financial companies 5 5
- other - -
3. Units in investment funds - -4. Loans a) Governments and Central Banks - -
b) Other public entities - -
c) Banks - -
d) Other entities - -
Total 89,915 58,914
4.3 Available-for-sale financial assets subject to micro-hedgingNo data to report.
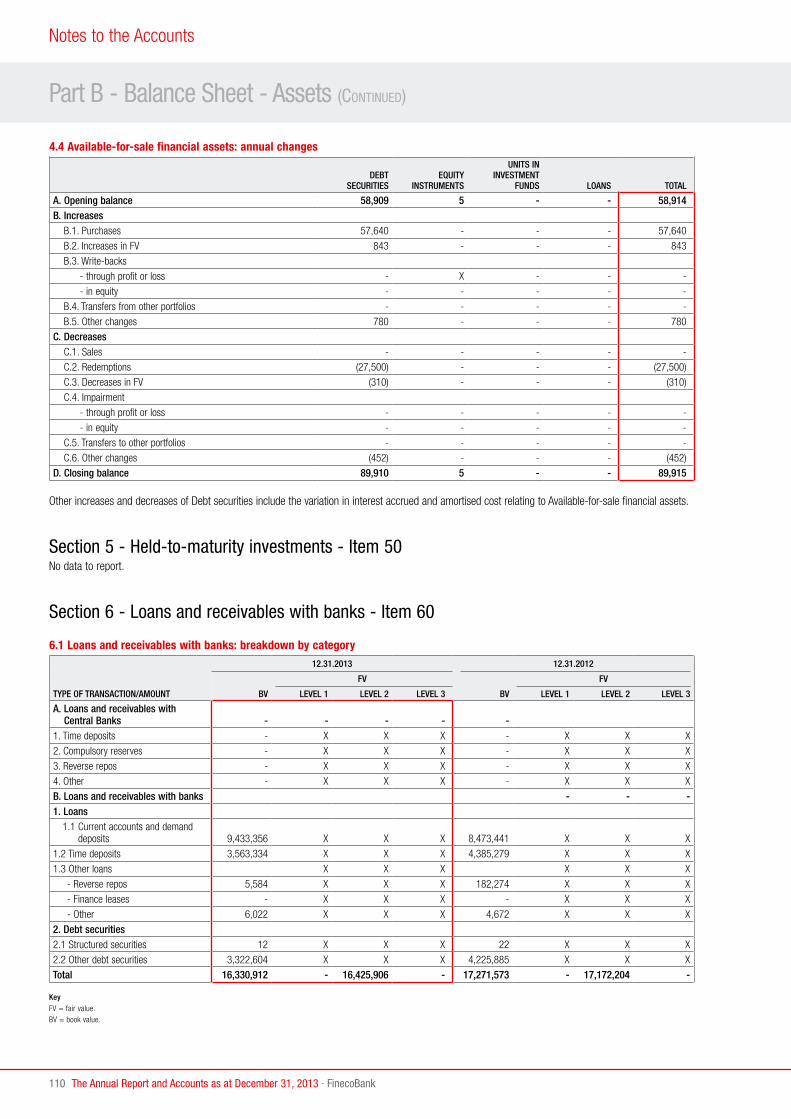
110
Part B - Balance Sheet - Assets (Continued)
Notes to the Accounts
The Annual Report and Accounts as at December 31, 2013 · FinecoBank
4.4 Available-for-sale financial assets: annual changes
DEBT SECURITIES
EQUITY INSTRUMENTS
UNITS IN INVESTMENT
FUNDS LOANS TOTAL
A. Opening balance 58,909 5 - - 58,914B. Increases B.1. Purchases 57,640 - - - 57,640
B.2. Increases in FV 843 - - - 843
B.3. Write-backs
- through profit or loss - X - - -
- in equity - - - - -
B.4. Transfers from other portfolios - - - - -
B.5. Other changes 780 - - - 780
C. Decreases C.1. Sales - - - - -
C.2. Redemptions (27,500) - - - (27,500)
C.3. Decreases in FV (310) - - - (310)
C.4. Impairment
- through profit or loss - - - - -
- in equity - - - - -
C.5. Transfers to other portfolios - - - - -
C.6. Other changes (452) - - - (452)
D. Closing balance 89,910 5 - - 89,915
Other increases and decreases of Debt securities include the variation in interest accrued and amortised cost relating to Available-for-sale financial assets.
Section 5 - Held-to-maturity investments - Item 50No data to report.
Section 6 - Loans and receivables with banks - Item 60
6.1 Loans and receivables with banks: breakdown by category
TYPE OF TRANSACTION/AMOUNT
12.31.2013 12.31.2012
BV
FV
BV
FV
LEVEL 1 LEVEL 2 LEVEL 3 LEVEL 1 LEVEL 2 LEVEL 3
A. Loans and receivables with Central Banks - - - - -
1. Time deposits - X X X - X X X
2. Compulsory reserves - X X X - X X X
3. Reverse repos - X X X - X X X
4. Other - X X X - X X X
B. Loans and receivables with banks - - -1. Loans 1.1 Current accounts and demand
deposits 9,433,356 X X X 8,473,441 X X X
1.2 Time deposits 3,563,334 X X X 4,385,279 X X X
1.3 Other loans X X X X X X
- Reverse repos 5,584 X X X 182,274 X X X
- Finance leases - X X X - X X X
- Other 6,022 X X X 4,672 X X X
2. Debt securities2.1 Structured securities 12 X X X 22 X X X
2.2 Other debt securities 3,322,604 X X X 4,225,885 X X X
Total 16,330,912 - 16,425,906 - 17,271,573 - 17,172,204 -
KeyFV = fair value.BV = book value.

111FinecoBank · The Annual Report and Accounts as at December 31, 2013
Loans and receivables with banks for current accounts and demand deposits mainly consist of accounts held with UniCredit S.p.A., with a book value of €9,415,098 thousand, and to a lesser extent, of current accounts held with other banks not belonging to UniCredit Group for transactions in securities.Time deposits recognised under assets consist of the deposit held with UniCredit S.p.A. (the Parent Company) for mandatory reserves, with a book value of €124,028 thousand, in addition to time deposits held with UniCredit S.p.A., with a book value of €3,439,306 thousand, in order to invest liquidity collected through repos transactions and CashPark accounts with retail customers and through repos transactions with credit institutions with the same time-frame.
Debt securities held in the portfolio mainly consist of debt securities issued by the Parent Company, and amount to €3,322,523 thousand. They were subscribed in order to invest liquidity and to be used for repos transactions with retail customers.
At the reporting date, there were no impaired assets with respect to banks.
6.2 Loans and receivables with banks: assets subject to micro-hedgingNo data to report.
6.3 Finance leasesNo data to report.
Section 7 - Loans and receivables with customers - Item 70
7.1 Loans and receivables with customers: breakdown by category
TYPE OF TRANSACTION/AMOUNT
12.31.2013 12.31.2012
BOOK VALUE FAIR VALUE
PERFORMING
IMPAIRED
FAIR VALUE
PERFORMING
IMPAIRED
L1 L2 L3 L1 L2 L3PURCHASED OTHER PURCHASED OTHER
Loans - - - - - -1. Current accounts 98,455 - 2,740 X X X 66,117 - 2,567 X X X
2. Reverse repos 120,804 - 56 X X X 100,686 - 97 X X X
3. Mortgages - - 76 X X X - - 65 X X X
4. Credit cards personal loans and wage assignment loans 317,252 - 1,835 X X X 300,097 - 1,669 X X X
5. Finance leases - - - X X X - - - X X X
6. Factoring - - - X X X - - - X X X
7. Other loans 100,007 - 24 X X X 82,285 - 22 X X X
Debt securities - - - - - -8. Structured securities - - - X X X - - - X X X
9. Other debt securities 1 - - X X X 1 - - X X X
Total 636,519 - 4,731 - 650,772 4,731 549,186 4,420 - 569,310 4,420

112
Part B - Balance Sheet - Assets (Continued)
Notes to the Accounts
The Annual Report and Accounts as at December 31, 2013 · FinecoBank
7.2 Loans and receivables with customers: breakdown by debtors/issuers
TYPE OF TRANSACTION/AMOUNT
12.31.2013 12.31.2012
PERFORMING
IMPAIRED
PERFORMING
IMPAIRED
PURCHASED OTHER PURCHASED OTHER
1. Debt securities a) Governments - - - - - -
b) Other public entities 1 - - 1 - -
c) Other issuers:
- non-financial companies - - - - - -
- financial companies - - - - - -
- insurance companies - - - - - -
- other - - - - - -
2. Loans to: a) Governments - - - - - -
b) Other public entities - - - - - -
c) Other entities:
- non-financial companies 7,800 - 34 7,582 - 21
- financial companies 92,797 - 11 75,335 - 18
- insurance companies 4,328 - - 5,074 - -
- other 531,593 - 4,686 461,194 - 4,381
Total 636,519 - 4,731 549,186 - 4,420
7.3 Loans and receivables with customers: assets subject to micro-hedgingNo data to report.
7.4 Finance leasesNo data to report.
Section 8 - Hedging derivatives - Item 80
8.1 Hedging derivatives: breakdown by type of hedge and by hierarchical level
ITEM/AMOUNT
FV 12.31.2013 NA12.31.2013
FV 12.31.2012 NA12.31.2012L1 L2 L3 L1 L2 L3
A. Financial derivatives 1) Fair value - 123,143 - 2,322,511 - 190,573 - 3,075,792
2) Cash flows - - - - - - - -
3) Net investment in foreign subsidiaries - - - - - - - -
B. Credit derivatives 1) Fair value - - - - - - - -
2) Cash flows - - - - - - - -
Total - 123,143 - 2,322,511 - 190,573 - 3,075,792
Key:NA = notional amount.L1 = Level 1.L2 = Level 2.L3 = Level 3.
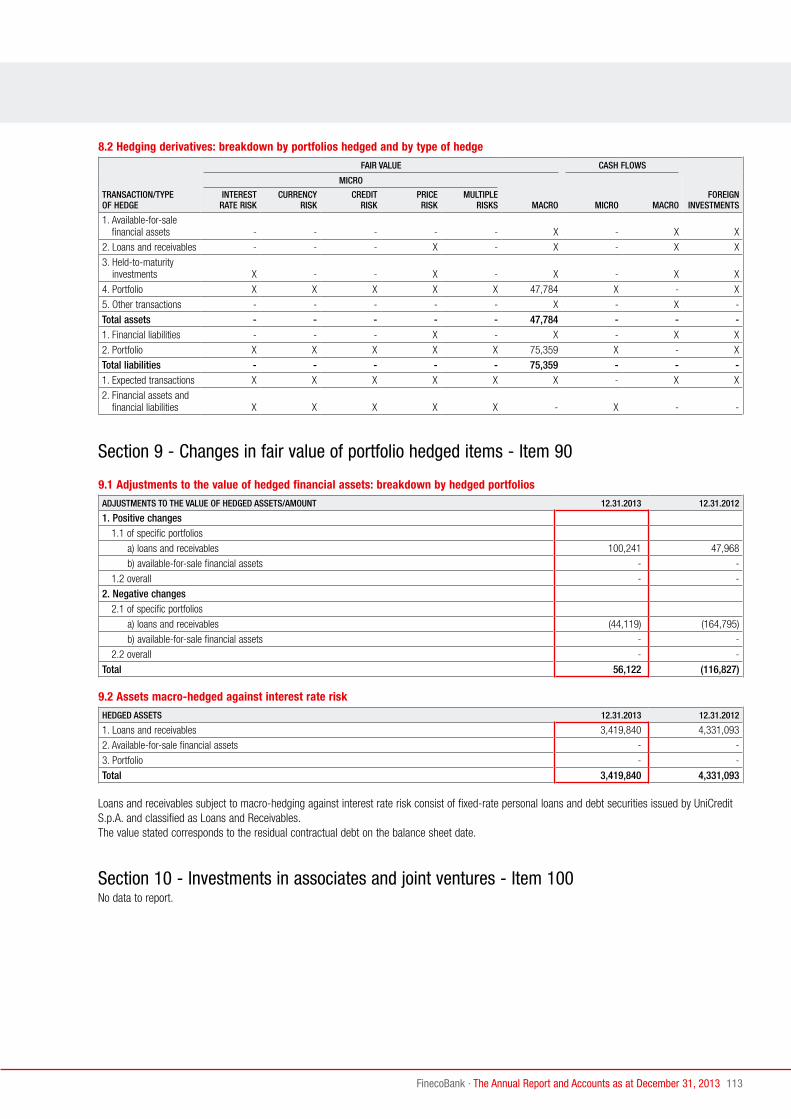
113FinecoBank · The Annual Report and Accounts as at December 31, 2013
8.2 Hedging derivatives: breakdown by portfolios hedged and by type of hedge
TRANSACTION/TYPE OF HEDGE
FAIR VALUE CASH FLOWS
FOREIGN INVESTMENTS
MICRO
MACRO MICRO MACROINTEREST
RATE RISKCURRENCY
RISKCREDIT
RISKPRICE RISK
MULTIPLE RISKS
1. Available-for-sale financial assets - - - - - X - X X
2. Loans and receivables - - - X - X - X X
3. Held-to-maturity investments X - - X - X - X X
4. Portfolio X X X X X 47,784 X - X
5. Other transactions - - - - - X - X -
Total assets - - - - - 47,784 - - -1. Financial liabilities - - - X - X - X X
2. Portfolio X X X X X 75,359 X - X
Total liabilities - - - - - 75,359 - - -1. Expected transactions X X X X X X - X X
2. Financial assets and financial liabilities X X X X X - X - -
Section 9 - Changes in fair value of portfolio hedged items - Item 90
9.1 Adjustments to the value of hedged financial assets: breakdown by hedged portfolios
ADJUSTMENTS TO THE VALUE OF HEDGED ASSETS/AMOUNT 12.31.2013 12.31.2012
1. Positive changes 1.1 of specific portfolios
a) loans and receivables 100,241 47,968
b) available-for-sale financial assets - -
1.2 overall - -
2. Negative changes 2.1 of specific portfolios
a) loans and receivables (44,119) (164,795)
b) available-for-sale financial assets - -
2.2 overall - -
Total 56,122 (116,827)
9.2 Assets macro-hedged against interest rate risk
HEDGED ASSETS 12.31.2013 12.31.2012
1. Loans and receivables 3,419,840 4,331,093
2. Available-for-sale financial assets - -
3. Portfolio - -
Total 3,419,840 4,331,093
Loans and receivables subject to macro-hedging against interest rate risk consist of fixed-rate personal loans and debt securities issued by UniCredit S.p.A. and classified as Loans and Receivables. The value stated corresponds to the residual contractual debt on the balance sheet date.
Section 10 - Investments in associates and joint ventures - Item 100No data to report.

114
Part B - Balance Sheet - Assets (Continued)
Notes to the Accounts
The Annual Report and Accounts as at December 31, 2013 · FinecoBank
Section 11 - Property, plant and equipment - Item 110
11.1 Property, plant and equipment used in the business: breakdown of assets carried at cost
ASSET/AMOUNT 12.31.2013 12.31.2012
1. Owned assets a) land - -
b) buildings - -
c) office furniture and fittings 834 732
d) electronic systems 5,846 3,743
e) other 1,358 1,379
2. Assets under financial lease a) land - -
b) buildings - -
c) office furniture and fittings - -
d) electronic systems - -
e) other - -
Total 8,038 5,854
A description of the methods used to calculate depreciation is provided in Section 11 of the income statement.
11.2 Property, plant and equipment held for investment purposes: breakdown of assets carried at cost
ASSET/AMOUNT
12.31.2013 12.31.2012
BOOK VALUE
FAIR VALUE BOOK VALUE
FAIR VALUE
L1 L2 L3 L1 L2 L3
1. Owned assets a) land - - - - - - - -
b) buildings 2,734 - - 4,813 2,846 - - 4,810
2. Assets under financial lease a) land - - - - - - - -
b) buildings - - - - - - - -
Total 2,734 - - 4,813 2,846 - - 4,810
11.3 Property, plant and equipment used in the business: breakdown of revalued assetsNo data to report.
11.4 Property, plant and equipment held for investment purposes: breakdown of assets measured at fair valueNo data to report.

115FinecoBank · The Annual Report and Accounts as at December 31, 2013
11.5 Property, plant and equipment used in the business: annual changes
LAND BUILDINGSOFFICE FURNITURE
AND FITTINGSELECTRONIC
SYSTEMS OTHER TOTAL
A. Gross opening balance - - 11,697 24,548 9,214 45,459 A.1 Total net reduction in value - - (10,965) (20,805) (7,835) (39,605)
A.2 Net opening balance - - 732 3,743 1,379 5,854B. Increases: B.1 Purchases - - 1,072 3,899 522 5,493
B.2 Capitalised expenditure on improvements - - - - - -
B3. Write-backs - - - - - -
B.4 Increases in fair value
a) in equity - - - - - -
b) through profit or loss - - - - - -
B.5 Positive Exchange differences - - - - - -
B.6 Transfers from properties held for investment - - - - - -
B.7 Other increases - - 15 - 7 22
C. Decreases: C.1 Sales - - - - - -
C.2 Depreciation - - (956) (1,778) (546) (3,280)
C.3 Impairment losses recognised
a) in equity - - - - - -
b) through profit or loss - - (28) - (4) (32)
C.4 Negative changes in fair value:
a) in equity - - - - - -
b) through profit or loss - - - - - -
C.5 Negative exchange differences - - - - - -
C.6 Transfers to:
a) property, plant and equipment held for investment - - - - - -
b) assets held for sale - - - - - -
C.7 Other decreases - - (1) (18) - (19)
D. Net closing balance - - 834 5,846 1,358 8,038 D.1 Total net reduction in value - - (11,764) (22,521) (8,350) (42,635)
D.2 Gross closing balance - - 12,598 28,367 9,708 50,673E. Carried at cost - - 834 5,846 1,358 8,038
Assets indicated in the above table are carried at cost.

116
Part B - Balance Sheet - Assets (Continued)
Notes to the Accounts
The Annual Report and Accounts as at December 31, 2013 · FinecoBank
11.6 Property, plant and equipment held for investment purposes: annual changes
12.31.2013
LAND BUILDINGS
A. Gross opening balance - 3,745A.1 Total net reduction in value - (899)
A.2 Net opening balance - 2,846B. Increases: B.1 Purchases - -
B.2 Capitalised expenditure on improvements - -
B.3 Net increases in fair value - -
B.4 Write-backs - -
B.5 Positive exchange differences - -
B.6 Transfer from properties used in the business - -
B.7 Other increases - -
C. Decreases: C.1 Sales - -
C.2 Depreciation - (112)
C.3 Negative changes in fair value - -
C.4 Impairment losses - -
C.5 Negative exchange differences - -
C.6 Transfers to other asset portfolios
a) properties used in the business - -
b) non-current assets classified as held for sale - -
C.7 Other decreases - -
D. Net closing balance - 2,734D.1 Total net reduction in value - (1,011)
D.2 Gross closing balance - 3,745E. Fair value measurement - 4,813
Buildings indicated in the above table are carried at cost.
11.7 Commitments to purchase property, plant and equipmentAs at December 31, 2013 the Bank had contractual commitments to purchase property, plant and equipment amounting to €284 thousand. No restrictions on the ownership of property, plant and equipment exist, and no property, plant and equipment is given as collateral for own liabilities and commitments.
Section 12 - Intangible assets - Item 120
12.1 Intangible assets: breakdown
ASSET/AMOUNT
12.31.2013 12.31.2012
FINITE LIFE INDEFINITE LIFE FINITE LIFE INDEFINITE LIFE
A.1 Goodwill X 89,602 X 89,602
A.2 Other Intangible assets 8,014 8,177
A.2.1 Assets carried at cost:
a) Intangible assets generated internally - - - -
b) Other assets 8,014 - 8,177 -
A.2.2 Assets valued at fair value:
a) Intangible assets generated internally - - - -
b) Other assets - - - -
Total 8,014 89,602 8,177 89,602
The useful life of software, considered for the calculation of amortisation, is 3 years, while the useful life of other intangible assets, for the calculation of depreciation, is 5 years. A description of the methods used to calculate amortisation and depreciation is provided in section 12 of the income statement.

117FinecoBank · The Annual Report and Accounts as at December 31, 2013
12.2 Intangible assets: annual changes
GOODWILL
OTHER INTANGIBLE ASSETS: GENERATED INTERNALLY OTHER INTANGIBLE ASSETS: OTHER
TOTALFIN INDEF FIN INDEF
A. Gross opening balance 124,729 - - 55,761 - 180,490 A.1 Total net reduction in value (35,127) - - (47,584) - (82,711)
A.2 Net opening balance 89,602 - - 8,177 - 97,779B. Increases B.1 Purchases - - - 4,503 - 4,503
B.2 Increases in internal intangible assets X - - - - -
B3. Write-backs X - - - - -
B.4 Positive changes in fair value:
- in equity X - - - - -
- through profit or loss X - - - - -
B.5 Positive exchange differences - - - - - -
B.6 Other increases - - - 120 - 120
C. Decreases C.1 Sales - - - - - -
C.2 Write-downs
- Amortisation X - - (4,657) - (4,657)
- Write-downs
+ in equity X - - - - -
+ through profit or loss - - - - - -
C.3 Negative changes in fair value
- in equity X - - - - -
- through profit or loss X - - - - -
C.4 Transfers to non-current assets classified as held for sale - - - - - -
C.5 Negative exchange differences - - - - - -
C.6 Other decreases - - - (129) - (129)
D. Net closing balance 89,602 - - 8,014 - 97,616 D.1 Total net impairment losses (35,127) - - (52,241) - (87,368)
E. Gross closing balance 124,729 - - 60,255 - 184,984F. Carried at cost 89,602 - - 8,014 - 97,616
KeyFIN: finite life.IND: indefinite life.
Assets indicated in the above table are carried at cost.
12.3 Other informationAs at December 31, 2013, the Bank had contractual commitments to purchase intangible assets amounting to €131 thousand.
There are also no intangible assets acquired for government concessions; no intangible assets used as collateral for own liabilities exist; no intangible assets covered by finance lease agreements exist; no revalued intangible assets exist, therefore no restrictions on the distribution of unrealised gains to shareholders exist.
Other information - Impairment testsUnder IAS 36, impairment test of intangible assets with indefinite lives must be performed at least annually and, in any case, whenever there is objective evidence of the occurrence of events that may have reduced their value. Recoverable value is the greater of the value in use (present value of future cash flows generated by the asset being valued) and the associated fair value, net of sales costs.The recoverable value of intangible assets subject to impairment testing must be determined for the individual assets, unless both the following conditions exist:• the value in use of the asset is not estimated to be close to the fair value net of selling costs;• the asset does not generate incoming cash flows that are largely independent to those generated by other assets.If these conditions exist, the impairment test is conducted at the level of the Cash Generating Unit (CGU), as required by the cited accounting principle.To determine the value in use of intangible assets subject to impairment testing, IAS 36 requires that reference be made to cash flows for the assets under conditions that were current on the test date.

118
Part B - Balance Sheet - Assets (Continued)
Notes to the Accounts
The Annual Report and Accounts as at December 31, 2013 · FinecoBank
For the impairment testing, the value in use of the Cash Generating Units (CGUs) to which these intangible assets are assigned must be calculated taking into account the cash flows for all assets and liabilities included in the CGUs and not only those for which goodwill and/or the intangible asset were recorded when applying IFRS 3.
The definition of the CGUEstimating the value in use for the purposes of any impairment test of intangible assets, including goodwill, which do not generate cash flows independently but only in conjunction with other business assets, requires that these assets first be attributed to operating units that are relatively autonomous in the business context (from the points of view of the cash flows generated, as well as the internal planning and management reporting system). These operating units are defined as Cash Generating Units (CGU). Goodwill recognised in the financial statements relates to buy-outs of divisions or companies engaged in trading activities or the distribution of financial, banking and insurance products through personal financial advisers. These activities have been fully integrated with FinecoBank’s ordinary operations, as a result it is not possible to isolate the contribution of each company/business division from the Bank’s overall income; this means that to establish the reasonableness of the value of goodwill recognised in the financial statements it is necessary to take account of the Bank’s overall income.The Cash Generating Unit (CGU) is the Bank as a whole. In fact, in view of the specific business model adopted by FinecoBank, which envisages a high level of integration between personal financial advisers and the trading and banking platform, an allocation of costs/revenues for business units is not considered relevant or meaningful; the personal financial advisers network is an integral part of the overall offer, which includes banking, brokerage and investment services.
Estimating cash flows to determine the value in use of the CGUsThe applicable accounting principles require that the impairment test be carried out by comparing the book value of the CGU to the recoverable value. When the latter proves to be less than the book value, a write-down must be recorded in the financial statements. The recoverable value is the greater of its fair value (net of sales costs) and the related value in use. The recoverable amount of the CGU is the greater of its fair value (net of costs to sell) and the related value in use.
Impairment test modelThe calculation of the value in use for the purposes of impairment test is made using a discounted cash flow (DCF) model. The cash flows are determined by subtracting the annual capital requirement generated by the change in the risk-weighted assets from net profit. This capital requirement is defined as the level of capitalization that is intended to be achieved in the long term, also in light of the minimum regulatory capital requirements.
The Discounted Cash Flow model used is based on three stages:• first stage - from 2014 to 2018 - which uses the internal financial projections relating to the Strategic Plan submitted for approval by the Board of
Directors on March 10, 2014;• interim stage - from 2019 to 2023 - for which forecasts of cash flows are extrapolated starting from the last period of explicit forecast (2018) using
reducing growth rates (from 4% to 2%) down to those of the “terminal value”; • terminal value calculated using a nominal growth rate of 2%. The euro area’s average nominal GDP growth from 1996 to 2013 was 3.0% (of which
1.6% real growth due to inflation). The choice of nominal 2%, corresponding to around 0% real growth, was made for prudential reasons.
Discount rates of cash flowsThe main assumptions used by Management to calculate the recoverable value were as follows:• Initial discount rate net of tax (Ke)11.29%• Final discount rate net of tax (Ke)10.00%• Nominal growth rate used to calculate Terminal Value 2.00%.
Future financial flows were discounted using a conservative estimate of the discount rate, incorporating the various risk factors linked to the business sector into the equity cost (Ke). The discount rate is a nominal rate, net of taxes. In particular, the cost of capital for the FinecoBank is the sum of the following:• Risk-free rate: the average over the last six years of the five-year Bund. The six-year horizon was adopted in line with the average economic cycle in
the Eurozone;• Debt risk premium: the average over the last six years of the Credit Default Swap paid by UniCredit;• Risk premium on own equity: calculated using the option-based model, based on the average volatility over the last six years of the share price of
banks operating primarily in the same sector.
The cost of capital as defined above, converges in a linear fashion to the cost of capital of the Terminal Value, over the 10 years envisaged in the model.

119FinecoBank · The Annual Report and Accounts as at December 31, 2013
Impairment test resultsFor the purpose of impairment test, the book value of goodwill was compared to the value in use calculated using the above-illustrated method. The result of the test conducted as at December 31, 2013 confirms the sustainability of goodwill recognised in the financial statements.
Sensitivity analysisSince this assessment is made particularly complex by the current macroeconomic and market environment affecting the financial sector and the resulting difficulty in making predictions about future long-term profitability, sensitivity analyses were conducted, assuming changes to the main parameters used in the impairment test.
The table below shows the change in the value in use as a result of specific changes in the main parameters and information used in the DCF model.
1% INCREASE IN THE DISCOUNT RATE AFTER
TAXES (KE)1% INCREASE IN TARGET
CORE TIER 1 RATIO
1% DECREASE IN THE NOMINAL GROWTH RATE
FOR THE CALCULATION OF TERMINAL VALUE
5% DECREASE IN ANNUAL EARNINGS
Change in value of use -12.1% -0.6% -7.2% -5.1%
The results confirm the sustainability of goodwill, as the need to perform write-downs did not arise in any of the hypothetical scenarios.Furthermore, where changes that currently cannot be reasonably expected are used for the above parameters the impairment test reaches break-even, as the value in use calculated by applying such changes remains much higher than the book value.Specifically, the impairment test reaches a break-even level in the event of an absolute positive change of over 30 percentage points in the discount rate after taxes (Ke), or in the case of a decrease of approximately 82% in annual earnings (keeping the other parameters and information used unchanged in both cases).
Section 13 - Tax Assets and Tax Liabilities - Asset item 130 and liability item 80
The item “Tax assets” amounting to €67,934 thousand comprises:- “Deferred tax assets” of €41,316 thousand recognised as a balancing entry in the income statement;- “Deferred tax assets” of €1,354 thousand as the balancing entry of Shareholders’ equity, mainly associated with the loss resulting from the
assignment of non-performing receivables to Aspra Finance S.p.A., merged by incorporation with Unicredit Credit Management Bank S.p.A., recorded in a negative reserve under shareholders’ equity;
- “Current tax assets” of €25,264 thousand. This amount was affected by the increase in IRES income tax and IRAP corporate tax to be paid in advance to the revenue office, from 100% to 130%.
The item “Tax liabilities” amounting to €37,701 thousand comprises:- “Current tax liabilities” of €16,842 thousand; - “Deferred tax liabilities” of €20,527 thousand recognised as a balancing entry in the income statement;- “Deferred tax liabilities” of €332 thousand recognised as a balancing entry of shareholders’ equity.The calculation of the aforementioned asset and liability items was affected by the impact of the adoption of “national tax consolidation”.
National tax consolidationFor the three-year period 2013-2015, FinecoBank, as consolidated company, is subject to “national tax consolidation”, as established by Legislative Decree no. 344 of December 12, 2003, which was carried out by the Parent Company, UniCredit S.p.A..
Prepaid/deferred tax assets/liabilitiesIn accordance with the law and regulations currently in force:- the valuation of deferred tax assets for IRES income tax purposes takes into account the expected income figures for future years, according to the
decisions made by the competent company bodies;- the valuation of deferred tax assets for IRAP corporate tax purposes takes place on the basis of the Company’s expected income figures for future
years, and takes into account changes in the legal context;- deferred tax liabilities are recognised whenever the relevant requirements are satisfied.
Deferred tax assets and liabilities were determined assuming an IRES income tax rate of 27.5% and an IRAP corporate tax rate of 5.57%.More detailed information on “Deferred tax assets” is provided in sections 13.1, 13.3 and 13.5 below. Similar information concerning “Deferred tax liabilities” is provided in sections 13.2, 13.4 and 13.6 below.

120
Part B - Balance Sheet - Assets (Continued)
Notes to the Accounts
The Annual Report and Accounts as at December 31, 2013 · FinecoBank
13.1 Deferred tax assets: breakdown
ASSET/AMOUNT 12.31.2013 12.31.2012
Allocations through equity 37,843 38,474
Allocations through equity 1,354 1,597
Impairments losses on loans and receivables 3,473 3,159
Total 42,670 43,230
13.2 Deferred tax liabilities: breakdown
ASSET/AMOUNT 12.31.2013 12.31.2012
Property plant and equipment / Intangible assets 20,527 19,172
Other financial instruments /assets/ liabilities 332 148
Total 20,859 19,320
13.3 Changes in deferred tax assets (through profit or loss)
12.31.2013 12.31.2012
1. Opening balance 41,633 37,5572.1 Deferred tax assets recognised in the year 7,048 8,098
a) relating to previous years - -
b) due to changes in accounting policies - -
c) write-backs - -
d) other 7,048 8,098
2.2 New taxes or increases in tax rates - -
2.3 Other increases - 1,364
3. Decreases3.1 Deferred tax assets cancelled in the year (6,928) (5,386)
a) reversals of temporary differences (6,928) (5,386)
b) write-downs of non-recoverable items - -
c) due to changes in accounting policies - -
d) other - -
3.2 Reduction in tax rates - -
3.3 Other decreases
a) conversion into tax credits pursuant to law no. 214/2011 - -
b) other (437) -
4. Closing balance 41,316 41,633
Figures as at December 31, 2012 differ from figures reported in the annual report at that date due to the retroactive application of IAS 19R, which decreased Deferred Tax Assets by €1,915 thousand, as described in Part A - Accounting Policies of Section 2 - General Criteria for preparing the Notes to the Accounts.Increases in deferred tax assets recognised in the financial year through profit or loss refer to the following main items:- Allocations to provisions for risks and charges;- future personnel costs.- impairment losses and losses on deferred receivables, up to 4/5, pursuant to article 106, paragraph 3 of the TUIR (Consolidated Law on Income Tax).
Decreases in deferred tax assets recorded in the financial year as a balancing item of the income statement refer to the following main items:- tax recovery for deferred expenses;- use of provisions for future personnel costs;- use of provisions for risks and charges;- tax recovery of bad debts.
There are no deferred tax assets arising from tax losses carried forward to subsequent years.

121FinecoBank · The Annual Report and Accounts as at December 31, 2013
13.3.1 Changes in deferred tax assets under Law 214/2011 (through profit or loss)
12.31.2013 12.31.2012
1. Opening balance 3,159 2,9782. Increases 945 1813. Decreases 3.1 Reversals (243) -
3.2 Conversion into tax credits
a) resulting from operating losses - -
b) resulting from tax losses - -
3.3 Other decreases (388) -
4. Closing balance 3,473 3,159
13.4 Changes in deferred tax liabilities (through profit or loss)
12.31.2013 12.31.2012
1. Opening balance 19,172 17,7872. Increases 2.1 Deferred tax liabilities arising during the year 1,374 1,429
a) relating to previous years - -
b) due to changes in accounting policies - -
c) other 1,374 1,429
2.2 New taxes or increases in tax rates - -
2.3 Other increases - -
3. Decreases 3.1 Deferred tax liabilities de-recognised during the year (19) (44)
a) reversals of temporary differences (19) (44)
b) due to changes in accounting policies - -
c) other - -
3.2 Reduction in tax rates - -
3.3 Other decreases - -
4. Closing balance 20,527 19,172
Increases in deferred tax liabilities recorded in the financial year through profit or loss refer to the recognition of deferred tax liabilities resulting from the accounting and tax treatment of goodwill.Decreases in deferred tax liabilities recorded in the financial year through profit or loss refer mainly to the tax recovery of amortisation.
13.5 Changes in deferred tax assets (through equity)
12.31.2013 12.31.2012
1. Opening balance 1,597 1,8072. Increases 2.1 Deferred tax assets recognised in the year 26 182
a) relating to previous years - -
b) due to changes in accounting policies - -
c) other 26 182
2.2 New taxes or increases in tax rates - -
2.3 Other increases - -
3. Decreases 3.1 Deferred tax assets cancelled in the year (269) (392)
a) reversals of temporary differences (223) -
b) write-downs of non-recoverable items - -
c) due to changes in accounting policies - -
d) other (46) (392)
3.2 Reduction in tax rates - -
3.3 Other decreases - -
4. Closing balance 1,354 1,597

122
Part B - Balance Sheet - Assets (Continued)
Notes to the Accounts
The Annual Report and Accounts as at December 31, 2013 · FinecoBank
Figures as at December 31, 2012 differ from figures reported in the annual report at that date due to the retroactive application of IAS 19R, which increased Deferred Tax Assets through equity by €216 thousand, as described in Part A - Accounting Policies of Section 2 - General Criteria for preparing the Notes to the Accounts.Decreases in deferred tax assets recorded in the financial year through equity refer to the recognition of deferred tax assets resulting from the fair value measurement of debt securities classified as “Available-for-sale financial assets”.
13.6 Changes in deferred tax liabilities (through equity)
12.31.2013 12.31.2012
1. Opening balance 148 732. Increases2.1 Deferred tax liabilities arising during the year 271 148
a) relating to previous years - -
b) due to change in accounting policies - -
c) other 271 148
2.2 New taxes or increases in tax rates - -
2.3 Other increases - -
3. Decreases3.1 Deferred tax liabilities de-recognised during the year (87) (73)
a) reversals of temporary differences (87) -
b) due to change in accounting policies - -
c) other - (73)
3.2 Reduction in tax rates - -
3.3 Other decreases - -
4. Closing balance 332 148
Increases in deferred tax liabilities recorded in the financial year through equity refer to the recognition of deferred tax liabilities resulting from the fair value measurement of debt securities classified as “Available-for-sale financial assets”.
13.7 Other informationNo information to report.
Section 14 - Non-current assets and disposal groups classified as held for sale and associated liabilities - Assets item 140 and liabilities item 90
14.1 Non-current assets and disposal groups classified as held for sale: breakdown by type of asset No data to report.
14.2 Other informationNo information to report.
14.3 Information on equity investments in companies subject to significant influence not valued according to the equity methodNo information to report.

123FinecoBank · The Annual Report and Accounts as at December 31, 2013
Section 15 - Other assets - Item 150
15.1 Other assets: breakdown
12.31.2013 12.31.2012
Items in transit not allocated to relevant accounts 13 7
Items in processing:
- notes, cheques and other documents 9,108 13,664
- POS and ATM cards 379 677
- other items in processing 1 6
Current receivables not related to the provision of financial services 1,707 2,827
Definitive items not recognised under other items:
- securities and coupons to be settled 8,283 608
- fees to be charged to customers 33,020 12,618
- amounts to be settled via clearing houses 908 2,365
- other transactions 20,281 24,646
Tax items other than those recognised under item 140:
- tax advances 151,540 77,872
- tax credit 9,356 9,276
- tax advances on employee severance indemnities 12 20
Receivables due to disputed items not deriving from lending 119 119
Prepayments 10,940 6,868
Improvement and incremental expenses incurred on leasehold assets 10,962 10,467
Total 256,629 162,040

124
Notes to the Accounts
The Annual Report and Accounts as at December 31, 2013 · FinecoBank
Liabilities
Section 1 - Deposits from banks - Item 10
1.1 Deposits from banks: breakdown by categoryTYPE OF TRANSACTION/AMOUNT 12.31.2013 12.31.2012
1. Deposits from central banks - -2. Deposits from banks2.1 Current accounts and demand deposits 29,139 39,4032.2 Time deposits - -2.3 Loans 2.3.1 Repos 1,619,295 2,025,627 2.3.2 Other - -2.4 Liabilities in respect of commitments to repurchase treasury shares - -2.5 Other liabilities 241 123Total 1,648,675 2,065,153Fair value - level 1 - -Fair value - level 2 1,648,675 2,065,153Fair value - level 3 - -Total fair value 1,648,675 2,065,153
1.2 Breakdown of item 10 “Deposits from banks”: subordinated debtsNo data to report.
1.3 Breakdown of item 10 “Deposits from banks”: structured debtsNo data to report.
1.4 Deposits from banks subject to micro-hedgingNo data to report.
1.5 Amounts payable under finance leasesNo data to report.
Section 2 - Deposits from customers - Item 20
2.1 Deposits from customers: breakdown by categoryTYPE OF TRANSACTION/AMOUNT 12.31.2013 12.31.2012
1. Current accounts and demand deposits 10,666,363 9,551,5502. Time deposits 1,699,635 2,277,4603. Loans 3.1 Repos 304,380 382,241 3.2 Other - -4. Liabilities in respect of commitments to repurchase treasury shares - -5. Other liabilities 61,931 52,291Total 12,732,309 12,263,542Fair value - level 1 - -Fair value - level 2 12,739,102 12,295,879Fair value - level 3 - -Total fair value 12,739,102 12,295,879
2.2 Breakdown of item 20 “Deposits from customers”: subordinated debtsNo data to report.
2.3 Breakdown of item 20 “Deposits from customers”: structured debtsNo data to report.
2.4 Deposits from customers subject to micro-hedgingNo data to report.
2.5 Amounts payable under finance leasesNo data to report.
Part B - Balance Sheet (Amounts in € thousand)

125FinecoBank · The Annual Report and Accounts as at December 31, 2013
Section 3 - Debt securities in issue - Item 30
3.1. Debt securities in issue: breakdown by category
TYPE OF TRANSACTION/AMOUNT
12.31.2013 12.31.2012
BOOK VALUE
FAIR VALUE BOOK VALUE
FAIR VALUE
LEVEL 1 LEVEL 2 LEVEL 3 LEVEL 1 LEVEL 2 LEVEL 3
A. Securities1. Bonds
1.1 structured - - - - - - - -
1.2 other 2,322,511 - 2,422,470 - 3,075,792 - 3,043,081 -
2. Other securities
2.1 structured - - - - - - - -
2.2 other - - - - - - - -
Total 2,322,511 - 2,422,470 - 3,075,792 - 3,043,081 -
In 2011 FinecoBank issued bond loans for a nominal value of €4,500,000 thousand and $100,000 thousand, which were entirely subscribed by the Parent Company UniCredit S.p.A.. These bonds have been partially repurchased in 2012 and 2013 for a total of €2,250,000 thousand.
3.2 Breakdown of item 30 “Debt securities in issue”: subordinated securitiesNo data to report.
3.3. Debt securities in issue subject to micro-hedgingNo data to report.
Section 4 - Financial liabilities held for trading - Item 40
4.1 Financial liabilities held for trading: breakdown by category
TYPE OF TRANSACTION/AMOUNT
12.31.2013 12.31.2012
NA
FV
FV* NA
FV
FV*L1 L2 L3 L1 L2 L3
A. On-balance sheet liabilities1. Deposits from banks - - - - - - - - - -2. Deposits from customers 633 - - - - 808 6 - - 63. Debt securities 3.1 Bonds 3.1.1 Structured - - - - X - - - - X 3.1.2 Other bonds - - - - X - - - - X 3.2 Other securities 3.2.1 Structured - - - - X - - - - X 3.2.2 Other - - - - X - - - - XTotal A 633 - - - - 808 6 - - 6B. Derivative instruments1. Financial derivatives 1.1 Trading derivatives X 1,709 592 - X X 4,523 2,648 - X 1.2 Related to fair value option X - - - X X - - - X 1.3 Other X - - - X X - - - X2. Credit derivatives 2.1 Trading derivatives X - - - X X - - - X 2.2 Related to fair value option X - - - X X - - - X 2.3 Other X - - - X X - - - XTotal B X 1,709 592 - X X 4,523 2,648 - XTotal (A+B) 633 1,709 592 - - 808 4,524 2,648 - 1
KeyFV = Fair value.FV* = Fair value calculated excluding the changes in value due to the change in the issuer’s credit rating since the issue date.NA = nominal or notional value.L1 = Level 1.L2 = Level 2.L3 = Level 3.

126
Part B - Balance Sheet - Liabilities (Continued)
Notes to the Accounts
The Annual Report and Accounts as at December 31, 2013 · FinecoBank
Trading financial derivatives refer to the negative valuation of Forex Contracts for Difference (CFDs), CFDs on indices and relative Futures on indices used to hedge CFDs.Sub-item B.1.1 Derivative instruments - Trading financial derivatives includes the negative valuations of spot contracts for securities classified in the HFT portfolio and currencies to be regulated in times established by market practices (“regular way”). CFDs on indices and currencies are “Over the counter” derivative contracts that require the payment of a differential generated by the difference between the opening and closing price of the financial instrument. In operational terms, the bank covers customer positions, by underwriting futures on the indexes underlying the CFDs on indices, or through Forex transactions with institutional counterparties to hedge CFD transactions in open currencies with customers’ currency.
4.2 Item 40 “Financial liabilities held for trading”: subordinated liabilitiesNo data to report.
4.3 Item 40 “Financial liabilities held for trading”: structured debtsNo data to report.
4.4 On-balance sheet financial liabilities (excluding “technical overdrafts”) held for trading: annual changesNo data to report.
Section 5 - Financial liabilities at fair value through profit and loss - Item 50No data to report.
Section 6 - Hedging derivatives - Item 60
6.1 Hedging derivatives: breakdown by type of hedge and by hierarchical level
ITEM/AMOUNTFAIR VALUE 12.31.2013 NA
12.31.2013FAIR VALUE 12.31.2012 NA
12.31.2012L1 L2 L3 L1 L2 L3
A. Financial derivatives 1) Fair value - 141,801 - 3,382,879 - 213,885 - 4,313,475 2) Cash flows - - - - - - - - 3) Net investment in foreign subsidiaries - - - - - - - -B. Credit derivatives 1) Fair value - - - - - - - - 2) Cash flows - - - - - - - -Totale - 141,801 - 3,382,879 - 213,885 - 4,313,475
Key:Key:NA = Nominal or Notional AmountL1 = Level 1L2 = Level 2L3 = Level 3
6.2 Hedging derivatives: breakdown by portfolios hedged and by type of hedge
TRANSACTION/TYPE OF HEDGE
FAIR VALUE CASH FLOWS
FOREIGN INVESTMENTS
MICRO
MACRO MICRO MACROINTEREST
RATE RISKCURRENCY
RISKCREDIT
RISKPRICE RISK
MULTIPLE RISKS
1. Available-for-sale financial assets - - - - - X - X X
2. Loans and receivables - - - X - X - X X
3. Held-to-maturity investments X - - X - X - X X
4. Portfolio X X X X X 93,987 X - X
5. Other transactions - - - - - X - X -
Total assets - - - - - 93,987 - - -1. Financial liabilities - - - X - X - X X
2. Portfolio X X X X X 47,814 X - X
Total liabilities - - - - - 47,814 - - -1. Expected transactions X X X X X X - X X2. Financial assets and
financial liabilities X X X X X - X - -

127FinecoBank · The Annual Report and Accounts as at December 31, 2013
Section 7 - Changes in fair value of portfolio hedged items - Item 70
7.1 - Adjustments to the value of hedged financial liabilities
CHANGES TO HEDGED FINANCIAL LIABILITIES/AMOUNTS 12.31.2013 12.31.2012
1. Positive changes to financial liabilities 81,077 24,673
2. Negative changes to financial liabilities (44,304) (165,307)
Total 36,773 (140,634)
7.2 Financial liabilities subject to macro-hedging of interest rate risk: breakdown
HEDGED LIABILITIES 12.31.2013 12.31.2012
1. Debt securities in issue 2,322,511 3,075,792
Total 2,322,511 3,075,792
Liabilities subject to macro-hedging of interest rate risk consist of debt securities issued by FinecoBank. The value stated corresponds to the residual contractual debt on the balance sheet date.
Section 8 - Tax liabilities - Item 80See section 13 of assets.
Section 9 - Liabilities included in disposal groups classified as held for sale - Item 90See section 14 of assets.
Section 10 - Other liabilities - Item 100
10.1 Other liabilities: breakdown
12.31.2013 12.31.2012
Accrued expenses other than those to be capitalised 183 857
for the financial liabilities concerned 15,229 14,059
Other liabilities relative to employees - 14
Other liabilities relative to other personnel 244 166
Other liabilities due to Directors and Statutory Auditors 181 178
Sums available to be paid to customers
Items in processing: 2,819 3,703
- incoming bank transfers 44,326 39,023
- outgoing bank transfers - 409
- POS and ATM cards 253 10,806
- other items in processing 27,400 20,094
Current payables not related to the provision of financial services
Definitive items not recognised under other items: 12,417 1,537
- securities and coupons to be settled 21,979 21,574
- other items 13,847 7,067
Adjustments for illiquid portfolio items Tax items other than those included in item 80:
- sums withheld from third parties as withholding agent 26,157 21,875
- other 57,697 38,438
Prepayments 276 305
Social security contributions to be paid 4,853 4,699
Total 227,861 184,804

128
Part B - Balance Sheet - Liabilities (Continued)
Notes to the Accounts
The Annual Report and Accounts as at December 31, 2013 · FinecoBank
Section 11 - Provision for employee severance pay - Item 110
11.1 Provision for employee severance pay: annual changes
12.31.2013 12.31.2012
A. Opening balance 3,909 3,289 B.1 Provisions for the year 126 144
B.2 Other increases 147 658
of which actuarial losses on employee severance pay provision (IAS19R) - 631
C. Decreases C.1 Payments made (124) (133)
C.2 Other decreases (297) (49)
of which actuarial gains on employee severance pay provision (IAS19R) (176) -
D. Closing balance 3,761 3,909
Figures as at December 31, 2012 differ from figures reported in the annual report at that date due to the retroactive application of IAS 19R, which increased the Provision for employee severance pay by €784 thousand, as described in Part A - Accounting Policies of Section 2 - General Criteria for preparing the Notes to the Accounts.
11.2 Other informationThe “TFR” provision for Italy-based employee benefits is considered to be a “post-retirement defined benefit”. It is therefore recognised on the basis of an actuarial estimate of the amount of benefit accrued by employees discounted to present value. This benefit is calculated by an external actuary using the “Unit credit projection method” (see Part A.2 - The Main Items of the Accounts).The Provision for employee severance pay covers the amount of the rights accrued in that respect up to December 31, 2013 by employees, under current legal regulations, as well as national collective bargaining agreements and supplementary company agreements.The financial year under review was characterised by:1) normal events relating to the employee severance pay provision in accordance with legal provisions and company agreements in force;2) changes associated with employment contracts pursuant to Article 1406 and following of the Civil Code dealing with individual mobility within
the Group.
In 2007, the new supplementary pension reform pursuant to Legislative Decree no. 252/2005 became effective and, as a result the amounts accrued up to December 31, 2006 were kept with the Company, whilst the amounts of employee severance pay provision accruing as of January 1, 2007 were transferred to the supplementary pension funds or the INPS Treasury fund according to the option adopted by the employees (within June 30, 2007). The result is that:- the employee severance fund accrued up to December 31, 2006 (or until the date of the option - falling between January 1, 2007 and June 30,
2007 - adopted by the employees if the they decided to transfer their employee severance pay provision to a supplementary pension fund) continues to be a “defined-benefit” plan and therefore subject to actuarial valuation, although based on simplified actuarial assumptions which no longer take account of estimated future pay rises;
- the amounts accrued from January 1, 2007 (or from the date of the option - falling between January 1, 2007 and June 30, 2007 - by the employees if they decided to transfer their employee severance pay provision to a supplementary pension fund), were considered as a “defined-benefit” plan (as the Company’s liability ceases at the time it pays the employee severance pay provision accrued to the pension fund chosen by the employee) and therefore the related cost for the period is equal to the amounts paid to the Supplementary Pension fund or the INPS Treasury fund.
Description of the main actuarial assumptions
12.31.2013 12.31.2012
Discount rate 3.30% 3.30%
Expected inflation rate 1.80% 2.00%
Employee severance pay provision: other information
12.31.2013
Provisions for the year 126- Current service cost -
- Interest expense on defined-benefit obligations 126
- Gains and losses on curtailments and settlements -
- Past service cost -
Actuarial gains (losses) recognised in Revaluation reserves (OCI) (176) - Actuarial gains (losses) for the year (109)
- Actuarial gains/losses on demographic assumptions -
- Actuarial gains/losses on financial assumptions (67)

129FinecoBank · The Annual Report and Accounts as at December 31, 2013
Section 12 - Provisions for risks and charges - Item 120
12.1 - Provisions for risks and charges: breakdown
ITEM/AMOUNT 12.31.2013 12.31.2012
1. Pensions and other post-retirement benefit obligations - -
2. Other provisions for risks and charges
2.1 legal disputes 55,577 51,773
2.2 staff expenses - -
2.3 other 53,777 51,312
Total 109,354 103,085
Figures as at December 31, 2012 differ from the figures presented in the annual report as at that date due to the retroactive application of IAS 19R, which decreased Provisions for risks and charges by €5,891 thousand, as described in Part A - Accounting Policies of Section 2 - General Criteria for preparing the Notes to the Accounts.The other provisions for risks and charges under sub-item 2.3 includes the supplementary customer indemnity provision amounting to €32,178 thousand, compared to €29,375 thousand as at December 31, 2012 (figure restated according to the retroactive application of IAS 19R came into effect as from January 1, 2013).
12.2 Provisions for risks and charges: annual changes
PENSION FUNDS OTHER PROVISIONS TOTAL
A. Opening balance - 103,085 103,085B Increases B.1 Provisions for the year - 15,773 15,773
B.2 Changes due to the passage of time - 214 214
B.3 Changes due to variations in the discount rate - 72 72
B.4 Other increases - 44 44
C Decreases C.1 Amounts used in the year - (9,834) (9,834)
C.2 Changes due to variations in the discount rate - - -
C.3 Other decreases - - -
D. Closing balance - 109,354 109,354
12.3 Pensions and other post-retirement defined-benefit obligationsNo data to report.
12.4 Provisions for risks and charges - other provisions
12.31.2013 12.31.2012
Legal disputes 55,578 51,774- On-going disputes 40,573 41,514
- Complaints 15,005 10,260
Other 53,776 51,311- Supplementary customer indemnity provision 32,178 29,375
- Provision for contractual payments and payments under non-competition agreements 1,916 2,477
- Tax disputes 7,439 5,943
- Other provisions 12,243 13,516
Total Provisions for risks and charges - Other provisions 109,354 103,085

130
Part B - Balance Sheet - Liabilities (Continued)
Notes to the Accounts
The Annual Report and Accounts as at December 31, 2013 · FinecoBank
PROVISIONS FOR RISKS AND CHARGES 12.31.2012 USES 2013 TRANSFERSCHANGES IN EQUITY
PROVISIONS 2013 12.31.2013
Legal disputes- Ongoing disputes 41,514 (4,625) 549 - 3,135 40,573
- Complaints 10,260 (1,548) (549) - 6,842 15,005
Other- Additional customer expenses 29,375 (424) - 196 3,031 32,178
- Contractual payments and payments non-competition agreements 2,477 (100) - (152) (309) 1,916
- Tax disputes 5,943 (3) - - 1,499 7,439
- Other provisions 13,516 (3,134) - - 1,861 12,243
Total provision for risks and charges 103,085 (9,834) - 44 16,059 109,354
The provision for legal disputes includes provisions made for disputes relating to damages caused to customers due to illegal conduct by the company’s financial advisers, provisions made for pending disputes with advisers and employees and other pending legal and out-of-court proceedings with customers and other parties.
The supplementary customer indemnity provision is set up to cover severance pay for the network of financial advisers, pursuant to article 1751 of the Italian Civil Code, in the event of termination of the contract for causes not attributable to the adviser, such as the adviser reaching retirement age.The charge relating to the obligations existing at the end of the year is measured with the aid of an independent external actuary.
The provision for contractual payments and payments under non-competition agreements relates to the operations of a limited number of financial advisers and are set out by contract. Specifically, the non-competition agreement extends the obligation of loyalty beyond the termination of the work relationship, which protects the Bank from any competition from a former financial adviser. Contractual payments constitute a special benefit that the Bank undertakes to pay a financial adviser who has exercised the right to assign the rights and obligations arising from the contract entered into with the Bank to third parties, where, following the termination of the work relationship, the adviser continues to behave in an ethical and professional manner towards the Bank, with specific regard to the portfolio of customers. The charge relating to the contractual payment is measured with the aid of an independent external actuary.
The provision for tax disputes is set up in relation to claims received from the Italian Revenue Agency following tax audits on the Bank over the years.As the Bank deems it has calculated taxation correctly and lawfully, it has submitted appeals in the various instances of legal proceedings. Nonetheless, based on current regulations in force, the payments demanded by the tax authorities, through a tax collection notice or payment notice, must be made in advance, including the additional taxes claimed and the penalties and related interest.This provision for risks and charges includes the amounts paid to the tax authorities in advance relating to presumed and actual payments for penalties, interest and charges, which will presumably be incurred in relation to legal fees to be incurred in the various instances of legal proceedings.
Other provisions are mainly set up to cover risks linked to the Bank’s business and operations. These provisions specifically include provisions made for marketing and customer loyalty campaigns, as well as the amount resolved, but not yet requested, by the National Interbank Deposit Guarantee Fund for the support provided to a bank under extraordinary administration.
Section 13 - Redeemable shares - Item 140
13.1 Redeemable shares: breakdownNo data to report.

131FinecoBank · The Annual Report and Accounts as at December 31, 2013
Section 14 - Bank’s shareholders’ equity - Items 130, 150, 160, 170, 180, 190 and 200
14.1 “Share capital” and “Treasury shares”: breakdownShare capital amounts to €200,070,430.89 fully paid up, and is comprised of 606,274,033 authorised and fully paid up ordinary shares with a nominal value of €0.33.
The Bank does not hold any of its own shares.
ITEM/AMOUNT 12.31.2013 12.31.2012
1. Share capital 200,070 200,070
2. Share premium reserve 1,934 1,934
3. Reserves
- Legal reserve 28,800 22,527
- Extraordinary reserve 98,744 93,773
- Other reserves 171 5
4. (Treasury shares) - -
5. Revaluation reserves 4,214 3,692
6. Equity instruments - -
7. Net Profit (Loss) for the year 85,216 125,467
Total 419,149 447,468
Figures as at December 31, 2012 differ from figures reported in the annual report at that date due to the retroactive application of IAS 19R, which increased Shareholders’ equity (under the line item Revaluation reserves) by €3,407 thousand, as described in Part A - Accounting Policies of Section 2 - General Criteria for preparing the Notes to the Accounts.
14.2 Share capital - Number of shares: annual changes
ITEMS/TYPE
12.31.2013
ORDINARY OTHER
A. Shares outstanding at the beginning of the year - fully paid 606,274,033 -
- not fully paid - -
A.1 Treasury shares (-) - -
A.2 Shares outstanding: opening balance 606,274,033 -B. IncreasesB.1 New issues
- against payment:
- business combinations - -
- bonds converted - -
- warrants exercised - -
- other - -
- free
- to employees - -
- to directors - -
- other - -
B.2 Sale of treasury shares - -
B.3 Other changes - -
C. DecreasesC.1 Cancellation - -
C.2 Purchase of treasury shares - -
C.3 Business transfers - -
C.4 Other changes - -
D. Shares outstanding: closing balance 606,274,033 -D.1 Treasury shares (+) -
D.2 Shares outstanding as at the end of the year - -
- fully paid 606,274,033 -
- not fully paid - -

132
Part B - Balance Sheet - Liabilities (Continued)
Notes to the Accounts
The Annual Report and Accounts as at December 31, 2013 · FinecoBank
14.3 Share capital: other informationOrdinary shares have a nominal value of €0.33.The shares are not subject to any right, privilege or constraint; there are no shares reserved for issue under option and sales contracts.
14.4 Reserves of profit: other informationReserves are represented by the legal reserve, amounting to €28,800 thousand, and the extraordinary reserve, amounting to €98,744 thousand, and other reserves which include the unavailable retained earnings, amounting to €171 thousand.
Information on the availability and distribution of shareholders’ equityIn accordance with Article 2427, paragraph 7-bis of the Italian Civil Code and document no. 1 issued on October 25, 2004 by the Italian Accounting Board (OIC), the following table provides details of the items of shareholders’ equity, showing their availability, distribution, and any utilisation during the past three years.
TYPE/DESCRIPTION AMOUNT POSSIBLE USEAVAILABLE FOR
DISTRIBUTION
SUMMARY OF THE AMOUNTS USED IN THE PAST THREE YEARS
TO COVER LOSSES
FOR OTHER REASONS
Share capital 200,070 - - - -Share capital reserve:Share premium reserve 1,934 A, B, C - (1) - -
Retained earnings: -Legal reserve 28,800 B - - -
Extraordinary reserve 98,744 A, B, C 98,744 (2) - -
Unavailable reserve (Article 6 Leg Dec. 38/2005) 171 D
Revaluation reserves:Valuation reserve for available-for-sale financial assets 4,214 D - - -
TOTAL 333,933 98,744 - -Undistributable amount 235,189
Distributable amount 98,744 - -
KeyA: for capital increase. B: to cover losses. C: for distribution to shareholders.D: availability and distribution limit prescribed by Article 6 of Legislative Decree no. 38/2005
Notes:(1) Pursuant to Article 2431 of the Civil Code, the sum total of this reserve may be distributed only on condition that the legal reserve has reached the limit set in Article 2430 of the Civil Code.(2) It cannot be distributed until the book value of intangible assets, Article 2426 no. 5 of the Civil Code, has been covered.
14.5 Equity instruments: breakdown and annual changesNo data to report.
14.6 Other informationNo data to report.

133FinecoBank · The Annual Report and Accounts as at December 31, 2013
Section 15 - Other information
1 Guarantees given and commitments
TRANSACTIONS 12.31.2013 12.31.2012
1) Financial guarantees given
a) Banks 306,033 302,130
b) Customers 782 382
2) Commercial guarantees given
a) Banks 4 4
b) Customers - -
3) Irrevocable commitments to lend funds
a) Banks
i) certain to be called on 28,028 278
ii) not certain to be called on - -
b) Customers
i) certain to be called on 149,972 368,531
ii) not certain to be called on - -
4) Commitments underlying credit derivatives: protection sales - -
5) Assets given as collateral for third-party obligations - -
6) Other commitments - -
Total 484,819 671,325
Financial guarantees given to banks include 5 guarantees issued on request of UniCredit S.p.A., for an indefinite period, for a total amount of €256,065 thousand, already recorded in the guarantees as at December 31, 2012 for the same amount.
2. Assets given as collateral for own liabilities and commitments
PORTFOLIOS 12.31.2013 12.31.2012
1. Financial assets held for trading - -
2. Financial assets at fair value through profit or loss - -
3. Available-for-sale financial assets - -
4. Held-to-maturity investments - -
5. Loans and receivables with banks 188,989 255,892
6. Loans and receivables with customers - -
7. Property, plant and equipment - -
Total 188,989 255,892
Assets given as collateral for own liabilities and commitments in sub-item 5. “Loans and receivables with banks” refer to bonds issued by UniCredit S.p.A., classified in the Loans and Receivables category, subscribed by the Bank in order to conduct reverse repos with the obligation for the buyer to resell the activities object of the transaction at the end of the transaction; bonds are given as collateral for the entire duration of the reverse repo.Furthermore, FinecoBank has used bonds issued by the Italian Central Government and the French Central Government, classified as Available-for-sale with a book value of €89,910 thousand, as collateral for bankers’ drafts or guarantees with third parties in relation to transactions on foreign markets. Securities are used as collateral until the Bank decides to stop the transactions for which the collateral or guarantees are granted.
3. Information on operating leasesNo data to report.

134
Part B - Balance Sheet - Liabilities (Continued)
Notes to the Accounts
The Annual Report and Accounts as at December 31, 2013 · FinecoBank
4. Administration and brokerage for third parties
TYPE OF SERVICE AMOUNT 12.31.2013 AMOUNT 12.31.2012
1. Execution of orders for customers Securities a) Purchases
1. Settled 52,846,365 43,614,256
2. Unsettled 596,835 804,650
b) Sales
1. Settled 52,697,184 44,353,146
2. Unsettled 586,732 770,090
Derivative contracts a) Purchases
1. Settled 100,624,537 88,264,862
2. Unsettled 163,535 181,678
b) Sales
1. Settled 100,594,652 88,329,771
2. Unsettled 183,384 154,413
2. Segregated accounts a) individual - -
b) collective - -
3. Custody and administration of securities a) third party securities on deposits: relating to depositary bank activities (excluding segregated accounts)
1. securities issued by the bank preparing the accounts - -
2. other securities - -
b) third party securities held in deposits (excluding segregated accounts): other 12,580,382 11,287,466
1. securities issued by the bank preparing the accounts - -
2. other securities 12,580,382 11,287,466
c) third-party securities deposited with third parties 12,580,382 11,287,466
d) own securities deposited with third parties 3,430,300 4,308,794
4. Other transactions Order receipt and transmission
a) Purchases 10,055,945 6,952,733
b) Sales 9,873,049 6,869,421
5. Financial assets offset in the financial statements, subject to settlement framework agreements or similar agreementsNo data to report.
6. Financial liabilities offset in the financial statements, or subject to settlement framework agreements or similar agreementsNo data to report.
7. Securities lending transactionsFinecoBank conducts securities lending transactions on a continuous and systematic basis, with the objective of optimising the returns of customer portfolios, satisfying the requests of institutional counterparties and obtaining a profit for the Bank. FinecoBank operates as the borrower, borrowing the securities of its customers and using them in reverse repos and securities lending transactions guaranteed by cash amounts with retail and institutional customers interested in the temporary ownership of the securities. In the case of securities lending transactions guaranteed by other securities, that are not recognised as liabilities or commitments in the Accounts, FinecoBank has used bond issues of UniCredit S.p.A., classified as Loans and Receivables as guarantees; for this purpose, the Bank has deposited debt securities issued by UniCredit S.p.A. in a dedicated portfolio held at the Custodian bank, representing an amount higher than that of the securities borrowed from customers, in order to provide a collective guarantee.
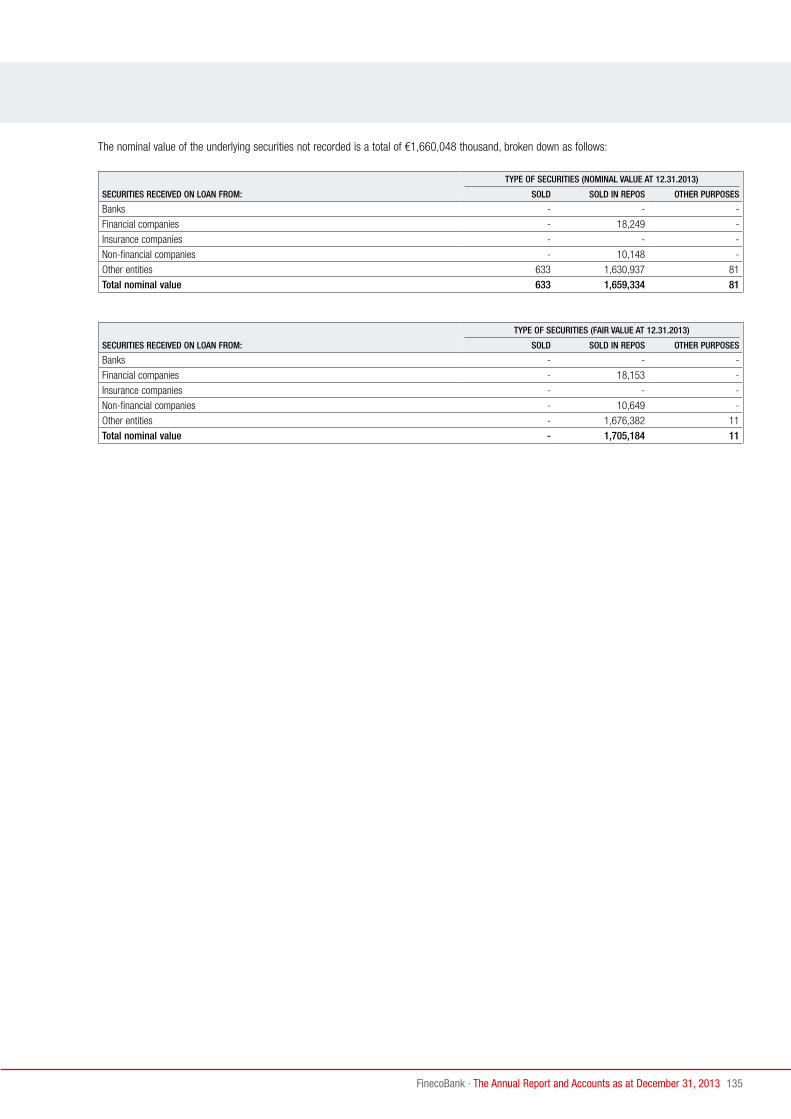
135FinecoBank · The Annual Report and Accounts as at December 31, 2013
The nominal value of the underlying securities not recorded is a total of €1,660,048 thousand, broken down as follows:
SECURITIES RECEIVED ON LOAN FROM:
TYPE OF SECURITIES (NOMINAL VALUE AT 12.31.2013)
SOLD SOLD IN REPOS OTHER PURPOSES
Banks - - -
Financial companies - 18,249 -
Insurance companies - - -
Non-financial companies - 10,148 -
Other entities 633 1,630,937 81
Total nominal value 633 1,659,334 81
SECURITIES RECEIVED ON LOAN FROM:
TYPE OF SECURITIES (FAIR VALUE AT 12.31.2013)
SOLD SOLD IN REPOS OTHER PURPOSES
Banks - - -
Financial companies - 18,153 -
Insurance companies - - -
Non-financial companies - 10,649 -
Other entities - 1,676,382 11
Total nominal value - 1,705,184 11


137FinecoBank · The Annual Report and Accounts as at December 31, 2013
Section 1 - Interest income and expense - items 10 and 20 138Section 2 - Fee and commission income and expense - Items 40 and 50 139Section 3 - Dividend income and similar revenue - Item 70 140Section 4 - Gains (losses) on financial assets and liabilities held for trading - Item 80 140Section 5 - Fair value adjustments in hedge accounting - Item 90 141Section 6 - Gains (Losses) on disposals/repurchases - Item 100 141Section 7 - Gains (losses) on financial assets and liabilities measured at fair value - Item 110 142Section 8 - Impairment losses - Item 130 142Section 9 - Administrative costs - Item 150 143Section 10 - Net provisions for risks and charges - Item 160 144Section 11 - Impairments/write-backs on property, plant and equipment - Item 170 145Section 12 - Impairment/write-backs on intangible assets - Item 180 145Section 13 - Other net operating income - Item 190 146Section 14 - Profit (loss) of associates - Item 210 146Section 15 - Gains (losses) on tangible and intangible assets measured at fair value - Item 220 146Section 16 - Impairment of goodwill - Item 230 146Section 17 - Gains (losses) on disposal of investments - Item 240 146Section 18 - Tax expense (income) related to profit or loss from continuing operations - Item 260 147Section 19 - Profit (Loss) after tax from discontinued operations - Item 280 147Section 20 - Other information 147Section 21 - Earnings per share 149
Part C - Income statement

138
Notes to the Accounts
The Annual Report and Accounts as at December 31, 2013 · FinecoBank
Section 1 - Interest income and expense - Items 10 and 20
1.1 Interest income and similar revenues: breakdown
ITEMS/TYPE DEBT SECURITIES LOANSOTHER
TRANSACTIONSTOTAL
12.31.2013TOTAL
12.31.2012
1. Financial assets held for trading 3 - - 3 8
2. Available-for-sale financial assets 1,798 - - 1,798 1,653
3. Held-to-maturity investments - - - - -
4. Loans and receivables with banks 33,407 232,670 - 266,077 406,015
5. Loans and receivables with customers - 26,155 - 26,155 25,794
6. Financial assets at fair value through profit or loss 84 - - 84 243
7. Hedging derivatives - - - - -
8. Other assets - - 48 48 26
Total interest income 35,292 258,825 48 294,165 433,739
Interest accrued on impaired assets, relating exclusively to the item loans and receivables with customers, amount to €343 thousand (€257 thousand at December 31, 2012).
1.2 Interest income and similar revenues: hedging differentialsThis table has been omitted as the balance of hedging differentials is negative (in relation to which reference should be made to table 1.5 below).
1.3 Interest income and similar revenues: other informationNo information to report.
1.3.1 Interest income on foreign currency financial assets
ITEMS/TYPE 12.31.2013 12.31.2012
Interest income on foreign currency financial assets 7,994 7,759
1.3.2 Interest income on finance lease transactionsNo data to report.
1.4 Interest expenses and similar charges: breakdown
ITEMS/TYPE PAYABLES SECURITIESOTHER
TRANSACTIONSTOTAL
12.31.2013TOTAL
12.31.2012
1. Deposits from central banks - - - - -
2. Deposits from banks (9,621) - - (9,621) (13,191)
3. Deposits from customers (78,920) - - (78,920) (119,238)
4. Debt securities in issue - (19,936) - (19,936) (52,700)
5. Financial liabilities held for trading - - - - -
6. Financial liabilities at fair value through profit and loss - - - - -
7. Other liabilities and provisions - - (2) (2) (4)
8. Hedging derivatives - - (5,408) (5,408) (5,137)
Total (88,541) (19,936) (5,410) (113,887) (190,270)
1.5 Interest expenses and similar charges: hedging differentials
ITEMS 12.31.2013 12.31.2012
A. Positive hedging differentials 141,095 275,462
B. Negative hedging differentials (146,503) (280,599)
C. Balance (A-B) (5,408) (5,137)
1.6 Interest expenses and similar charges: other informationNo information to report.
1.6.1 Interest expense on liabilities denominated in currency
ITEMS/TYPE 12.31.2013 12.31.2012
Interest expense on liabilities denominated in currency (956) (776)
1.6.2 Interest expense on finance leasesNo data to report.
Part C - Income statement (Amounts in € thousand)

139FinecoBank · The Annual Report and Accounts as at December 31, 2013
Section 2 - Fee and commission income and expense - Items 40 and 50
2.1 Fee and commission revenues: breakdown
TYPE OF SERVICE/AMOUNT 12.31.2013 12.31.2012
(a) guarantees given 67 43
(b) credit derivatives - -
(c) management, brokerage and consulting services:
1. securities trading 68,271 72,385
2. currency trading - -
3. portfolio management
3.1. individual - -
3.2. collective - -
4. custody and administration of securities 640 1,065
5. custodian bank - -
6. placement of securities 209,004 174,060
of which commissions for maintenance of UCI placement 179,340 137,791 7. reception and transmission of orders 9,958 8,520
8. advisory services
8.1. related to investments 11,048 7,032
8.2. related to financial structure - -
9. distribution of third-party services:
9.1. portfolio management 2,753 4,446
9.1.1 individual 1,515 3,604
9.1.2 collective 1,238 842
9.2. insurance products 21,235 21,484
9.3. other products 10 27
(d) collection and payment services 26,421 24,276
(e) securitisation servicing - -
(f) factoring - -
(g) tax collection services - -
(h) management of multilateral trading systems - -
(i) management of current accounts 5,861 6,829
(j) other services 4,363 4,211
Total 359,631 324,378
2.2 Fee and commission revenues: distribution channels for products and services
CHANNEL/AMOUNT 12.31.2013 12.31.2012
(a) at own branches:
1. portfolio management - -
2. placement of securities - -
3. third-party services and products - -
(b) cold-calling:
1. portfolio management 2,753 4,446
2. placement of securities 150,605 125,025
3. third-party services and products 20,976 21,357
(c) other distribution channels:
1. portfolio management - -
2. placement of securities 58,399 49,035
3. third-party services and products 269 154
Total 233,002 200,017
Commissions for the placement of securities through “other distribution channels” refer to commissions collected on subscriptions of shares and bonds with advance subscription, subscription and maintenance of units in investment funds and of SICAVs carried out directly by customers online.

140
Part C - Income Statement (Continued)
Notes to the Accounts
The Annual Report and Accounts as at December 31, 2013 · FinecoBank
2.3 Fee and commission expenses: breakdown
SERVICE/AMOUNT 12.31.2013 12.31.2012
(a) guarantees received (30) (30)
(b) credit derivatives - -
(c) management and brokerage services:
1. securities trading (6,046) (5,833)
2. currency trading (375) (302)
3. portfolio management
3.1 own - -
3.2 delegated to third parties - -
4. custody and administration of securities (3,713) (3,766)
5. placement of financial instruments - -
6. cold-calling to offer securities, products and services (163,861) (146,309)
(d) collection and payment services (15,606) (15,106)
(e) other services (322) (350)
(f) securities lending transactions (2,942) (9,072)
Total (192,895) (180,768)
Section 3 - Dividend income and similar revenue - Item 70
3.1 Dividend income and similar revenue: breakdown
ITEM/INCOME
12.31.2013 12.31.2012
DIVIDENDS
INCOME FROM UNITS IN INVESTMENT
FUNDS DIVIDENDS
INCOME FROM UNITS IN INVESTMENT
FUNDS
A. Financial assets held for trading 3 - 1 -
B. Available-for-sale financial assets - - - -
C. Financial assets at fair value through profit or loss - - - -
D. Equity investments - X - X
Total 3 - 1 -
Section 4 - Gains (losses) on financial assets and liabilities held for trading - Item 80
4.1 Gains (losses) on financial assets and liabilities held for trading: breakdown
TRANSACTION/INCOME ITEMUNREALISED GAINS
(A)REALISED
PROFITS (B)UNREALISED LOSSES
(C)REALISED
LOSSES (D)NET PROFIT OR LOSS
[(A+B)-(C+D)]
1. Financial assets held for trading 1.1 Debt securities - 183 (4) (19) 160
1.2 Equity instruments 4 71,139 (2) (63,454) 7,687
1.3 Units in investment funds - 2 (64) (2) (64)
1.4 Loans - - - - -
1.5 Other - 6,884 - - 6,884
2. Financial liabilities held for trading 2.1 Debt securities - - - - -
2.2 Payables - - - - -
2.3 Other - 92 - (9) 83
3. Other financial assets and liabilities: exchange differences X X X X 2,6994. Derivatives 4.1 Financial derivatives:
- On debt securities and interest rates 116 2 (108) (2) 8
- On equity securities and share indices 1,747 10,627 (1,672) (5,691) 5,011
- On currency and gold X X X X 5,427
- Other - 101 - (59) 42
4.2 Credit derivatives - - - - -
Total 1,867 89,030 (1,850) (69,236) 27,937

141FinecoBank · The Annual Report and Accounts as at December 31, 2013
Section 5 - Fair value adjustments in hedge accounting - Item 90
5.1 Fair value adjustments in hedge accounting: breakdown
INCOME ITEM/AMOUNT 12.31.2013 12.31.2012
A. Gains on: A.1 Fair value hedging instruments 232,935 223,041
A.2 Hedged asset items (in fair value hedge relationship) 125,734 154,665
A.3 Hedged liability items (in fair value hedge relationship) - -
A.4 Cash-flow hedging derivatives - -
A.5 Assets and liabilities denominated in currency - -
Total gains on hedging activities (A) 358,669 377,706B. Losses on: B.1 Fair value hedging instruments (228,548) (203,145)
B.2 Hedged asset items (in fair value hedge relationship) (4,156) (19,849)
B.3 Hedged liability items (in fair value hedge relationship) (125,965) (154,712)
B.4 Cash-flow hedging derivatives - -
B.5 Assets and liabilities denominated in currency - -
Total losses on hedging activities (B) (358,669) (377,706)C. Fair value adjustments in hedge accounting (A-B) - -
Section 6 - Gains (Losses) on disposals/repurchases - Item 100
6.1 Gains (Losses) on disposals/repurchases: breakdown
ITEM/INCOME ITEM
12.31.2013 12.31.2012
PROFIT LOSS NET PROFIT PROFIT LOSS NET PROFIT
Financial assets1. Loans and receivables with banks 52,446 - 52,446 56,985 (1) 56,984
2. Loans and receivables with customers - - - - - -
3. Available-for-sale financial assets
3.1 Debt securities - - - - - -
3.2 Equity instruments - - - - - -
3.3 Units in investment funds - - - - - -
3.4 Loans - - - - - -
4. Held-to-maturity investments - - - - - -
Total assets 52,446 - 52,446 56,985 (1) 56,984Financial liabilities1. Deposits from banks - - - - - -
2. Deposits from customers - - - - - -
3. Debt securities in issue - (52,481) (52,481) - (56,985) (56,985)
Total liabilities - (52,481) (52,481) - (56,985) (56,985)

142
Part C - Income Statement (Continued)
Notes to the Accounts
The Annual Report and Accounts as at December 31, 2013 · FinecoBank
Section 7 - Gains (losses) on financial assets and liabilities measured at fair value - Item 110
7.1 Gain (losses) on financial assets and liabilities measured at fair value through profit and loss: breakdown
TRANSACTION/INCOME ITEMUNREALISED
GAINS (A)REALISED
PROFITS (B)UNREALISED
LOSSES (C)REALISED
LOSSES (D)
NET PROFIT OR LOSS
[(A+B)-(C+D)]
1. Financial assets 1.1 Debt securities 128 391 - (178) 341
1.2 Equity instruments - - - - -
1.3 Units in investment funds - - - - -
1.4 Loans - - - - -
2. Financial liabilities 2.1 Debt securities - - - - -
2.2 Deposits from banks - - - - -
2.3 Deposits from customers - - - - -
3. Other financial assets and liabilities: exchange differences X X X X -4. Credit and financial derivatives - - - -Total 128 391 - (178) 341
Section 8 - Impairment losses - Item 130
8.1 Impairment losses on loans and receivables: breakdown
TRANSACTION/INCOME ITEM
IMPAIRMENTS (1) WRITE-BACKS (2)
12.31.2013 12.31.2012
MICRO
MACRO
MICRO MACRO
WRITE-OFFS OTHER A B A B
A. Loans and receivables with banks
- Loans - - - - - - - - -
- Debt securities - - - - - - - - -
B. Loans and receivables with customers Impaired related to purchase agreements
- Loans - - X - - - X - -
- Debt securities - - X - - - X - -
Other loans
- Loans (135) (4,052) (559) 236 903 - 332 (3,275) (2,852)
- Debt securities - - - - - - - - -
C. Total (135) (4,052) (559) 236 903 - 332 (3,275) (2,852)
Key A = From interest.B = Other write-backs.
8.2 Impairment losses on available for sale financial assets: breakdownNo data to report.
8.3 Impairment losses on held-to-maturity investments: breakdownNo data to report.
8.4 Impairment losses on other financial transactions: breakdownNo data to report.

143FinecoBank · The Annual Report and Accounts as at December 31, 2013
Section 9 - Administrative costs - Item 150
9.1 Payroll costs: breakdown
TYPE OF EXPENSE/AMOUNT 12.31.2013 12.31.2012
1) Employees (61,283) (59,220)
a) wages and salaries (41,721) (39,943)
b) social security contributions (11,323) (10,609)
c) employee severance fund (803) (735)
d) pension costs - -
e) allocation to employee severance pay provision (139) (165)
f) provision for retirements and similar provisions
- defined contribution - -
- defined benefit - -
g) payments to external pension funds
- defined contribution (2,276) (2,179)
- defined benefit - -
h) costs related to share-based payments (465) (588)
i) other employee benefits (4,556) (5,001)
2) Other staff (101) (97)
3) Directors and statutory auditors (864) (764)
4) Early retirement costs - -
5) Recovery of expenses for employees seconded to other companies 71 91
6) Recovery of expenses for employees seconded to the company (1,161) (1,032)
Total (63,338) (61,022)
Following the issue of the second update of Circular no. 262 of January 21, 2014, employee severance fund payments made to other defined contribution funds which were previously recognised in the item “employee severance fund” have been recognised under “payments to supplementary pension funds”, previously booked to the item “employee severance fund”. In addition, from 2013, the remuneration for long-term incentives has been recognised under the item “other employee benefits”, which was previously recognised under “wages and salaries”.To enable a like-for-like comparison, 2012 data have been also reclassified.
Sub-item 1) h) “costs related to share-based payments” includes costs recognised in the income statement in relation to share-based payments of the Parent Company UniCredit S.p.A..
9.2 Average number of employees by category
12.31.2013 12.31.2012
Employees 949 919(a) executives 21 21
(b) managers 259 250
(c) remaining employees 669 648
Other personnel 17 19
9.3 Pensions and other post-retirement defined-benefit obligations costs and revenuesNo data to report.
9.4 Other employee benefits
TYPE OF EXPENSE/AMOUNT 12.31.2013 12.31.2012
Leaving incentives (291) (1,773)
Medical plan (728) (648)
Luncheon vouchers (761) (761)
Seniority bonuses (1,554) (772)
Other (1,222) (1,047)
Total (4,556) (5,001)

144
Part C - Income Statement (Continued)
Notes to the Accounts
The Annual Report and Accounts as at December 31, 2013 · FinecoBank
9.5 Other administrative expenses: breakdown
12.31.2013 12.31.2012
1) INDIRECT TAXES AND DUTIES (59,389) (39,306)2) MISCELLANEOUS COSTS AND EXPENSES A) Advertising expenses - Marketing and communication (19,541) (16,891) Mass media campaigns (13,903) (12,491)
Marketing and promotions (5,566) (4,303)
Sponsorships (46) (65)
Conventions and internal communications (26) (32)
B) Expenses related to credit risk (914) (739) Credit recovery expenses (495) (431)
Commercial information and company searches (419) (308)
C) Expenses related to personnel (12,663) (12,373) Personnel training (361) (408)
Car rental and other payroll costs (51) (40)
Personal financial adviser expenses (11,724) (11,321)
Travel expenses (457) (512)
Premises rentals for personnel (70) (92)
D) ICT expenses (29,458) (29,674) Lease of ICT equipment and software (5,083) (6,069)
Software expenses: lease and maintenance (6,441) (5,639)
ICT communication systems (3,996) (3,673)
ICT services: external personnel/outsourced services (6,685) (6,778)
Financial information providers (7,253) (7,515)
E) Consulting and professional services (3,023) (3,468) Consultancy for ordinary operations (886) (764)
Consultancy for strategy, business development and organisational optimisation (45) (34)
Legal expenses (11) (56)
Legal disputes (2,081) (2,614)
F) Real estate expenses (21,646) (21,112) Real estate services (685) (671)
Repair and maintenance of furniture, machinery, and equipment (159) (157)
Maintenance of premises (1,294) (1,155)
Premises rentals (16,428) (15,457)
Cleaning of premises (485) (549)
Utilities (2,595) (3,123)
G) Other functioning costs (28,002) (25,107) Surveillance and security services (295) (105)
Money counting services and transport (1) (2)
Postage and transport of documents (3,048) (2,617)
Administrative and logistic services (13,711) (13,536)
Insurance (3,892) (2,766)
Printing and stationery (747) (651)
Association dues and fees (6,078) (5,212)
Other administrative expenses (230) (218)
Total (174,636) (148,670)
Section 10 - Net provisions for risks and charges - Item 160
10.1 Net provisions for risks and charges: breakdown
12.31.2013 12.31.2012
PROVISIONS REALLOCATIONS PROVISIONS REALLOCATIONS
Disputes with customers and PFA (21,690) 11,713 (18,164) 11,717
Supplementary customer indemnity provision (3,031) - (2,697) -
Other provisions for risks and charges (6,081) 3,030 (9,342) 130
Total (30,802) 14,743 (30,203) 11,847

145FinecoBank · The Annual Report and Accounts as at December 31, 2013
Section 11 - impairments/write-backs on property, plant and equipment - item 170
11.1 Impairments/write-backs on property, plant and equipment: breakdown
ASSET/INCOME ITEMDEPRECIATION
(A)WRITE-DOWNS
FOR IMPAIRMENT (B)WRITE-BACKS
(C)NET GAIN (LOSS)
(A+B-C)
A. Property, plant and equipment
A.1 Owned
- Used in the business (3,280) (32) - (3,312)
- Held for investment (112) - - (112)
A.2 Finance lease
- Used in the business - - - -
- Held for investment - - - -
Total (3,392) (32) - (3,424)
Impairment losses during the year are of a negligible amount and mainly refer to office furniture and fittings for which a value in use equal to zero has been determined.
Percent depreciation rates applied during the reporting period:• 3% instrumental properties• 15% fittings• 15% miscellaneous plant and equipment• 12% furniture and ordinary machines• 20% EDP machines• 20% mobile phones and television camera systems• 30% alarm and security systems• 7.5% hosting equipment and systems• 25% motor vehicles.
Section 12 - Impairments/write-backs on intangible assets - Item 180
12.1 Impairments on intangible assets: breakdown
ASSET/INCOME ITEMDEPRECIATION
(A)WRITE-DOWNS
FOR IMPAIRMENT (B)WRITE-BACKS
(C)NET GAIN (LOSS)
(A+B-C)
A. Intangible assets
A.1 Owned
- Generated internally by the Company - - - -
- Other (4,657) - - (4,657)
A.2 Finance lease
Total (4,657) - - (4,657)
Depreciation on intangible assets relate to software, amortised over three years and the costs incurred to create the new Fineco website, amortised over 5 years.
As regards the disclosure required by IAS 36 paragraph 134, letters d), e), f) and 135, letters c), d), e), see Part B paragraph 12.3 Other Information.

146
Part C - Income Statement (Continued)
Notes to the Accounts
The Annual Report and Accounts as at December 31, 2013 · FinecoBank
Section 13 - Other net operating income - Item 190
13.1 Other operating expenses: breakdown
TYPE/AMOUNT 12.31.2013 12.31.2012
Refunds and allowances (288) (431)
Penalties, fines and unfavourable rulings (2,665) (3,310)
Improvements and incremental expenses incurred on leasehold properties (2,778) (2,678)
Improvements and incremental expenses incurred on group properties (13) (13)
Exceptional write-downs of assets (847) (599)
Other operating expense (2,348) (1,209)
Total (8,939) (8,240)
Exceptional write-downs of assets include costs incurred for credit card fraud of €758 thousand.
13.2 Other operating income: breakdown
TYPE/AMOUNT 12.31.2013 12.31.2012
Recovery of costs:
- ancillary expenses - other 166 407
- taxes 56,830 31,067
Rental income from real estate investments 230 226
Other income from current year 3,782 2,646
Total 61,008 34,346
Section 14 - Profit (loss) of associates - Item 210
14.1 Profit (loss) of associates: breakdownNo data to report.
Section 15 - Gains (losses) on tangible and intangible assets measured at fair value - Item 220
15.1 Net gains (losses) on property, plant and equipment and intangible assets measured at fair value: breakdown No data to report.
Section 16 - Impairment of goodwill - Item 230
16.1 Impairment of goodwill: breakdownNo data to report.
Section 17 - Gains (losses) on disposal of investments - Item 240
17.1 Gains (losses) on disposal of investments: breakdown
INCOME ITEM/AMOUNT 12.31.2013 12.31.2012
A. Properties
- Gains on disposal - -
- Losses on disposal - -
B. Other assets
- Gains on disposal - -
- Losses on disposal (6) (3)
Net gain (loss) (6) (3)

147FinecoBank · The Annual Report and Accounts as at December 31, 2013
Section 18 - Tax expense (income) related to profit or loss from continuing operations - Item 260
18.1 Tax expense (income) related to profit or loss from continuing operations: breakdown
INCOME ITEM/AMOUNT 12.31.2013 12.31.2012
1. Current tax (-) (72,983) (73,968)
2. Adjustment to current tax of prior years (+/-) (2,500) (4,000)
3. Reduction of current tax for the year (+) - -
3. bis Reduction of current tax for the year due to tax receivables pursuant to Law 214/2011 (+) - -
4. Changes in deferred tax assets (+/-) 121 2,712
5. Changes in deferred tax liabilities (+/-) (1,355) (1,384)
6. Tax expense for the year (-) (-1+/-2+3+/-4+/-5) (76,717) (76,640)
The amount of taxes was affected by provisions contained in Law Decree 133/2013 converted by law no. 5 of 29.1.2014; this Law Decree introduced, for the 2013 tax period only, an additional 8.5% on top of the income tax rate of 27.5 per cent established by the Consolidated Act of Taxes and applied to the taxable corporate income of banks and financial companies, except for the increase of the taxable income arising from the deferred portion of 4/5 of losses on receivables and write-downs of receivables established in article 106 paragraph 3 of the aforesaid Act.
18.2 Reconciliation of theoretical tax charge to actual tax charge
2013 2012
Profit before tax 161,933 202,107
IRES INCOME TAX IRAP CORPORATE TAX TOTAL 2013 TOTAL 2012
Amount corresponding to theoretical tax rate (58,296) (9,020) (67,316) 66,837+ Tax effects of charges not relevant to the calculation
of taxable income (705) (4,516) (5,221) 9,726
- Tax effects of income not relevant to the calculation of taxable income - - - -
- Tax effects deriving from the use of tax losses from previous years - - - -
- Tax effects deriving from the application of substitute taxes (446) - (446) 445
Amount corresponding to actual tax rate (59,447) (13,536) (72,983) 77,008
Section 19 - Profit (Loss) after tax from discontinued operations - Item 280
19.1 Profit (Loss) after tax from discontinued operations: breakdown No data to report.
19.2 Breakdown of tax on discontinued operationsNo data to report.
Section 20 - Other information
1.1 Designation of Parent CompanyUniCredit S.p.A.Rome Register of CompaniesRegistered in the Register of Banking Groups and Parent Company of the UniCredit Banking Group with code 2008.1
1.2 Registered Office of Parent CompanyRegistered Office: Rome, Via A. Specchi, 16Head Office: Milan, Piazza Cordusio
1.3 Key figures for the Parent Company (income statement, balance sheet, structure)The Bank is subject to management and coordination by UniCredit S.p.A. and therefore pursuant to Article 2497 bis paragraph 4 of the Civil Code the key figures from its last approved financial statements are provided below.

148
Part C - Income Statement (Continued)
Notes to the Accounts
The Annual Report and Accounts as at December 31, 2013 · FinecoBank
UniCredit S.p.A. - Reclassified balance sheet as at December 31, 2012 (Amounts in € million)
ASSETS 12.31.2012
Cash and cash balances 2,214
Financial assets held for trading 10,536
Loans and receivables with banks 27,936
Loans and receivables with customers 260,850
Financial investments 94,647
Hedging instruments 10,840
Property, plant and equipment 2,755
Goodwill 2,815
Other intangible assets 26
Tax assets 12,243
Non-current assets and disposal groups classified as held for sale -
Other assets 6,417
Total assets 431,279
(Amounts in € million)
LIABILITIES AND SHAREHOLDERS’ EQUITY 12.31.2012
Deposits from banks 56,446
Deposits from customers and debt securities in issue 279,347
Financial liabilities held for trading 10,078
Financial liabilities at fair value through profit and loss -
Hedging instruments 11,936
Provisions for risks and charges 1,767
Tax liabilities 2,644
Liabilities included in disposal groups classified as held for sale -
Other liabilities 11,072
Shareholders’ equity 57,989
- capital and reserves 58,085- available-for-sale assets fair value reserve and cash-flow hedging reserve 124- net profit (220)Total liabilities and shareholders’ equity 431,279
UniCredit S.p.A. - Condensed Income Statement 2012 (Amounts in € million)
12.31.2012
Net interest 4,276
Dividends and other income from equity investments 1,707
Net fees and commissions 3,540
Net trading, hedging and fair value income 96
Net other expenses/income 75
OPERATING INCOME 9,694 Payroll costs (3,306)
Other administrative expenses (2,797)
Recovery of expenses 423
Amortisation, depreciation and impairment losses on intangible and tangible assets (169)
Operating costs (5,849)GROSS OPERATING PROFIT (LOSS) 3,845 Net write-downs of loans and provisions for guarantees and commitments (6,966)
NET OPERATING PROFIT (LOSS) (3,121)Provisions for risks and charges (169)
Integration costs (109)
Net income from investments 47
GROSS PROFIT (LOSS) FROM CONTINUING OPERATIONS (3,352)Income tax for the year 3,132
PROFIT (LOSS) AFTER TAX (220)

149FinecoBank · The Annual Report and Accounts as at December 31, 2013
1.4 Disclosure of auditing fees pursuant to art. 160 paragraph 1 bis of Legislative Decree 58/98The table below provides details of the fees paid (net of VAT and expenses) to the auditing firm Deloitte & Touche S.p.A. and entities within the network that the auditing firm belongs to:
(Amounts in €)
TYPE OF SERVICES COMPANY WHICH PROVIDED THE SERVICE FEES
Auditing Deloitte & Touche S.p.A. 147,681
Other services Deloitte Consulting S.r.l. 15,000
168,751
Section 21 - Earnings per share
21.1 Average number of diluted sharesBasic earnings per share are calculated by dividing the net profit of the year by the average number of ordinary shares outstandind during the year.As at December 31, 2013, there were no transactions in place resulting in a dilutive effect on earnings per share (the number of ordinary shares outstanding is also unchanged during the financial years presented).
12.31.2013 12.31.2012
Net income (in € thousand) 85,216 125,467
Average number of ordinary shares in issue 606,274,033 606,274,033
Earnings per share (basic and diluted) 0.14 0.21
21.2 Other informationNo information to report.


151FinecoBank · The Annual Report and Accounts as at December 31, 2013
Part D - Comprehensive income

152
Notes to the Accounts
The Annual Report and Accounts as at December 31, 2013 · FinecoBank

153FinecoBank · The Annual Report and Accounts as at December 31, 2013
Detailed statement of comprehensive income
ITEMS GROSS AMOUNT INCOME TAX NET AMOUNT
10. Net Profit (Loss) for the year X X 85,215,605Other comprehensive income without reclassification through profit or loss
20. Property, plant and equipment - - -
30. Intangible assets - - -
40. Defined benefit plans 131,486 34,471 165,957
50. Non current assets classified as held for sale - - -
60. Valuation reserves from investments accounted for using the equity method - - -
Other comprehensive income with reclassification through profit or loss70. Hedges of foreign investments:
a) fair value changes - - -
b) reclassification through profit or loss - - -
c) other variations - - -
80. Exchange differences: a) fair value changes - - -
b) reclassification through profit or loss - - -
c) other variations - - -
90. Cash flow hedges: a) fair value changes - - -
b) reclassification through profit or loss - - -
c) other variations - - -
100. Available for sale financial assets: a) fair value changes 795,383 (263,033) 532,350
b) reclassification through profit or loss
- due to impairment - - -
- gains/losses on disposals (262,822) 86,915 (175,907)
c) other variations - - -
110. Non-current assets classified as held for sale: a) fair value changes - - -
b) reclassification through profit or loss - - -
c) other variations - - -
120. Valuation reserves from investments accounted for using the equity method: a) fair value changes - - -
b) reclassification through profit or loss
- due to impairment - - -
- gains/losses on disposals - - -
c) other variations - - -
130. Total other comprehensive income 664,046 (141,647) 522,400140. Comprehensive income (item 10+130) 85,738,005
Part D - Comprehensive income


155FinecoBank · The Annual Report and Accounts as at December 31, 2013
Section 1 - Credit Risk 156Section 2 - Market risk 170Section 3 - Liquidity Risk 184Section 4 - Operational risk 189Section 5 - Other risks and information 192
Part E - Information on risks and hedging policies

156
Notes to the Accounts
The Annual Report and Accounts as at December 31, 2013 · FinecoBank
IntroductionIn order to ensure lean and efficient management of risks, the risk management process is structured in accordance with the organisational choices made by the Group and the provisions of the Supervisory Instructions for Banks pertaining to the internal control system.Risk management and control is performed by the Risk Management function of FinecoBank in collaboration with the same function of the Parent Company, which performs its role of guidance, coordination and control of risks at Group level. The organizational model considers a specific point of reference for Italy through the Chief Risk Officer function (CRO) of the Parent Company, to which has been assigned the responsibilities related to credit risks, operational risks and reputational risks of the Italian perimeter, as well as the managerial coordination of Risk Management functions in the Italian Legal Entities - among which FinecoBank - have been assigned.FinecoBank is responsible for first and second-level monitoring, especially for verifying that the risk level of individual companies is compatible with the guidelines set by the Parent Company, individual company equity, and prudential supervisory rules.
As an aid to the reader, an explanatory glossary of terms used is provided at the end of this chapter.
Organisational structureThe Board of Directors of FinecoBank (“Board”) is tasked with setting the strategic policies and the guidelines for the organisational and operational structures, overseeing and monitoring their timely execution within the risk profiles of assigned. The Board is responsible for promoting a company culture that empowers controls, in compliance with the indications and principles contained in the Supervisory Instructions, setting and approving strategies for identifying and evaluating risk, and approving the strategic guidelines and risk management policies. The Board also verifies that the internal control structure is consistent with the risk tolerance established and approves policies for the management of risks.
The Managing Director has been assigned specific powers by the Board in all the Bank’s areas of activity. These powers are to be exercised in accordance with the applicable regulations and within the limits of the Parent Company directives and the policies, instructions, limits, risk assumption procedures and using the operational methods governed by the applicable information notices. The Managing Director puts in place the necessary measures to ensure the establishment and maintenance of an efficient and effective internal control system.
The CRO Department, in line with the instructions and the guidelines of the Parent Company, is responsible for credit operations and risk management. The disclosure, at various levels, is provided by the Strategic Bodies and Officers (Managing Director, Board of Directors, Risk Committee). In relation to the Basel II Pillar 2 instructions, reputational and business risk and, in collaboration with the CFO, liquidity risk are also monitored and reported. The CRO and the Chief Financial Officer (CFO) are responsible for proposing and adapting the Group Risk Appetite Framework to FinecoBank and setting risk management strategies and policies, in line with the Bank’s strategies and objectives, coordinating and monitoring their implementation by the units responsible, also in the various company areas. The CRO Department ensures the control of the Bank’s overall risk profile monitoring the various types of exposure, in accordance with the methods established by the Parent Company.
The Risk Management Unit prevents and monitors different components of Bank risks. The function specifically controls credit, market and operational risks to which the Bank is exposed. Risk Management also involves the monitoring of business, reputation and liquidity risks. The Risk Management Unit supports the CRO, in the area of responsibility of the Department, in monitoring and reporting to the Strategic Bodies and Officers.
The corporate governance structure for operational risk involves the establishment of the Risks Committee, which sets the strategies for the mitigation and assessment of all types of risk, within the directives issued by the Parent Company, and approves and validates the internal procedures and operating manuals for operational risk.Lastly, the participation by the Chief Risk Officer and Head of Risk Management in the Products Committee ensures oversight of the operational risk associated with the Bank’s new business activities, as well as creating and disseminating a risk culture in the various functional areas.
Section 1 - Credit Risk
QUALITATIVE INFORMATION
1. General aspectsFinecoBank’s objective is to provide an adequate range of products able to satisfy and encourage loyalty among customers, through a competitive and complete offer. The development of the products and of the product line must also seek to maintain portfolio quality and, in any event, adequate processes to monitor profitability.Lending is expanded through the development of new products, or modification of existing ones, as well as through the protection of market share achieved. The factors that generate credit risk are determined by acceptance policies that assess creditworthiness, which are always adequately correlated to the risk/return ratio, and therefore remuneration of the product.
Part E - Information on risks and hedging policies (Amounts in € thousand)

157FinecoBank · The Annual Report and Accounts as at December 31, 2013
In line with the Risk Appetite established by the Group, FinecoBank sets the Credit Risk Strategies as an instrument for credit risk management. The Strategies focus on loans and receivables with customers and are aimed at reducing cost of risk and rates of default by setting the Target Risk and optimising the loan portfolio.
The quality of the loan portfolio, which is constantly monitored and supported by risk mitigation instruments, is protected by scoring models that contribute to evaluation during the approval process, ensuring that it is consistent and controlled. In addition to adequate coverage of the risk levels, monitoring of the portfolio and its segmentation by product and seniority allow a better understanding of the best loan issue strategies. The identification of any high-risk areas permits intervention on the automated measurement systems as well as on disbursement standards, with the possibility to take measures to limit credit risk in advance. In 2013, lending activity continued to focus on granting credit lines, mostly backed by assets, issuing credit cards with full payment of the balance at term to current account holders, and granting personal loans.During the year, the new product “Credit line with authorisation to sell through administration and SICAVs” was issued: customers can obtain a credit line in proportion to the amount of securities they hold, for which the Bank has received an authorisation to sell. The new offering is designed to meet the liquidity needs of affluent customers to avoid divestitures.
Choices concerning the investment of the Bank’s liquidity are governed by a prudential approach aimed at containing credit risk and mainly involve current accounts and deposits at UniCredit S.p.A..
2. Credit Risk Management Policies2.1 Organisational aspectsThe credit process can be broken down into the following stages:• assessment of creditworthiness• granting/disbursement of credit• credit monitoring• management of impaired loans• risk measurement and control
The assessment of creditworthiness entails ascertaining the ability of the borrower to repay. It is performed by specific centralised and specialist operating units in the various product lines disbursed to customers (personal loans, credit cards, credit lines). On receipt of the request, the offices in question assess the reliability of documentation, evaluate the equity and income situation, and gather information, also by consulting public records, private banks and system data such as the information contained in the Bank of Italy’s risk centre and in the Group archives.
To grant the credit, in addition to an assessment of creditworthiness, dedicated functions assess the compatibility of the request with the customer’s overall situation, based on the amount of the request, where necessary agreeing a new application with the customer, and evaluate any guarantees, finalise them, link them to credit lines and record in accordance with the associated processes. Lastly, the decision-making parties approve or reject the application on the basis of their powers or send the application to a higher decision-making body.
Credit monitoring is carried out on credit lines to check that the economic situation of the Customer and of the guarantor that resulted in the approval has not changed. This check may entail collecting updated system data and information, as well as information from private banks. Checks are carried out according to established processes at set intervals, and may vary according to the amount of the credit line granted. In line with the general principles laid down by the Supervisory Body, receivables are classified on the basis of the level of impairment, which may be established on the basis of qualitative or quantitative criteria.
The management of impaired loans entails taking all action necessary to restore them to normality or to recover the credits in situations where the relationship cannot be continued. All of these measures are established by specific processes based on the type, the amount, the past-due period and the presence of financial assets of the customer, which may be offered as collateral. Credit collection is performing by means of dunning carried out directly by FinecoBank, both through dunning letters and debt collection carried out by specialised, authorised external companies.Lastly, management also entails forecasting losses on an individual basis, which is continuously updated based on the progress of recovery actions for the amounts due or based on information collected during the recovery actions.
The measurement and control of credit risk takes place at the assessment stage with the support of scoring tools that analyse the customers’ socio-demographic profiles, making an assessment of individual counterparties on a statistical basis and supplementing the assessment, on one hand, with the support of credit bureaus for a better knowledge of public and private data and on the other hand, with information contained in the Bank of Italy’s risk centre.Credit risk control is also performed through the systematic assessment of the performance of credit portfolios in order to estimate expected losses and intervene on disbursement policies where necessary.

158
Part E - Information on risks and hedging policies (Continued)
Notes to the Accounts
The Annual Report and Accounts as at December 31, 2013 · FinecoBank
2.1.1 Factors that generate Credit RiskIn the course of its credit business activities, FinecoBank is exposed to the risk that its loans may, due to the deterioration of the debtor’s financial condition, not be repaid at maturity, and thus resulting in a partial or full write-down. This risk is always inherent in traditional lending operations regardless of the form of the credit. The main reasons for default lie in the borrower’s lack of autonomous ability to ensure the repayment of the debt.
In addition to the granting and disbursement of credit, FinecoBank is also exposed to counterparty risk for all the activities for all clearing and pre-clearing operations with the institutional and banking counterparties necessary to conduct the Bank’s business. Counterparty risk is defined as the risk that a counterparty to one of the transactions is in default prior to the final clearance of the cash flows of the transaction. The counterparties in these transactions could default as a result of insolvency, political and economic events, lack of liquidity, operating problems or other reasons.Other transactions involving counterparty risk are:• entering into derivative contracts; • purchasing and selling securities, futures, or currencies;• holding third-party securities. In addition, “Non-Traditional Credit Risk” is generated by leverage/short transactions conducted through securities lending. Leverage/short transactions conducted through securities lending, also when there are automatic stop losses performed within the margins, can generate credit risk if the security lacks liquidity (for example, in the case of dramatic events that affect the normal functioning of markets) and/or the margin is insufficient. To anticipate such events, scenario analyses are conducted periodically to assess the impacts and implement appropriate mitigation policies.
FinecoBank monitors and manages the specific risk of each counterparty and the overall risk of loan portfolios through procedures, structures and rules that steer, govern and standardize the assessment and management of credit risk, in line with the Group principles and best practice, and which are capable of extending their effectiveness to all phases of the economic cycle.
FinecoBank reports all information to the Parent Company that can help it in its assessment of each FIBS counterparty (“Financial Institutions, Banks and Sovereigns”) that FinecoBank intends to have dealings with and with respect to whom a risk limit (ceiling) is to be set within which the Group intends to operate. The assessment is conducted within the risk limits assigned to the counterparty’s Economic Group, i.e. considering the Group’s exposure towards all the parties legally and economically linked to the counterparty. At the end of the assessment, FinecoBank receives a risk ceiling to be monitored from the Parent Company.
2.2 Management, measurement and control systemThe measurement of credit risk during the issue process is supported by automated assessment systems (so-called credit scoring systems).These systems also incorporate all available information and facts: public and private data provided by Credit rating bureaus, Risk Centre data flows or information requests submitted to the Bank of Italy, Group archives with data relating to positions shared with other Group banks and other performance information on customers, historicised by FinecoBank. During the loan application process, attention is always focused on the possibility of optimising all information concerning customers that has been provided by the Bank, the Group and the System.The collection of any guarantees, their assessment and the margins between the fair value of the guarantee and the amount of the loan granted are a simple kind of support to risk mitigation, but there is no relevant positive correlation between the value of the financial guarantee and the applicant’s creditworthiness.
The collective write-downs of the “performing” loan portfolio are determined using migration rates, through transition matrices, both from performing loans to non-performing loans and for each classification status (past due, doubtful, non-performing) by combining the default rates with the expected recovery rates individually calculated for non-performing loans and taking account of any supporting guarantees.
The global assessment of portfolio risks, in order to identify the sustainability of the asset and the remuneration margins, is made both with the assistance of a tool shared with the Parent Company (Credit Tableau de Bord), which contains all the main risk indicators and the largest receivables of those listed, and with the support of specific product reports that identify the trend of default rates, broken down by disbursement period and default level.
The monitoring of credit risk as part of the management of the trading book is conducted by breaking it down into rating class and issuer sector, which determine the implicit risk of contracts.
2.2.1 Credit Risk StrategiesThe Group Credit Risk Strategies (GCRS) are one of the advanced instruments for managing credit risk. Consistent both with the budget process and industry expert views, the GCRS provide a set of guidelines and operative targets on the credit portfolio evolution (new business), aimed at improving the overall risk-return profile of the portfolio. Based on the Group’s risk appetite, FinecoBank identifies targets related to credit quality and profitability of its loan portfolio.

159FinecoBank · The Annual Report and Accounts as at December 31, 2013
FinecoBank’s Credit Risk Strategies focus on loans and receivables with customers. The objective is therefore to keep the levels of risk/default within the Group limits.Credit risk strategies are set by using the main credit risk measures established by the Parent Company in order to correctly and prudentially manage credit portfolio risk.
2.3 Credit risk mitigation techniquesIn order to mitigate risk when granting the different types of credit facilities, various types of collateral are obtained: liens on shares, bonds or investment funds, insurance contracts and government bonds are used to guarantee current account overdraft facilities, whilst the registration of first mortgages is quite rare.
2.4 Impaired financial assetsLoans are classified as past due, doubtful or non-performing in accordance with the criteria set forth by the Bank of Italy and the thresholds established by the Parent Company, with methods differing according to product type. Generally speaking, the classification of problem loans is usually objective, while the classification as non-performing, linked to the customer’s insolvency, is always individual and defined on the basis of the progress of debt recovery actions.The loss estimate for classified positions is also individual.The classification criterion used for overdrawn accounts is related to the performance of debt recovery activity or the forced sale of securities to cover debts. The restructuring of loans is only authorised if the amount past due has been paid in full in observance of the original payment schedule, or if considerable payments have been made leading the Bank to believe the debt exposure is very likely to be repaid.The procedure for the management of irregularly performing loans involves actions that may be taken to recover debts by ranking them by seniority of expiration.

160
Part E - Information on risks and hedging policies (Continued)
Notes to the Accounts
The Annual Report and Accounts as at December 31, 2013 · FinecoBank
QUANTITATIVE INFORMATION
A. Credit quality
A.1 Impaired and performing loans: amounts, write-downs, changes, distribution by business activity/region
A.1.1 Breakdown of financial assets by portfolio and credit quality (carrying value)
PORTFOLIO/QUALITY
NON-PERFORMING
LOANSDOUBTFUL
LOANSRESTRUCTURED
LOANS
PAST-DUEIMPAIRED
LOANS
PAST-DUENON-IMPAIRED
LOANSOTHER
ASSETS TOTAL
1. Financial assets held for trading - - - - - 2,742 2,742
2. Available-for-sale financial assets - - - - - 89,910 89,910
3. Held-to-maturity investments - - - - - - -
4. Loans and receivables with banks - - - - - 16,330,912 16,330,912
5. Loans and receivables with customers 3,277 673 - 781 18,662 617,857 641,250
6. Financial assets at fair value through profit or loss - - - - - 3,199 3,199
7. Financial instruments classified as held for sale - - - - - - -
8. Hedging derivatives - - - - - 123,143 123,143
Total 31 December 2013 3,277 673 - 781 18,662 17,167,763 17,191,156Total 31 December 2012 3,133 436 - 852 17,970 18,070,008 18,092,399
As at December 31, 2013, there were no impaired purchased loans.
A.1.2 Breakdown of credit exposures by portfolio and credit quality (gross and net values)
PORTFOLIO/QUALITY
IMPAIRED ASSETS PERFORMING
TOTAL (NET EXPOSURE)
GROSSEXPOSURE
SPECIFICIMPAIRMENT
NETEXPOSURE
GROSSEXPOSURE
PORTFOLIOIMPAIRMENT
NETEXPOSURE
1. Financial assets held for trading - - - X X 2,742 2,742
2. Available-for-sale financial assets - - - 89,910 - 89,910 89,910
3. Held-to-maturity investments - - - - - - -
4. Loans and receivables with banks - - - 16,330,912 - 16,330,912 16,330,912
5. Loans and receivables with customers 21,174 (16,443) 4,731 644,241 (7,722) 636,519 641,250
6. Financial assets at fair value through profit or loss - - - X X 3,199 3,199
7. Financial instruments classified as held for sale - - - - - - -
8. Hedging derivatives - - - X X 123,143 123,143
Total 31 December 2013 21,174 (16,443) 4,731 17,065,063 (7,722) 17,186,425 17,191,156Total 31 December 2012 17,899 (13,478) 4,421 17,887,163 (7,495) 18,087,978 18,092,399
As at December 31, 2013, there were no exposures relating to customers with performing loans renegotiated under collective agreements, no impaired purchased loans and no partial write-backs have been made on impaired financial assets.
Breakdown by maturity of net performing loans to customers, amounting to €636,519 thousand, is as follows:- not past due of €617,858 thousand;- not-impaired, past due between 1 day and 90 days of €18,015 thousand;- not-impaired, past due between 90 and 180 days of €451 thousand;- not-impaired, past due between 180 days and 1 year of €191 thousand;- not-impaired, past due over 1 year of €5 thousand.Other performing loans shown in table A.1.2 are all not past due.

161FinecoBank · The Annual Report and Accounts as at December 31, 2013
A.1.3 On-balance sheet and off-balance-sheet credit exposures to banks: gross and net values
TYPE OF EXPOSURE/AMOUNTEXPOSURE
GROSSSPECIFIC
IMPAIRMENTSPORTFOLIO
IMPAIRMENTSNET
EXPOSURE
A. On-balance sheet exposures a) Non-performing loans - - X -
b) Doubtful loans - - X -
c) Restructured loans - - X -
d) Past-due impaired loans - - X -
e) Other assets 16,334,146 X - 16,334,146
Total A 16,334,146 - - 16,334,146B. Off-balance sheet exposures a) Impaired - - X -
b) Other 832,131 X - 832,131
Total B 832,131 - - 832,131
In the above table, item B. “Off-balance sheet exposures” includes the counterparty risk related to repos classified as “Securities Financing Transactions” (SFT), as defined in Bank of Italy prudential regulations, amounting to €401,792 thousand.There were no securities lending transactions collateralised by other securities or without a cash guarantee with banks.
A.1.4 On-balance sheet credit exposures to banks: trend of gross impaired exposures: No data to report.
A.1.5 On-balance sheet credit exposures to banks: trend in total impairments No data to report.
A.1.6 On-balance sheet and off-balance-sheet credit exposures to customers: gross and net values
TYPE OF EXPOSURE/AMOUNTEXPOSURE
GROSSSPECIFIC
IMPAIRMENTSPORTFOLIO
IMPAIRMENTSNET
EXPOSURE
A. On-balance sheet exposures a) Non-performing loans 17,664 (14,387) X 3,277
b) Doubtful loans 2,065 (1,393) X 672
c) Restructured loans - - X -
d) Past-due impaired loans 1,444 (663) X 781
e) Other assets 734,165 X (7,722) 726,443
Total A 755,338 (16,443) (7,722) 731,173B. Off-balance sheet exposures a) Impaired - - X -
b) Other 616,506 X - 616,506
Total B 616,506 - - 616,506
In the above table, item B. “Off-balance sheet exposures” includes the counterparty risk related to securities lending transactions collateralised by other securities and to repos classified as “Securities Financing Transactions” (SFT), as defined in Bank of Italy prudential regulations, amounting to €574,542 thousand.There were no securities lending transactions without cash guarantees with customers.

162
Part E - Information on risks and hedging policies (Continued)
Notes to the Accounts
The Annual Report and Accounts as at December 31, 2013 · FinecoBank
A.1.7 On-balance sheet credit exposures to customers: trend of gross impaired exposures:
SOURCE / CATEGORIESNON-PERFORMING
LOANSDOUBTFUL
LOANSRESTRUCTURED
LOANSPAST-DUE
LOANS
A. Opening balance - gross exposure 14,985 1,384 - 1,529 of which: assets sold but not derecognised - - - -
B. Increases B.1 inflows from performing loans 76 834 - 6,462
B.2 transfers from other categoriesof impaired exposures 3,104 3,786 - -
B.3 Other increases 394 410 - 787
C. Decreases C.1 outflows to performing loans - (416) - (731)
C.2 de-recognitions (239) (127) - -
C.3 collections (656) (700) - (2,769)
C.4 disposals - - - -
C.4 bis losses on disposal - - - -
C.5 transfers to other categoriesof impaired exposures - (3,102) - (3,788)
C.6 other decreases - (4) - (46)
D. Gross exposure closing balance 17,664 2,065 - 1,444 of which: assets sold but not derecognised - - - -
A.1.8 On-balance sheet credit exposures to customers: trend in total impairments
SOURCE / CATEGORIESNON-PERFORMING
LOANS DOUBTFUL
LOANSRESTRUCTURED
LOANSPAST-DUE
LOANS
A. Total opening impairment (11,852) (948) - (678) of which: assets sold but not derecognised - - - -
B. Increases B.1 impairment (2,425) (1,394) - (621)
B.1.a losses on disposal - - - -
B.2 transfers from other categories of impaired exposures (1,008) (64) - -
B.3 Other increases (35) - - -
C. Decreases C.1 write-backs from assessments 441 61 - 180
C.2 write-backs from recoveries 253 61 - 148
C.2.a gains on disposal - - - -
C.3 de-recognitions 239 127 - -
C.4 transfers to other categories of impaired exposures - 764 - 308
C.5 other decreases - - -
D. Final overall impairment (14,387) (1,393) - (663) of which: assets sold but not derecognised - - - -
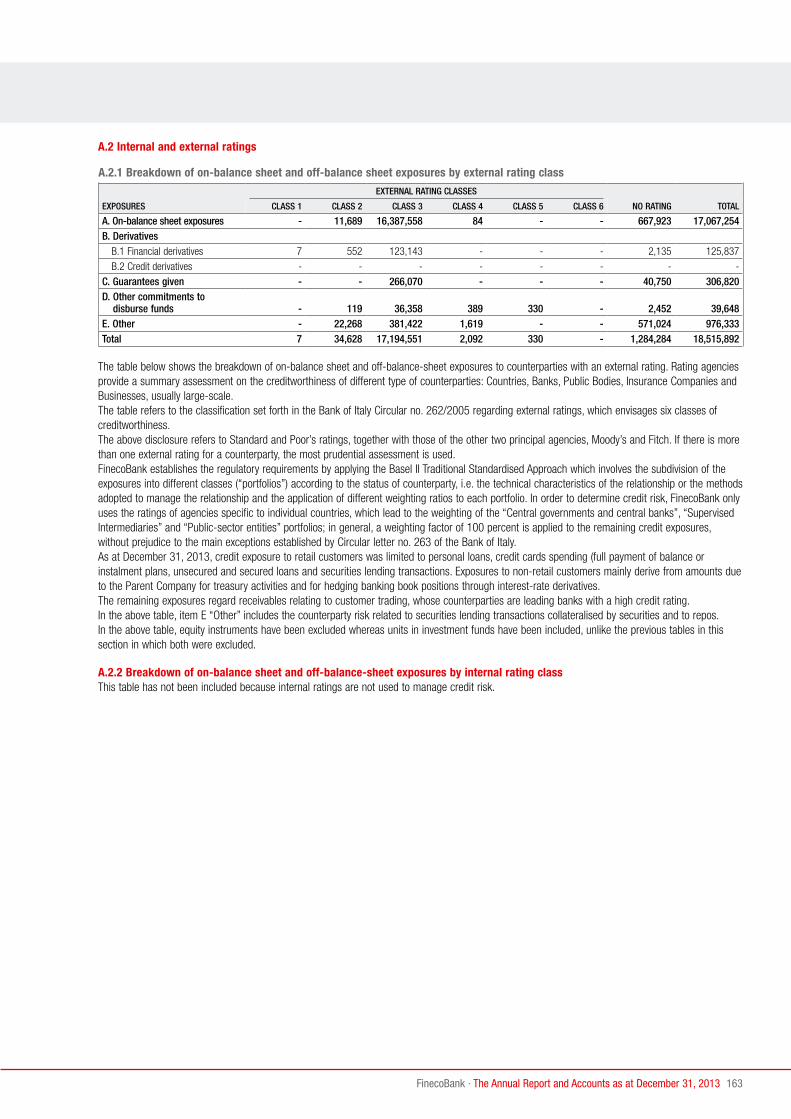
163FinecoBank · The Annual Report and Accounts as at December 31, 2013
A.2 Internal and external ratings
A.2.1 Breakdown of on-balance sheet and off-balance sheet exposures by external rating class
EXPOSURES
EXTERNAL RATING CLASSES
NO RATING TOTALCLASS 1 CLASS 2 CLASS 3 CLASS 4 CLASS 5 CLASS 6
A. On-balance sheet exposures - 11,689 16,387,558 84 - - 667,923 17,067,254B. Derivatives B.1 Financial derivatives 7 552 123,143 - - - 2,135 125,837
B.2 Credit derivatives - - - - - - - -
C. Guarantees given - - 266,070 - - - 40,750 306,820D. Other commitments to
disburse funds - 119 36,358 389 330 - 2,452 39,648E. Other - 22,268 381,422 1,619 - - 571,024 976,333Total 7 34,628 17,194,551 2,092 330 - 1,284,284 18,515,892
The table below shows the breakdown of on-balance sheet and off-balance-sheet exposures to counterparties with an external rating. Rating agencies provide a summary assessment on the creditworthiness of different type of counterparties: Countries, Banks, Public Bodies, Insurance Companies and Businesses, usually large-scale.The table refers to the classification set forth in the Bank of Italy Circular no. 262/2005 regarding external ratings, which envisages six classes of creditworthiness.The above disclosure refers to Standard and Poor’s ratings, together with those of the other two principal agencies, Moody’s and Fitch. If there is more than one external rating for a counterparty, the most prudential assessment is used.FinecoBank establishes the regulatory requirements by applying the Basel II Traditional Standardised Approach which involves the subdivision of the exposures into different classes (“portfolios”) according to the status of counterparty, i.e. the technical characteristics of the relationship or the methods adopted to manage the relationship and the application of different weighting ratios to each portfolio. In order to determine credit risk, FinecoBank only uses the ratings of agencies specific to individual countries, which lead to the weighting of the “Central governments and central banks”, “Supervised Intermediaries” and “Public-sector entities” portfolios; in general, a weighting factor of 100 percent is applied to the remaining credit exposures, without prejudice to the main exceptions established by Circular letter no. 263 of the Bank of Italy. As at December 31, 2013, credit exposure to retail customers was limited to personal loans, credit cards spending (full payment of balance or instalment plans, unsecured and secured loans and securities lending transactions. Exposures to non-retail customers mainly derive from amounts due to the Parent Company for treasury activities and for hedging banking book positions through interest-rate derivatives.The remaining exposures regard receivables relating to customer trading, whose counterparties are leading banks with a high credit rating.In the above table, item E “Other” includes the counterparty risk related to securities lending transactions collateralised by securities and to repos.In the above table, equity instruments have been excluded whereas units in investment funds have been included, unlike the previous tables in this section in which both were excluded.
A.2.2 Breakdown of on-balance sheet and off-balance-sheet exposures by internal rating classThis table has not been included because internal ratings are not used to manage credit risk.

164
Part E - Information on risks and hedging policies (Continued)
Notes to the Accounts
The Annual Report and Accounts as at December 31, 2013 · FinecoBank
A.3 Breakdown of secured exposures by type of collateralA.3.1 Secured exposures to banks
NET EXPOSURE
VALUE
REAL GUARANTEES (1) PERSONAL GUARANTEES (2)
TOTAL (1) + (2)
PROPERTIES - MORTGAGE
PROPERTIES - FINANCE
LEASE SECURITIES
OTHER REAL
GUARANTEES
CREDIT DERIVATIVES GUARANTEES, ETC.
CLN
OTHER DERIVATIVES
GOVERNMENTS AND CENTRAL
BANKS
OTHER PUBLIC
ENTITIES BANKSOTHER
ENTITIES
GOVERNMENTS AND CENTRAL
BANKS
OTHER PUBLIC
ENTITIES BANKSOTHER
ENTITIES
1. Secured on-balance sheet exposures: 1.1 totally secured 5,584 - - 5,608 - - - - - - - - - - 5,608 - of which impaired - - - - - - - - - - - - - - - 1.2 partially secured - - - - - - - - - - - - - - - - of which impaired - - - - - - - - - - - - - - -2. Secured off- Balance Sheet credit exposures: 2.1 totally secured - - - - - - - - - - - - - - - - of which impaired - - - - - - - - - - - - - - - 2.2 partially secured - - - - - - - - - - - - - - - - of which impaired - - - - - - - - - - - - - - -
A.3.2 Secured exposures to customers
NET EXPOSURE
VALUE
REAL GUARANTEES (1) PERSONAL GUARANTEES (2)
TOTAL (1) + (2)
PROPERTIES - MORTGAGE
PROPERTIES - FINANCE
LEASE SECURITIES
OTHER REAL
GUARANTEES
CREDIT DERIVATIVES GUARANTEES, ETC.
CLN
OTHER DERIVATIVES
GOVERNMENTS AND CENTRAL
BANKS
OTHER PUBLIC
ENTITIES BANKSOTHER
ENTITIES
GOVERNMENTS AND CENTRAL
BANKS
OTHER PUBLIC
ENTITIES BANKSOTHER
ENTITIES
1. Secured on-balance sheet exposures: 1.1 totally secured 160,238 544 - 210,440 26,289 - - - - - - - - 12 237,285 - of which impaired 101 344 - 77 29 - - - - - - - - - 450 1.2 partially secured 359 - - 1,475 - - - - - - - - - - 1,475 - of which impaired - - - - - - - - - - - - - - -2. Secured off- Balance Sheet credit exposures: 2.1 totally secured 1,127 - - 1,098 5,280 - - - - - - - - - 6,378 - of which impaired - - - - 1 - - - - - - - - - 1 2.2 partially secured - - - - - - - - - - - - - - - - of which impaired - - - - - - - - - - - - - - -
B. Distribution and concentration of credit exposuresB.1 Breakdown of on-balance sheet and off-balance-sheet exposures to customers by sector (carrying value)
EXPOSURE/COUNTERPARTY
GOVERNMENTS OTHER PUBLIC ENTITIES FINANCIAL COMPANIES INSURANCE COMPANIES NON-FINANCIAL COMPANIES OTHER ENTITIES
NET EXPOSURE
SPECIFIC IMPAIRMENTS
PORTFOLIO IMPAIRMENTS
NET EXPOSURE
SPECIFIC IMPAIRMENTS
PORTFOLIO IMPAIRMENTS
NET EXPOSURE
SPECIFIC IMPAIRMENTS
PORTFOLIO IMPAIRMENTS
NET EXPOSURE
SPECIFIC IMPAIRMENTS
PORTFOLIO IMPAIRMENTS
NET EXPOSURE
SPECIFIC IMPAIRMENTS
PORTFOLIO IMPAIRMENTS
NET EXPOSURE
SPECIFIC IMPAIRMENTS
PORTFOLIO IMPAIRMENTS
A. On-balance sheet exposures A.1 Non-performing loans - - - - 9 (55) - - 18 (68) 3,250 (14,264)
A.2 Doubtful loans - - - - 2 (5) - - 13 (26) 658 (1,362)
A.3 Restructured loans - - - - - - - - - - - -
A.4 Past-due loans - - - - - - - - 3 (2) 778 (661)
A.5 Other exposures 89,921 - 1 - 92,797 (141) 4,328 - 7,801 (3,316) 531,595 (4,265)
Total A 89,921 - - 1 - - 92,808 (60) (141) 4,328 - - 7,835 (96) (3,316) 536,281 (16,287) (4,265)B. “Off-balance” sheet exposures B.1 Non-performing loans - - - - - - - - - - - -
B.2 Doubtful loans - - - - - - - - - - - -
B.3 Other impaired assets - - - - - - - - - - - -
B.4 Other exposures 36,961 - - - 598 - 16 - 1,079 - 3,309 -
Total B 36,961 - - - - - 598 - - 16 - - 1,079 - - 3,309 - -TOTAL A + B 31 December 2013 126,882 - - 1 - - 93,406 (60) (141) 4,344 - - 8,914 (96) (3,316) 539,590 (16,287) (4,265)TOTAL A + B 31 December 2012 58,977 - - 1 - - 75,593 (51) (161) 5,074 - - 8,185 (69) (3,548) 471,566 (13,358) (3,787)

165FinecoBank · The Annual Report and Accounts as at December 31, 2013
A.3 Breakdown of secured exposures by type of collateralA.3.1 Secured exposures to banks
NET EXPOSURE
VALUE
REAL GUARANTEES (1) PERSONAL GUARANTEES (2)
TOTAL (1) + (2)
PROPERTIES - MORTGAGE
PROPERTIES - FINANCE
LEASE SECURITIES
OTHER REAL
GUARANTEES
CREDIT DERIVATIVES GUARANTEES, ETC.
CLN
OTHER DERIVATIVES
GOVERNMENTS AND CENTRAL
BANKS
OTHER PUBLIC
ENTITIES BANKSOTHER
ENTITIES
GOVERNMENTS AND CENTRAL
BANKS
OTHER PUBLIC
ENTITIES BANKSOTHER
ENTITIES
1. Secured on-balance sheet exposures: 1.1 totally secured 5,584 - - 5,608 - - - - - - - - - - 5,608 - of which impaired - - - - - - - - - - - - - - - 1.2 partially secured - - - - - - - - - - - - - - - - of which impaired - - - - - - - - - - - - - - -2. Secured off- Balance Sheet credit exposures: 2.1 totally secured - - - - - - - - - - - - - - - - of which impaired - - - - - - - - - - - - - - - 2.2 partially secured - - - - - - - - - - - - - - - - of which impaired - - - - - - - - - - - - - - -
A.3.2 Secured exposures to customers
NET EXPOSURE
VALUE
REAL GUARANTEES (1) PERSONAL GUARANTEES (2)
TOTAL (1) + (2)
PROPERTIES - MORTGAGE
PROPERTIES - FINANCE
LEASE SECURITIES
OTHER REAL
GUARANTEES
CREDIT DERIVATIVES GUARANTEES, ETC.
CLN
OTHER DERIVATIVES
GOVERNMENTS AND CENTRAL
BANKS
OTHER PUBLIC
ENTITIES BANKSOTHER
ENTITIES
GOVERNMENTS AND CENTRAL
BANKS
OTHER PUBLIC
ENTITIES BANKSOTHER
ENTITIES
1. Secured on-balance sheet exposures: 1.1 totally secured 160,238 544 - 210,440 26,289 - - - - - - - - 12 237,285 - of which impaired 101 344 - 77 29 - - - - - - - - - 450 1.2 partially secured 359 - - 1,475 - - - - - - - - - - 1,475 - of which impaired - - - - - - - - - - - - - - -2. Secured off- Balance Sheet credit exposures: 2.1 totally secured 1,127 - - 1,098 5,280 - - - - - - - - - 6,378 - of which impaired - - - - 1 - - - - - - - - - 1 2.2 partially secured - - - - - - - - - - - - - - - - of which impaired - - - - - - - - - - - - - - -
B. Distribution and concentration of credit exposuresB.1 Breakdown of on-balance sheet and off-balance-sheet exposures to customers by sector (carrying value)
EXPOSURE/COUNTERPARTY
GOVERNMENTS OTHER PUBLIC ENTITIES FINANCIAL COMPANIES INSURANCE COMPANIES NON-FINANCIAL COMPANIES OTHER ENTITIES
NET EXPOSURE
SPECIFIC IMPAIRMENTS
PORTFOLIO IMPAIRMENTS
NET EXPOSURE
SPECIFIC IMPAIRMENTS
PORTFOLIO IMPAIRMENTS
NET EXPOSURE
SPECIFIC IMPAIRMENTS
PORTFOLIO IMPAIRMENTS
NET EXPOSURE
SPECIFIC IMPAIRMENTS
PORTFOLIO IMPAIRMENTS
NET EXPOSURE
SPECIFIC IMPAIRMENTS
PORTFOLIO IMPAIRMENTS
NET EXPOSURE
SPECIFIC IMPAIRMENTS
PORTFOLIO IMPAIRMENTS
A. On-balance sheet exposures A.1 Non-performing loans - - - - 9 (55) - - 18 (68) 3,250 (14,264)
A.2 Doubtful loans - - - - 2 (5) - - 13 (26) 658 (1,362)
A.3 Restructured loans - - - - - - - - - - - -
A.4 Past-due loans - - - - - - - - 3 (2) 778 (661)
A.5 Other exposures 89,921 - 1 - 92,797 (141) 4,328 - 7,801 (3,316) 531,595 (4,265)
Total A 89,921 - - 1 - - 92,808 (60) (141) 4,328 - - 7,835 (96) (3,316) 536,281 (16,287) (4,265)B. “Off-balance” sheet exposures B.1 Non-performing loans - - - - - - - - - - - -
B.2 Doubtful loans - - - - - - - - - - - -
B.3 Other impaired assets - - - - - - - - - - - -
B.4 Other exposures 36,961 - - - 598 - 16 - 1,079 - 3,309 -
Total B 36,961 - - - - - 598 - - 16 - - 1,079 - - 3,309 - -TOTAL A + B 31 December 2013 126,882 - - 1 - - 93,406 (60) (141) 4,344 - - 8,914 (96) (3,316) 539,590 (16,287) (4,265)TOTAL A + B 31 December 2012 58,977 - - 1 - - 75,593 (51) (161) 5,074 - - 8,185 (69) (3,548) 471,566 (13,358) (3,787)

166
Part E - Information on risks and hedging policies (Continued)
Notes to the Accounts
The Annual Report and Accounts as at December 31, 2013 · FinecoBank
B.2 Breakdown of on-balance sheet and off-balance-sheet exposures to customers by geographical area (carrying value)
EXPOSURE/GEOGRAPHICAL AREA
ITALYOTHER EUROPEAN
COUNTRIES AMERICA ASIAREST
OF THE WORLD
NET EXPOSURE
TOTAL IMPAIRMENT
NET EXPOSURE
TOTAL IMPAIRMENT
NET EXPOSURE
TOTAL IMPAIRMENT
NET EXPOSURE
TOTAL IMPAIRMENT
NET EXPOSURE
TOTAL IMPAIRMENT
A. On-balance sheet exposures
A.1 Non-performing loans 3,277 (14,387) - - - - - - - -
A.2 Doubtful loans 673 (1,393) - - - - - - - -
A.3 Restructured loans - - - - - - - - - -
A.4 Past-due loans 781 (663) - - - - - - - -
A.5 Other exposures 673,359 (7,721) 53,055 (1) 9 - 18 - 1 -
TOTAL 678,090 (24,164) 53,055 (1) 9 - 18 - 1 -B. "Off-balance" sheet
exposures B.1 Non-performing loans - - - - - - - - - -
B.2 Doubtful loans - - - - - - - - - -
B.3 Other impaired assets - - - - - - - - - -
B.4 Other exposures 40,250 - 1,603 - 104 - 3 - 4 -
TOTAL 40,250 - 1,603 - 104 - 3 - 4 -TOTAL 31 December 2013 718,340 (24,164) 54,658 (1) 113 - 21 - 5 -TOTAL 31 December 2012 574,434 (20,973) 44,802 (1) 149 - 7 - 3 -
EXPOSURE/GEOGRAPHICAL AREA
NORTHWEST ITALY NORTH-EAST ITALY CENTRAL ITALY SOUTHERN ITALY AND ISLANDS
NET EXPOSURE
TOTAL IMPAIRMENT
NET EXPOSURE
TOTAL IMPAIRMENT
NET EXPOSURE
TOTAL IMPAIRMENT
NET EXPOSURE
TOTAL IMPAIRMENT
A. On-balance sheet exposures
A.1 Non-performing loans 759 (3,592) 381 (1,747) 655 (2,820) 1,481 (6,228)
A.2 Doubtful loans 121 (253) 120 (248) 172 (355) 259 (536)
A.3 Restructured loans - - - - - - - -
A.4 Past-due loans 198 (179) 120 (63) 156 (155) 306 (267)
A.5 Other exposures 199,649 (2,556) 84,685 (1,069) 256,617 (2,339) 132,409 (1,757)
TOTAL 200,727 (6,580) 85,306 (3,127) 257,600 (5,669) 134,455 (8,788)B. "Off-balance" sheet
exposures B.1 Non-performing loans - - - - - - - -
B.2 Doubtful loans - - - - - - - -
B.3 Other impaired assets - - - - - - - -
B.4 Other exposures 2,055 - 454 - 37,147 - 594 -
TOTAL 2,055 - 454 - 37,147 - 594 -TOTAL 31 December 2013 202,782 (6,580) 85,760 (3,127) 294,747 (5,669) 135,049 (8,788)TOTAL 31 December 2012 175,141 (5,836) 71,981 (2,853) 208,005 (4,985) 119,305 (7,297)
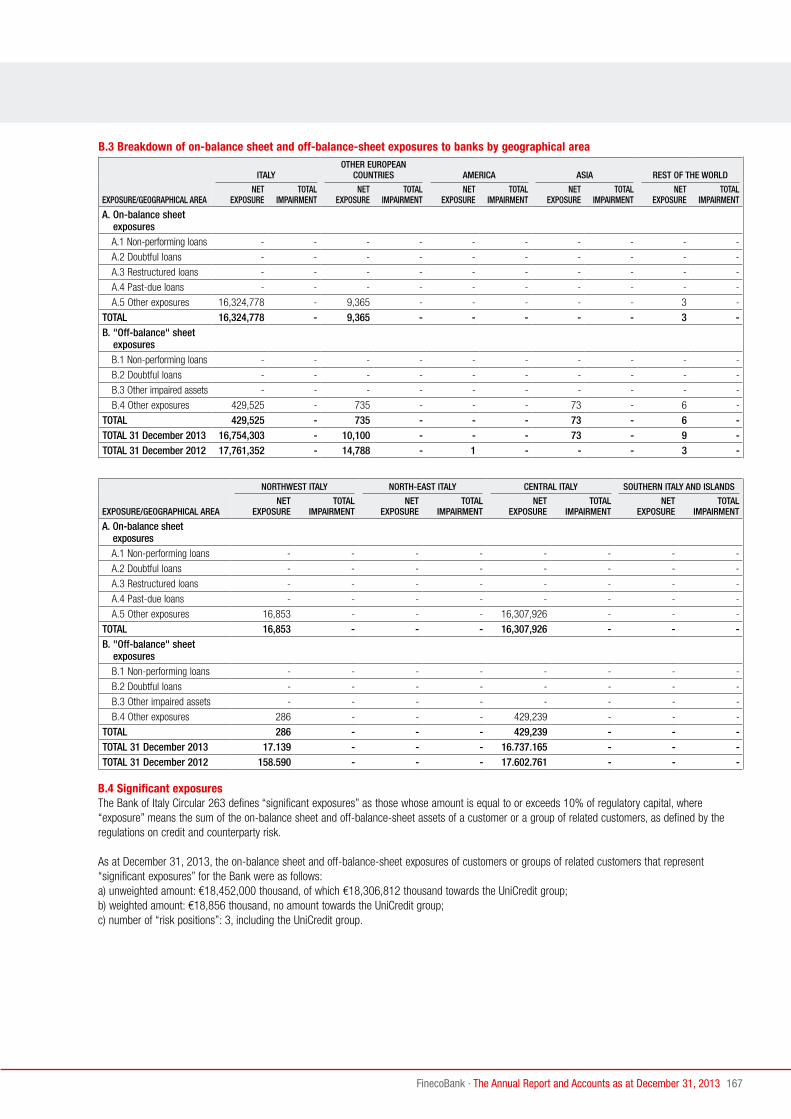
167FinecoBank · The Annual Report and Accounts as at December 31, 2013
B.3 Breakdown of on-balance sheet and off-balance-sheet exposures to banks by geographical area
EXPOSURE/GEOGRAPHICAL AREA
ITALYOTHER EUROPEAN
COUNTRIES AMERICA ASIA REST OF THE WORLD
NET EXPOSURE
TOTAL IMPAIRMENT
NET EXPOSURE
TOTAL IMPAIRMENT
NET EXPOSURE
TOTAL IMPAIRMENT
NET EXPOSURE
TOTAL IMPAIRMENT
NET EXPOSURE
TOTAL IMPAIRMENT
A. On-balance sheet exposures
A.1 Non-performing loans - - - - - - - - - -
A.2 Doubtful loans - - - - - - - - - -
A.3 Restructured loans - - - - - - - - - -
A.4 Past-due loans - - - - - - - - - -
A.5 Other exposures 16,324,778 - 9,365 - - - - - 3 -
TOTAL 16,324,778 - 9,365 - - - - - 3 -B. "Off-balance" sheet
exposures B.1 Non-performing loans - - - - - - - - - -
B.2 Doubtful loans - - - - - - - - - -
B.3 Other impaired assets - - - - - - - - - -
B.4 Other exposures 429,525 - 735 - - - 73 - 6 -
TOTAL 429,525 - 735 - - - 73 - 6 -TOTAL 31 December 2013 16,754,303 - 10,100 - - - 73 - 9 -TOTAL 31 December 2012 17,761,352 - 14,788 - 1 - - - 3 -
EXPOSURE/GEOGRAPHICAL AREA
NORTHWEST ITALY NORTH-EAST ITALY CENTRAL ITALY SOUTHERN ITALY AND ISLANDS
NET EXPOSURE
TOTAL IMPAIRMENT
NET EXPOSURE
TOTAL IMPAIRMENT
NET EXPOSURE
TOTAL IMPAIRMENT
NET EXPOSURE
TOTAL IMPAIRMENT
A. On-balance sheet exposures
A.1 Non-performing loans - - - - - - - -
A.2 Doubtful loans - - - - - - - -
A.3 Restructured loans - - - - - - - -
A.4 Past-due loans - - - - - - - -
A.5 Other exposures 16,853 - - - 16,307,926 - - -
TOTAL 16,853 - - - 16,307,926 - - -B. "Off-balance" sheet
exposures B.1 Non-performing loans - - - - - - - -
B.2 Doubtful loans - - - - - - - -
B.3 Other impaired assets - - - - - - - -
B.4 Other exposures 286 - - - 429,239 - - -
TOTAL 286 - - - 429,239 - - -TOTAL 31 December 2013 17.139 - - - 16.737.165 - - -TOTAL 31 December 2012 158.590 - - - 17.602.761 - - -
B.4 Significant exposuresThe Bank of Italy Circular 263 defines “significant exposures” as those whose amount is equal to or exceeds 10% of regulatory capital, where “exposure” means the sum of the on-balance sheet and off-balance-sheet assets of a customer or a group of related customers, as defined by the regulations on credit and counterparty risk.
As at December 31, 2013, the on-balance sheet and off-balance-sheet exposures of customers or groups of related customers that represent “significant exposures” for the Bank were as follows:a) unweighted amount: €18,452,000 thousand, of which €18,306,812 thousand towards the UniCredit group;b) weighted amount: €18,856 thousand, no amount towards the UniCredit group;c) number of “risk positions”: 3, including the UniCredit group.

168
Part E - Information on risks and hedging policies (Continued)
Notes to the Accounts
The Annual Report and Accounts as at December 31, 2013 · FinecoBank
C. Securitisation and asset transfer transactionsC.1 Securitisation transactionsNo data to report.
C.2 Disposals
A. Financial assets sold and partially derecognised
QUALITATIVE INFORMATIONFinecoBank undertakes reverse repos on securities not recognised in the balance sheet, received through repos and securitised lending, on securities in the Bank’s portfolio.With regard to the transactions on securities in the Bank’s portfolio, the financial assets transferred are bonds issued by UniCredit S.p.A., recognised under Loans and Receivables, which have not been derecognised because FinecoBank undertakes reverse repos with the obligation for the buyer to resell at the end of the activities object of the transaction and maintains all the risks associated with ownership of the securities.
QUANTITATIVE INFORMATION
C.2.1 Financial assets sold but not derecognised: book value and full value
TYPE/ PORTFOLIO
FINANCIAL ASSETS HELD FOR TRADING
FINANCIAL ASSETS AT FAIR VALUE THROUGH
PROFIT OR LOSSAVAILABLE-FOR-SALE
FINANCIAL ASSETSHELD-TO-MATURITY
INVESTMENTSLOANS AND RECEIVABLES
WITH BANKSLOANS AND RECEIVABLES
WITH CUSTOMERS TOTAL
A B C A B C A B C A B C A B C A B C 12.31.2013 12.31.2012
A. On-balance sheet assets 1. Debt securities - - - - - - - - - - - - 188,989 - - - - - 188,989 255,892
2. Equity instruments - - - - - - - - - - - 3. Units in investment funds - - - - - - - - - - - 4. Loans - - - - - - - - - - - - - - - - - - - -B. Derivative instrumentsTotal 31 December 2013 - - - - - - - - - - - - 188,989 - - - - - 188,989 of which impaired - - - - - - - - - - - - - - - - - - -Total 31 December 2012 - - - - - - - - - - - - 255,892 - - - - - 255,892 of which impaired - - - - - - - - - - - - - - - - - - -
Key:A = financial assets sold and fully recognised (book value).B = financial assets sold and partially recognised (book value).C = financial assets sold and partially recognised (entire value).
C.2.2 Financial liabilities from financial assets sold but not derecognised: book value
LIABILITY/ASSET PORTFOLIOFINANCIAL ASSETS HELD FOR TRADING
FINANCIAL ASSETS AT FAIR VALUE THROUGH
PROFIT OR LOSSAVAILABLE-FOR-SALE
FINANCIAL ASSETSHELD-TO-MATURITY
INVESTMENTSLOANS AND RECEIVABLES
WITH BANKSLOANS AND RECEIVABLES
WITH CUSTOMERS TOTAL
1. Deposits from customers a) from fully-recognised assets - - - - 187,807 - 187,807
b) from partially-recognised assets - - - - - - -
2. Deposits from banks a) from fully-recognised assets - - - - 2,811 - 2,811
b) from partially-recognised assets - - - - - - -
Total 31 December 2013 - - - - 190,618 - 190,618Total 31 December 2012 - - - - 259,118 - 259,118

169FinecoBank · The Annual Report and Accounts as at December 31, 2013
QUANTITATIVE INFORMATION
C.2.1 Financial assets sold but not derecognised: book value and full value
TYPE/ PORTFOLIO
FINANCIAL ASSETS HELD FOR TRADING
FINANCIAL ASSETS AT FAIR VALUE THROUGH
PROFIT OR LOSSAVAILABLE-FOR-SALE
FINANCIAL ASSETSHELD-TO-MATURITY
INVESTMENTSLOANS AND RECEIVABLES
WITH BANKSLOANS AND RECEIVABLES
WITH CUSTOMERS TOTAL
A B C A B C A B C A B C A B C A B C 12.31.2013 12.31.2012
A. On-balance sheet assets 1. Debt securities - - - - - - - - - - - - 188,989 - - - - - 188,989 255,892
2. Equity instruments - - - - - - - - - - - 3. Units in investment funds - - - - - - - - - - - 4. Loans - - - - - - - - - - - - - - - - - - - -B. Derivative instrumentsTotal 31 December 2013 - - - - - - - - - - - - 188,989 - - - - - 188,989 of which impaired - - - - - - - - - - - - - - - - - - -Total 31 December 2012 - - - - - - - - - - - - 255,892 - - - - - 255,892 of which impaired - - - - - - - - - - - - - - - - - - -
Key:A = financial assets sold and fully recognised (book value).B = financial assets sold and partially recognised (book value).C = financial assets sold and partially recognised (entire value).
C.2.2 Financial liabilities from financial assets sold but not derecognised: book value
LIABILITY/ASSET PORTFOLIOFINANCIAL ASSETS HELD FOR TRADING
FINANCIAL ASSETS AT FAIR VALUE THROUGH
PROFIT OR LOSSAVAILABLE-FOR-SALE
FINANCIAL ASSETSHELD-TO-MATURITY
INVESTMENTSLOANS AND RECEIVABLES
WITH BANKSLOANS AND RECEIVABLES
WITH CUSTOMERS TOTAL
1. Deposits from customers a) from fully-recognised assets - - - - 187,807 - 187,807
b) from partially-recognised assets - - - - - - -
2. Deposits from banks a) from fully-recognised assets - - - - 2,811 - 2,811
b) from partially-recognised assets - - - - - - -
Total 31 December 2013 - - - - 190,618 - 190,618Total 31 December 2012 - - - - 259,118 - 259,118

170
Part E - Information on risks and hedging policies (Continued)
Notes to the Accounts
The Annual Report and Accounts as at December 31, 2013 · FinecoBank
B. Assets sold and fully derecognised with recognition of continuing involvementNo data to report.
C.3 Covered bond transactionsNo data to report.
D. Credit Risk Measurement ModelsD.1. Credit Risk Measurement - Trading BookThe monitoring of credit risk as part of the management of the trading book is conducted through the rating of all financial instruments held.
D.2. Credit Risk Measurement - Banking BookFinecoBank’s banking book consists of securities, current accounts and deposits held with the Parent Company. Retail customer activities are limited to the granting of personal loans and credit lines, as well as the issue of credit cards. Therefore, FinecoBank’s banking book - excluding transactions with the Parent Company - has a negligible level of risk concentration.
Section 2 - Market riskMarket risk derives from the effect that changes in market variables (interest rates, securities prices, exchange rates, etc.) can cause to the economic value of the Bank’s portfolio, including the assets held in the trading book, as well as those posted in the banking book, i.e. operations connected to strategic investment choices.
Risk Management Strategies and Processes The Parent Company’s Board of Directors lays down strategic guidelines for taking on market risks by calculating capital allocation for the Parent company and its subsidiaries, depending on risk appetite and value creation objectives in proportion to risks assumed.The Board of Directors of FinecoBank, in line with the Group’s approach, approves a general framework of reference for market risk and any significant changes, relating to the organisational structure, strategies, and methods.FinecoBank’s strategy is to keep the minimum level of market risk in line with business needs and the limits set by the Parent Company.Market risk in FinecoBank is defined through two sets of limits:• Global measures of market risk (e.g. VaR): which are meant to establish a boundary to the economic capital absorption and to the economic loss
accepted for activities under trading activities regime; these limits have to be consistent with the assigned budget of revenues and the defined risk taking capacity;
• Granular measures of market risk (Sensitivity limits, Stress scenario limits, Nominal limits): which exist independently of, but act in concert with the global limits; in order to control more effectively and more specifically different risk types, desks and products, these limits are generally granular sensitivity or stress-related limits. The levels set for granular limits aim at limiting the concentration in individual risk factors and the excessive exposure in risk factors which are not sufficiently covered under VaR.
C.2.3 Sales transactions relating to financial liabilities with repayment exclusively based on assets sold and not derecognised: fair valueThe table below only shows the own securities not derecognised that are used in repos.
TYPE/ PORTFOLIO
FINANCIAL ASSETS HELD FOR TRADING
FINANCIAL ASSETS AT FAIR VALUE THROUGH PROFIT OR LOSS
AVAILABLE-FOR-SALE FINANCIAL ASSETS
HELD-TO-MATURITY INVESTMENTS (FAIR VALUE)
LOANS AND RECEIVABLES WITH BANKS (FAIR VALUE)
LOANS AND RECEIVABLES WITH CUSTOMERS (FAIR VALUE) TOTAL
A B A B A B A B A B A B 12.31.2013 12.31.2012
A. On-balance sheet assets 1. Debt securities - - - - - - - - 200,329 - - - 200,329 255,116
2. Equity instruments - - - - - - - -
3. Units in investment funds - - - - - - - -
4. Loans - - - - - - - - - - - - - -
B. Derivative instruments - -Total assets - - - - - - - - 200,329 - - - 200,329 255,116C. Associated liabilities 1. Deposits from customers - - - - - - - - 187,807 - - - 187,807 258,827
2. Deposits from banks - - - - - - - - 2,811 - - - 2,811 291
Total liabilities - - - - - - - - 190,618 - - - 190,618 259,118Net value 31 December 2013 - - - - - - - - 9,711 - - - 9,711Net value 31 December 2012 - - - - - - - - (4,002) - - - (4,002)
Key:A = financial assets sold and wholly recognised. B= financial assets sold and partially recognised.

171FinecoBank · The Annual Report and Accounts as at December 31, 2013
Structure and OrganizationIn order to ensure the effective implementation of operations and the consistency of policies, methods and practices related to market risk in the Group entities, the Group model for activities related to market risk is based on the definition of specific responsibilities.The Parent Company, within its relations with FinecoBank, has primarily - but not solely - responsibility for:• establishing, implementing and refining appropriate measures at global level for measuring exposure to market risk;• setting risk limits, based on measurements identified, in line with the risk appetite approved by the Group.
The Market Risk function of FinecoBank, within the Risk Management Unit, in full compliance with local legal and regulatory obligations, works together with the Market Risk Management Italy Function of the Parent Company and is tasked primarily - but not exclusively - with:• calculating the risk measurements for the global and granular measures for the Bank’s portfolios;• checking that the measurements are compatible with the approved limits;• initiating the escalation process when limits are exceeded, engaging the Market Risk Management Italy function of the Parent Company;• discussing and approving innovative and complex market risk profiles, providing the Financial Risk Italy function of the Parent Company adequate
information for the issue of the related non-binding opinion.
Risk measurement and reporting systemsTrading BookThe main tool used by FinecoBank to measure the market risk of trading positions is Value at Risk (VaR), calculated using the historic simulation approach.The historic simulation method involves the daily revaluation of positions on the basis of market price trends over an appropriate observation period. The resulting distribution of gains and losses is analysed to determine the effect of extreme market fluctuations on portfolios. The percentile value of the distribution corresponding to the set confidence level represents the VaR. The following parameters are used to calculate VaR: confidence level 99%; time horizon of 1 day; daily update of the time series; observation period of 500 days.
Banking Book The primary responsibility of the monitoring and control of the risk management for Market Risk in the Banking Book lies in the Bank’s competent Bodies. The Parent Company is in charge of monitoring market risk for the banking book at consolidated level, but shares this responsibility with the relevant functions of the Legal Entities at local level.The Parent Company, defines structure, data and frequency of the necessary Group and local level reporting. The banking book interest rate risk measure covers both the value and net interest income risk aspects. More precisely, the different, and complementary, perspectives involve: • Economic value perspective: variation in interest rates can affect the economic value of assets and liabilities. The economic value of the Bank can
be viewed as the present value of the expected net cash flows, defined as the expected cash flows on assets minus the expected cash flows on liabilities. A relevant risk measure from this perspective is the economic value sensitivity per time bucket for a 1bp rate shock. This measure is reported to the relevant committees to assess the economic value impact of various changes in the yield curve. The economic value sensitivity is also calculated for a 200bp parallel shock. A monitoring variable from this perspective is the value at risk resulting from interest rate risk exposure;
C.2.3 Sales transactions relating to financial liabilities with repayment exclusively based on assets sold and not derecognised: fair valueThe table below only shows the own securities not derecognised that are used in repos.
TYPE/ PORTFOLIO
FINANCIAL ASSETS HELD FOR TRADING
FINANCIAL ASSETS AT FAIR VALUE THROUGH PROFIT OR LOSS
AVAILABLE-FOR-SALE FINANCIAL ASSETS
HELD-TO-MATURITY INVESTMENTS (FAIR VALUE)
LOANS AND RECEIVABLES WITH BANKS (FAIR VALUE)
LOANS AND RECEIVABLES WITH CUSTOMERS (FAIR VALUE) TOTAL
A B A B A B A B A B A B 12.31.2013 12.31.2012
A. On-balance sheet assets 1. Debt securities - - - - - - - - 200,329 - - - 200,329 255,116
2. Equity instruments - - - - - - - -
3. Units in investment funds - - - - - - - -
4. Loans - - - - - - - - - - - - - -
B. Derivative instruments - -Total assets - - - - - - - - 200,329 - - - 200,329 255,116C. Associated liabilities 1. Deposits from customers - - - - - - - - 187,807 - - - 187,807 258,827
2. Deposits from banks - - - - - - - - 2,811 - - - 2,811 291
Total liabilities - - - - - - - - 190,618 - - - 190,618 259,118Net value 31 December 2013 - - - - - - - - 9,711 - - - 9,711Net value 31 December 2012 - - - - - - - - (4,002) - - - (4,002)
Key:A = financial assets sold and wholly recognised. B= financial assets sold and partially recognised.

172
Part E - Information on risks and hedging policies (Continued)
Notes to the Accounts
The Annual Report and Accounts as at December 31, 2013 · FinecoBank
• Income perspective: the focus of analysis is the impact of changes of interest rates on accrual or reported Net Interest Income that is the difference between revenues generated by interest sensitive assets and the cost related to interest sensitive liabilities. An example of a measure of risks used is Net Interest Income sensitivity for a 100bp parallel shock in rates. This measure provides an indication of the impact that such a shock would have on the net interest income over the next 12 months. For these rate scenarios, the 0% floor is considered for the downward shock in view of the current low rate environment. Additional scenarios that are evaluated include steepening and flattening scenarios (non-parallel shocks).
Procedures and methodologies for Valuation of Trading Book positions FinecoBank ensures that the value applied to each trading book position appropriately reflects the current fair (market) value, i.e. the amount for which an asset could be exchanged, or a liability settled, between knowledgeable, willing parties in an arm’s length transaction. The fair value of each financial instrument is based on, or derived from, observable market prices or inputs. The availability of observable prices or inputs differs by product and market, and might change over time. If observable prices or parameters are readily and regularly available (i.e. satisfying adequate liquidity requirements), they are directly employed in the determination of fair value (mark-to-market). In non-active markets or for certain instruments, for which observable prices or inputs are not available, fair values calculated leveraging on valuation techniques appropriate for the specific instrument (mark-to-model). This approach involves estimation and judgement and, therefore, might require valuation adjustments which take into account bid-ask spreads, liquidity and counterparty risk, besides the employed pricing model. In addition, each pricing model used for fair value calculation is validated by a dedicated function independent from business units. According to Group Market Risk Governance Guidelines, in order to ensure the adequate separation between functions in charge of development activities and functions in charge of validation, all pricing models developed by Legal Entities front-office functions need to be centrally and independently tested and validated by the Holding Company Market Risk functions. Model validation is also carried out centrally for any novel system or analysis framework whose utilization has a potential impact on the Bank’s economic results. In addition to daily marking to market or marking to model, Independent Price Verification (IPV) shall be performed by FinecoBank’s Risk Management. This is the process by which market prices or model inputs are regularly verified for accuracy and independence. While daily marking to market or marking to model may be performed by front-office dealers, verification of market prices and model inputs is performed at least monthly. Risk measuresVaRThe VaR calculated within the measurement of the market risk of the banking and trading book uses a historical simulation approach. The choice of model adopted by the Parent Company has a series of advantages:• easy to understand and communicate;• does not require any explicit assumptions about the particular functional form of the distribution of yields of the risk factors;• does not require estimation of the variance-covariance matrix of the market factors that may affect the value of the portfolio. • captures the correlation structure reflected in the joint changes in market factors implicitly assuming that it remains constant in the future;On the other hand, VaR models based on historical simulations do not provide any information on the amount of the loss exceeding the VaR. This why the framework established by the Parent Company uses additional instruments such as stress tests.
2.1 Interest rate risk and price risk - regulatory trading book
QUALITATIVE INFORMATION
A. General aspectsThe trading book is used to hold debt securities (ordinary and subordinated, structured and plain vanilla), equity instruments, and certificates - listed and non-listed - related to brokerage activities with retail customers. FinecoBank does not perform proprietary trading and does not assume speculative positions in its books. Entries in the Bank’s trading book are recorded against brokerage activities with retail customers particularly during the sale of OTC instruments. Other entries in the trading book are made for the internalisation of various financial instruments when the Bank is a counterparty to the customer. This activity is performed as a result of the options introduced by the MiFID which allow the execution of orders for financial instruments in a number of execution venues including internal execution.
B. Processes for managing and methods for measuring interest rate risk and price riskFor both a description of internal processes for monitoring and managing risk and an illustration of the methodologies used to analyse exposure, please refer to the introduction.

173FinecoBank · The Annual Report and Accounts as at December 31, 2013
QUANTITATIVE INFORMATION
1. Regulatory trading book: distribution by maturity (repricing date) of on-balance sheet financial assets and liabilities and financial derivatives - Currency: Euro
TYPE/UNEXPIRED TERM ON DEMANDUP TO
3 MONTHS
BETWEEN 3 AND
6 MONTHS
BETWEEN 6 MONTHS
AND 1 YEAR
BETWEEN 1 AND
5 YEARS
BETWEEN 5 AND
10 YEARSOVER
10 YEARSINDEFINITE DURATION
1. On-balance sheet assets 1.1 Debt securities
- with early redemption option - - - - - - - -
- other 30 1 - 4 1 4 8 -
1.2 Other assets - - - - - - - -
2. On-balance sheet liabilities 2.1 Repos - - - - - - - -
2.2 Other liabilities - - - - - - - -
3. Financial derivatives 3.1 With underlying security
- Options
+ Long positions - - - - - - - -
+ Short positions - - - - - - - -
- Other derivatives
+ Long positions 4,939 123,684 3,435 31 957 1,306 21,080 -
+ Short positions 4,939 123,558 3,435 31 957 1,419 21,084 -
3.2 Without underlying security
- Options
+ Long positions - - - - - - - -
+ Short positions - - - - - - - -
- Other derivatives
+ Long positions - 126,233 3,610 84,800 - - - -
+ Short positions - 158,891 8,850 33,650 - - - -
Item 3.1 Financial derivatives with underlying security - Other derivatives includes spot contracts for securities, other than shares and units in investment funds, to be settled within the times established by market practices (“regular way”).Item 3.2 Financial derivatives without underlying security - Other derivatives includes the currency spot contracts to be settled within the times established by market practices (“regular way”).
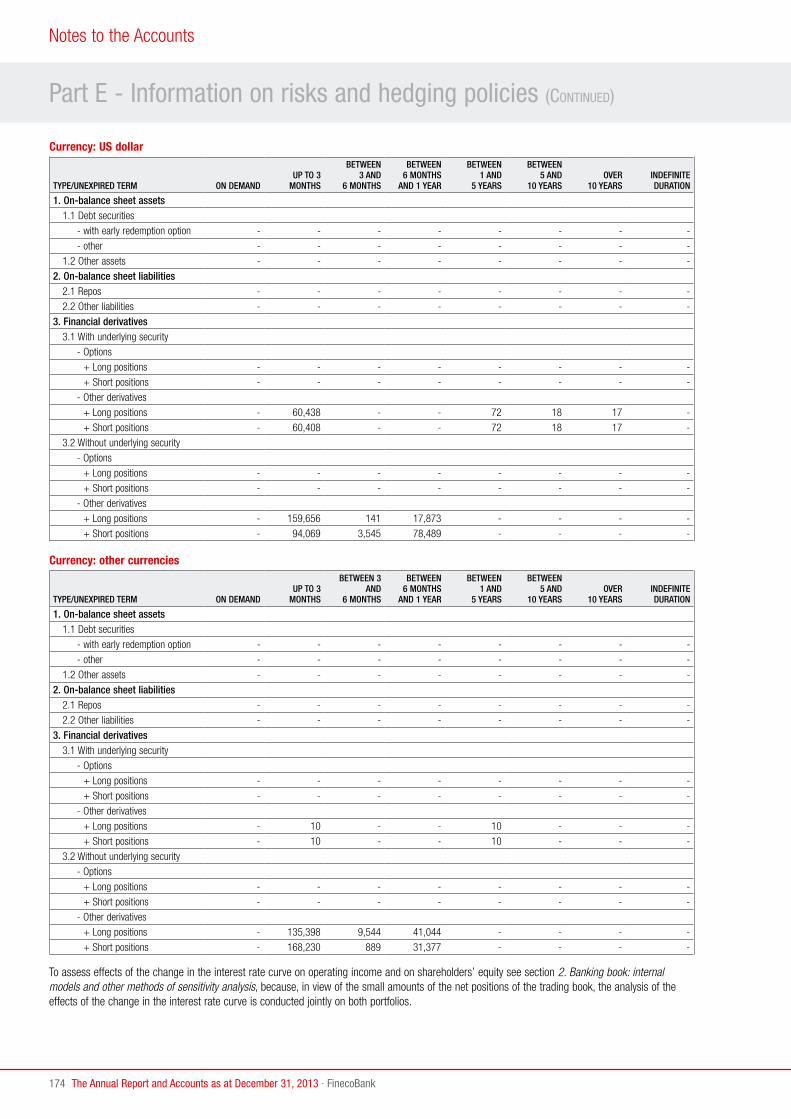
174
Part E - Information on risks and hedging policies (Continued)
Notes to the Accounts
The Annual Report and Accounts as at December 31, 2013 · FinecoBank
Currency: US dollar
TYPE/UNEXPIRED TERM ON DEMANDUP TO 3
MONTHS
BETWEEN 3 AND
6 MONTHS
BETWEEN 6 MONTHS
AND 1 YEAR
BETWEEN 1 AND
5 YEARS
BETWEEN 5 AND
10 YEARSOVER
10 YEARSINDEFINITE DURATION
1. On-balance sheet assets 1.1 Debt securities
- with early redemption option - - - - - - - -
- other - - - - - - - -
1.2 Other assets - - - - - - - -
2. On-balance sheet liabilities 2.1 Repos - - - - - - - -
2.2 Other liabilities - - - - - - - -
3. Financial derivatives 3.1 With underlying security
- Options
+ Long positions - - - - - - - -
+ Short positions - - - - - - - -
- Other derivatives
+ Long positions - 60,438 - - 72 18 17 -
+ Short positions - 60,408 - - 72 18 17 -
3.2 Without underlying security
- Options
+ Long positions - - - - - - - -
+ Short positions - - - - - - - -
- Other derivatives
+ Long positions - 159,656 141 17,873 - - - -
+ Short positions - 94,069 3,545 78,489 - - - -
Currency: other currencies
TYPE/UNEXPIRED TERM ON DEMANDUP TO 3
MONTHS
BETWEEN 3 AND
6 MONTHS
BETWEEN 6 MONTHS
AND 1 YEAR
BETWEEN 1 AND
5 YEARS
BETWEEN 5 AND
10 YEARSOVER
10 YEARSINDEFINITE DURATION
1. On-balance sheet assets 1.1 Debt securities
- with early redemption option - - - - - - - -
- other - - - - - - - -
1.2 Other assets - - - - - - - -
2. On-balance sheet liabilities 2.1 Repos - - - - - - - -
2.2 Other liabilities - - - - - - - -
3. Financial derivatives 3.1 With underlying security
- Options
+ Long positions - - - - - - - -
+ Short positions - - - - - - - -
- Other derivatives
+ Long positions - 10 - - 10 - - -
+ Short positions - 10 - - 10 - - -
3.2 Without underlying security
- Options
+ Long positions - - - - - - - -
+ Short positions - - - - - - - -
- Other derivatives
+ Long positions - 135,398 9,544 41,044 - - - -
+ Short positions - 168,230 889 31,377 - - - -
To assess effects of the change in the interest rate curve on operating income and on shareholders’ equity see section 2. Banking book: internal models and other methods of sensitivity analysis, because, in view of the small amounts of the net positions of the trading book, the analysis of the effects of the change in the interest rate curve is conducted jointly on both portfolios.

175FinecoBank · The Annual Report and Accounts as at December 31, 2013
2. 2. Regulatory trading book: distribution of exposures in equity instruments and share indices for the main stock market countries
TYPE OF TRANSACTION/LISTING INDEX
LISTED
UNLISTEDUSA NETHERLANDS ITALY GERMANY CANADA OTHER
A. Equity instruments - Long positions - - 1 3 - 8 11
- Short positions - - - - - - -
B. Unsettled transactions on equity instruments
- Long positions 57,953 3,303 72,902 2,064 1,512 330 -
- Short positions 57,953 3,303 72,902 2,073 1,512 330 -
C. Other derivatives on equity instruments
- Long positions - - - - - - -
- Short positions - - - - - - -
D. Derivatives on share indices
- Long positions 1,460 - 1,143 2,076 - 543 -
- Short positions 432 - 1,181 2,103 - 520 -
In view of the lack of speculative operations and the comments made in point 2.1 the positions in equity instruments and equity indices held in the regulatory trading book as at December 31, 2013 are residual and originate exclusively from settlement activities with institutional counterparties in behalf of customers and they also have a residual impact on operating income, profit (loss) for the year and shareholders’ equity.
3. Regulatory trading book: internal models and other methods of sensitivity analysisFinecoBank monitors the VaR of the Trading Book daily.As at December 31, 2013, the daily VaR of trading book amounted to €137 thousand.
2.2 Interest rate risk and price risk - banking book
QUALITATIVE INFORMATION
A. General aspects, management processes and measurement methods for interest rate risk and price riskInterest rate risk consists of changes in interest rates that are reflected in: • interest income sources, and thus, the Bank’s earnings (cash flow risk); • the net present value of assets and liabilities, due to their impact on the present value of future cash flows (fair value risk).FinecoBank, in line the Group approach, measures and monitors interest rate risk daily within the framework of the methods and corresponding limits or thresholds set by the Parent Company. These relate to the sensitivity of net interest income and the economic value. Interest rate risk has an impact on all owned positions resulting from strategic investment decisions (banking book). The main sources of interest rate risk can be classified as follows: • repricing risk - the risk resulting from timing mismatches in maturities and the repricing of the Bank’s assets and liabilities; the main features of this
risk are:- yield curve risk - risk resulting from exposure of the bank’s positions to changes in the slope and shape of the yield curve; - basis risk - risk resulting from the imperfect correlation in lending and borrowing interest rate changes for different instruments that may also show
similar repricing characteristics; • optionality risk - risk resulting from implicit or explicit options in the Group’s banking book positions.Within the organisation structure already described above, the Parent Company sets the limits that are then approved by the Board of Directors of FinecoBank. These limits are set in terms of VaR (calculated using the methodology described above in relation to the trading portfolio), and Gap Repricing. FinecoBank is responsible for managing the exposure to interest rate risk within the limits assigned.
To assess effects of the change in the interest rate curve on the banking book, scenario analyses are conducted that involve the parallel shifts in the rate curve of +/- 100 bps and +/- 200 bps at weekly intervals. For more details see section 2. Banking book: Internal models and other methods of sensitivity analysis
B. Fair value hedging activitiesHedging strategies aimed at complying with interest rate risk limits for the banking portfolio are carried out with listed or unlisted derivative contracts. These derivatives, which are usually interest rate swaps, are the type of contracts most used. Macro-hedging is generally used, meaning hedges related to the amounts of cash contained in asset or liability portfolios.

176
Part E - Information on risks and hedging policies (Continued)
Notes to the Accounts
The Annual Report and Accounts as at December 31, 2013 · FinecoBank
C. Cash flow hedging activityThere are currently no cash flow hedges generated by FinecoBank business operations.
D. Hedges of foreign investmentsThere are currently no hedges of foreign investments within FinecoBank’s business operations.
QUANTITATIVE INFORMATION
1. 1. Banking book: distribution by maturity (repricing date) of financial assets and liabilities - Currency: Euro
TYPE/UNEXPIRED TERM ON DEMANDUP TO 3
MONTHS
BETWEEN 3 AND
6 MONTHS
BETWEEN 6 MONTHS AND 1 YEAR
BETWEEN 1 AND
5 YEARS
BETWEEN 5 AND
10 YEARSOVER
10 YEARSINDEFINITE DURATION
1. On-balance sheet assets 1.1 Debt securities - with early redemption option - - - - - - - - - other - 260,979 37,651 751,189 2,293,395 - - - 1.2 Loans to banks 8,954,935 763,975 943,157 1,829,457 20,117 - - - 1.3 Loans to customers - current accounts 98,492 456 538 257 689 - - - - other loans - with early redemption option 3,104 18,189 15,622 24,853 66,224 3,383 - - - other 34,009 351,975 554 791 2,870 73 83 - 2. On-balance sheet liabilities 2.1 Deposits from customers - current accounts 10,173,193 - - - - - - - - other payables - with early redemption option - - - - - - - - - other 77,853 558,173 500,014 898,187 13,485 - - - 2.2 Deposits from banks - current accounts 27,627 - - - - - - - - other payables 239 77,420 654,543 887,333 - - - - 2.3 Debt securities - with early redemption option - - - - - - - - - other - - - - 2,250,000 - - - 2.4 Other liabilities - with early redemption option - - - - - - - - - other - - - - - - - - 3. Financial derivatives 3.1 With underlying security - Options + Long positions - - - - - - - - + Short positions - - - - - - - - - Other derivatives + Long positions - - - - - - - - + Short positions - - - - - - - - 3.2 Without underlying security - Options + Long positions - - - - - - - - + Short positions - - - - - - - - - Other derivatives + Long positions - 3,310,368 - - 2,250,000 - - - + Short positions - 2,505,539 4,076 766,100 2,284,653 - - - 4. Other off-balance sheet
transactions + Long positions - - - - 716 - - - + Short positions - 716 - - - - - -
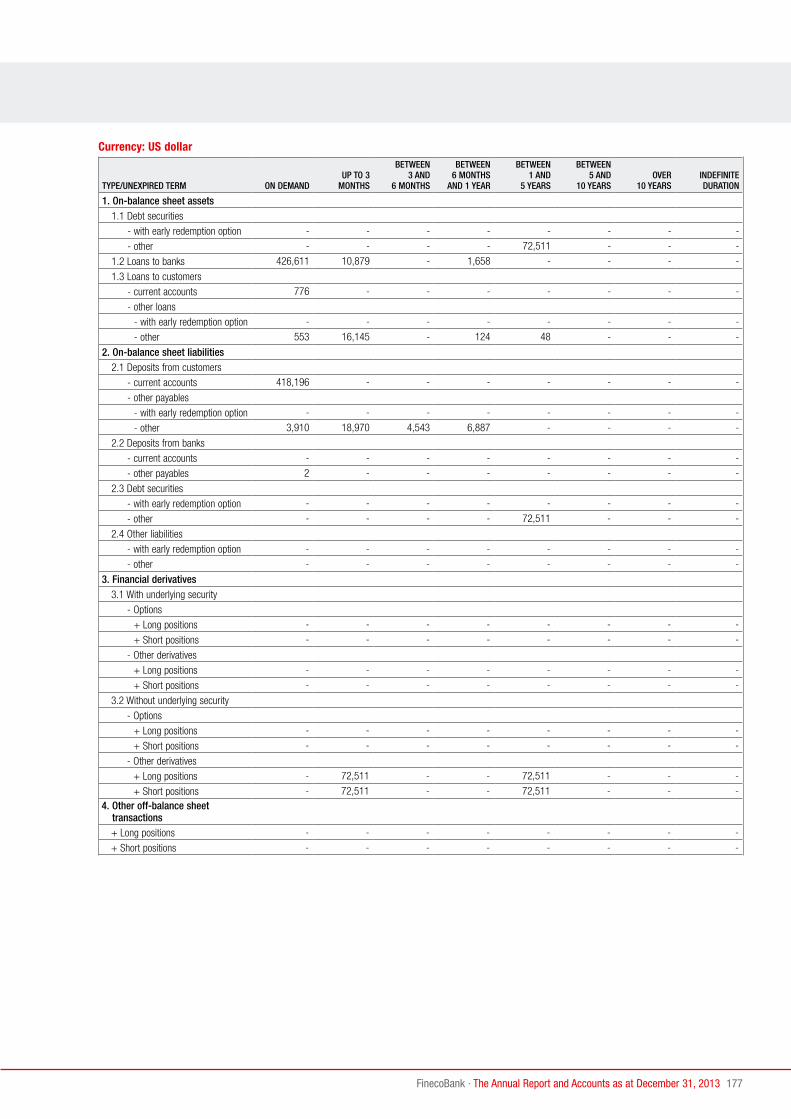
177FinecoBank · The Annual Report and Accounts as at December 31, 2013
Currency: US dollar
TYPE/UNEXPIRED TERM ON DEMANDUP TO 3
MONTHS
BETWEEN 3 AND
6 MONTHS
BETWEEN 6 MONTHS AND 1 YEAR
BETWEEN 1 AND
5 YEARS
BETWEEN 5 AND
10 YEARSOVER
10 YEARSINDEFINITE DURATION
1. On-balance sheet assets 1.1 Debt securities
- with early redemption option - - - - - - - -
- other - - - - 72,511 - - -
1.2 Loans to banks 426,611 10,879 - 1,658 - - - -
1.3 Loans to customers
- current accounts 776 - - - - - - -
- other loans
- with early redemption option - - - - - - - -
- other 553 16,145 - 124 48 - - -
2. On-balance sheet liabilities 2.1 Deposits from customers
- current accounts 418,196 - - - - - - -
- other payables
- with early redemption option - - - - - - - -
- other 3,910 18,970 4,543 6,887 - - - -
2.2 Deposits from banks
- current accounts - - - - - - - -
- other payables 2 - - - - - - -
2.3 Debt securities
- with early redemption option - - - - - - - -
- other - - - - 72,511 - - -
2.4 Other liabilities
- with early redemption option - - - - - - - -
- other - - - - - - - -
3. Financial derivatives 3.1 With underlying security
- Options
+ Long positions - - - - - - - -
+ Short positions - - - - - - - -
- Other derivatives
+ Long positions - - - - - - - -
+ Short positions - - - - - - - -
3.2 Without underlying security
- Options
+ Long positions - - - - - - - -
+ Short positions - - - - - - - -
- Other derivatives
+ Long positions - 72,511 - - 72,511 - - -
+ Short positions - 72,511 - - 72,511 - - - 4. Other off-balance sheet
transactions + Long positions - - - - - - - -
+ Short positions - - - - - - - -

178
Part E - Information on risks and hedging policies (Continued)
Notes to the Accounts
The Annual Report and Accounts as at December 31, 2013 · FinecoBank
Currency: other currencies
TYPE/UNEXPIRED TERM ON DEMANDUP TO 3
MONTHS
BETWEEN 3 AND
6 MONTHS
BETWEEN 6 MONTHS AND 1 YEAR
BETWEEN 1 AND
5 YEARS
BETWEEN 5 AND
10 YEARSOVER
10 YEARSINDEFINITE DURATION
1. On-balance sheet assets 1.1 Debt securities
- with early redemption option - - - - - - - -
- other - - - - - - - -
1.2 Loans to banks 57,290 96 - 121 - - - -
1.3 Loans to customers
- current accounts 22 - - - - - - -
- other loans
- with early redemption option - - - - - - - -
- other 986 431 - - - - - -
2. On-balance sheet liabilities 2.1 Deposits from customers
- current accounts 55,915 - - - - - - -
- other payables
- with early redemption option - - - - - - - -
- other 9 59 - - - - - -
2.2 Deposits from banks
- current accounts 1,512 - - - - - - -
- other payables - - - - - - - -
2.3 Debt securities
- with early redemption option - - - - - - - -
- other - - - - - - - -
2.4 Other liabilities
- with early redemption option - - - - - - - -
- other - - - - - - - -
3. Financial derivatives 3.1 With underlying security
- Options
+ Long positions - - - - - - - -
+ Short positions - - - - - - - -
- Other derivatives
+ Long positions - - - - - - - -
+ Short positions - - - - - - - -
3.2 Without underlying security
- Options
+ Long positions - - - - - - - -
+ Short positions - - - - - - - -
- Other derivatives
+ Long positions - - - - - - - -
+ Short positions - - - - - - - - 4. Other off-balance sheet
transactions + Long positions - - - - - - - -
+ Short positions - - - - - - - -
For a description of the effects of a change in the interest rate curve on net interest income, profit (loss) for the year and shareholders’ equity, as well as the results of the scenario analyses see section 2. Banking book: Internal models and other methods of sensitivity analysis.

179FinecoBank · The Annual Report and Accounts as at December 31, 2013
2. Banking book: internal models and other methods of sensitivity analysisThe following table provides the results of the analyses conducted.
CURRENCYVALUE ANALYSIS
(SHIFT + 100 BP)VALUE ANALYSIS (SHIFT - 100 BP)
VALUE ANALYSIS (SHIFT + 200 BP)
VALUE ANALYSIS (SHIFT - 200 BP)
VALUE ANALYSIS (SHIFT + 1 BP) IRVAR*
EUR 32.130 -16.206 21.878 -9.422 110 /
USD 450 -171 845 -87 4 /
Other currencies 12 1 96 -12 1 /
Total 32.592 -16.378 22.819 -9.521 115 727
* 1 day holding period, 99% confidence level%.
The sensitivity analysis on the net interest income, which was conducted assuming a shift of + 100 basis points on the euro interest rate curve, highlighted an impact of €32,592 thousand as at December 31, 2013. A shift of -100 basis points showed an impact of - €16,378 thousand.The sensitivity analysis on the value of shareholders’ equity, which was conducted assuming a shift of + 200 basis points on the euro interest rate curve, showed an impact of €22,819 thousand. A shift of -200 basis point showed an impact of - €9,521 thousand.The sensitivity analysis on the value of shareholders’ equity, which was conducted assuming a shift of + 1, showed an overall impact of €115 thousand.The interest rate VaR figure for FinecoBank came to approximately €727 thousand.
2.3 Exchange rate risk
QUALITATIVE INFORMATIONA. General aspects, management processes and measurement methods for exchange rate riskAs part of its treasury activities, FinecoBank collects deposits in foreign currencies, mainly in US dollars, through customer current account overdrafts and reverse repos, using the funds collected in current accounts and by entering into time deposits in the same currency with the Parent Company.The impact on the value of balance sheet items is estimated using the Forex VaR indicator.
The VaR of the Bank’s positions is not used for the calculation of the Pillar 1 capital requirement because the traditional standardized approach is used. The VaR is only used for management purposes.
B. Exchange rate risk hedgingExchange rate risk is hedged through the matching of assets and liabilities denominated in currency or through spot transactions in foreign currencies. The component of exchange rate risk that contributes to the formation of the overall VaR is usually tied to the temporal mismatch between assets and liabilities in US dollars.

180
Part E - Information on risks and hedging policies (Continued)
Notes to the Accounts
The Annual Report and Accounts as at December 31, 2013 · FinecoBank
QUANTITATIVE INFORMATION
1. Breakdown of assets, liabilities and derivatives by currency of denomination
ITEMS
CURRENCIES
US DOLLAR
POUND STERLING
SWISS FRANC YEN
AUSTRALIAN DOLLAR
OTHER CURRENCIES
A. Financial assets 529,306 28,244 28,043 113 109 2,447 A.1 Debt securities 72,511 - - - - -
A.2 Equity instruments 1 3 - 5 - -
A.3 Loans to banks 439,148 27,490 27,744 61 109 2,104
A.4 Loans to customers 17,646 751 299 47 - 343
A.5 Other financial assets - - - - - -
B. Other assets 144 - 22 - 1 17C. Financial liabilities 525,019 28,011 27,905 72 - 1,507 C.1 Deposits from banks 2 - - 72 - 1,440
C.2 Deposits from customers 452,506 28,011 27,905 - - 67
C.3 Debt securities 72,511 - - - - -
C.4 Other financial liabilities - - - - - -
D. Other liabilities 4,795 55 33 1 11 76E. Financial derivatives - Options
+ Long positions - - - - - -
+ Short positions - - - - - -
- Other derivatives
+ Long positions 177,670 28,820 54,074 6,619 25,972 70,502
+ Short positions 176,103 27,529 59,016 16,616 26,244 71,091
Total assets 707,120 57,064 82,139 6,732 26,082 72,966Total liabilities 705,917 55,595 86,954 16,689 26,255 72,674Imbalance 1,203 1,469 (4,815) (9,957) (173) 292
The impact of the changes in exchange rates are measured through the daily Forex VaR of the overall portfolio, as detailed in the section below.
2. Internal models and other methods of sensitivity analysisAs at December 31, 2013, the daily Forex VaR of the overall portfolio (banking and trading books) was approximately €20 thousand.

181FinecoBank · The Annual Report and Accounts as at December 31, 2013
2.4 Derivative instruments
A. Financial derivativesA.1 Regulatory trading book: period-end and average notional amounts
UNDERLYING ASSET/TYPE OF DERIVATIVE
12.31.2013 12.31.2012
OVER THE COUNTER
CENTRAL COUNTER-PARTIES
OVER THE COUNTER
CENTRAL COUNTER-PARTIES
1. Debt securities and interest rate indexes a) Options - - - -
b) Swaps - - - -
c) Forwards - - - -
d) Futures - 115 - -
e) Other 384 - - -
2. Equity instruments and share indices a) Options - - - -
b) Swaps - - - -
c) Forwards - - - -
d) Futures - 2,297 - -
e) Other 7,222 4 - 5
3. Currencies and gold a) Options - - - -
b) Swaps - - - -
c) Forwards - - - -
d) Futures - - - -
e) Other 529,958 - - -
4. Commodities - - - -5. Other underlying assets - - - -Total 537,564 2,416 - 5Average amounts 349,734 1,533 33 213
A.2 Banking book: period-end and average notional amountsA.2.1 Hedging instruments
UNDERLYING ASSET/TYPE OF DERIVATIVE
12.31.2013 12.31.2012
OVER THE COUNTER
CENTRAL COUNTER-PARTIES
OVER THE COUNTER
CENTRAL COUNTER-PARTIES
1. Debt securities and interest rate indexes a) Options - - - -
b) Swaps 5,705,390 - 7,389,267 -
c) Forwards - - - -
d) Futures - - - -
e) Other - - - -
2. Equity instruments and share indices a) Options - - - -
b) Swaps - - - -
c) Forwards - - - -
d) Futures - - - -
e) Other - - - -
3. Currencies and gold a) Options - - - -
b) Swaps - - - -
c) Forwards - - - -
d) Futures - - - -
e) Other - - - -
4. Commodities - - - -5. Other underlying assets - - - -Total 5,705,390 - 7,389,267 -Average amounts 6,331,222 - 7,518,647 -
A.2.2 Other derivativesNo data to report.

182
Part E - Information on risks and hedging policies (Continued)
Notes to the Accounts
The Annual Report and Accounts as at December 31, 2013 · FinecoBank
A.3 Financial derivatives: gross positive fair value - breakdown by product
TRANSACTION TYPES/UNDERLYINGS
POSITIVE FAIR VALUE
12.31.2013 12.31.2012
OVER THE COUNTER
CENTRAL COUNTER-PARTIES
OVER THE COUNTER
CENTRAL COUNTER-PARTIES
A. Regulatory trading book a) Options - - - - b) Interest rate swaps - - - - c) Cross currency swaps - - - - d) Equity swaps - - - - e) Forwards - - - - f) Futures - 5 - - g) Other 903 - - 1B. Banking book - hedges a) Options - - - - b) Interest rate swaps 123,143 - 190,573 - c) Cross currency swaps - - - - d) Equity swaps - - - - e) Forwards - - - - f) Futures - - - - g) Other - - - -C. Banking book - other derivatives a) Options - - - - b) Interest rate swaps - - - - c) Cross currency swaps - - - - d) Equity swaps - - - - e) Forwards - - - - f) Futures - - - - g) Other - - - -Total 124,046 5 190,573 1
A.4 Financial derivatives: negative fair value - breakdown by product
TRANSACTION TYPES/UNDERLYINGS
NEGATIVE FAIR VALUE
12.31.2013 12.31.2012
OVER THE COUNTER
CENTRAL COUNTER-PARTIES
OVER THECOUNTER
CENTRAL COUNTER-PARTIES
A. Regulatory trading book a) Options - - - - b) Interest rate swaps - - - - c) Cross currency swaps - - - - d) Equity swaps - - - - e) Forwards - - - - f) Futures - 24 - - g) Other 548 - - -B. Banking book - hedges a) Options - - - - b) Interest rate swaps 141,801 - 213,885 - c) Cross currency swaps - - - - d) Equity swaps - - - - e) Forwards - - - - f) Futures - - - - g) Other - - - -C. Banking book - other derivatives a) Options - - - - b) Interest rate swaps - - - - c) Cross currency swaps - - - - d) Equity swaps - - - - e) Forwards - - - - f) Futures - - - - g) Other - - - -Total 142,349 24 213,885 -

183FinecoBank · The Annual Report and Accounts as at December 31, 2013
A.5 Over the counter financial derivatives - regulatory trading book: notional values, positive and negative gross fair values by counterparty - contracts not covered by clearing agreements
CONTRACTS NOT INCLUDED IN NETTING AGREEMENTS
GOVERNMENTS AND CENTRAL
BANKSOTHER PUBLIC
ENTITIES BANKSFINANCIAL
COMPANIESINSURANCE COMPANIES
NON-FINANCIAL COMPANIES
OTHER ENTITIES
1. Debt securities and interest rate indexes
- notional value - - - - - - 384
- positive fair value - - - - - - 1
- negative fair value - - - - - - 1
- future exposure - - - - - - -
2. Equity instruments and share indices
- notional value - - 227 - - - 6,995
- positive fair value - - 23 - - - 111
- negative fair value - - 2 - - - 65
- future exposure - - 23 - - - 699
3. Currencies and gold - notional value - - 367,305 400 - 6,379 155,873
- positive fair value - - 472 - - 11 284
- negative fair value - - 399 - - - 81
- future exposure - - 96 4 - 64 1,510
4. Other instruments - notional value - - - - - - -
- positive fair value - - - - - - -
- negative fair value - - - - - - -
- future exposure - - - - - - -
A.6 Over the counter financial derivatives - regulatory trading book: notional values, positive and negative gross fair values by counterparty - contracts not covered by clearing agreements
No data to report.
A.7 Over the counter financial derivatives - banking book: notional values, positive and negative gross fair values by counterparty - contracts not covered by clearing agreements
CONTRACTS NOT INCLUDED IN NETTING AGREEMENTS
GOVERNMENTS AND CENTRAL
BANKSOTHER PUBLIC
ENTITIES BANKSFINANCIAL
COMPANIESINSURANCE COMPANIES
NON-FINANCIAL COMPANIES
OTHER ENTITIES
1. Debt securities and interest rate indexes
- notional value - - 5,705,390 - - - -
- positive fair value - - 123,143 - - - -
- negative fair value - - 141,801 - - - -
- future exposure - - 173 - - - -
2. Equity instruments and share indices
- notional value - - - - - - -
- positive fair value - - - - - - -
- negative fair value - - - - - - -
- future exposure - - - - - - -
3. Currencies and gold - notional value - - - - - - -
- positive fair value - - - - - - -
- negative fair value - - - - - - -
- future exposure - - - - - - -
4. Other instruments - notional value - - - - - - -
- positive fair value - - - - - - -
- negative fair value - - - - - - -
- future exposure - - - - - - -

184
Part E - Information on risks and hedging policies (Continued)
Notes to the Accounts
The Annual Report and Accounts as at December 31, 2013 · FinecoBank
A.8 Over the counter financial derivatives - banking book: notional values, positive and negative gross fair values by counterparty - contracts not covered by clearing agreements
No data to report.
A.9 Residual life of over-the-counter financial derivatives: notional values
UNDERLYING/UNEXPIRED TERMUP TO
1 YEARBETWEEN 1
AND 5 YEARSOVER
5 YEARS TOTAL
A. Regulatory trading book A.1 Financial derivatives on debt securities and interest rates 384 - - 384
A.2 Financial derivatives on equity instruments and share indices - - 7,222 7,222
A.3 Financial derivatives on exchange rates and gold 529,958 - - 529,958
A.4 Financial derivatives on other instruments - - - -
B. Banking book B.1 Financial derivative contracts on debt securities and interest rates 3,348,226 2,357,164 - 5,705,390
B.2 Financial derivatives on equity instruments and share indices - - - -
B.3 Financial derivatives on exchange rates and gold - - - -
B.4 Financial derivatives on other instruments - - - -
Total 31 December 2013 3,878,568 2,357,164 7,222 6,242,954Total 31 December 2012 177,315 7,211,952 - 7,389,267
A.10 Over the counter financial derivatives: Counterparty risk/financial risk - Internal modelsNo data to report.
B. Credit derivativesB.1 Credit derivatives: period-end and average notional amountsNo data to report.
B.2 OTC Credit derivatives: positive fair value - breakdown by productNo data to report.
B.3 OTC Credit derivatives: negative fair value - breakdown by productNo data to report.
B.4 OTC Credit derivatives: positive and negative gross fair values by counterparty - contracts not covered by clearing agreementsNo data to report.
B.5 OTC Credit derivatives: positive and negative gross fair values by counterparty - contracts covered by clearing agreementsNo data to report.
B.6. Credit derivatives residual life: notional valuesNo data to report.
B.7 Credit derivatives: Counterparty risk/financial risk - Internal modelsNo data to report.
C. Financial and credit derivativesC.1 Over the counter financial and credit derivatives: net fair values and future exposures by counterpartyNo data to report.
Section 3 - Liquidity Risk
QUALITATIVE INFORMATION
A. General aspects, management processes and measurement methods for liquidity riskLiquidity risk is defined as the risk that the Group may find itself unable to fulfil its current and future, expected or unexpected, payment obligations (by cash or delivery).The UniCredit group manages liquidity risk at centralised level and on a consolidated basis, in line with the regulations of the local Supervisory Authorities and with business requirements. FinecoBank is responsible for the correct implementation and observation of liquidity policies within the guidelines issued by the Parent Company, adjusting the net of its cash flows and transferring the surplus/shortfall to the Parent Company on a daily basis.FinecoBank’s main source of funding is the deposits of its customers.

185FinecoBank · The Annual Report and Accounts as at December 31, 2013
The Liquidity CentresThe “Group Liquidity Governance Guideline” issued by the Parent Company describes the organizational structures, functions and responsibilities of the Group and the Legal Entities regarding the management of liquidity.The Liquidity Centres are responsible for: • the liquidity management and concentration process of liquidity flows of the Legal Entities falling within their perimeter of responsibility; • the funding optimization carried out on the relevant local markets and are responsible for coordinating access to short term and medium long term
markets of the legal entities belonging to their perimeter; • the implementation of the Group’s liquidity rules at local level in line with Group’s Governance Guideline and Policy and local regulations.
The Parent Company, as the party responsible for supervision and control, also with regard to liquidity, steers, coordinates and controls all aspects relating to liquidity for the entire Group. The Parent Company, moreover, acts as the Liquidity Centre for Italy, which also includes FinecoBank.In addition to meeting local legal and regulatory requirements, through the Parent Company and under the supervision of Group Risk Management, FinecoBank adopts the metrics set at Group level, to ensure that the liquidity position meets the requirements established.
Roles and responsibilities Two main functions have been identified within FinecoBank for the management of the liquidity: the Risk Management function and the Treasury function each with different roles and responsibilities. In particular, the operational responsibilities reside in the Finance functions, while the Risk Management function has responsibilities of independent controls and independent reporting compared to the operational functions (in line with the requirements of Bank of Italy 263 Circular).
Risk measurement and reporting systemsThe Liquidity Policy issued by the Parent Company sets out the methods used to manage the quantitative aspects of liquidity risk.Liquidity risk, for its particular nature, is addressed by means of gap analyses, liquidity stress testing, and complementary measures (mainly through a set of ratios: e.g. loan to deposit, leverage).The Group’s Liquidity Framework is based upon the Liquidity Risk Mismatch Model which is characterized by the following fundamental principles: • Short-term liquidity risk management (operational liquidity), which considers the events that will impact upon the Group’s liquidity position from 1 day
up to one year. The primary objective is to maintain the Group’s capacity to fulfil its ordinary and extraordinary payment obligations while minimizing the relevant costs.
• Structural liquidity risk management (structural risk), which considers the events that will impact upon the Group’s liquidity position over one year. The primary objective is to maintain an adequate ratio between medium/long term liabilities and medium to long-term assets, with a view to avoiding pressures on short-term funding sources (both current and future), while in the meantime optimizing the cost of funding.
• Stress tests. Liquidity risk is a low probability, high impact event. Therefore, stress testing is an excellent tool to reveal potential vulnerabilities in the Balance Sheet. The Group uses several scenarios ranging from general market crisis to idiosyncratic crisis, and combinations hereof.
In this context, the Parent Company takes into account all of the assets, liabilities, off-balance sheet positions and present and future events which generate certain or potential cash flows for the Group, thereby protecting the Group Banks/Companies from risks related to the transformation of maturity.Given that the majority of FinecoBank’s balance sheet items have a maturity within the year, particularly attention is given to the management of operational liquidity. The management of short-term liquidity aims to maintain a sustainable balance between cash inflows and outflows, representing the basic and necessary condition for ensuring FinecoBank’s business continuity.All aspects of the framework are coordinated by the Italy Regional Liquidity Centre and the stress tests are fully centralised within this centre.
Behavioural models for asset and liability items The Group has developed specific behavioural models aimed at estimating the maturity profile of asset and liability items that do not have a contractual maturity; in fact, some items perceived as due on demand, are actually subject to sticky behaviour.More specifically, modelling of assets and liabilities aims to construct a replication profile that best reflects the behavioural characteristics of the items. An example is on demand items: estimates of the maturity profile reflect the perceived stickiness. These behavioural models are developed by the Planning, Finance and Administration function of the Parent Company and validated by the Risk Management function of the Parent Company. FinecoBank, within the Italy Regional Liquidity Centre, using these behavioural models.

186
Part E - Information on risks and hedging policies (Continued)
Notes to the Accounts
The Annual Report and Accounts as at December 31, 2013 · FinecoBank
QUANTITATIVE INFORMATION
1. Time breakdown by contractual residual maturity of financial assets and liabilities - Currency: Euro
ITEM/TIME BRACKETSON
DEMAND
BETWEEN 1 AND
7 DAYS
BETWEEN 7 AND
15 DAYS
BETWEEN 15 DAYS
AND 1 MONTH
BETWEEN 1 AND 3
MONTHS
BETWEEN 3 AND 6
MONTHS
BETWEEN 6 MONTHS
AND 1 YEAR
BETWEEN 1 AND 5
YEARSOVER 5 YEARS
INDEFINITE DURATION
On-balance sheet assetsA.1 Government securities - - - - 10,247 526 10,626 69,001 9 -
A.2 Debt securities - - - 251,567 39 5 159,865 2,853,252 31 -
A.3 Units in investment funds 1,936 - - - - - - - - -
A.4 Loans
- Banks 8,954,935 66,084 73,406 118,211 383,752 949,331 1,844,958 20,000 - 124,010
- Customers 136,660 37,860 190,406 62,743 78,318 19,173 30,066 77,864 3,974 -
On-balance sheet liabilitiesB.1 Deposits and current
accounts
- Banks 27,627 - - - - - - - - -
- Customers 10,205,406 36,263 33,795 57,594 316,418 462,710 780,357 13,336 - -
B.2 Debt securities - - - - - - - 2,250,000 - -
B.3 Other liabilities 58,251 23,911 18,406 13,207 134,264 693,534 1,015,033 - - -
Off-balance sheet transactionsC.1 Financial derivatives
with exchange of capital
- Long positions - 139,545 - - 125 135 34 15,954 22,275 100
- Short positions - 141,093 - - 10 135 34 15,954 22,393 100
C.2 Financial derivatives without exchange of capital
- Long positions 102 - - - 21,361 21,506 41,847 - - -
- Short positions 77 - 45 842 19,884 20,006 49,286 - - -
C.3 Deposits and loans to be collected
- Long positions - - - - - - - - - -
- Short positions - - - - - - - - - -
C.4 Irrevocable commitments to lend funds
- Long positions - - - - - - - 716 - -
- Short positions - - - 716 - - - - - -
C.5 Financial guarantees given - - - - - - - - - -
C.6 Financial guarantees received - - - - - - - - - -
C.7 Credit derivatives with exchange of capital
- Long positions - - - - - - - - - -
- Short positions - - - - - - - - - -
C.8 Credit derivatives without exchange of capital
- Long positions - - - - - - - - - -
- Short positions - - - - - - - - - -

187FinecoBank · The Annual Report and Accounts as at December 31, 2013
Currency: US dollar
ITEM/TIME BRACKETSON
DEMAND
BETWEEN 1 AND
7 DAYS
BETWEEN 7 AND
15 DAYS
BETWEEN 15 DAYS
AND 1 MONTH
BETWEEN 1 AND 3
MONTHS
BETWEEN 3 AND 6
MONTHS
BETWEEN 6 MONTHS
AND 1 YEAR
BETWEEN 1 AND 5
YEARSOVER 5 YEARS
INDEFINITE DURATION
On-balance sheet assetsA.1 Government securities - - - - - - - - - -
A.2 Debt securities - - - - - - - 72,511 - -
A.3 Units in investment funds - - - - - - - - - -
A.4 Loans
- Banks 426,611 - - - 10,889 - 1,658 - - -
- Customers 1,414 3,423 244 1,745 10,675 - 124 49 - -
On-balance sheet liabilitiesB.1 Deposits and current
accounts
- Banks - - - - - - - - - -
- Customers 418,196 - - - - - - - - -
B.2 Debt securities - - - - - - - 72,511 - -
B.3 Other liabilities 3,912 4,473 670 2,168 11,685 4,569 6,997 - - -
Off-balance sheet transactionsC.1 Financial derivatives
with exchange of capital
- Long positions - 81,705 - - - - - 73 31 -
- Short positions - 80,441 - - - - - 73 31 -
C.2 Financial derivatives without exchange of capital
- Long positions 394 - - - 1,115 1,145 2,326 - - -
- Short positions 249 - - - 1,127 1,132 2,287 - - -
C.3 Deposits and loans to be collected
- Long positions - - - - - - - - - -
- Short positions - - - - - - - - - -
C.4 Irrevocable commitments to lend funds
- Long positions - - - - - - - - - -
- Short positions - - - - - - - - - -
C.5 Financial guarantees given - - - - - - - - - -
C.6 Financial guarantees received - - - - - - - - - -
C.7 Credit derivatives with exchange of capital
- Long positions - - - - - - - - - -
- Short positions - - - - - - - - - -
C.8 Credit derivatives without exchange of capital
- Long positions - - - - - - - - - -
- Short positions - - - - - - - - - -

188
Part E - Information on risks and hedging policies (Continued)
Notes to the Accounts
The Annual Report and Accounts as at December 31, 2013 · FinecoBank
Currency: other currencies
ITEM/TIME BRACKETSON
DEMAND
BETWEEN 1 AND
7 DAYS
BETWEEN 7 AND
15 DAYS
BETWEEN 15 DAYS
AND 1 MONTH
BETWEEN 1 AND 3
MONTHS
BETWEEN 3 AND 6
MONTHS
BETWEEN 6 MONTHS
AND 1 YEAR
BETWEEN 1 AND 5
YEARSOVER 5 YEARS
INDEFINITE DURATION
On-balance sheet assetsA.1 Government securities - - - - - - - - - -
A.2 Debt securities - - - - - - - - - -
A.3 Units in investment funds - - - - - - - - - -
A.4 Loans
- Banks 57,290 5 - 91 - - 121 - - -
- Customers 1,012 25 15 47 342 - - - - -
On-balance sheet liabilitiesB.1 Deposits and current
accounts
- Banks 1,512 - - - - - - - - -
- Customers 55,915 - - - - - - - - -
B.2 Debt securities - - - - - - - - - -
B.3 Other liabilities 9 7 - 6 47 - - - - -
Off-balance sheet transactionsC.1 Financial derivatives
with exchange of capital
- Long positions - 3,596 - - - - - 11 - -
- Short positions - 3,250 - - - - - 11 - -
C.2 Financial derivatives without exchange of capital
- Long positions 411 - - - - - - - - -
- Short positions 246 - - - - - - - - -
C.3 Deposits and loans to be collected
- Long positions - - - - - - - - - -
- Short positions - - - - - - - - - -
C.4 Irrevocable commitments to lend funds
- Long positions - - - - - - - - - -
- Short positions - - - - - - - - - -
C.5 Financial guarantees given - - - - - - - - - -
C.6 Financial guarantees received - - - - - - - - - -
C.7 Credit derivatives with exchange of capital
- Long positions - - - - - - - - - -
- Short positions - - - - - - - - - -
C.8 Credit derivatives without exchange of capital
- Long positions - - - - - - - - - -
- Short positions - - - - - - - - - -

189FinecoBank · The Annual Report and Accounts as at December 31, 2013
2. Disclosure on committed assets recognised in the financial statements
TYPE
COMMITTED NOT COMMITTED
12.31.2013 12.31.2012VB FV VB FV
1. Cash and cash balances - X 5 X 5 7
2. Debt securities 1,995,984 2,027,613 1,419,790 1,477,749 3,415,774 4,295,621
3. Equity instruments - - 28 28 28 372
4. Loans 34,023 X 13,615,523 X 13,649,546 13,599,270
5. Other financial assets - X 183,895 X 183,895 80,679
6. Non-financial assets - X 432,949 X 432,949 314,821
Total 31 December 2013 2,030,007 2,027,613 15,652,190 1,477,777 17,682,197 XTotal 31 December 2012 2,496,059 2,408,360 15,794,711 1,788,266 X 18,290,770
3. Disclosure on committed owned assets not recognised in the financial statements
TYPE COMMITTED NOT COMMITTED 12.31.2013 12.31.2012
1. Financial assets - -
- Securities 1,752,187 2,456,016 4,208,203 3,882,119
- Other - - - -
2. Non-financial assets - - - -
Total 31 December 2013 1,752,187 2,456,016 4,208,203 XTotal 31 December 2012 2,307,144 1,574,975 X 3,882,119
The column “Not committed” of the above table also shows the bonds issued by the Bank repurchased at a fair value of €2,329,626 thousand (€1,501,000 thousand as at December 31, 2012).
No European Central Bank refinancing operations have been undertaken.
Assets received as guarantees or on loan within repo and securities lending transactions
12.31.2013 12.31.2012
Fair value of securities as guarantee for repo transactions and securities lending with cash guarantee 173,381 319,608
Fair value of securities received on loan 1,705,195 2,061,511
Of which fair value of securities delivered through repos and securities lending with cash guarantee (1,752,187) (2,307,144)
Section 4 - Operational risk
QUALITATIVE INFORMATION
A. General aspects, operational processes and methods for measuring operational riskOperational riskOperational risk is defined as the risk of losses due to errors, violations, interruptions, or damage caused by internal processes, personnel, systems or by external events. This definition includes legal and compliance risk, but not strategic and reputational risk.For example, losses arising from the following can be defined as operational: internal or external fraud, employment practices and workplace safety, customer claims, product distribution, fines and penalties for regulatory breaches, damage to the Company’s physical assets, business disruption and system failures, and management of processes.
Group operational risk frameworkThe recognition, measurement, control and management of operational risk are carried out according to the principles established by Basel II in the “New Basel agreement on Capital” and in line with the “New regulations for the prudential supervision of banks” (Bank of Italy Circular no. 263 of December 27, 2006 as amended), which incorporate instructions on international convergence for the measurement of capital and of capital ratios. These principles and provisions have been set out in the Group Framework for the management of operational risk and adopted in FinecoBank’s Operational Risk Manual approved by the Board of Directors. The methodology for data classification and completeness verification, scenario analysis, risk indicators, reporting and capital at risk measurement is set by the Parent Company’s Group Operational & Reputational Risks department and applies to FinecoBank as a Group Legal Entity. A pivot element of the risk control framework is the operational risk management application, allowing the collection of the data required for operational risk control and capital measurement.The compliance of the risk control and measurement system with external regulations and Group standards is assessed through an internal validation process, under the responsibility of the Group Internal Validation department of the Parent Company, which is independent from the Group Operational & Reputational Risks department.FinecoBank has obtained the approval of the Bank of Italy for the use of advanced approaches (AMA) to calculate its capital requirement for operational risk with effect from June 30, 2010.

190
Part E - Information on risks and hedging policies (Continued)
Notes to the Accounts
The Annual Report and Accounts as at December 31, 2013 · FinecoBank
Organisational structureThe Strategic Direction Body is responsible for approving all aspects relating to the Group operational risk framework and verifying the adequacy of the measurement and control system and is regularly updated on changes to the risk profile and operational risk exposure, with support from the appropriate risk committees if required.In addition to the Strategic Direction Body, the corporate governance structure for operational risk consists of the Risks Committee - introduced from June 24, 2009 - which examines all risk issues submitted to it, and approves and validates the internal procedures and operating manuals for operational risk.The reports produced by Risk Management for the Risks Committee and for the Board of Directors ensure that management and the control bodies are constantly updated on the trend in operational risk within the Bank and can actively intervene in the management and mitigation of the risks. The Chief Risk Officer’s participation in the Products Committee ensures oversight of the operational risk associated with the Bank’s new business activities. The Operational Risk Management (ORM) team is part of the broader Risk Management office which reports to the Chief Risk Officer of FinecoBank who in turn reports directly to the Managing Director.The main activities carried out by the Risk Management office in terms of operational risk are:• recognition, classification, validation and reporting of operating losses with consequent identification of problem areas;• assessment of potential risks through scenario analyses and risk indicators (Key Risk Indicator-KRI);• monitoring and optimisation of the internal control system;• policies to mitigate and transfer risk through insurance cover;• development of an operational risk culture within the Bank;• generating reports for Senior Management on risk trends.
Internal validation processIn compliance with external regulations, the operational risk control and measurement system is subject to an internal validation process established by the Parent Company, in order to verify its compliance with minimum requirements and Group standards. This process is owned by the Pillar 2 Risks and Operational Risk Validation unit, within the Group Internal Validation department.The use of the Advanced Measurement Approach (AMA) to calculate regulatory capital requires the preparation of an annual report on the management and control system for operational risk by the Operational Risk team. This annual Report contains a self-assessment of the system and a detailed examination of the governance structure, the process for collecting data on losses, the scenario analyses and internal control system, as well as the operational use of the measurement system.The Report is submitted to the approval of the Board of Directors and is validated by the Internal Audit department and Group GIV (Group Internal Validation). For 2013, the Internal Audit department and Group GIV confirmed that the level of risk monitoring was good, as well as the adequacy of the existing management and control system.
Operational risk managementOperational risk management consists of the review of processes to reduce the risks found and the management of the related insurance policies, with the identification of the suitable deductibles and limits.The Risks Committee and the Product Committee, from September 2011, have been joined by a Permanent Work Group (PWG), whose members include the CRO, the Risk Manager and the Organisation function aimed at sharing their respective expertise in relation to the projects planned or in under way, new processes and products, or changes to them, and anything else that may affect the Bank’s risk profile. The PWG’s ultimate objective is to identify and then develop new mitigation measures.As part of the prevention of operational risk and to control sales channels remotely, the Risk Management office has focused on fraud prevention measures. The development of remote monitoring to prevent fraud has led to the creation of a system called System of Fraud Identification and Analysis (SoFIA). This system enables a larger amount of data and information on individual indicators to be analysed at the same time and enables possible irregularities to be detected on a daily basis through an alert system.In this way, all of the names put forward to be checked are assessed at the same time with regard to all remote indicators (30 indicators).On the basis of qualitative and quantitative assessments of these indicators, the assigned staff select any cases that need to be reported to the Network Controls Department, Monitoring and Network Services Department - reporting directly to the Managing Director - for subsequent examination.Moreover, the Operational Risk team is updated annually on the results of the tests conducted in accordance with the Business Continuity and Disaster Recovery plans.
Risk capital measurement and allocation mechanismOperational risk is measured internally by means of:• collecting data on losses;• monitoring Key Risk Indicators (KRI);• scenario analyses;• remote control of sales channels.
The collection and classification of operating losses is managed by a Group system called Application for Risk Gauging On line (ARGO).In addition to internal prevention and improvement, the information gathered is used to calculate Pillar 1 and 2 capital requirements.

191FinecoBank · The Annual Report and Accounts as at December 31, 2013
In terms of key risk indicators, there are currently 47 risk indicators split into nine control areas (Legal, Claims, Credit Cards, Back Office, PFA, IT systems, Payment Systems, Current Accounts, HR) which the Bank uses to measure its exposure to operational risk. If an indicator shows an irregular value, this may be related to changes in the exposure to operational risk. Scenario analyses enable FinecoBank’s exposure to operational risk, characterised by low frequency but high potential impact, to be estimated. The scenarios are identified by analysing internal losses, external events, risk indicator trends, critical processes, products and risk classes.The inclusion of the data generated through the analyses of the scenario and of the trend of risk indicators are a forward-looking element of the risk capital calculation model.Data collection and control is managed at local level, while the management and maintenance of the model to calculate regulatory capital is centralised for all Legal Entities of the Group at the Parent Company.The risk capital for operational risk used for regulatory purposes as at December 31, 2013, amounted to €64,912 thousand.
Risks arising from significant legal proceedingsFinecoBank is involved in legal proceedings, which are individually insignificant, for which there is considerable uncertainty regarding the outcome and the amount of any possible charges. Where it is possible to reliably estimate the amount of possible charges and the charges are considered likely, provisions have been made in an appropriate amount based on the circumstances and consistent with international accounting standards. Specifically, to cover these obligations, as well as complaints from customers that have not yet resulted in legal proceedings, as at December 31, 2013, FinecoBank had a provision in place for risks and charges of €55,578 thousand.
Risks arising from tax disputes and auditsRisks arising from tax disputes or audits as at December 31, 2013 referred to:• a notice pertaining to 2003, challenging the use of tax credits of €2.3 million, for which the bank has submitted an appeal to the Court of Cassation,
deeming its position to be sound. The bank has already paid the additional taxes, penalties and interest due. In relation to this dispute, the charge for the additional taxes and the penalty have been recorded in the income statement as a contra entry to tax provisions and the provision for risks and charges. A tax credit has also been recorded in the amount paid;
• a notice pertaining to 2007, challenging the deductibility of costs relating to an acquired company of €1.6 million, for which the bank has submitted an appeal to the Province Tax Commission, deeming that said costs are deductible. For this dispute, the taxes and penalties have already been posted to the income statement as a balancing entry of tax provisions and the provision for risks and charges;
• a tax audit concluded in 2013 relating to the years 2008-2011, which challenges extraordinary transactions and costs deducted totalling €6.2 million. This audit was followed by a notice only for the year 2008. As regards the extraordinary transaction, the Bank submitted an appeal to the Milan Province Tax Commission, deeming its position to be sound, while for the non-deductible costs, it submitted a request for a tax settlement proposal to the Italian Revenue Agency - Milan. Provisions were allocated with a view to a reasonable solution to the controversy, marked by particularly misleading and specious claims.
In relation to the above, as at December 31, 2013, FinecoBank had allocated provisions in amounts deemed suitable, given the specific circumstances, and in line with the international accounting standards: tax provisions totalling €10.1 million and a provision for risks and charges for penalties and interest totalling €7.4 million.
QUANTITATIVE INFORMATION
Internal operating loss data is the main component used to calculate capital requirements against operational risk. Loss analyses enable the ORM team to make assessments on FinecoBank’s exposure to operational risk and to identify any critical areas.As at December 31, 2013, operating losses recorded in the accounts amounted to €13,5 million. The main source of operating losses by the event types established in the New Basel II Agreement, which generated them, is shown below:• Internal fraud: losses due to unauthorised activities, fraud, embezzlement or infringement of laws, regulations or company directives that involve at
least one internal staff member of the bank or a resource hired under an agency contract;• External fraud: losses owing to fraud, embezzlement or violation of laws by subjects external to the bank;• employment practices and workplace safety: losses due to actions not compliant with the law or to agreements regarding employment, health and
safety, to the payment of compensation for bodily harm, or to cases of discrimination or non-application of equality conditions;• customers, products and professional practices: losses arising from non-fulfilment of professional obligations towards customers or from the nature
or characteristics of the products or services provided;• damage from external events: losses arising from external events, including natural disasters, acts of terrorism and vandalism;• business disruption and system failures: losses owing to business disruption and system failures or interruptions;• process management, execution and delivery: losses due to deficiencies in the completion of transactions or management of processes, as well as
losses due to relations with commercial counterparties, vendors and suppliers.In 2013 the main sources of loss were attributable to provisions or loss expenses relating to complaints and legal action brought by customers against the Bank due to conduct linked to alleged misappropriation by personal financial advisers.

192
Part E - Information on risks and hedging policies (Continued)
Notes to the Accounts
The Annual Report and Accounts as at December 31, 2013 · FinecoBank
Section 5 - Other risks and informationAlthough the types of risk described above represent the main categories, there are, other types that FinecoBank considers important. As part of the provisions of Basel II Pillar 2, FinecoBank - with the support of the Parent Company - has identified other types of risk in addition to the credit, market, operational and liquidity risk described above:• Business risk is defined as adverse, unexpected changes in business volume and/or margins that are not due to credit, market and operational
risks. Business risk can result, above all, from a serious deterioration in the market environment, changes in the competitive situation or customer behaviour, but may also result from changes in the legal framework;
• Strategic risk is the risk of suffering potential losses due to decisions or radical changes in the business environment, improper implementation of decisions, lack of responsiveness to changes in the business environment, which result in negative impacts to the risk profile, capital and earnings as well as the overall direction and scope of a bank over the long run;
• Reputational risk, which represents the current or future risk of a fall in profits resulting from a negative perception of the Bank’s image by Customers, counterparties, shareholders, investors or Supervisory Authorities.
FinecoBank has not included Real Estate Risk within the Bank’s scope of risk, because it does not hold significant positions in real estate, nor does it include Financial Investment Risk, as it does not possess large non-speculative financial investments in companies external to the Group.Following the identification of the significant risks, the Parent Company establishes the best way to analyse them in qualitative and quantitative terms. The quantitative measurement is carried out by the Parent Company using data sent by FinecoBank and is used to calculate the Internal Capital.Credit, market, operational and business risks are measured quantitatively by the Parent Company, using: • economic capital, calculation of the benefit of diversification and aggregation as a component of internal capital (including prudential cushion for
model risk and variability of the economic cycle); • Stress tests.
Internal Capital is the capital set aside as a buffer against the potential losses inherent in the Group’s business activities and it takes into consideration all risk types identified by the Group as quantified in terms of Economic Capital in line with Pillar 2 requirements. For control purposes, Internal Capital is calculated quarterly by the Parent Company based on the periodic figures sent by FinecoBank; it is also projected for budgeting purposes. The multi-dimensional nature of risk makes it necessary to supplement the measurement of economic capital with stress testing, not only in order to estimate losses in certain scenarios, but also to ascertain the impact of their determinants. The stress test is one of the instruments used control significant risks in order to assess the Bank’s vulnerability to “exceptional but plausible” events, providing additional information to the monitoring activities. Stress testing, in accordance with regulatory requirements, is conducted on the basis of a set of internally defined stress scenarios and is performed at least twice a year by specific Parent Company functions.
ICAAP - Internal Capital Adequacy Assessment ProcessMeasuring the risk profile is a fundamental element of the Internal Capital Adequacy Assessment Process under Basel II Pillar 2. The Group’s approach to ICAAP relies on the definition of the “Risk Governance”, as a preliminary requirement, while the process consists of following phases: • defining the scope and identifying the risks; • assessing the risk profile; • defining risk appetite and capital allocation; • monitoring and reporting.
Capital adequacy is assessed considering the balance between the assumed risk, both Pillar 1 and Pillar 2, and the available capital. With respect to Pillar 2, the relevant metric is the Risk Taking Capacity, which is the ratio between available capital (Available Financial Resources, AFR) and Internal Capital.The main elements of the internal process for determining capital adequacy include the setting and monitoring of the risk appetite. The risk appetite is defined as the level of risk that the Bank is willing to accept for the pursuit of its strategic objectives and business plan, taking into account the interests of its Customers and its Shareholder, capital requirements and other requirements. The main objectives of the risk appetite are:• explicitly assessing the risks, and their interconnections at local and Group level, that the Bank decides to assume (or avoid) in a long-term
perspective;• specifying the types of risk that the Bank intends to assume, setting targets, triggers and limits under both normal operating and stress conditions;• snsuring a risk-return profile “ex-ante” consistent with sustainable long-term growth, as defined by the return forecasts of the strategic plan/budget;• snsuring that the business developed within the limits of risk tolerance established by the Board of Directors of FinecoBank, in accordance with the
applicable national and international regulations;• supporting discussions on future policy options with regard to the risk profile;• guiding the vision of internal and external stakeholders towards a risk profile consistent with the strategic plan;• providing qualitative descriptions for risks that are difficult to quantify (e.g. strategic, reputational, compliance) to strategically guide the review of
processes and the internal control system.

193FinecoBank · The Annual Report and Accounts as at December 31, 2013
The risk appetite includes a statement and a set of KPIs. The Statement sets out the Bank’s positioning in terms of strategic objectives and associated risk profiles, while the KPIs are designed to quantitatively measure the Bank’s in the following categories:• risk ownership • regulatory requirements; • profitability and risk; • control over specific types of risk.For each KPI respective thresholds are identified, consisting of targets, triggers and limits. The setting of the thresholds is evaluated on a case-by-case basis, also through managerial decisions by the Board of Directors of FinecoBank, in compliance with the regulatory requirements and of the supervisory bodies and considering the consistency with the Group risk appetite.The metrics are the subject of regular monitoring and reporting, at least quarterly. The monitoring, be competence, is carried out by the CRO Department, the CFO Department and the Italy Liquidity Centre (Parent Company).
Glossary
Available financial resources (AFR)
AFR are the resources that can be used to safeguard the bank from insolvency. The AFR are an economic measure that consider the potential reserves, hybrid debt instruments, IFRS reserves, goodwill and other intangible assets, treasury shares held and the expected profits.
Economic capital Capital level that is required to cover the losses that may occur with at a time horizon of one year and a certain probability or confidence level. Economic Capital is a measure of the variability of the Expected Loss of the portfolio and depends on the degree of diversification of the portfolio itself.
Internal Capital Represents the amount of capital required to cover potential losses and is required to support the business activities and positions held. Internal Capital is the sum of the aggregated Economic Capital and a cushion that considers the effects of the cycle and model risk.
Core Tier 1 Ratio The percentage of a bank’s Tier 1 Capital to its risk weighted assets. Tier 1 capital also consists of:• paid in capital;• reserves (including share premium);• retained earnings.
Cost of Risk The ratio between loan loss provisions and loans and receivables with customers. It is one of the indicators of the bank assets’ level of risk: the lower the ratio, the less risky the bank assets.
Credit Quality - EL EL%= EL/EADRepresents the expected loss as a percentage of the exposure in the event of default (EAD) of the performing portfolio.The perimeter is the customers of the performing portfolio.
Funding Provision, in various forms, of the funds necessary to finance business activities or particular financial transactions.
Key Risk Indicators The risk indicators are quantitative metrics that reflect exposure to Operational Risks of specific processes or products: the value expressed by an indicator should be related to changes in risk levels.
Leverage Ratio The leverage ratio is the ratio between the total assets net of intangible assets and shareholders’ equity, net of intangible assets.
Model Risk Category The MRCs have been introduced at the group level in order to characterize the types of operational loss in more detail. They are obtained from the combination of the seven event types established by Basel II with one or more of products offered to customers.
Banking book The set of positions other than those included in the regulatory trading portfolio are recorded in the banking book.
Trading Book Positions held for trading are those held intentionally for a subsequent sale in the near term and/or assumed with the intention of benefiting, in the short term, from the differences between buying and selling prices, or other price or interest rate interest variations.
Risk Taking Capacity Ration between Available Financial Resources and Internal Capital.Includes a prudential buffer (cushion).
RWA - Risk Weighted Assets
RWA: On-balance sheet assets and off-balance sheet assets (derivatives and guarantees) classified and weighted by different coefficients referring to risks, following banking rules issued by local Supervisors (i.e. Banca d’Italia, Bafin, etc.), to calculate solvency ratios.
Sensitivity The greater or lesser degree of sensitivity with which certain assets or liabilities react to changes in rates or other reference parameters.
Sensitivity Analysis Sensitivity analysis quantifies the change in value of a financial portfolio resulting from an unfavourable change in major risk factors (interest rate, exchange rate, equity).
Tier 1 Capital The most reliable and liquid part of a bank’s capital, as defined by regulatory rules.
Total Capital Ratio The percentage of a bank’s Tier 1 and Tier 2 capital to its risk weighted assets. Tier 2 capital consists of:• valuation reserves;• innovative capital and hybrid instruments.
Value at Risk A method used for quantifying risk. It measures potential future losses which will not be exceeded within a specified period and with a specified probability.


195FinecoBank · The Annual Report and Accounts as at December 31, 2013
Section 1 - Bank’s shareholders’ equity 196Section 2 - Regulatory capital and ratios 197
Part F - Shareholders’ Equity

196
Notes to the Accounts
The Annual Report and Accounts as at December 31, 2013 · FinecoBank
Section 1 - Bank’s shareholders’ equity
A. QUALITATIVE INFORMATIONThe management and allocation of capital (regulatory and economic), aimed at ensuring that the amount of capital and the related ratios are consistent with the risk profile assumed and comply with regulatory provisions, is carried out at Group level, given that the quality and the amount of capital resources of the individual Group companies are established on the basis of more general Group objectives.The purpose of capital management is to define the target level of capitalisation of the Group and of its companies in compliance with regulatory constraints and risk appetite. As regards dynamic capital management, the Parent Company draws up a financial plan and monitors the capital and regulatory ratios, anticipating any appropriate action needed to reach the objectives. Monitoring refers, on one hand, to both shareholders’ equity and the composition of regulatory capital and, on the other hand, to the planning and performance of risk-weighted assets (RWA).
B. QUANTITATIVE INFORMATION
B.1 Bank’s shareholders’ equity: breakdown
AMOUNT 12.31.2013 AMOUNT 12.31.2012
1. Share capital 200,070 200,070
2. Share premium reserve 1,934 1,934
3. Reserves
- from profits
a) legal 28,800 22,527
b) statutory - -
c) treasury shares - -
d) other 98,915 93,778
- other - -
4. Equity instruments - -
5. (Treasury shares) - -
6. Revaluation reserves
- Available-for-sale financial assets 641 285
- Property, plant and equipment - -
- Intangible assets - -
- Hedging instruments of foreign investments - -
- Cash flow hedges - -
- Exchange differences - -
- Non-current assets classified as held for sale - -
- Actuarial gains (losses) on defined benefits plans 3,573 3,407
- Revaluation reserves for associates carried at equity - -
- Special revaluation laws - -
7. Net Profit (Loss) for the year 85,216 125,467
Total 419,149 447,468
Figures as at December 31, 2012 differ from figures reported in the annual report at that date due to the retroactive application of IAS 19R, which increased Shareholders’ equity (under the item Revaluation reserves) by €3,407 thousand, as described in Part A - Accounting Policies of Section 2 - General Criteria for preparing the Notes to the Accounts.
B.2 Revaluation reserves for available-for-sale financial assets: breakdown
ASSET/AMOUNT
TOTAL 12.31.2013 TOTAL 12.31.2012
POSITIVE RESERVE NEGATIVE RESERVE POSITIVE RESERVE NEGATIVE RESERVE
1. Debt securities 673 (32) 300 (15)
2. Equity instruments - - - -
3. Units in investment funds. - - - -
4. Loans - - - -
Total 673 (32) 300 (15)
Part F - Shareholders’ Equity (Amounts in € thousand)

197FinecoBank · The Annual Report and Accounts as at December 31, 2013
B.3 Revaluation reserves for available-for-sale financial assets: annual changes
DEBT SECURITIES EQUITY INSTRUMENTSUNITS IN
INVESTMENT FUNDS LOANS
1. Opening balances 285 - - -2. Increases 2.1 Fair value increases 564 - - -
2.2 Reclassification through profit or loss of negative reserves
- from impairment - - - -
- from disposal - - - -
2.3 Other increases - - - -
3. Decreases 3.1 Fair value reductions (32) - - -
3.2 Impairment losses - - - -
3.3 Reclassification through profit or loss of positive reserves
- from disposal (176) - - -
3.4 Other increases - - - -
4. Closing balance 641 - - -
B.4 Revaluation reserves for defined benefit plans: annual changes ACTUARIAL GAINS (LOSSES) ON
DEFINED BENEFITS PLANS
1. Opening balances 3,4072. Increases 2.1 Fair value increases 282
2.2 Other increases -
3. Decreases 3.1 Fair value reductions (116)
3.2 Other increases -
4. Closing balances 3,573
Section 2 - Regulatory capital and ratios
2.1 Regulatory capitalA. Qualitative informationRegulatory capital is calculated on a quarterly basis in accordance with supervisory regulations. The results are reported to the Parent Company’s Board of Directors. As at December 31, 2013, the Bank’s regulatory capital stood at €316,008 thousand and satisfied the mandatory prudential requirements established by current Bank of Italy regulations. Regulatory capital and total risk-weighted assets were calculated by applying current supervisory provisions on the basis of accounting figures prepared in accordance with international accounting standards.
12.31.2013 12.31.2012
Tier 1 capital 316,008 251,095
Tier 2 capital - -
Items to be deducted - -
Regulatory capital 316,008 251,095
1. Tier 1 capitalThe positive elements of Tier 1 capital are represented by the share capital, made up of 606,274,033 ordinary shares of a nominal value of €0.33 each, the share premium reserve of €1,934 thousand, the legal, extraordinary and other profit reserves of €127,715 thousand, the share of the profit for 2013, amounting to €63,209 thousand, which the Bank’s strategic supervisory and management bodies intend to allocate to reserves, and the positive and negative prudential filters introduced following the amendment of IAS 19 with respect to defined benefit plans totalling €169 thousand.The negative elements of Tier 1 capital are represented by the book value of goodwill, less any deferred tax liabilities, of €69,075 thousand, and other intangible assets of €8,014 thousand.
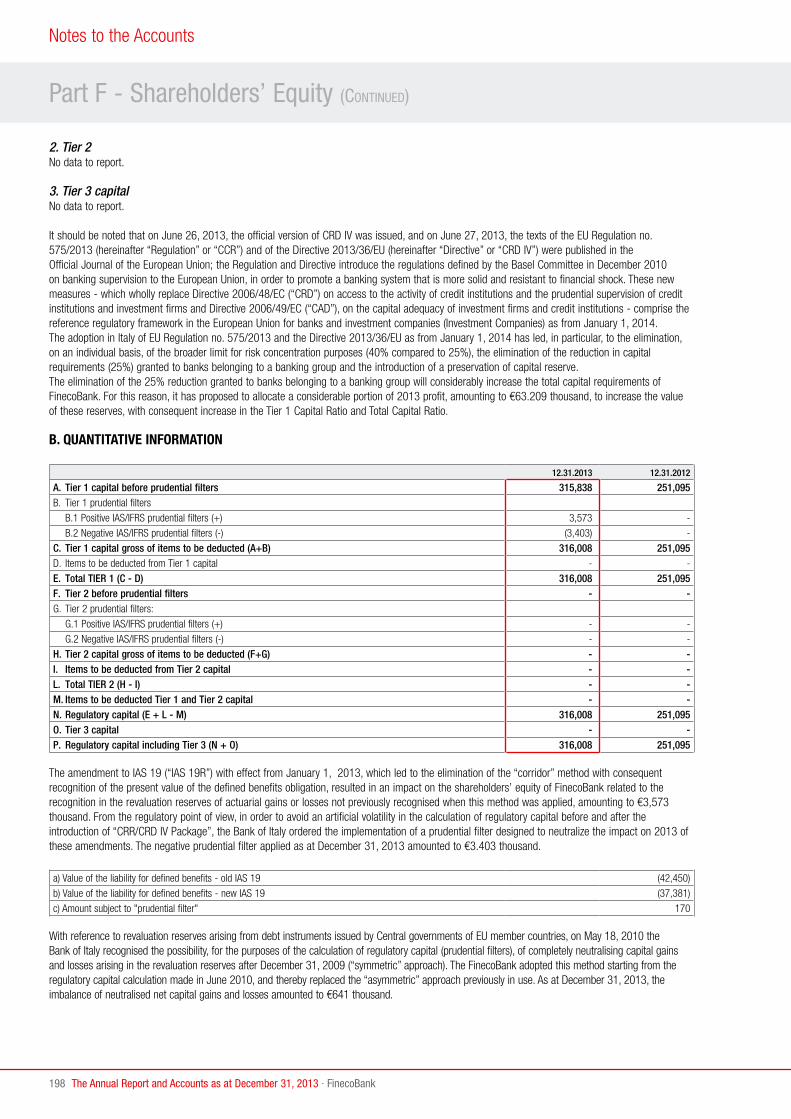
198
Part F - Shareholders’ Equity (Continued)
Notes to the Accounts
The Annual Report and Accounts as at December 31, 2013 · FinecoBank
2. Tier 2No data to report.
3. Tier 3 capitalNo data to report.
It should be noted that on June 26, 2013, the official version of CRD IV was issued, and on June 27, 2013, the texts of the EU Regulation no. 575/2013 (hereinafter “Regulation” or “CCR”) and of the Directive 2013/36/EU (hereinafter “Directive” or “CRD IV”) were published in the Official Journal of the European Union; the Regulation and Directive introduce the regulations defined by the Basel Committee in December 2010 on banking supervision to the European Union, in order to promote a banking system that is more solid and resistant to financial shock. These new measures - which wholly replace Directive 2006/48/EC (“CRD”) on access to the activity of credit institutions and the prudential supervision of credit institutions and investment firms and Directive 2006/49/EC (“CAD”), on the capital adequacy of investment firms and credit institutions - comprise the reference regulatory framework in the European Union for banks and investment companies (Investment Companies) as from January 1, 2014.The adoption in Italy of EU Regulation no. 575/2013 and the Directive 2013/36/EU as from January 1, 2014 has led, in particular, to the elimination, on an individual basis, of the broader limit for risk concentration purposes (40% compared to 25%), the elimination of the reduction in capital requirements (25%) granted to banks belonging to a banking group and the introduction of a preservation of capital reserve.The elimination of the 25% reduction granted to banks belonging to a banking group will considerably increase the total capital requirements of FinecoBank. For this reason, it has proposed to allocate a considerable portion of 2013 profit, amounting to €63.209 thousand, to increase the value of these reserves, with consequent increase in the Tier 1 Capital Ratio and Total Capital Ratio.
B. QUANTITATIVE INFORMATION
12.31.2013 12.31.2012
A. Tier 1 capital before prudential filters 315,838 251,095B. Tier 1 prudential filters
B.1 Positive IAS/IFRS prudential filters (+) 3,573 -
B.2 Negative IAS/IFRS prudential filters (-) (3,403) -
C. Tier 1 capital gross of items to be deducted (A+B) 316,008 251,095D. Items to be deducted from Tier 1 capital - -
E. Total TIER 1 (C - D) 316,008 251,095F. Tier 2 before prudential filters - -G. Tier 2 prudential filters:
G.1 Positive IAS/IFRS prudential filters (+) - -
G.2 Negative IAS/IFRS prudential filters (-) - -
H. Tier 2 capital gross of items to be deducted (F+G) - -I. Items to be deducted from Tier 2 capital - -L. Total TIER 2 (H - I) - -M. Items to be deducted Tier 1 and Tier 2 capital - -N. Regulatory capital (E + L - M) 316,008 251,095O. Tier 3 capital - -P. Regulatory capital including Tier 3 (N + O) 316,008 251,095
The amendment to IAS 19 (“IAS 19R”) with effect from January 1, 2013, which led to the elimination of the “corridor” method with consequent recognition of the present value of the defined benefits obligation, resulted in an impact on the shareholders’ equity of FinecoBank related to the recognition in the revaluation reserves of actuarial gains or losses not previously recognised when this method was applied, amounting to €3,573 thousand. From the regulatory point of view, in order to avoid an artificial volatility in the calculation of regulatory capital before and after the introduction of “CRR/CRD IV Package”, the Bank of Italy ordered the implementation of a prudential filter designed to neutralize the impact on 2013 of these amendments. The negative prudential filter applied as at December 31, 2013 amounted to €3.403 thousand.
a) Value of the liability for defined benefits - old IAS 19 (42,450)
b) Value of the liability for defined benefits - new IAS 19 (37,381)
c) Amount subject to "prudential filter" 170
With reference to revaluation reserves arising from debt instruments issued by Central governments of EU member countries, on May 18, 2010 the Bank of Italy recognised the possibility, for the purposes of the calculation of regulatory capital (prudential filters), of completely neutralising capital gains and losses arising in the revaluation reserves after December 31, 2009 (“symmetric” approach). The FinecoBank adopted this method starting from the regulatory capital calculation made in June 2010, and thereby replaced the “asymmetric” approach previously in use. As at December 31, 2013, the imbalance of neutralised net capital gains and losses amounted to €641 thousand.

199FinecoBank · The Annual Report and Accounts as at December 31, 2013
Reconciliation of Regulatory capital with Carrying amounts
12.31.2013 12.31.2012
Tier 1 Capital - Positive items 396,500 329,718Share capital 200,070 200,070
Share premium reserve 1,934 1,934
Reserves 127,714 116,305
Profit allocated to reserves 63,209 11,409
Profit for the year 85,216 125,467 Dividends and charitable donations (22,007) (114,058)Positive filter - Defined benefit plans 3,573 -
Tier 1 Capital 1 - Negative items (80,492) (78,623)Goodwill to be deducted from regulatory capital (69,075) (70,446)
Goodwill (89,602) (89,602) Deferred taxes relating to goodwill 20,527 19,156Other intangible assets (8,014) (8,177)
Negative filter - Defined benefit plans (3,403) -
Tier 1 capital 316,008 251,095Tier 2 Capital - -Regulatory capital 316,008 251,095
Report on Regulatory capital
12.31.2013 12.31.2012
Tier 1 capitalOpening balance 251,095 237,733
Profit for the year allocated to reserves 63,209 11,409
Goodwill net of deferred taxes 1,371 1,412
Other intangible assets 163 541
Positive filter - Defined benefit plans 3,573 -
Negative filter - Defined benefit plans (3,403) -
Closing balance 316,008 251,095
Tier 2Opening balance - -
Closing balance - -
Regulatory capital 316,008 251,095
2.2 Capital adequacy
A. QUALITATIVE INFORMATION
Prudential regulatory requirements have been established by applying the current provisions of the Basel II Traditional Standardised Approach. FinecoBank calculates its capital requirement for operational risk using advanced approaches, integrating total capital requirements for the floor set by Bank of Italy regulations. FinecoBank has applied a floor corresponding to the positive difference between 80% of the capital requirements calculated on the basis of the rules in force as at December 31, 2006 and the sum of the capital requirements for credit, counterparty, market and operational risks, calculated by applying the current provisions of the standardised Basel II Traditional Standardised Approach. As at December 31, 2013, the floor was €90,828 thousand, net of the 25% reduction granted to banks belonging to a Banking group.

200
Part F - Shareholders’ Equity (Continued)
Notes to the Accounts
The Annual Report and Accounts as at December 31, 2013 · FinecoBank
B. QUANTITATIVE INFORMATION
CATEGORY/AMOUNT
NON WEIGHTED ASSETS WEIGHTED ASSETS
12.31.2013 12.31.2012 12.31.2013 12.31.2012
A. RISK ASSETS A.1 Credit and counterparty risk 18,756,147 19,782,877 1,073,917 1,170,572 1. Traditional standardised approach 18,756,147 19,782,877 1,073,917 1,170,572
2. Internal rating method - - - -
2.1 Basic - - - -
2.2 Advanced - - - -
3. Securitisations - - - -
B. REGULATORY CAPITAL REQUIREMENTS B.1 Credit and counterparty risk 85,913 93,646 B.2 Market risk 3,335 3,379 1. Traditional standardised approach 3,335 3,379
2. Internal models - -
3. Concentration risk - -
B.3 Operational risk 64,912 58,515 1. Basic method - -
2. Traditional standardised approach - -
3. Advanced measurement approach 64,912 58,515
B.4 Other prudential requirements - - B.5 Other calculation elements 52,288 59,524 B.6 Total prudential requirements 206,448 215,064C. RISK ASSETS AND CAPITAL RATIOS C.1 Risk-weighted assets 2,580,595 2,688,301
C.2 Tier 1 capital/Risk-weighted assets (Tier 1 capital ratio) 12.25% 9.34%
C.3 Regulatory capital including Tier 3/ Risk-weighted assets (Total capital ratio) 12.25% 9.34%
Risk-weighted assets have been calculated by multiplying the total of prudential requirements by 12.5 (the inverse of the minimum compulsory coefficient of 8%).
Exposure to credit and counterparty risk breakdown by portfolio
PORTFOLIO
12.31.2013 12.31.2012
EXPOSURE TO CREDIT AND
COUNTERPARTY RISKRISK-WEIGHTED
ASSETS
EXPOSURE TO CREDIT AND
COUNTERPARTY RISKRISK-WEIGHTED
ASSETS
Exposure subject to IRB approachTotal - IRB approach - - - -Exposure subject to traditional standardized approachCentral governments and central banks 442,828 - 307,935 -
Supervised Intermediaries 17,019,549 24,456 18,119,016 95,551
Local authorities 1 - 1 -
Non-profit organisations and public sector entities 4,506 4,506 2,205 2,205
Multilateral development banks 3 - 3 -
Companies and other entities 110,340 107,846 102,543 100,399
Retail exposures 967,491 725,618 1,115,273 836,455
Past-due exposures 4,685 4,751 4,349 4,416
Other exposures 206,744 206,740 131,552 131,546
Total - Traditional standardised approach 18,756,147 1,073,917 19,782,877 1,170,572Risk assets - Credit and counterparty risk 18,756,147 1,073,917 19,782,877 1,170,572Capital requirement - Credit and counterparty risk 85,913 93,646

201FinecoBank · The Annual Report and Accounts as at December 31, 2013
Capital requirement per type of risk and approach adopted
TYPE OF RISK APPROACH USED
CAPITAL REQUIREMENTS
12.31.2013
CAPITAL REQUIREMENTS
12.31.2012
Capital requirements credit and counterparty risk
Standard approach for On-balance sheet exposures and Guarantees given and commitments to disburse funds,
Current exposure Method for Derivatives and CRM - Comprehensive methods with regulatory adjustments for
volatility for SFT Transactions 85,913 93,646Capital requirements market risk Standard approach 3,335 3,379Operational risk1. Advanced measurement approach Advanced measurement approach 64,912 58,515
Capital requirements operational risk 64,912 58,515Supplement for Basel I floor 121,103 131,212Reduction for banks belonging to a Banking Group (68,815) (71,688)Total capital requirements 206,448 215,064
2.3 Minimum ratios set by the Parent Company
CAPITAL ADEQUACY INDICATORS 12.31.2013TARGET 2013
UNICREDITTRIGGER 2013
UNICREDITLIMIT 2013UNICREDIT
Core Tier 1 ratio 12.25% 9.00% 8.00% 6.00%
Total capital ratio 12.25% 9.00% 8.00% 6.00%
The Core Tier 1 and Total Capital Ratio are above the targets set in the 2013 Risk Appetite Framework of the Parent Company.The Targets, Trigger and Limits of Total Capital Ratio are the same as those set for Core Tier 1 following the NBO approved by the Parent Company on April 12, 2013. In fact, since the Bank of Italy has provided for the application of the Basel I floor in the calculation of the capital requirement and considering Fineco’s business model under which the funding is fully invested in the Parent Company, a request was made for a re-calibration of the target, triggers and limit set. In particular, given the specific nature of operations and the absence of subordinated liabilities or other prudential filters, it was agreed with the relevant Parent Company department that the limits, triggers and targets set for the Core Tier 1 Ratio could also be applied to the Total Capital Ratio.
The Bank has made a priority of capital management and allocation on the basis of the risk assumed in order to expand its operations and create value. The activities consist of different stages of the process of planning and control and, in particular, in the planning and budgeting processes and the monitoring processes (analysis of expected and achieved performance, analysis and monitoring of limits, analysis and performance monitoring of the capital ratios).Capital and its allocation are therefore extremely important in defining strategies, since on the one hand it represents the shareholders’ investment in the Bank which must be adequately remunerated, on the other hand, it is a scarce resource on which there are external limitations imposed by regulatory provisions.As regards dynamic capital management, the CFO area draws up a financial plan and monitors the capital and regulatory ratios, anticipating any appropriate action needed to reach the objectives.Monitoring refers, on one hand, to both shareholders’ equity and the composition of regulatory capital (Core Tier 1) and, on the other hand, to the planning and performance of risk-weighted assets (RWA).


203FinecoBank · The Annual Report and Accounts as at December 31, 2013
Section 1 - Business combinations completed during the yearNo information to report.
Section 1 - Business combinations completed after year-endNo information to report.
Section 1 - Retrospective adjustmentsNo information to report.
Part G - Business combinations


205FinecoBank · The Annual Report and Accounts as at December 31, 2013
1. Details of Top Managers’ Compensation 2062. Related-party transactions 206
Part H - Related-party transactions

206
Notes to the Accounts
The Annual Report and Accounts as at December 31, 2013 · FinecoBank
Information on the fees paid to key management personnel and on related-party transactions, according to IAS 24 are shown below.
1. Details of Top Managers’ CompensationKey management personnel are persons having authority and responsibility for planning, directing, and controlling FinecoBank’s activities, directly or indirectly. Key management personnel include, in addition to the other members of the Board of Directors and the members of the Board of Statutory Auditors, in accordance with the provisions of Bank of Italy Circular no. 262 of December 22, 2005 as amended, and the Managing Director and the General Manager (the latter only for the year 2012).
12.31.2013 12.31.2012
Fees paid to “Key Management Personnel”, Directors and the Board of Statutory Auditors
a) short-term benefits 2,127 2,382
b) post-employment benefits 67 127
of which under defined benefit plans - - of which under defined contribution plans 67 127c) other long-term employee benefits - -
d) termination benefits - 1,400
e) share-based payments 292 243
TOTAL 2,486 4,152
From 2013, the remuneration of Key management personnel, Directors and the Board of Statutory Auditors also include the emoluments paid to the above persons for positions held in the Audit Committee and the 231 Committee. For uniformity of comparison those emoluments have been also shown in the comparative figures as at December 31, 2012.
2. Related-party transactionsIn order to ensure full compliance with current legislative and regulatory provisions on disclosure of related-party transactions, on December 13, 2010, the Company’s Board of Directors approved the new provisions for related-party transactions, in compliance with the provisions of the Consob Regulation, approved by Resolution No. 17221 of March 12, 2010 and subsequently amended by Resolution No. 17389 of June 23, 2010.In accordance with the instructions given by the Parent Company, the criteria for identifying the transactions completed with related parties were defined, in line with the instructions of the above-mentioned Supervisory Body.During the year 2013 no related-party transactions were conducted that qualified as significant according to the above-mentioned criteria for identifying related-party transactions. During the year inter-company transactions and/or transactions with related parties in general, both Italian and foreign, were conducted within the ordinary course of business and the related financial activities and were completed under conditions similar to those applied to transactions with unrelated third parties, except for an agreement at non-standard conditions with the company PI4PAY (related party and associated person) approved by the Board of Directors on November 5, 2013, following the recommendation of the Audit Committee (as the Committee of Independent Directors for transactions with associated person of lesser importance for a non-significant amount).Intra-group transactions were carried out based on assessments of a mutual economic advantage, and the determination of applicable terms and conditions took place in compliance with the criteria of substantial correctness, keeping in mind the common goal of creating value for the entire UniCredit group. The same principle was also applied to the provision of intra-group services, combined with the principle of charging for such services at minimal rate solely to recover related production costs.Finally, with regard to transactions of significant operating, capital and financial importance, in 2012 FinecoBank S.p.A. issued 5 bank guarantees in favour of the Revenue Agency at the request of Unicredit S.p.A., with an unlimited term (more specifically, with a duration up to the payment of the underlying pending amounts), for a total amount of €256,065 thousand, plus interest accrued and accruing up to the request for payment by the Revenue Agency. The bank guarantees were issued as a guarantee for the obligations assumed by Unicredit S.p.A. relating to five VAT reimbursement suspension orders issued by the Revenue Agency and entail the assumption by FinecoBank S.p.A. of an irrevocable payment commitment on demand, within 30 days and without any exceptions. During 2013, following the cancellation of a unified tax assessment issued by the Liguria Regional Revenue Office up to the amount of the charge cancelled, an amendment in replacement was made, for unvaried amounts, of bank guarantee already issued by FinecoBank S.p.A.; this transaction did not result in any change in the commitments assumed in the forms, means and risks already assessed during the year 2012.
Part H - Related-party transactions (Amounts in € thousand)

207FinecoBank · The Annual Report and Accounts as at December 31, 2013
The following table shows the outstanding assets, liabilities, guarantees and commitments as at December 31, 2013, for each group of related parties according to IAS 24:
BALANCES AT 12.31.2013
JOINT VENTURES NOT CONSOLIDATED ASSOCIATES
DIRECTORS AND KEY PERSONNEL
OTHER RELATED PARTIES
Financial assets held for trading - - - 29
Financial assets at fair value through profit or loss - - - -
Loans and receivables with banks - - - 6
Loans and receivables with customers - - 4 6,563
Other assets - - - -
Total assets - - 4 6,598Deposits from banks - - - 12
Deposits from customers - - 424 14,831
Financial liabilities held for trading - - - -
Tax liabilities - - - -
Other liabilities - - - 304
Total liabilities - - 424 15,147Guarantees given and commitments - - - -
The following table sets out the impact of the above transactions with related parties on the main Income Statement items, for each group of related parties.
INCOME STATEMENT AS AT 12.31.2013
JOINT VENTURES NOT CONSOLIDATED ASSOCIATES
DIRECTORS AND KEY PERSONNEL
OTHER RELATED PARTIES
Interest income and similar revenues - - - 13
Interest expenses and similar charges - - (5) (83)
Fee and commission income - - - 26,823
Fee and commission expense - - (2) (480)
Gains (losses) on financial assets and liabilities held for trading - - - -
Fair value adjustments in hedge accounting - - - -
Payroll costs - - - -
Other administrative expenses - - - (7,364)
Other operating expense - - - -
Other administrative income - - 1 5
Net impairment losses on loans and provisions for guarantees and commitments - - - -
Total income statement - - (6) 18,914
With regard to the “Key management personnel” category, in application of the special regulations laid down in Article 136 of Legislative Decree 385/93 (Consolidated Law on Banking), the obligations established for persons that perform administrative, management and control functions pursuant to those regulations were unanimously approved by a resolution of the Board of Directors with the favourable vote of all members of the Board of Statutory Auditors, in accordance with Article 136 of said Consolidated Law on Banking.The category “Directors and key personnel” includes the dealings with directors and key personnel of FinecoBank and the Parent Company UniCredit.
The “other related parties” category includes:- close family members of key management personnel (i.e. those family members who, as is expected, may influence - or be influenced by - the
person in question);- companies controlled (or jointly controlled) by, or associated with, “key management personnel” or their close family members;- associates, and their subsidiaries, of the Parent Company UniCredit;- shareholders, and their subsidiaries, of the Parent Company UniCredit.

208
Part H - Related-Party Transactions (Continued)
Notes to the Accounts
The Annual Report and Accounts as at December 31, 2013 · FinecoBank
Lastly, we note that the item “Other related parties” does not include figures as at December 31, 2013 and the Income Statement for 2013 relating to the Parent Company UniCredit and the UniCredit group companies, because they are presented further below.
Transactions with the parent company and other UniCredit Group companies
TOTAL TRANSACTIONS WITH UNICREDIT GROUP COMPANIES 12.31.2013
Assets 16,461,642Financial assets held for trading 30
Financial assets at fair value through profit or loss 1,186
Loans and receivables with banks 16,304,187
Loans and receivables with customers 13,444
Hedging derivative assets 123,143
Tax assets 15,179
Other assets 4,473
Liabilities 3,982,281Deposits from banks 1,565,413
Deposits from customers 3,261
Debt securities in issue 2,322,511
Financial liabilities held for trading 8
Hedging derivative liabilities 141,801
Tax liabilities (58,578)
Other liabilities 7,865
Guarantees 266,070Guarantees given 266,070
Income Statement 295,632Interest income and similar revenues 265,917
Interest expenses and similar charges (34,863)
Fee and commission income 82,174
Fee and commission expense (4,775)
Gains (losses) on financial assets and liabilities held for trading 858
Fair value adjustments in hedge accounting 4,387
Gains (losses) from disposal or repurchase 35
Administrative costs (18,350)
Other net operating income 249
The following table summarises transactions with UniCredit group companies as at December 31, 2013:
COMPANY ASSETS LIABILITIESGUARANTEES AND
COMMITMENTSINCOME
STATEMENT
UniCredit S.p.A. 16,448,012 3,963,574 266,070 227,705
UniCredit Bank AG 144 5,890 - 2,070
UniCredit Bank AG Milan - 640 - 402
Direktanlage.AT AG 25 1,024 - (10)
UniCredit Credit Management Bank S.p.A. - 61 - (100)
UniCredit Factoring S.p.A. - - - 3
UniCredit Leasing S.p.A. - - - 10
Localmind S.p.A. in liquidation - 2,712 - (11)
UniCredit Luxemburg Finance SA - - - 71
Unicredit Business Integrated Solutions S.C.p.A. 4 3,473 - (13,223)
Pioneer Investment Management SGR p.A. 2,424 122 - 11,444
Fineco Leasing S.p.A. - 550 - 662
Dab Bank AG 5 4,191 - 295
Cordusio Società Fiduciaria per Azioni 74 44 - (9)
Pioneer Asset Management SA Luxemburg 10,950 - - 66,315
UniCredit Bank Austria AG 2 - - 4
UniCredit Bank Czech Republic A.S. - - - 1
UniCredit Bank Hungary ZRT. - - - 1
Bank Pekao SA 1 - - 1
UniCredit BulBank AD 1 - - 1
Total 16,461,642 3,982,281 266,070 295,632

209FinecoBank · The Annual Report and Accounts as at December 31, 2013
The following tables contain a breakdown of the items relating to Assets, Liabilities, Costs and Revenue for each company of the Group.
Transactions with parent company
TRANSACTIONS WITH UNICREDIT S.P.A. 12.31.2013
Assets 16,448,012Financial assets at fair value through profit or loss 1,187
Loans and receivables with banks 16,304,052
Hedging derivative assets 123,143
Tax assets 15,179
Other assets 4,451
Liabilities 3,963,574Deposits from banks 1,554,316
Debt securities in issue 2,322,511
Hedging derivative liabilities 141,160
Tax liabilities (58,578)
Other liabilities 4,165
Guarantees 266,070Guarantees given 266,070
Income Statement 227,705Interest income and similar revenues 265,539
Interest expenses and similar charges (33,968)
Fee and commission income 1,236
Fee and commission expense (3,882)
Fair value adjustments in hedge accounting 3,513
Gains (losses) from disposal or repurchase 35
Administrative costs (4,787)
Other net operating income 19
Transactions with companies controlled by UniCredit S.p.A.
TRANSACTIONS WITH UNICREDIT BANK AG 12.31.2013
Assets 144Loans and receivables with banks 135
Other assets 9
Income Statement 5,890Interest income and similar revenues 5,890
Interest expenses and similar charges 2,070Fee and commission income 332
Interest expenses and similar charges (7)
Interest income and similar revenues 1,745
TRANSACTIONS WITH UNICREDIT BANK AG, MILAN 12.31.2013
Liabilities 640Hedging derivative liabilities 640
Income Statement 402Interest income and similar revenues 46
Interest expenses and similar charges (871)
Fee and commission income 361
Fee and commission expense (8)
Fair value adjustments in hedge accounting 874

210
Part H - Related-Party Transactions (Continued)
Notes to the Accounts
The Annual Report and Accounts as at December 31, 2013 · FinecoBank
TRANSACTIONS WITH DIREKTANLAGE.AT AG 12.31.2013
Assets 25Financial assets held for trading 25
Liabilities 1,024Deposits from banks 1,020
Financial liabilities held for trading 4
Income Statement (10)Interest expenses and similar charges (2)
Fee and commission income 17
Fee and commission expense (53)
Gains (losses) on financial assets and liabilities held for trading 28
TRANSACTIONS WITH UNICREDIT CREDIT MANAGEMENT BANK S.P.A. 12.31.2013
Liabilities 61Other liabilities 61
Income Statement (100)Administrative costs (100)
TRANSACTIONS UNICREDIT FACTORING S.P.A. 12.31.2013
Income Statement 3Administrative costs 3
TRANSACTIONS WITH UNICREDIT LEASING S.P.A. 12.31.2013
Income Statement 10Fee and commission income 10
TRANSACTIONS WITH LOCALMIND S.P.A. 12.31.2013
Liabilities 2,712Deposits from customers 2,712
Income Statement (11)Interest expenses and similar charges (11)
TRANSACTIONS WITH UNICREDIT LUXEMBOURG FINANCE SA 12.31.2013
Income Statement 71Fee and commission income 71
TRANSACTIONS WITH UNICREDIT BUSINESS INTEGRATED SOLUTIONS S.C.P.A. 12.31.2013
Assets 4Other assets 4
Liabilities 3,473Other liabilities 3,473
Income Statement (13,223)Fee and commission income 8
Administrative costs (13,461)
Other net operating income 230

211FinecoBank · The Annual Report and Accounts as at December 31, 2013
TRANSACTIONS WITH PIONEER INVESTMENT MANAGEMENT SGR P.A. 12.31.2013
Assets 2,424Loans and receivables with customers 2,424
Liabilities 122Other liabilities 122
Income Statement 11,444Fee and commission income 11,644
Fee and commission expense (200)
TRANSACTIONS WITH FINECO LEASING S.P.A. 12.31.2013
Liabilities 550Deposits from customers 550
Income Statement 662Interest expenses and similar charges (1)
Fee and commission income 663
TRANSACTIONS WITH DAB BANK AG 12.31.2013
Assets 5Financial assets held for trading 5
Liabilities 4,191Deposits from banks 4,187
Financial liabilities held for trading 4
Income Statement 295Interest expenses and similar charges (3)
Fee and commission income 38
Fee and commission expense (571)
Gains (losses) on financial assets and liabilities held for trading 831
TRANSACTIONS WITH CORDUSIO SOCIETÀ FIDUCIARIA PER AZIONI 12.31.2013
Assets 74Loans and receivables with customers 71
Other assets 3
Liabilities 44Other liabilities 44
Income Statement (9)Fee and commission income 59
Fee and commission expense (63)
Administrative costs (5)
TRANSACTIONS WITH PIONEER ASSET MANAGEMENT SA LUXEMBOURG 12.31.2013
Assets 10,950Loans and receivables with customers 10,950
Income Statement 66,315Fee and commission income 66,315
TRANSACTIONS WITH UNICREDIT BANK AUSTRIA AG 12.31.2013
Assets 2Other assets 2
Income Statement 4Fee and commission income 4

212
Part H - Related-Party Transactions (Continued)
Notes to the Accounts
The Annual Report and Accounts as at December 31, 2013 · FinecoBank
TRANSACTIONS WITH UNICREDIT BANK CZECH REPUBLIC A.S. 12.31.2013
Income Statement 1Fee and commission income 1
TRANSACTIONS WITH UNICREDIT BANK HUNGARY ZRT 12.31.2013
Income Statement 1Fee and commission income 1
BANK PEKAO SA 12.31.2013
Assets 1Other assets 1
Income Statement 1Fee and commission income 1
TRANSACTIONS WITH UNICREDIT BULBANK AD 12.31.2013
Assets 1Other assets 1
Income Statement 1Fee and commission income 1

213FinecoBank · The Annual Report and Accounts as at December 31, 2013


215FinecoBank · The Annual Report and Accounts as at December 31, 2013
A. Qualitative information 216B. Quantitative information 218
Part I - Share-based payments

216
Notes to the Accounts
The Annual Report and Accounts as at December 31, 2013 · FinecoBank
A. QUALITATIVE INFORMATION
1. Description of share-based payments
1.1 Outstanding instrumentsGroup Medium & Long Term Incentive Plans for selected employees include the following categories of Equity-Settled Share Based Payment instruments which entail the granting of shares of the Parent Company UniCredit:• Stock Options allocated to selected Top & Senior Managers and Key Talents and represented by rights to subscribe UniCredit shares;• Performance Stock Options & Performance Shares allocated to selected Top & Senior Managers and Key Talents of the Group and represented
respectively by Options and free UniCredit ordinary shares that the Parent Company undertakes to grant, conditional upon achieving performance targets approved by the Parent Company’s Board;
• Employee Share Ownership Plan (ESOP), which offers eligible Company employees the possibility to buy UniCredit ordinary shares with the following advantages: granting of free ordinary shares (or the rights to receive them) measured on the basis of the shares purchased by each Participant (“Investment Shares”) during the “Enrolment Period”. The granting of free ordinary shares is subordinated to vesting conditions (other than market conditions) stated in the Plan Rules.
• Group Executive Incentive System that offers eligible Group Executives a variable remuneration for which payment will be made in five years. For the first two years, the beneficiaries receive payment by cash and for the second two years, they receive payment in cash and shares, in relation to the achievement of individual and Group performance conditions as established in the Plan Rules.
• Share For Talent that offers eligible key talents free UniCredit ordinary shares that the Parent Company undertakes to grant, upon achievement of performance targets set by the Parent Company’s Board of Directors.
1.2 Measurement model1.2.1 Stock Options and Performance Stock OptionsThe Hull and White Evaluation Model has been adopted to measure the economic value of Stock Options and Performance Stock Options.This model is based on a trinomial tree price distribution using the Boyle’s algorithm and estimates the early exercise probability on the basis of a deterministic model connected to:- reaching a Market Share Value equal to an exercise price-multiple (M);- probability of beneficiaries’ early exit (E) after the end of the Vesting Period.
No new Stock Option and Performance Stock Option plans were assigned in 2013.
1.2.2 Other equity instruments - Performance SharesThe economic value of Performance Shares is measured considering the share market price at the grant date less the present value of the future dividends during the performance period. Parameters are estimated by applying the same model used for Stock Options measurement.
Any new Performance Shares’ Plans have not been granted during 2013.
1.2.3 Other equity instruments - Plan for Talent SharesThe plan offers free UniCredit ordinary shares, granted in three instalments, each with annual vesting, to selected beneficiaries.The economic value of Performance Shares is measured considering the share market price at the grant date less the present value of the future dividends during the performance period. Parameters are estimated by applying the same model used for Stock Options measurement.
No new Share for Talent plans were assigned in 2013.
1.2.4 Group Executive Incentive SystemThe amount of the incentive will be determined on a basis of the achievement of quantitative and qualitative goals stated by the plan. In particular, the overall evaluation is expressed as a percentage, from a minimum of 0% to a maximum of 150% (non-market vesting conditions). This percentage, adjusted by the application of a risk/opportunity factor - Group Gate - at first payment, multiplied by the incentive will determine the effective amount that will be paid to the beneficiary.
The Economic and Equity effects will be receipt on a basis of instrument vesting period.
Part I - Share-based payments (Amounts in € thousand)

217FinecoBank · The Annual Report and Accounts as at December 31, 2013
Group Executive Incentive System 2012 - SharesThe economic value of shares granted is measured considering the share market price at the grant date less the present value of the future dividends during the performance period.
SHARES GRANTED GROUP EXECUTIVE INCENTIVE SYSTEM 2012
FIRST INSTALMENT(2015)
SECOND INSTALMENT (2016)
THIRD INSTALMENT 3 (2017)
Bonus Opportunity Economic Value - (Grant Date) 27-Mar-2012 27-Mar-2012 27-Mar-2012
Number of Shares - Date of Board resolution 11-Apr-2013 11-Apr-2013 11-Apr-2013
Vesting Period Start Date 1-Jan-2012 1-Jan-2012 1-Jan-2012
Vesting Period End Date 31-Dec-2014 31-Dec-2015 31-Dec-2016
UniCredit Share Market Price [€] 3.52 3.52 3.52
Average Economic Value of Vesting conditions [€] -0.19 -0.37 -0.63
Performance Shares Fair Value per unit at Grant Date [€] 3.33 3.15 2.89
3. Only for Plans assigned to the Executive Vice Presidents.
Group Executive Incentive System 2013The variable incentive related to 2013 will be defined on the basis of:- individual performance, as well as results at business level and, where applicable, at country or Group level;- establishment of a balanced structure of upfront (following the performance evaluations) and deferred payments, in cash and in shares;- regulatory instructions that, for share payments, require a retention period of two years for upfront payments and one year for deferred shares;- application is a risk/sustainability factor, linked to the Group and/or Individual Business/Country results and the capital and liquidity conditions of the
Group (“Group Gate”), as well as a “Zero Factor” when the general conditions and the Group and/or Individual Business/Country results do not meet the plan targets as approved by the Board of Directors of UniCredit S.p.A..
The profit and loss and net equity effects will be recognised on the basis of the instruments’ vesting period.
1.2.5 Employee Share Ownership Plan (Piano Let’s Share 2012)The following tables show the measurements and parameters used in relation to Free Shares (or rights to receive them) connected to the “Employee Share Ownership Plan” approved in 2012.
Measurement of Free Shares ESOP 2012FREE SHARES
FIRST INSTALMENTFREE SHARES
SECOND INSTALMENT
Date of granting of Free Shares to Group employees 5-Feb-2013 5-Aug-2013
Vesting Period Start Date 31-Jan-2013 31-Jul-2013
Vesting Period End Date 31-Jan-2014 31-Jul-2014
Free Shares Fair Value per unit [€] 4.351 3.78
All the profit and loss and net equity effects of the plan, relating to the Free Shares granted will be recognised during the vesting period (except for the adjustments, in line with the plan rules, which will be recorded before the next available closing after the vesting period). The UniCredit ordinary shares granted under this plan are purchased on the market.
2. Other informationEmployee Share Ownership Plan for 2014 (formerly 2013) for UniCredit group Employees (Let’s Share for 2014)In May 2013 the Ordinary Shareholders’ Meeting approved the “UniCredit group Employee Share Ownership Plan 2014” (“Let’s Share for 2014”) that offers eligible Group employees the opportunity to purchase UniCredit ordinary shares at favourable conditions, starting from January 2014, in order to strengthen employee loyalty and commitment to achieve the corporate goals.
Let’s Share for 2014 was launched on November 27, 2013 in 11 countries across the Group (Austria, Bulgaria, Czech Republic, Germany, Hungary, Italy, Poland, Romania, Serbia, UK, Slovakia, Luxembourg and Hong Kong) with a participation rate of about 3.4% of the eligible employees.
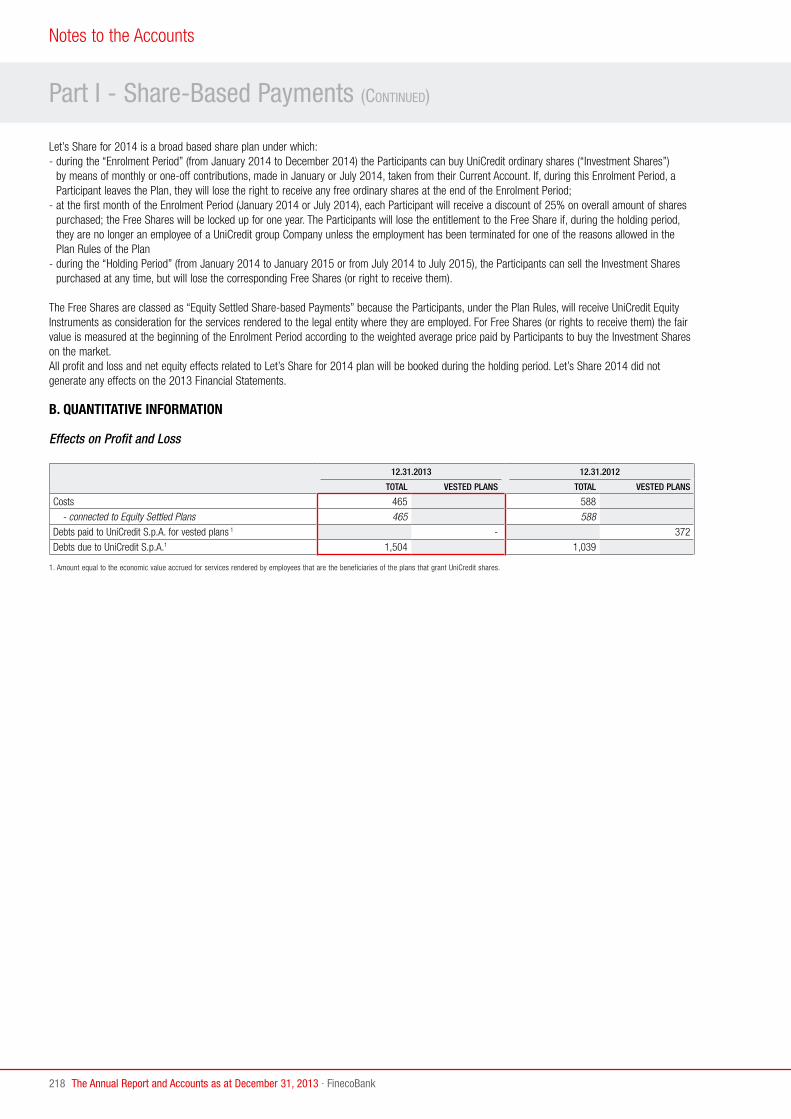
218
Part I - Share-Based Payments (Continued)
Notes to the Accounts
The Annual Report and Accounts as at December 31, 2013 · FinecoBank
Let’s Share for 2014 is a broad based share plan under which:- during the “Enrolment Period” (from January 2014 to December 2014) the Participants can buy UniCredit ordinary shares (“Investment Shares”)
by means of monthly or one-off contributions, made in January or July 2014, taken from their Current Account. If, during this Enrolment Period, a Participant leaves the Plan, they will lose the right to receive any free ordinary shares at the end of the Enrolment Period;
- at the first month of the Enrolment Period (January 2014 or July 2014), each Participant will receive a discount of 25% on overall amount of shares purchased; the Free Shares will be locked up for one year. The Participants will lose the entitlement to the Free Share if, during the holding period, they are no longer an employee of a UniCredit group Company unless the employment has been terminated for one of the reasons allowed in the Plan Rules of the Plan
- during the “Holding Period” (from January 2014 to January 2015 or from July 2014 to July 2015), the Participants can sell the Investment Shares purchased at any time, but will lose the corresponding Free Shares (or right to receive them).
The Free Shares are classed as “Equity Settled Share-based Payments” because the Participants, under the Plan Rules, will receive UniCredit Equity Instruments as consideration for the services rendered to the legal entity where they are employed. For Free Shares (or rights to receive them) the fair value is measured at the beginning of the Enrolment Period according to the weighted average price paid by Participants to buy the Investment Shares on the market.All profit and loss and net equity effects related to Let’s Share for 2014 plan will be booked during the holding period. Let’s Share 2014 did not generate any effects on the 2013 Financial Statements.
B. QUANTITATIVE INFORMATION
Effects on Profit and Loss
12.31.2013 12.31.2012
TOTAL VESTED PLANS TOTAL VESTED PLANS
Costs 465 588
- connected to Equity Settled Plans 465 588Debts paid to UniCredit S.p.A. for vested plans 1 - 372
Debts due to UniCredit S.p.A.1 1,504 1,039
1. Amount equal to the economic value accrued for services rendered by employees that are the beneficiaries of the plans that grant UniCredit shares.

219FinecoBank · The Annual Report and Accounts as at December 31, 2013


221FinecoBank · The Annual Report and Accounts as at December 31, 2013
The Bank does not disclose segment reporting information, as its particular business model involves significant integration between the different types of business. FinecoBank offers its (banking and investment) services through its network of financial advisers and online and mobile channels, which operate in a coordinated and integrated manner. As a result of the comprehensive nature of the services offered, the Bank provides customers with a one-stop solution for banking transactions and investment needs. Due to this highly integrated, customer-focused strategy, revenues and margins relating to different products/services (investing, banking and brokerage) are extremely interdependent.This integration approach is what inspires the top management in setting company targets and identifying the instruments to be used for achieving them.As regards the disclosure on revenues from customers per product/service, in consideration of the above, reference should be made to the detailed disclosure in Part C - Income Statement, in these Notes to the Accounts.FinecoBank mainly targets retail customers in Italy; information concerning geographic segments and the degree of dependency on main customers is considered by top management as not being of material importance for information purposes, and is not therefore disclosed.
Part L - Segment reporting


Sorter pages: UniCreditCreative concept: Orange 021
Graphic development and Composition:MERCURIO GP - Milan
May 2014


Listen,understand, respond.
The Annual Report and Accounts as at Decem
ber 31, 2013
www.fi neco.it
The Annual Report and Accountsas at December 31, 2013