long path (active ) doas -basic principle -long path...
TRANSCRIPT
Lecture on atmospheric remote sensing [email protected]
11
Long Path (active) DOAS
-basic principle
-Long path DOAS (UV/vis/IR)
-instrumental improvements
-Specific applications
-white cell
-vertical profiles
-tomographic inversions
Lecture on atmospheric remote sensing [email protected]
22
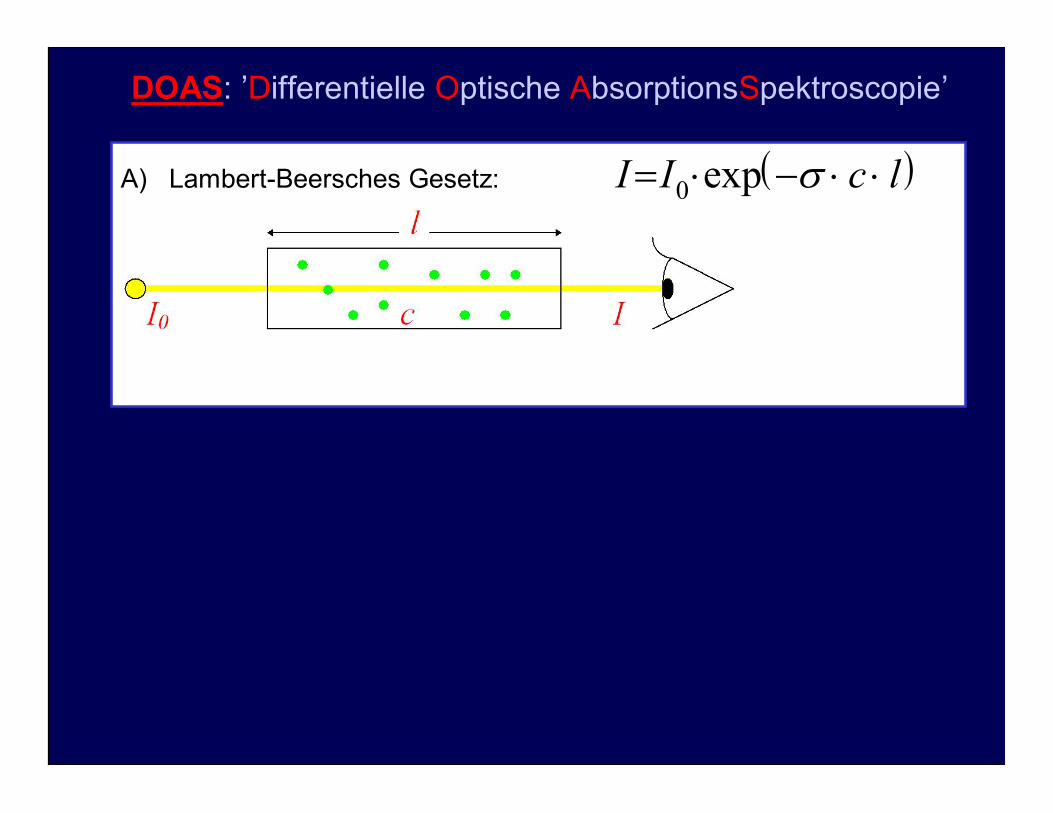
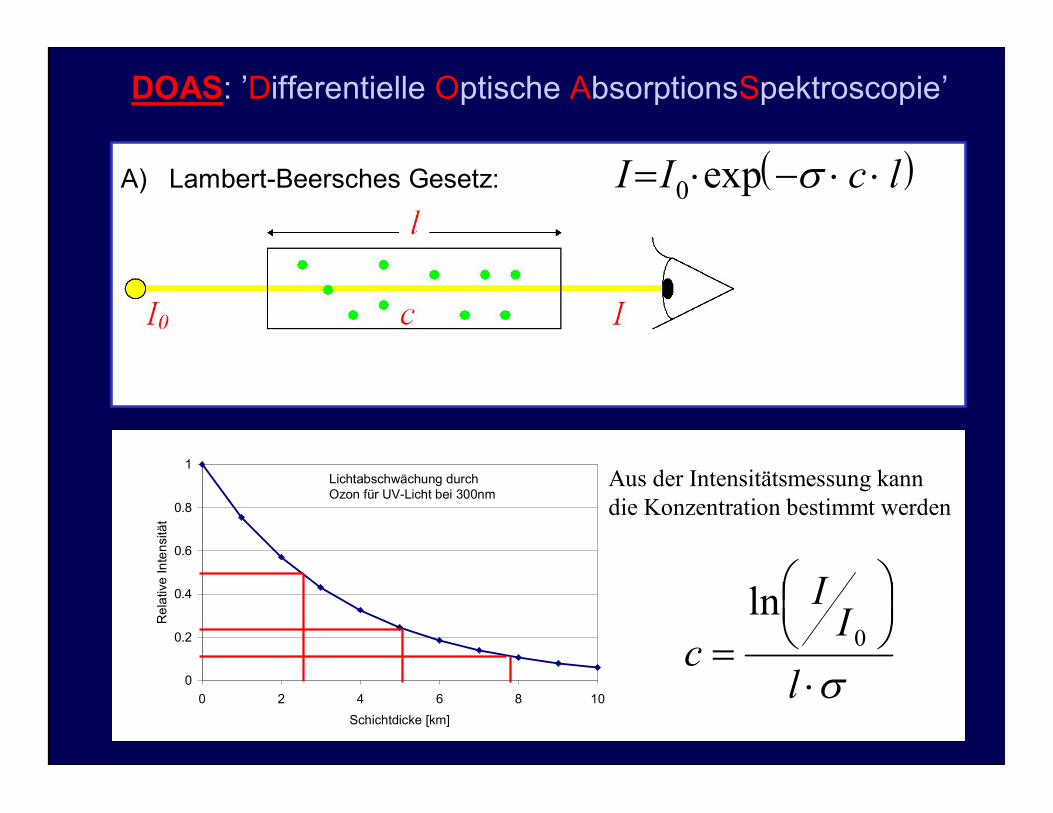
A) Lambert-Beersches Gesetz: I I c l 0 exp
DOAS: ’Differentielle Optische AbsorptionsSpektroscopie’
Lecture on atmospheric remote sensing [email protected]
33
A) Lambert-Beersches Gesetz: I I c l 0 exp
DOAS: ’Differentielle Optische AbsorptionsSpektroscopie’
0
0.2
0.4
0.6
0.8
1
0 2 4 6 8 10Schichtdicke [km]
Rel
ativ
e In
tens
ität
Lichtabschwächung durch Ozon für UV-Licht bei 300nm
l
II
c 0ln
Aus der Intensitätsmessung kann die Konzentration bestimmt werden
Lecture on atmospheric remote sensing [email protected]
44
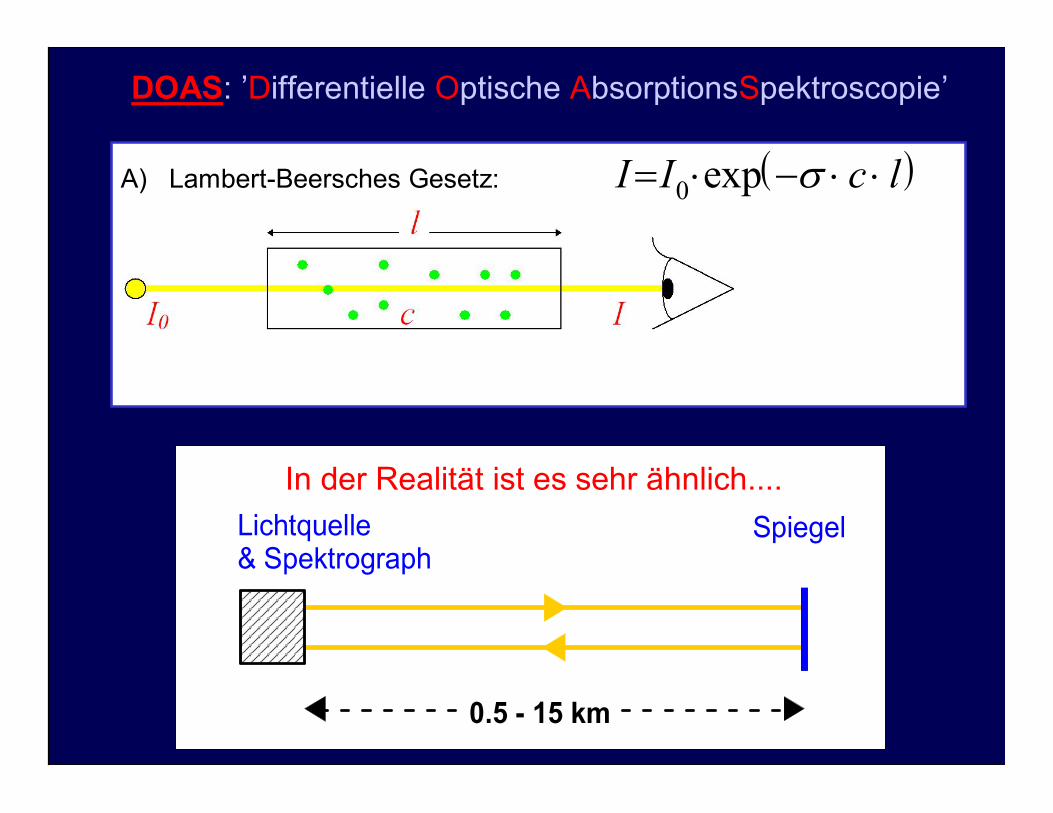
SpiegelLichtquelle& Spektrograph
0.5 - 15 km
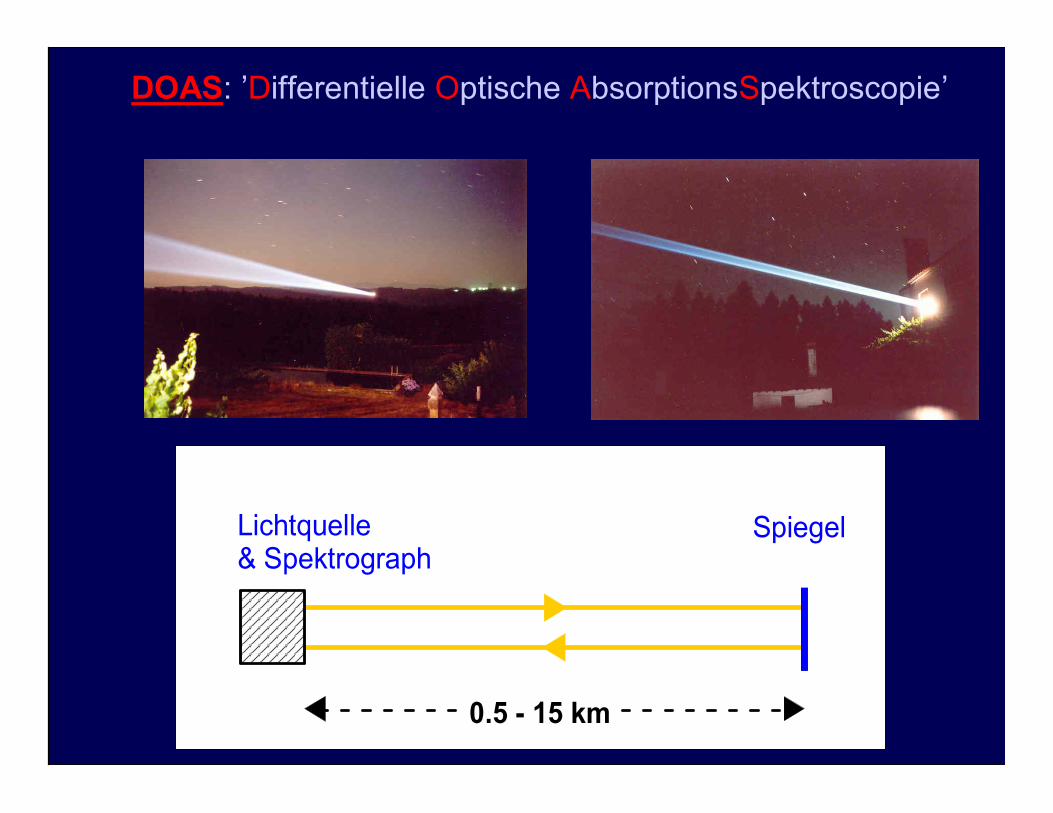
In der Realität ist es sehr ähnlich....
DOAS: ’Differentielle Optische AbsorptionsSpektroscopie’
A) Lambert-Beersches Gesetz: I I c l 0 exp
Lecture on atmospheric remote sensing [email protected]
55
Long Path DOAS
-basic principle
-Long path DOAS (UV/vis/IR)
-instrumental improvements
-Specific applications
-white cell
-vertical profiles
-tomographic inversions
Lecture on atmospheric remote sensing [email protected]
66
DOAS: ’Differentielle Optische AbsorptionsSpektroscopie’
SpiegelLichtquelle& Spektrograph
0.5 - 15 km
Lecture on atmospheric remote sensing [email protected]
77
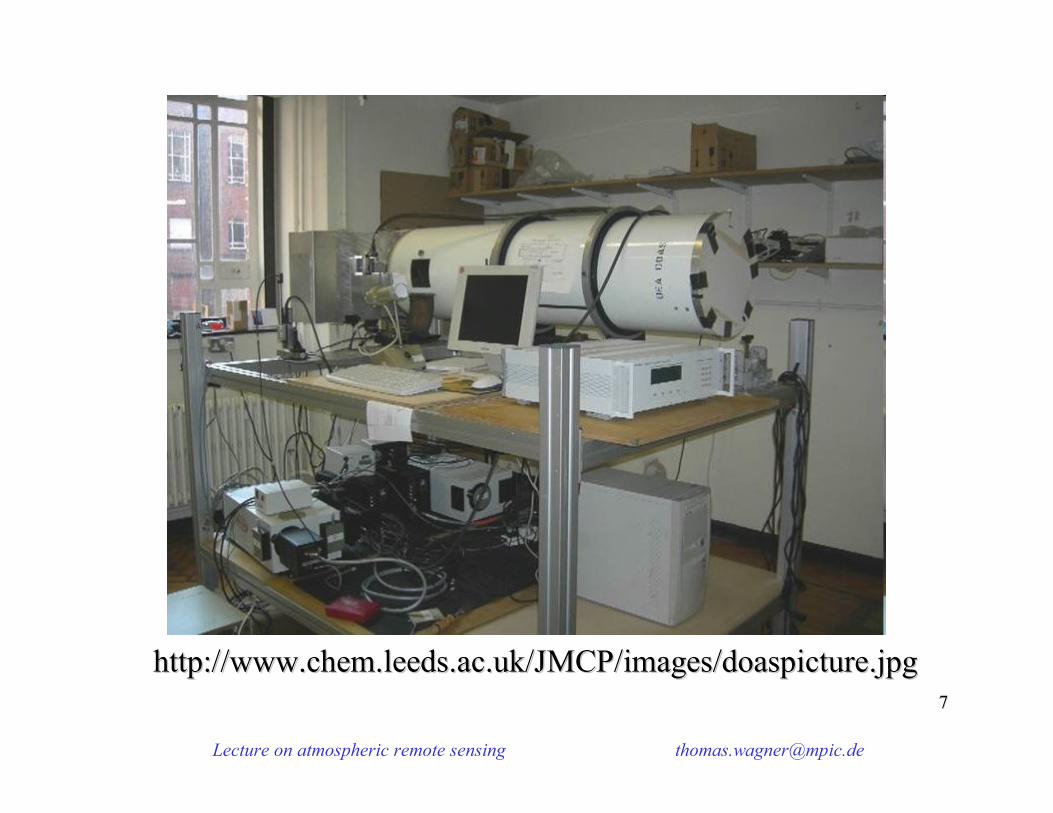
http://http://wwwwww.chem..chem.leedsleeds..acac..ukuk/JMCP//JMCP/imagesimages//doaspicturedoaspicture..jpgjpg
Lecture on atmospheric remote sensing [email protected]
88
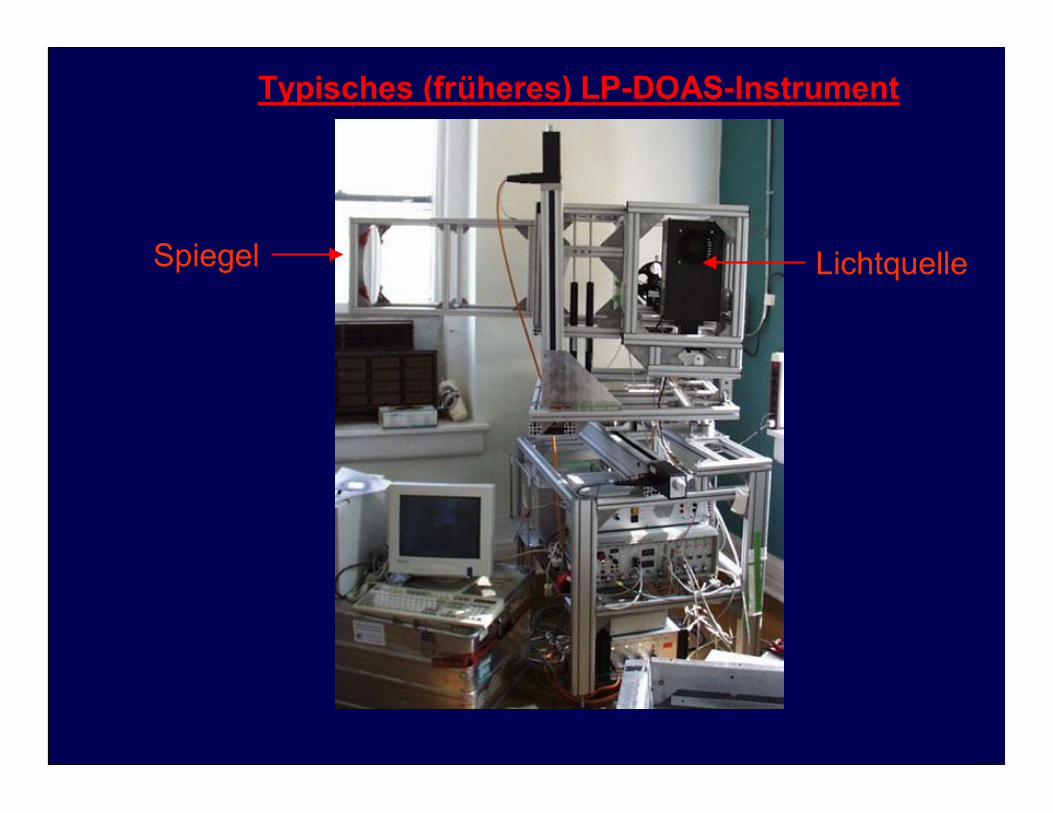
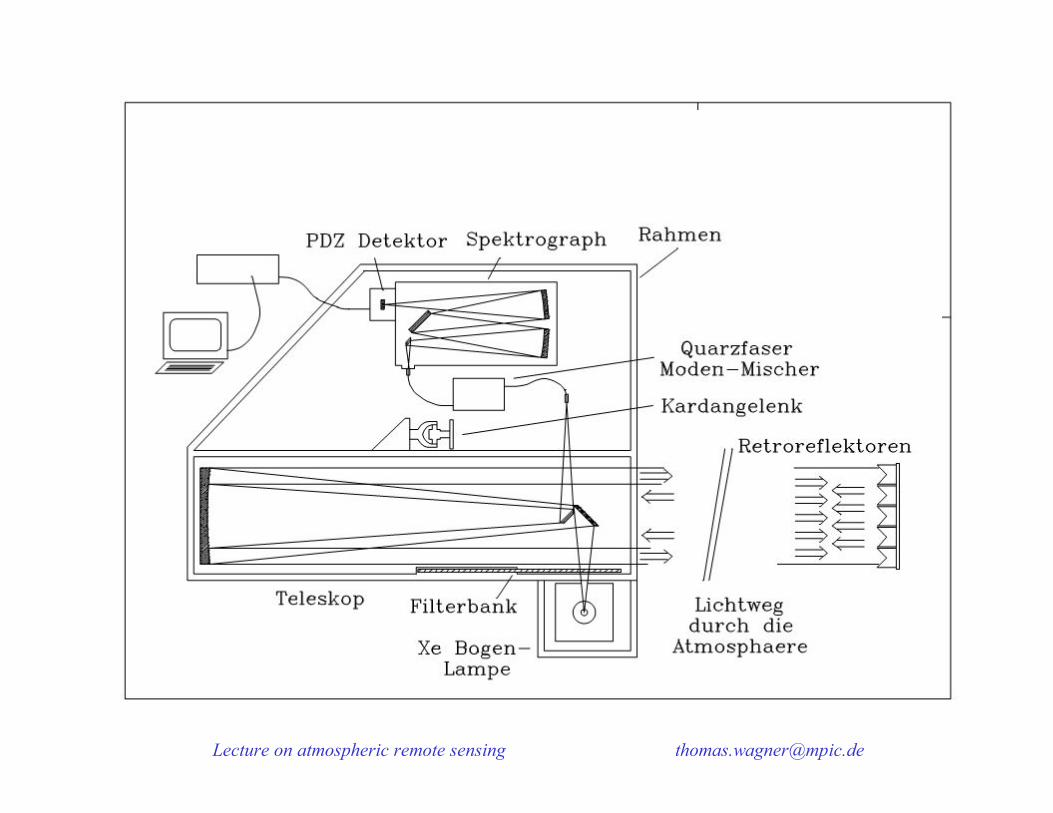
Typisches (früheres) LP-DOAS-Instrument
Spiegel Lichtquelle
Lecture on atmospheric remote sensing [email protected]
1010
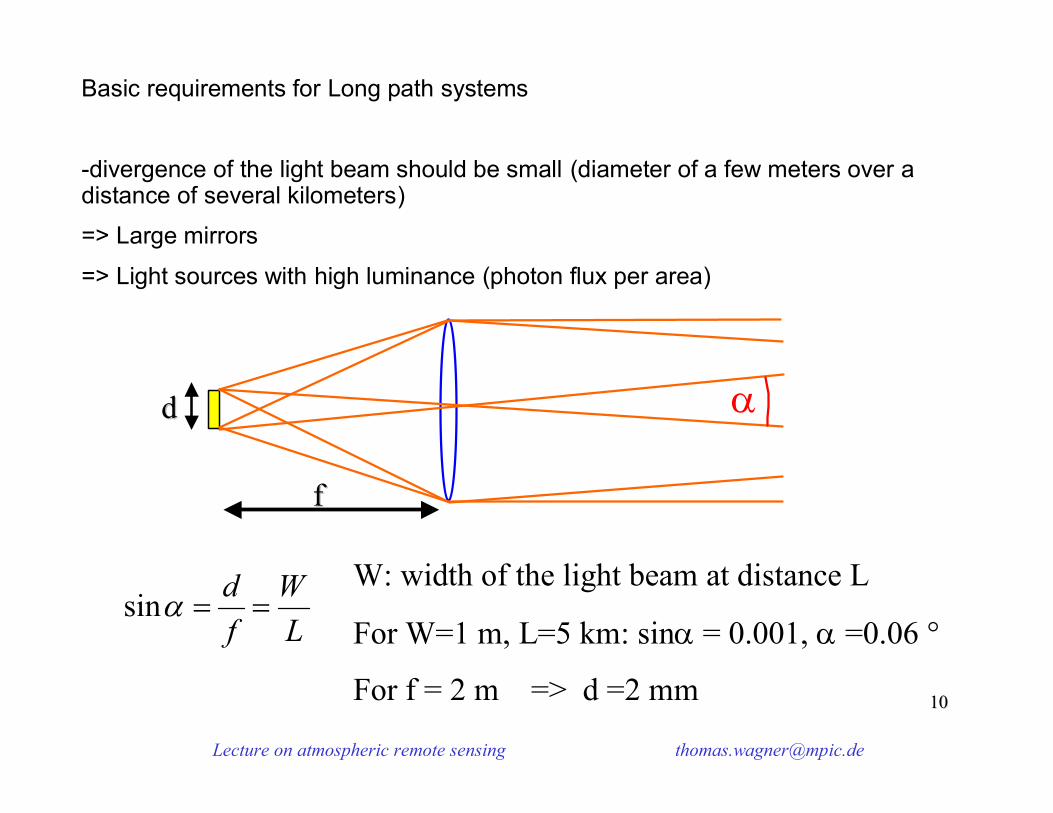
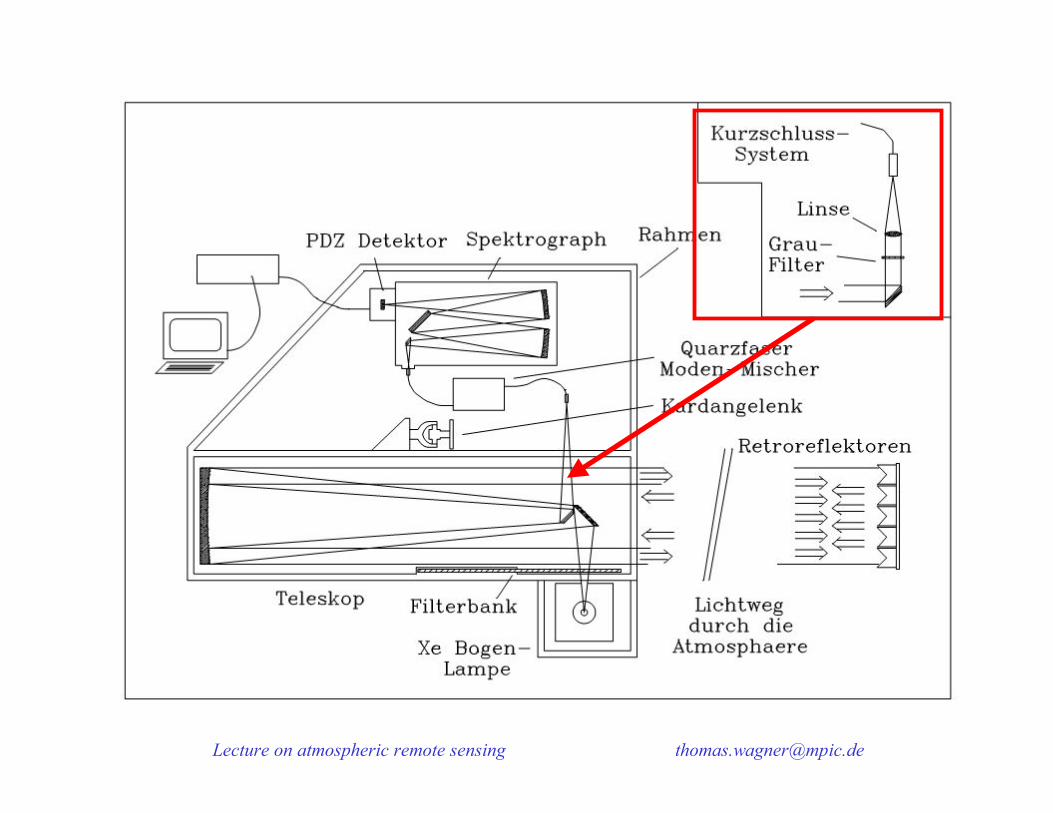
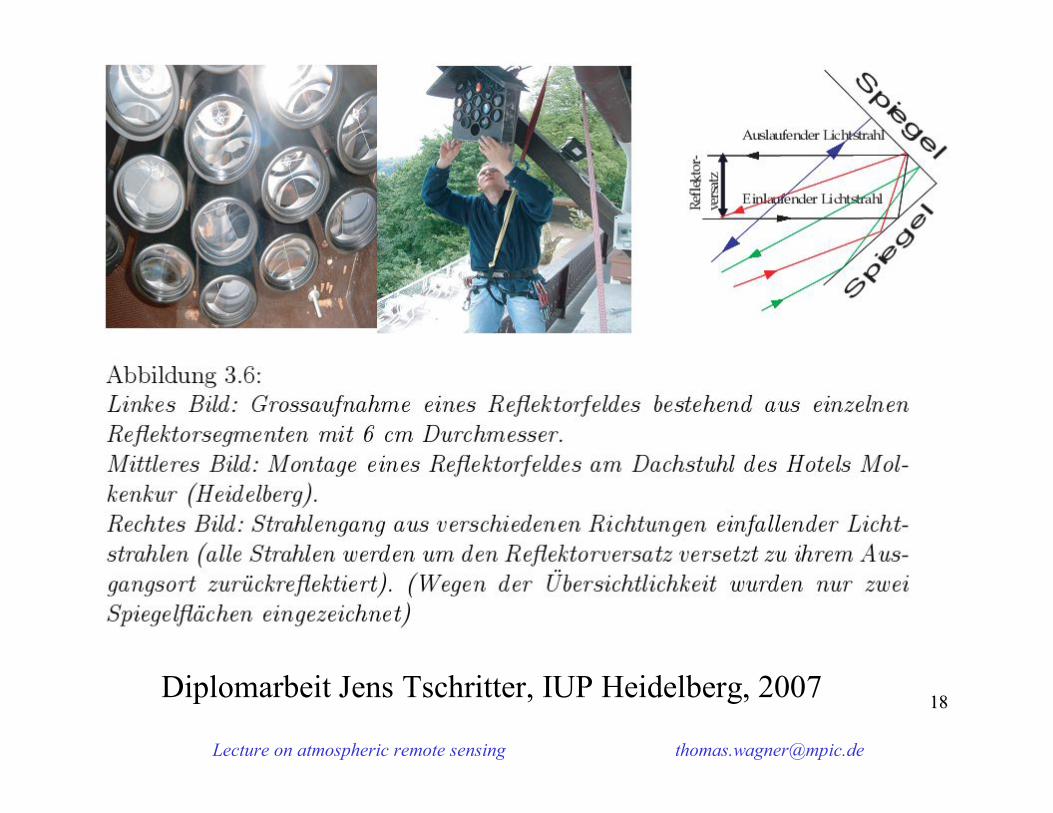
Basic requirements for Long path systems
-divergence of the light beam should be small (diameter of a few meters over a distance of several kilometers)
=> Large mirrors
=> Light sources with high luminance (photon flux per area)
dd
ff
LW
fdsin
W: width of the light beam at distance L
For W=1 m, L=5 km: sin = 0.001, =0.06 °
For f = 2 m => d =2 mm
Lecture on atmospheric remote sensing [email protected]
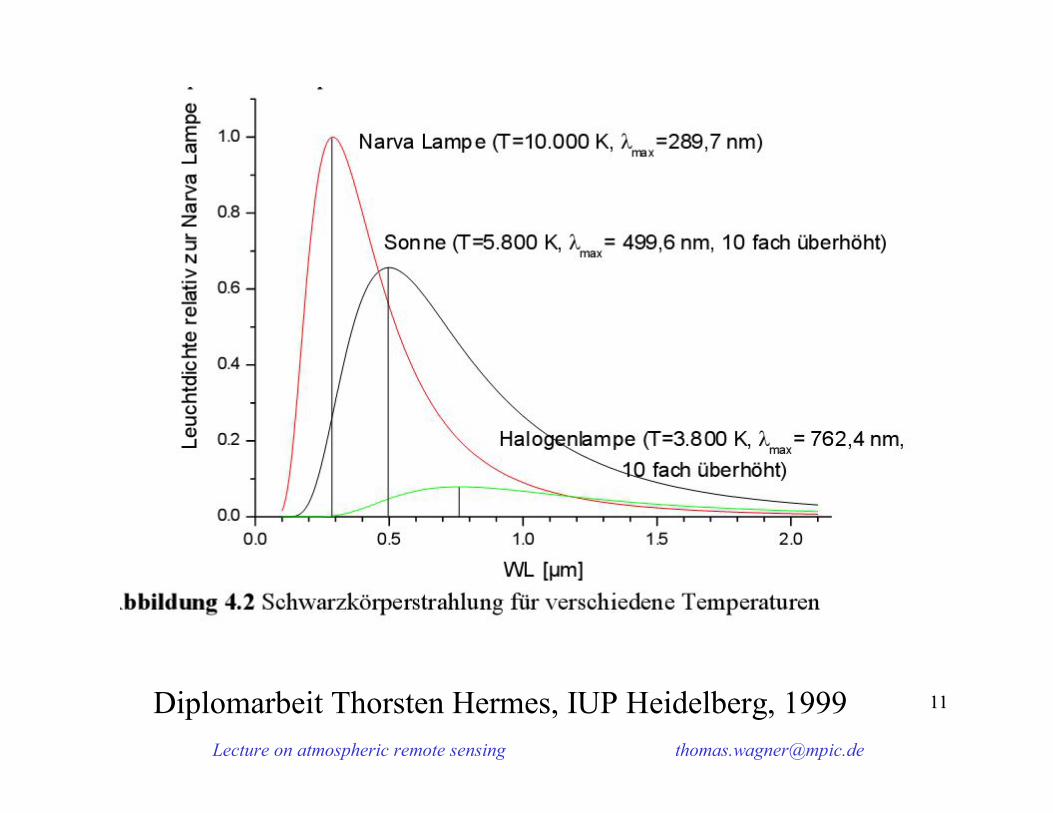
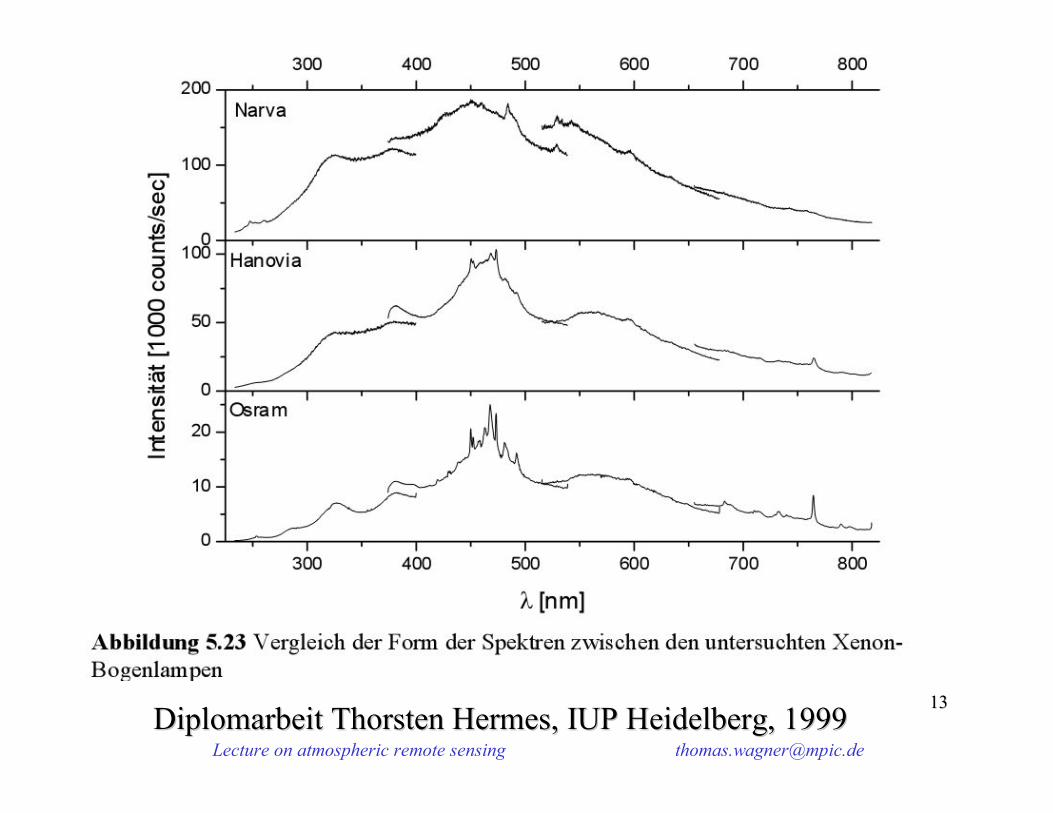
1111Diplomarbeit Thorsten Hermes, IUP Heidelberg, 1999
Lecture on atmospheric remote sensing [email protected]
1212
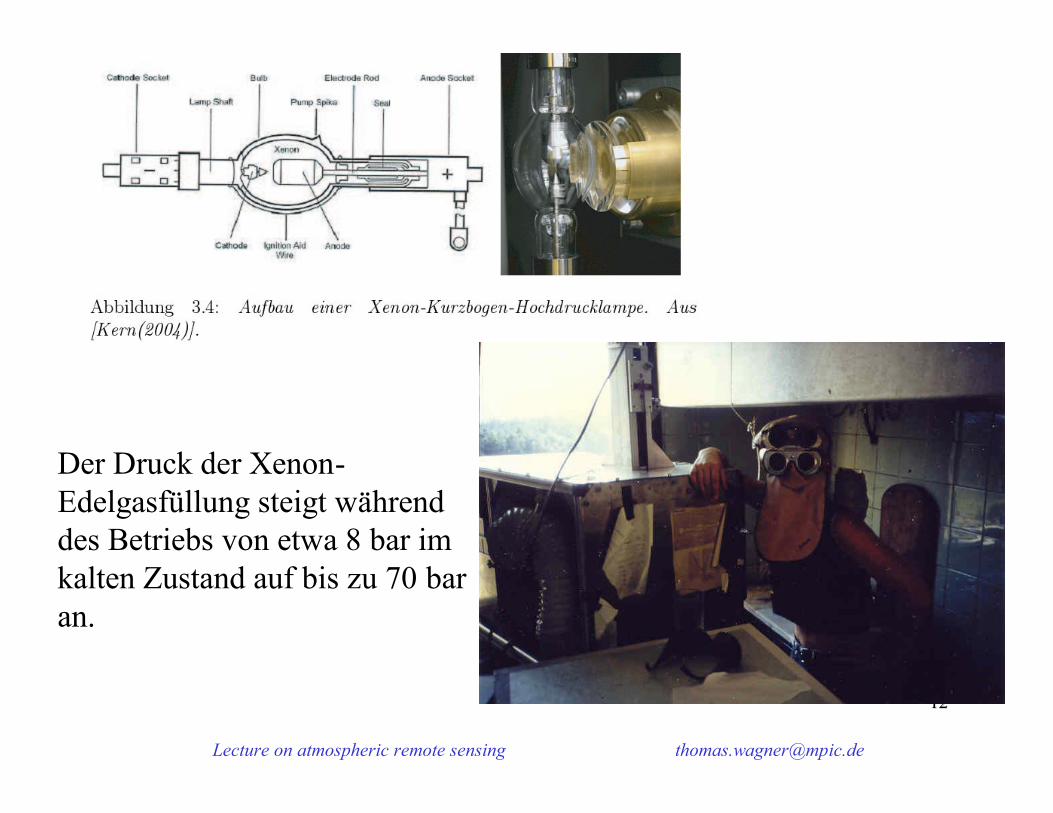
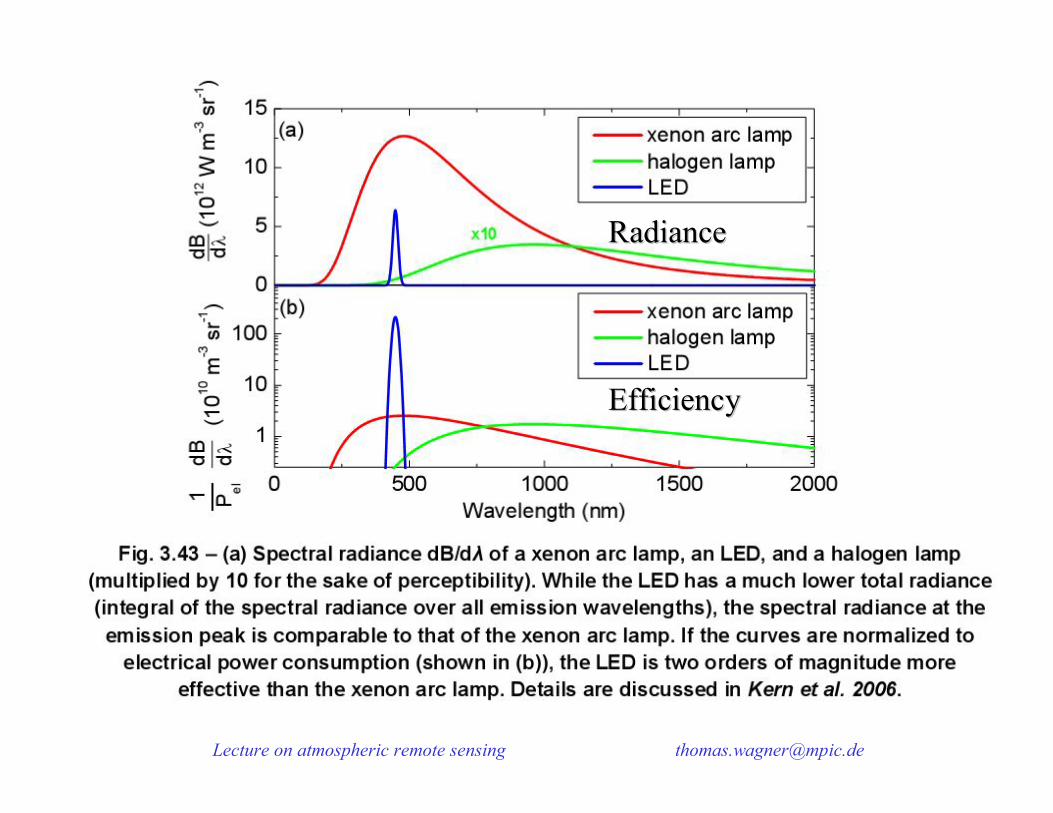
Der Druck der Xenon-Edelgasfüllung steigt während des Betriebs von etwa 8 bar im kalten Zustand auf bis zu 70 bar an.
Lecture on atmospheric remote sensing [email protected]
1313Diplomarbeit Thorsten Hermes, IUP Heidelberg, 1999Diplomarbeit Thorsten Hermes, IUP Heidelberg, 1999

Lecture on atmospheric remote sensing [email protected]
1414
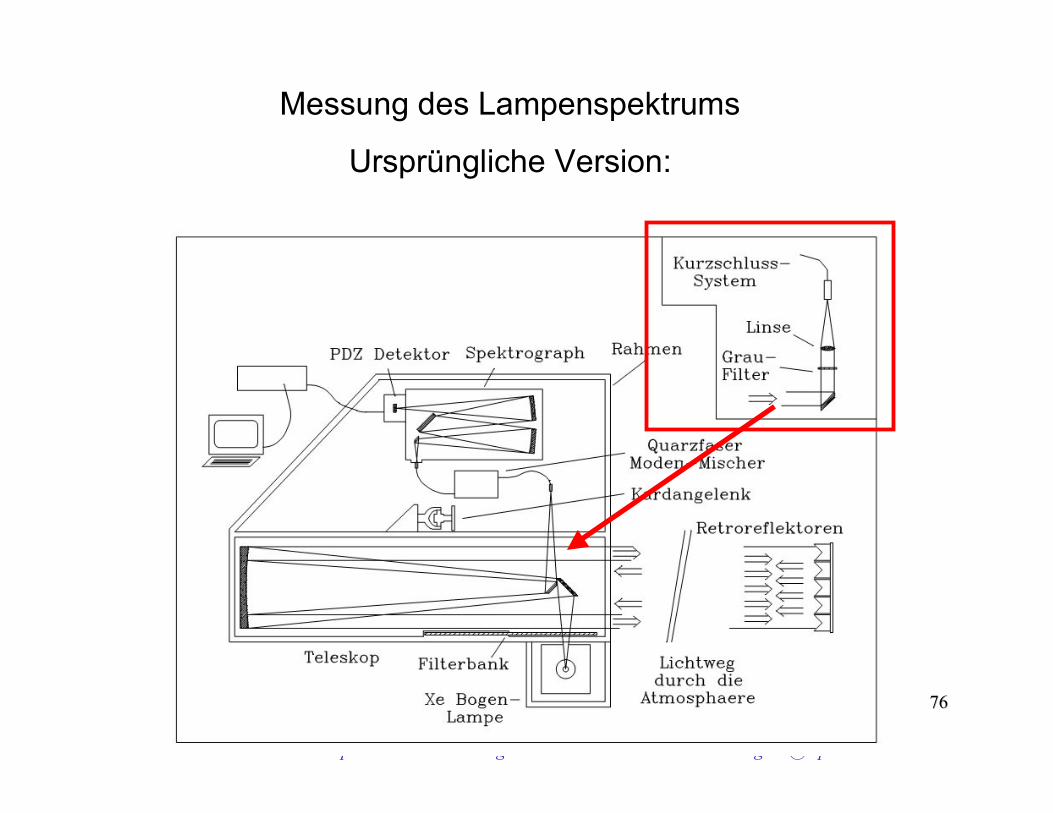
The spectral stuctures affect the trace gas analysis (for details see below). Thus they have to be removed from the measured spectra. This is achieved by the following procedure:
First, a lamp spectrum without atmospheric absorption is measured. Then the measured ‚atmospheric spectra‘ are divided by this lamp spectrum.
How can a lamp spectrum be measured?
(note: it should contain also all other instrumental features like e.g. mirror reflectivity, fibre throughput)
Lecture on atmospheric remote sensing [email protected]
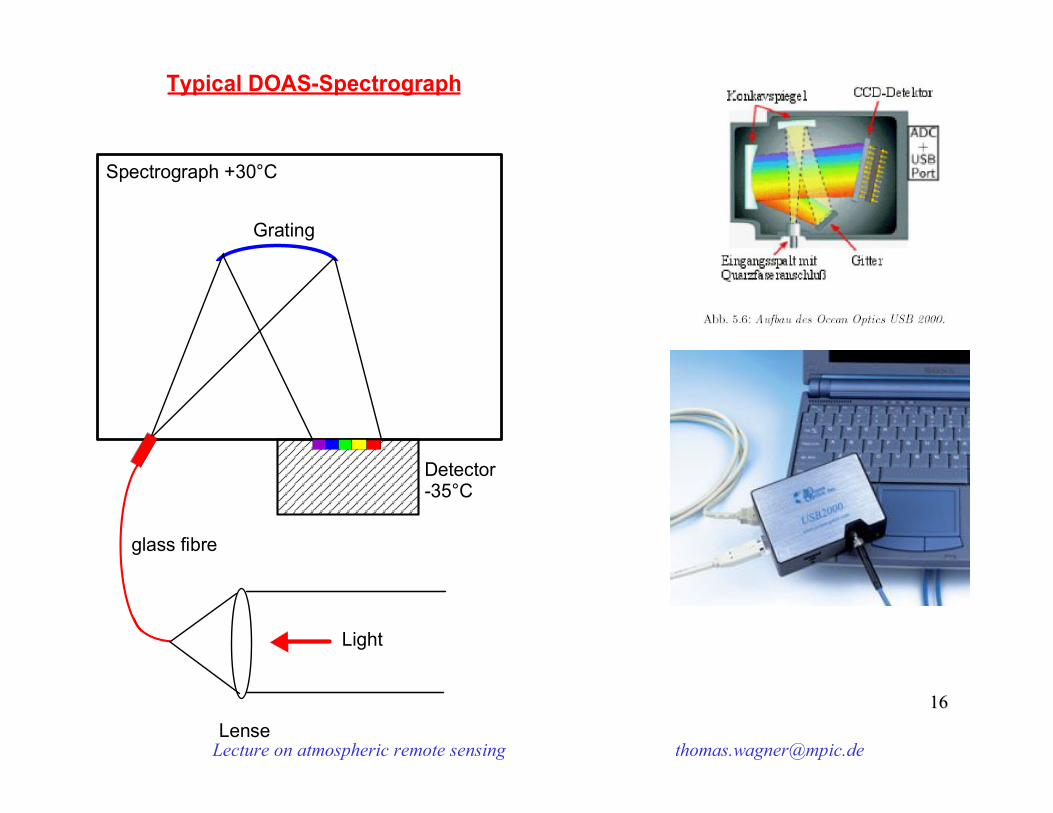
1616Lense
glass fibre
Spectrograph +30°C
Grating
Detector-35°C
Typical DOAS-Spectrograph
Light
Lecture on atmospheric remote sensing [email protected]
1717
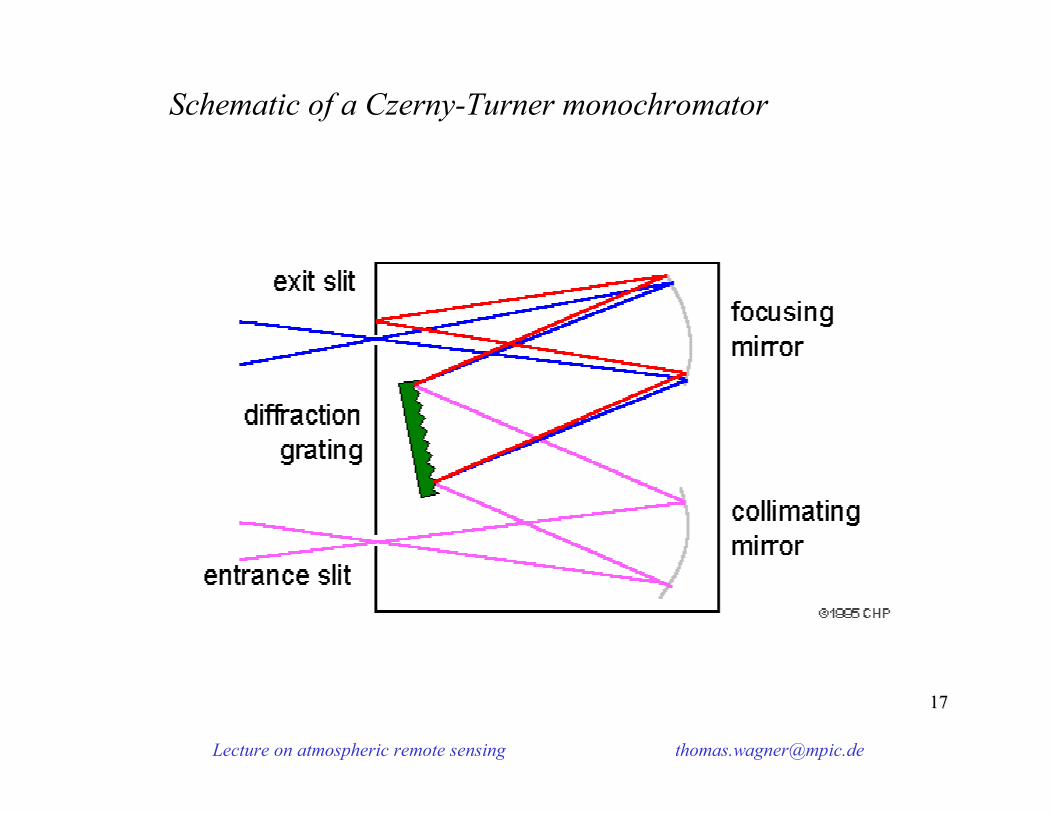
Schematic of a Czerny-Turner monochromator
Lecture on atmospheric remote sensing [email protected]
1818Diplomarbeit Jens Tschritter, IUP Heidelberg, 2007
Lecture on atmospheric remote sensing [email protected]
1919
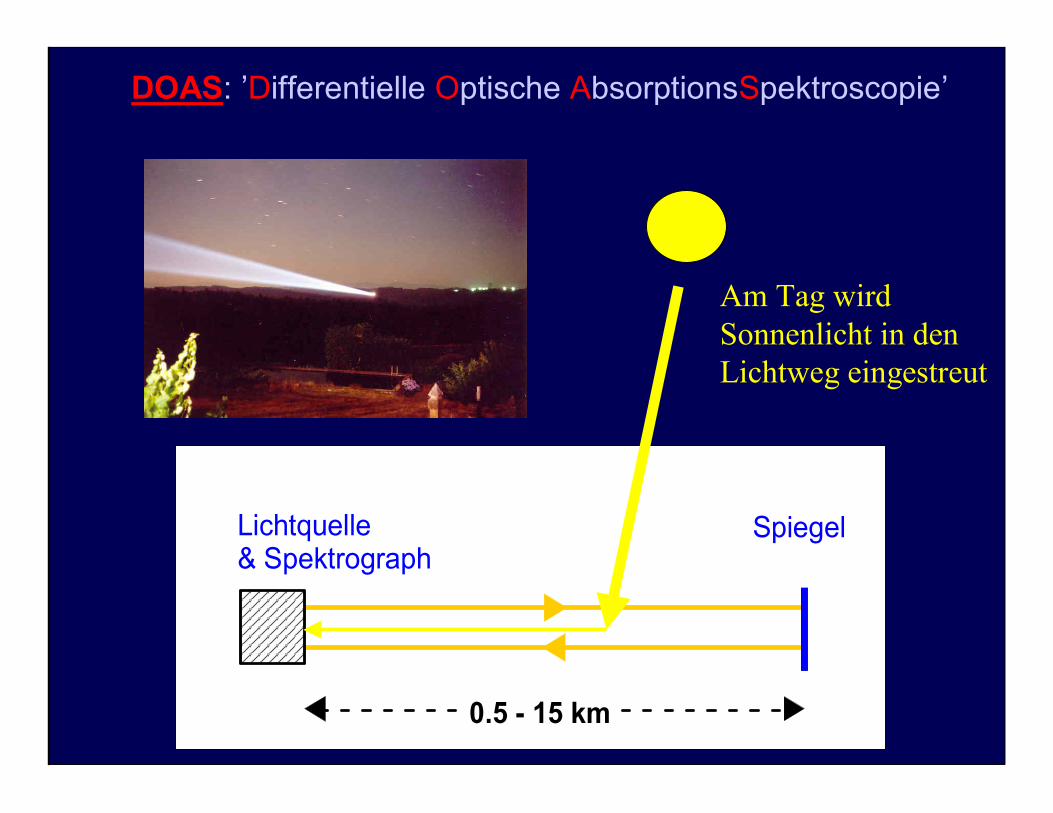
DOAS: ’Differentielle Optische AbsorptionsSpektroscopie’
SpiegelLichtquelle& Spektrograph
0.5 - 15 km
Am Tag wird Sonnenlicht in den Lichtweg eingestreut
Lecture on atmospheric remote sensing [email protected]
2020
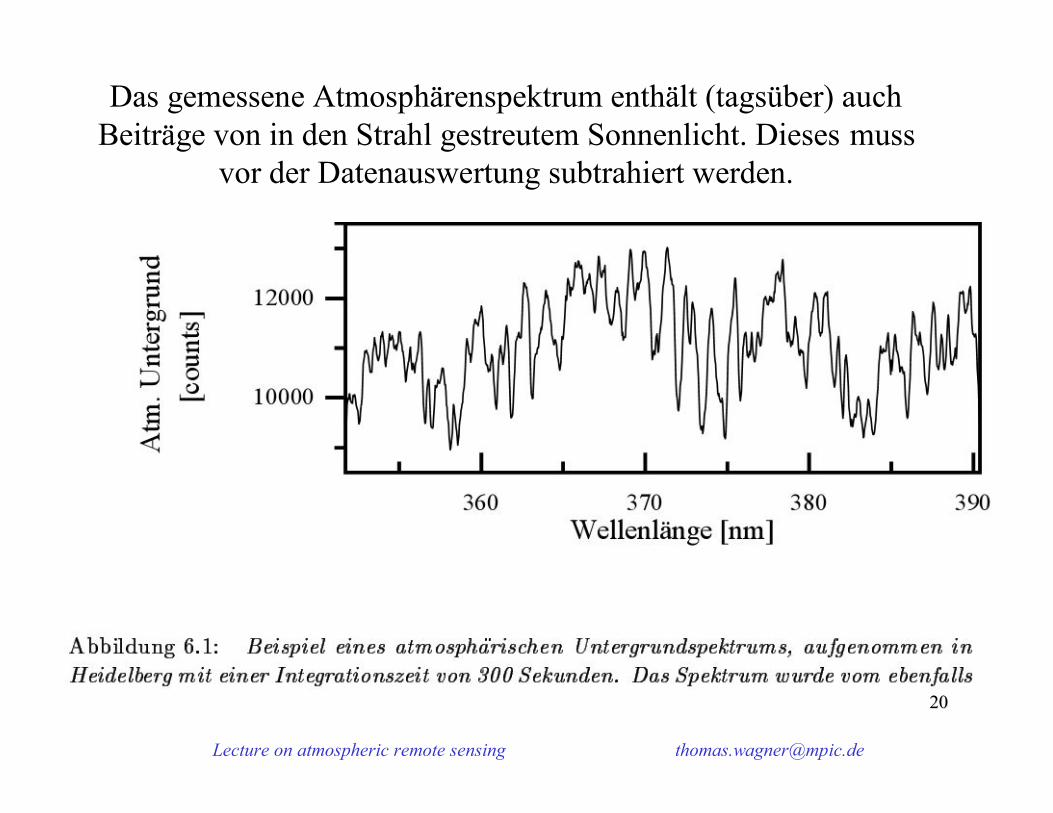
Das gemessene Atmosphärenspektrum enthält (tagsüber) auch Beiträge von in den Strahl gestreutem Sonnenlicht. Dieses muss
vor der Datenauswertung subtrahiert werden.
Lecture on atmospheric remote sensing [email protected]
2121
l
si
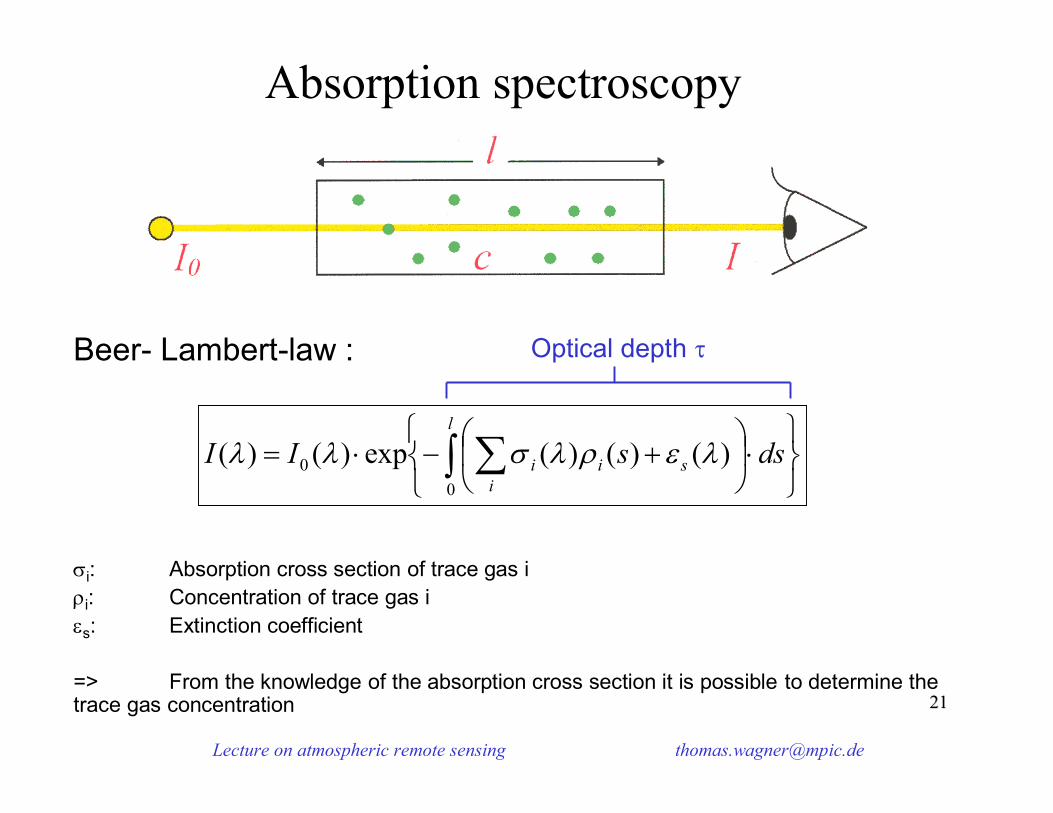
ii dssII0
0 )()()(exp)()(
Beer- Lambert-law :
i: Absorption cross section of trace gas ii: Concentration of trace gas is: Extinction coefficient
=> From the knowledge of the absorption cross section it is possible to determine the trace gas concentration
Absorption spectroscopy
Optical depth
Lecture on atmospheric remote sensing [email protected]
2222
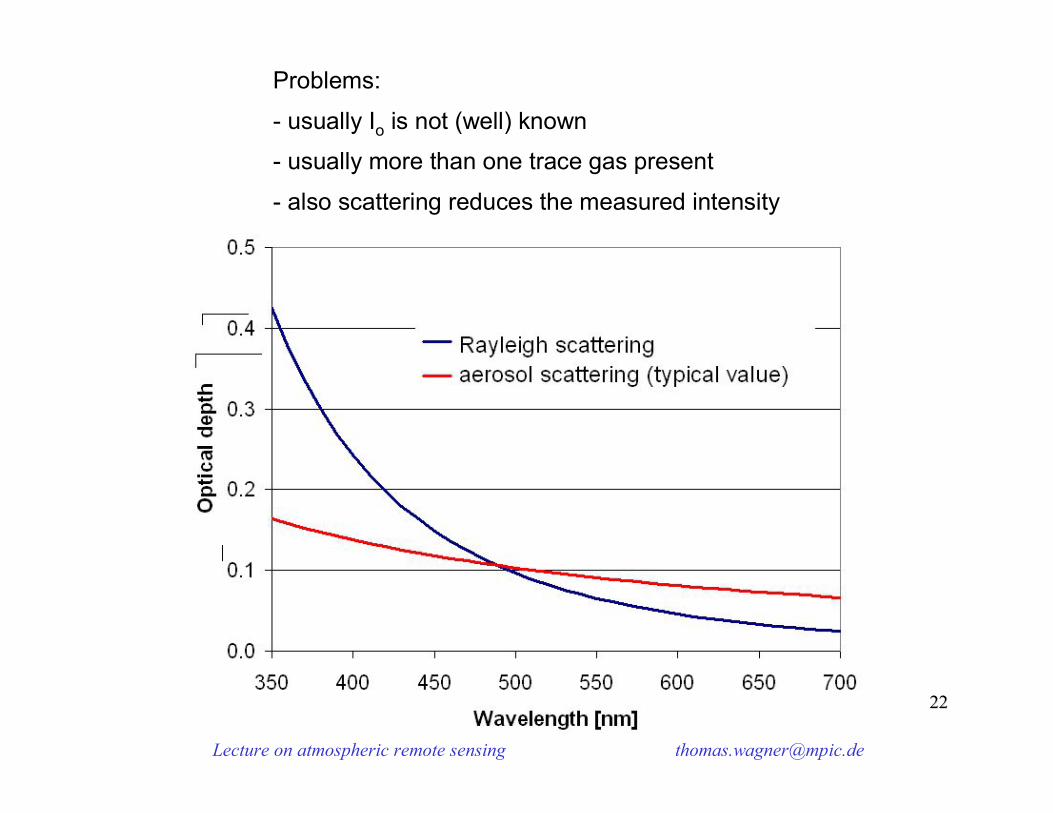
Problems:
- usually Io is not (well) known
- usually more than one trace gas present
- also scattering reduces the measured intensity

Lecture on atmospheric remote sensing [email protected]
2323
Beer- Lambert-law :
I0‘i: Intensity minus all broad and contributions (absorption & scattering)‘i: Differential absorption cross section of trace gas ii: Concentration of trace gas is: Extinction coefficient
=> From the knowledge of the differential absorption cross section it is possible todetermine the trace gas concentration
l
iii dssII
00 )()('exp)(')(
Differential absorption spectroscopy
Differential optical depth ‘
Lecture on atmospheric remote sensing [email protected]
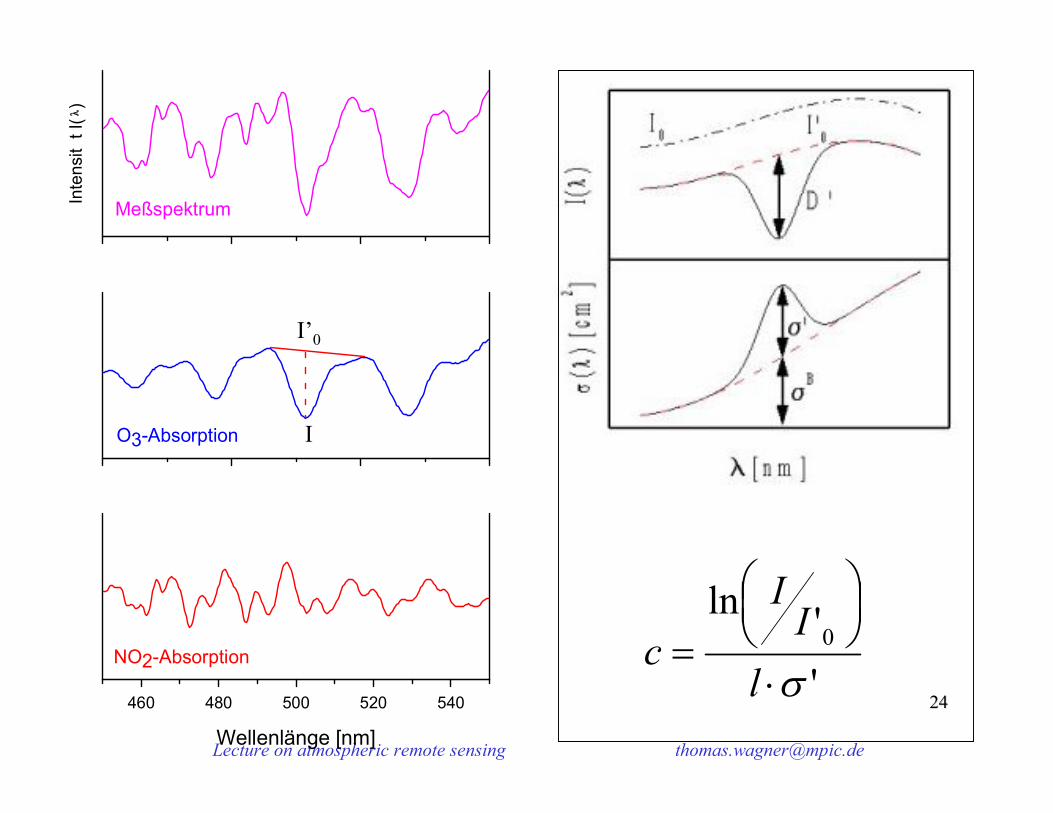
2424460 480 500 520 540
Wellenlänge [nm]
Inte
nsit
t I(
)
O3-Absorption
NO2-Absorption
Meßspektrum
'differentielle'optische DichteI’0
I
''ln0
l
II
c
Lecture on atmospheric remote sensing [email protected]
2626
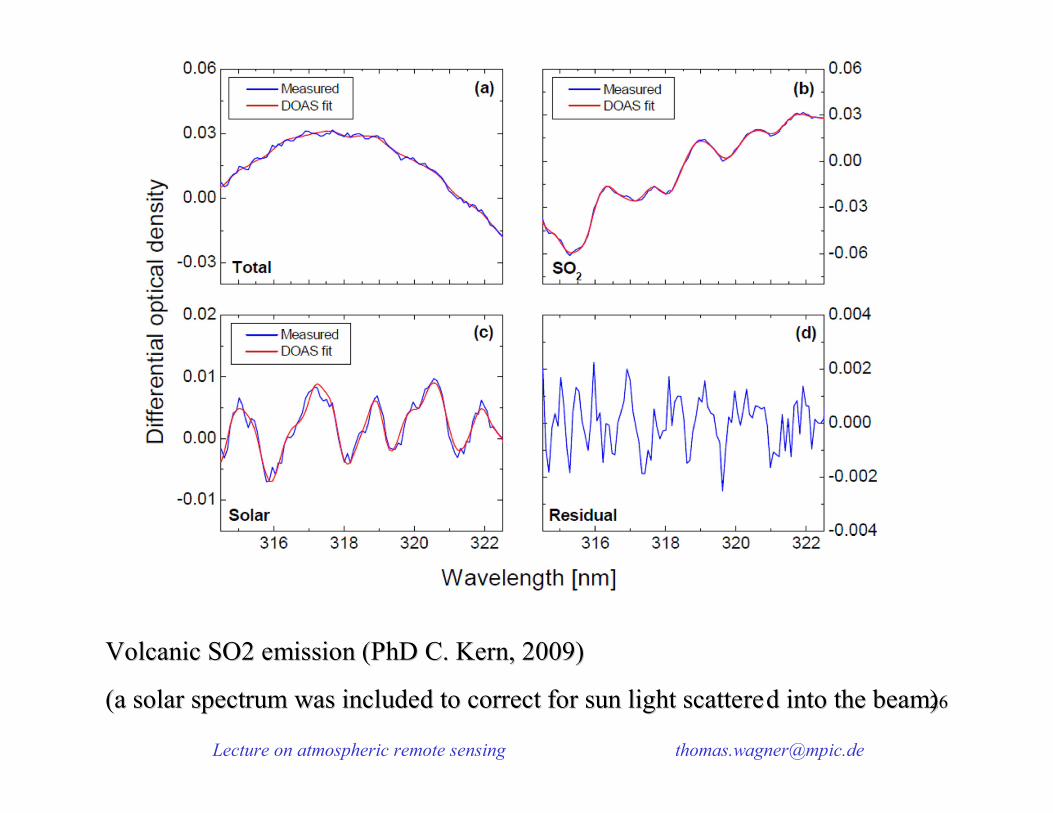
Volcanic SO2 emission (PhD C. Kern, 2009)Volcanic SO2 emission (PhD C. Kern, 2009)
(a solar spectrum was included to correct for sun light scattere(a solar spectrum was included to correct for sun light scattered into the beam)d into the beam)
Lecture on atmospheric remote sensing [email protected]
2727
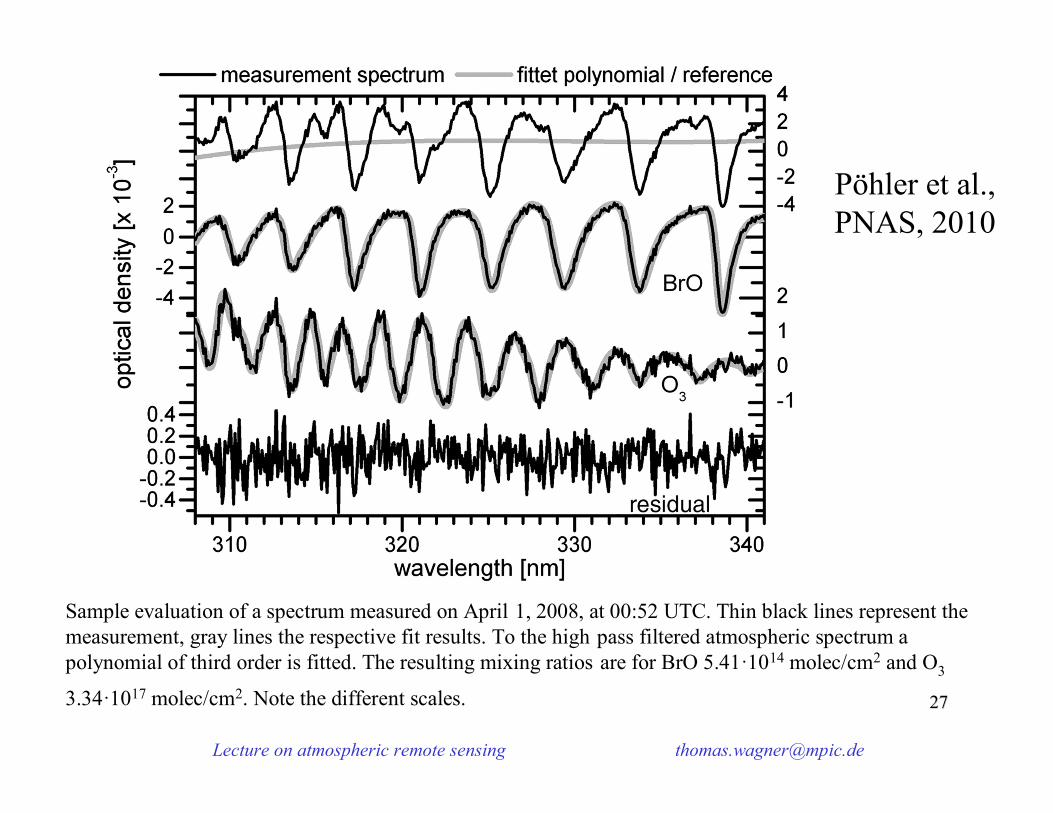
Pöhler et al., PNAS, 2010
Sample evaluation of a spectrum measured on April 1, 2008, at 00:52 UTC. Thin black lines represent the measurement, gray lines the respective fit results. To the high pass filtered atmospheric spectrum a polynomial of third order is fitted. The resulting mixing ratios are for BrO 5.41·1014 molec/cm2 and O3
3.34·1017 molec/cm2. Note the different scales.
Lecture on atmospheric remote sensing [email protected]
2828
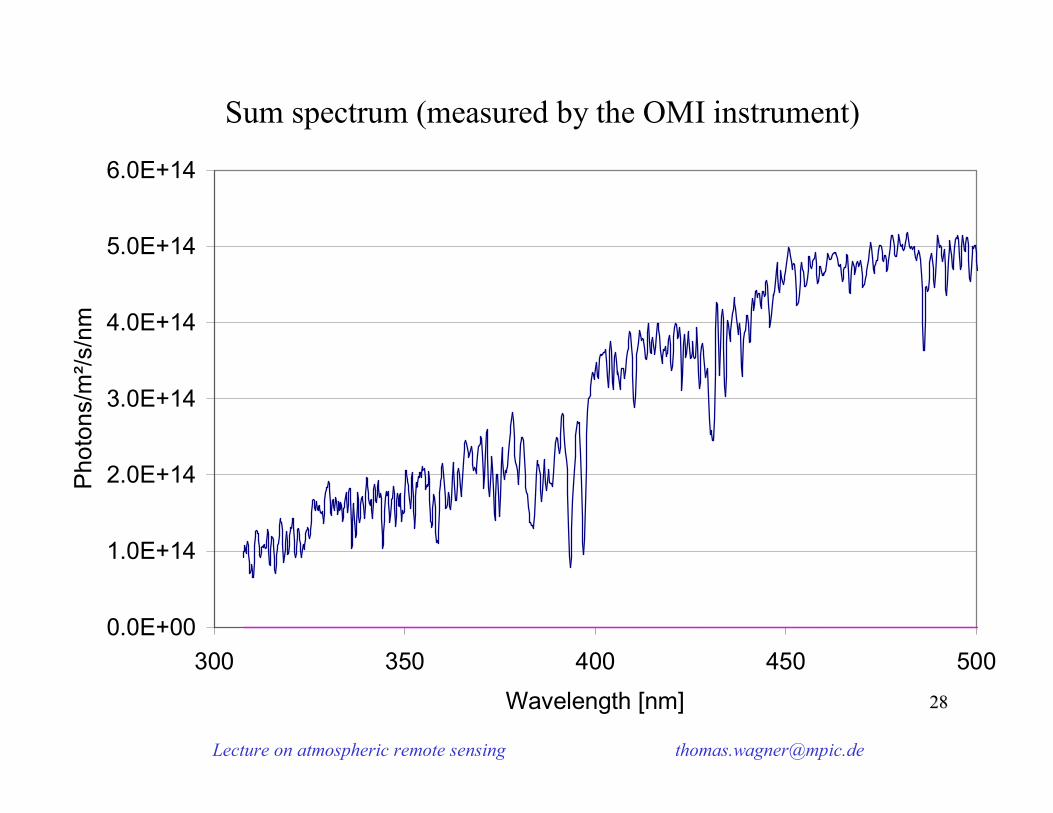
Sum spectrum (measured by the OMI instrument)
0.0E+00
1.0E+14
2.0E+14
3.0E+14
4.0E+14
5.0E+14
6.0E+14
300 350 400 450 500Wavelength [nm]
Pho
tons
/m²/s
/nm
Lecture on atmospheric remote sensing [email protected]
2929
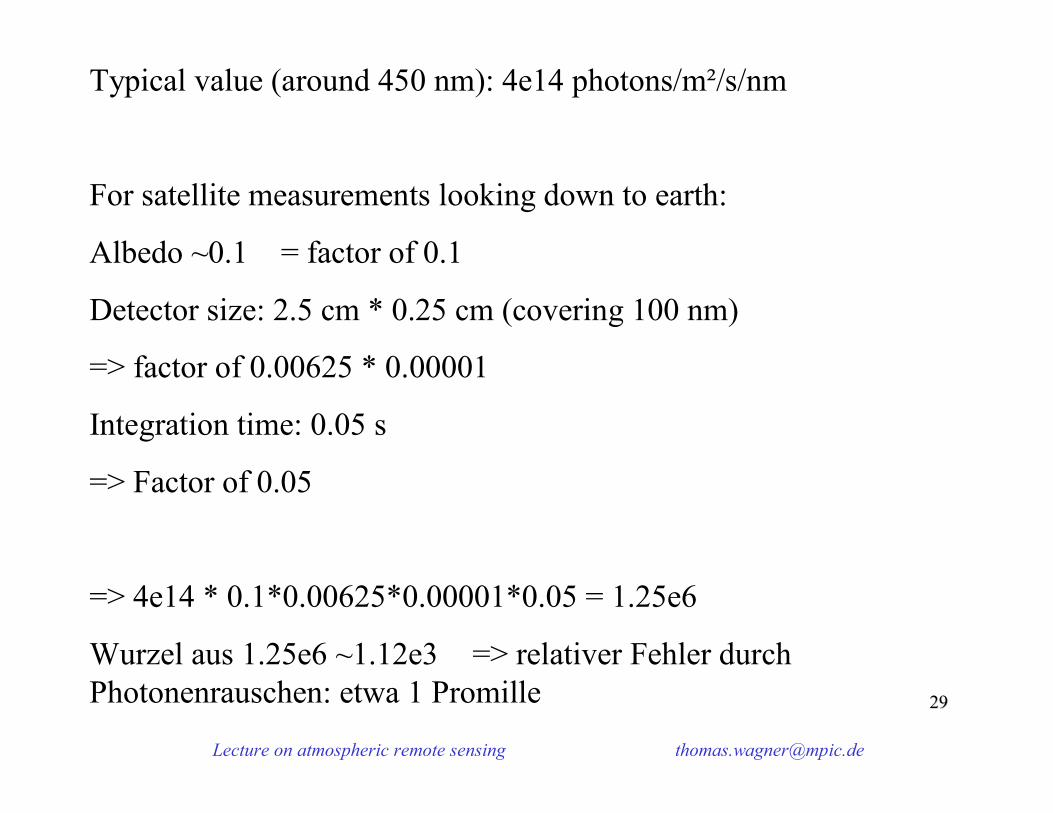
Typical value (around 450 nm): 4e14 photons/m²/s/nm
For satellite measurements looking down to earth:
Albedo ~0.1 = factor of 0.1
Detector size: 2.5 cm * 0.25 cm (covering 100 nm)
=> factor of 0.00625 * 0.00001
Integration time: 0.05 s
=> Factor of 0.05
=> 4e14 * 0.1*0.00625*0.00001*0.05 = 1.25e6
Wurzel aus 1.25e6 ~1.12e3 => relativer Fehler durch Photonenrauschen: etwa 1 Promille

Lecture on atmospheric remote sensing [email protected]
3030
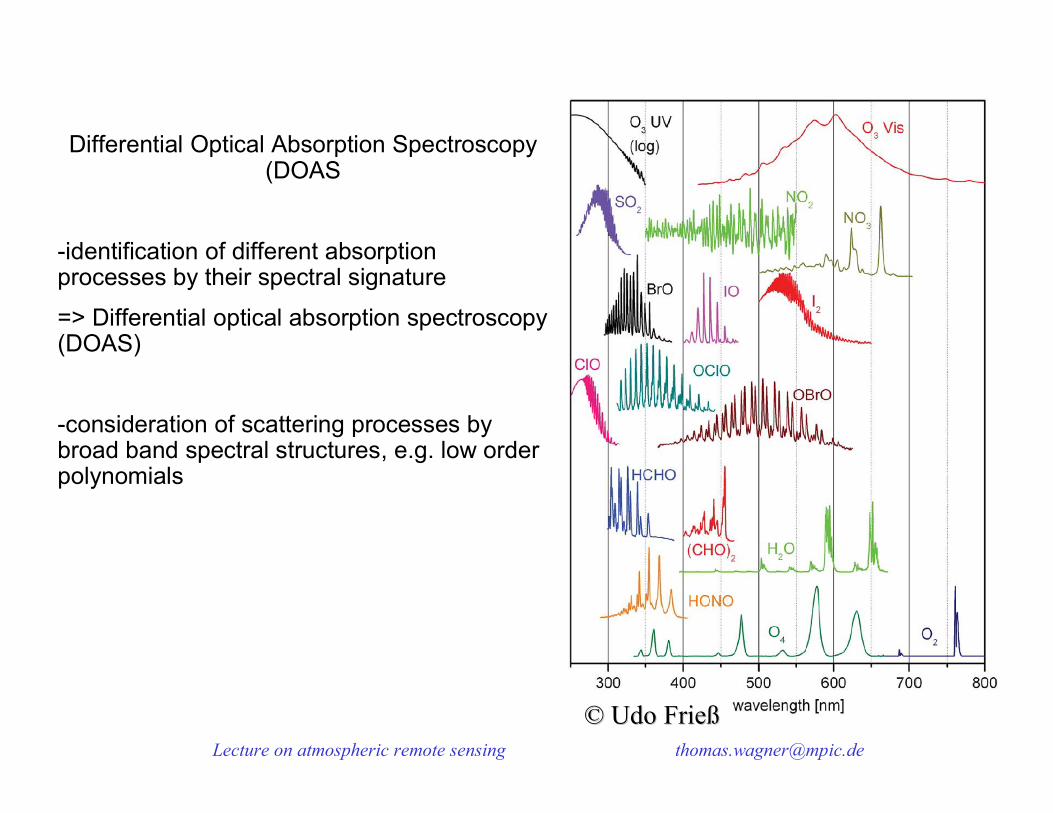
Differential Optical Absorption Spectroscopy (DOAS
-identification of different absorption processes by their spectral signature
=> Differential optical absorption spectroscopy(DOAS)
-consideration of scattering processes by broad band spectral structures, e.g. low orderpolynomials
© Udo © Udo FrießFrieß
Lecture on atmospheric remote sensing [email protected]
3131
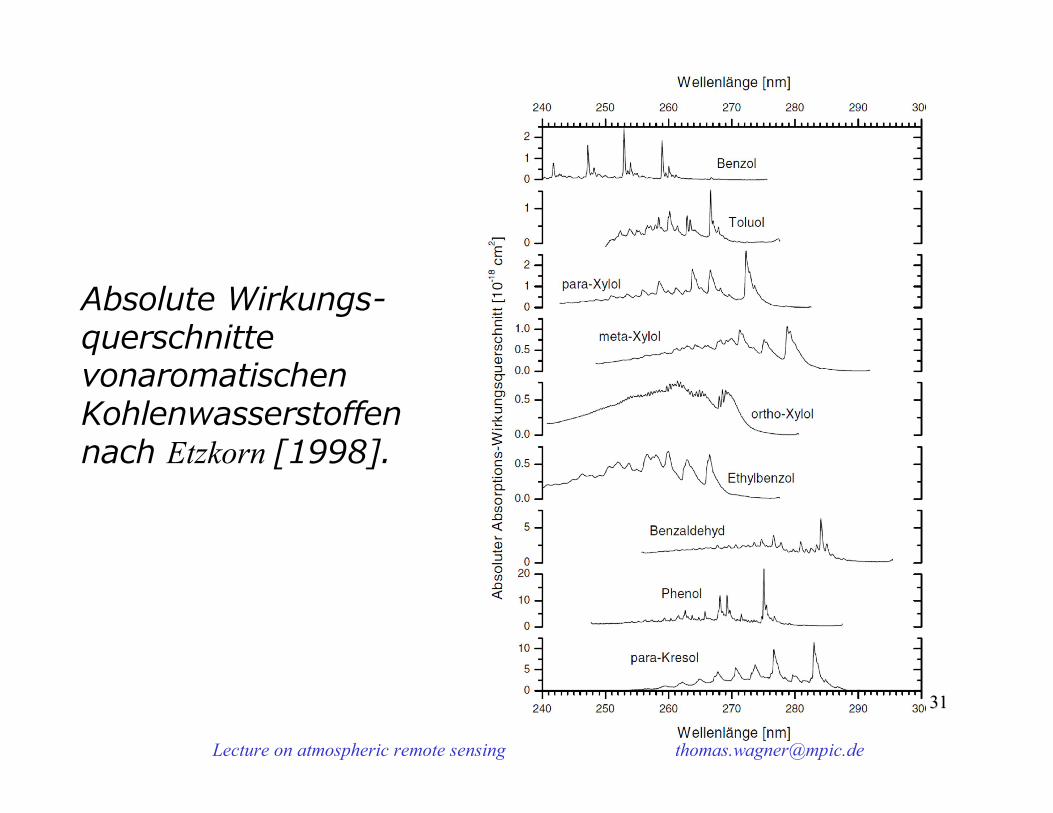
Absolute Wirkungs-querschnitte vonaromatischen Kohlenwasserstoffen nach Etzkorn [1998].
Lecture on atmospheric remote sensing [email protected]
3232
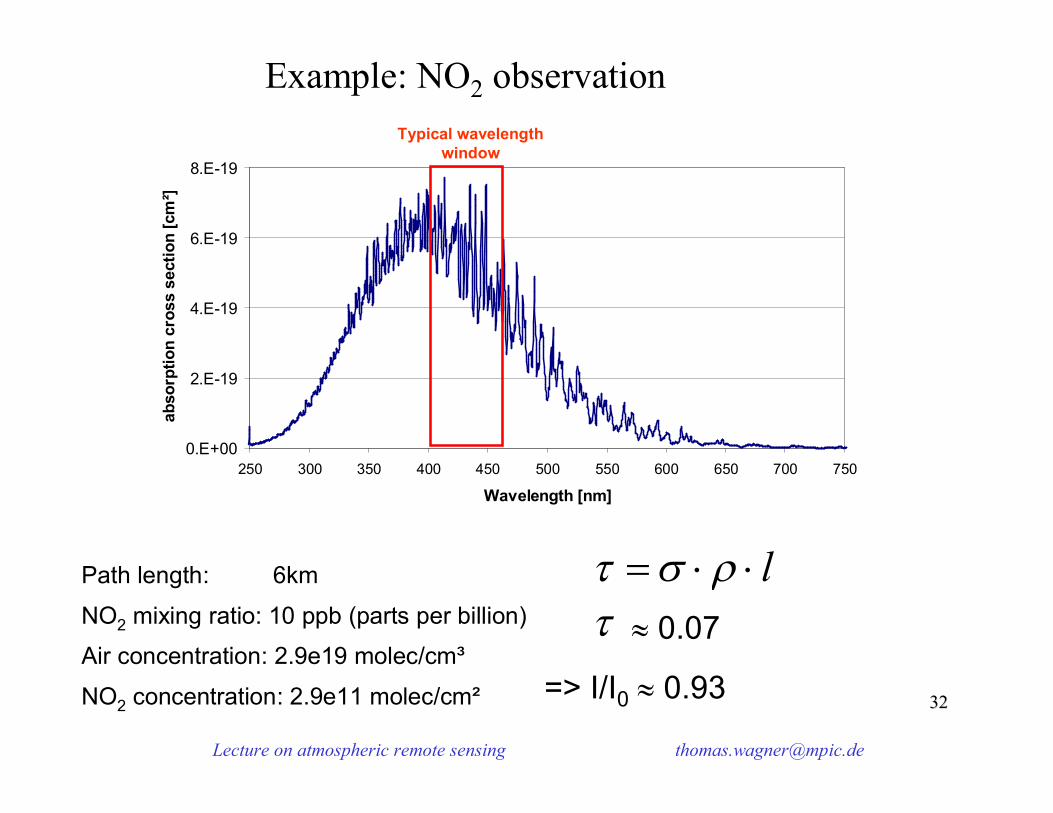
Example: NO2 observation
0.E+00
2.E-19
4.E-19
6.E-19
8.E-19
250 300 350 400 450 500 550 600 650 700 750
Wavelength [nm]
abso
rptio
n cr
oss
sect
ion
[cm
²]
l Path length: 6km
NO2 mixing ratio: 10 ppb (parts per billion)
Air concentration: 2.9e19 molec/cm³
NO2 concentration: 2.9e11 molec/cm²
Typical wavelength window
0.07
=> I/I0 0.93
Lecture on atmospheric remote sensing [email protected]
3333
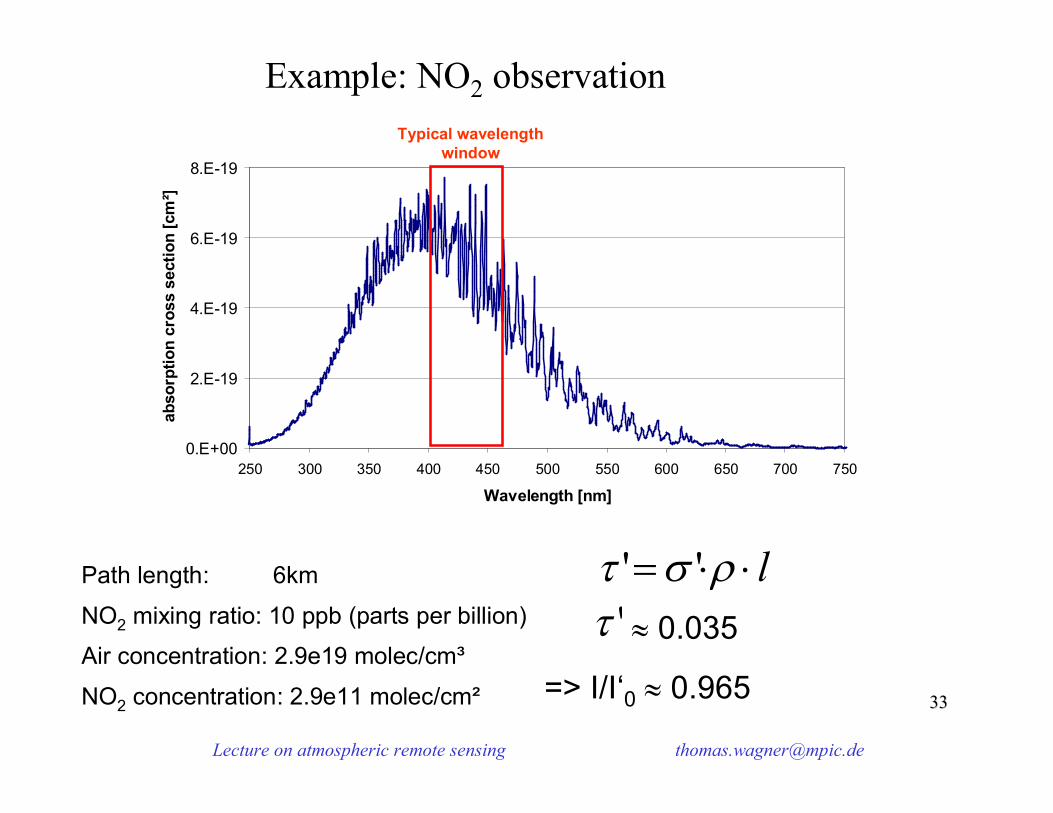
Example: NO2 observation
0.E+00
2.E-19
4.E-19
6.E-19
8.E-19
250 300 350 400 450 500 550 600 650 700 750
Wavelength [nm]
abso
rptio
n cr
oss
sect
ion
[cm
²]
l ''Path length: 6km
NO2 mixing ratio: 10 ppb (parts per billion)
Air concentration: 2.9e19 molec/cm³
NO2 concentration: 2.9e11 molec/cm²
Typical wavelength window
' 0.035
=> I/I‘0 0.965
Lecture on atmospheric remote sensing [email protected]
3434
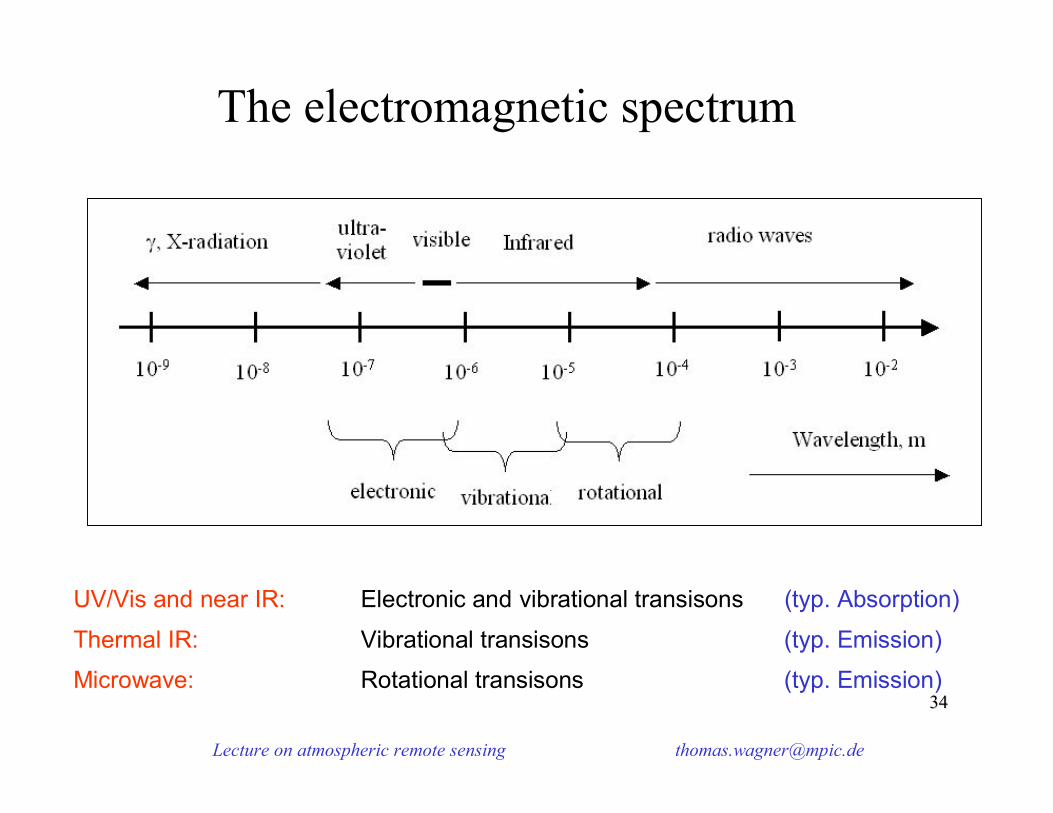
UV/Vis and near IR: Electronic and vibrational transisons (typ. Absorption)
Thermal IR: Vibrational transisons (typ. Emission)
Microwave: Rotational transisons (typ. Emission)
The electromagnetic spectrum
Lecture on atmospheric remote sensing [email protected]
3535
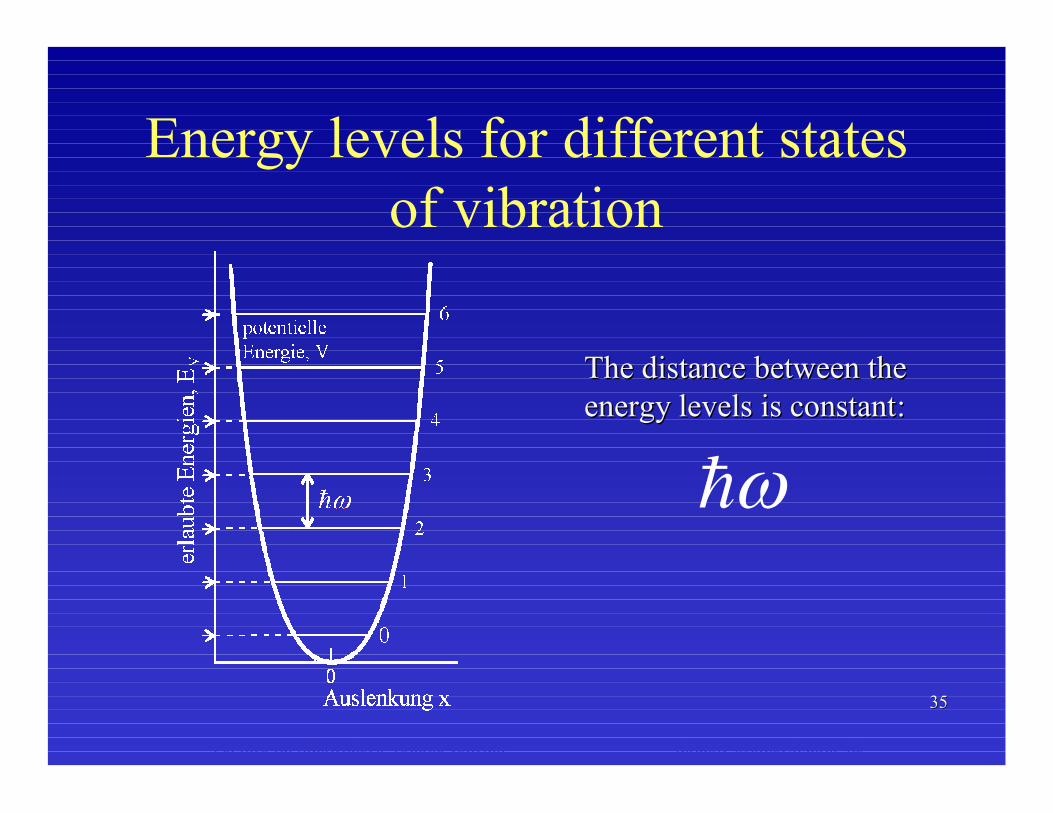
Energy levels for different statesof vibration
TheThe distancedistance between the between the energy levels is constantenergy levels is constant::
Lecture on atmospheric remote sensing [email protected]
3636
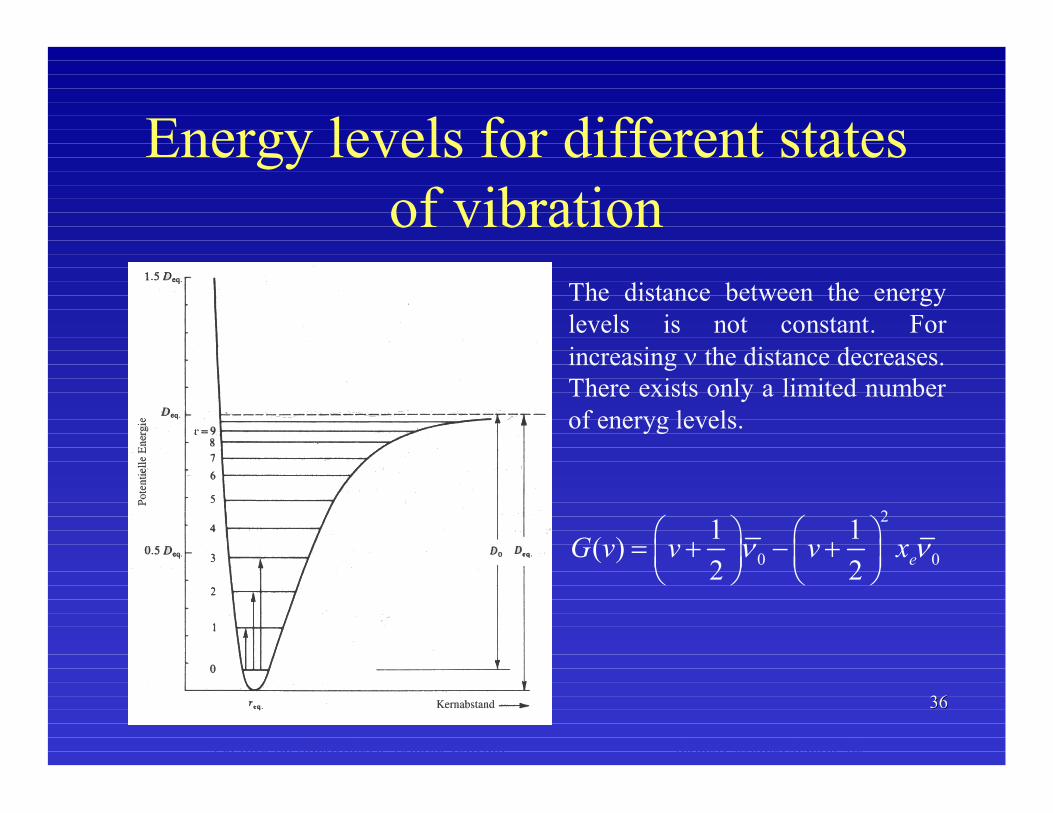
Energy levels for different statesof vibration
The distance between the energy levels is not constant. Forincreasing the distance decreases.There exists only a limited numberof eneryg levels.
2
0 01 1( )2 2
eG v v v x
Lecture on atmospheric remote sensing [email protected]
3737
0
2E-18
4E-18
6E-18
8E-18
1E-17
1.2E-17
1.4E-17
300 320 340 360 380 400 420 440Wavelength [nm]
Abs
orpt
ion
cros
s se
ctio
n [c
m²]
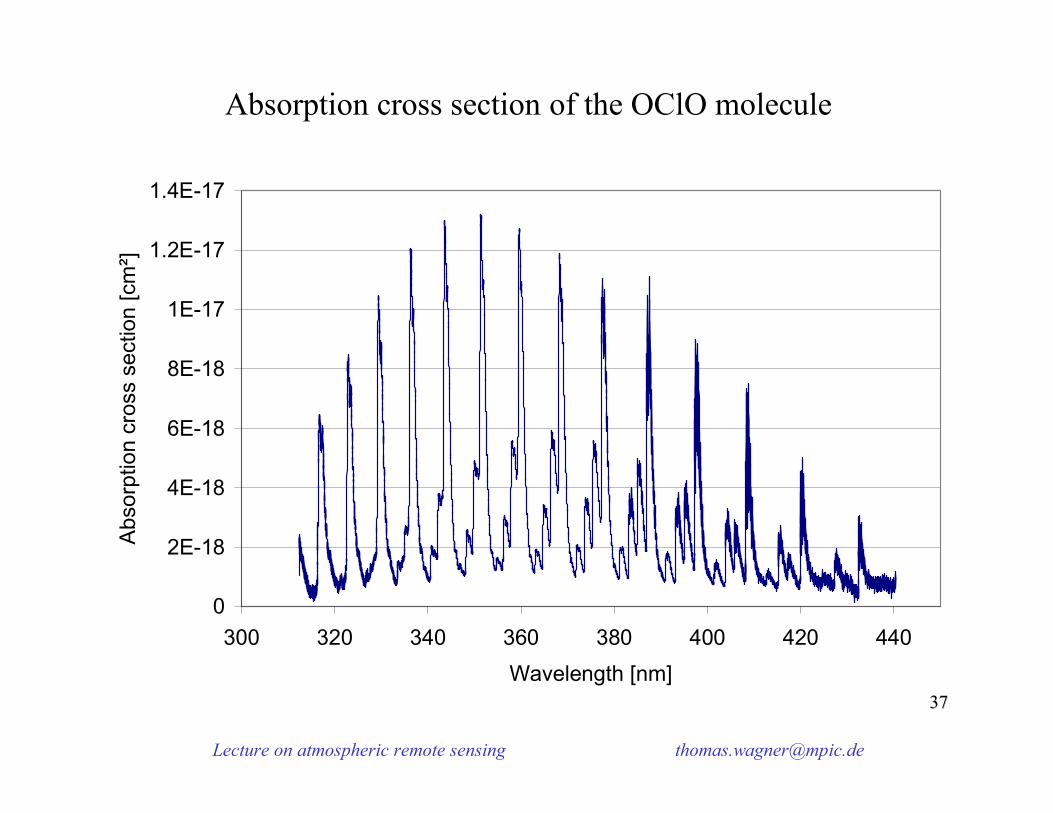
Absorption cross section of the OClO molecule
Lecture on atmospheric remote sensing [email protected]
3838
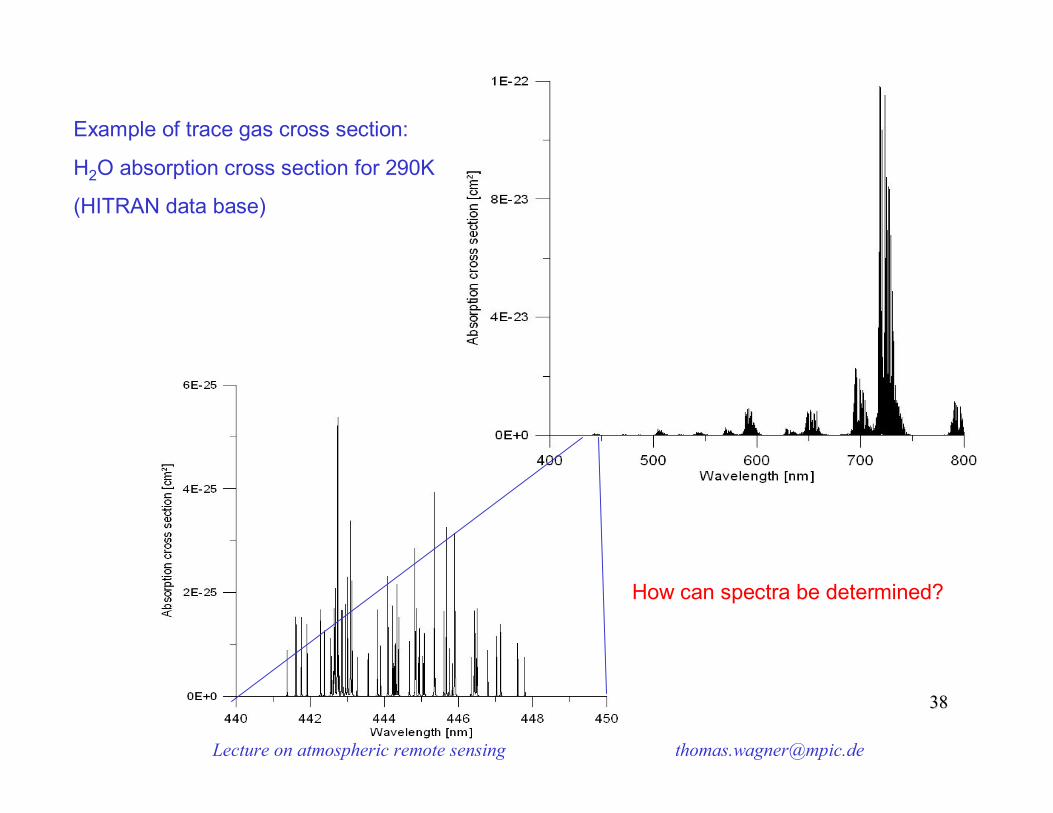
Example of trace gas cross section:
H2O absorption cross section for 290K
(HITRAN data base)
How can spectra be determined?
Lecture on atmospheric remote sensing [email protected]
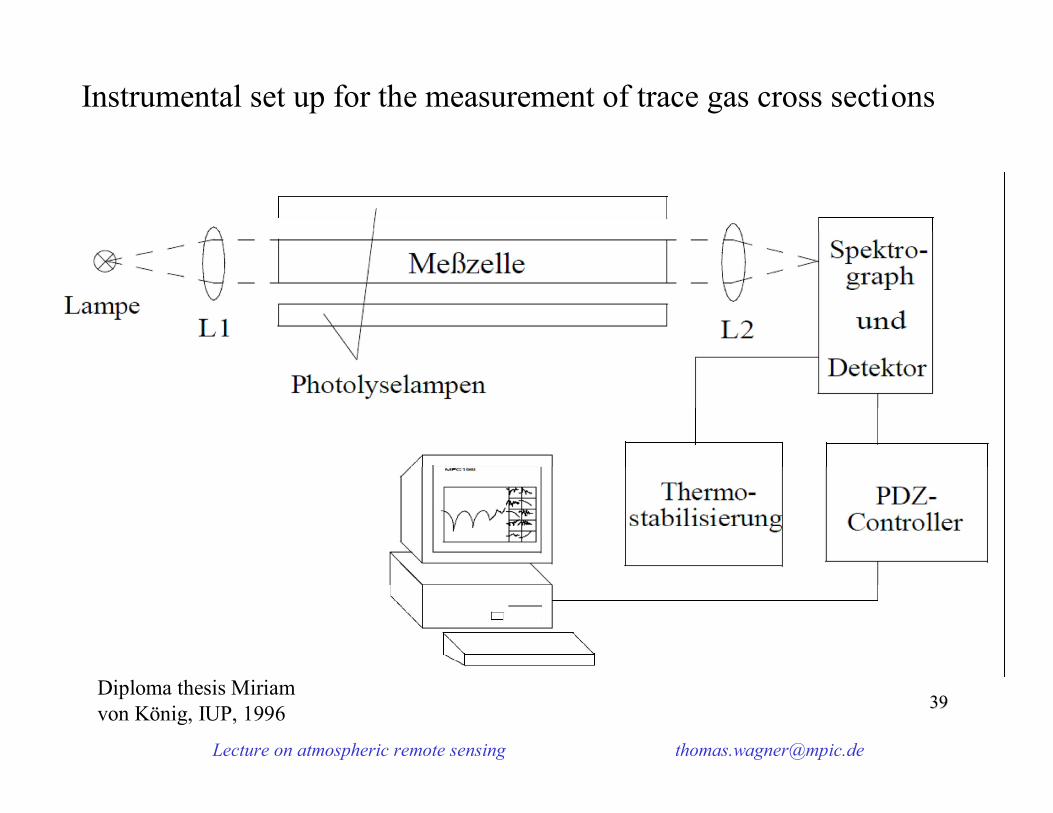
3939Diploma thesis Miriam von König, IUP, 1996
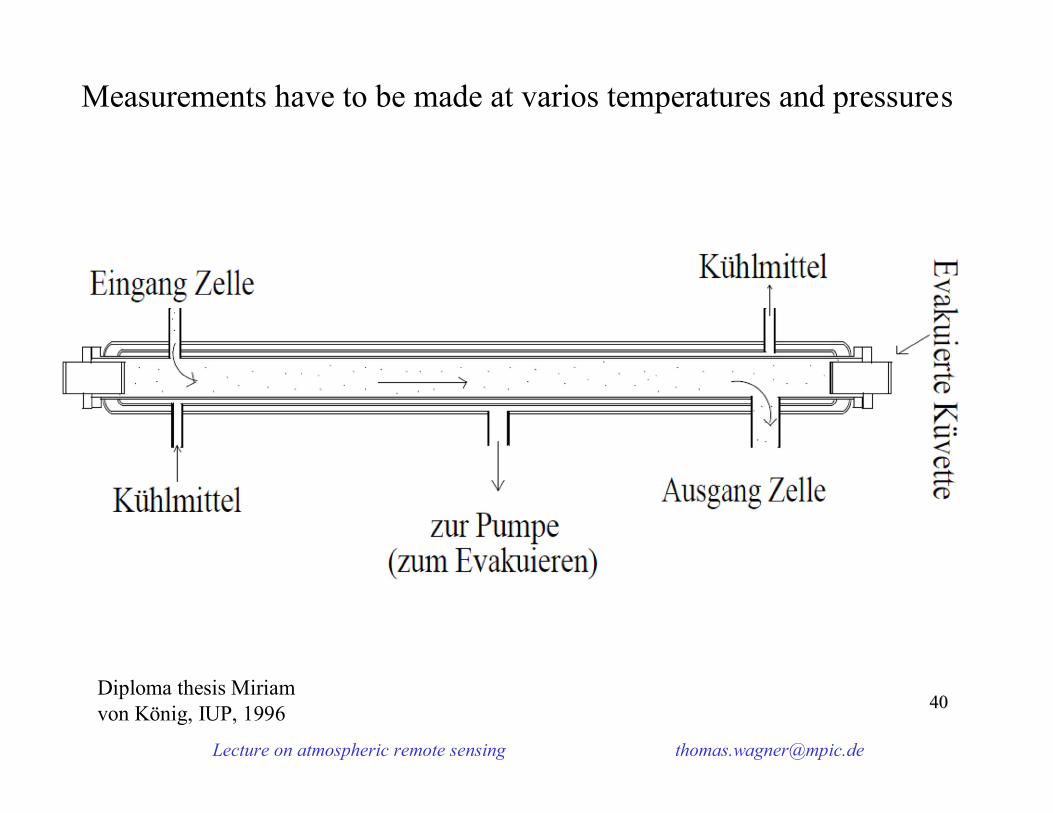
Instrumental set up for the measurement of trace gas cross sections
Lecture on atmospheric remote sensing [email protected]
4040Diploma thesis Miriam von König, IUP, 1996
Measurements have to be made at varios temperatures and pressures
Lecture on atmospheric remote sensing [email protected]
4141Johannes Orphal, IUP-Bremen
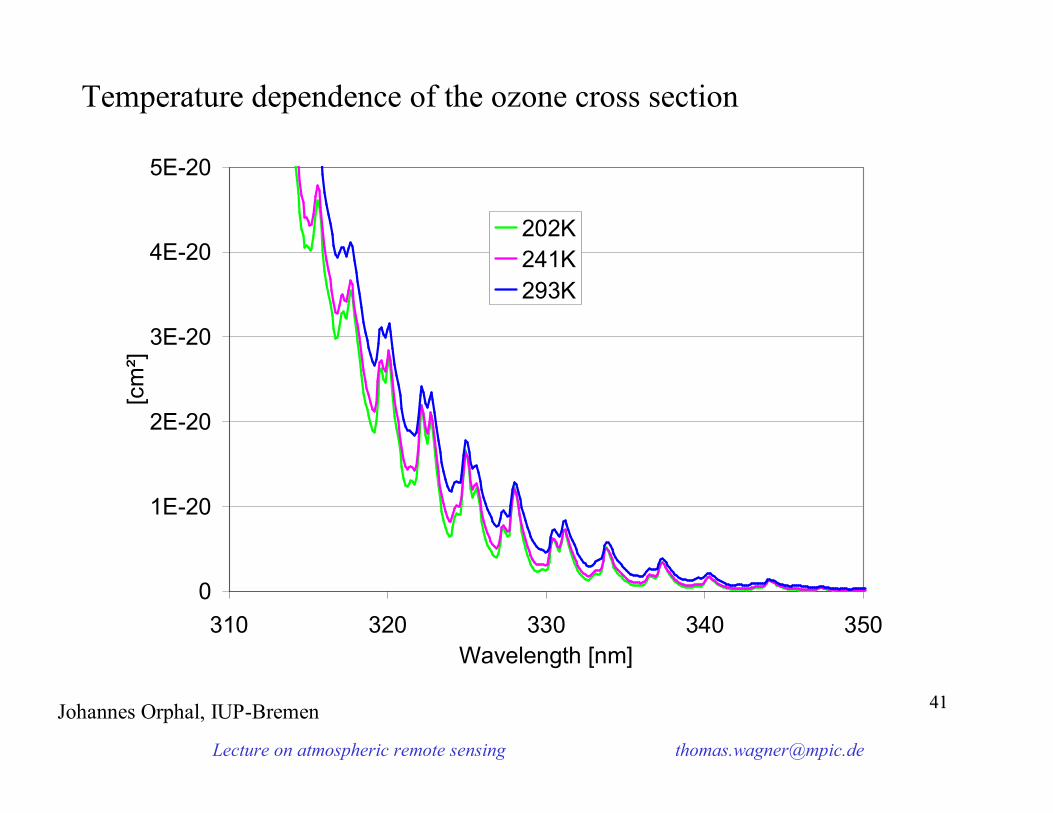
Temperature dependence of the ozone cross section
0
1E-20
2E-20
3E-20
4E-20
5E-20
310 320 330 340 350Wavelength [nm]
[cm
²]
202K241K293K
Lecture on atmospheric remote sensing [email protected]
4242Johannes Orphal, IUP-Bremen
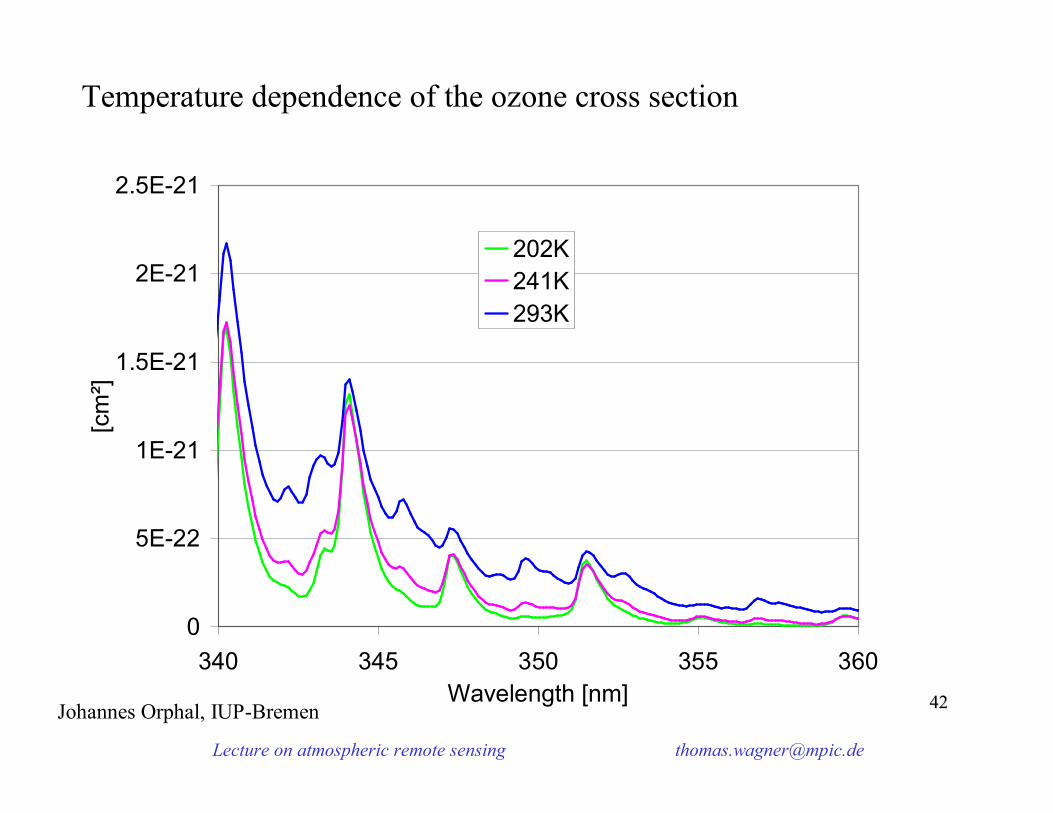
Temperature dependence of the ozone cross section
0
5E-22
1E-21
1.5E-21
2E-21
2.5E-21
340 345 350 355 360Wavelength [nm]
[cm
²]
202K241K293K
Lecture on atmospheric remote sensing [email protected]
4343
Differential Optical Absorption Spectroscopy (DOAS
-identification of different absorption processes by their spectral signature
=> Differential optical absorption spectroscopy(DOAS)
-consideration of scattering processes by broad band spectral structures, e.g. low orderpolynomials
© Udo © Udo FrießFrieß
Lecture on atmospheric remote sensing [email protected]
4444
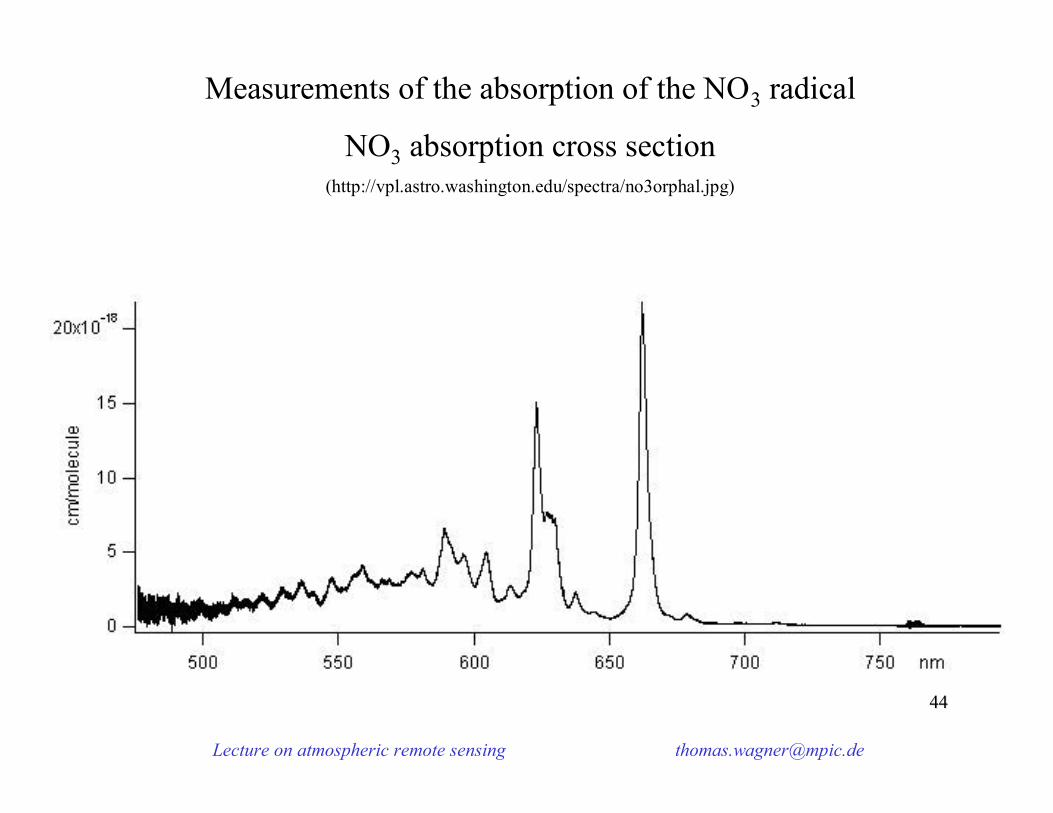
Measurements of the absorption of the NO3 radical
NO3 absorption cross section(http://vpl.astro.washington.edu/spectra/no3orphal.jpg)
Lecture on atmospheric remote sensing [email protected]
4545
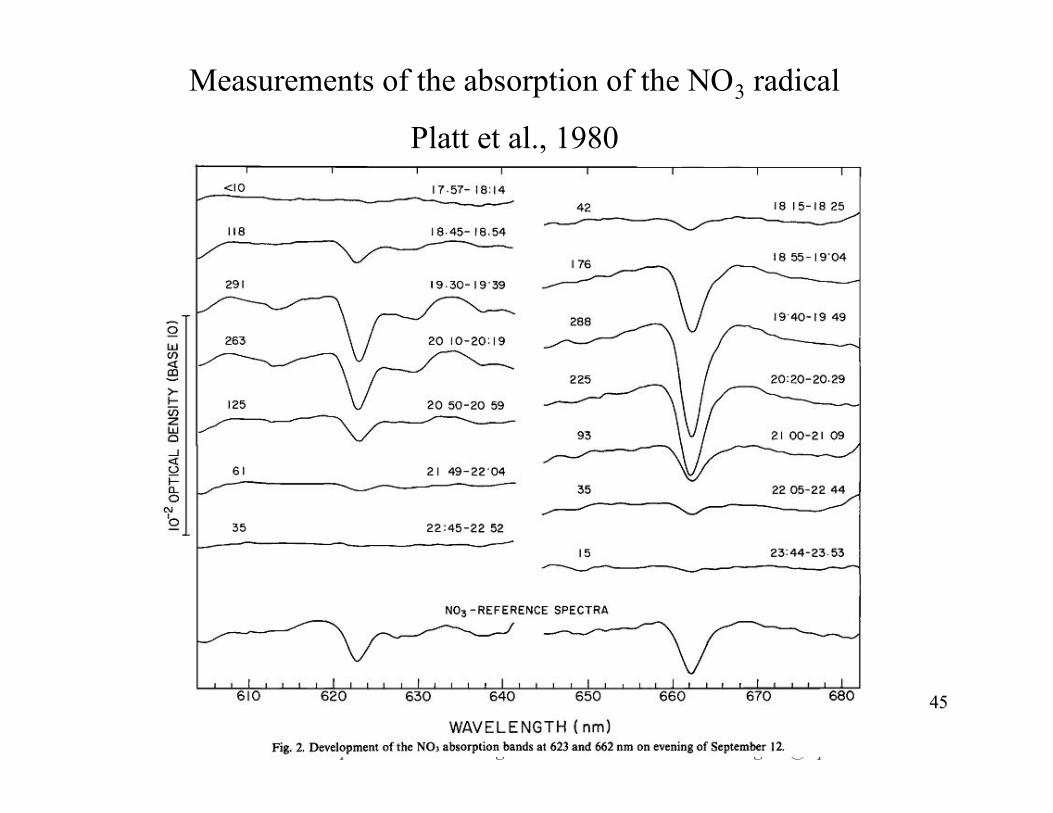
Measurements of the absorption of the NO3 radical
Platt et al., 1980
Lecture on atmospheric remote sensing [email protected]
4646
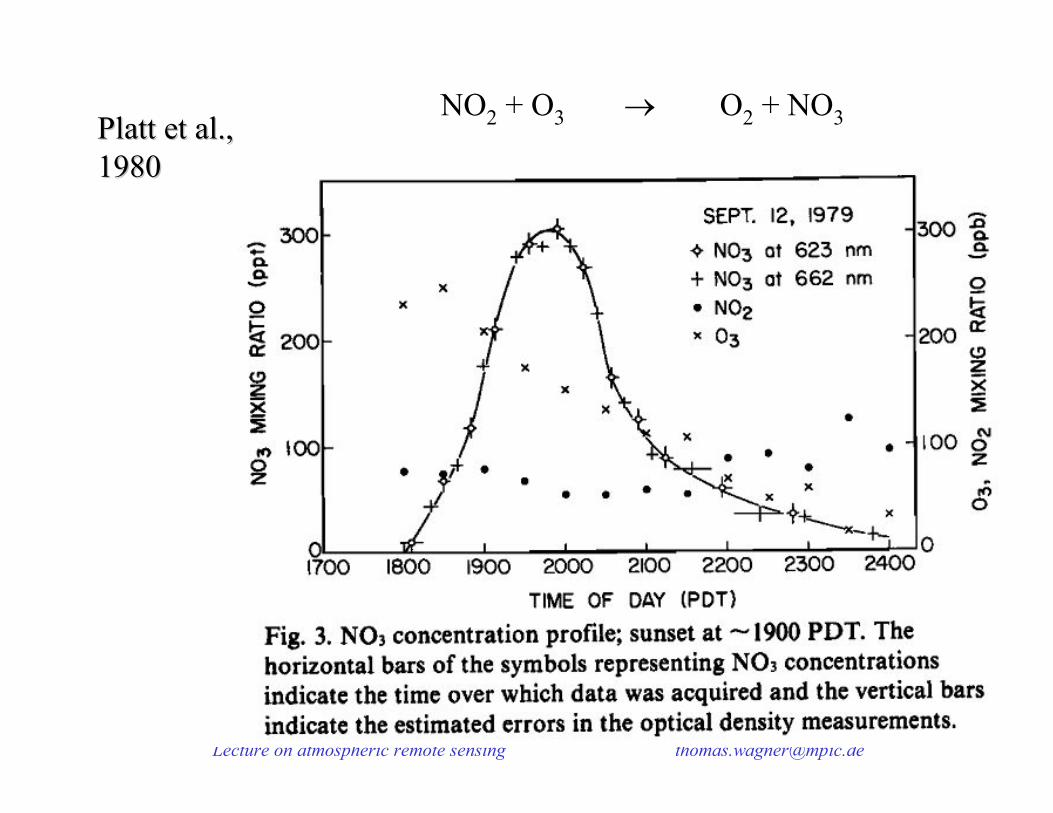
Platt et al., Platt et al., 19801980
NO2 + O3 O2 + NO3
Lecture on atmospheric remote sensing [email protected]
4747
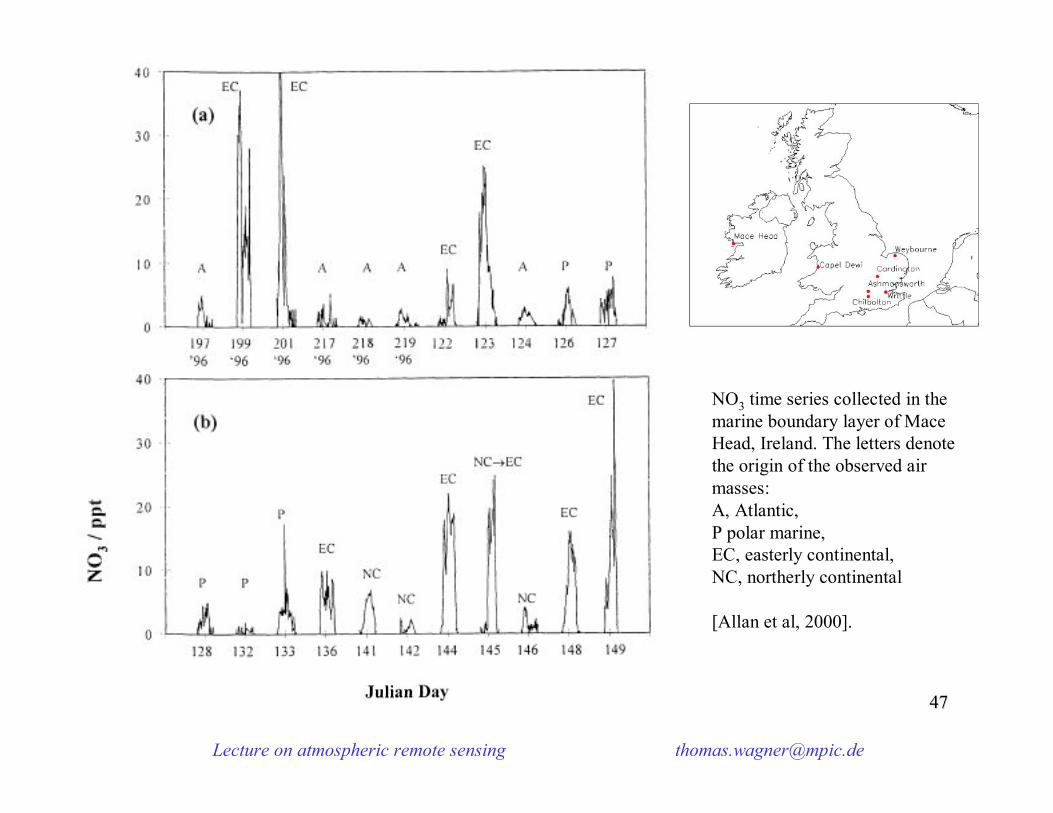
NO3 time series collected in the marine boundary layer of Mace Head, Ireland. The letters denote the origin of the observed air masses: A, Atlantic, P polar marine, EC, easterly continental, NC, northerly continental
[Allan et al, 2000].
Lecture on atmospheric remote sensing [email protected]
4848
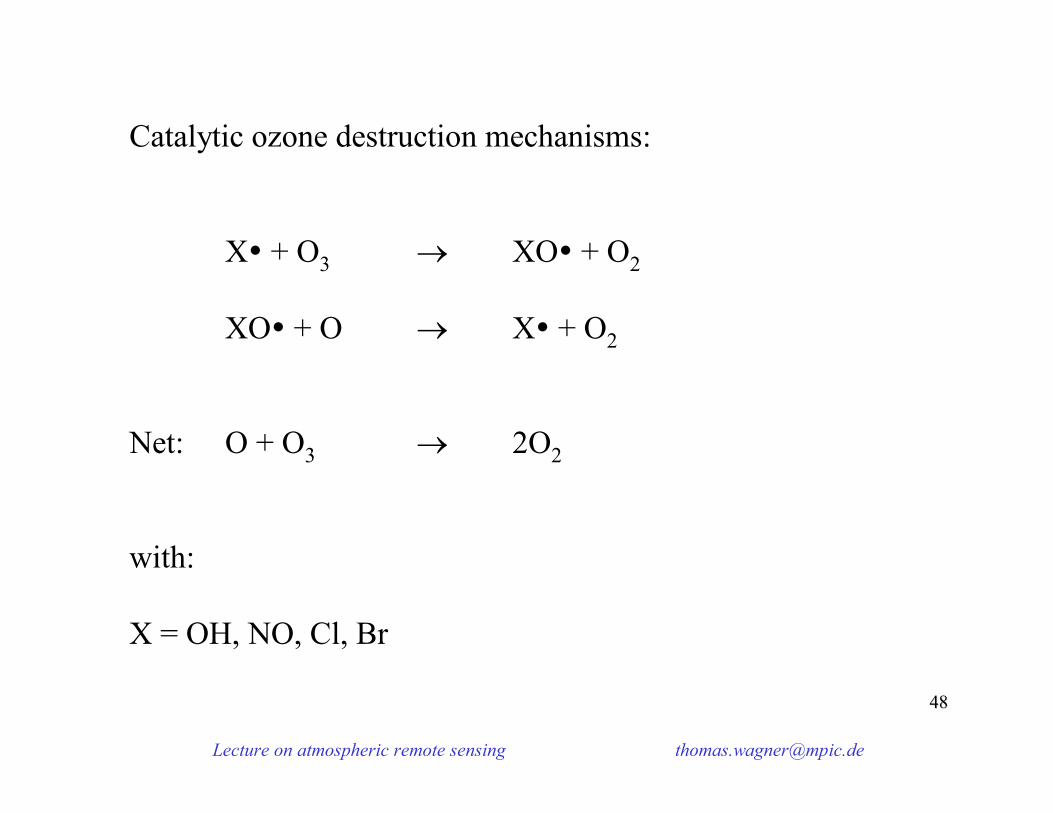
Catalytic ozone destruction mechanisms:
X + O3 XO + O2
XO + O X + O2
Net: O + O3 2O2
with:
X = OH, NO, Cl, Br
Lecture on atmospheric remote sensing [email protected]
4949
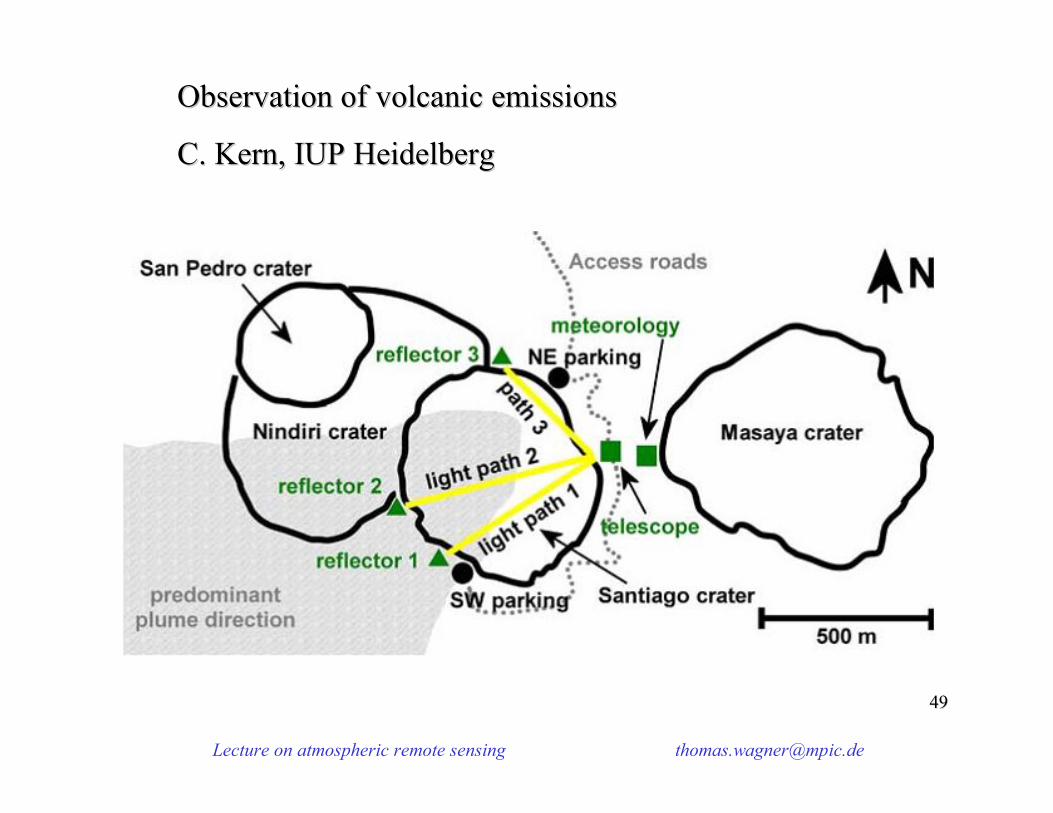
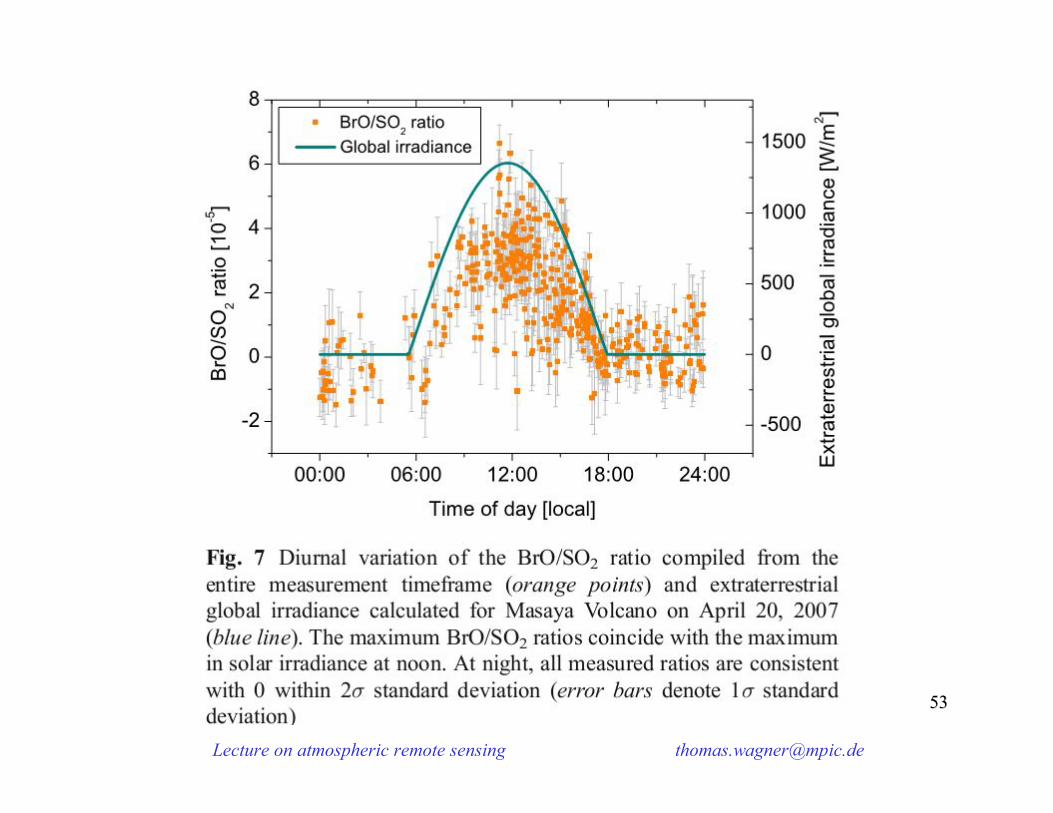
Observation of Observation of volcanic emissionsvolcanic emissions
C. Kern, IUP HeidelbergC. Kern, IUP Heidelberg

Lecture on atmospheric remote sensing [email protected]
5454
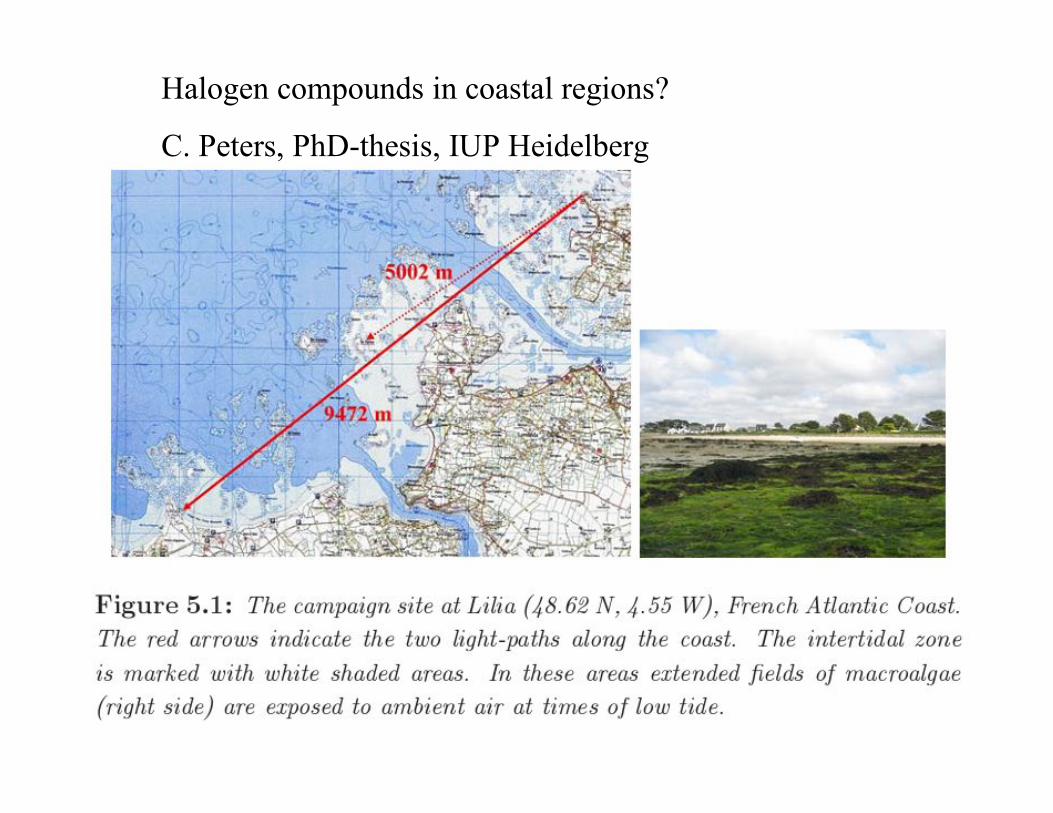
Halogen compounds in coastal regions?
C. Peters, PhD-thesis, IUP Heidelberg
Lecture on atmospheric remote sensing [email protected]
5555425 430 435 440
0.996
0.998
1.000
1.002
wavelength [nm]
residual
0.996
0.998
1.000
1.002
optic
al d
ensi
ty atmospheric spectrum
0.99995
1.00000
1.00005IO reference
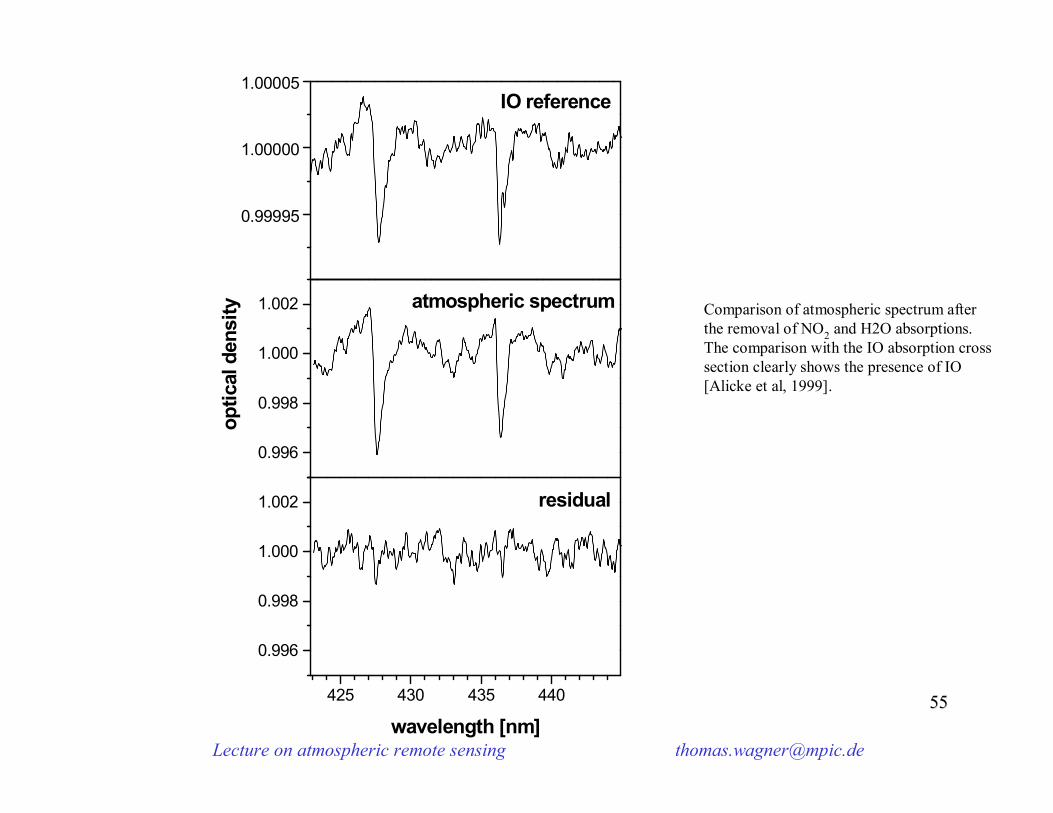
Comparison of atmospheric spectrum after the removal of NO2 and H2O absorptions. The comparison with the IO absorption cross section clearly shows the presence of IO [Alicke et al, 1999].
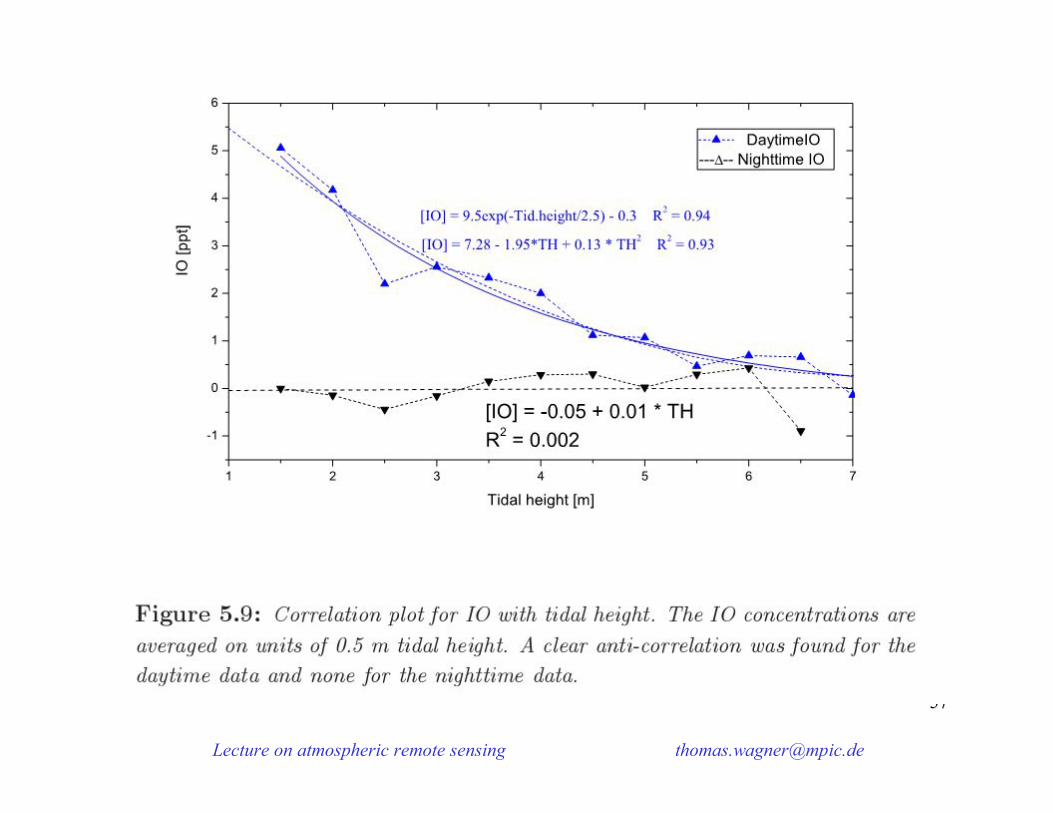

Lecture on atmospheric remote sensing [email protected]
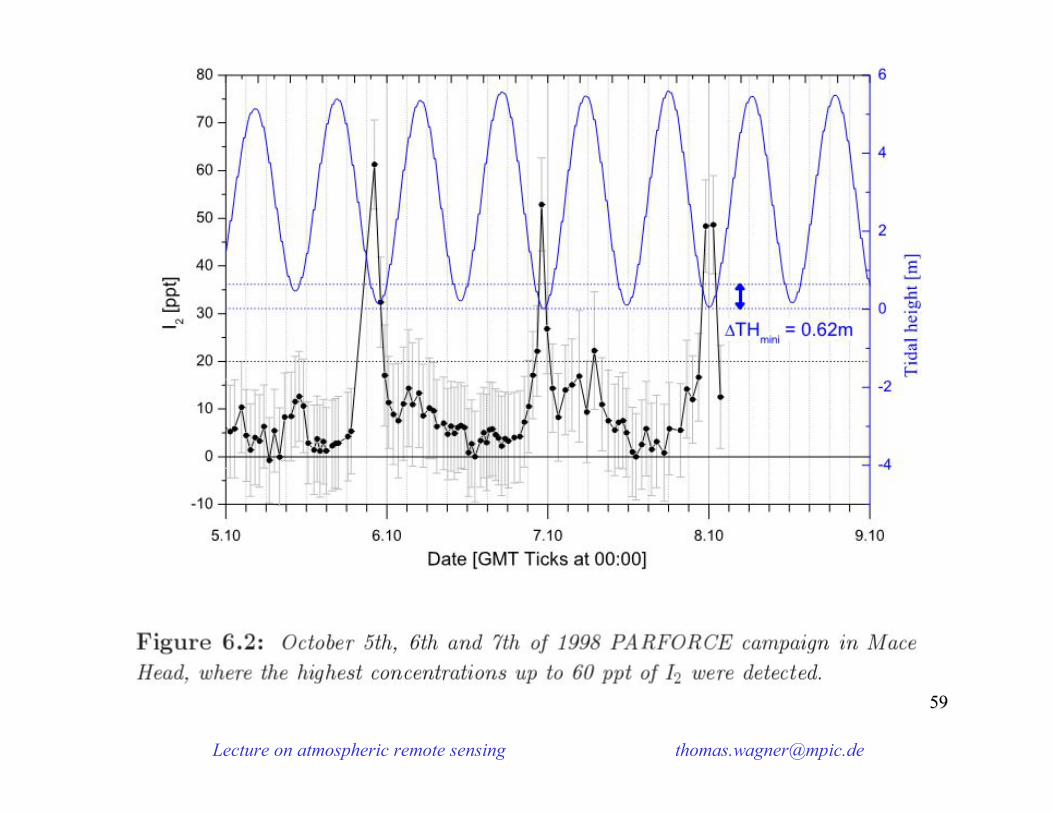
6161
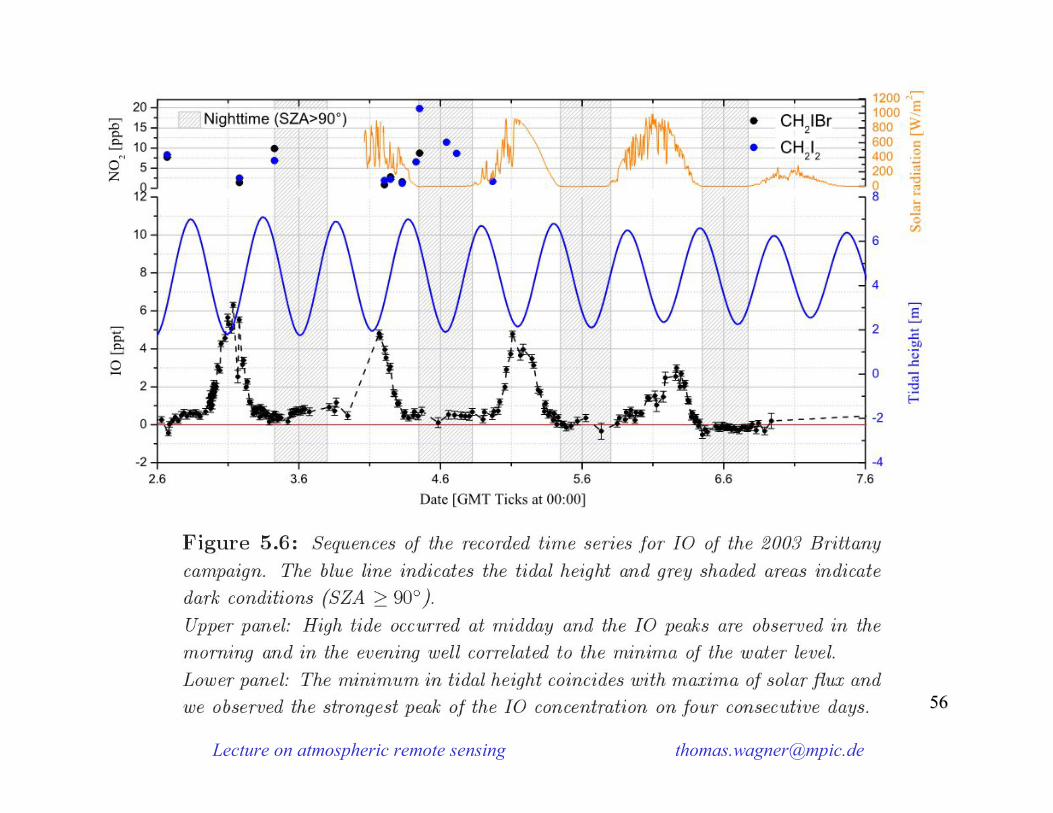
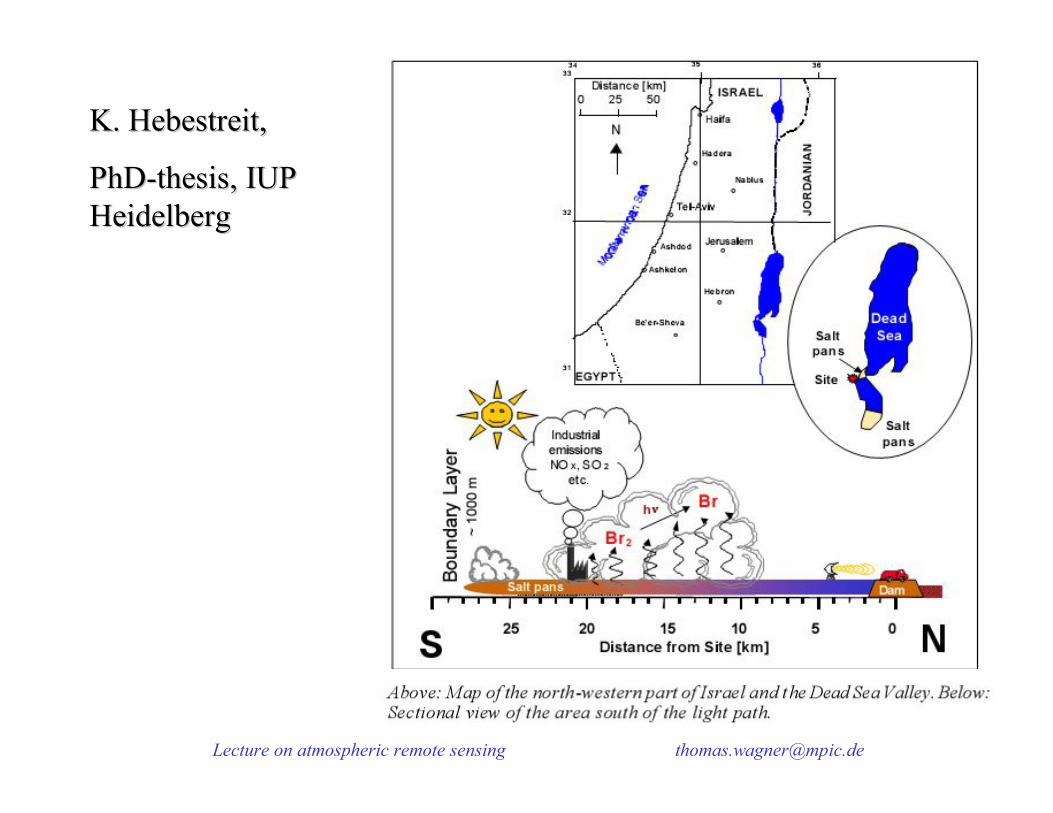
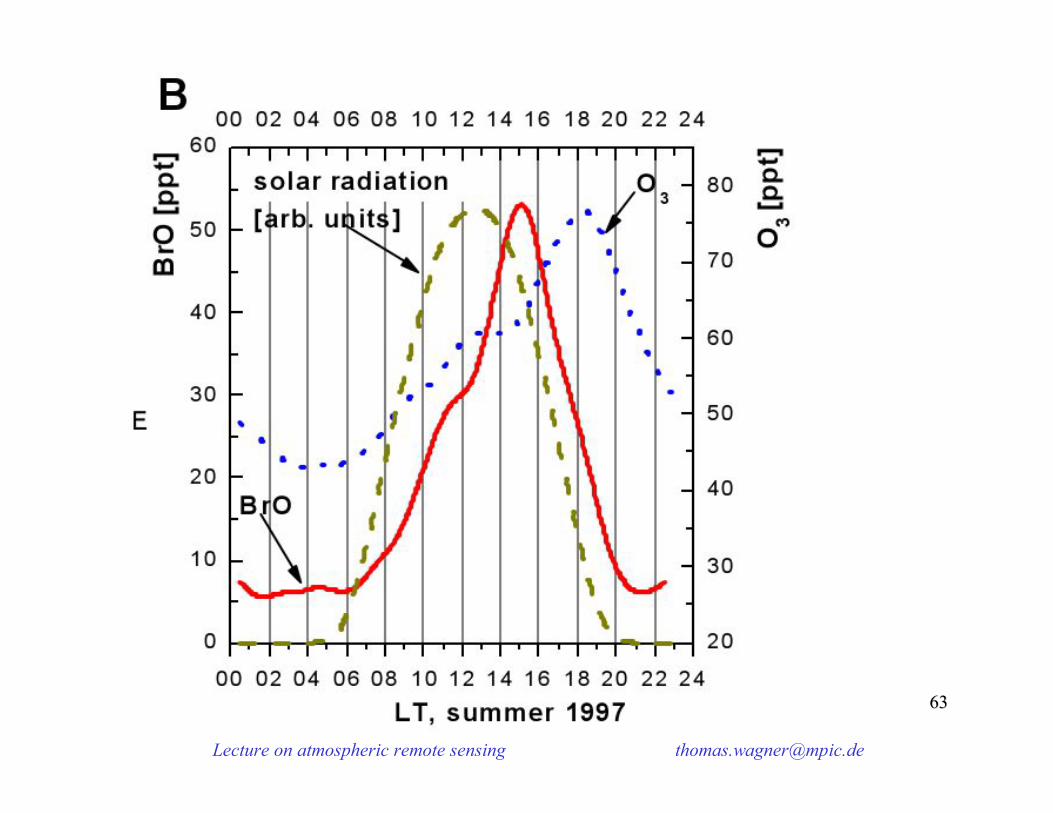
K. Hebestreit,K. Hebestreit,
PhDPhD--thesisthesis, IUP , IUP HeidelbergHeidelberg
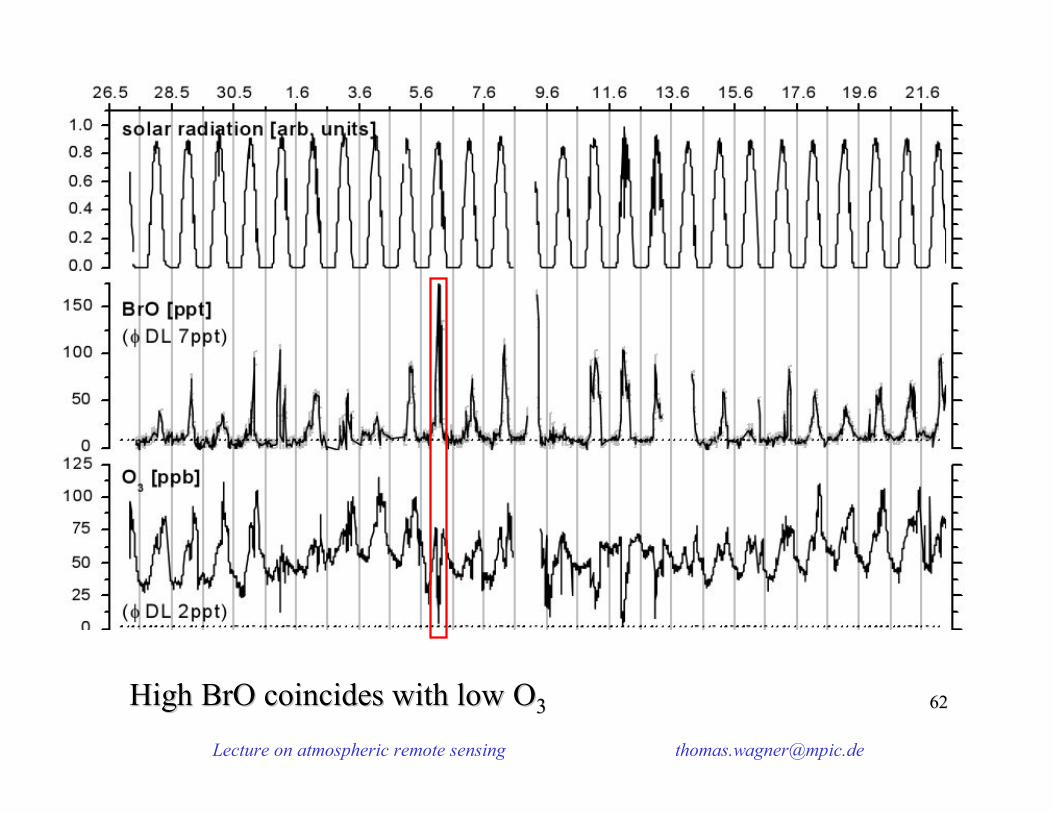
Lecture on atmospheric remote sensing [email protected]
6262High High BrO coincides with low BrO coincides with low OO33
Lecture on atmospheric remote sensing [email protected]
6464
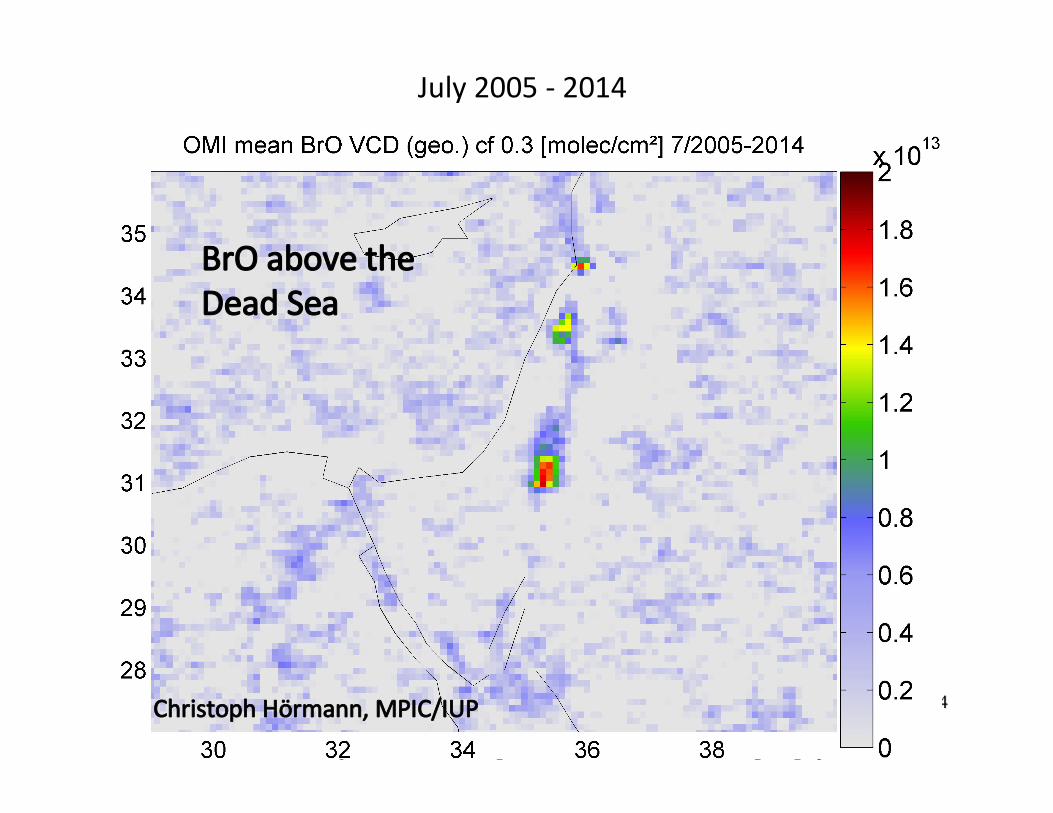
July 2005 - 2014
BrO above the Dead Sea
Christoph Hörmann, MPIC/IUP
Lecture on atmospheric remote sensing [email protected]
6565
Long Path DOAS
-basic principle
-Long path DOAS (UV/vis/IR)
-instrumental improvements
-Specific applications
-white cell
-vertical profiles
-tomographic inversions
Lecture on atmospheric remote sensing [email protected]
6666
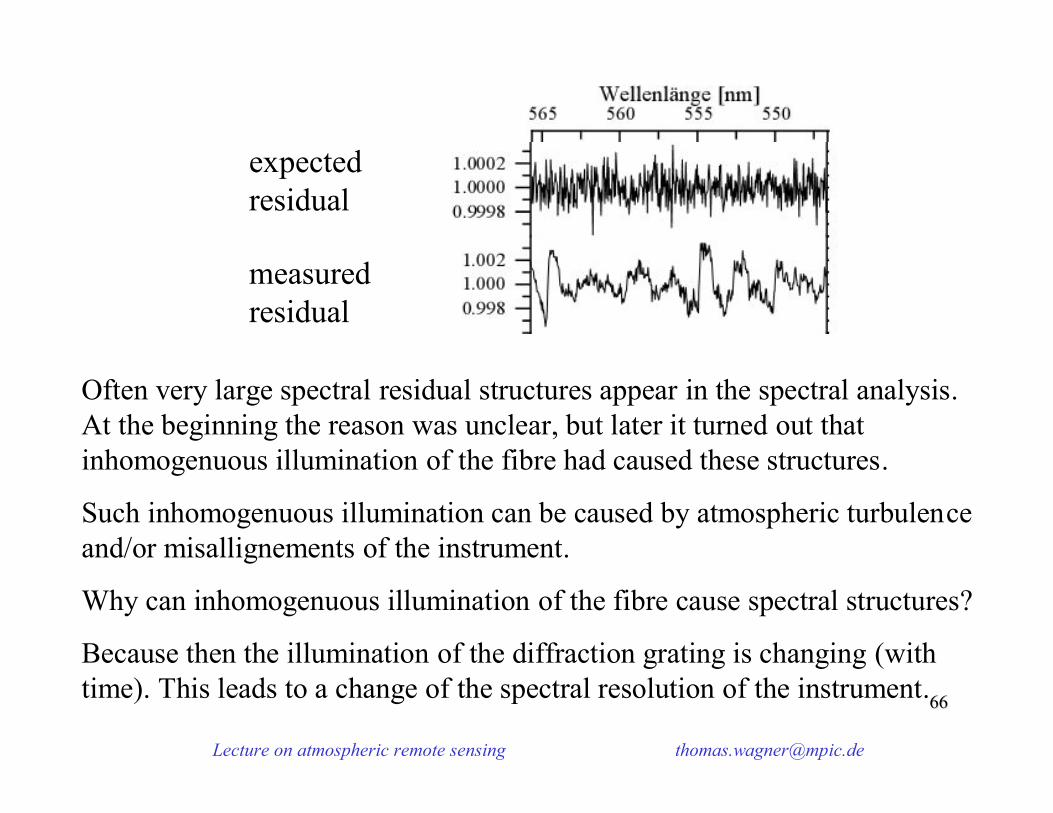
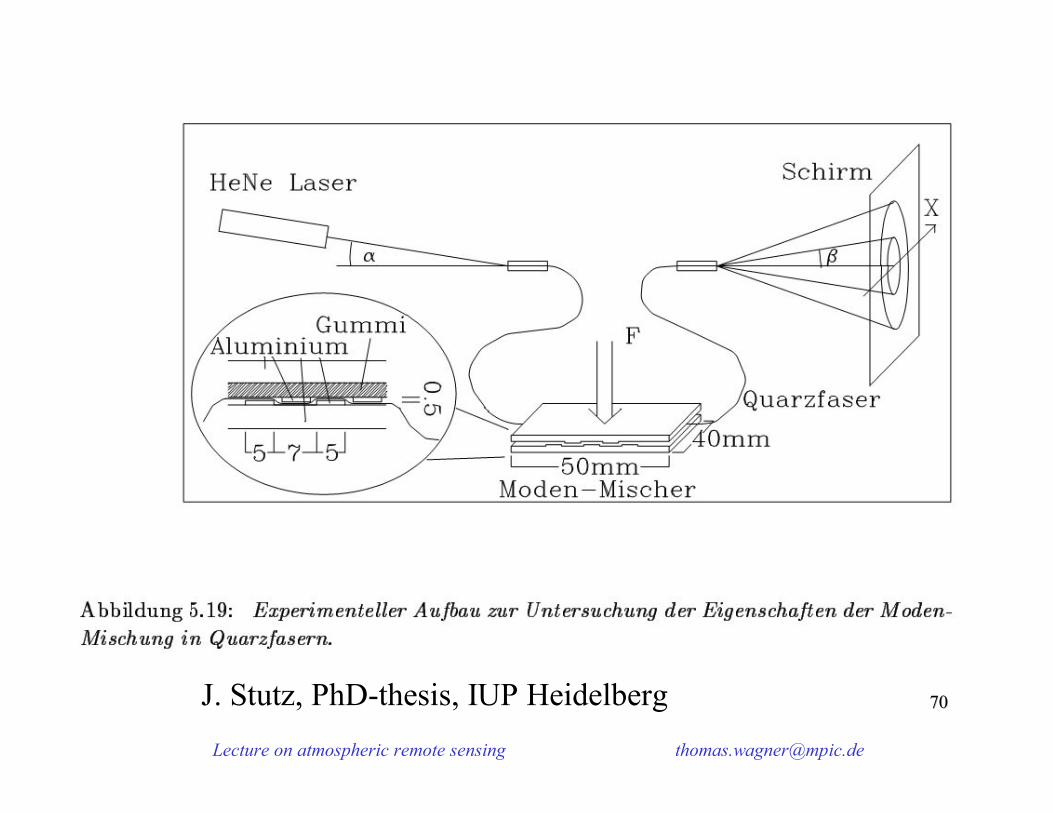
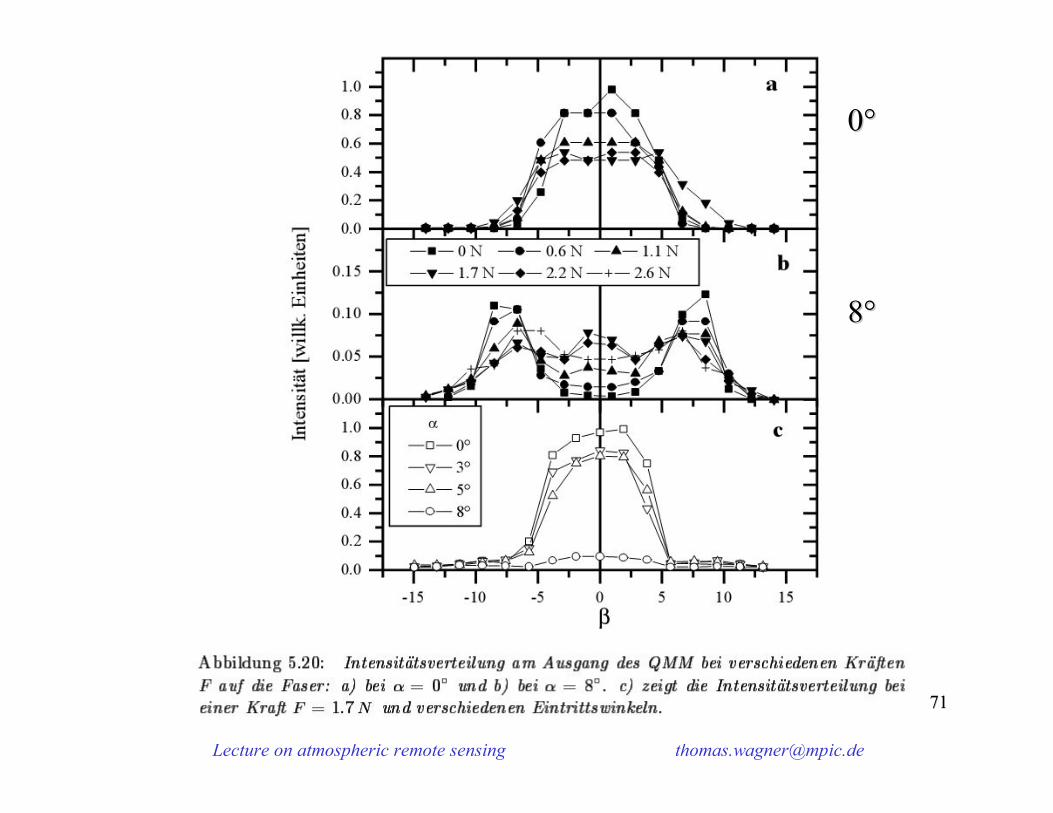
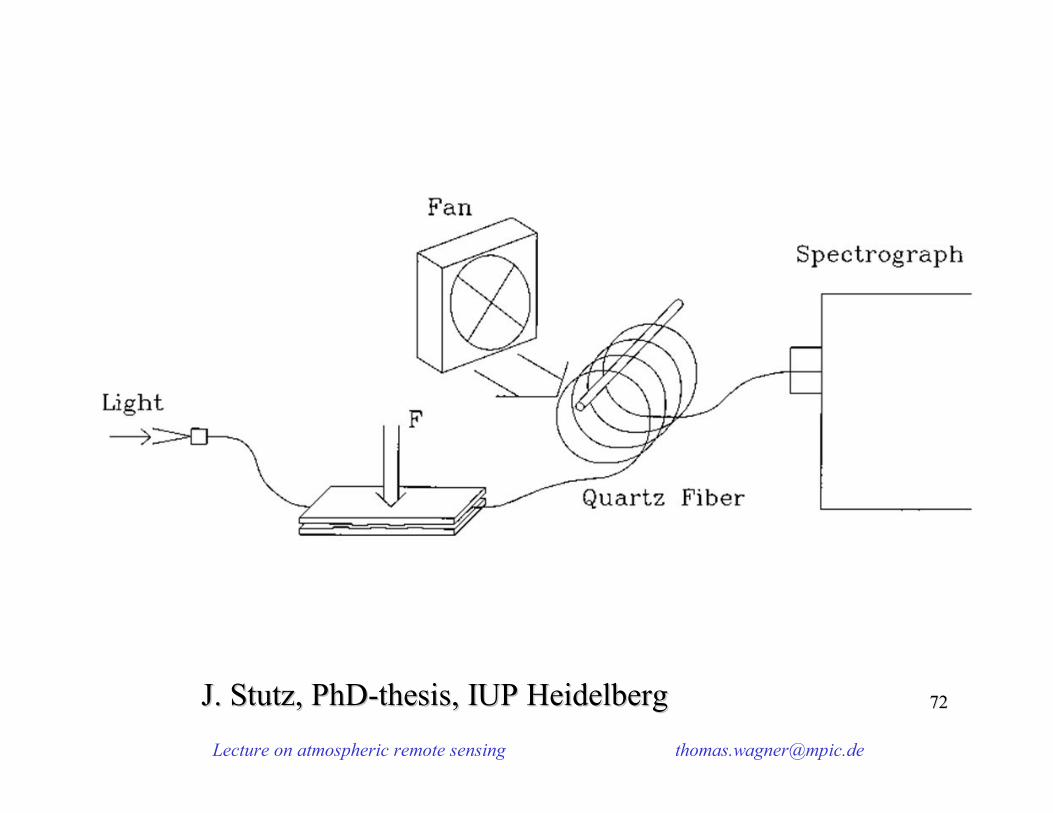
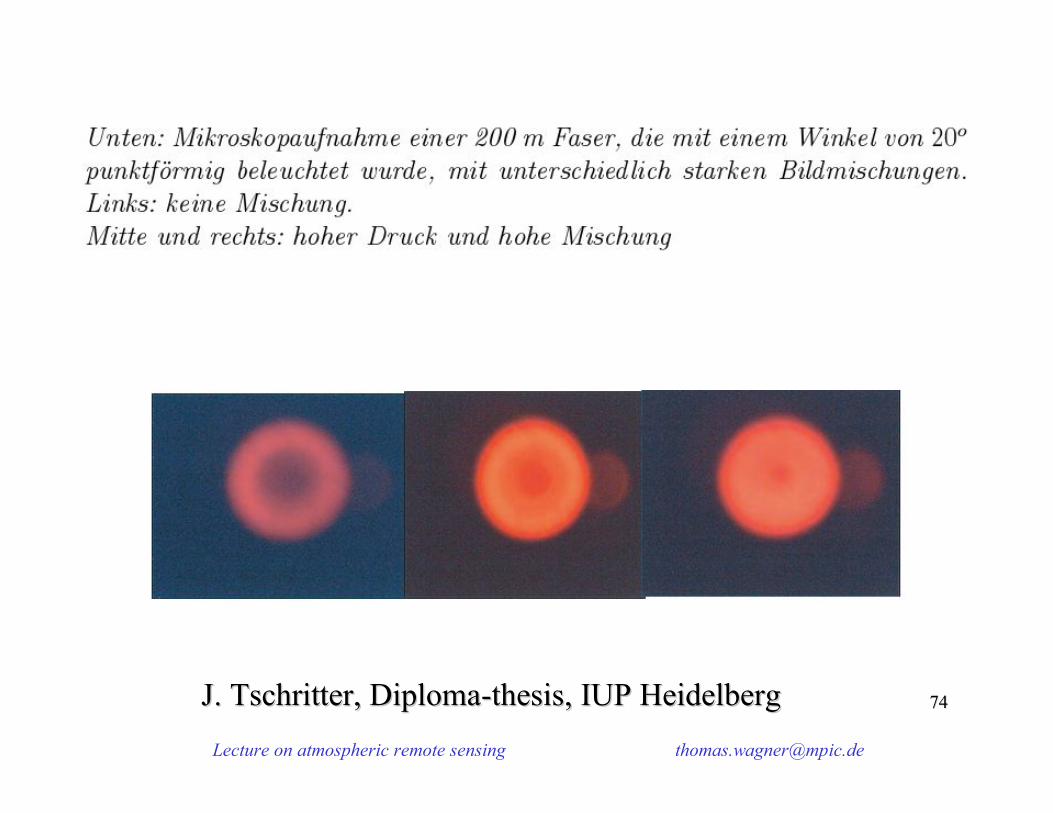
Often very large spectral residual structures appear in the spectral analysis. At the beginning the reason was unclear, but later it turned out that inhomogenuous illumination of the fibre had caused these structures.
Such inhomogenuous illumination can be caused by atmospheric turbulence and/or misallignements of the instrument.
Why can inhomogenuous illumination of the fibre cause spectral structures?
Because then the illumination of the diffraction grating is changing (with time). This leads to a change of the spectral resolution of the instrument.
expected residual
measured residual
Lecture on atmospheric remote sensing [email protected]
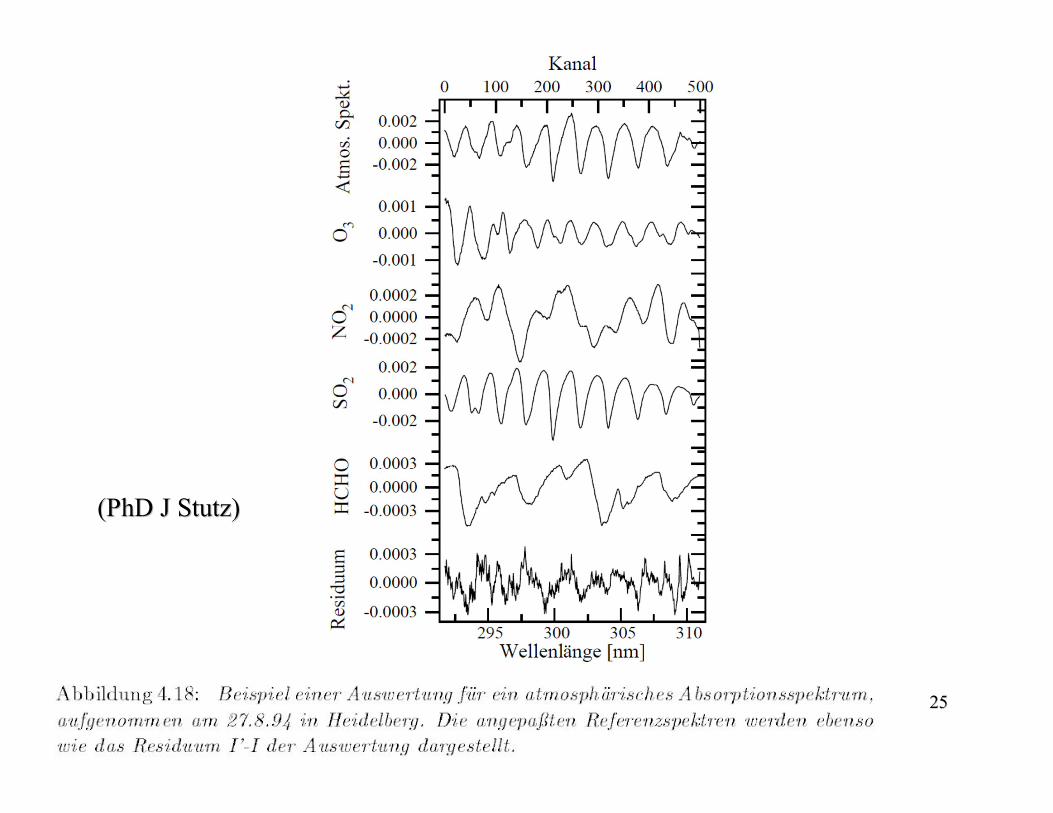
7272J. Stutz, J. Stutz, PhDPhD--thesisthesis, IUP Heidelberg, IUP Heidelberg
Lecture on atmospheric remote sensing [email protected]
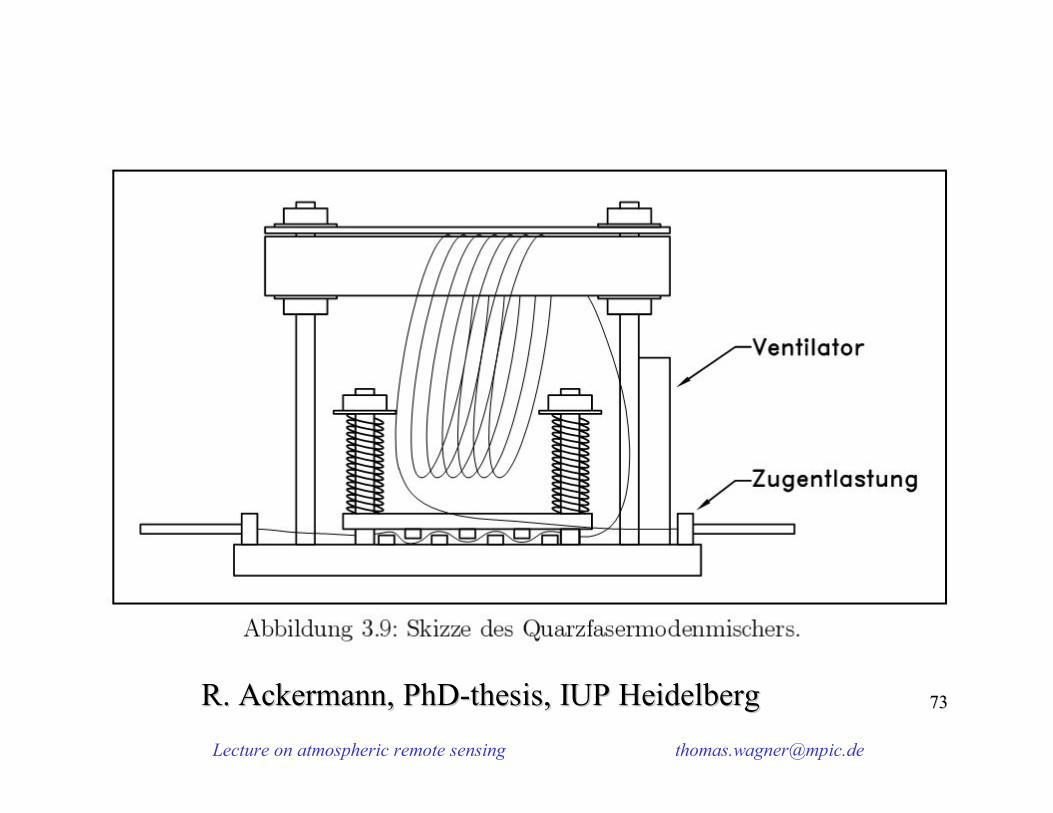
7373R. Ackermann, R. Ackermann, PhDPhD--thesisthesis, IUP Heidelberg, IUP Heidelberg
Lecture on atmospheric remote sensing [email protected]
7474J. J. TschritterTschritter, , DiplomaDiploma--thesisthesis, IUP Heidelberg, IUP Heidelberg
Lecture on atmospheric remote sensing [email protected]
7575
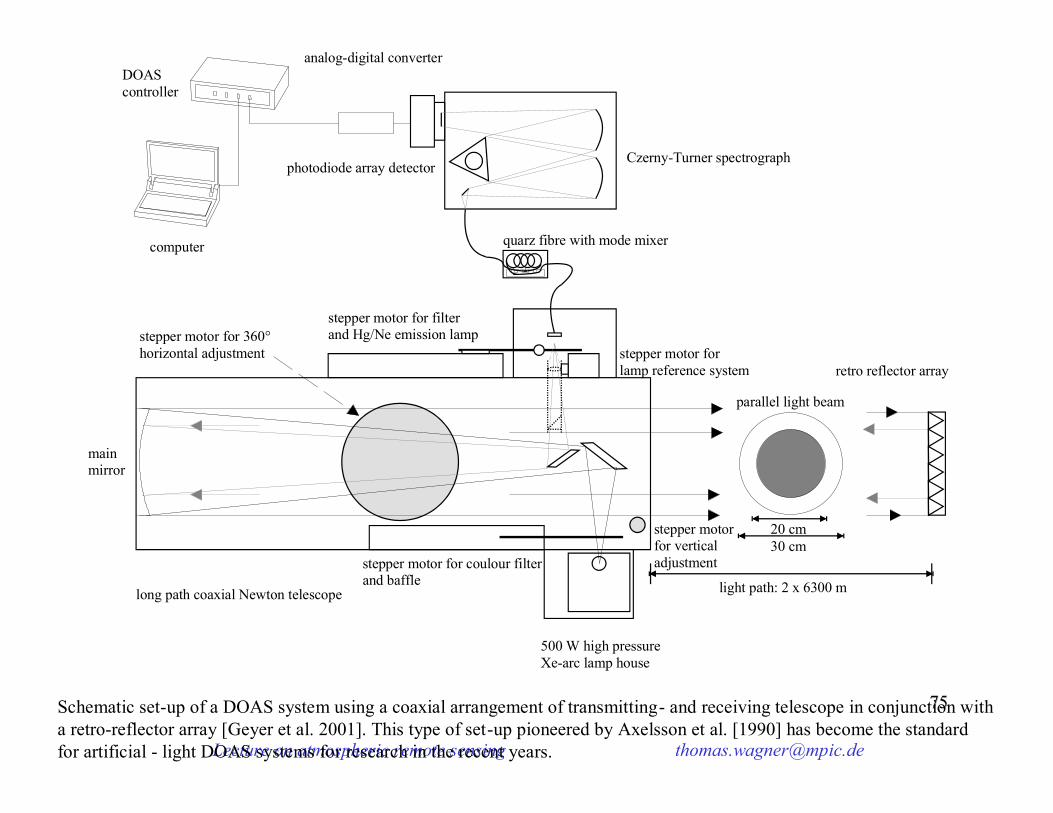
quarz fibre with mode mixer
photodiode array detectorCzerny-Turner spectrograph
retro reflector array
light path: 2 x 6300 m
20 cm30 cm
parallel light beam
500 W high pressureXe-arc lamp house
stepper motorfor vertical adjustment
long path coaxial Newton telescope
stepper motor for coulour filterand baffle
stepper motor for filterand Hg/Ne emission lampstepper motor for 360°
horizontal adjustment
mainmirror
stepper motor for lamp reference system
analog-digital converter
computer
DOAScontroller
Schematic set-up of a DOAS system using a coaxial arrangement of transmitting- and receiving telescope in conjunction with a retro-reflector array [Geyer et al. 2001]. This type of set-up pioneered by Axelsson et al. [1990] has become the standard for artificial - light DOAS systems for research in the recent years.
Lecture on atmospheric remote sensing [email protected]
7676
Messung des Lampenspektrums
Ursprüngliche Version:

Lecture on atmospheric remote sensing [email protected]
7777C. Hak, Dissertation, IUP Heidelberg, 2007C. Hak, Dissertation, IUP Heidelberg, 2007
Messung des Lampenspektrums
Verbesserte Version (aber aufwendig):
Lecture on atmospheric remote sensing [email protected]
7878
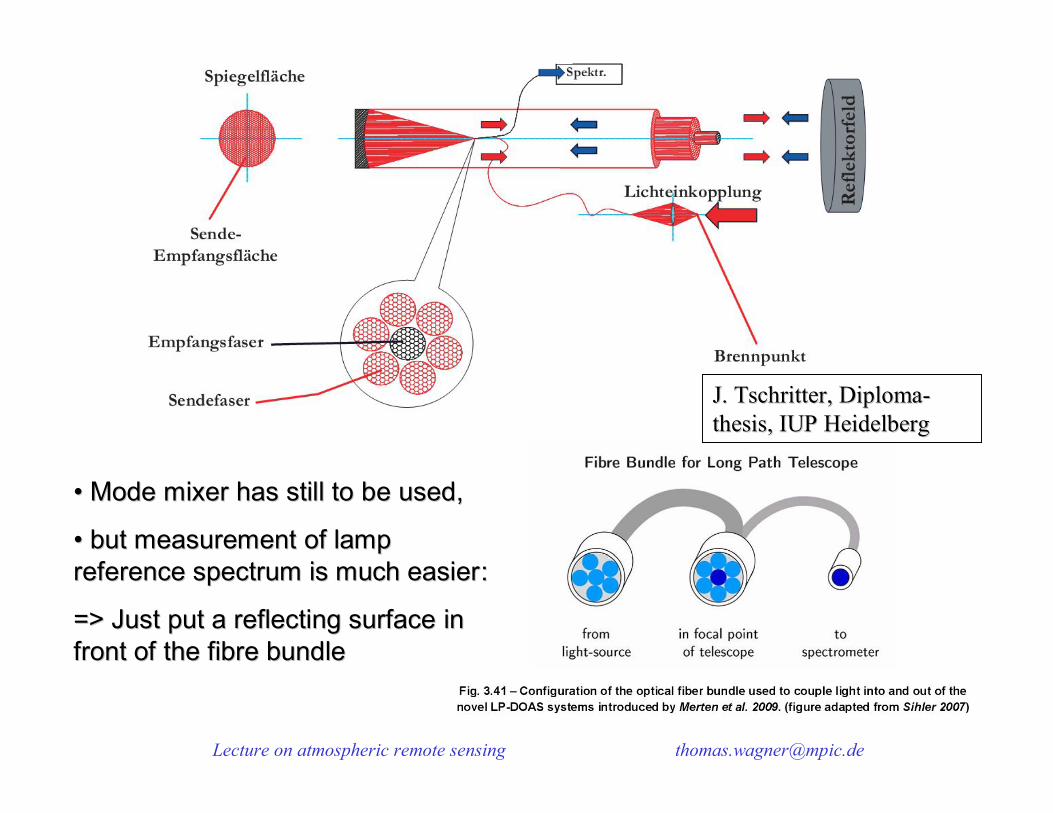
J. J. TschritterTschritter, , DiplomaDiploma--thesisthesis, IUP Heidelberg, IUP Heidelberg
•• Mode Mode mixer mixer has still to has still to be usedbe used, ,
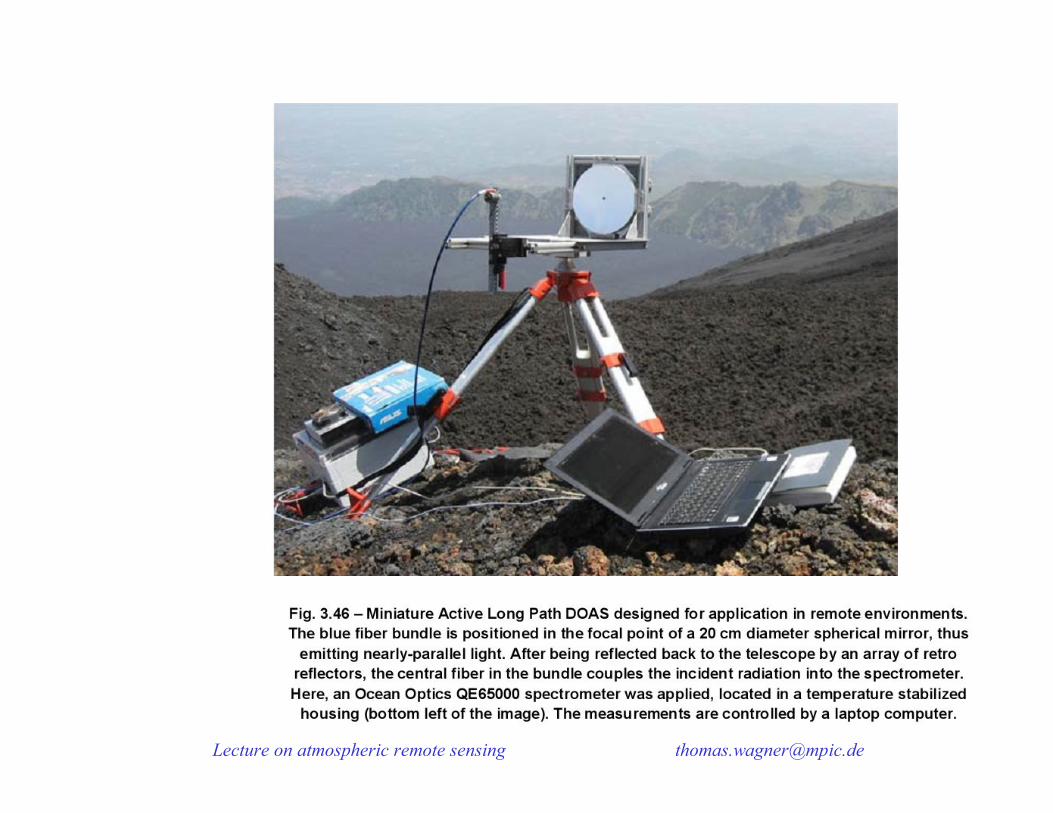
•• but measurementbut measurement of of lamp lamp reference spectrum is much easierreference spectrum is much easier::
=> Just => Just put put a a reflecting surface reflecting surface in in front of front of the fibre bundlethe fibre bundle
Lecture on atmospheric remote sensing [email protected]
8181
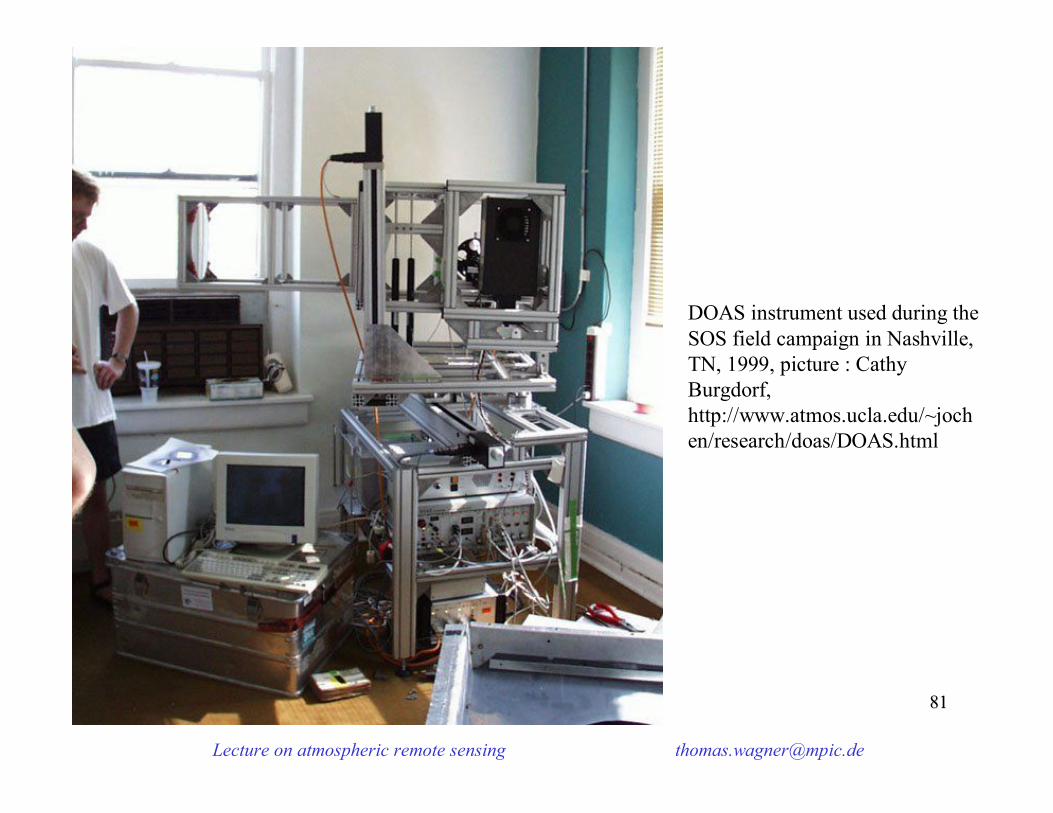
DOAS instrument used during theSOS field campaign in Nashville, TN, 1999, picture : Cathy Burgdorf, http://www.atmos.ucla.edu/~jochen/research/doas/DOAS.html
Lecture on atmospheric remote sensing [email protected]
8282
Long Path DOAS
-basic principle
-Long path DOAS (UV/vis/IR)
-instrumental improvements
-Specific applications
-white cell
-vertical profiles
-tomographic inversions

Lecture on atmospheric remote sensing [email protected]
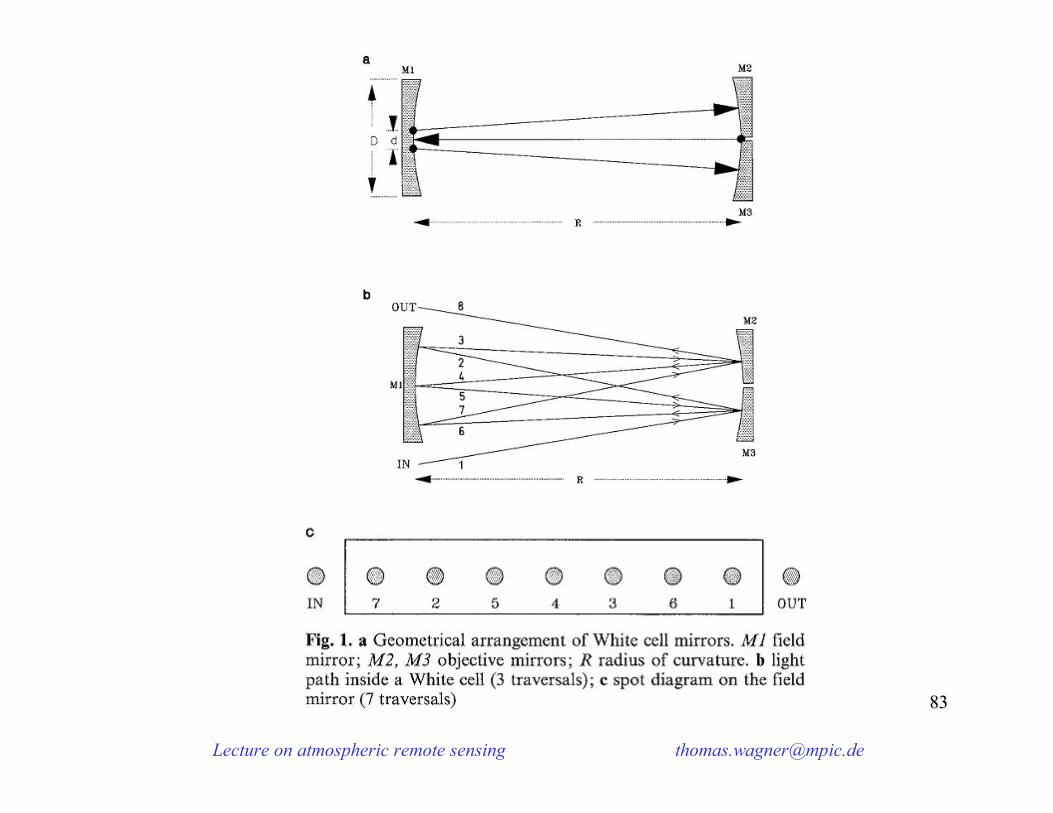
8585
-Multi-Reflektions-System (White-Zelle):
Hohlspiegel
0.1 - 15 m
Lichtquelle& Spektrograph
Lecture on atmospheric remote sensing [email protected]
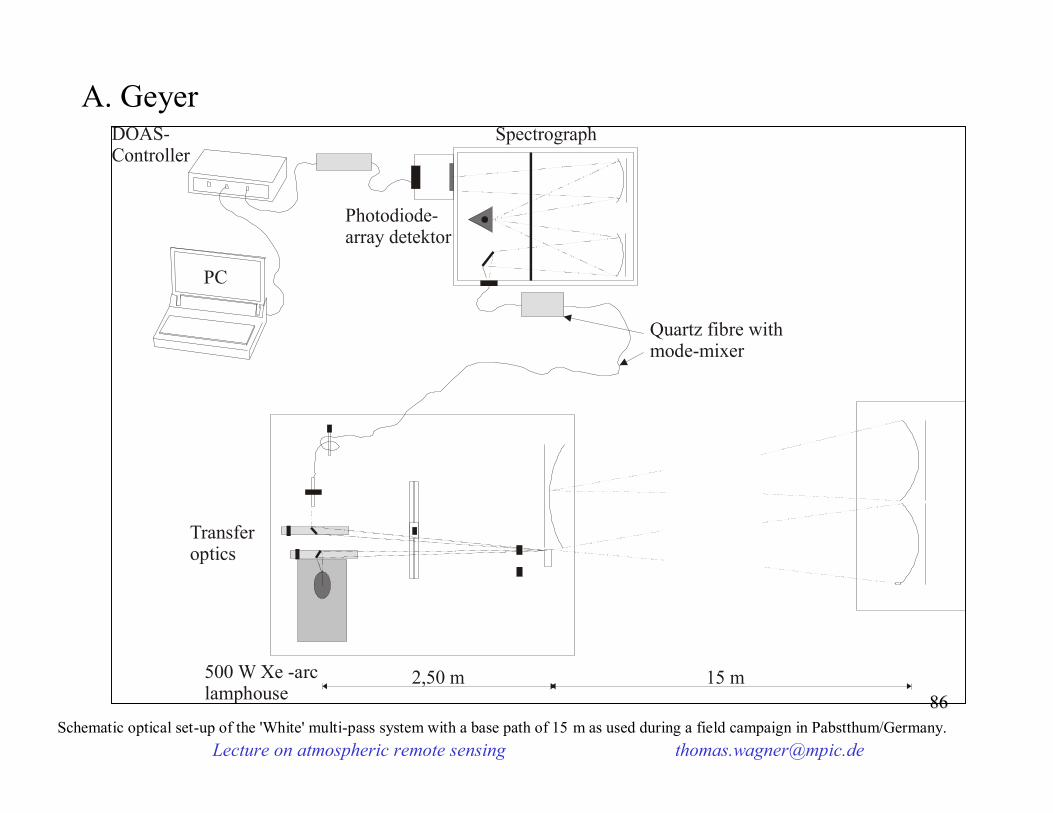
8686Schematic optical set-up of the 'White' multi-pass system with a base path of 15 m as used during a field campaign in Pabstthum/Germany.
500 W Xe -arclamphouse
Quartz fibre withmode-mixer
Transferoptics
PC
A. Geyer
Lecture on atmospheric remote sensing [email protected]
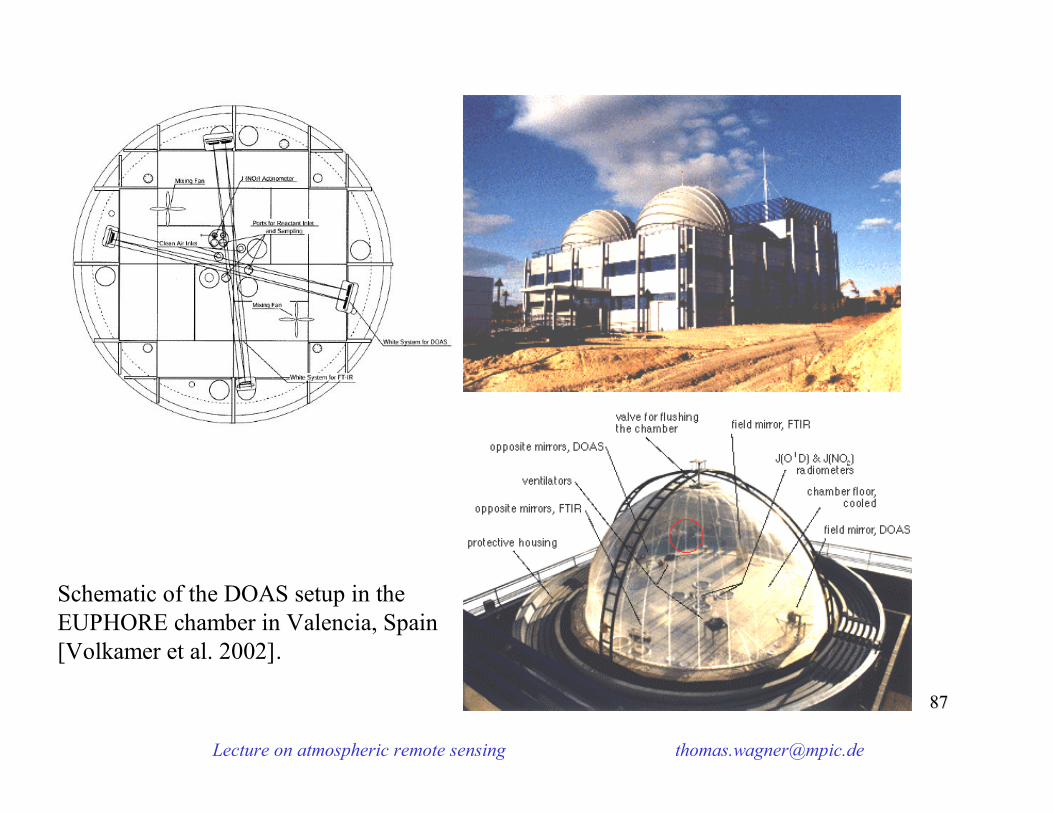
8787
Schematic of the DOAS setup in the EUPHORE chamber in Valencia, Spain [Volkamer et al. 2002].
Lecture on atmospheric remote sensing [email protected]
8888
Long Path DOAS
-basic principle
-Long path DOAS (UV/vis/IR)
-instrumental improvements
-Specific applications
-white cell
-vertical profiles
-tomographic inversions
Lecture on atmospheric remote sensing [email protected]
8989
DOAS
4 m
1.25 km
1.57 m
2.45 m
1.8 m
Sonic Anemometer
2.1m
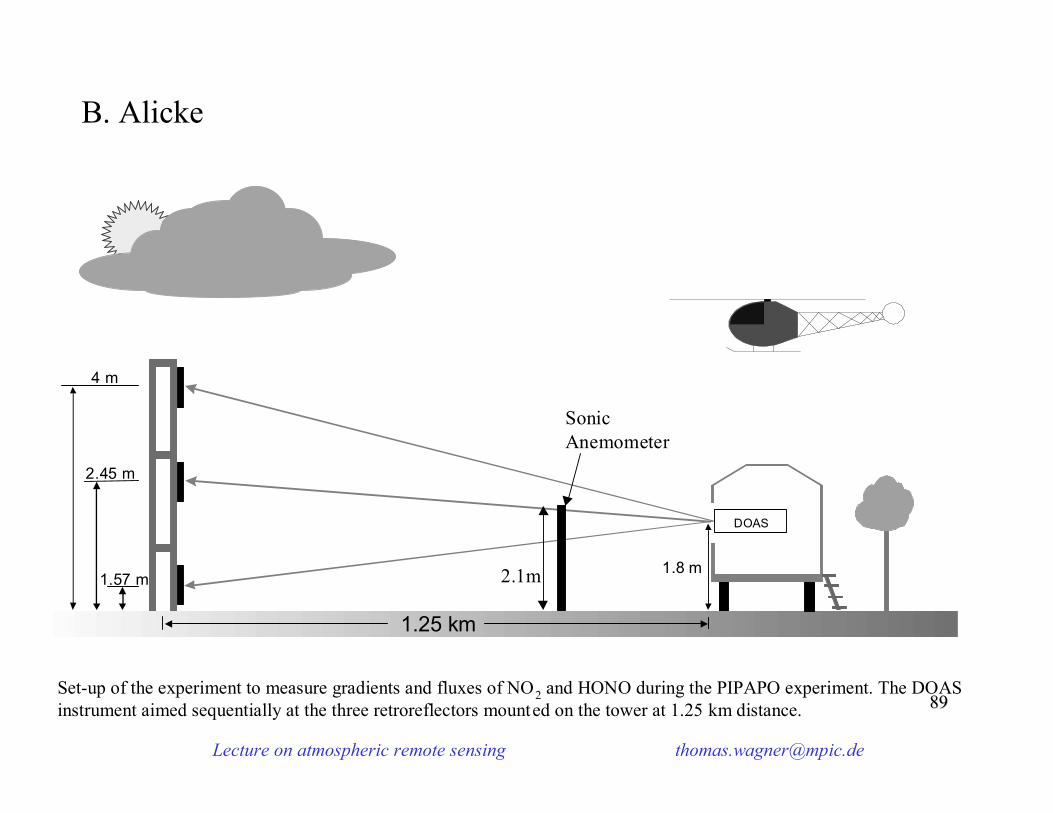
Set-up of the experiment to measure gradients and fluxes of NO2 and HONO during the PIPAPO experiment. The DOAS instrument aimed sequentially at the three retroreflectors mounted on the tower at 1.25 km distance.
B. Alicke
Lecture on atmospheric remote sensing [email protected]
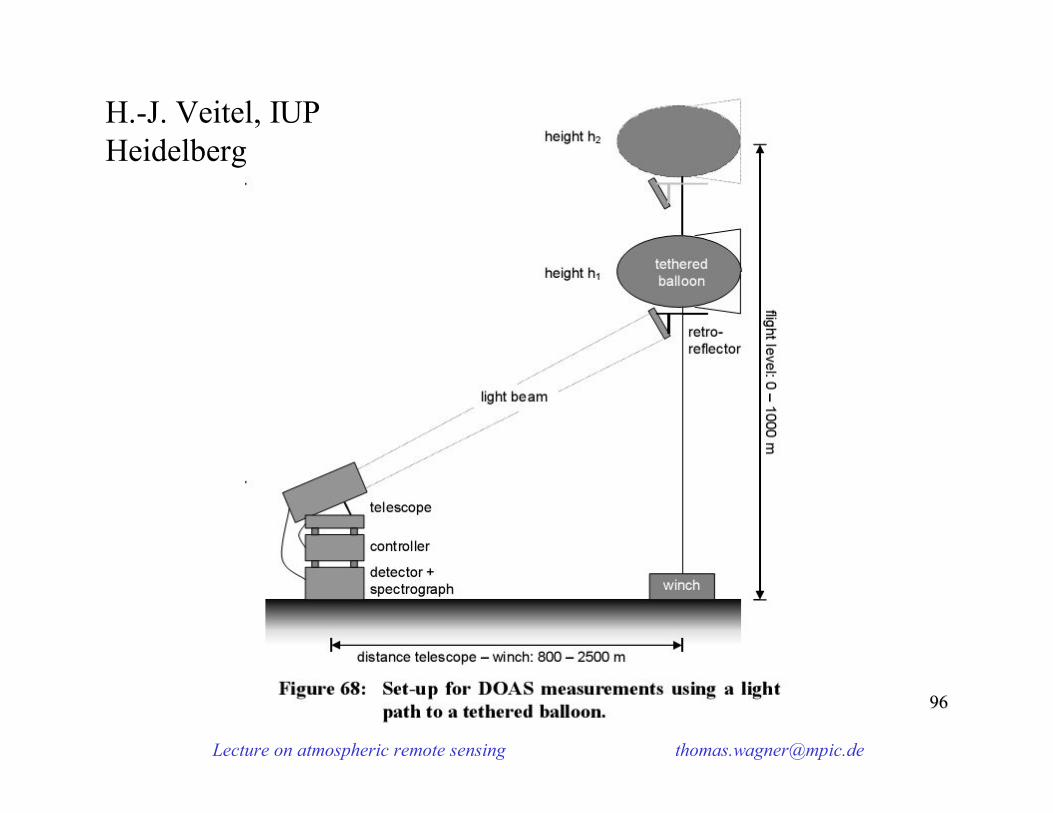
9090
020406080
5/29/1998 12:00 5/30/1998 00:00 5/30/1998 12:00
0
5
10
a
[NO
2] (p
pb) upper LP
middle LP lower LP
b
Gra
dien
t(p
pb m
-1)
c 360
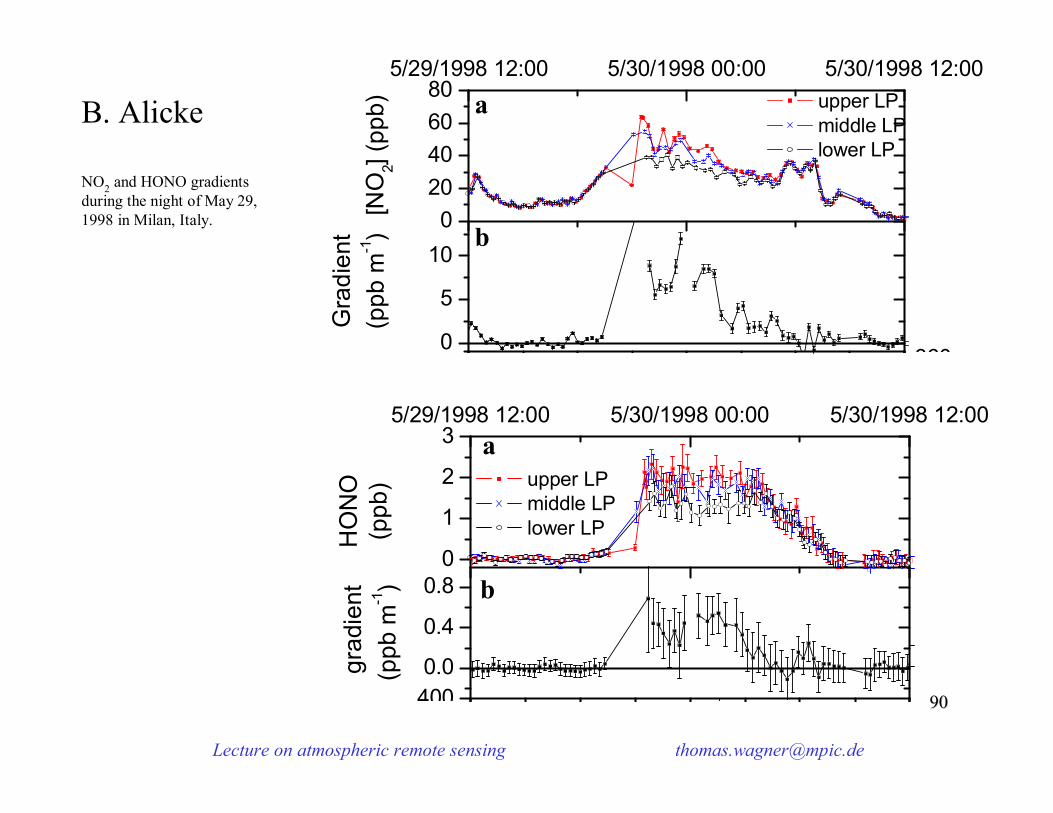
NO2 and HONO gradients during the night of May 29, 1998 in Milan, Italy.
B. Alicke
0
1
2
35/29/1998 12:00 5/30/1998 00:00 5/30/1998 12:00
4000.0
0.4
0.8
a
HO
NO
(ppb
) upper LP middle LP lower LP
b
gra
dien
t(p
pb m
-1)
Lecture on atmospheric remote sensing [email protected]
9191
RTU 115mRTM 99mRTL 70m
DOAS Systems
WT 44mME 2m
6.1 km1.9 km750m
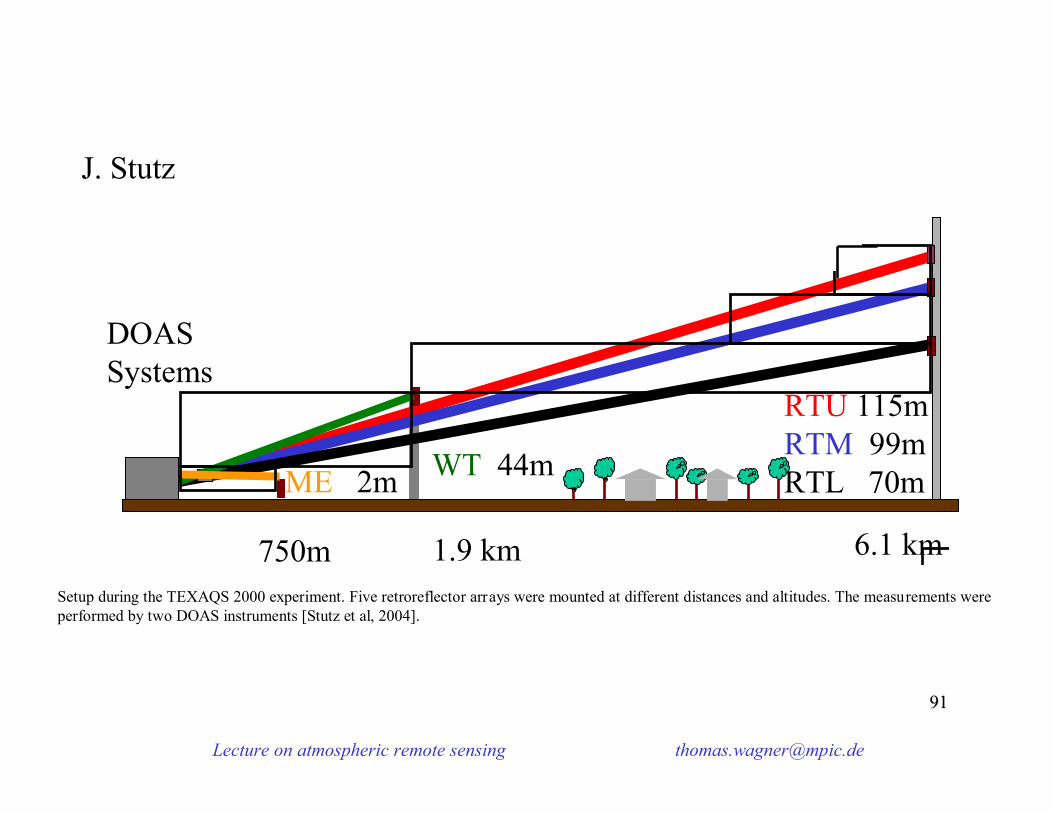
Setup during the TEXAQS 2000 experiment. Five retroreflector arrays were mounted at different distances and altitudes. The measurements were performed by two DOAS instruments [Stutz et al, 2004].
J. Stutz
6.1 km1.9 km750m
Lecture on atmospheric remote sensing [email protected]
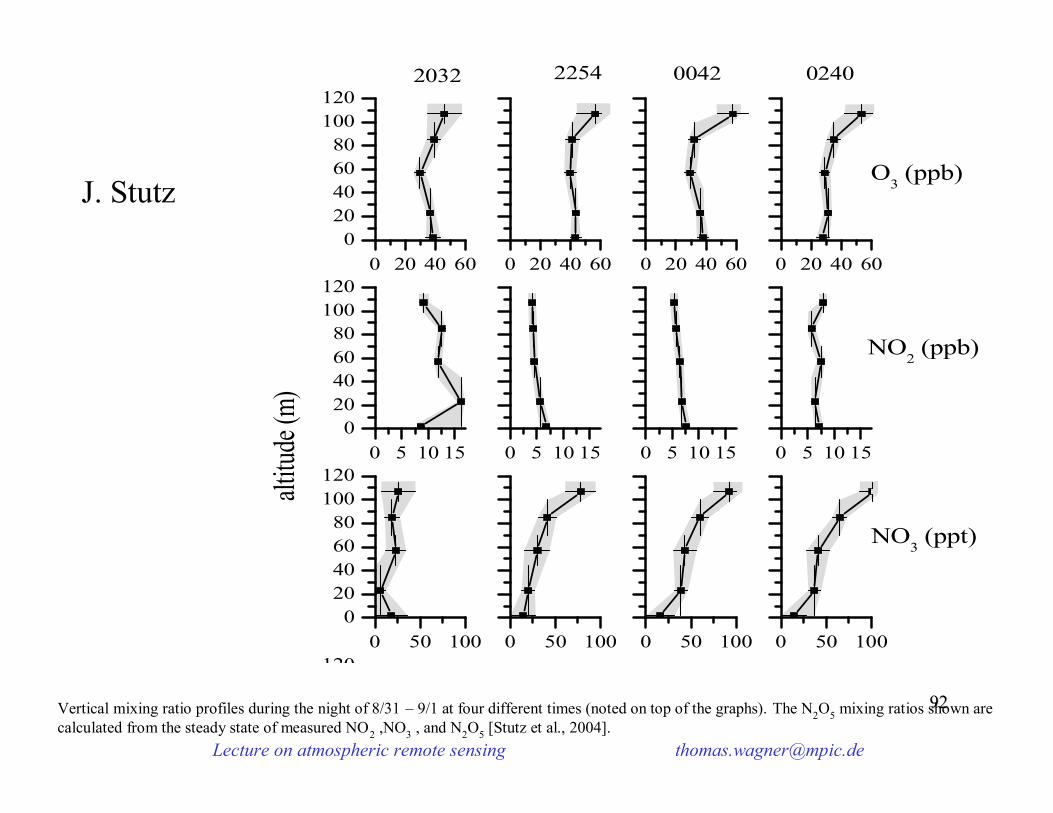
9292
0 5 10 150
20406080
100120
altit
ude (
m)
0 5 10 15
2254
0 5 10 15
0042
0 5 10 15
0240
NO2 (ppb)
0 50 1000
20406080
100120
0 50 100 0 50 100 0 50 100
NO3 (ppt)
0 20 40 600
20406080
100120
0 20 40 60 0 20 40 60 0 20 40 60
O3 (ppb)
120
2032
Vertical mixing ratio profiles during the night of 8/31 – 9/1 at four different times (noted on top of the graphs). The N2O5 mixing ratios shown are calculated from the steady state of measured NO2 ,NO3 , and N2O5 [Stutz et al., 2004].
J. Stutz

Lecture on atmospheric remote sensing [email protected]
100100
Long Path DOAS
-basic principle
-Long path DOAS (UV/vis/IR)
-instrumental improvements
-Specific applications
-white cell
-vertical profiles
-tomographic inversions
Lecture on atmospheric remote sensing [email protected]
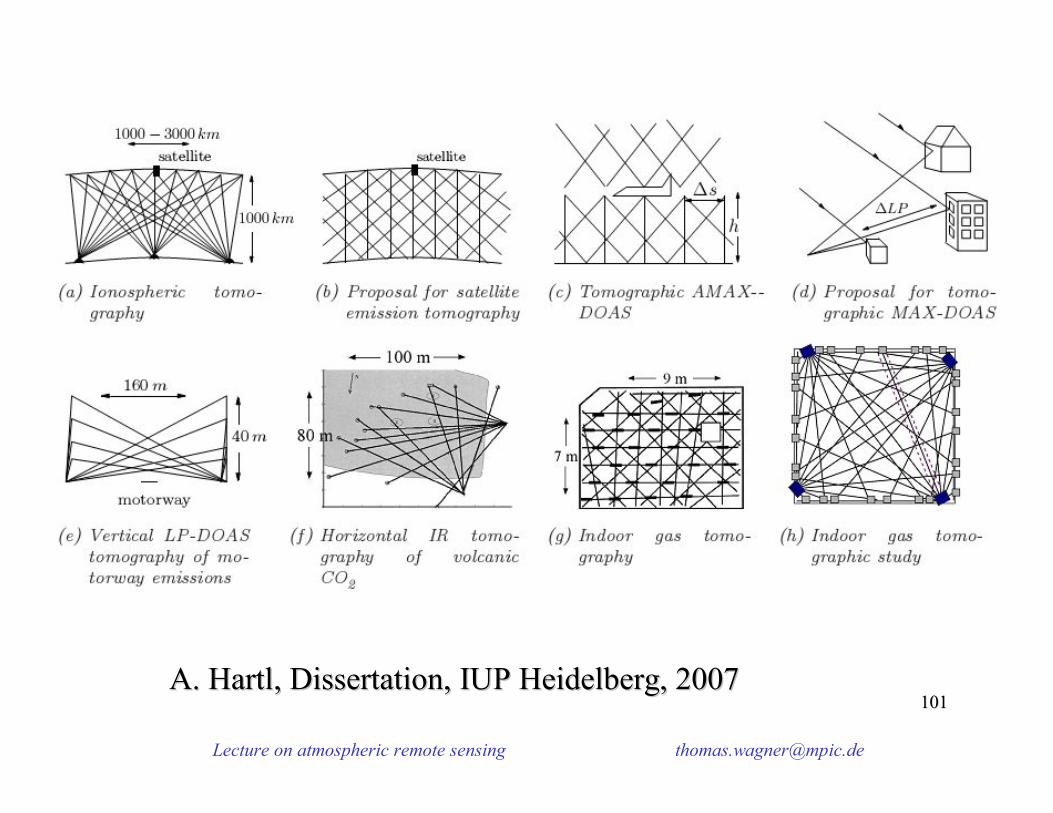
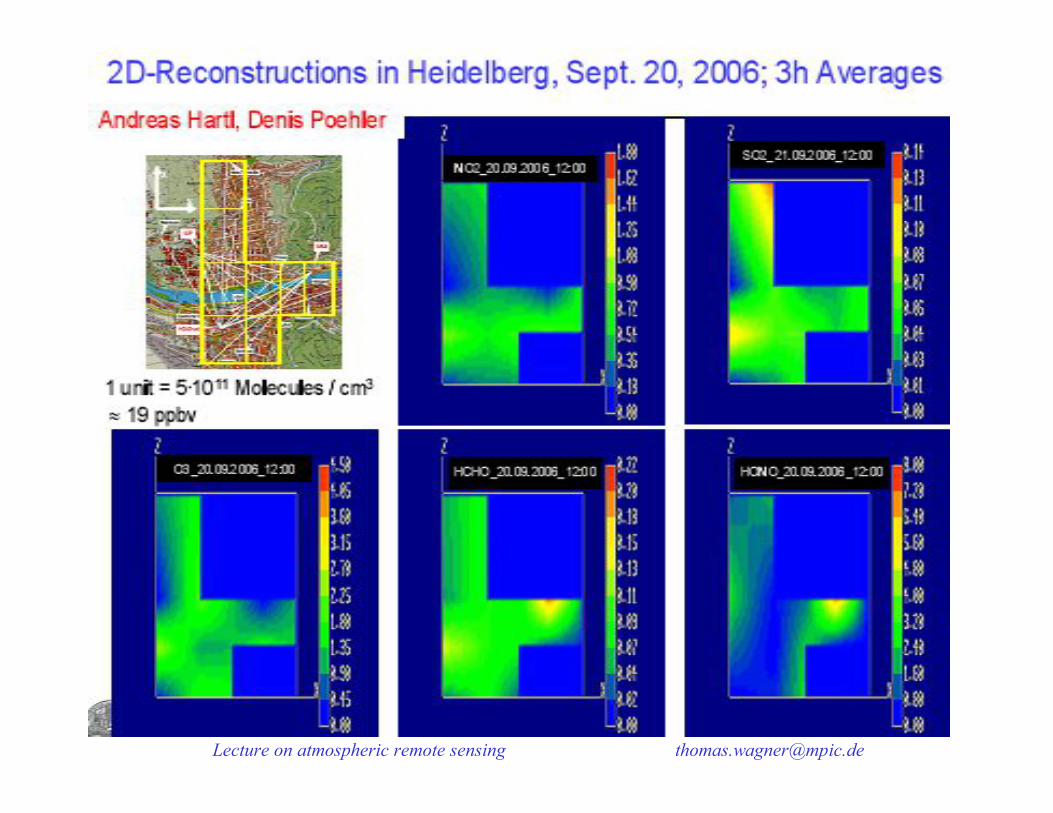
101101A. A. HartlHartl, Dissertation, IUP Heidelberg, 2007, Dissertation, IUP Heidelberg, 2007
Lecture on atmospheric remote sensing [email protected]
102102
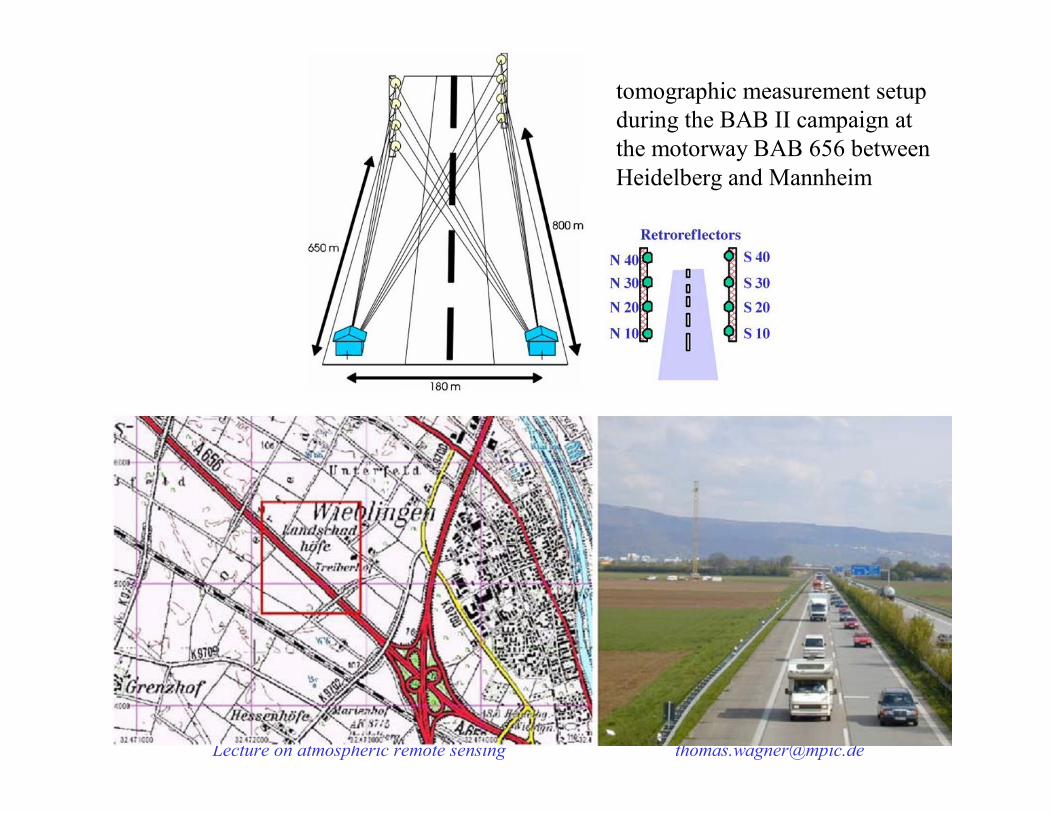
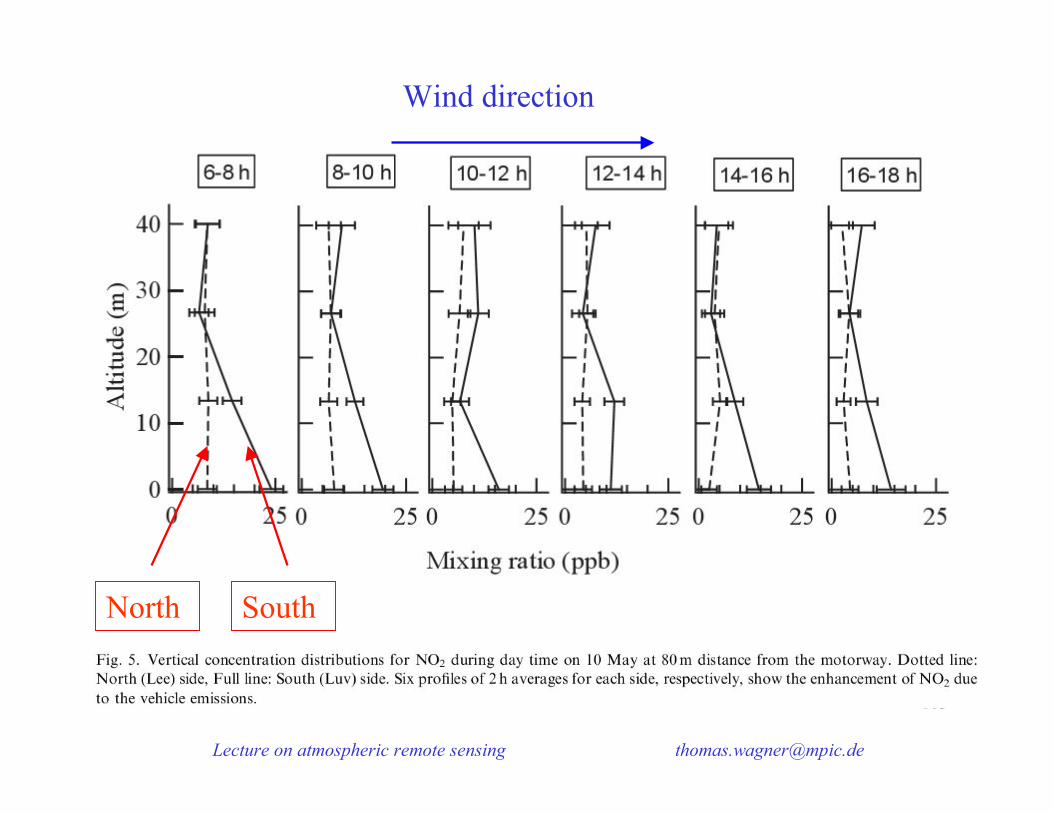
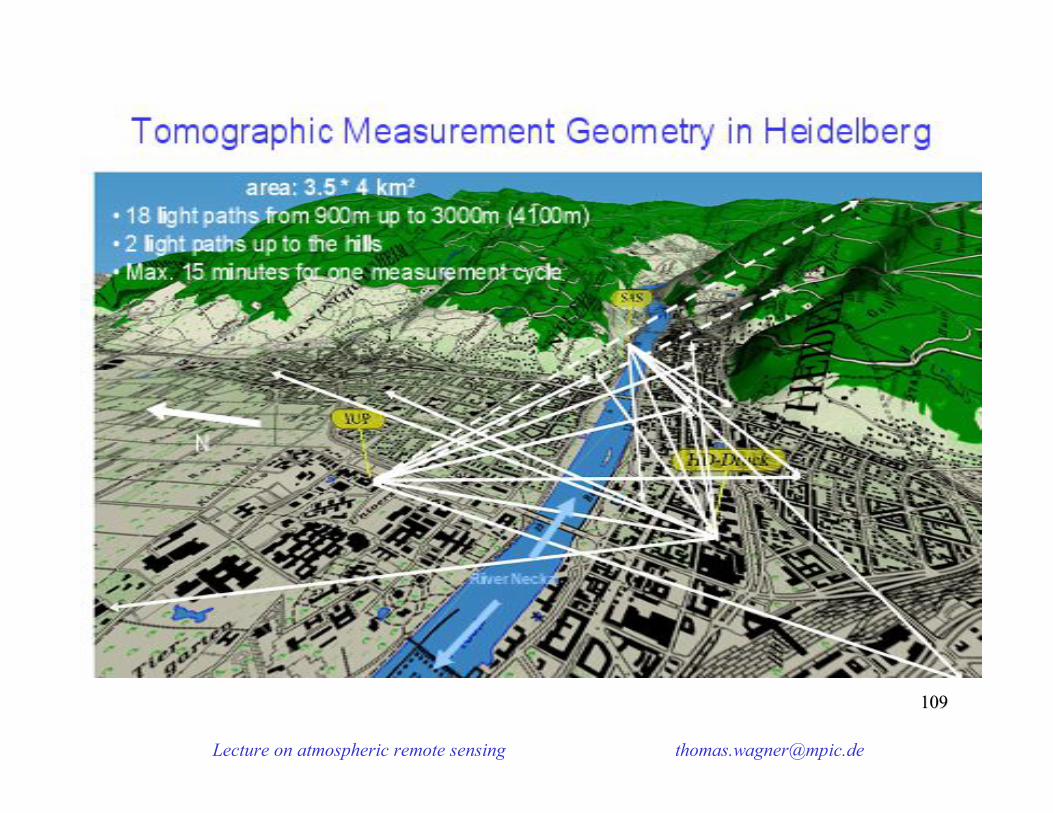
tomographic measurement setup during the BAB II campaign at the motorway BAB 656 between Heidelberg and Mannheim
Lecture on atmospheric remote sensing [email protected]
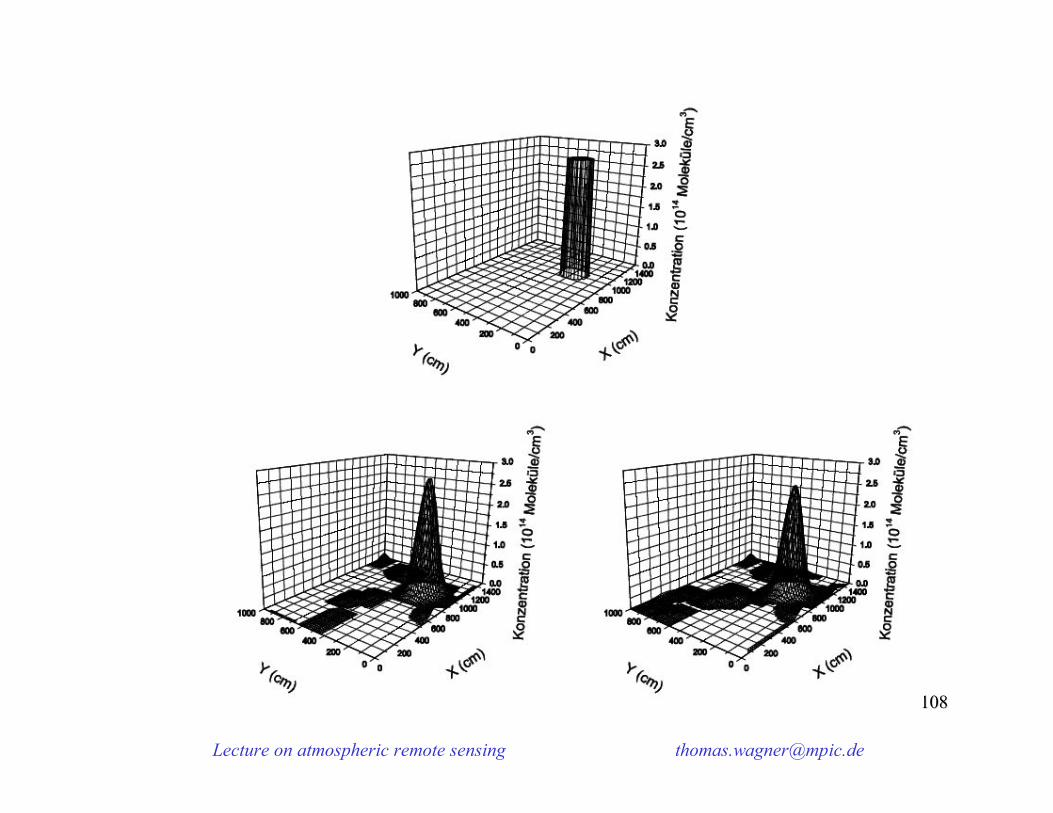
104104
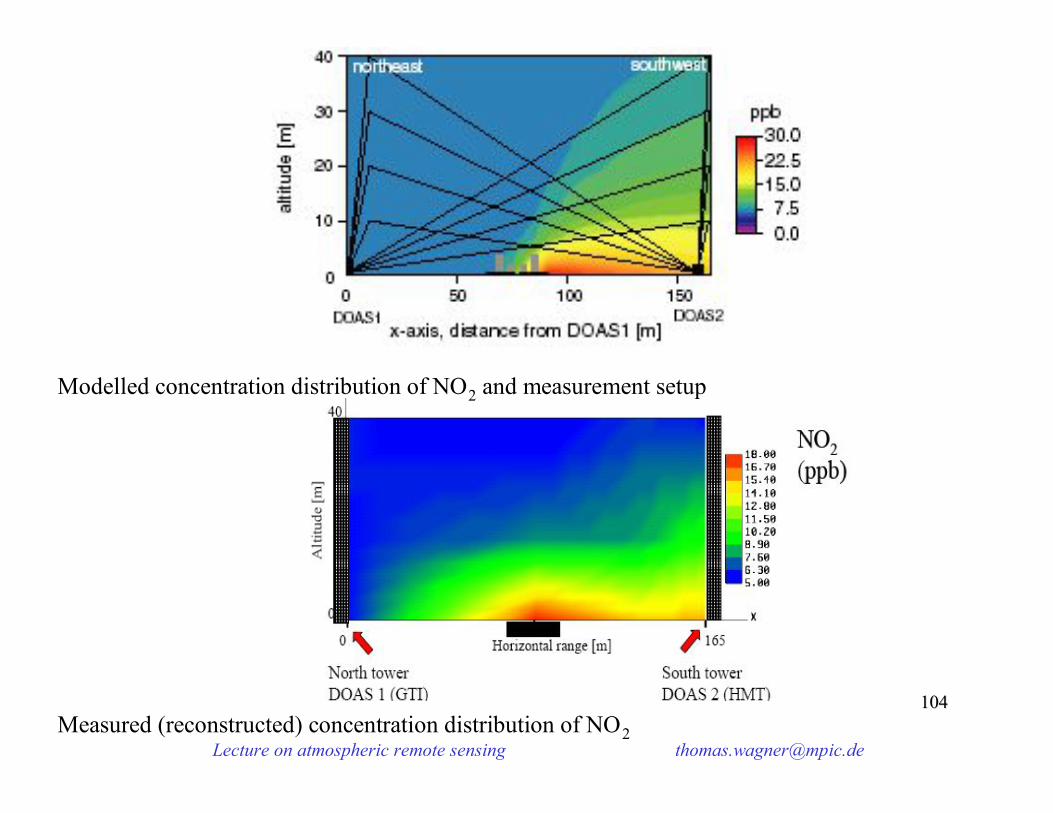
Modelled concentration distribution of NO2 and measurement setup
Measured (reconstructed) concentration distribution of NO2
Lecture on atmospheric remote sensing [email protected]
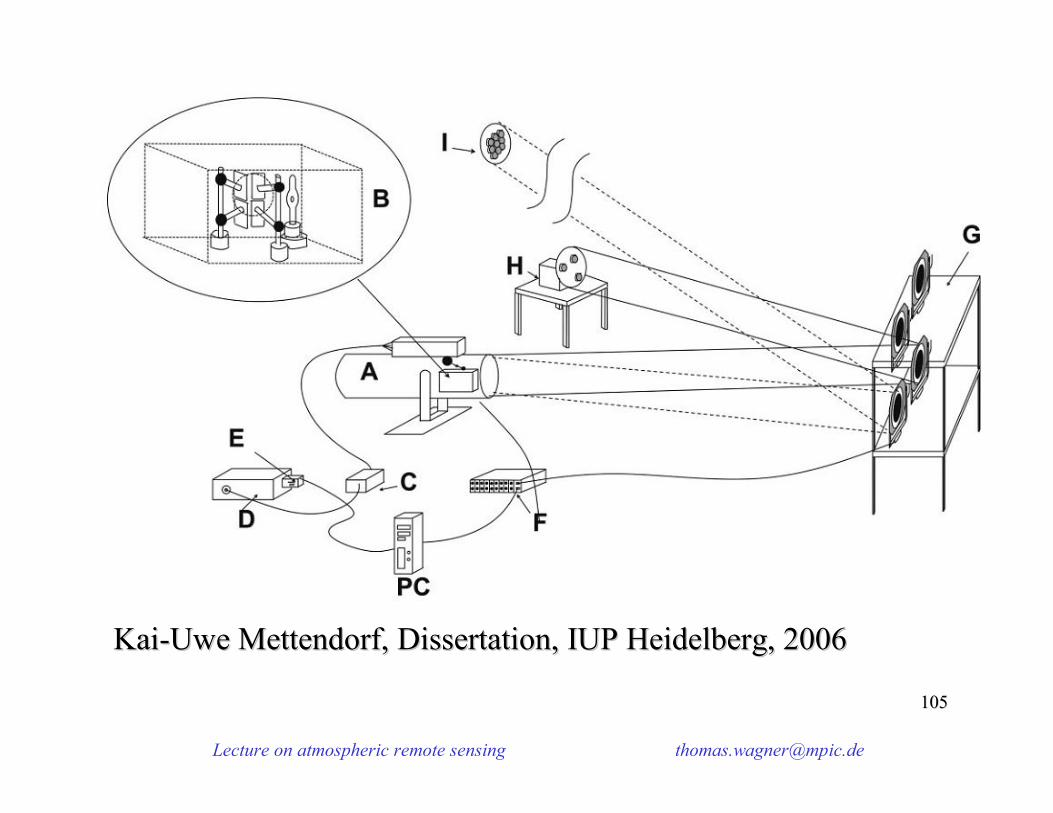
105105
KaiKai--Uwe Mettendorf, Dissertation, IUP Heidelberg, 2006Uwe Mettendorf, Dissertation, IUP Heidelberg, 2006
Lecture on atmospheric remote sensing [email protected]
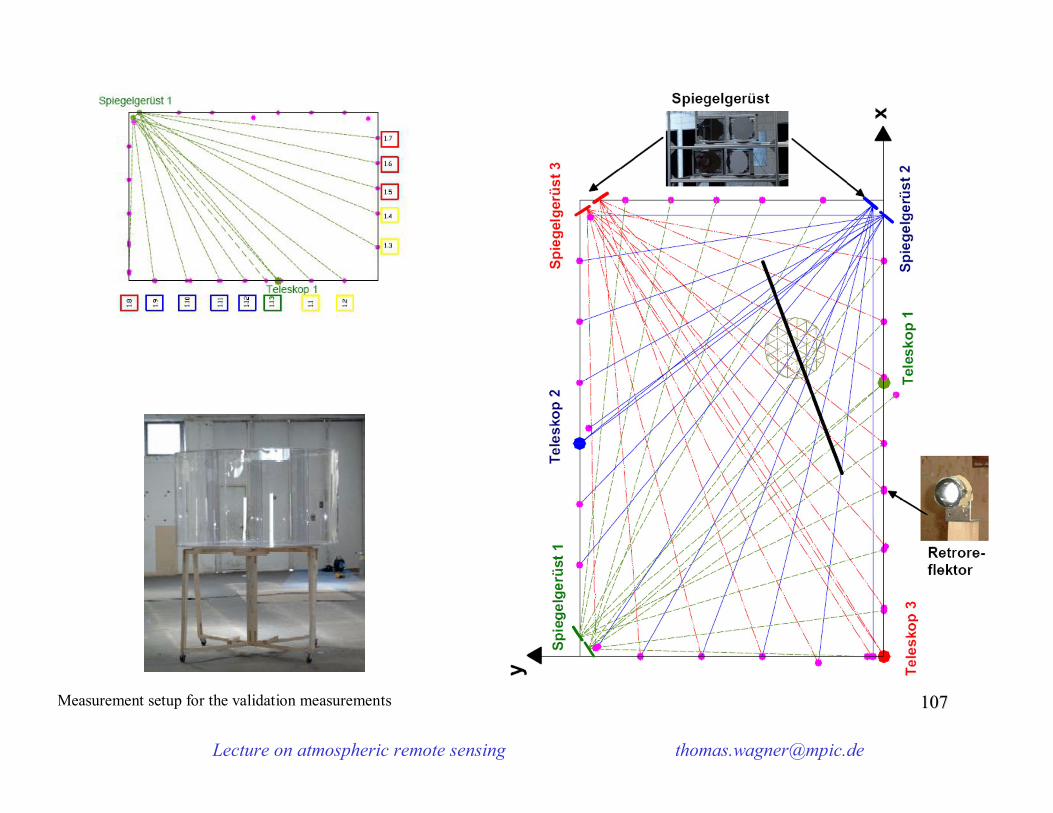
107107Measurement setup for the validation measurements
Lecture on atmospheric remote sensing [email protected]
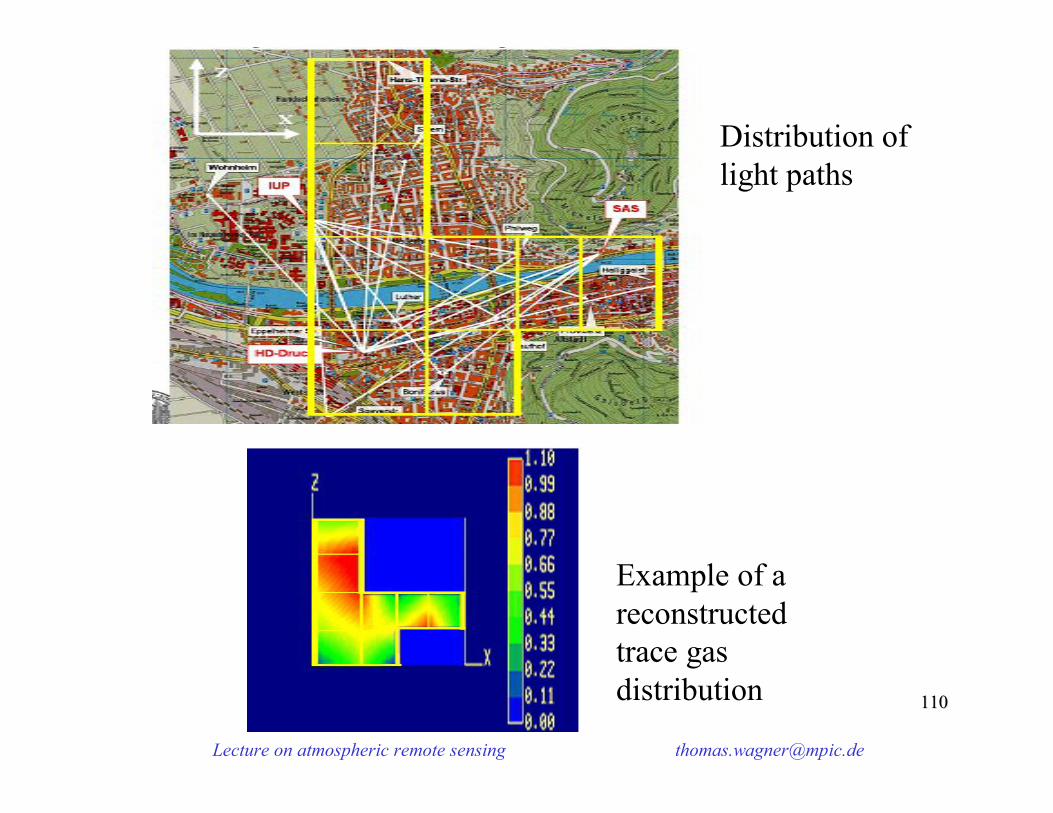
110110
Distribution of light paths
Example of a reconstructed trace gas distribution
Lecture on atmospheric remote sensing [email protected]
112112
Summary (I) Long Path (active) DOAS
-direct application of the Lambert-Beer law
-long absorption path is needed to become sensitive even for small trace gas concentrations
-LP-DOAS measurements are often used if spatial distribution is not important (is a trace gas present at all?)
=> many trace gases were first observed by LP DOAS
-measurements possible also during night
-only the averaged trace gas concentration along the light path can be obtained (from simple LP DOAS)
-expensive and complicated instrumental set-up
Lecture on atmospheric remote sensing [email protected]
113113
Summary (II) Long Path (active) DOAS
-recently many instrumental improvements were developed,e.g. fibre optics, LEDs as light sources, which make instruments much cheaper, lighter, and easier to operate
-many specialisations of LP-DOAS exist for specific applications:
-White (multi-reflection) system
-light paths at different altitudes
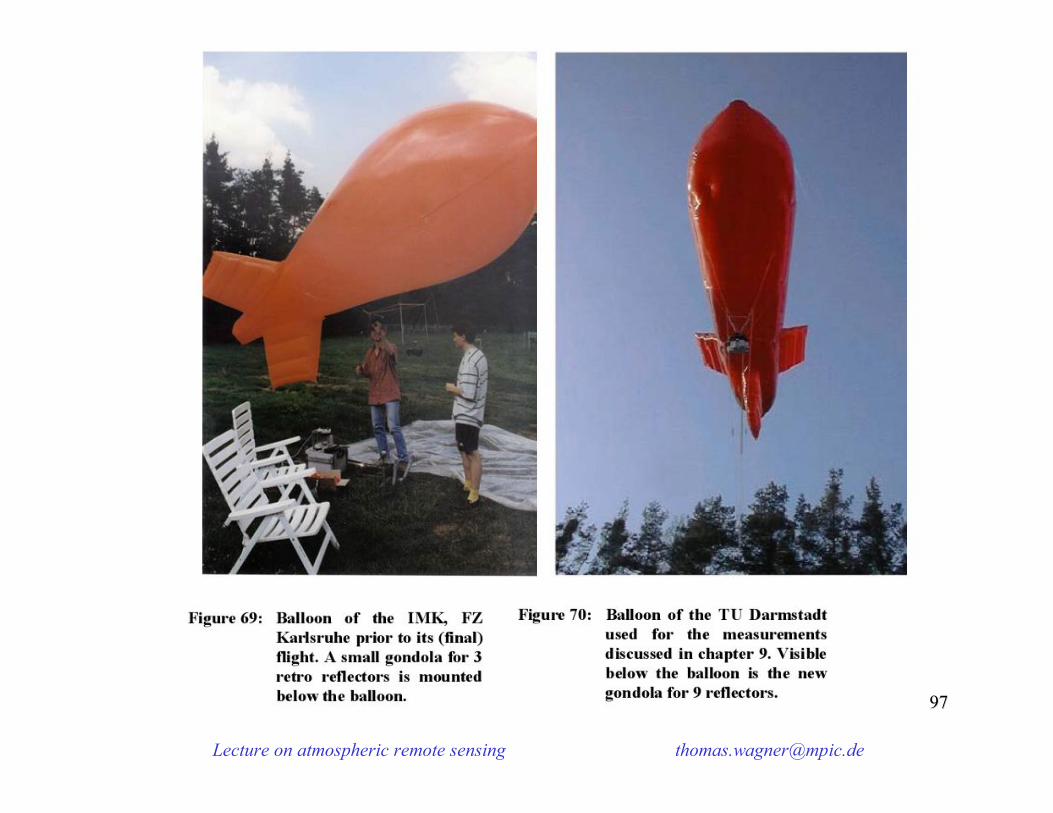
-balloon-borne reflectors
-tomographic inversions