looking for ways to characterize countries socio
TRANSCRIPT

Looking for ways to characterize countries socio-politically and economically
using longitudinal dataBy
Claire Durand, Université de Montréaland Paul Pelletier
Presented at the CSDI workshop,Limerick, Ireland,
March, 26-29, 2018

Outline
PThe context
PThe goal
PThe data
PMethods of analysis
PThe results< Clustering according to characteristics
< Clustering according to Trust
< Relationship between clusters
PConclusion
... It is a work in progress...
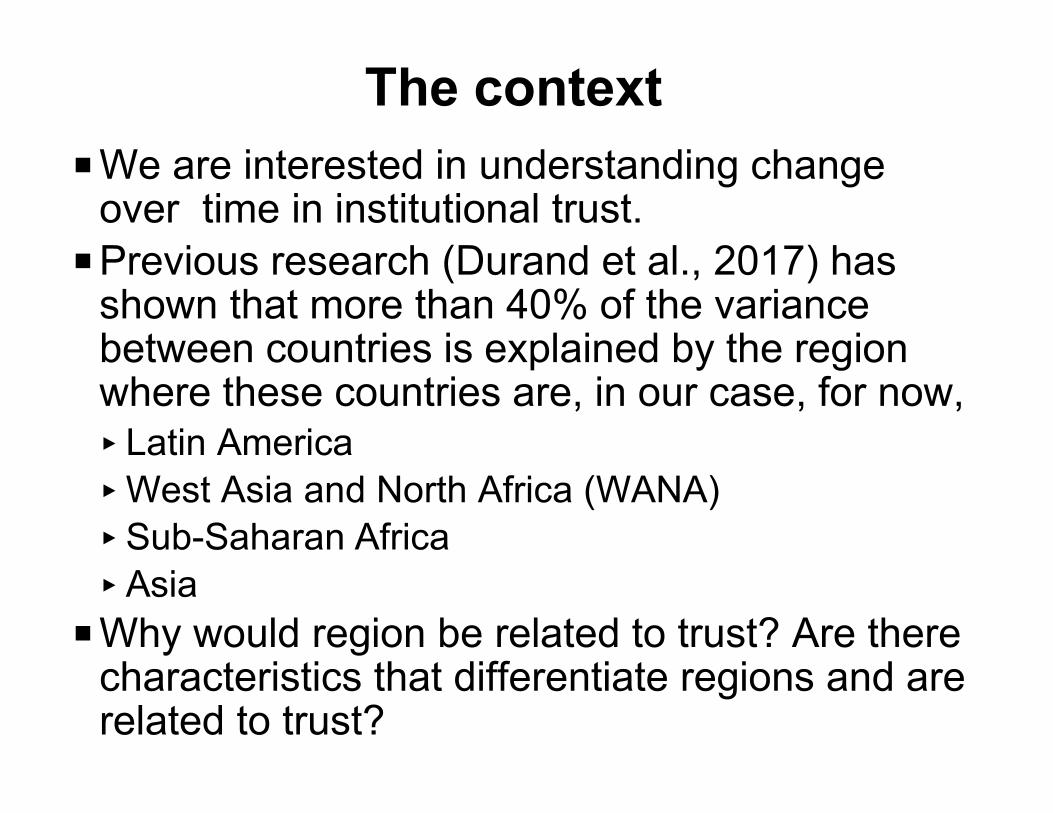
The context
PWe are interested in understanding changeover time in institutional trust.
PPrevious research (Durand et al., 2017) has shown that more than 40% of the variance between countries is explained by the region where these countries are, in our case, for now,< Latin America
< West Asia and North Africa (WANA)
< Sub-Saharan Africa
< Asia
PWhy would region be related to trust? Are therecharacteristics that differentiate regions and arerelated to trust?

The problem “With your feet in a ice bucket and your head in the
oven, on average you are comfortable”
PThere is much heterogeneity between countrieswithin region in change over time in different measures of trust.
PWe want to characterize countries in order tounderstand heterogeneity & homogeneity withinand between regions.
PNot many authors could validate a relationship between socio-politico-economic indicators and trust, and certainly not a substantial one.
The goal
PUnderstand differences between regions ininstitutional trust, taking into account change overtime.
PWe do not want to predict perceptions (Trust) withperceptions, but with “factual” data.
PCan we cluster countries longitudinally, < According to change in the countries’ characteristics?
< According to change in trust in various institutions?
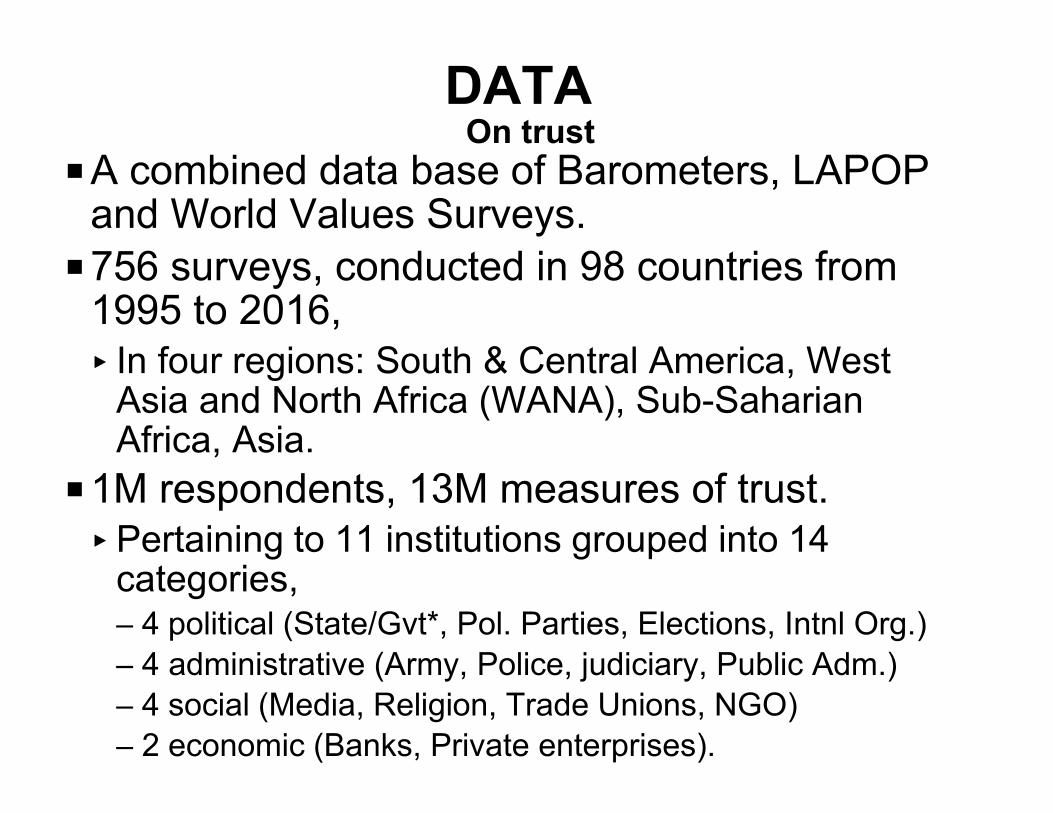
DATA
PA combined data base of Barometers, LAPOP and World Values Surveys.
P756 surveys, conducted in 98 countries from 1995 to 2016, < In four regions: South & Central America, West
Asia and North Africa (WANA), Sub-SaharianAfrica, Asia.
P1M respondents, 13M measures of trust.< Pertaining to 11 institutions grouped into 14
categories, – 4 political (State/Gvt*, Pol. Parties, Elections, Intnl Org.)
– 4 administrative (Army, Police, judiciary, Public Adm.)
– 4 social (Media, Religion, Trade Unions, NGO)
– 2 economic (Banks, Private enterprises).
On trust

Data
PSame countries as for trust, 1990-2016
PEconomic situation:< LN (GDP) per capita (QOG - UN)
< Gini: – Disposition and Market (SWIID)
PSocial situation:< Proportion of urban population (QOG - UN)
< Diversity:– Ethnic fractionalization (QOG -Alvesina et al.); E-GSMA
– Religious fractionalization (QOG -Alvesina et al.)
PPolitical:< Polity2 index of democratic regime
On countries’ characteristics

Methods of analysis
PWe use K-means longitudinal analysis in order
to cluster countries into homogenous groups
< Based on Trust -- total institutional trust and trust in
the State&Government
< And on social, economic and political characteristics.
PSince we cannot predict the past by the
future,...
< We use Correspondence analysis to examine
whether there is a relationship between clusters of
characteristics, region, and clusters of Trust.
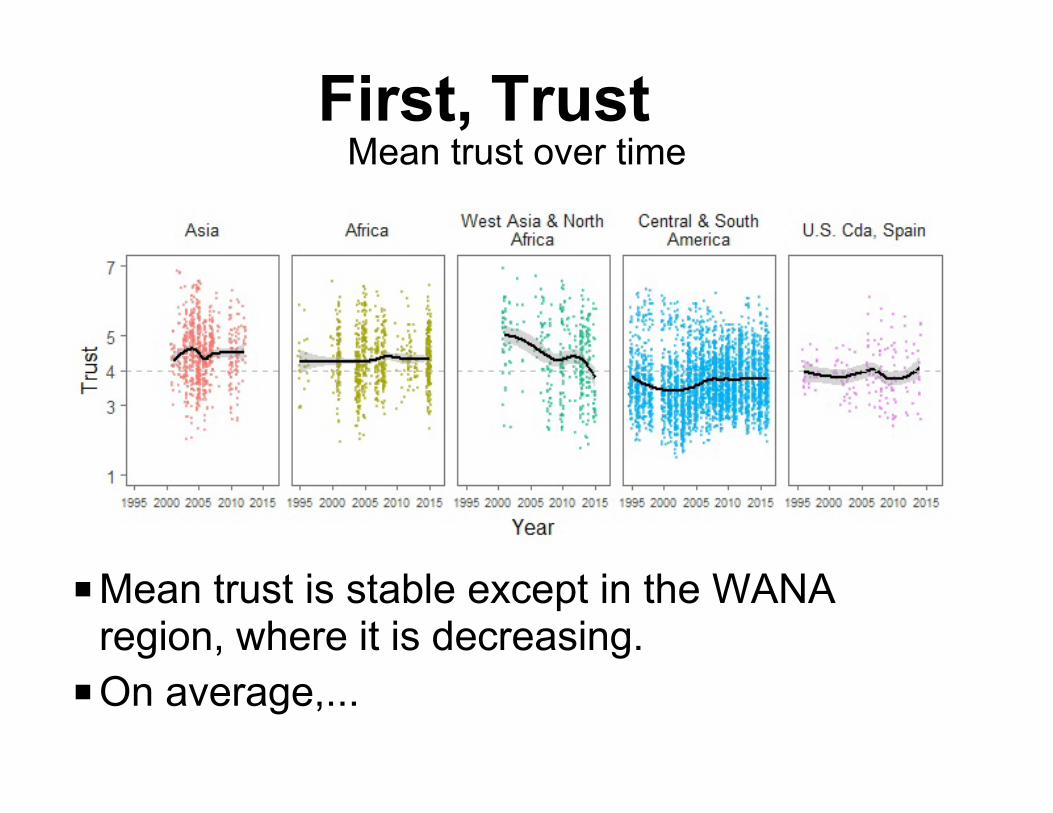
First, TrustMean trust over time
PMean trust is stable except in the WANA region, where it is decreasing.
POn average,...

Comparison of average trust &
trust in State/Government, by
region

Trust in State-Government, Latin America, some countries
P Increases in Bolivia, Argentina
PDecreases in Peru, Chile
PQuadratictrend in Brazil& Venezuela.

What about economiccharacteristics? In Latin AmericaSolt GINI_disp
P A rise in inequalities oftenprecedes a change of gvt: Bolivia,Venezuela, Argentina, Uruguay.
P 3 groups oftrajectories:< Argentina, Uruguay,
Venezuela
< Peru, Brazil, Chile
< Bolivia

Mean Institutional Trust
PLatin America is in the two low-trust clusters.
PMost of Asia is in the high trust cluster
PAfrica & Wana: mixed.
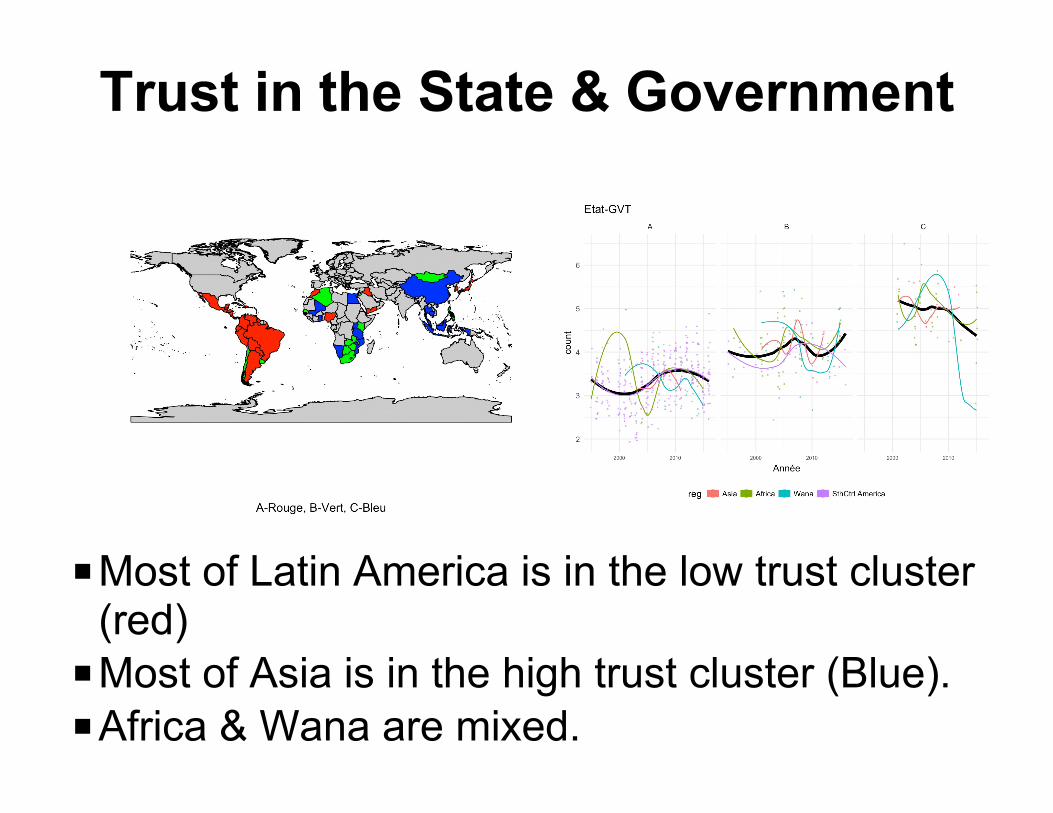
Trust in the State & Government
PMost of Latin America is in the low trust cluster(red)
PMost of Asia is in the high trust cluster (Blue).PAfrica & Wana are mixed.

GINI_disp index; level & shapeEstimate of inequality in equivalized household disposable (post-tax, post-transfer) income; the clustering takes into account thelevel of the index.
PLatin America: medium level, mostly quadraticPSouth Africa: high inequalitiesPWana & Asia: mixed but low inequalities
countries (blue) are present in both regions.
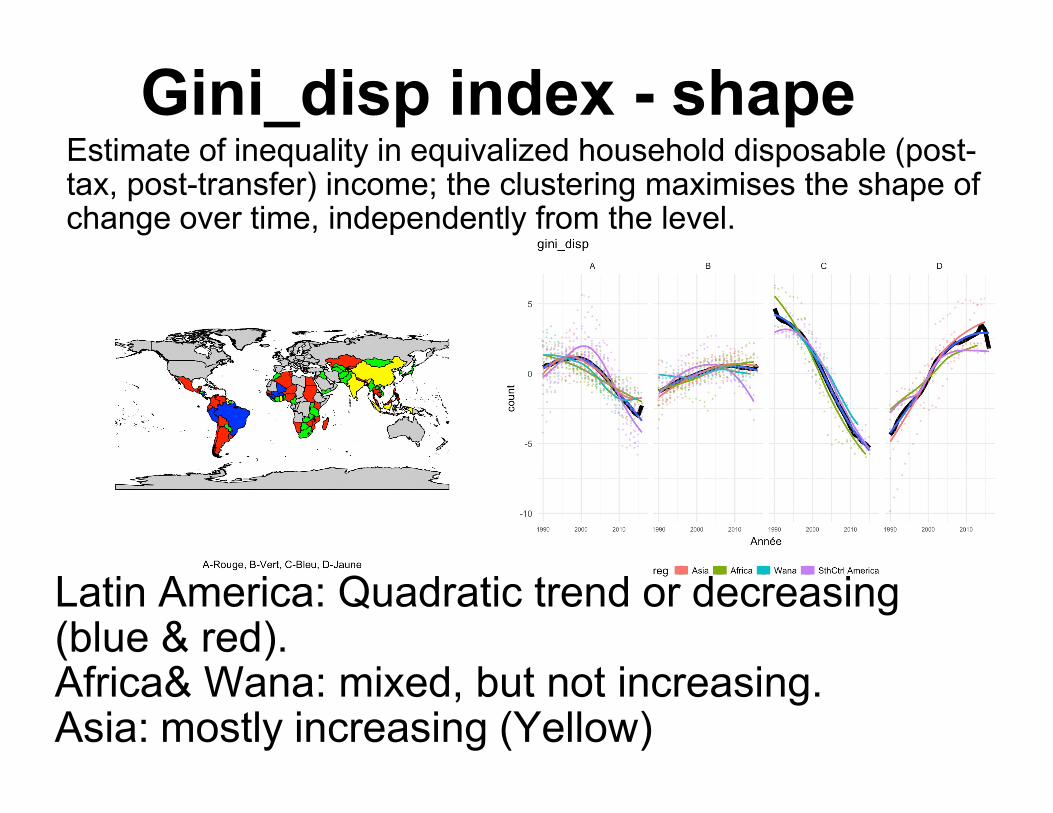
Gini_disp index - shapeEstimate of inequality in equivalized household disposable (post-tax, post-transfer) income; the clustering maximises the shape ofchange over time, independently from the level.
Latin America: Quadratic trend or decreasing(blue & red).Africa& Wana: mixed, but not increasing.Asia: mostly increasing (Yellow)

Gini_market index - shapeEstimate of inequality in equivalized household market (pre-tax,pre-transfer) income; the clustering maximises the shape ofchange over time, independently from the level.
PLatin America: quadratic or decreasing
PAfrica & WANA: mixed.
PAsia, South Africa: Increasing.

GDP (Ln)
PLatin America: Medium-High mostly
POther regions: mixed;

Urban Population
Medium-High (blue) & High (yellow) proportionof urban population characterizes LatinAmerica
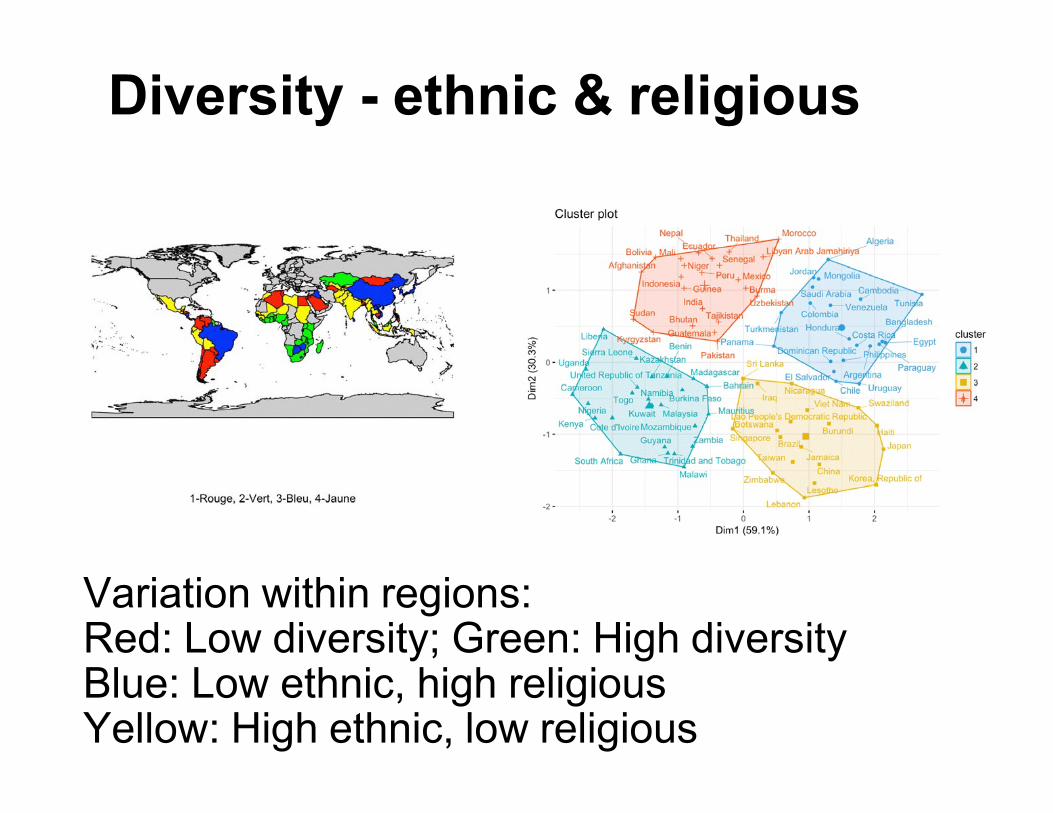
Diversity - ethnic & religious
Variation within regions:Red: Low diversity; Green: High diversityBlue: Low ethnic, high religiousYellow: High ethnic, low religious

Polity2 (democratic Regimes)
- Red: More democratic regimes characterizeLatin America- Green: More autocratic regimes characterizeWANA.- Asia & Africa are mixed.

First conclusion
PWe see that some clusters are more present in
some regions:
< For example, Latin America:
– all in the democratic cluster,
– most countries high urbanized and with a high ln(GDP).
PBut other analysis show clusters almost evenly
distributed in different regions.
< Diversity & Gini - shape indices, for example.
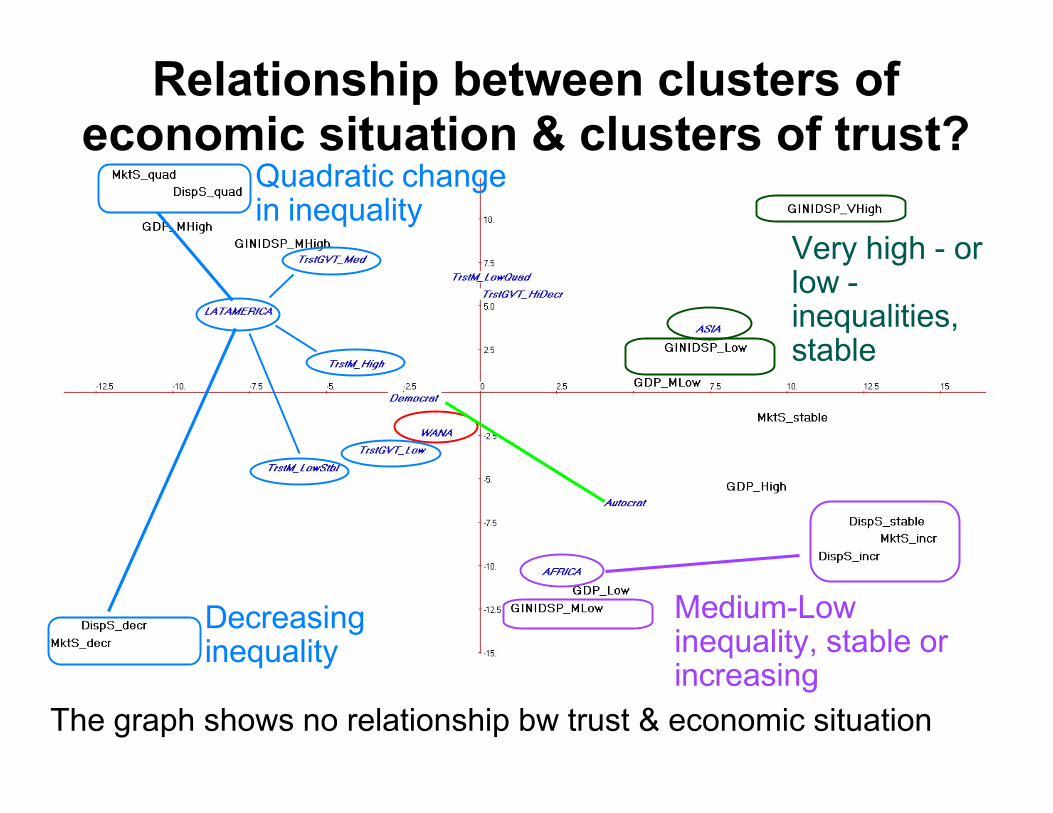
Relationship between clusters ofeconomic situation & clusters of trust?
Medium-Lowinequality, stable orincreasing
Decreasinginequality
Quadratic changein inequality
Very high - orlow -inequalities,stable
The graph shows no relationship bw trust & economic situation

Clusters of economicsituation & clusters of trust
Some countries

Relationship between clusters of socialsituation & clusters of trust?
The graph shows low trust in Governement to beassociated high urban population & low diversity.

Relationship between clusters of socialsituation & clusters of trust?
Some countries

Validating using 4-level regressionanalysis
PShows that:< Polity2 index (democratic vs autocratic regime) is
related:– Negatively to trust in the Government & the political
parties.– But positively to trust in the electoral process.
< Proportion of urban population related negativelywith average trust.
< Other variables not related, including an index ofchange over 5 years in the gini_disp index.
< These variables (+ WGI_mean) explain a similarproportion of variance that region.
ConclusionP We could find variables that inform about regional
differences. The interpretation of these findings is notyet obvious, however.
P Latin America is characterized by low trust,democratic regimes & a highly urbanized population.
< Can we conclude that democracy & the proportionof urban population are associated by low trust?What influences what?
P In other regions, there is much heterogeneity withinregion in all aspects.
P Some clusters are defined by quadratic trends. Thismay hamper the capacity to validate relationshipsbetween some characteristics & trust.

Next steps
PMore thorough review of the literature and
selection of other indicators (V-Dem data base
& World Governance indicators).
PClustering of trust according to other
institutions:
< Elections
< Political parties
< Army, police
< Trade Unions
< Religious leaders/ the Church.

Trust in the State/governement,compared with political parties, army &
police
PTrust in the state-gvt differ frommean institutionaltrust:
PAsia, stable;Africa: variable;Wana: declining;South-CentralAmerica:variable.

An example: Trust in the Media,Religious Organizations & Trade Unions
PTrust in the state-gvt differ frommean institutionaltrust:
PAsia, stable;Africa: variable;Wana: declining;South-CentralAmerica:variable.