major crops statistics of the philippines, … crops statistics of the philippines, 2010-2014...
TRANSCRIPT
MAJOR CROPS STATISTICS OF THE PHILIPPINES, 2010-2014 (REGIONAL AND PROVINCIAL)
PHILIPPINE STATISTICS AUTHORITY
DECEMBER 2015
ISSN-2012-0672
MAJOR CROPS STATISTICS OF THE PHILIPPINES, 2010-2014 (REGIONAL AND PROVINCIAL)
PHILIPPINE STATISTICS AUTHORITY
TERMS OF USE Major Crops Statistics of the Philippines is a publication of the Philippine Statistics Authority. The PSA reserves exclusive right to reproduce this publication in whatever form. Should any portion of this publication be included in a report/article, the title of the publication and the PSA should be cited as the source of data. The PSA will not be responsible for any information derived from the processing of data contained in this publication.
ISSN-2012-0672
MAJOR CROPS STATISTICS OF THE PHILIPPINES, 2010-2014 (REGIONAL AND PROVINCIAL)
PHILIPPINE STATISTICS AUTHORITY
FOREWORD
This is the 10th edition of the statistical report entitled Major Crops Statistics of the Philippines. It presents the 2010 to 2014 annual data on volume of production, area planted/harvested and number of trees/hills of 21 major crops under the following commodity groupings: Cereals, Fruit Crops, Non-Food and Industrial Crops and Vegetables and Root Crops. The data are disaggregated down to the provincial level. The 21 major crops are those highlighted in the Report on the Performance of Agriculture which is released quarterly by the Philippine Statistics Authority (PSA).
In response to the needs of our data users, the report presents statistics
on banana, mango, coffee and tobacco by variety. This report was prepared by the Crops Statistics Division (CSD) of the PSA.
It is intended to serve as ready reference for our various clients and stakeholders in the agriculture sector.
The PSA would appreciate comments and suggestions from our data users
and readers for further improvement of this report.
LISA GRACE S. BERSALES, Ph.D.
National Statistician
Quezon City, Philippines December 2015
i
MAJOR CROPS STATISTICS OF THE PHILIPPINES, 2010-2014 (REGIONAL AND PROVINCIAL)
PHILIPPINE STATISTICS AUTHORITY
ii
TABLE OF CONTENTS
Page
Foreword i
Table of contents ii
Explanatory notes iii
List of Tables vii
Summary 1
MAJOR CROPS STATISTICS OF THE PHILIPPINES, 2010-2014 (REGIONAL AND PROVINCIAL)
PHILIPPINE STATISTICS AUTHORITY
EXPLANATORY NOTES I. Crops Covered
This statistical report covers the following major crops: II. Sampling Methodology
A. CEREALS
The sampling design of the Palay and Corn Production Survey (PCPS) uses the results of the 1991 Census of Agriculture and Fisheries (CAF) as sampling frame. The survey domain is the province. It employs a replicated two-stage stratified sampling design. The barangay as the primary sampling unit (psu) is selected using a probability proportional to size (pps) scheme. The farming household which serves as the secondary sampling unit (ssu) is selected systematically.
iii
COMMON NAME SCIENTIFIC NAME ENGLISH NAME
Palay Oryza Sativa Linn Palay/Paddy
Mais Zea mays L. Corn/Maize
Niyog Cocos nucifera L. Coconut
Tubo Saccharun officinarum L. Sugarcane
Saging Musa sapientum var. Banana
Pinya Ananas comosus L. Pineapple
Kape Coffea sp. Coffee
Mangga Mangifer indica L. Mango
Tabako Nicotiana tabacum Tobacco
Abaka Musa textiles Nee Abaca
Mani Archis hypogea Linn. Peanut
Mongo Vigna radiata L. Mungbean
Kamoteng kahoy Manihot esculenta Crantz. Cassava
Kamote Ipomoea batatas Lam Sweet Potato
Kamatis Lycopersicon esculentum Mill. Tomato
Bawang Allium sativum Linn. Garl ic
Sibuyas Allium cepa Linn. Onion bulb
Repolyo Brassica oleracea L. (Capitata grp) Cabbage
Talong Solanum melongena Linn. Eggplant
Kalamans i Citrus madurensis Lour. Calamans i
Goma Hevea brasilliasis Mull. Ara Rubber
MAJOR CROPS STATISTICS OF THE PHILIPPINES, 2010-2014 (REGIONAL AND PROVINCIAL)
PHILIPPINE STATISTICS AUTHORITY
1. First Stage (Primary) Sampling Unit Selection
a. For Major Palay/Corn Provinces
The primary sampling units are divided into strata of approximately equal sizes relative to the total farm area devoted to palay/corn. The largest barangays in each municipality are lumped into one stratum (generally, the 10th stratum). The remaining barangays are then divided into 9 strata such that the aggregate palay/corn farm area of all the barangays constituting any one stratum is approximately the same as that of the other strata.
Using the area devoted to palay/corn as a measure of size of the barangay, a pps sample of four (4) independent barangays is selected from each stratum. Each sample barangay represents a replicate sample for that stratum.
b. For Other Provinces
The primary sampling units are divided into 5 strata with the largest barangays constituting the 5th stratum. A pps sample of two (2) independent barangays is selected from each stratum.
2. Second Stage (Secondary) Sampling Unit Selection
Households in each sample barangay are classified into farming and non-farming. For the PCPS, the selection of sample households is limited only to the group categorized as farming households. From the list of farming households and using a random start and a sampling interval, the sample households are drawn systematically.
B. OTHER CROPS
For crops other than palay and corn, basic production statistics are
generated thru the Crops Production survey which is based on non-probability sampling. That is, there is no frame where samples are selected. The domain of the survey is the province. The primary data sources are stratified into small farms and large farms/plantations. For large farms/plantations, a maximum of five (5) plantations are randomly chosen to represent the whole province. The cut-off size of large farms/plantations in hectares varies by crop and by major island grouping, Luzon, Visayas and Mindanao. For small farms, crops statistics generation employs two-stage sampling design. That is, for each crop the top five (5) producing municipalities in a province serve as the primary sampling units (psu). Five producing farmers from each municipality are
iv
MAJOR CROPS STATISTICS OF THE PHILIPPINES, 2010-2014 (REGIONAL AND PROVINCIAL)
PHILIPPINE STATISTICS AUTHORITY
the top five (5) producing municipalities in a province serve as the primary sampling units (psu). Five producing farmers from each municipality are chosen as the ultimate sampling units (usu). Under this approach, it is possible that a farmer may be drawn as a sample for more than one crop which he plants and harvests.
B1. Data on Other Crops with Specialized Commodity Agencies
Area and production data for sugarcane and abaca include estimates
generated from the PSA surveys and reports from specialized commodity agencies. For sugarcane, PSA covers cane that are used for chewing and production of panocha/muscovado and basi/vinegar and ethanol, while the Sugar Regulatory Administration (SRA) is the source of data in cane that are milled for centrifugal sugar. Abaca fiber that passes through baling stations is reported by the Philippine Fiber Industry Development Authority (PhilFIDA), while the PSA collects data on unbaled fiber. Data on area and production of coconut are the results of the Quarterly Coconut Production Survey (QCPS), a joint undertaking between the PSA and Philippine Coconut Authority (PCA).
The SRA releases monthly preliminary data, while FIDA releases data
on a quarterly basis. These data are finalized only in the succeeding year. The PSA, on the other hand, allows revision of the quarterly data it collects in the succeeding quarter. As a result of this difference in the time lag in releasing the final estimates for crops with specialized commodity agencies, the latest annual data, e.g. 2005, are considered preliminary.
III. Definition of Terms
Area Planted The actual physical area planted to a particular crop. In crop statistics, this generally applies to area reported for permanent crops.
Area Harvested The actual area from which harvests are realized. This excludes crop are which were totally damaged. It may be smaller than area planted. In crop statistics, this applies to temporary crops. Area Planted The actual physical area planted. This generally applies to area reported for permanent crops and multi-harvest temporary crops. Bearing Trees/Bearing Hills/ The number of trees/hills/vines where Bearing Vines harvesting has been made in the past but m
v
MAJOR CROPS STATISTICS OF THE PHILIPPINES, 2010-2014 (REGIONAL AND PROVINCIAL)
PHILIPPINE STATISTICS AUTHORITY
may or may not have borne fruits or productive during the reference period due to cyclical production pattern of the crop. Hills applies to banana. Vines applies to pepper and grapes. Crop Production Is the quantity produced and actually harvested for a particular crop during the reference period. It includes those harvested but damaged, stolen, given away, consumed, given as harvester’s share, reserved etc. Excluded are those produced but not harvested due to low price, lack of demand and force majeure or fortuitous events, etc. Major Crops Refer to the top 19 crops in the Philippines, other than palay and corn which collectively account for more than 60 percent of the total crop production. These include coconut, sugarcane, banana, pineapple, coffee, mango, tobacco, abaca, peanut, mongo, cassava, sweet potato, tomato, garlic, onion, cabbage, eggplant, calamansi and rubber. Permanent/Perennial Crops Are crops which occupy the land for a long period of time and do not need to be replaced after each harvest such as fruit trees, shrubs, nuts, etc. These crops may be productive or fruit-bearing crops. Examples are: avocado, coffee, coconut and other fruit trees.
Temporary Crops Crops which are grown seasonally and which growing cycle less than one year and which must be sown and planted again for production after each harvest.
vi
Note: A blank space in the data tables means that no harvest was made for the crop in the province.
MAJOR CROPS STATISTICS OF THE PHILIPPINES, 2010-2014 (REGIONAL AND PROVINCIAL)
PHILIPPINE STATISTICS AUTHORITY
LIST OF TABLES
vii
Table Page
1 SUMMARY: VOLUME OF PRODUCTION OF MAJOR CROPS,PHILIPPINES, 2010-2014 1
HIGHLIGHTS (CEREALS) - PALAY 2
2 PALAY: VOLUME OF PRODUCTION IN METRIC TONS, BY REGION,BY PROVINCE, PHILIPPINES, 2010-2014 4
3 PALAY: AREA HARVESTED IN HECTARES, BY REGION, BY PROVINCE, PHILIPPINES, 2010-2014 6
4 PALAY: TOP PRODUCING PROVINCES BASED ON PRODUCTION,PHILIPPINES, 2014 8
5 PALAY: TOP PRODUCING PROVINCES BASED ON AREA, PHILIPPINES, 2014 8
6 IRRIGATED PALAY: VOLUME OF PRODUCTION IN METRIC TONS,BY REGION, BY PROVINCE, PHILIPPINES, 2010-2014 9
7 IRRIGATED PALAY: AREA HARVESTED IN HECTARES, BY REGION, BY PROVINCE, PHILIPPINES, 2010-2014 11
8 IRRIGATED PALAY: TOP PRODUCING PROVINCES BASED ONPRODUCTION, PHILIPPINES, 2014 13
9 IRRIGATED PALAY: TOP PRODUCING PROVINCES BASED ON AREA, PHILIPPINES, 2014 13
10 RAINFED PALAY: VOLUME OF PRODUCTION IN METRIC TONS,BY REGION, BY PROVINCE, PHILIPPINES, 2010-2014 14
11 RAINFED PALAY: AREA HARVESTED IN HECTARES, BY REGION, BY PROVINCE, PHILIPPINES, 2010-2014 16
12 RAINFED PALAY: TOP PRODUCING PROVINCES BASED ON PRODUCTION, PHILIPPINES, 2014 18
13 RAINFED PALAY: TOP PRODUCING PROVINCES BASED ON AREA, PHILIPPINES, 2014 18
CORN 19
14 CORN: VOLUME OF PRODUCTION IN METRIC TONS, BY REGION,BY PROVINCE, PHILIPPINES, 2010-2014 21
15 CORN: AREA HARVESTED IN HECTARES, BY REGION, BY PROVINCE, PHILIPPINES, 2010-2014 23
MAJOR CROPS STATISTICS OF THE PHILIPPINES, 2010-2014 (REGIONAL AND PROVINCIAL)
PHILIPPINE STATISTICS AUTHORITY
viii
Table Page
16 CORN: TOP PRODUCING PROVINCES BASED ON PRODUCTION,PHILIPPINES, 2014 25
17 CORN: TOP PRODUCING PROVINCES BASED ON AREA, PHILIPPINES, 2014 25
18 WHITE CORN: VOLUME OF PRODUCTION IN METRIC TONS,BY REGION, BY PROVINCE, PHILIPPINES, 2010-2014 26
19 WHITE CORN: AREA HARVESTED IN HECTARES, BY REGION, BY PROVINCE, PHILIPPINES, 2010-2014 28
20 WHITE CORN: TOP PRODUCING PROVINCES BASED ON PRODUCTION, PHILIPPINES, 2014 30
21 WHITE CORN: TOP PRODUCING PROVINCES BASED ON AREA, PHILIPPINES, 2014 30
22 YELLOW CORN: VOLUME OF PRODUCTION IN METRIC TONS,BY REGION, BY PROVINCE, PHILIPPINES, 2010-2014 31
23 YELLOW CORN: AREA HARVESTED IN HECTARES, BY REGION, BY PROVINCE, PHILIPPINES, 2010-2014 33
24 YELLOW CORN: TOP PRODUCING PROVINCES BASED ON PRODUCTION, PHILIPPINES, 2014 35
25 YELLOW CORN: TOP PRODUCING PROVINCES BASED ON AREA, PHILIPPINES, 2014 35
HIGHLIGHTS (NON-FOOD and INDUSTRIAL CROPS) - ABACA 36
26 ABACA: VOLUME OF PRODUCTION IN METRIC TONS, BY REGION,BY PROVINCE, PHILIPPINES, 2010-2014 37
27 ABACA: AREA PLANTED IN HECTARES, BY REGION, BY PROVINCE, PHILIPPINES, 2010-2014 39
28 ABACA: TOP PRODUCING PROVINCES BASED ON PRODUCTION,PHILIPPINES, 2014 41
29 ABACA: TOP PRODUCING PROVINCES BASED ON AREA, PHILIPPINES, 2014 41
COCONUT 42
30 COCONUT: VOLUME OF PRODUCTION IN METRIC TONS ,BY REGION, BY PROVINCE, PHILIPPINES, 2010-2014 43
31 COCONUT: AREA PLANTED IN HECTARES, BY REGION, BY PROVINCE, PHILIPPINES, 2010-2014 45
MAJOR CROPS STATISTICS OF THE PHILIPPINES, 2010-2014 (REGIONAL AND PROVINCIAL)
PHILIPPINE STATISTICS AUTHORITY
ix
Table Page
32 COCONUT: NUMBER OF BEARING TREES BY REGION, BY PROVINCE, PHILIPPINES, 2010-2014 47
33 COCONUT: TOP PRODUCING PROVINCES BASED ON PRODUCTION,PHILIPPINES, 2014 49
34 COCONUT: TOP PRODUCING PROVINCES BASED ON AREA, PHILIPPINES, 2014 49
COFFEE 50
35 COFFEE: VOLUME OF PRODUCTION IN METRIC TONS,BY REGION, BY PROVINCE, PHILIPPINES, 2010-2014 53
36 COFFEE: AREA PLANTED IN HECTARES, BY REGION, BY PROVINCE,PHILIPPINES, 2010-2014 55
37 COFFEE: NUMBER OF BEARING TREES BY REGION, BY PROVINCE,PHILIPPINES, 2010-2014 57
38 COFFEE: TOP PRODUCING PROVINCES BASED ON PRODUCTION, 59PHILIPPINES, 2014
39 COFFEE: TOP PRODUCING PROVINCES BASED ON AREA, PHILIPPINES, 2014 59
40 ARABICA COFFEE: VOLUME OF PRODUCTION IN METRIC TONS BY REGION, BY PROVINCE, PHILIPPINES, 2010-2014 60
41 ARABICA COFFEE: AREA PLANTED IN HECTARES, BY REGION, BY PROVINCE, PHILIPPINES, 2010-2014 62
42 ARABICA COFFEE: NUMBER OF BEARING TREES, BY REGION, BY PROVINCE, PHILIPPINES, 2010-2014 64
43 ARABICA COFFEE: TOP PRODUCING PROVINCES BASED ONPRODUCTION, PHILIPPINES, 2014 66
44 ARABICA COFFEE: TOP PRODUCING PROVINCES BASED ON AREA, PHILIPPINES, 2014 66
45 EXCELSA COFFEE: VOLUME OF PRODUCTION IN METRIC TONS BY REGION, BY PROVINCE, PHILIPPINES, 2010-2014 67
46 EXCELSA COFFEE: AREA PLANTED IN HECTARES, BY REGION,BY PROVINCE, PHILIPPINES, 2010-2014 69
47 EXCELSA COFFEE: NUMBER OF BEARING TREES, BY REGION, BY PROVINCE, PHILIPPINES, 2010-2014 71
MAJOR CROPS STATISTICS OF THE PHILIPPINES, 2010-2014 (REGIONAL AND PROVINCIAL)
PHILIPPINE STATISTICS AUTHORITY
x
Table Page
48 EXCELSA COFFEE: TOP PRODUCING PROVINCES BASED ONPRODUCTION, PHILIPPINES, 2014 73
49 EXCELSA COFFEE: TOP PRODUCING PROVINCES BASED ON AREA,PHILIPPINES, 2014 73
50 LIBERICA COFFEE: VOLUME OF PRODUCTION IN METRIC TONS BY REGION, BY PROVINCE, PHILIPPINES, 2010-2014 74
51 LIBERICA COFFEE: AREA PLANTED IN HECTARES, BY REGION,BY PROVINCE, PHILIPPINES, 2010-2014 76
52 LIBERICA COFFEE: NUMBER OF BEARING TREES BY REGION, BY PROVINCE, PHILIPPINES, 2010-2014 78
53 LIBERICA COFFEE: TOP PRODUCING PROVINCES BASED ON PRODUCTION, PHILIPPINES, 2014 80
54 LIBERICA COFFEE: TOP PRODUCING PROVINCES BASED ON AREA,PHILIPPINES, 2014 80
55 ROBUSTA COFFEE: VOLUME OF PRODUCTION IN METRIC TONS, BY REGION, BY PROVINCE, PHILIPPINES, 2010-2014 81
56 ROBUSTA COFFEE: AREA PLANTED IN HECTARES, BY REGION,BY PROVINCE, PHILIPPINES, 2010-2014 83
57 ROBUSTA COFFEE: NUMBER OF BEARING TREES BY REGION, BY PROVINCE, PHILIPPINES, 2010-2014 85
58 ROBUSTA COFFEE: TOP PRODUCING PROVINCES BASED ON PRODUCTION, PHILIPPINES, 2014 87
59 ROBUSTA COFFEE: TOP PRODUCING PROVINCES BASED ON AREA,PHILIPPINES, 2014 87
RUBBER 88
60 RUBBER: VOLUME OF PRODUCTION IN METRIC TONS, BY REGION,BY PROVINCE, PHILIPPINES, 2010-2014 89
61 RUBBER: AREA PLANTED IN HECTARES, BY REGION, BY PROVINCE,PHILIPPINES, 2010-2014 91
62 RUBBER: NUMBER OF MATURE TREES BY REGION, BY PROVINCEPHILIPPINES, 2010-2014 93
63 RUBBER: TOP PRODUCING PROVINCES BASED ON PRODUCTION,PHILIPPINES, 2014 95
MAJOR CROPS STATISTICS OF THE PHILIPPINES, 2010-2014 (REGIONAL AND PROVINCIAL)
PHILIPPINE STATISTICS AUTHORITY
xi
Table Page
64 RUBBER: TOP PRODUCING PROVINCES BASED ON AREA, PHILIPPINES, 2014 95
SUGARCANE 96
65 SUGARCANE: VOLUME OF PRODUCTION IN METRIC TONS, BY REGION, BY PROVINCE, PHILIPPINES, 2010-2014 97
66 SUGARCANE: AREA PLANTED IN HECTARES, BY REGION, BY PROVINCE, PHILIPPINES, 2010-2014 99
67 SUGARCANE: TOP PRODUCING PROVINCES BASED ONPRODUCTION, PHILIPPINES, 2014 101
68 SUGARCANE: TOP PRODUCING PROVINCES BASED ON AREA, PHILIPPINES, 2014 101
TOBACCO 102
69 TOBACCO: VOLUME OF PRODUCTION IN METRIC TONS BY REGION, BY PROVINCE, PHILIPPINES, 2010-2014 104
70 TOBACCO: AREA PLANTED IN HECTARES, BY REGION, BY PROVINCE, PHILIPPINES, 2010-2014 106
71 TOBACCO: TOP PRODUCING PROVINCES BASED ON PRODUCTION,PHILIPPINES, 2014 108
72 TOBACCO: TOP PRODUCING PROVINCES BASED ON AREA,PHILIPPINES, 2014 108
73 NATIVE TOBACCO: VOLUME OF PRODUCTION IN METRIC TONS, BY REGION, BY PROVINCE, PHILIPPINES, 2010-2014 109
74 NATIVE TOBACCO: AREA PLANTED IN HECTARES, BY REGION, BY PROVINCE, PHILIPPINES, 2010-2014 111
75 NATIVE TOBACCO: TOP PRODUCING PROVINCES BASED ONPRODUCTION, PHILIPPINES, 2014 113
76 NATIVE TOBACCO: TOP PRODUCING PROVINCES BASED ON AREA, PHILIPPINES, 2014 113
77 VIRGINIA TOBACCO: VOLUME OF PRODUCTION IN METRIC TONS,BY REGION, BY PROVINCE, PHILIPPINES, 2010-2014 114
78 TVIRGINIA TOBACCO: AREA PLANTED IN HECTARES, BY REGION, BY PROVINCE, PHILIPPINES, 2010-2014 116
79 VIRGINIA TOBACCO: TOP PRODUCING PROVINCES BASED ONPRODUCTION, PHILIPPINES, 2014 118
80 VIRGINIA TOBACCO: TOP PRODUCING PROVINCES BASED ON AREA, PHILIPPINES, 2014 118
MAJOR CROPS STATISTICS OF THE PHILIPPINES, 2010-2014 (REGIONAL AND PROVINCIAL)
PHILIPPINE STATISTICS AUTHORITY
xii
Table Page
HIGHLIGHTS (FRUITS) - BANANA 119
81 BANANA: VOLUME OF PRODUCTION IN METRIC TONS, BY REGION,BY PROVINCE, PHILIPPINES, 2010-2014 123
82 BANANA: AREA PLANTED IN HECTARES, BY REGION, BY PROVINCE,PHILIPPINES, 2010-2014 125
83 BANANA: NUMBER OF BEARING TREES BY REGION, BY PROVINCE,PHILIPPINES, 2010-2014 127
84 BANANA: TOP PRODUCING PROVINCES BASED ON PRODUCTION,PHILIPPINES, 2014 129
85 BANANA: TOP PRODUCING PROVINCES BASED ON AREA, PHILIPPINES, 2014 129
86 CAVENDISH BANANA: VOLUME OF PRODUCTION IN METRIC TONS,BY REGION, BY PROVINCE, PHILIPPINES, 2010-2014 130
87 CAVENDISH BANANA: AREA PLANTED IN HECTARES, BY REGION, BY PROVINCE, PHILIPPINES, 2010-2014 132
88 CAVENDISH BANANA: NUMBER OF BEARING TREES BY REGION, BY PROVINCE, PHILIPPINES, 2010-2014 134
89 CAVENDISH BANANA: TOP PRODUCING PROVINCES BASED ON PRODUCTION, PHILIPPINES, 2014 136
90 CAVENDISH BANANA: TOP PRODUCING PROVINCES BASED ON AREA, PHILIPPINES, 2014 136
91 LAKATAN BANANA: VOLUME OF PRODUCTION IN METRIC TONS,BY REGION, BY PROVINCE, PHILIPPINES, 2010-2014 137
92 LAKATAN BANANA: AREA PLANTED IN HECTARES, BY REGION, BY PROVINCE, PHILIPPINES, 2010-2014 139
93 LAKATAN BANANA: NUMBER OF BEARING TREES BY REGION, BY PROVINCE, PHILIPPINES, 2010-2014 141
94 LAKATAN BANANA: TOP PRODUCING PROVINCES BASED ON PRODUCTION, PHILIPPINES, 2014 143
95 LAKATAN BANANA: TOP PRODUCING PROVINCES BASED ON AREA, PHILIPPINES, 2014 143
96 SABA BANANA: VOLUME OF PRODUCTION IN METRIC TONS, BY REGION, BY PROVINCE, PHILIPPINES, 2010-2014 144
MAJOR CROPS STATISTICS OF THE PHILIPPINES, 2010-2014 (REGIONAL AND PROVINCIAL)
PHILIPPINE STATISTICS AUTHORITY
xiii
Table Page
97 SABA BANANA: AREA PLANTED IN HECTARES, BY REGION, BY PROVINCE, PHILIPPINES, 2010-2014 146
98 SABA BANANA: NUMBER OF BEARING TREES BY REGION, BY PROVINCE, PHILIPPINES, 2010-2014 148
99 SABA BANANA: TOP PRODUCING PROVINCES BASED ON PRODUCTION, PHILIPPINES, 2014 150
100 SABA BANANA: TOP PRODUCING PROVINCES BASED ON AREA, PHILIPPINES, 2014 150
HIGHLIGHTS – CALAMANSI 151
101 CALAMANSI: VOLUME OF PRODUCTION IN METRIC TONS BY REGION, BY PROVINCE, PHILIPPINES, 2010-2014 152
102 CALAMANSI: AREA PLANTED IN HECTARES, BY REGION, BY PROVINCE, PHILIPPINES, 2010-2014 154
103 CALAMANSI: NUMBER OF BEARING TREES BY REGION, BY PROVINCE, PHILIPPINES, 2010-2014 156
104 CALAMANSI: TOP PRODUCING PROVINCES BASED ON PRODUCTION, PHILIPPINES, 2014 158
105 CALAMANSI: TOP PRODUCING PROVINCES BASED ON AREA, PHILIPPINES, 2014 158
HIGHLIGHTS– MANGO 159
106 MANGO: VOLUME OF PRODUCTION IN METRIC TONS, BY REGION, BY PROVINCE, PHILIPPINES, 2010-2014 161
107 MANGO: AREA PLANTED IN HECTARES, BY REGION, BY PROVINCE, PHILIPPINES, 2010-2014 163
108 MANGO: NUMBER OF BEARING TREES BY REGION, BY PROVINCE, PHILIPPINES, 2010-2014 165
109 MANGO: TOP PRODUCING PROVINCES BASED ON PRODUCTION, PHILIPPINES, 2014 167
110 MANGO: TOP PRODUCING PROVINCES BASED ON AREA, PHILIPPINES, 2014 167
111 CARABAO MANGO: VOLUME OF PRODUCTION IN METRIC TONS, BY REGION, BY PROVINCE, PHILIPPINES, 2010-2014 168
112 CARABAO MANGO: AREA PLANTED IN HECTARES, BY REGION, BY PROVINCE, PHILIPPINES, 2010-2014 170

MAJOR CROPS STATISTICS OF THE PHILIPPINES, 2010-2014 (REGIONAL AND PROVINCIAL)
PHILIPPINE STATISTICS AUTHORITY
xiv
Table Page
113 CARABAO MANGO: NUMBER OF BEARING TREES BY REGION, BY PROVINCE, PHILIPPINES, 2010-2014 172
114 CARABAO MANGO: TOP PRODUCING PROVINCES BASED ON PRODUCTION, PHILIPPINES, 2014 174
115 CARABAO MANGO: TOP PRODUCING PROVINCES BASED ON AREA, PHILIPPINES, 2014 174
HIGHLIGHTS – PINEAPPLE 175
116 PINEAPPLE: VOLUME OF PRODUCTION IN METRIC TONS BY REGION, BY PROVINCE, PHILIPPINES, 2010-2014 176
117 PINEAPPLE: AREA PLANTED IN HECTARES, BY REGION, BY PROVINCE, PHILIPPINES, 2010-2014 178
118 PINEAPPLE: TOP PRODUCING PROVINCES BASED ON PRODUCTION, PHILIPPINES, 2014 180
119 PINEAPPLE: TOP PRODUCING PROVINCES BASED ON AREA, PHILIPPINES, 2014 180
HIGHLIGHTS – CABBAGE 181
120 CABBAGE: VOLUME OF PRODUCTION IN METRIC TONS BY REGION,BY PROVINCE, PHILIPPINES, 2010-2014 182
121 CABBAGE: AREA HARVESTED IN HECTARES, BY REGION, BY PROVINCE, PHILIPPINES, 2010-2014 184
122 CABBAGE: TOP PRODUCING PROVINCES BASED ON PRODUCTION,PHILIPPINES, 2014 186
123 CABBAGE: TOP PRODUCING PROVINCES BASED ON AREA, PHILIPPINES, 2014 186
HIGHLIGHTS – SWEET POTATO 187
124 SWEET POTATO: VOLUME OF PRODUCTION IN METRIC TONS, BY REGION, BY PROVINCE, PHILIPPINES, 2010-2014 188
125 SWEET POTATO: AREA HARVESTED IN HECTARES, BY REGION, BY PROVINCE, PHILIPPINES, 2010-2014 190
126 SWEET POTATO: TOP PRODUCING PROVINCES BASED ON PRODUCTION, PHILIPPINES, 2014 192
127 SWEET POTATO: TOP PRODUCING PROVINCES BASED ON AREA, PHILIPPINES, 2014 192
MAJOR CROPS STATISTICS OF THE PHILIPPINES, 2010-2014 (REGIONAL AND PROVINCIAL)
PHILIPPINE STATISTICS AUTHORITY
xv
Table Page
HIGHLIGHTS – CASSAVA 193
128 CASSAVA: VOLUME OF PRODUCTION IN METRIC TONS, BY REGION,BY PROVINCE, PHILIPPINES, 2010-2014 194
129 CASSAVA: AREA HARVESTED IN HECTARES, BY REGION, BY PROVINCE,PHILIPPINES, 2010-2014 196
130 CASSAVA: TOP PRODUCING PROVINCES BASED ON PRODUCTION, PHILIPPINES, 2014 198
131 CASSAVA: TOP PRODUCING PROVINCES BASED ON AREA, PHILIPPINES, 2014 198
HIGHLIGHTS – EGGPLANT 199
132 EGGPLANT: VOLUME OF PRODUCTION IN METRIC TONS, BY REGION,BY PROVINCE, PHILIPPINES, 2010-2014 200
133 EGGPLANT: AREA PLANTED IN HECTARES, BY REGION, BY PROVINCE,
BY PROVINCE, PHILIPPINES, 2010-2014 202
134 EGGPLANT: TOP PRODUCING PROVINCES BASED ON PRODUCTION,
PHILIPPINES, 2014 204
135 EGGPLANT: TOP PRODUCING PROVINCES BASED ON AREA,
PHILIPPINES, 2014 204
HIGHLIGHTS – GARLIC 205
136 GARLIC: VOLUME OF PRODUCTION IN METRIC TONS, BY REGION,
BY PROVINCE, PHILIPPINES, 2010-2014 206
137 GARLIC: AREA HARVESTED IN HECTARES, BY REGION, BY PROVINCE,
PHILIPPINES, 2010-2014 208
138 GARLIC: TOP PRODUCING PROVINCES BASED ON PRODUCTION,
PHILIPPINES, 2014 210
139 GARLIC: TOP PRODUCING PROVINCES BASED ON AREA,
PHILIPPINES, 2014 210
HIGHLIGHTS – MUNGBEAN 211
140 MUNGBEAN: VOLUME OF PRODUCTION IN METRIC TONS, BY REGION,
BY PROVINCE, PHILIPPINES, 2010-2014 212
141 MUNGBEAN: AREA HARVESTED IN HECTARES, BY REGION,
BY PROVINCE, PHILIPPINES, 2010-2014 214
MAJOR CROPS STATISTICS OF THE PHILIPPINES, 2010-2014 (REGIONAL AND PROVINCIAL)
PHILIPPINE STATISTICS AUTHORITY
xvi
Table Page
142 MUNGBEAN: TOP PRODUCING PROVINCES BASED ON PRODUCTION, PHILIPPINES, 2014 216
143 MUNGBEAN: TOP PRODUCING PROVINCES BASED ON AREA,
PHILIPPINES, 2014 216
HIGHLIGHTS – ONION 217
144 ONION: VOLUME OF PRODUCTION IN METRIC TONS, BY REGION,
BY PROVINCE, PHILIPPINES, 2010-2014 218
145 ONION: AREA HARVESTED IN HECTARES, BY REGION, BY PROVINCE,
PHILIPPINES, 2010-2014 220
146 ONION: TOP PRODUCING PROVINCES BASED ON PRODUCTION, PHILIPPINES, 2014 222
147 ONION: TOP PRODUCING PROVINCES BASED ON AREA, PHILIPPINES, 2014 222
HIGHLIGHTS – PEANUT 223
148 PEANUT: VOLUME OF PRODUCTION IN METRIC TONS, BY REGION,BY PROVINCE, PHILIPPINES, 2010-2014 224
149 PEANUT: AREA HARVESTED IN HECTARES, BY REGION, BY PROVINCE,PHILIPPINES, 2010-2014 226
150 PEANUT: TOP PRODUCING PROVINCES BASED ON PRODUCTION, PHILIPPINES, 2014 228
151 PEANUT: TOP PRODUCING PROVINCES BASED ON AREA, PHILIPPINES, 2014 228
HIGHLIGHTS – TOMATO 229
152 TOMATO: VOLUME OF PRODUCTION IN METRIC TONS BY REGION,BY PROVINCE, PHILIPPINES, 2010-2014 230
153 TOMATO: AREA PLANTED IN HECTARES, BY REGION, BY PROVINCE,PHILIPPINES, 2010-2014 232
154 TOMATO: TOP PRODUCING PROVINCES BASED ON PRODUCTION, PHILIPPINES, 2014 234
155 TOMATO: TOP PRODUCING PROVINCES BASED ON AREA, PHILIPPINES, 2014 234
MAJOR CROPS STATISTICS OF THE PHILIPPINES, 2010-2014 (REGIONAL AND PROVINCIAL)
PHILIPPINE STATISTICS AUTHORITY
SUMMARY
1
Crop 2010 2011 2012 R/ 2013 R/ 2014
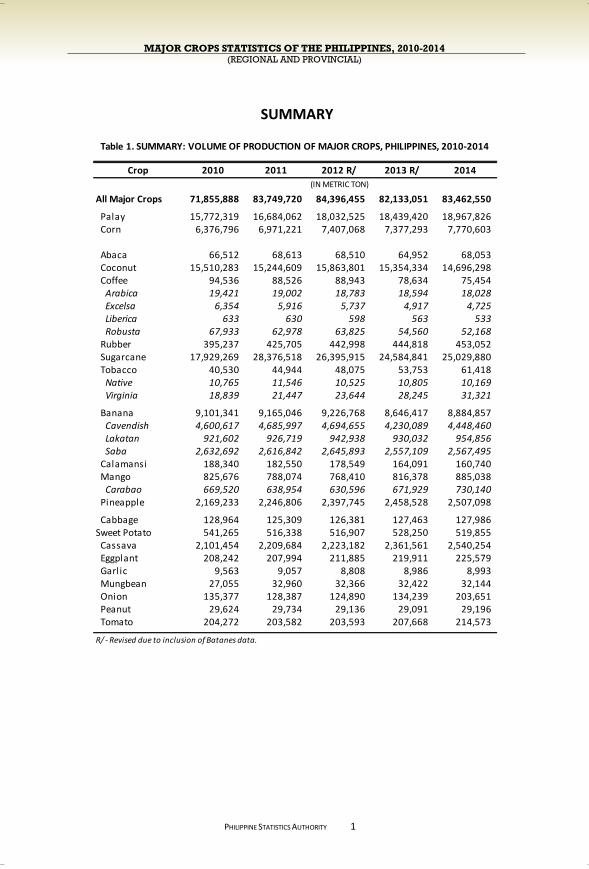
All Major Crops 71,855,888 83,749,720 84,396,455 82,133,051 83,462,550
Palay 15,772,319 16,684,062 18,032,525 18,439,420 18,967,826 Corn 6,376,796 6,971,221 7,407,068 7,377,293 7,770,603
Abaca 66,512 68,613 68,510 64,952 68,053 Coconut 15,510,283 15,244,609 15,863,801 15,354,334 14,696,298 Coffee 94,536 88,526 88,943 78,634 75,454
Arabica 19,421 19,002 18,783 18,594 18,028 Excelsa 6,354 5,916 5,737 4,917 4,725 Liberica 633 630 598 563 533 Robusta 67,933 62,978 63,825 54,560 52,168
Rubber 395,237 425,705 442,998 444,818 453,052 Sugarcane 17,929,269 28,376,518 26,395,915 24,584,841 25,029,880 Tobacco 40,530 44,944 48,075 53,753 61,418
Native 10,765 11,546 10,525 10,805 10,169 Virginia 18,839 21,447 23,644 28,245 31,321
Banana 9,101,341 9,165,046 9,226,768 8,646,417 8,884,857 Cavendish 4,600,617 4,685,997 4,694,655 4,230,089 4,448,460 Lakatan 921,602 926,719 942,938 930,032 954,856 Saba 2,632,692 2,616,842 2,645,893 2,557,109 2,567,495
Calamansi 188,340 182,550 178,549 164,091 160,740 Mango 825,676 788,074 768,410 816,378 885,038
Carabao 669,520 638,954 630,596 671,929 730,140 Pineapple 2,169,233 2,246,806 2,397,745 2,458,528 2,507,098
Cabbage 128,964 125,309 126,381 127,463 127,986 Sweet Potato 541,265 516,338 516,907 528,250 519,855 Cassava 2,101,454 2,209,684 2,223,182 2,361,561 2,540,254 Eggplant 208,242 207,994 211,885 219,911 225,579 Garlic 9,563 9,057 8,808 8,986 8,993 Mungbean 27,055 32,960 32,366 32,422 32,144 Onion 135,377 128,387 124,890 134,239 203,651 Peanut 29,624 29,734 29,136 29,091 29,196 Tomato 204,272 203,582 203,593 207,668 214,573
R/ - Revised due to inclusion of Batanes data.
Table 1. SUMMARY: VOLUME OF PRODUCTION OF MAJOR CROPS, PHILIPPINES, 2010-2014
(IN METRIC TON)
MAJOR CROPS STATISTICS OF THE PHILIPPINES, 2010-2014 (REGIONAL AND PROVINCIAL)
PHILIPPINE STATISTICS AUTHORITY
PALAY
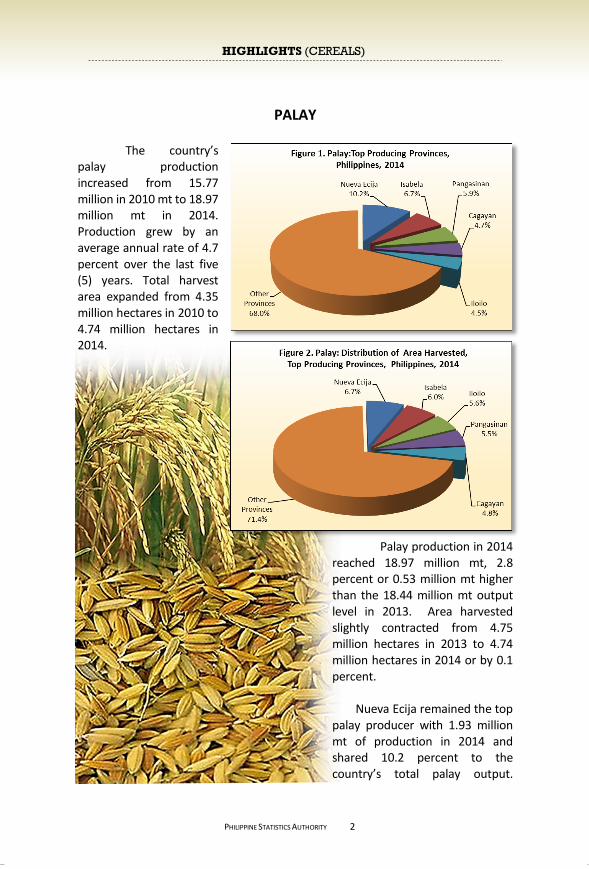
The country’s palay production increased from 15.77 million in 2010 mt to 18.97 million mt in 2014. Production grew by an average annual rate of 4.7 percent over the last five (5) years. Total harvest area expanded from 4.35 million hectares in 2010 to 4.74 million hectares in 2014.
Palay production in 2014 reached 18.97 million mt, 2.8 percent or 0.53 million mt higher than the 18.44 million mt output level in 2013. Area harvested slightly contracted from 4.75 million hectares in 2013 to 4.74 million hectares in 2014 or by 0.1 percent.
Nueva Ecija remained the top
palay producer with 1.93 million mt of production in 2014 and shared 10.2 percent to the country’s total palay output. Isabela ranked second with 6.7
2
HIGHLIGHTS (CEREALS)

MAJOR CROPS STATISTICS OF THE PHILIPPINES, 2010-2014 (REGIONAL AND PROVINCIAL)
PHILIPPINE STATISTICS AUTHORITY
Isabela ranked second with 6.7 percent share to the national total. This was followed by Pangasinan, Cagayan and Iloilo with 5.9 percent, 4.7 percent and 4.5 percent shares, respectively. The combined output of these provinces totaled 6.06 million mt or 32.0 percent of the total production (Figure 1). Total harvest areas from these provinces were 1.36 million hectares, or 28.6 percent of country’s total palay area (Figure 2).
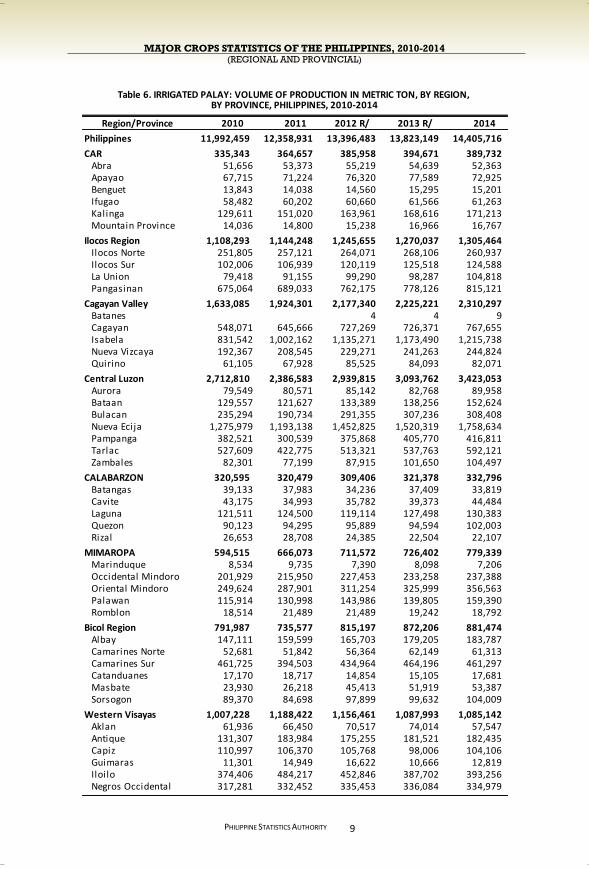
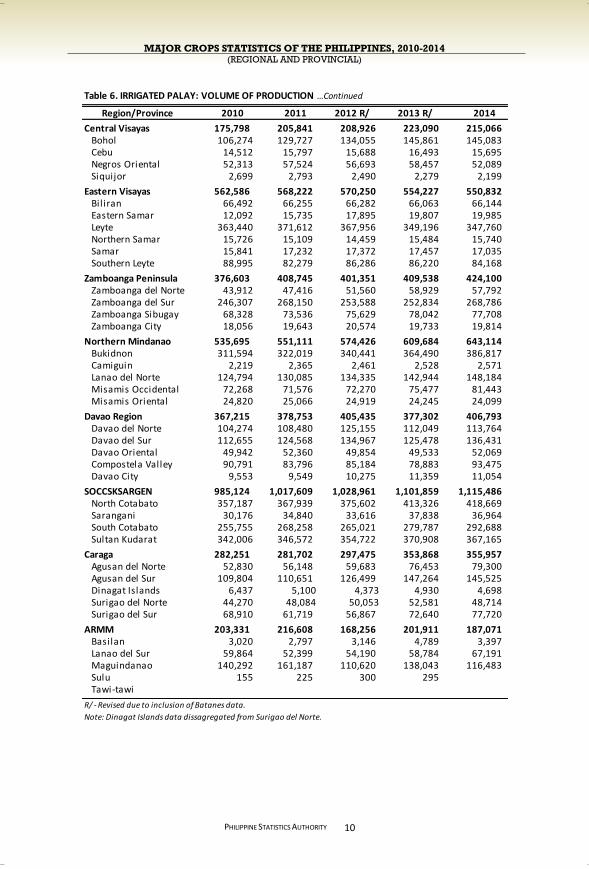
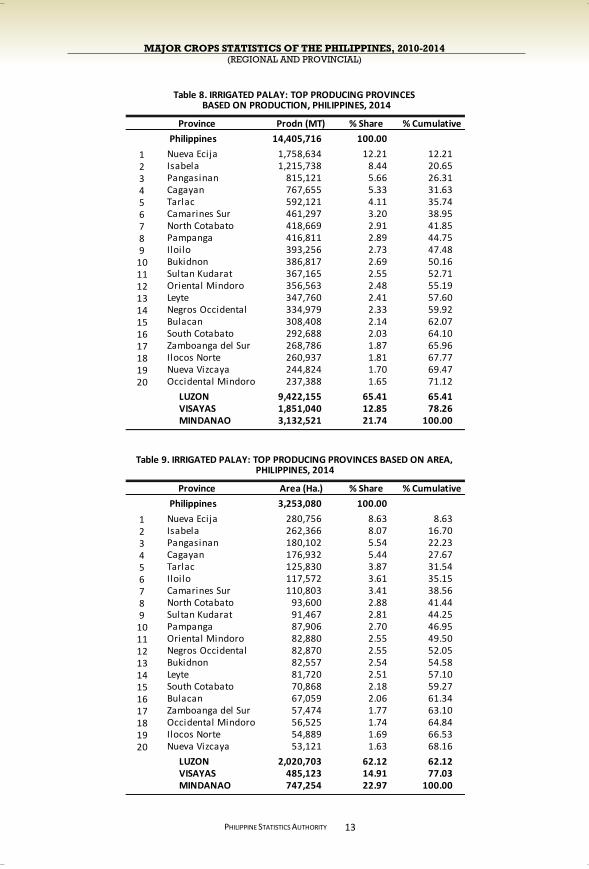
Palay production in irrigated farms grew by 4.2 percent from 13.82 million
mt in 2013 to 14.41 million mt in 2014. The top producing provinces were Nueva Ecija, Isabela, Pangasinan, Cagayan, and Tarlac. The combined output from these regions reached 5.15 million mt, equivalent to 35.7 percent of the country’s irrigated palay production (Figure 3).
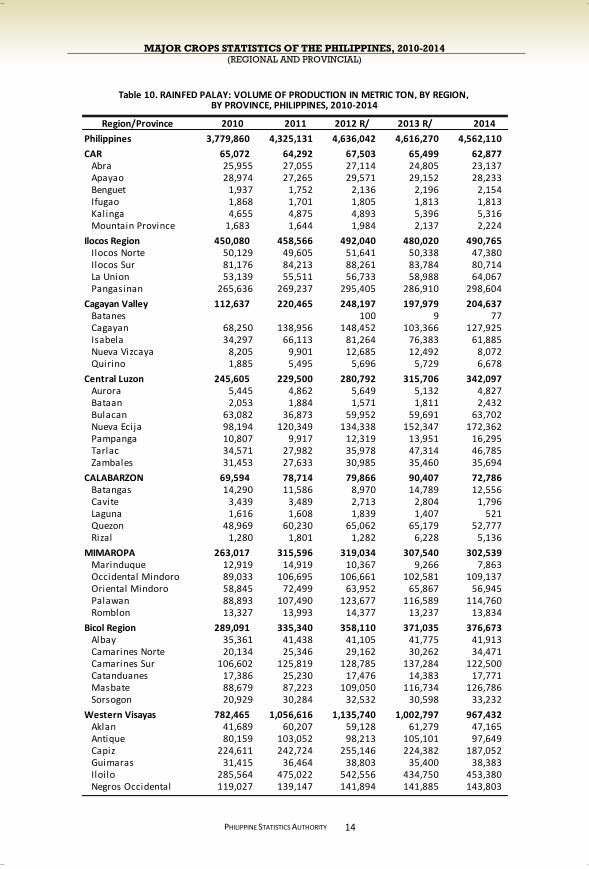
In rainfed areas, production reached 4.56 million mt in 2014. Iloilo was the
top producing province with an output of 0.45 million mt. The other four (4) leading producers were Pangasinan, Maguindanao, Capiz and Nueva Ecija with a total output of 0.93 million mt, or 20.3 percent of the total rainfed production in 2014 (Figure 4).
3
MAJOR CROPS STATISTICS OF THE PHILIPPINES, 2010-2014 (REGIONAL AND PROVINCIAL)
PHILIPPINE STATISTICS AUTHORITY
4
Region/Province 2010 2011 2012 R/ 2013 R/ 2014
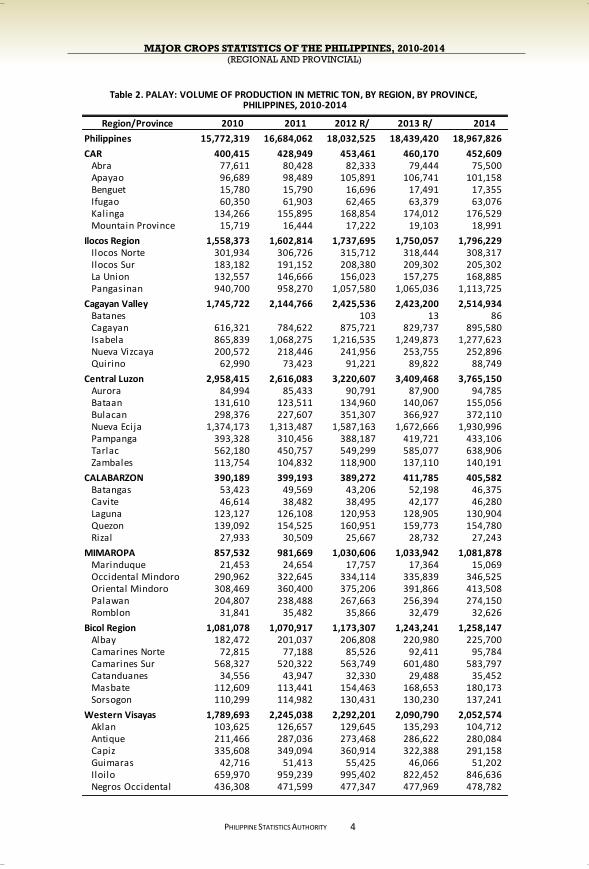
Philippines 15,772,319 16,684,062 18,032,525 18,439,420 18,967,826
CAR 400,415 428,949 453,461 460,170 452,609 Abra 77,611 80,428 82,333 79,444 75,500 Apayao 96,689 98,489 105,891 106,741 101,158 Benguet 15,780 15,790 16,696 17,491 17,355 Ifugao 60,350 61,903 62,465 63,379 63,076 Kalinga 134,266 155,895 168,854 174,012 176,529 Mountain Province 15,719 16,444 17,222 19,103 18,991
Ilocos Region 1,558,373 1,602,814 1,737,695 1,750,057 1,796,229 Ilocos Norte 301,934 306,726 315,712 318,444 308,317 Ilocos Sur 183,182 191,152 208,380 209,302 205,302 La Union 132,557 146,666 156,023 157,275 168,885 Pangasinan 940,700 958,270 1,057,580 1,065,036 1,113,725
Cagayan Valley 1,745,722 2,144,766 2,425,536 2,423,200 2,514,934 Batanes 103 13 86 Cagayan 616,321 784,622 875,721 829,737 895,580 Isabela 865,839 1,068,275 1,216,535 1,249,873 1,277,623 Nueva Vizcaya 200,572 218,446 241,956 253,755 252,896 Quirino 62,990 73,423 91,221 89,822 88,749
Central Luzon 2,958,415 2,616,083 3,220,607 3,409,468 3,765,150 Aurora 84,994 85,433 90,791 87,900 94,785 Bataan 131,610 123,511 134,960 140,067 155,056 Bulacan 298,376 227,607 351,307 366,927 372,110 Nueva Ecija 1,374,173 1,313,487 1,587,163 1,672,666 1,930,996 Pampanga 393,328 310,456 388,187 419,721 433,106 Tarlac 562,180 450,757 549,299 585,077 638,906 Zambales 113,754 104,832 118,900 137,110 140,191
CALABARZON 390,189 399,193 389,272 411,785 405,582 Batangas 53,423 49,569 43,206 52,198 46,375 Cavite 46,614 38,482 38,495 42,177 46,280 Laguna 123,127 126,108 120,953 128,905 130,904 Quezon 139,092 154,525 160,951 159,773 154,780 Rizal 27,933 30,509 25,667 28,732 27,243
MIMAROPA 857,532 981,669 1,030,606 1,033,942 1,081,878 Marinduque 21,453 24,654 17,757 17,364 15,069 Occidental Mindoro 290,962 322,645 334,114 335,839 346,525 Oriental Mindoro 308,469 360,400 375,206 391,866 413,508 Palawan 204,807 238,488 267,663 256,394 274,150 Romblon 31,841 35,482 35,866 32,479 32,626
Bicol Region 1,081,078 1,070,917 1,173,307 1,243,241 1,258,147 Albay 182,472 201,037 206,808 220,980 225,700 Camarines Norte 72,815 77,188 85,526 92,411 95,784 Camarines Sur 568,327 520,322 563,749 601,480 583,797 Catanduanes 34,556 43,947 32,330 29,488 35,452 Masbate 112,609 113,441 154,463 168,653 180,173 Sorsogon 110,299 114,982 130,431 130,230 137,241
Western Visayas 1,789,693 2,245,038 2,292,201 2,090,790 2,052,574 Aklan 103,625 126,657 129,645 135,293 104,712 Antique 211,466 287,036 273,468 286,622 280,084 Capiz 335,608 349,094 360,914 322,388 291,158 Guimaras 42,716 51,413 55,425 46,066 51,202 Iloilo 659,970 959,239 995,402 822,452 846,636 Negros Occidental 436,308 471,599 477,347 477,969 478,782
PHILIPPINES, 2010-2014Table 2. PALAY: VOLUME OF PRODUCTION IN METRIC TON, BY REGION, BY PROVINCE,
MAJOR CROPS STATISTICS OF THE PHILIPPINES, 2010-2014 (REGIONAL AND PROVINCIAL)
PHILIPPINE STATISTICS AUTHORITY
5
Region/Province 2010 2011 2012 R/ 2013 R/ 2014
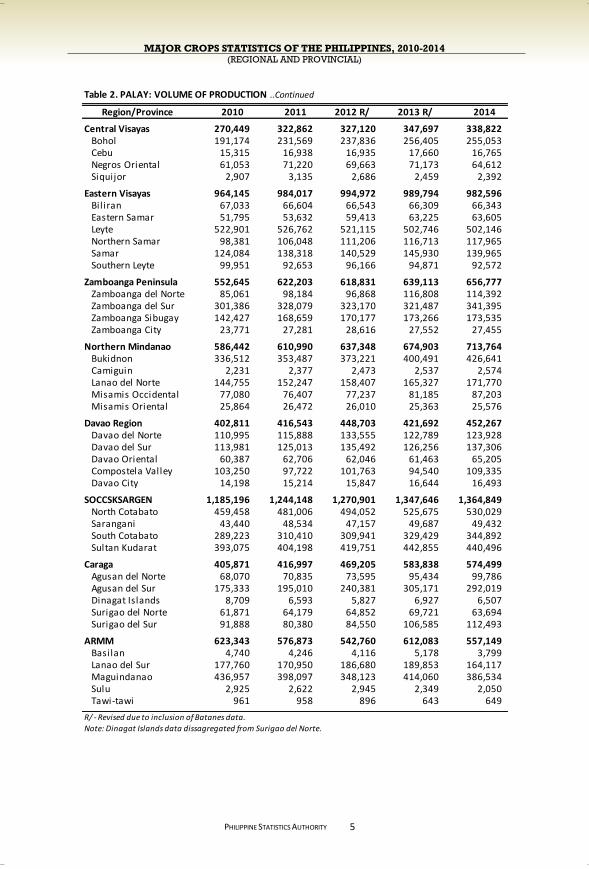
Central Visayas 270,449 322,862 327,120 347,697 338,822 Bohol 191,174 231,569 237,836 256,405 255,053 Cebu 15,315 16,938 16,935 17,660 16,765 Negros Oriental 61,053 71,220 69,663 71,173 64,612 Siquijor 2,907 3,135 2,686 2,459 2,392
Eastern Visayas 964,145 984,017 994,972 989,794 982,596 Bil iran 67,033 66,604 66,543 66,309 66,343 Eastern Samar 51,795 53,632 59,413 63,225 63,605 Leyte 522,901 526,762 521,115 502,746 502,146 Northern Samar 98,381 106,048 111,206 116,713 117,965 Samar 124,084 138,318 140,529 145,930 139,965 Southern Leyte 99,951 92,653 96,166 94,871 92,572
Zamboanga Peninsula 552,645 622,203 618,831 639,113 656,777 Zamboanga del Norte 85,061 98,184 96,868 116,808 114,392 Zamboanga del Sur 301,386 328,079 323,170 321,487 341,395 Zamboanga Sibugay 142,427 168,659 170,177 173,266 173,535 Zamboanga City 23,771 27,281 28,616 27,552 27,455
Northern Mindanao 586,442 610,990 637,348 674,903 713,764 Bukidnon 336,512 353,487 373,221 400,491 426,641 Camiguin 2,231 2,377 2,473 2,537 2,574 Lanao del Norte 144,755 152,247 158,407 165,327 171,770 Misamis Occidental 77,080 76,407 77,237 81,185 87,203 Misamis Oriental 25,864 26,472 26,010 25,363 25,576
Davao Region 402,811 416,543 448,703 421,692 452,267 Davao del Norte 110,995 115,888 133,555 122,789 123,928 Davao del Sur 113,981 125,013 135,492 126,256 137,306 Davao Oriental 60,387 62,706 62,046 61,463 65,205 Compostela Valley 103,250 97,722 101,763 94,540 109,335 Davao City 14,198 15,214 15,847 16,644 16,493
SOCCSKSARGEN 1,185,196 1,244,148 1,270,901 1,347,646 1,364,849 North Cotabato 459,458 481,006 494,052 525,675 530,029 Sarangani 43,440 48,534 47,157 49,687 49,432 South Cotabato 289,223 310,410 309,941 329,429 344,892 Sultan Kudarat 393,075 404,198 419,751 442,855 440,496
Caraga 405,871 416,997 469,205 583,838 574,499 Agusan del Norte 68,070 70,835 73,595 95,434 99,786 Agusan del Sur 175,333 195,010 240,381 305,171 292,019 Dinagat Islands 8,709 6,593 5,827 6,927 6,507 Surigao del Norte 61,871 64,179 64,852 69,721 63,694 Surigao del Sur 91,888 80,380 84,550 106,585 112,493
ARMM 623,343 576,873 542,760 612,083 557,149 Basilan 4,740 4,246 4,116 5,178 3,799 Lanao del Sur 177,760 170,950 186,680 189,853 164,117 Maguindanao 436,957 398,097 348,123 414,060 386,534 Sulu 2,925 2,622 2,945 2,349 2,050 Tawi-tawi 961 958 896 643 649
R/ - Revised due to inclusion of Batanes data.
Note: Dinagat Islands data dissagregated from Surigao del Norte.
Table 2. PALAY: VOLUME OF PRODUCTION ..Continued
MAJOR CROPS STATISTICS OF THE PHILIPPINES, 2010-2014 (REGIONAL AND PROVINCIAL)
PHILIPPINE STATISTICS AUTHORITY
6
Region/Province 2010 2011 2012 R/ 2013 R/ 2014
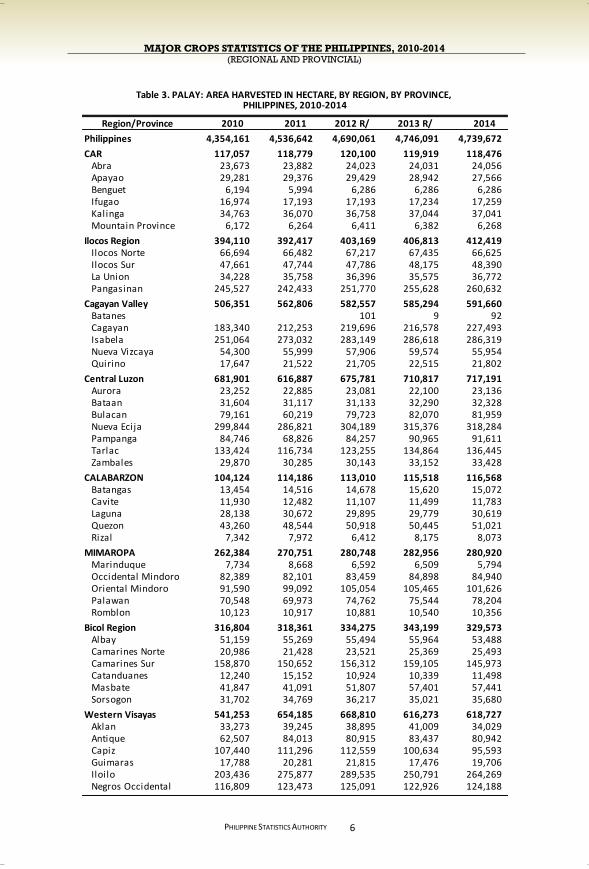
Philippines 4,354,161 4,536,642 4,690,061 4,746,091 4,739,672
CAR 117,057 118,779 120,100 119,919 118,476 Abra 23,673 23,882 24,023 24,031 24,056 Apayao 29,281 29,376 29,429 28,942 27,566 Benguet 6,194 5,994 6,286 6,286 6,286 Ifugao 16,974 17,193 17,193 17,234 17,259 Kalinga 34,763 36,070 36,758 37,044 37,041 Mountain Province 6,172 6,264 6,411 6,382 6,268
Ilocos Region 394,110 392,417 403,169 406,813 412,419 Ilocos Norte 66,694 66,482 67,217 67,435 66,625 Ilocos Sur 47,661 47,744 47,786 48,175 48,390 La Union 34,228 35,758 36,396 35,575 36,772 Pangasinan 245,527 242,433 251,770 255,628 260,632
Cagayan Valley 506,351 562,806 582,557 585,294 591,660 Batanes 101 9 92 Cagayan 183,340 212,253 219,696 216,578 227,493 Isabela 251,064 273,032 283,149 286,618 286,319 Nueva Vizcaya 54,300 55,999 57,906 59,574 55,954 Quirino 17,647 21,522 21,705 22,515 21,802
Central Luzon 681,901 616,887 675,781 710,817 717,191 Aurora 23,252 22,885 23,081 22,100 23,136 Bataan 31,604 31,117 31,133 32,290 32,328 Bulacan 79,161 60,219 79,723 82,070 81,959 Nueva Ecija 299,844 286,821 304,189 315,376 318,284 Pampanga 84,746 68,826 84,257 90,965 91,611 Tarlac 133,424 116,734 123,255 134,864 136,445 Zambales 29,870 30,285 30,143 33,152 33,428
CALABARZON 104,124 114,186 113,010 115,518 116,568 Batangas 13,454 14,516 14,678 15,620 15,072 Cavite 11,930 12,482 11,107 11,499 11,783 Laguna 28,138 30,672 29,895 29,779 30,619 Quezon 43,260 48,544 50,918 50,445 51,021 Rizal 7,342 7,972 6,412 8,175 8,073
MIMAROPA 262,384 270,751 280,748 282,956 280,920 Marinduque 7,734 8,668 6,592 6,509 5,794 Occidental Mindoro 82,389 82,101 83,459 84,898 84,940 Oriental Mindoro 91,590 99,092 105,054 105,465 101,626 Palawan 70,548 69,973 74,762 75,544 78,204 Romblon 10,123 10,917 10,881 10,540 10,356
Bicol Region 316,804 318,361 334,275 343,199 329,573 Albay 51,159 55,269 55,494 55,964 53,488 Camarines Norte 20,986 21,428 23,521 25,369 25,493 Camarines Sur 158,870 150,652 156,312 159,105 145,973 Catanduanes 12,240 15,152 10,924 10,339 11,498 Masbate 41,847 41,091 51,807 57,401 57,441 Sorsogon 31,702 34,769 36,217 35,021 35,680
Western Visayas 541,253 654,185 668,810 616,273 618,727 Aklan 33,273 39,245 38,895 41,009 34,029 Antique 62,507 84,013 80,915 83,437 80,942 Capiz 107,440 111,296 112,559 100,634 95,593 Guimaras 17,788 20,281 21,815 17,476 19,706 Iloilo 203,436 275,877 289,535 250,791 264,269 Negros Occidental 116,809 123,473 125,091 122,926 124,188
Table 3. PALAY: AREA HARVESTED IN HECTARE, BY REGION, BY PROVINCE, PHILIPPINES, 2010-2014
MAJOR CROPS STATISTICS OF THE PHILIPPINES, 2010-2014 (REGIONAL AND PROVINCIAL)
PHILIPPINE STATISTICS AUTHORITY
7
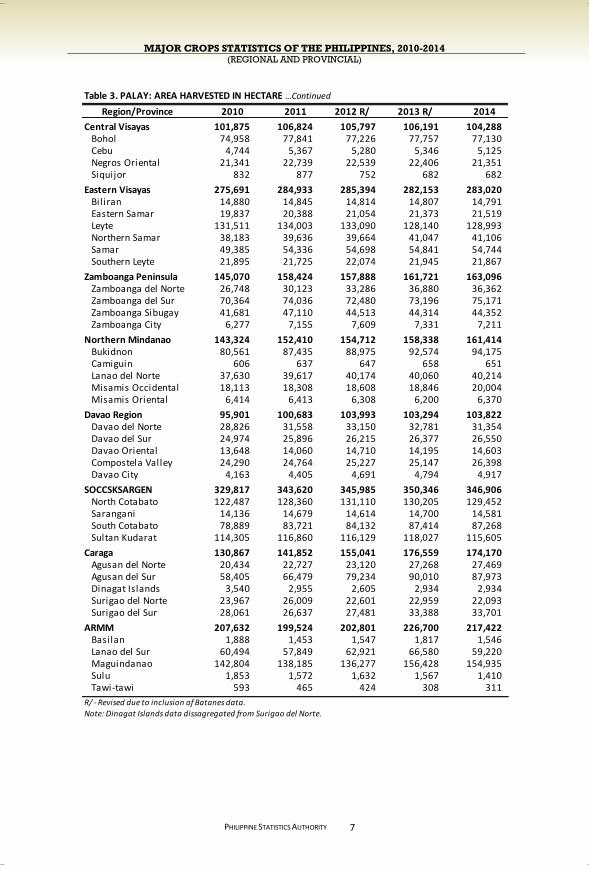
Region/Province 2010 2011 2012 R/ 2013 R/ 2014
Central Visayas 101,875 106,824 105,797 106,191 104,288 Bohol 74,958 77,841 77,226 77,757 77,130 Cebu 4,744 5,367 5,280 5,346 5,125 Negros Oriental 21,341 22,739 22,539 22,406 21,351 Siquijor 832 877 752 682 682
Eastern Visayas 275,691 284,933 285,394 282,153 283,020 Bil iran 14,880 14,845 14,814 14,807 14,791 Eastern Samar 19,837 20,388 21,054 21,373 21,519 Leyte 131,511 134,003 133,090 128,140 128,993 Northern Samar 38,183 39,636 39,664 41,047 41,106 Samar 49,385 54,336 54,698 54,841 54,744 Southern Leyte 21,895 21,725 22,074 21,945 21,867
Zamboanga Peninsula 145,070 158,424 157,888 161,721 163,096 Zamboanga del Norte 26,748 30,123 33,286 36,880 36,362 Zamboanga del Sur 70,364 74,036 72,480 73,196 75,171 Zamboanga Sibugay 41,681 47,110 44,513 44,314 44,352 Zamboanga City 6,277 7,155 7,609 7,331 7,211
Northern Mindanao 143,324 152,410 154,712 158,338 161,414 Bukidnon 80,561 87,435 88,975 92,574 94,175 Camiguin 606 637 647 658 651 Lanao del Norte 37,630 39,617 40,174 40,060 40,214 Misamis Occidental 18,113 18,308 18,608 18,846 20,004 Misamis Oriental 6,414 6,413 6,308 6,200 6,370
Davao Region 95,901 100,683 103,993 103,294 103,822 Davao del Norte 28,826 31,558 33,150 32,781 31,354 Davao del Sur 24,974 25,896 26,215 26,377 26,550 Davao Oriental 13,648 14,060 14,710 14,195 14,603 Compostela Valley 24,290 24,764 25,227 25,147 26,398 Davao City 4,163 4,405 4,691 4,794 4,917
SOCCSKSARGEN 329,817 343,620 345,985 350,346 346,906 North Cotabato 122,487 128,360 131,110 130,205 129,452 Sarangani 14,136 14,679 14,614 14,700 14,581 South Cotabato 78,889 83,721 84,132 87,414 87,268 Sultan Kudarat 114,305 116,860 116,129 118,027 115,605
Caraga 130,867 141,852 155,041 176,559 174,170 Agusan del Norte 20,434 22,727 23,120 27,268 27,469 Agusan del Sur 58,405 66,479 79,234 90,010 87,973 Dinagat Islands 3,540 2,955 2,605 2,934 2,934 Surigao del Norte 23,967 26,009 22,601 22,959 22,093 Surigao del Sur 28,061 26,637 27,481 33,388 33,701
ARMM 207,632 199,524 202,801 226,700 217,422 Basilan 1,888 1,453 1,547 1,817 1,546 Lanao del Sur 60,494 57,849 62,921 66,580 59,220 Maguindanao 142,804 138,185 136,277 156,428 154,935 Sulu 1,853 1,572 1,632 1,567 1,410 Tawi-tawi 593 465 424 308 311
R/ - Revised due to inclusion of Batanes data.
Note: Dinagat Islands data dissagregated from Surigao del Norte.
Table 3. PALAY: AREA HARVESTED IN HECTARE …Continued
MAJOR CROPS STATISTICS OF THE PHILIPPINES, 2010-2014 (REGIONAL AND PROVINCIAL)
PHILIPPINE STATISTICS AUTHORITY
8
Prodn (MT) % Share % Cumulative
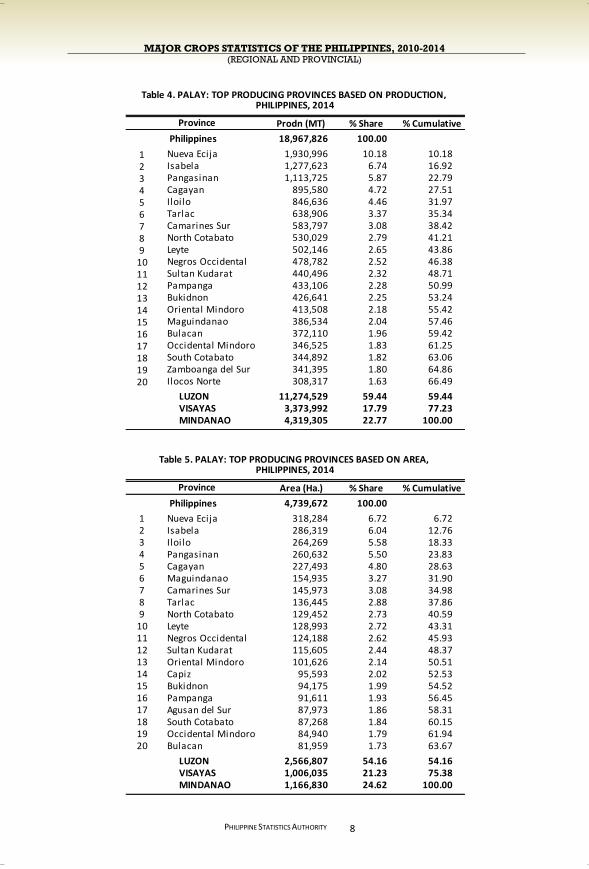
Philippines 18,967,826 100.00
1 Nueva Ecija 1,930,996 10.18 10.182 Isabela 1,277,623 6.74 16.923 Pangasinan 1,113,725 5.87 22.794 Cagayan 895,580 4.72 27.515 Iloilo 846,636 4.46 31.976 Tarlac 638,906 3.37 35.347 Camarines Sur 583,797 3.08 38.428 North Cotabato 530,029 2.79 41.219 Leyte 502,146 2.65 43.86
10 Negros Occidental 478,782 2.52 46.3811 Sultan Kudarat 440,496 2.32 48.7112 Pampanga 433,106 2.28 50.9913 Bukidnon 426,641 2.25 53.2414 Oriental Mindoro 413,508 2.18 55.4215 Maguindanao 386,534 2.04 57.4616 Bulacan 372,110 1.96 59.4217 Occidental Mindoro 346,525 1.83 61.2518 South Cotabato 344,892 1.82 63.0619 Zamboanga del Sur 341,395 1.80 64.8620 Ilocos Norte 308,317 1.63 66.49
LUZON 11,274,529 59.44 59.44VISAYAS 3,373,992 17.79 77.23MINDANAO 4,319,305 22.77 100.00
Area (Ha.) % Share % Cumulative
Philippines 4,739,672 100.00
1 Nueva Ecija 318,284 6.72 6.722 Isabela 286,319 6.04 12.763 Iloilo 264,269 5.58 18.334 Pangasinan 260,632 5.50 23.835 Cagayan 227,493 4.80 28.636 Maguindanao 154,935 3.27 31.907 Camarines Sur 145,973 3.08 34.988 Tarlac 136,445 2.88 37.869 North Cotabato 129,452 2.73 40.59
10 Leyte 128,993 2.72 43.3111 Negros Occidental 124,188 2.62 45.9312 Sultan Kudarat 115,605 2.44 48.3713 Oriental Mindoro 101,626 2.14 50.5114 Capiz 95,593 2.02 52.5315 Bukidnon 94,175 1.99 54.5216 Pampanga 91,611 1.93 56.4517 Agusan del Sur 87,973 1.86 58.3118 South Cotabato 87,268 1.84 60.1519 Occidental Mindoro 84,940 1.79 61.9420 Bulacan 81,959 1.73 63.67
LUZON 2,566,807 54.16 54.16VISAYAS 1,006,035 21.23 75.38MINDANAO 1,166,830 24.62 100.00
Province
Province
Table 4. PALAY: TOP PRODUCING PROVINCES BASED ON PRODUCTION,
Table 5. PALAY: TOP PRODUCING PROVINCES BASED ON AREA, PHILIPPINES, 2014
PHILIPPINES, 2014
MAJOR CROPS STATISTICS OF THE PHILIPPINES, 2010-2014 (REGIONAL AND PROVINCIAL)
PHILIPPINE STATISTICS AUTHORITY
9
Region/Province 2010 2011 2012 R/ 2013 R/ 2014
Philippines 11,992,459 12,358,931 13,396,483 13,823,149 14,405,716
CAR 335,343 364,657 385,958 394,671 389,732 Abra 51,656 53,373 55,219 54,639 52,363 Apayao 67,715 71,224 76,320 77,589 72,925 Benguet 13,843 14,038 14,560 15,295 15,201 Ifugao 58,482 60,202 60,660 61,566 61,263 Kalinga 129,611 151,020 163,961 168,616 171,213 Mountain Province 14,036 14,800 15,238 16,966 16,767
Ilocos Region 1,108,293 1,144,248 1,245,655 1,270,037 1,305,464 Ilocos Norte 251,805 257,121 264,071 268,106 260,937 Ilocos Sur 102,006 106,939 120,119 125,518 124,588 La Union 79,418 91,155 99,290 98,287 104,818 Pangasinan 675,064 689,033 762,175 778,126 815,121
Cagayan Valley 1,633,085 1,924,301 2,177,340 2,225,221 2,310,297 Batanes 4 4 9 Cagayan 548,071 645,666 727,269 726,371 767,655 Isabela 831,542 1,002,162 1,135,271 1,173,490 1,215,738 Nueva Vizcaya 192,367 208,545 229,271 241,263 244,824 Quirino 61,105 67,928 85,525 84,093 82,071
Central Luzon 2,712,810 2,386,583 2,939,815 3,093,762 3,423,053 Aurora 79,549 80,571 85,142 82,768 89,958 Bataan 129,557 121,627 133,389 138,256 152,624 Bulacan 235,294 190,734 291,355 307,236 308,408 Nueva Ecija 1,275,979 1,193,138 1,452,825 1,520,319 1,758,634 Pampanga 382,521 300,539 375,868 405,770 416,811 Tarlac 527,609 422,775 513,321 537,763 592,121 Zambales 82,301 77,199 87,915 101,650 104,497
CALABARZON 320,595 320,479 309,406 321,378 332,796 Batangas 39,133 37,983 34,236 37,409 33,819 Cavite 43,175 34,993 35,782 39,373 44,484 Laguna 121,511 124,500 119,114 127,498 130,383 Quezon 90,123 94,295 95,889 94,594 102,003 Rizal 26,653 28,708 24,385 22,504 22,107
MIMAROPA 594,515 666,073 711,572 726,402 779,339 Marinduque 8,534 9,735 7,390 8,098 7,206 Occidental Mindoro 201,929 215,950 227,453 233,258 237,388 Oriental Mindoro 249,624 287,901 311,254 325,999 356,563 Palawan 115,914 130,998 143,986 139,805 159,390 Romblon 18,514 21,489 21,489 19,242 18,792
Bicol Region 791,987 735,577 815,197 872,206 881,474 Albay 147,111 159,599 165,703 179,205 183,787 Camarines Norte 52,681 51,842 56,364 62,149 61,313 Camarines Sur 461,725 394,503 434,964 464,196 461,297 Catanduanes 17,170 18,717 14,854 15,105 17,681 Masbate 23,930 26,218 45,413 51,919 53,387 Sorsogon 89,370 84,698 97,899 99,632 104,009
Western Visayas 1,007,228 1,188,422 1,156,461 1,087,993 1,085,142 Aklan 61,936 66,450 70,517 74,014 57,547 Antique 131,307 183,984 175,255 181,521 182,435 Capiz 110,997 106,370 105,768 98,006 104,106 Guimaras 11,301 14,949 16,622 10,666 12,819 Iloilo 374,406 484,217 452,846 387,702 393,256 Negros Occidental 317,281 332,452 335,453 336,084 334,979
BY PROVINCE, PHILIPPINES, 2010-2014Table 6. IRRIGATED PALAY: VOLUME OF PRODUCTION IN METRIC TON, BY REGION,
MAJOR CROPS STATISTICS OF THE PHILIPPINES, 2010-2014 (REGIONAL AND PROVINCIAL)
PHILIPPINE STATISTICS AUTHORITY
10
Region/Province 2010 2011 2012 R/ 2013 R/ 2014
Central Visayas 175,798 205,841 208,926 223,090 215,066 Bohol 106,274 129,727 134,055 145,861 145,083 Cebu 14,512 15,797 15,688 16,493 15,695 Negros Oriental 52,313 57,524 56,693 58,457 52,089 Siquijor 2,699 2,793 2,490 2,279 2,199
Eastern Visayas 562,586 568,222 570,250 554,227 550,832 Bil iran 66,492 66,255 66,282 66,063 66,144 Eastern Samar 12,092 15,735 17,895 19,807 19,985 Leyte 363,440 371,612 367,956 349,196 347,760 Northern Samar 15,726 15,109 14,459 15,484 15,740 Samar 15,841 17,232 17,372 17,457 17,035 Southern Leyte 88,995 82,279 86,286 86,220 84,168
Zamboanga Peninsula 376,603 408,745 401,351 409,538 424,100 Zamboanga del Norte 43,912 47,416 51,560 58,929 57,792 Zamboanga del Sur 246,307 268,150 253,588 252,834 268,786 Zamboanga Sibugay 68,328 73,536 75,629 78,042 77,708 Zamboanga City 18,056 19,643 20,574 19,733 19,814
Northern Mindanao 535,695 551,111 574,426 609,684 643,114 Bukidnon 311,594 322,019 340,441 364,490 386,817 Camiguin 2,219 2,365 2,461 2,528 2,571 Lanao del Norte 124,794 130,085 134,335 142,944 148,184 Misamis Occidental 72,268 71,576 72,270 75,477 81,443 Misamis Oriental 24,820 25,066 24,919 24,245 24,099
Davao Region 367,215 378,753 405,435 377,302 406,793 Davao del Norte 104,274 108,480 125,155 112,049 113,764 Davao del Sur 112,655 124,568 134,967 125,478 136,431 Davao Oriental 49,942 52,360 49,854 49,533 52,069 Compostela Valley 90,791 83,796 85,184 78,883 93,475 Davao City 9,553 9,549 10,275 11,359 11,054
SOCCSKSARGEN 985,124 1,017,609 1,028,961 1,101,859 1,115,486 North Cotabato 357,187 367,939 375,602 413,326 418,669 Sarangani 30,176 34,840 33,616 37,838 36,964 South Cotabato 255,755 268,258 265,021 279,787 292,688 Sultan Kudarat 342,006 346,572 354,722 370,908 367,165
Caraga 282,251 281,702 297,475 353,868 355,957 Agusan del Norte 52,830 56,148 59,683 76,453 79,300 Agusan del Sur 109,804 110,651 126,499 147,264 145,525 Dinagat Islands 6,437 5,100 4,373 4,930 4,698 Surigao del Norte 44,270 48,084 50,053 52,581 48,714 Surigao del Sur 68,910 61,719 56,867 72,640 77,720
ARMM 203,331 216,608 168,256 201,911 187,071 Basilan 3,020 2,797 3,146 4,789 3,397 Lanao del Sur 59,864 52,399 54,190 58,784 67,191 Maguindanao 140,292 161,187 110,620 138,043 116,483 Sulu 155 225 300 295 Tawi-tawi
R/ - Revised due to inclusion of Batanes data.
Note: Dinagat Islands data dissagregated from Surigao del Norte.
Table 6. IRRIGATED PALAY: VOLUME OF PRODUCTION …Continued
MAJOR CROPS STATISTICS OF THE PHILIPPINES, 2010-2014 (REGIONAL AND PROVINCIAL)
PHILIPPINE STATISTICS AUTHORITY
11
Region/Province 2010 2011 2012 R/ 2013 R/ 2014
Philippines 3,008,325 3,072,637 3,163,185 3,236,337 3,253,080
CAR 91,265 93,043 94,068 94,352 93,301 Abra 14,763 14,804 14,915 14,920 14,950 Apayao 17,140 17,319 17,372 17,358 16,267 Benguet 5,188 5,081 5,200 5,200 5,200 Ifugao 16,132 16,336 16,336 16,374 16,399 Kalinga 32,724 34,031 34,739 35,023 35,098 Mountain Province 5,318 5,472 5,506 5,477 5,387
Ilocos Region 260,757 263,633 273,371 279,749 285,823 Ilocos Norte 54,843 54,682 55,082 55,359 54,889 Ilocos Sur 25,101 25,394 26,511 27,925 28,261 La Union 19,850 21,453 22,259 21,570 22,571 Pangasinan 160,963 162,104 169,519 174,895 180,102
Cagayan Valley 441,583 479,036 495,501 510,338 511,873 Batanes 3 1 3 Cagayan 141,685 159,572 167,224 176,227 176,932 Isabela 232,438 248,420 255,278 258,780 262,366 Nueva Vizcaya 50,723 52,059 53,386 55,032 53,121 Quirino 16,737 18,985 19,610 20,298 19,451
Central Luzon 599,573 544,198 599,891 631,664 639,952 Aurora 21,695 21,436 21,476 20,579 21,780 Bataan 31,004 30,392 30,677 31,732 31,771 Bulacan 59,017 48,259 65,219 67,455 67,059 Nueva Ecija 261,034 249,571 265,802 277,185 280,756 Pampanga 81,656 65,906 81,077 87,285 87,906 Tarlac 124,353 107,494 114,365 123,214 125,830 Zambales 20,814 21,140 21,275 24,214 24,850
CALABARZON 79,494 83,111 80,120 81,415 86,191 Batangas 9,037 9,537 9,250 10,141 9,937 Cavite 10,530 10,615 9,827 10,151 10,948 Laguna 27,619 30,176 29,275 29,217 30,370 Quezon 25,366 25,386 25,770 25,773 28,508 Rizal 6,942 7,397 5,998 6,133 6,428
MIMAROPA 166,012 174,752 185,166 188,471 189,480 Marinduque 2,622 2,788 2,325 2,664 2,420 Occidental Mindoro 54,267 53,802 55,069 56,429 56,525 Oriental Mindoro 68,045 76,123 84,432 84,774 82,880 Palawan 35,906 36,236 37,632 39,221 42,431 Romblon 5,172 5,803 5,708 5,383 5,224
Bicol Region 216,256 203,609 217,458 222,226 214,082 Albay 39,606 42,759 43,276 43,979 42,339 Camarines Norte 13,725 13,665 14,839 16,075 15,218 Camarines Sur 124,594 108,342 115,873 116,625 110,803 Catanduanes 5,488 5,909 4,782 4,992 5,361 Masbate 8,244 8,736 13,320 15,496 15,352 Sorsogon 24,599 24,198 25,368 25,059 25,009
Western Visayas 273,564 314,768 305,588 288,187 296,174 Aklan 16,967 18,173 18,127 19,460 16,042 Antique 34,577 47,182 46,114 46,862 46,920 Capiz 29,562 28,002 27,864 25,956 29,105 Guimaras 3,392 4,271 4,707 3,077 3,665 Iloilo 107,308 133,752 125,015 110,755 117,572 Negros Occidental 81,758 83,388 83,761 82,077 82,870
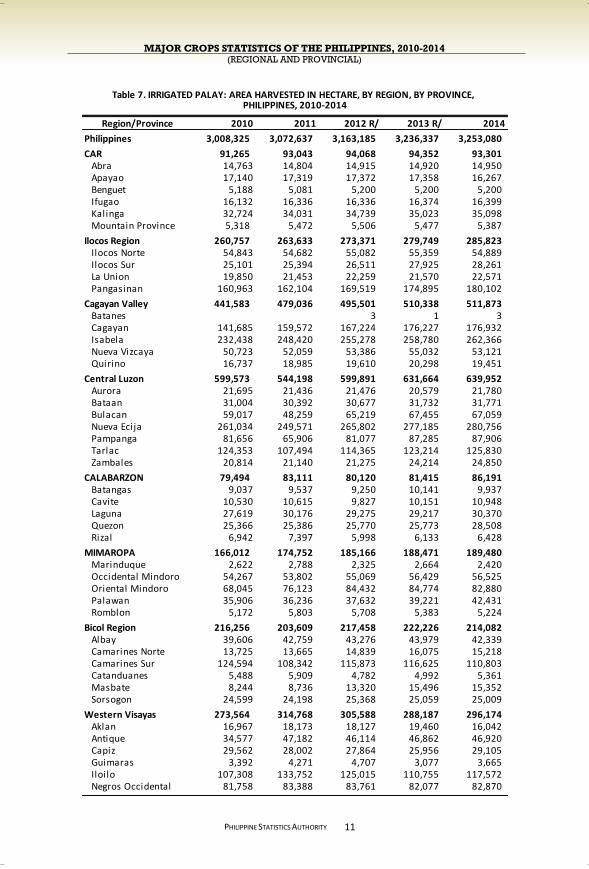
PHILIPPINES, 2010-2014Table 7. IRRIGATED PALAY: AREA HARVESTED IN HECTARE, BY REGION, BY PROVINCE,
MAJOR CROPS STATISTICS OF THE PHILIPPINES, 2010-2014 (REGIONAL AND PROVINCIAL)
PHILIPPINE STATISTICS AUTHORITY
12
Region/Province 2010 2011 2012 R/ 2013 R/ 2014
Central Visayas 57,465 59,679 59,759 60,505 59,221 Bohol 35,386 36,828 37,167 37,592 37,728 Cebu 4,316 4,750 4,658 4,754 4,578 Negros Oriental 17,019 17,356 17,268 17,549 16,315 Siquijor 744 745 666 610 600
Eastern Visayas 129,254 134,126 133,847 129,310 129,728 Bil iran 14,672 14,688 14,688 14,688 14,689 Eastern Samar 3,269 4,584 4,845 4,953 5,003 Leyte 83,385 86,835 86,196 81,231 81,720 Northern Samar 4,506 4,320 4,029 4,317 4,338 Samar 4,742 5,101 5,134 5,082 4,974 Southern Leyte 18,680 18,598 18,955 19,039 19,004
Zamboanga Peninsula 89,362 93,712 91,163 94,776 94,564 Zamboanga del Norte 13,236 14,000 13,945 16,098 14,877 Zamboanga del Sur 56,019 57,722 54,957 56,325 57,474 Zamboanga Sibugay 15,842 17,335 17,238 17,572 17,451 Zamboanga City 4,265 4,655 5,023 4,781 4,762
Northern Mindanao 127,005 132,270 135,103 138,670 140,441 Bukidnon 72,662 76,876 78,891 81,995 82,557 Camiguin 600 626 636 647 648 Lanao del Norte 31,040 32,005 32,499 33,025 33,109 Misamis Occidental 16,680 16,815 17,137 17,203 18,356 Misamis Oriental 6,023 5,948 5,940 5,800 5,771
Davao Region 84,309 88,219 89,539 88,939 89,243 Davao del Norte 26,524 29,099 30,329 29,775 28,259 Davao del Sur 24,492 25,366 25,705 25,712 25,872 Davao Oriental 10,464 10,812 10,737 10,391 10,580 Compostela Valley 20,617 20,796 20,430 20,489 21,983 Davao City 2,212 2,146 2,338 2,572 2,549
SOCCSKSARGEN 257,958 263,305 263,387 270,123 266,223 North Cotabato 88,071 90,093 90,148 94,337 93,600 Sarangani 9,191 9,650 9,733 10,470 10,288 South Cotabato 67,360 68,933 68,473 70,864 70,868 Sultan Kudarat 93,336 94,629 95,033 94,452 91,467
Caraga 84,980 88,264 89,489 99,786 100,072 Agusan del Norte 14,781 16,934 17,736 21,068 20,976 Agusan del Sur 33,499 33,682 36,285 38,917 38,994 Dinagat Islands 2,575 2,230 1,915 2,034 2,049 Surigao del Norte 13,999 16,132 16,298 16,409 15,649 Surigao del Sur 20,126 19,286 17,255 21,358 22,404
ARMM 49,488 56,912 49,735 57,826 56,711 Basilan 1,103 900 1,082 1,657 1,346 Lanao del Sur 16,368 14,338 15,289 17,011 19,457 Maguindanao 31,967 41,604 33,274 39,058 35,908 Sulu 50 70 90 100 Tawi-tawi
R/ - Revised due to inclusion of Batanes data.
Note: Dinagat Islands data dissagregated from Surigao del Norte.
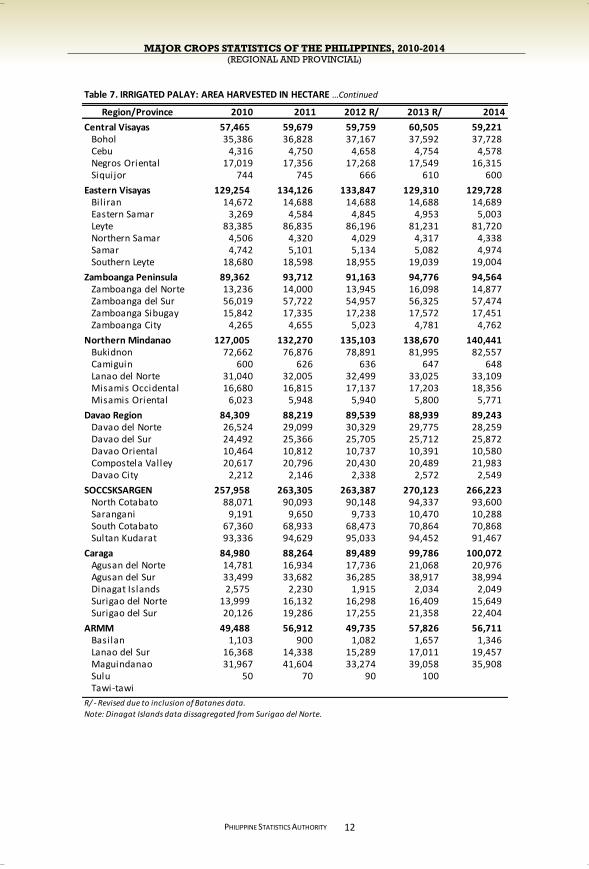
Table 7. IRRIGATED PALAY: AREA HARVESTED IN HECTARE …Continued
MAJOR CROPS STATISTICS OF THE PHILIPPINES, 2010-2014 (REGIONAL AND PROVINCIAL)
PHILIPPINE STATISTICS AUTHORITY
13
Prodn (MT) % Share % Cumulative
Philippines 14,405,716 100.00
1 Nueva Ecija 1,758,634 12.21 12.212 Isabela 1,215,738 8.44 20.653 Pangasinan 815,121 5.66 26.314 Cagayan 767,655 5.33 31.635 Tarlac 592,121 4.11 35.746 Camarines Sur 461,297 3.20 38.957 North Cotabato 418,669 2.91 41.858 Pampanga 416,811 2.89 44.759 Iloilo 393,256 2.73 47.48
10 Bukidnon 386,817 2.69 50.1611 Sultan Kudarat 367,165 2.55 52.7112 Oriental Mindoro 356,563 2.48 55.1913 Leyte 347,760 2.41 57.6014 Negros Occidental 334,979 2.33 59.9215 Bulacan 308,408 2.14 62.0716 South Cotabato 292,688 2.03 64.1017 Zamboanga del Sur 268,786 1.87 65.9618 Ilocos Norte 260,937 1.81 67.7719 Nueva Vizcaya 244,824 1.70 69.4720 Occidental Mindoro 237,388 1.65 71.12
LUZON 9,422,155 65.41 65.41VISAYAS 1,851,040 12.85 78.26MINDANAO 3,132,521 21.74 100.00
Area (Ha.) % Share % Cumulative
Philippines 3,253,080 100.00
1 Nueva Ecija 280,756 8.63 8.632 Isabela 262,366 8.07 16.703 Pangasinan 180,102 5.54 22.234 Cagayan 176,932 5.44 27.675 Tarlac 125,830 3.87 31.546 Iloilo 117,572 3.61 35.157 Camarines Sur 110,803 3.41 38.568 North Cotabato 93,600 2.88 41.449 Sultan Kudarat 91,467 2.81 44.25
10 Pampanga 87,906 2.70 46.9511 Oriental Mindoro 82,880 2.55 49.5012 Negros Occidental 82,870 2.55 52.0513 Bukidnon 82,557 2.54 54.5814 Leyte 81,720 2.51 57.1015 South Cotabato 70,868 2.18 59.2716 Bulacan 67,059 2.06 61.3417 Zamboanga del Sur 57,474 1.77 63.1018 Occidental Mindoro 56,525 1.74 64.8419 Ilocos Norte 54,889 1.69 66.5320 Nueva Vizcaya 53,121 1.63 68.16
LUZON 2,020,703 62.12 62.12VISAYAS 485,123 14.91 77.03MINDANAO 747,254 22.97 100.00
Province
Table 8. IRRIGATED PALAY: TOP PRODUCING PROVINCES
Table 9. IRRIGATED PALAY: TOP PRODUCING PROVINCES BASED ON AREA,
Province
PHILIPPINES, 2014
BASED ON PRODUCTION, PHILIPPINES, 2014
MAJOR CROPS STATISTICS OF THE PHILIPPINES, 2010-2014 (REGIONAL AND PROVINCIAL)
PHILIPPINE STATISTICS AUTHORITY
14
Region/Province 2010 2011 2012 R/ 2013 R/ 2014
Philippines 3,779,860 4,325,131 4,636,042 4,616,270 4,562,110
CAR 65,072 64,292 67,503 65,499 62,877 Abra 25,955 27,055 27,114 24,805 23,137 Apayao 28,974 27,265 29,571 29,152 28,233 Benguet 1,937 1,752 2,136 2,196 2,154 Ifugao 1,868 1,701 1,805 1,813 1,813 Kalinga 4,655 4,875 4,893 5,396 5,316 Mountain Province 1,683 1,644 1,984 2,137 2,224
Ilocos Region 450,080 458,566 492,040 480,020 490,765 Ilocos Norte 50,129 49,605 51,641 50,338 47,380 Ilocos Sur 81,176 84,213 88,261 83,784 80,714 La Union 53,139 55,511 56,733 58,988 64,067 Pangasinan 265,636 269,237 295,405 286,910 298,604
Cagayan Valley 112,637 220,465 248,197 197,979 204,637 Batanes 100 9 77 Cagayan 68,250 138,956 148,452 103,366 127,925 Isabela 34,297 66,113 81,264 76,383 61,885 Nueva Vizcaya 8,205 9,901 12,685 12,492 8,072 Quirino 1,885 5,495 5,696 5,729 6,678
Central Luzon 245,605 229,500 280,792 315,706 342,097 Aurora 5,445 4,862 5,649 5,132 4,827 Bataan 2,053 1,884 1,571 1,811 2,432 Bulacan 63,082 36,873 59,952 59,691 63,702 Nueva Ecija 98,194 120,349 134,338 152,347 172,362 Pampanga 10,807 9,917 12,319 13,951 16,295 Tarlac 34,571 27,982 35,978 47,314 46,785 Zambales 31,453 27,633 30,985 35,460 35,694
CALABARZON 69,594 78,714 79,866 90,407 72,786 Batangas 14,290 11,586 8,970 14,789 12,556 Cavite 3,439 3,489 2,713 2,804 1,796 Laguna 1,616 1,608 1,839 1,407 521 Quezon 48,969 60,230 65,062 65,179 52,777 Rizal 1,280 1,801 1,282 6,228 5,136
MIMAROPA 263,017 315,596 319,034 307,540 302,539 Marinduque 12,919 14,919 10,367 9,266 7,863 Occidental Mindoro 89,033 106,695 106,661 102,581 109,137 Oriental Mindoro 58,845 72,499 63,952 65,867 56,945 Palawan 88,893 107,490 123,677 116,589 114,760 Romblon 13,327 13,993 14,377 13,237 13,834
Bicol Region 289,091 335,340 358,110 371,035 376,673 Albay 35,361 41,438 41,105 41,775 41,913 Camarines Norte 20,134 25,346 29,162 30,262 34,471 Camarines Sur 106,602 125,819 128,785 137,284 122,500 Catanduanes 17,386 25,230 17,476 14,383 17,771 Masbate 88,679 87,223 109,050 116,734 126,786 Sorsogon 20,929 30,284 32,532 30,598 33,232
Western Visayas 782,465 1,056,616 1,135,740 1,002,797 967,432 Aklan 41,689 60,207 59,128 61,279 47,165 Antique 80,159 103,052 98,213 105,101 97,649 Capiz 224,611 242,724 255,146 224,382 187,052 Guimaras 31,415 36,464 38,803 35,400 38,383 Iloilo 285,564 475,022 542,556 434,750 453,380 Negros Occidental 119,027 139,147 141,894 141,885 143,803
BY PROVINCE, PHILIPPINES, 2010-2014Table 10. RAINFED PALAY: VOLUME OF PRODUCTION IN METRIC TON, BY REGION,
MAJOR CROPS STATISTICS OF THE PHILIPPINES, 2010-2014 (REGIONAL AND PROVINCIAL)
PHILIPPINE STATISTICS AUTHORITY
15
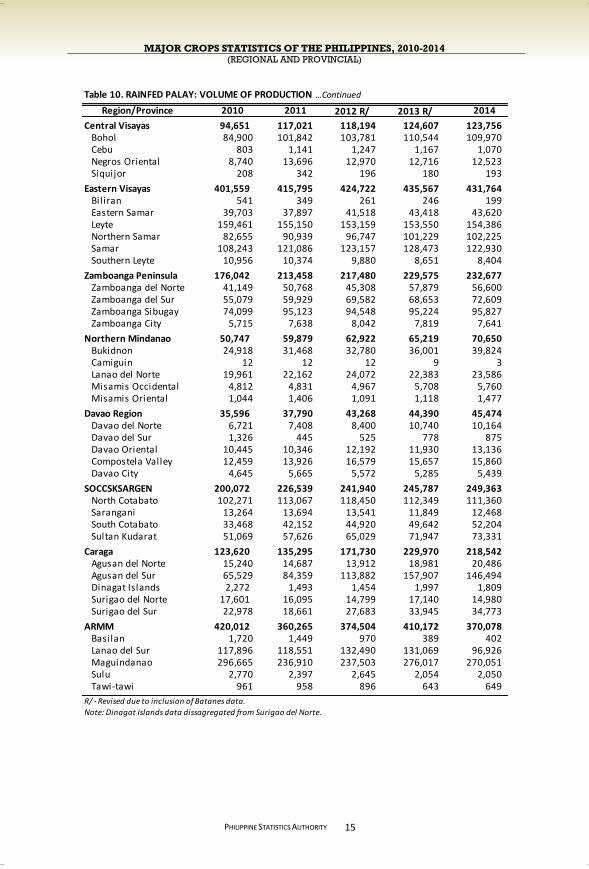
Region/Province 2010 2011 2012 R/ 2013 R/ 2014
Central Visayas 94,651 117,021 118,194 124,607 123,756 Bohol 84,900 101,842 103,781 110,544 109,970 Cebu 803 1,141 1,247 1,167 1,070 Negros Oriental 8,740 13,696 12,970 12,716 12,523 Siquijor 208 342 196 180 193
Eastern Visayas 401,559 415,795 424,722 435,567 431,764 Bil iran 541 349 261 246 199 Eastern Samar 39,703 37,897 41,518 43,418 43,620 Leyte 159,461 155,150 153,159 153,550 154,386 Northern Samar 82,655 90,939 96,747 101,229 102,225 Samar 108,243 121,086 123,157 128,473 122,930 Southern Leyte 10,956 10,374 9,880 8,651 8,404
Zamboanga Peninsula 176,042 213,458 217,480 229,575 232,677 Zamboanga del Norte 41,149 50,768 45,308 57,879 56,600 Zamboanga del Sur 55,079 59,929 69,582 68,653 72,609 Zamboanga Sibugay 74,099 95,123 94,548 95,224 95,827 Zamboanga City 5,715 7,638 8,042 7,819 7,641
Northern Mindanao 50,747 59,879 62,922 65,219 70,650 Bukidnon 24,918 31,468 32,780 36,001 39,824 Camiguin 12 12 12 9 3 Lanao del Norte 19,961 22,162 24,072 22,383 23,586 Misamis Occidental 4,812 4,831 4,967 5,708 5,760 Misamis Oriental 1,044 1,406 1,091 1,118 1,477
Davao Region 35,596 37,790 43,268 44,390 45,474 Davao del Norte 6,721 7,408 8,400 10,740 10,164 Davao del Sur 1,326 445 525 778 875 Davao Oriental 10,445 10,346 12,192 11,930 13,136 Compostela Valley 12,459 13,926 16,579 15,657 15,860 Davao City 4,645 5,665 5,572 5,285 5,439
SOCCSKSARGEN 200,072 226,539 241,940 245,787 249,363 North Cotabato 102,271 113,067 118,450 112,349 111,360 Sarangani 13,264 13,694 13,541 11,849 12,468 South Cotabato 33,468 42,152 44,920 49,642 52,204 Sultan Kudarat 51,069 57,626 65,029 71,947 73,331
Caraga 123,620 135,295 171,730 229,970 218,542 Agusan del Norte 15,240 14,687 13,912 18,981 20,486 Agusan del Sur 65,529 84,359 113,882 157,907 146,494 Dinagat Islands 2,272 1,493 1,454 1,997 1,809 Surigao del Norte 17,601 16,095 14,799 17,140 14,980 Surigao del Sur 22,978 18,661 27,683 33,945 34,773
ARMM 420,012 360,265 374,504 410,172 370,078 Basilan 1,720 1,449 970 389 402 Lanao del Sur 117,896 118,551 132,490 131,069 96,926 Maguindanao 296,665 236,910 237,503 276,017 270,051 Sulu 2,770 2,397 2,645 2,054 2,050 Tawi-tawi 961 958 896 643 649
R/ - Revised due to inclusion of Batanes data.
Note: Dinagat Islands data dissagregated from Surigao del Norte.
Table 10. RAINFED PALAY: VOLUME OF PRODUCTION …Continued
MAJOR CROPS STATISTICS OF THE PHILIPPINES, 2010-2014 (REGIONAL AND PROVINCIAL)
PHILIPPINE STATISTICS AUTHORITY
16
Region/Province 2010 2011 2012 R/ 2013 R/ 2014
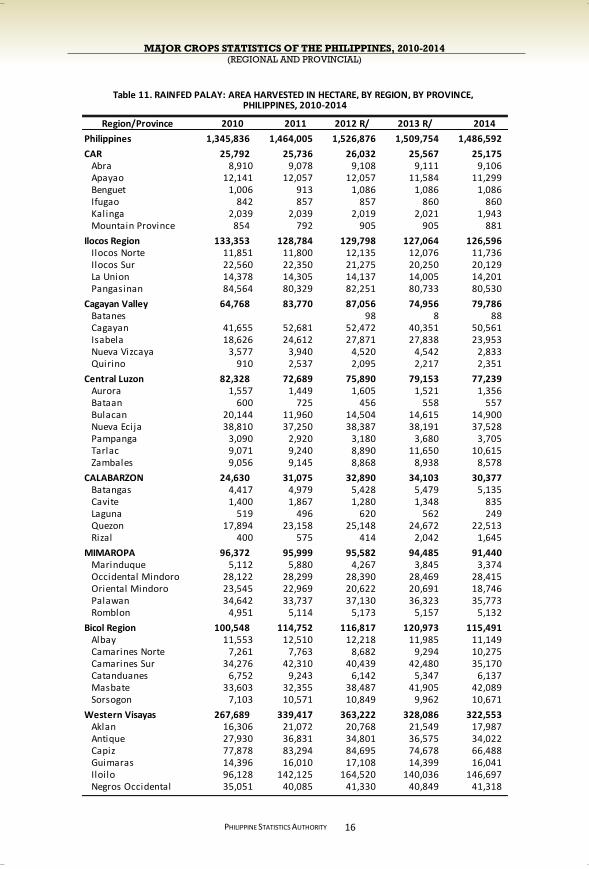
Philippines 1,345,836 1,464,005 1,526,876 1,509,754 1,486,592
CAR 25,792 25,736 26,032 25,567 25,175 Abra 8,910 9,078 9,108 9,111 9,106 Apayao 12,141 12,057 12,057 11,584 11,299 Benguet 1,006 913 1,086 1,086 1,086 Ifugao 842 857 857 860 860 Kalinga 2,039 2,039 2,019 2,021 1,943 Mountain Province 854 792 905 905 881
Ilocos Region 133,353 128,784 129,798 127,064 126,596 Ilocos Norte 11,851 11,800 12,135 12,076 11,736 Ilocos Sur 22,560 22,350 21,275 20,250 20,129 La Union 14,378 14,305 14,137 14,005 14,201 Pangasinan 84,564 80,329 82,251 80,733 80,530
Cagayan Valley 64,768 83,770 87,056 74,956 79,786 Batanes 98 8 88 Cagayan 41,655 52,681 52,472 40,351 50,561 Isabela 18,626 24,612 27,871 27,838 23,953 Nueva Vizcaya 3,577 3,940 4,520 4,542 2,833 Quirino 910 2,537 2,095 2,217 2,351
Central Luzon 82,328 72,689 75,890 79,153 77,239 Aurora 1,557 1,449 1,605 1,521 1,356 Bataan 600 725 456 558 557 Bulacan 20,144 11,960 14,504 14,615 14,900 Nueva Ecija 38,810 37,250 38,387 38,191 37,528 Pampanga 3,090 2,920 3,180 3,680 3,705 Tarlac 9,071 9,240 8,890 11,650 10,615 Zambales 9,056 9,145 8,868 8,938 8,578
CALABARZON 24,630 31,075 32,890 34,103 30,377 Batangas 4,417 4,979 5,428 5,479 5,135 Cavite 1,400 1,867 1,280 1,348 835 Laguna 519 496 620 562 249 Quezon 17,894 23,158 25,148 24,672 22,513 Rizal 400 575 414 2,042 1,645
MIMAROPA 96,372 95,999 95,582 94,485 91,440 Marinduque 5,112 5,880 4,267 3,845 3,374 Occidental Mindoro 28,122 28,299 28,390 28,469 28,415 Oriental Mindoro 23,545 22,969 20,622 20,691 18,746 Palawan 34,642 33,737 37,130 36,323 35,773 Romblon 4,951 5,114 5,173 5,157 5,132
Bicol Region 100,548 114,752 116,817 120,973 115,491 Albay 11,553 12,510 12,218 11,985 11,149 Camarines Norte 7,261 7,763 8,682 9,294 10,275 Camarines Sur 34,276 42,310 40,439 42,480 35,170 Catanduanes 6,752 9,243 6,142 5,347 6,137 Masbate 33,603 32,355 38,487 41,905 42,089 Sorsogon 7,103 10,571 10,849 9,962 10,671
Western Visayas 267,689 339,417 363,222 328,086 322,553 Aklan 16,306 21,072 20,768 21,549 17,987 Antique 27,930 36,831 34,801 36,575 34,022 Capiz 77,878 83,294 84,695 74,678 66,488 Guimaras 14,396 16,010 17,108 14,399 16,041 Iloilo 96,128 142,125 164,520 140,036 146,697 Negros Occidental 35,051 40,085 41,330 40,849 41,318
PHILIPPINES, 2010-2014Table 11. RAINFED PALAY: AREA HARVESTED IN HECTARE, BY REGION, BY PROVINCE,
MAJOR CROPS STATISTICS OF THE PHILIPPINES, 2010-2014 (REGIONAL AND PROVINCIAL)
PHILIPPINE STATISTICS AUTHORITY
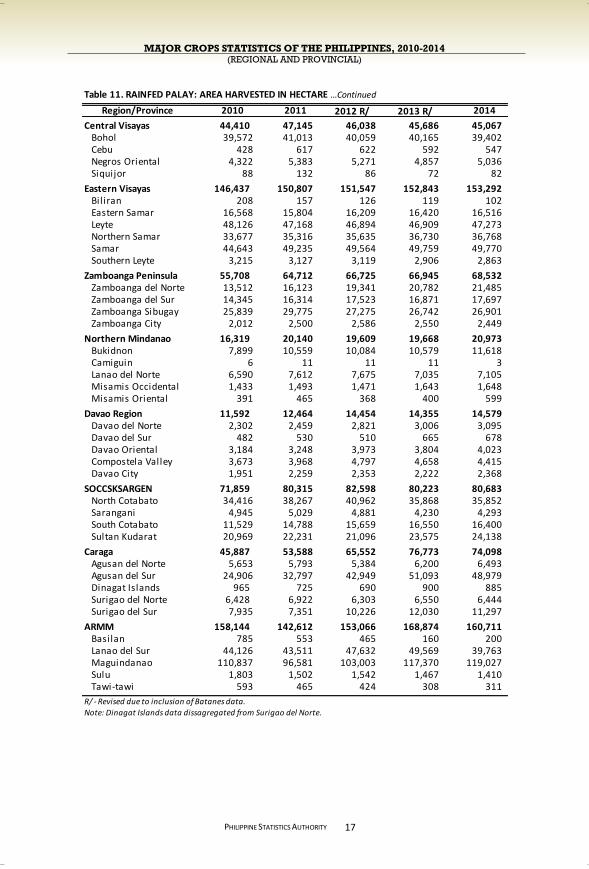
17
Region/Province 2010 2011 2012 R/ 2013 R/ 2014
Central Visayas 44,410 47,145 46,038 45,686 45,067 Bohol 39,572 41,013 40,059 40,165 39,402 Cebu 428 617 622 592 547 Negros Oriental 4,322 5,383 5,271 4,857 5,036 Siquijor 88 132 86 72 82
Eastern Visayas 146,437 150,807 151,547 152,843 153,292 Bil iran 208 157 126 119 102 Eastern Samar 16,568 15,804 16,209 16,420 16,516 Leyte 48,126 47,168 46,894 46,909 47,273 Northern Samar 33,677 35,316 35,635 36,730 36,768 Samar 44,643 49,235 49,564 49,759 49,770 Southern Leyte 3,215 3,127 3,119 2,906 2,863
Zamboanga Peninsula 55,708 64,712 66,725 66,945 68,532 Zamboanga del Norte 13,512 16,123 19,341 20,782 21,485 Zamboanga del Sur 14,345 16,314 17,523 16,871 17,697 Zamboanga Sibugay 25,839 29,775 27,275 26,742 26,901 Zamboanga City 2,012 2,500 2,586 2,550 2,449
Northern Mindanao 16,319 20,140 19,609 19,668 20,973 Bukidnon 7,899 10,559 10,084 10,579 11,618 Camiguin 6 11 11 11 3 Lanao del Norte 6,590 7,612 7,675 7,035 7,105 Misamis Occidental 1,433 1,493 1,471 1,643 1,648 Misamis Oriental 391 465 368 400 599
Davao Region 11,592 12,464 14,454 14,355 14,579 Davao del Norte 2,302 2,459 2,821 3,006 3,095 Davao del Sur 482 530 510 665 678 Davao Oriental 3,184 3,248 3,973 3,804 4,023 Compostela Valley 3,673 3,968 4,797 4,658 4,415 Davao City 1,951 2,259 2,353 2,222 2,368
SOCCSKSARGEN 71,859 80,315 82,598 80,223 80,683 North Cotabato 34,416 38,267 40,962 35,868 35,852 Sarangani 4,945 5,029 4,881 4,230 4,293 South Cotabato 11,529 14,788 15,659 16,550 16,400 Sultan Kudarat 20,969 22,231 21,096 23,575 24,138
Caraga 45,887 53,588 65,552 76,773 74,098 Agusan del Norte 5,653 5,793 5,384 6,200 6,493 Agusan del Sur 24,906 32,797 42,949 51,093 48,979 Dinagat Islands 965 725 690 900 885 Surigao del Norte 6,428 6,922 6,303 6,550 6,444 Surigao del Sur 7,935 7,351 10,226 12,030 11,297
ARMM 158,144 142,612 153,066 168,874 160,711 Basilan 785 553 465 160 200 Lanao del Sur 44,126 43,511 47,632 49,569 39,763 Maguindanao 110,837 96,581 103,003 117,370 119,027 Sulu 1,803 1,502 1,542 1,467 1,410 Tawi-tawi 593 465 424 308 311
R/ - Revised due to inclusion of Batanes data.
Note: Dinagat Islands data dissagregated from Surigao del Norte.
Table 11. RAINFED PALAY: AREA HARVESTED IN HECTARE …Continued

MAJOR CROPS STATISTICS OF THE PHILIPPINES, 2010-2014 (REGIONAL AND PROVINCIAL)
PHILIPPINE STATISTICS AUTHORITY
18
Prodn (MT) % Share % Cumulative
Philippines 4,562,110 100.00
1 Iloilo 453,380 9.94 9.942 Pangasinan 298,604 6.55 16.483 Maguindanao 270,051 5.92 22.404 Capiz 187,052 4.10 26.505 Nueva Ecija 172,362 3.78 30.286 Leyte 154,386 3.38 33.677 Agusan del Sur 146,494 3.21 36.888 Negros Occidental 143,803 3.15 40.039 Cagayan 127,925 2.80 42.83
10 Masbate 126,786 2.78 45.6111 Samar 122,930 2.69 48.3112 Camarines Sur 122,500 2.69 50.9913 Palawan 114,760 2.52 53.5114 North Cotabato 111,360 2.44 55.9515 Bohol 109,970 2.41 58.3616 Occidental Mindoro 109,137 2.39 60.7517 Northern Samar 102,225 2.24 62.9918 Antique 97,649 2.14 65.1319 Lanao del Sur 96,926 2.12 67.2620 Zamboanga Sibugay 95,827 2.10 69.36
LUZON 1,852,374 40.60 40.60VISAYAS 1,522,952 33.38 73.99MINDANAO 1,186,784 26.01 100.00
Area (Ha.) % Share % Cumulative
Philippines 1,486,592 100.00
1 Iloilo 146,697 9.87 9.872 Maguindanao 119,027 8.01 17.873 Pangasinan 80,530 5.42 23.294 Capiz 66,488 4.47 27.765 Cagayan 50,561 3.40 31.176 Samar 49,770 3.35 34.517 Agusan del Sur 48,979 3.29 37.818 Leyte 47,273 3.18 40.999 Masbate 42,089 2.83 43.82
10 Negros Occidental 41,318 2.78 46.6011 Lanao del Sur 39,763 2.67 49.2712 Bohol 39,402 2.65 51.9213 Nueva Ecija 37,528 2.52 54.4514 Northern Samar 36,768 2.47 56.9215 North Cotabato 35,852 2.41 59.3316 Palawan 35,773 2.41 61.7417 Camarines Sur 35,170 2.37 64.1118 Antique 34,022 2.29 66.3919 Occidental Mindoro 28,415 1.91 68.3120 Zamboanga Sibugay 26,901 1.81 70.12
LUZON 546,104 36.74 36.74VISAYAS 520,912 35.04 71.78MINDANAO 419,576 28.22 100.00
Province
Table 12. RAINFED PALAY: TOP PRODUCING PROVINCES
Table 13. RAINFED PALAY: TOP PRODUCING PROVINCES BASED ON AREA,
Province
PHILIPPINES, 2014
BASED ON PRODUCTION, PHILIPPINES, 2014

MAJOR CROPS STATISTICS OF THE PHILIPPINES, 2010-2014 (REGIONAL AND PROVINCIAL)
PHILIPPINE STATISTICS AUTHORITY
CORN
Corn production during the last five years increased from 6.38 million mt in 2010 to 7.77 million mt in 2014. Average annual growth was 5.1 percent.
In 2014, total corn production reached 7.77 million mt and was 5.3 percent higher than the 2013 output level of 7.38 million mt. Harvest area increased by 1.9 percent from 2.56 million hectares in 2013 to 2.61 million hectares in 2014.
Isabela was the leading
province with 1.18 million mt of corn produced or 15.1 percent share to the national output. Bukidnon and South Cotabato followed with 0.81 million mt and 0.50 million mt or 10.4 percent and 6.4 percent share, respectively (Figure 5).
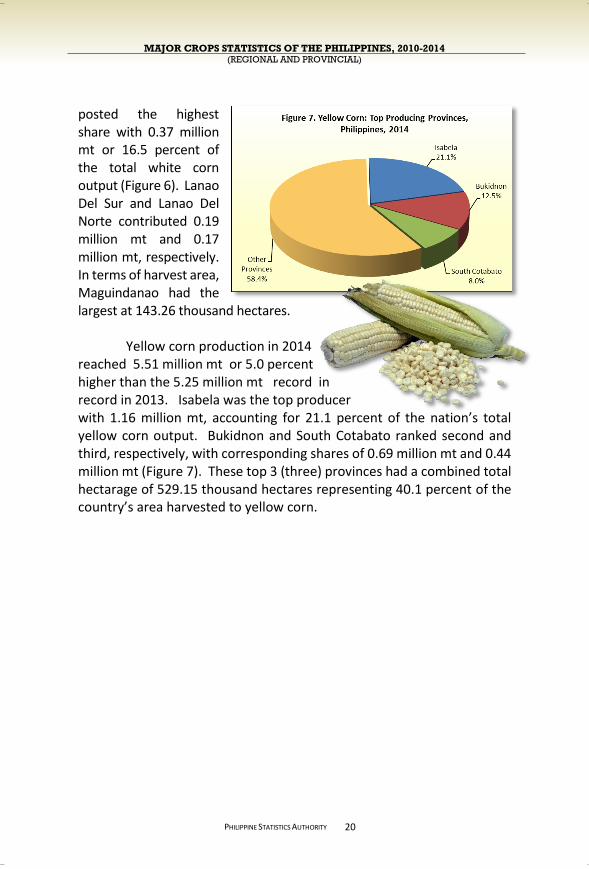
In 2014, white corn production was 2.26 million mt. Maguindanao posted the highest share with 0.37
19
MAJOR CROPS STATISTICS OF THE PHILIPPINES, 2010-2014 (REGIONAL AND PROVINCIAL)
PHILIPPINE STATISTICS AUTHORITY
posted the highest share with 0.37 million mt or 16.5 percent of the total white corn output (Figure 6). Lanao Del Sur and Lanao Del Norte contributed 0.19 million mt and 0.17 million mt, respectively. In terms of harvest area, Maguindanao had the largest at 143.26 thousand hectares.
Yellow corn production in 2014 reached 5.51 million mt or 5.0 percent higher than the 5.25 million mt record in record in 2013. Isabela was the top producer with 1.16 million mt, accounting for 21.1 percent of the nation’s total yellow corn output. Bukidnon and South Cotabato ranked second and third, respectively, with corresponding shares of 0.69 million mt and 0.44 million mt (Figure 7). These top 3 (three) provinces had a combined total hectarage of 529.15 thousand hectares representing 40.1 percent of the country’s area harvested to yellow corn.
20
MAJOR CROPS STATISTICS OF THE PHILIPPINES, 2010-2014 (REGIONAL AND PROVINCIAL)
PHILIPPINE STATISTICS AUTHORITY
21
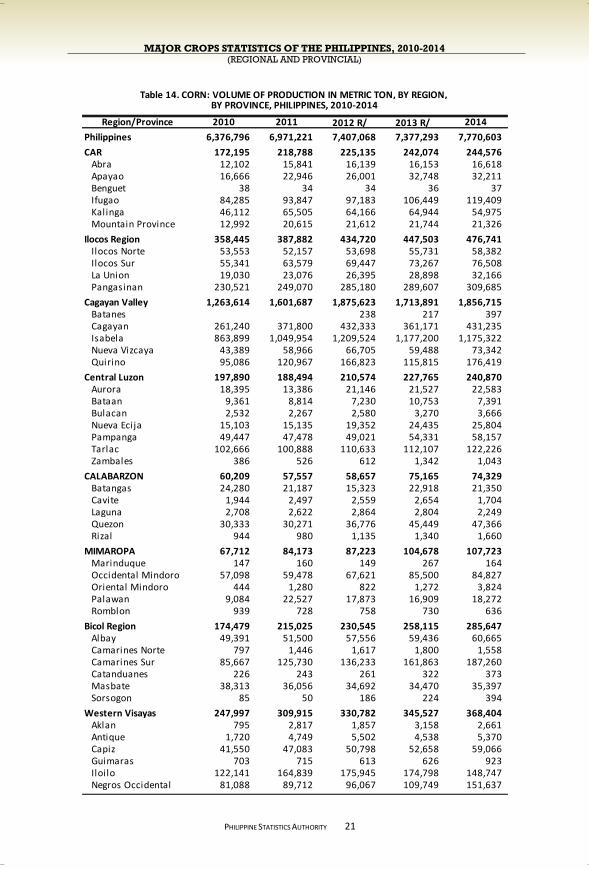
Region/Province 2010 2011 2012 R/ 2013 R/ 2014
Philippines 6,376,796 6,971,221 7,407,068 7,377,293 7,770,603
CAR 172,195 218,788 225,135 242,074 244,576 Abra 12,102 15,841 16,139 16,153 16,618 Apayao 16,666 22,946 26,001 32,748 32,211 Benguet 38 34 34 36 37 Ifugao 84,285 93,847 97,183 106,449 119,409 Kalinga 46,112 65,505 64,166 64,944 54,975 Mountain Province 12,992 20,615 21,612 21,744 21,326
Ilocos Region 358,445 387,882 434,720 447,503 476,741 Ilocos Norte 53,553 52,157 53,698 55,731 58,382 Ilocos Sur 55,341 63,579 69,447 73,267 76,508 La Union 19,030 23,076 26,395 28,898 32,166 Pangasinan 230,521 249,070 285,180 289,607 309,685
Cagayan Valley 1,263,614 1,601,687 1,875,623 1,713,891 1,856,715 Batanes 238 217 397 Cagayan 261,240 371,800 432,333 361,171 431,235 Isabela 863,899 1,049,954 1,209,524 1,177,200 1,175,322 Nueva Vizcaya 43,389 58,966 66,705 59,488 73,342 Quirino 95,086 120,967 166,823 115,815 176,419
Central Luzon 197,890 188,494 210,574 227,765 240,870 Aurora 18,395 13,386 21,146 21,527 22,583 Bataan 9,361 8,814 7,230 10,753 7,391 Bulacan 2,532 2,267 2,580 3,270 3,666 Nueva Ecija 15,103 15,135 19,352 24,435 25,804 Pampanga 49,447 47,478 49,021 54,331 58,157 Tarlac 102,666 100,888 110,633 112,107 122,226 Zambales 386 526 612 1,342 1,043
CALABARZON 60,209 57,557 58,657 75,165 74,329 Batangas 24,280 21,187 15,323 22,918 21,350 Cavite 1,944 2,497 2,559 2,654 1,704 Laguna 2,708 2,622 2,864 2,804 2,249 Quezon 30,333 30,271 36,776 45,449 47,366 Rizal 944 980 1,135 1,340 1,660
MIMAROPA 67,712 84,173 87,223 104,678 107,723 Marinduque 147 160 149 267 164 Occidental Mindoro 57,098 59,478 67,621 85,500 84,827 Oriental Mindoro 444 1,280 822 1,272 3,824 Palawan 9,084 22,527 17,873 16,909 18,272 Romblon 939 728 758 730 636
Bicol Region 174,479 215,025 230,545 258,115 285,647 Albay 49,391 51,500 57,556 59,436 60,665 Camarines Norte 797 1,446 1,617 1,800 1,558 Camarines Sur 85,667 125,730 136,233 161,863 187,260 Catanduanes 226 243 261 322 373 Masbate 38,313 36,056 34,692 34,470 35,397 Sorsogon 85 50 186 224 394
Western Visayas 247,997 309,915 330,782 345,527 368,404 Aklan 795 2,817 1,857 3,158 2,661 Antique 1,720 4,749 5,502 4,538 5,370 Capiz 41,550 47,083 50,798 52,658 59,066 Guimaras 703 715 613 626 923 Iloilo 122,141 164,839 175,945 174,798 148,747 Negros Occidental 81,088 89,712 96,067 109,749 151,637
BY PROVINCE, PHILIPPINES, 2010-2014Table 14. CORN: VOLUME OF PRODUCTION IN METRIC TON, BY REGION,
MAJOR CROPS STATISTICS OF THE PHILIPPINES, 2010-2014 (REGIONAL AND PROVINCIAL)
PHILIPPINE STATISTICS AUTHORITY
22
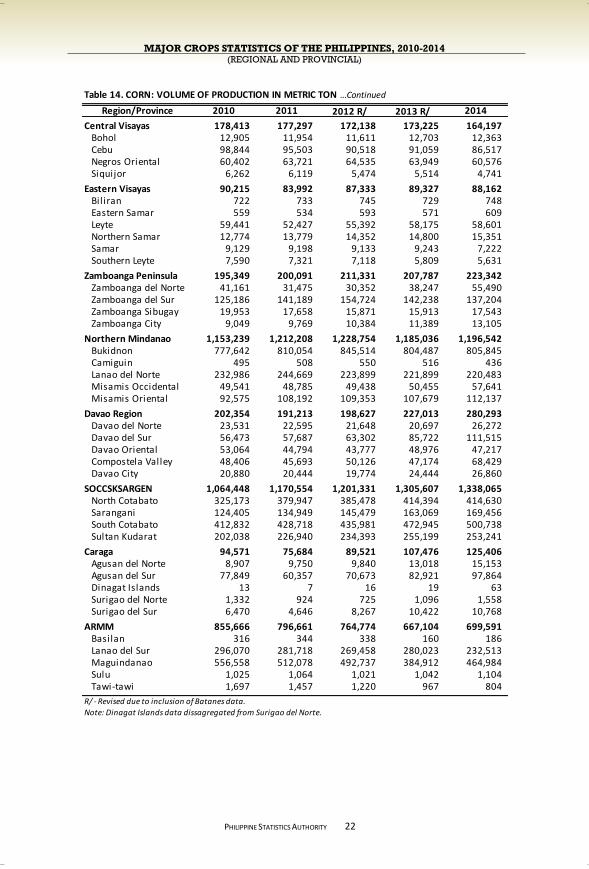
Region/Province 2010 2011 2012 R/ 2013 R/ 2014
Central Visayas 178,413 177,297 172,138 173,225 164,197 Bohol 12,905 11,954 11,611 12,703 12,363 Cebu 98,844 95,503 90,518 91,059 86,517 Negros Oriental 60,402 63,721 64,535 63,949 60,576 Siquijor 6,262 6,119 5,474 5,514 4,741
Eastern Visayas 90,215 83,992 87,333 89,327 88,162 Bil iran 722 733 745 729 748 Eastern Samar 559 534 593 571 609 Leyte 59,441 52,427 55,392 58,175 58,601 Northern Samar 12,774 13,779 14,352 14,800 15,351 Samar 9,129 9,198 9,133 9,243 7,222 Southern Leyte 7,590 7,321 7,118 5,809 5,631
Zamboanga Peninsula 195,349 200,091 211,331 207,787 223,342 Zamboanga del Norte 41,161 31,475 30,352 38,247 55,490 Zamboanga del Sur 125,186 141,189 154,724 142,238 137,204 Zamboanga Sibugay 19,953 17,658 15,871 15,913 17,543 Zamboanga City 9,049 9,769 10,384 11,389 13,105
Northern Mindanao 1,153,239 1,212,208 1,228,754 1,185,036 1,196,542 Bukidnon 777,642 810,054 845,514 804,487 805,845 Camiguin 495 508 550 516 436 Lanao del Norte 232,986 244,669 223,899 221,899 220,483 Misamis Occidental 49,541 48,785 49,438 50,455 57,641 Misamis Oriental 92,575 108,192 109,353 107,679 112,137
Davao Region 202,354 191,213 198,627 227,013 280,293 Davao del Norte 23,531 22,595 21,648 20,697 26,272 Davao del Sur 56,473 57,687 63,302 85,722 111,515 Davao Oriental 53,064 44,794 43,777 48,976 47,217 Compostela Valley 48,406 45,693 50,126 47,174 68,429 Davao City 20,880 20,444 19,774 24,444 26,860
SOCCSKSARGEN 1,064,448 1,170,554 1,201,331 1,305,607 1,338,065 North Cotabato 325,173 379,947 385,478 414,394 414,630 Sarangani 124,405 134,949 145,479 163,069 169,456 South Cotabato 412,832 428,718 435,981 472,945 500,738 Sultan Kudarat 202,038 226,940 234,393 255,199 253,241
Caraga 94,571 75,684 89,521 107,476 125,406 Agusan del Norte 8,907 9,750 9,840 13,018 15,153 Agusan del Sur 77,849 60,357 70,673 82,921 97,864 Dinagat Islands 13 7 16 19 63 Surigao del Norte 1,332 924 725 1,096 1,558 Surigao del Sur 6,470 4,646 8,267 10,422 10,768
ARMM 855,666 796,661 764,774 667,104 699,591 Basilan 316 344 338 160 186 Lanao del Sur 296,070 281,718 269,458 280,023 232,513 Maguindanao 556,558 512,078 492,737 384,912 464,984 Sulu 1,025 1,064 1,021 1,042 1,104 Tawi-tawi 1,697 1,457 1,220 967 804
R/ - Revised due to inclusion of Batanes data.
Note: Dinagat Islands data dissagregated from Surigao del Norte.
Table 14. CORN: VOLUME OF PRODUCTION IN METRIC TON …Continued
MAJOR CROPS STATISTICS OF THE PHILIPPINES, 2010-2014 (REGIONAL AND PROVINCIAL)
PHILIPPINE STATISTICS AUTHORITY
23
Region/Province 2010 2011 2012 R/ 2013 R/ 2014
Philippines 2,499,040 2,544,612 2,593,924 2,563,718 2,611,432
CAR 48,991 56,051 57,290 61,639 64,832 Abra 6,552 6,552 6,441 6,448 6,447 Apayao 4,014 5,343 5,812 6,739 7,200 Benguet 39 35 35 37 38 Ifugao 22,992 24,034 24,658 27,329 30,114 Kalinga 11,305 14,314 14,318 14,890 14,459 Mountain Province 4,089 5,773 6,026 6,196 6,574
Ilocos Region 75,342 77,183 82,793 84,106 87,763 Ilocos Norte 12,451 11,958 12,283 12,503 12,448 Ilocos Sur 12,408 12,853 13,452 14,303 14,613 La Union 5,053 5,496 5,479 5,870 6,542 Pangasinan 45,430 46,876 51,579 51,430 54,160
Cagayan Valley 364,723 422,095 432,465 416,823 437,729 Batanes 99 83 195 Cagayan 85,005 105,583 109,422 100,872 111,000 Isabela 239,052 266,924 268,758 273,141 269,266 Nueva Vizcaya 12,440 14,610 15,961 15,243 16,770 Quirino 28,226 34,978 38,225 27,484 40,498
Central Luzon 42,977 38,836 40,481 44,151 43,535 Aurora 3,983 3,003 3,890 4,010 4,416 Bataan 1,934 1,837 1,519 2,135 1,463 Bulacan 919 938 1,002 1,088 1,167 Nueva Ecija 6,064 5,987 6,403 6,968 7,102 Pampanga 11,212 10,442 10,653 11,043 10,902 Tarlac 18,720 16,467 16,853 18,528 18,212 Zambales 145 162 161 379 273
CALABARZON 29,687 31,858 33,080 33,906 34,518 Batangas 9,318 8,806 8,054 9,466 9,569 Cavite 1,173 1,292 1,418 1,408 1,021 Laguna 1,126 1,156 1,242 1,219 1,007 Quezon 17,758 20,269 21,882 21,283 22,370 Rizal 312 335 484 530 551
MIMAROPA 22,984 26,463 24,496 28,022 29,135 Marinduque 155 164 151 220 144 Occidental Mindoro 16,449 15,631 16,619 19,848 19,556 Oriental Mindoro 186 638 306 526 1,531 Palawan 5,381 9,374 6,694 6,658 7,216 Romblon 813 656 726 770 688
Bicol Region 101,812 108,243 112,964 109,582 113,596 Albay 20,859 21,750 23,035 22,454 21,487 Camarines Norte 630 1,021 1,056 1,134 844 Camarines Sur 30,281 36,891 38,479 43,766 48,012 Catanduanes 264 289 296 355 371 Masbate 49,709 48,252 50,010 41,770 42,697 Sorsogon 69 40 88 103 185
Western Visayas 112,502 122,216 122,569 123,946 124,312 Aklan 637 1,061 1,043 1,241 1,105 Antique 874 1,899 1,974 1,554 1,852 Capiz 15,899 14,800 15,722 15,849 17,105 Guimaras 690 662 521 476 552 Iloilo 37,813 43,984 44,437 45,128 39,618 Negros Occidental 56,589 59,810 58,872 59,698 64,080
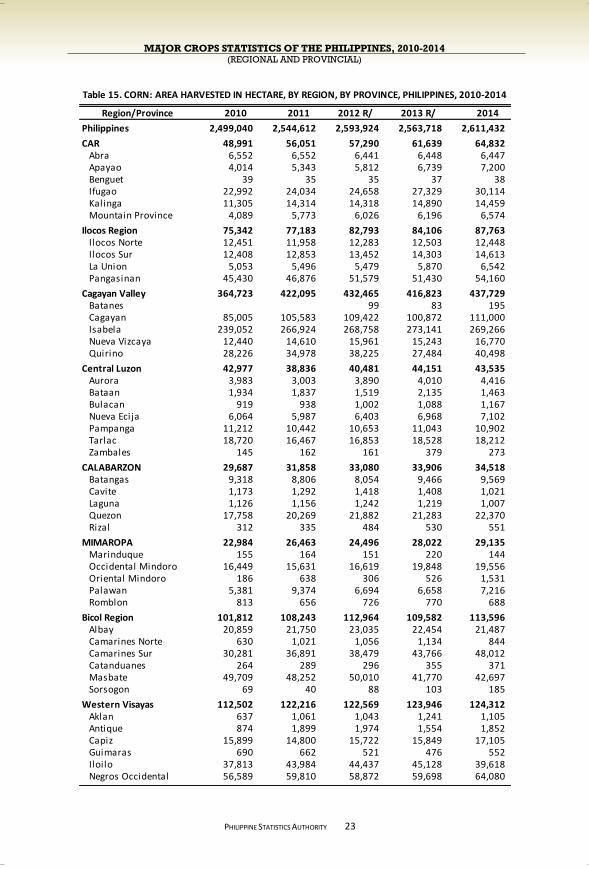
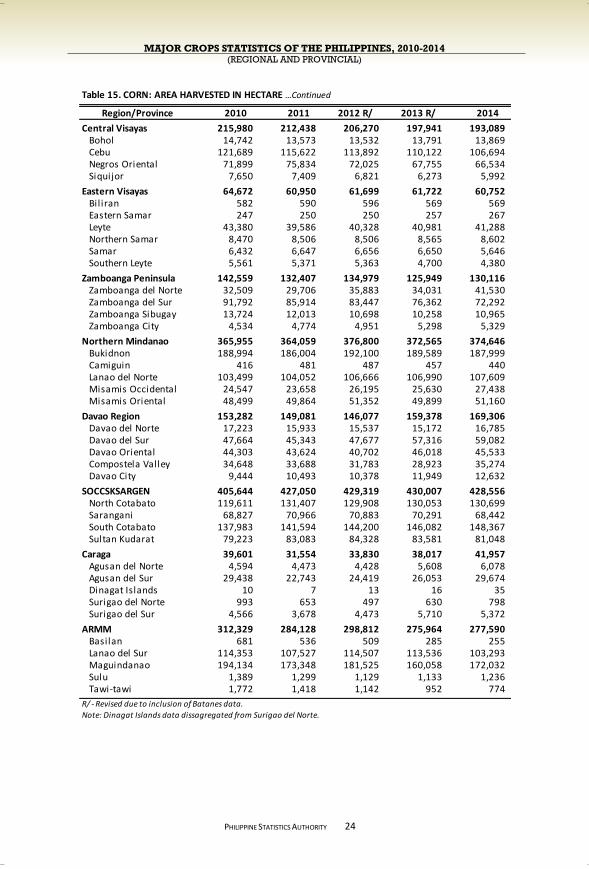
Table 15. CORN: AREA HARVESTED IN HECTARE, BY REGION, BY PROVINCE, PHILIPPINES, 2010-2014
MAJOR CROPS STATISTICS OF THE PHILIPPINES, 2010-2014 (REGIONAL AND PROVINCIAL)
PHILIPPINE STATISTICS AUTHORITY
24
Region/Province 2010 2011 2012 R/ 2013 R/ 2014
Central Visayas 215,980 212,438 206,270 197,941 193,089 Bohol 14,742 13,573 13,532 13,791 13,869 Cebu 121,689 115,622 113,892 110,122 106,694 Negros Oriental 71,899 75,834 72,025 67,755 66,534 Siquijor 7,650 7,409 6,821 6,273 5,992
Eastern Visayas 64,672 60,950 61,699 61,722 60,752 Bil iran 582 590 596 569 569 Eastern Samar 247 250 250 257 267 Leyte 43,380 39,586 40,328 40,981 41,288 Northern Samar 8,470 8,506 8,506 8,565 8,602 Samar 6,432 6,647 6,656 6,650 5,646 Southern Leyte 5,561 5,371 5,363 4,700 4,380
Zamboanga Peninsula 142,559 132,407 134,979 125,949 130,116 Zamboanga del Norte 32,509 29,706 35,883 34,031 41,530 Zamboanga del Sur 91,792 85,914 83,447 76,362 72,292 Zamboanga Sibugay 13,724 12,013 10,698 10,258 10,965 Zamboanga City 4,534 4,774 4,951 5,298 5,329
Northern Mindanao 365,955 364,059 376,800 372,565 374,646 Bukidnon 188,994 186,004 192,100 189,589 187,999 Camiguin 416 481 487 457 440 Lanao del Norte 103,499 104,052 106,666 106,990 107,609 Misamis Occidental 24,547 23,658 26,195 25,630 27,438 Misamis Oriental 48,499 49,864 51,352 49,899 51,160
Davao Region 153,282 149,081 146,077 159,378 169,306 Davao del Norte 17,223 15,933 15,537 15,172 16,785 Davao del Sur 47,664 45,343 47,677 57,316 59,082 Davao Oriental 44,303 43,624 40,702 46,018 45,533 Compostela Valley 34,648 33,688 31,783 28,923 35,274 Davao City 9,444 10,493 10,378 11,949 12,632
SOCCSKSARGEN 405,644 427,050 429,319 430,007 428,556 North Cotabato 119,611 131,407 129,908 130,053 130,699 Sarangani 68,827 70,966 70,883 70,291 68,442 South Cotabato 137,983 141,594 144,200 146,082 148,367 Sultan Kudarat 79,223 83,083 84,328 83,581 81,048
Caraga 39,601 31,554 33,830 38,017 41,957 Agusan del Norte 4,594 4,473 4,428 5,608 6,078 Agusan del Sur 29,438 22,743 24,419 26,053 29,674 Dinagat Islands 10 7 13 16 35 Surigao del Norte 993 653 497 630 798 Surigao del Sur 4,566 3,678 4,473 5,710 5,372
ARMM 312,329 284,128 298,812 275,964 277,590 Basilan 681 536 509 285 255 Lanao del Sur 114,353 107,527 114,507 113,536 103,293 Maguindanao 194,134 173,348 181,525 160,058 172,032 Sulu 1,389 1,299 1,129 1,133 1,236 Tawi-tawi 1,772 1,418 1,142 952 774
R/ - Revised due to inclusion of Batanes data.
Note: Dinagat Islands data dissagregated from Surigao del Norte.
Table 15. CORN: AREA HARVESTED IN HECTARE …Continued
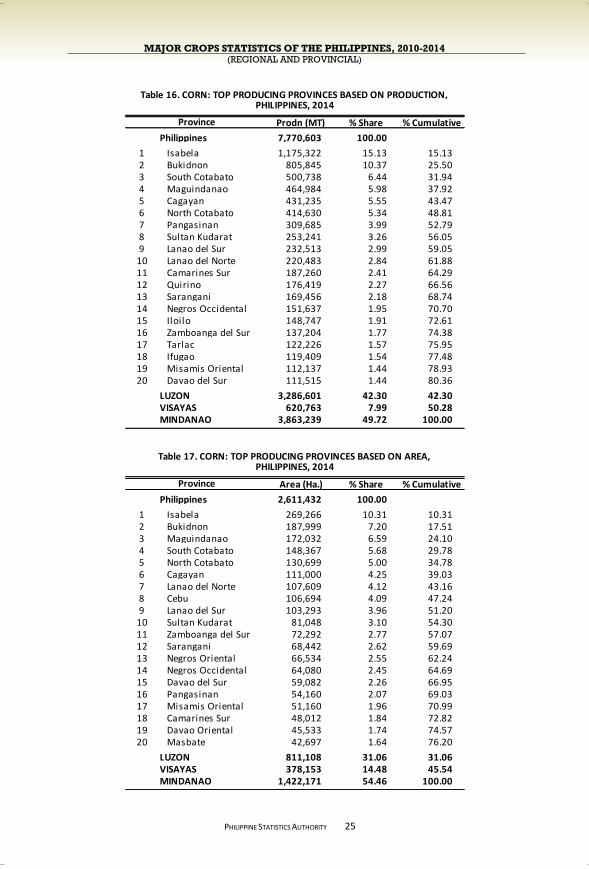
MAJOR CROPS STATISTICS OF THE PHILIPPINES, 2010-2014 (REGIONAL AND PROVINCIAL)
PHILIPPINE STATISTICS AUTHORITY
25
Prodn (MT) % Share % Cumulative
Philippines 7,770,603 100.00
1 Isabela 1,175,322 15.13 15.132 Bukidnon 805,845 10.37 25.503 South Cotabato 500,738 6.44 31.944 Maguindanao 464,984 5.98 37.925 Cagayan 431,235 5.55 43.476 North Cotabato 414,630 5.34 48.817 Pangasinan 309,685 3.99 52.798 Sultan Kudarat 253,241 3.26 56.059 Lanao del Sur 232,513 2.99 59.05
10 Lanao del Norte 220,483 2.84 61.8811 Camarines Sur 187,260 2.41 64.2912 Quirino 176,419 2.27 66.5613 Sarangani 169,456 2.18 68.7414 Negros Occidental 151,637 1.95 70.7015 Iloilo 148,747 1.91 72.6116 Zamboanga del Sur 137,204 1.77 74.3817 Tarlac 122,226 1.57 75.9518 Ifugao 119,409 1.54 77.4819 Misamis Oriental 112,137 1.44 78.9320 Davao del Sur 111,515 1.44 80.36
LUZON 3,286,601 42.30 42.30VISAYAS 620,763 7.99 50.28MINDANAO 3,863,239 49.72 100.00
Area (Ha.) % Share % Cumulative
Philippines 2,611,432 100.00
1 Isabela 269,266 10.31 10.312 Bukidnon 187,999 7.20 17.513 Maguindanao 172,032 6.59 24.104 South Cotabato 148,367 5.68 29.785 North Cotabato 130,699 5.00 34.786 Cagayan 111,000 4.25 39.037 Lanao del Norte 107,609 4.12 43.168 Cebu 106,694 4.09 47.249 Lanao del Sur 103,293 3.96 51.20
10 Sultan Kudarat 81,048 3.10 54.3011 Zamboanga del Sur 72,292 2.77 57.0712 Sarangani 68,442 2.62 59.6913 Negros Oriental 66,534 2.55 62.2414 Negros Occidental 64,080 2.45 64.6915 Davao del Sur 59,082 2.26 66.9516 Pangasinan 54,160 2.07 69.0317 Misamis Oriental 51,160 1.96 70.9918 Camarines Sur 48,012 1.84 72.8219 Davao Oriental 45,533 1.74 74.5720 Masbate 42,697 1.64 76.20
LUZON 811,108 31.06 31.06VISAYAS 378,153 14.48 45.54MINDANAO 1,422,171 54.46 100.00
Province
Table 16. CORN: TOP PRODUCING PROVINCES BASED ON PRODUCTION,
Table 17. CORN: TOP PRODUCING PROVINCES BASED ON AREA,
Province
PHILIPPINES, 2014
PHILIPPINES, 2014
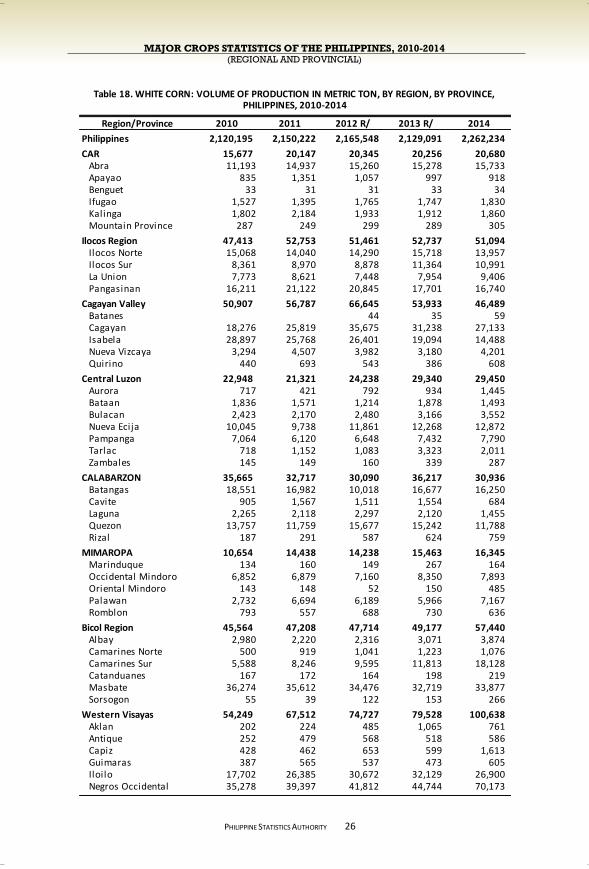
MAJOR CROPS STATISTICS OF THE PHILIPPINES, 2010-2014 (REGIONAL AND PROVINCIAL)
PHILIPPINE STATISTICS AUTHORITY
26
Region/Province 2010 2011 2012 R/ 2013 R/ 2014
Philippines 2,120,195 2,150,222 2,165,548 2,129,091 2,262,234
CAR 15,677 20,147 20,345 20,256 20,680 Abra 11,193 14,937 15,260 15,278 15,733 Apayao 835 1,351 1,057 997 918 Benguet 33 31 31 33 34 Ifugao 1,527 1,395 1,765 1,747 1,830 Kalinga 1,802 2,184 1,933 1,912 1,860 Mountain Province 287 249 299 289 305
Ilocos Region 47,413 52,753 51,461 52,737 51,094 Ilocos Norte 15,068 14,040 14,290 15,718 13,957 Ilocos Sur 8,361 8,970 8,878 11,364 10,991 La Union 7,773 8,621 7,448 7,954 9,406 Pangasinan 16,211 21,122 20,845 17,701 16,740
Cagayan Valley 50,907 56,787 66,645 53,933 46,489 Batanes 44 35 59 Cagayan 18,276 25,819 35,675 31,238 27,133 Isabela 28,897 25,768 26,401 19,094 14,488 Nueva Vizcaya 3,294 4,507 3,982 3,180 4,201 Quirino 440 693 543 386 608
Central Luzon 22,948 21,321 24,238 29,340 29,450 Aurora 717 421 792 934 1,445 Bataan 1,836 1,571 1,214 1,878 1,493 Bulacan 2,423 2,170 2,480 3,166 3,552 Nueva Ecija 10,045 9,738 11,861 12,268 12,872 Pampanga 7,064 6,120 6,648 7,432 7,790 Tarlac 718 1,152 1,083 3,323 2,011 Zambales 145 149 160 339 287
CALABARZON 35,665 32,717 30,090 36,217 30,936 Batangas 18,551 16,982 10,018 16,677 16,250 Cavite 905 1,567 1,511 1,554 684 Laguna 2,265 2,118 2,297 2,120 1,455 Quezon 13,757 11,759 15,677 15,242 11,788 Rizal 187 291 587 624 759
MIMAROPA 10,654 14,438 14,238 15,463 16,345 Marinduque 134 160 149 267 164 Occidental Mindoro 6,852 6,879 7,160 8,350 7,893 Oriental Mindoro 143 148 52 150 485 Palawan 2,732 6,694 6,189 5,966 7,167 Romblon 793 557 688 730 636
Bicol Region 45,564 47,208 47,714 49,177 57,440 Albay 2,980 2,220 2,316 3,071 3,874 Camarines Norte 500 919 1,041 1,223 1,076 Camarines Sur 5,588 8,246 9,595 11,813 18,128 Catanduanes 167 172 164 198 219 Masbate 36,274 35,612 34,476 32,719 33,877 Sorsogon 55 39 122 153 266
Western Visayas 54,249 67,512 74,727 79,528 100,638 Aklan 202 224 485 1,065 761 Antique 252 479 568 518 586 Capiz 428 462 653 599 1,613 Guimaras 387 565 537 473 605 Iloilo 17,702 26,385 30,672 32,129 26,900 Negros Occidental 35,278 39,397 41,812 44,744 70,173
PHILIPPINES, 2010-2014Table 18. WHITE CORN: VOLUME OF PRODUCTION IN METRIC TON, BY REGION, BY PROVINCE,
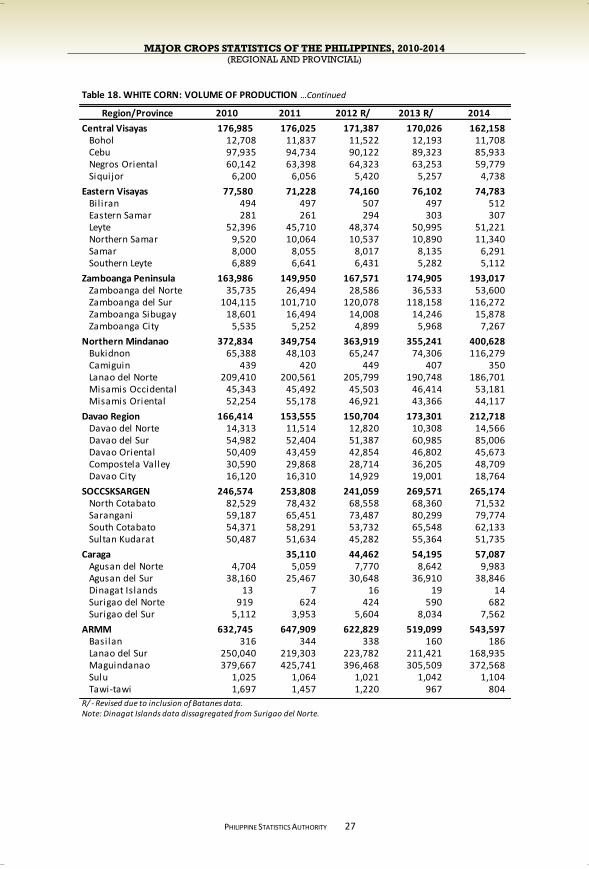
MAJOR CROPS STATISTICS OF THE PHILIPPINES, 2010-2014 (REGIONAL AND PROVINCIAL)
PHILIPPINE STATISTICS AUTHORITY
27
Region/Province 2010 2011 2012 R/ 2013 R/ 2014
Central Visayas 176,985 176,025 171,387 170,026 162,158 Bohol 12,708 11,837 11,522 12,193 11,708 Cebu 97,935 94,734 90,122 89,323 85,933 Negros Oriental 60,142 63,398 64,323 63,253 59,779 Siquijor 6,200 6,056 5,420 5,257 4,738
Eastern Visayas 77,580 71,228 74,160 76,102 74,783 Bil iran 494 497 507 497 512 Eastern Samar 281 261 294 303 307 Leyte 52,396 45,710 48,374 50,995 51,221 Northern Samar 9,520 10,064 10,537 10,890 11,340 Samar 8,000 8,055 8,017 8,135 6,291 Southern Leyte 6,889 6,641 6,431 5,282 5,112
Zamboanga Peninsula 163,986 149,950 167,571 174,905 193,017 Zamboanga del Norte 35,735 26,494 28,586 36,533 53,600 Zamboanga del Sur 104,115 101,710 120,078 118,158 116,272 Zamboanga Sibugay 18,601 16,494 14,008 14,246 15,878 Zamboanga City 5,535 5,252 4,899 5,968 7,267
Northern Mindanao 372,834 349,754 363,919 355,241 400,628 Bukidnon 65,388 48,103 65,247 74,306 116,279 Camiguin 439 420 449 407 350 Lanao del Norte 209,410 200,561 205,799 190,748 186,701 Misamis Occidental 45,343 45,492 45,503 46,414 53,181 Misamis Oriental 52,254 55,178 46,921 43,366 44,117
Davao Region 166,414 153,555 150,704 173,301 212,718 Davao del Norte 14,313 11,514 12,820 10,308 14,566 Davao del Sur 54,982 52,404 51,387 60,985 85,006 Davao Oriental 50,409 43,459 42,854 46,802 45,673 Compostela Valley 30,590 29,868 28,714 36,205 48,709 Davao City 16,120 16,310 14,929 19,001 18,764
SOCCSKSARGEN 246,574 253,808 241,059 269,571 265,174 North Cotabato 82,529 78,432 68,558 68,360 71,532 Sarangani 59,187 65,451 73,487 80,299 79,774 South Cotabato 54,371 58,291 53,732 65,548 62,133 Sultan Kudarat 50,487 51,634 45,282 55,364 51,735
Caraga 35,110 44,462 54,195 57,087 Agusan del Norte 4,704 5,059 7,770 8,642 9,983 Agusan del Sur 38,160 25,467 30,648 36,910 38,846 Dinagat Islands 13 7 16 19 14 Surigao del Norte 919 624 424 590 682 Surigao del Sur 5,112 3,953 5,604 8,034 7,562
ARMM 632,745 647,909 622,829 519,099 543,597 Basilan 316 344 338 160 186 Lanao del Sur 250,040 219,303 223,782 211,421 168,935 Maguindanao 379,667 425,741 396,468 305,509 372,568 Sulu 1,025 1,064 1,021 1,042 1,104 Tawi-tawi 1,697 1,457 1,220 967 804
R/ - Revised due to inclusion of Batanes data.Note: Dinagat Islands data dissagregated from Surigao del Norte.
Table 18. WHITE CORN: VOLUME OF PRODUCTION …Continued
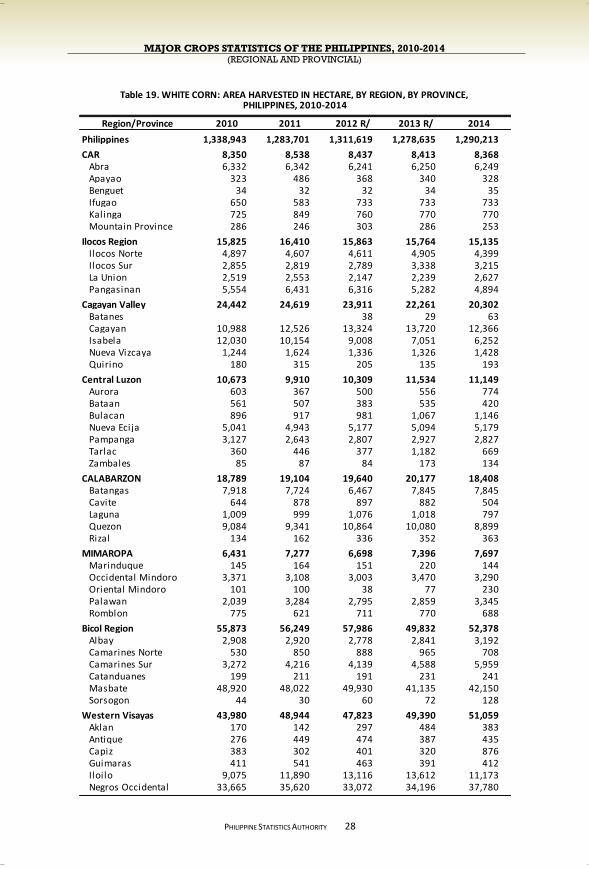
MAJOR CROPS STATISTICS OF THE PHILIPPINES, 2010-2014 (REGIONAL AND PROVINCIAL)
PHILIPPINE STATISTICS AUTHORITY
28
Region/Province 2010 2011 2012 R/ 2013 R/ 2014
Philippines 1,338,943 1,283,701 1,311,619 1,278,635 1,290,213
CAR 8,350 8,538 8,437 8,413 8,368 Abra 6,332 6,342 6,241 6,250 6,249 Apayao 323 486 368 340 328 Benguet 34 32 32 34 35 Ifugao 650 583 733 733 733 Kalinga 725 849 760 770 770 Mountain Province 286 246 303 286 253
Ilocos Region 15,825 16,410 15,863 15,764 15,135 Ilocos Norte 4,897 4,607 4,611 4,905 4,399 Ilocos Sur 2,855 2,819 2,789 3,338 3,215 La Union 2,519 2,553 2,147 2,239 2,627 Pangasinan 5,554 6,431 6,316 5,282 4,894
Cagayan Valley 24,442 24,619 23,911 22,261 20,302 Batanes 38 29 63 Cagayan 10,988 12,526 13,324 13,720 12,366 Isabela 12,030 10,154 9,008 7,051 6,252 Nueva Vizcaya 1,244 1,624 1,336 1,326 1,428 Quirino 180 315 205 135 193
Central Luzon 10,673 9,910 10,309 11,534 11,149 Aurora 603 367 500 556 774 Bataan 561 507 383 535 420 Bulacan 896 917 981 1,067 1,146 Nueva Ecija 5,041 4,943 5,177 5,094 5,179 Pampanga 3,127 2,643 2,807 2,927 2,827 Tarlac 360 446 377 1,182 669 Zambales 85 87 84 173 134
CALABARZON 18,789 19,104 19,640 20,177 18,408 Batangas 7,918 7,724 6,467 7,845 7,845 Cavite 644 878 897 882 504 Laguna 1,009 999 1,076 1,018 797 Quezon 9,084 9,341 10,864 10,080 8,899 Rizal 134 162 336 352 363
MIMAROPA 6,431 7,277 6,698 7,396 7,697 Marinduque 145 164 151 220 144 Occidental Mindoro 3,371 3,108 3,003 3,470 3,290 Oriental Mindoro 101 100 38 77 230 Palawan 2,039 3,284 2,795 2,859 3,345 Romblon 775 621 711 770 688
Bicol Region 55,873 56,249 57,986 49,832 52,378 Albay 2,908 2,920 2,778 2,841 3,192 Camarines Norte 530 850 888 965 708 Camarines Sur 3,272 4,216 4,139 4,588 5,959 Catanduanes 199 211 191 231 241 Masbate 48,920 48,022 49,930 41,135 42,150 Sorsogon 44 30 60 72 128
Western Visayas 43,980 48,944 47,823 49,390 51,059 Aklan 170 142 297 484 383 Antique 276 449 474 387 435 Capiz 383 302 401 320 876 Guimaras 411 541 463 391 412 Iloilo 9,075 11,890 13,116 13,612 11,173 Negros Occidental 33,665 35,620 33,072 34,196 37,780
PHILIPPINES, 2010-2014Table 19. WHITE CORN: AREA HARVESTED IN HECTARE, BY REGION, BY PROVINCE,
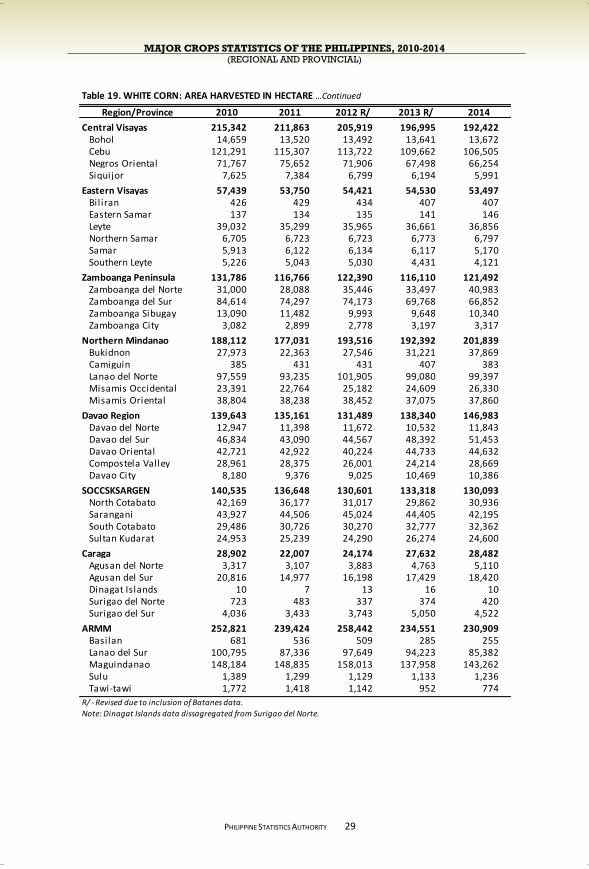
MAJOR CROPS STATISTICS OF THE PHILIPPINES, 2010-2014 (REGIONAL AND PROVINCIAL)
PHILIPPINE STATISTICS AUTHORITY
29
Region/Province 2010 2011 2012 R/ 2013 R/ 2014
Central Visayas 215,342 211,863 205,919 196,995 192,422 Bohol 14,659 13,520 13,492 13,641 13,672 Cebu 121,291 115,307 113,722 109,662 106,505 Negros Oriental 71,767 75,652 71,906 67,498 66,254 Siquijor 7,625 7,384 6,799 6,194 5,991
Eastern Visayas 57,439 53,750 54,421 54,530 53,497 Bil iran 426 429 434 407 407 Eastern Samar 137 134 135 141 146 Leyte 39,032 35,299 35,965 36,661 36,856 Northern Samar 6,705 6,723 6,723 6,773 6,797 Samar 5,913 6,122 6,134 6,117 5,170 Southern Leyte 5,226 5,043 5,030 4,431 4,121
Zamboanga Peninsula 131,786 116,766 122,390 116,110 121,492 Zamboanga del Norte 31,000 28,088 35,446 33,497 40,983 Zamboanga del Sur 84,614 74,297 74,173 69,768 66,852 Zamboanga Sibugay 13,090 11,482 9,993 9,648 10,340 Zamboanga City 3,082 2,899 2,778 3,197 3,317
Northern Mindanao 188,112 177,031 193,516 192,392 201,839 Bukidnon 27,973 22,363 27,546 31,221 37,869 Camiguin 385 431 431 407 383 Lanao del Norte 97,559 93,235 101,905 99,080 99,397 Misamis Occidental 23,391 22,764 25,182 24,609 26,330 Misamis Oriental 38,804 38,238 38,452 37,075 37,860
Davao Region 139,643 135,161 131,489 138,340 146,983 Davao del Norte 12,947 11,398 11,672 10,532 11,843 Davao del Sur 46,834 43,090 44,567 48,392 51,453 Davao Oriental 42,721 42,922 40,224 44,733 44,632 Compostela Valley 28,961 28,375 26,001 24,214 28,669 Davao City 8,180 9,376 9,025 10,469 10,386
SOCCSKSARGEN 140,535 136,648 130,601 133,318 130,093 North Cotabato 42,169 36,177 31,017 29,862 30,936 Sarangani 43,927 44,506 45,024 44,405 42,195 South Cotabato 29,486 30,726 30,270 32,777 32,362 Sultan Kudarat 24,953 25,239 24,290 26,274 24,600
Caraga 28,902 22,007 24,174 27,632 28,482 Agusan del Norte 3,317 3,107 3,883 4,763 5,110 Agusan del Sur 20,816 14,977 16,198 17,429 18,420 Dinagat Islands 10 7 13 16 10 Surigao del Norte 723 483 337 374 420 Surigao del Sur 4,036 3,433 3,743 5,050 4,522
ARMM 252,821 239,424 258,442 234,551 230,909 Basilan 681 536 509 285 255 Lanao del Sur 100,795 87,336 97,649 94,223 85,382 Maguindanao 148,184 148,835 158,013 137,958 143,262 Sulu 1,389 1,299 1,129 1,133 1,236 Tawi-tawi 1,772 1,418 1,142 952 774
R/ - Revised due to inclusion of Batanes data.
Note: Dinagat Islands data dissagregated from Surigao del Norte.
Table 19. WHITE CORN: AREA HARVESTED IN HECTARE …Continued
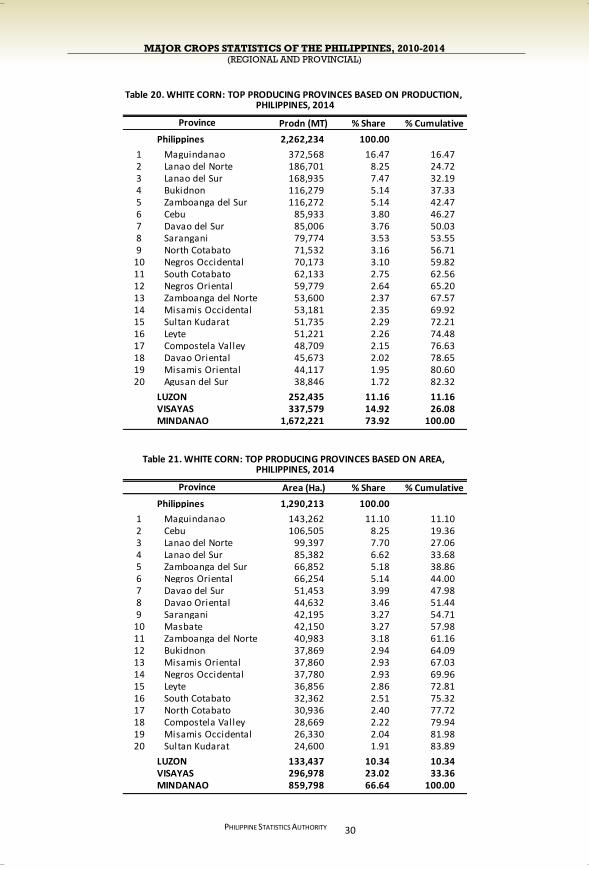
MAJOR CROPS STATISTICS OF THE PHILIPPINES, 2010-2014 (REGIONAL AND PROVINCIAL)
PHILIPPINE STATISTICS AUTHORITY
30
Prodn (MT) % Share % Cumulative
Philippines 2,262,234 100.00
1 Maguindanao 372,568 16.47 16.472 Lanao del Norte 186,701 8.25 24.723 Lanao del Sur 168,935 7.47 32.194 Bukidnon 116,279 5.14 37.335 Zamboanga del Sur 116,272 5.14 42.476 Cebu 85,933 3.80 46.277 Davao del Sur 85,006 3.76 50.038 Sarangani 79,774 3.53 53.559 North Cotabato 71,532 3.16 56.71
10 Negros Occidental 70,173 3.10 59.8211 South Cotabato 62,133 2.75 62.5612 Negros Oriental 59,779 2.64 65.2013 Zamboanga del Norte 53,600 2.37 67.5714 Misamis Occidental 53,181 2.35 69.9215 Sultan Kudarat 51,735 2.29 72.2116 Leyte 51,221 2.26 74.4817 Compostela Valley 48,709 2.15 76.6318 Davao Oriental 45,673 2.02 78.6519 Misamis Oriental 44,117 1.95 80.6020 Agusan del Sur 38,846 1.72 82.32
LUZON 252,435 11.16 11.16VISAYAS 337,579 14.92 26.08MINDANAO 1,672,221 73.92 100.00
Area (Ha.) % Share % Cumulative
Philippines 1,290,213 100.00
1 Maguindanao 143,262 11.10 11.102 Cebu 106,505 8.25 19.363 Lanao del Norte 99,397 7.70 27.064 Lanao del Sur 85,382 6.62 33.685 Zamboanga del Sur 66,852 5.18 38.866 Negros Oriental 66,254 5.14 44.007 Davao del Sur 51,453 3.99 47.988 Davao Oriental 44,632 3.46 51.449 Sarangani 42,195 3.27 54.71
10 Masbate 42,150 3.27 57.9811 Zamboanga del Norte 40,983 3.18 61.1612 Bukidnon 37,869 2.94 64.0913 Misamis Oriental 37,860 2.93 67.0314 Negros Occidental 37,780 2.93 69.9615 Leyte 36,856 2.86 72.8116 South Cotabato 32,362 2.51 75.3217 North Cotabato 30,936 2.40 77.7218 Compostela Valley 28,669 2.22 79.9419 Misamis Occidental 26,330 2.04 81.9820 Sultan Kudarat 24,600 1.91 83.89
LUZON 133,437 10.34 10.34VISAYAS 296,978 23.02 33.36MINDANAO 859,798 66.64 100.00
Province
Table 20. WHITE CORN: TOP PRODUCING PROVINCES BASED ON PRODUCTION,
Table 21. WHITE CORN: TOP PRODUCING PROVINCES BASED ON AREA,
Province
PHILIPPINES, 2014
PHILIPPINES, 2014
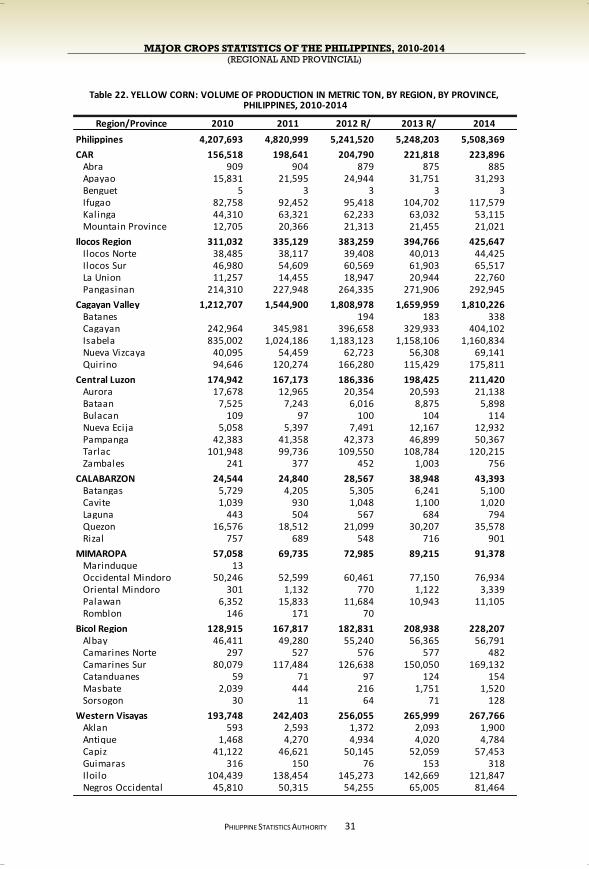
MAJOR CROPS STATISTICS OF THE PHILIPPINES, 2010-2014 (REGIONAL AND PROVINCIAL)
PHILIPPINE STATISTICS AUTHORITY
31
Region/Province 2010 2011 2012 R/ 2013 R/ 2014
Philippines 4,207,693 4,820,999 5,241,520 5,248,203 5,508,369
CAR 156,518 198,641 204,790 221,818 223,896 Abra 909 904 879 875 885 Apayao 15,831 21,595 24,944 31,751 31,293 Benguet 5 3 3 3 3 Ifugao 82,758 92,452 95,418 104,702 117,579 Kalinga 44,310 63,321 62,233 63,032 53,115 Mountain Province 12,705 20,366 21,313 21,455 21,021
Ilocos Region 311,032 335,129 383,259 394,766 425,647 Ilocos Norte 38,485 38,117 39,408 40,013 44,425 Ilocos Sur 46,980 54,609 60,569 61,903 65,517 La Union 11,257 14,455 18,947 20,944 22,760 Pangasinan 214,310 227,948 264,335 271,906 292,945
Cagayan Valley 1,212,707 1,544,900 1,808,978 1,659,959 1,810,226 Batanes 194 183 338 Cagayan 242,964 345,981 396,658 329,933 404,102 Isabela 835,002 1,024,186 1,183,123 1,158,106 1,160,834 Nueva Vizcaya 40,095 54,459 62,723 56,308 69,141 Quirino 94,646 120,274 166,280 115,429 175,811
Central Luzon 174,942 167,173 186,336 198,425 211,420 Aurora 17,678 12,965 20,354 20,593 21,138 Bataan 7,525 7,243 6,016 8,875 5,898 Bulacan 109 97 100 104 114 Nueva Ecija 5,058 5,397 7,491 12,167 12,932 Pampanga 42,383 41,358 42,373 46,899 50,367 Tarlac 101,948 99,736 109,550 108,784 120,215 Zambales 241 377 452 1,003 756
CALABARZON 24,544 24,840 28,567 38,948 43,393 Batangas 5,729 4,205 5,305 6,241 5,100 Cavite 1,039 930 1,048 1,100 1,020 Laguna 443 504 567 684 794 Quezon 16,576 18,512 21,099 30,207 35,578 Rizal 757 689 548 716 901
MIMAROPA 57,058 69,735 72,985 89,215 91,378 Marinduque 13 Occidental Mindoro 50,246 52,599 60,461 77,150 76,934 Oriental Mindoro 301 1,132 770 1,122 3,339 Palawan 6,352 15,833 11,684 10,943 11,105 Romblon 146 171 70
Bicol Region 128,915 167,817 182,831 208,938 228,207 Albay 46,411 49,280 55,240 56,365 56,791 Camarines Norte 297 527 576 577 482 Camarines Sur 80,079 117,484 126,638 150,050 169,132 Catanduanes 59 71 97 124 154 Masbate 2,039 444 216 1,751 1,520 Sorsogon 30 11 64 71 128
Western Visayas 193,748 242,403 256,055 265,999 267,766 Aklan 593 2,593 1,372 2,093 1,900 Antique 1,468 4,270 4,934 4,020 4,784 Capiz 41,122 46,621 50,145 52,059 57,453 Guimaras 316 150 76 153 318 Iloilo 104,439 138,454 145,273 142,669 121,847 Negros Occidental 45,810 50,315 54,255 65,005 81,464
PHILIPPINES, 2010-2014Table 22. YELLOW CORN: VOLUME OF PRODUCTION IN METRIC TON, BY REGION, BY PROVINCE,
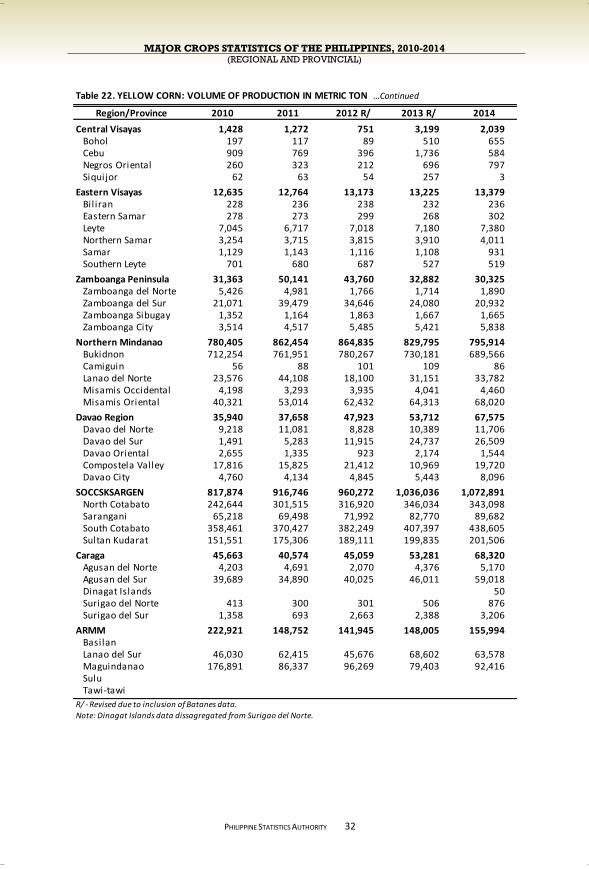
MAJOR CROPS STATISTICS OF THE PHILIPPINES, 2010-2014 (REGIONAL AND PROVINCIAL)
PHILIPPINE STATISTICS AUTHORITY
32
Region/Province 2010 2011 2012 R/ 2013 R/ 2014
Central Visayas 1,428 1,272 751 3,199 2,039 Bohol 197 117 89 510 655 Cebu 909 769 396 1,736 584 Negros Oriental 260 323 212 696 797 Siquijor 62 63 54 257 3
Eastern Visayas 12,635 12,764 13,173 13,225 13,379 Bil iran 228 236 238 232 236 Eastern Samar 278 273 299 268 302 Leyte 7,045 6,717 7,018 7,180 7,380 Northern Samar 3,254 3,715 3,815 3,910 4,011 Samar 1,129 1,143 1,116 1,108 931 Southern Leyte 701 680 687 527 519
Zamboanga Peninsula 31,363 50,141 43,760 32,882 30,325 Zamboanga del Norte 5,426 4,981 1,766 1,714 1,890 Zamboanga del Sur 21,071 39,479 34,646 24,080 20,932 Zamboanga Sibugay 1,352 1,164 1,863 1,667 1,665 Zamboanga City 3,514 4,517 5,485 5,421 5,838
Northern Mindanao 780,405 862,454 864,835 829,795 795,914 Bukidnon 712,254 761,951 780,267 730,181 689,566 Camiguin 56 88 101 109 86 Lanao del Norte 23,576 44,108 18,100 31,151 33,782 Misamis Occidental 4,198 3,293 3,935 4,041 4,460 Misamis Oriental 40,321 53,014 62,432 64,313 68,020
Davao Region 35,940 37,658 47,923 53,712 67,575 Davao del Norte 9,218 11,081 8,828 10,389 11,706 Davao del Sur 1,491 5,283 11,915 24,737 26,509 Davao Oriental 2,655 1,335 923 2,174 1,544 Compostela Valley 17,816 15,825 21,412 10,969 19,720 Davao City 4,760 4,134 4,845 5,443 8,096
SOCCSKSARGEN 817,874 916,746 960,272 1,036,036 1,072,891 North Cotabato 242,644 301,515 316,920 346,034 343,098 Sarangani 65,218 69,498 71,992 82,770 89,682 South Cotabato 358,461 370,427 382,249 407,397 438,605 Sultan Kudarat 151,551 175,306 189,111 199,835 201,506
Caraga 45,663 40,574 45,059 53,281 68,320 Agusan del Norte 4,203 4,691 2,070 4,376 5,170 Agusan del Sur 39,689 34,890 40,025 46,011 59,018 Dinagat Islands 50 Surigao del Norte 413 300 301 506 876 Surigao del Sur 1,358 693 2,663 2,388 3,206
ARMM 222,921 148,752 141,945 148,005 155,994 Basilan Lanao del Sur 46,030 62,415 45,676 68,602 63,578 Maguindanao 176,891 86,337 96,269 79,403 92,416 Sulu Tawi-tawi
R/ - Revised due to inclusion of Batanes data.
Note: Dinagat Islands data dissagregated from Surigao del Norte.
Table 22. YELLOW CORN: VOLUME OF PRODUCTION IN METRIC TON …Continued
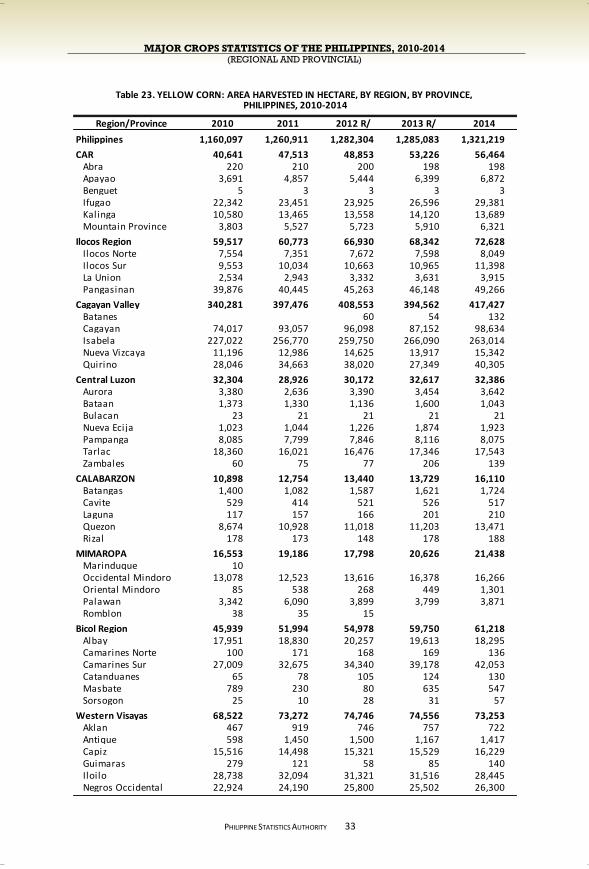
MAJOR CROPS STATISTICS OF THE PHILIPPINES, 2010-2014 (REGIONAL AND PROVINCIAL)
PHILIPPINE STATISTICS AUTHORITY
33
Region/Province 2010 2011 2012 R/ 2013 R/ 2014
Philippines 1,160,097 1,260,911 1,282,304 1,285,083 1,321,219
CAR 40,641 47,513 48,853 53,226 56,464 Abra 220 210 200 198 198 Apayao 3,691 4,857 5,444 6,399 6,872 Benguet 5 3 3 3 3 Ifugao 22,342 23,451 23,925 26,596 29,381 Kalinga 10,580 13,465 13,558 14,120 13,689 Mountain Province 3,803 5,527 5,723 5,910 6,321
Ilocos Region 59,517 60,773 66,930 68,342 72,628 Ilocos Norte 7,554 7,351 7,672 7,598 8,049 Ilocos Sur 9,553 10,034 10,663 10,965 11,398 La Union 2,534 2,943 3,332 3,631 3,915 Pangasinan 39,876 40,445 45,263 46,148 49,266
Cagayan Valley 340,281 397,476 408,553 394,562 417,427 Batanes 60 54 132 Cagayan 74,017 93,057 96,098 87,152 98,634 Isabela 227,022 256,770 259,750 266,090 263,014 Nueva Vizcaya 11,196 12,986 14,625 13,917 15,342 Quirino 28,046 34,663 38,020 27,349 40,305
Central Luzon 32,304 28,926 30,172 32,617 32,386 Aurora 3,380 2,636 3,390 3,454 3,642 Bataan 1,373 1,330 1,136 1,600 1,043 Bulacan 23 21 21 21 21 Nueva Ecija 1,023 1,044 1,226 1,874 1,923 Pampanga 8,085 7,799 7,846 8,116 8,075 Tarlac 18,360 16,021 16,476 17,346 17,543 Zambales 60 75 77 206 139
CALABARZON 10,898 12,754 13,440 13,729 16,110 Batangas 1,400 1,082 1,587 1,621 1,724 Cavite 529 414 521 526 517 Laguna 117 157 166 201 210 Quezon 8,674 10,928 11,018 11,203 13,471 Rizal 178 173 148 178 188
MIMAROPA 16,553 19,186 17,798 20,626 21,438 Marinduque 10 Occidental Mindoro 13,078 12,523 13,616 16,378 16,266 Oriental Mindoro 85 538 268 449 1,301 Palawan 3,342 6,090 3,899 3,799 3,871 Romblon 38 35 15
Bicol Region 45,939 51,994 54,978 59,750 61,218 Albay 17,951 18,830 20,257 19,613 18,295 Camarines Norte 100 171 168 169 136 Camarines Sur 27,009 32,675 34,340 39,178 42,053 Catanduanes 65 78 105 124 130 Masbate 789 230 80 635 547 Sorsogon 25 10 28 31 57
Western Visayas 68,522 73,272 74,746 74,556 73,253 Aklan 467 919 746 757 722 Antique 598 1,450 1,500 1,167 1,417 Capiz 15,516 14,498 15,321 15,529 16,229 Guimaras 279 121 58 85 140 Iloilo 28,738 32,094 31,321 31,516 28,445 Negros Occidental 22,924 24,190 25,800 25,502 26,300
PHILIPPINES, 2010-2014Table 23. YELLOW CORN: AREA HARVESTED IN HECTARE, BY REGION, BY PROVINCE,
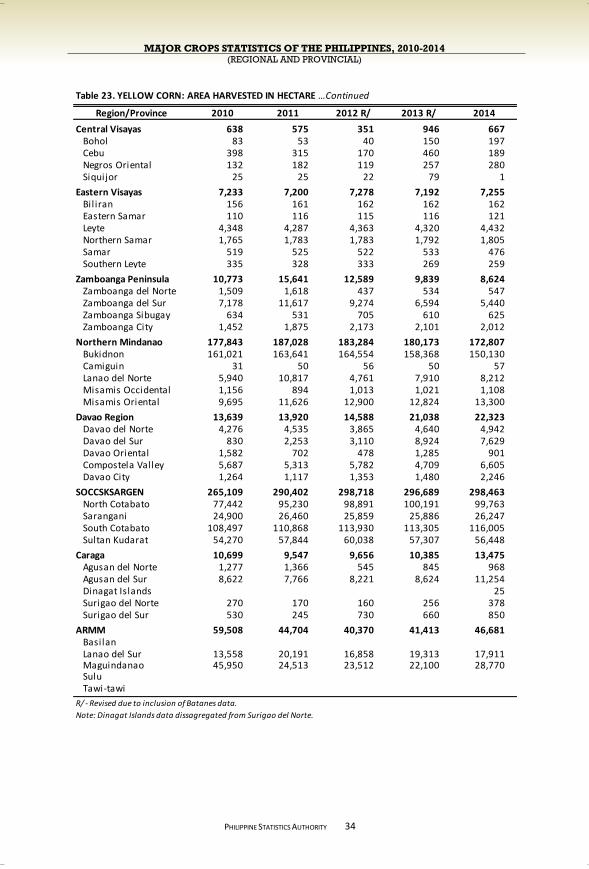
MAJOR CROPS STATISTICS OF THE PHILIPPINES, 2010-2014 (REGIONAL AND PROVINCIAL)
PHILIPPINE STATISTICS AUTHORITY
34
Region/Province 2010 2011 2012 R/ 2013 R/ 2014
Central Visayas 638 575 351 946 667 Bohol 83 53 40 150 197 Cebu 398 315 170 460 189 Negros Oriental 132 182 119 257 280 Siquijor 25 25 22 79 1
Eastern Visayas 7,233 7,200 7,278 7,192 7,255 Bil iran 156 161 162 162 162 Eastern Samar 110 116 115 116 121 Leyte 4,348 4,287 4,363 4,320 4,432 Northern Samar 1,765 1,783 1,783 1,792 1,805 Samar 519 525 522 533 476 Southern Leyte 335 328 333 269 259
Zamboanga Peninsula 10,773 15,641 12,589 9,839 8,624 Zamboanga del Norte 1,509 1,618 437 534 547 Zamboanga del Sur 7,178 11,617 9,274 6,594 5,440 Zamboanga Sibugay 634 531 705 610 625 Zamboanga City 1,452 1,875 2,173 2,101 2,012
Northern Mindanao 177,843 187,028 183,284 180,173 172,807 Bukidnon 161,021 163,641 164,554 158,368 150,130 Camiguin 31 50 56 50 57 Lanao del Norte 5,940 10,817 4,761 7,910 8,212 Misamis Occidental 1,156 894 1,013 1,021 1,108 Misamis Oriental 9,695 11,626 12,900 12,824 13,300
Davao Region 13,639 13,920 14,588 21,038 22,323 Davao del Norte 4,276 4,535 3,865 4,640 4,942 Davao del Sur 830 2,253 3,110 8,924 7,629 Davao Oriental 1,582 702 478 1,285 901 Compostela Valley 5,687 5,313 5,782 4,709 6,605 Davao City 1,264 1,117 1,353 1,480 2,246
SOCCSKSARGEN 265,109 290,402 298,718 296,689 298,463 North Cotabato 77,442 95,230 98,891 100,191 99,763 Sarangani 24,900 26,460 25,859 25,886 26,247 South Cotabato 108,497 110,868 113,930 113,305 116,005 Sultan Kudarat 54,270 57,844 60,038 57,307 56,448
Caraga 10,699 9,547 9,656 10,385 13,475 Agusan del Norte 1,277 1,366 545 845 968 Agusan del Sur 8,622 7,766 8,221 8,624 11,254 Dinagat Islands 25 Surigao del Norte 270 170 160 256 378 Surigao del Sur 530 245 730 660 850
ARMM 59,508 44,704 40,370 41,413 46,681 Basilan Lanao del Sur 13,558 20,191 16,858 19,313 17,911 Maguindanao 45,950 24,513 23,512 22,100 28,770 Sulu Tawi-tawi
R/ - Revised due to inclusion of Batanes data.
Note: Dinagat Islands data dissagregated from Surigao del Norte.
Table 23. YELLOW CORN: AREA HARVESTED IN HECTARE …Continued
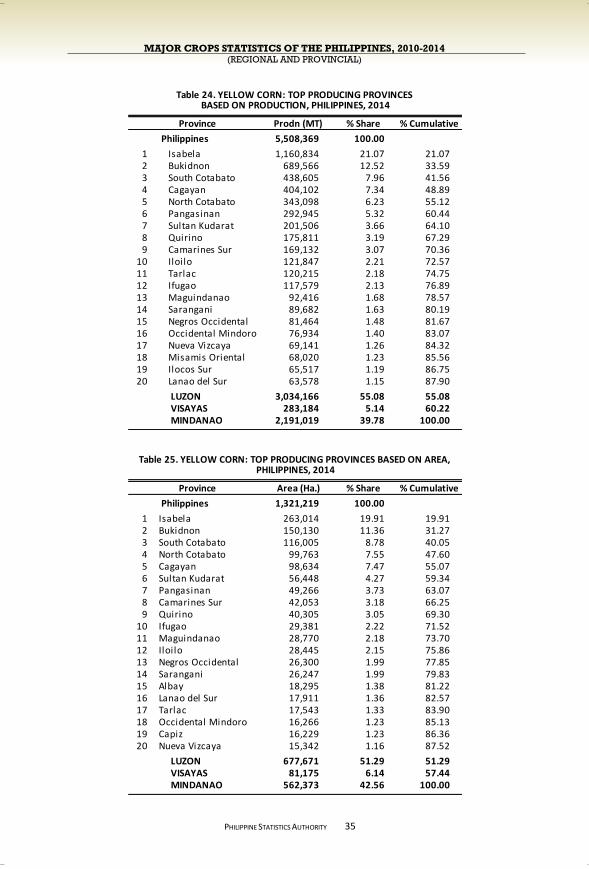
MAJOR CROPS STATISTICS OF THE PHILIPPINES, 2010-2014 (REGIONAL AND PROVINCIAL)
PHILIPPINE STATISTICS AUTHORITY
35
Prodn (MT) % Share % Cumulative
Philippines 5,508,369 100.00
1 Isabela 1,160,834 21.07 21.072 Bukidnon 689,566 12.52 33.593 South Cotabato 438,605 7.96 41.564 Cagayan 404,102 7.34 48.895 North Cotabato 343,098 6.23 55.126 Pangasinan 292,945 5.32 60.447 Sultan Kudarat 201,506 3.66 64.108 Quirino 175,811 3.19 67.299 Camarines Sur 169,132 3.07 70.36
10 Iloilo 121,847 2.21 72.5711 Tarlac 120,215 2.18 74.7512 Ifugao 117,579 2.13 76.8913 Maguindanao 92,416 1.68 78.5714 Sarangani 89,682 1.63 80.1915 Negros Occidental 81,464 1.48 81.6716 Occidental Mindoro 76,934 1.40 83.0717 Nueva Vizcaya 69,141 1.26 84.3218 Misamis Oriental 68,020 1.23 85.5619 Ilocos Sur 65,517 1.19 86.7520 Lanao del Sur 63,578 1.15 87.90
LUZON 3,034,166 55.08 55.08VISAYAS 283,184 5.14 60.22MINDANAO 2,191,019 39.78 100.00
Area (Ha.) % Share % Cumulative
Philippines 1,321,219 100.00
1 Isabela 263,014 19.91 19.912 Bukidnon 150,130 11.36 31.273 South Cotabato 116,005 8.78 40.054 North Cotabato 99,763 7.55 47.605 Cagayan 98,634 7.47 55.076 Sultan Kudarat 56,448 4.27 59.347 Pangasinan 49,266 3.73 63.078 Camarines Sur 42,053 3.18 66.259 Quirino 40,305 3.05 69.30
10 Ifugao 29,381 2.22 71.5211 Maguindanao 28,770 2.18 73.7012 Iloilo 28,445 2.15 75.8613 Negros Occidental 26,300 1.99 77.8514 Sarangani 26,247 1.99 79.8315 Albay 18,295 1.38 81.2216 Lanao del Sur 17,911 1.36 82.5717 Tarlac 17,543 1.33 83.9018 Occidental Mindoro 16,266 1.23 85.1319 Capiz 16,229 1.23 86.3620 Nueva Vizcaya 15,342 1.16 87.52
LUZON 677,671 51.29 51.29VISAYAS 81,175 6.14 57.44MINDANAO 562,373 42.56 100.00
Province
Table 24. YELLOW CORN: TOP PRODUCING PROVINCES
Table 25. YELLOW CORN: TOP PRODUCING PROVINCES BASED ON AREA,
Province
PHILIPPINES, 2014
BASED ON PRODUCTION, PHILIPPINES, 2014
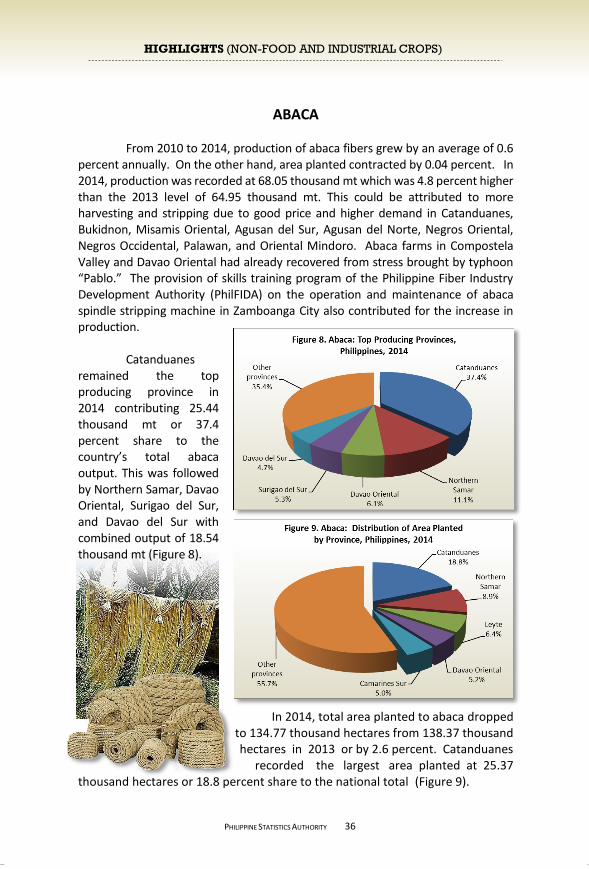
MAJOR CROPS STATISTICS OF THE PHILIPPINES, 2010-2014 (REGIONAL AND PROVINCIAL)
PHILIPPINE STATISTICS AUTHORITY
ABACA
From 2010 to 2014, production of abaca fibers grew by an average of 0.6 percent annually. On the other hand, area planted contracted by 0.04 percent. In 2014, production was recorded at 68.05 thousand mt which was 4.8 percent higher than the 2013 level of 64.95 thousand mt. This could be attributed to more harvesting and stripping due to good price and higher demand in Catanduanes, Bukidnon, Misamis Oriental, Agusan del Sur, Agusan del Norte, Negros Oriental, Negros Occidental, Palawan, and Oriental Mindoro. Abaca farms in Compostela Valley and Davao Oriental had already recovered from stress brought by typhoon “Pablo.” The provision of skills training program of the Philippine Fiber Industry Development Authority (PhilFIDA) on the operation and maintenance of abaca spindle stripping machine in Zamboanga City also contributed for the increase in production.
Catanduanes
remained the top producing province in 2014 contributing 25.44 thousand mt or 37.4 percent share to the country’s total abaca output. This was followed by Northern Samar, Davao Oriental, Surigao del Sur, and Davao del Sur with combined output of 18.54 thousand mt (Figure 8).
In 2014, total area planted to abaca dropped to 134.77 thousand hectares from 138.37 thousand hectares in 2013 or by 2.6 percent. Catanduanes
recorded the largest area planted at 25.37 thousand hectares or 18.8 percent share to the national total (Figure 9).
36
HIGHLIGHTS (NON-FOOD AND INDUSTRIAL CROPS)
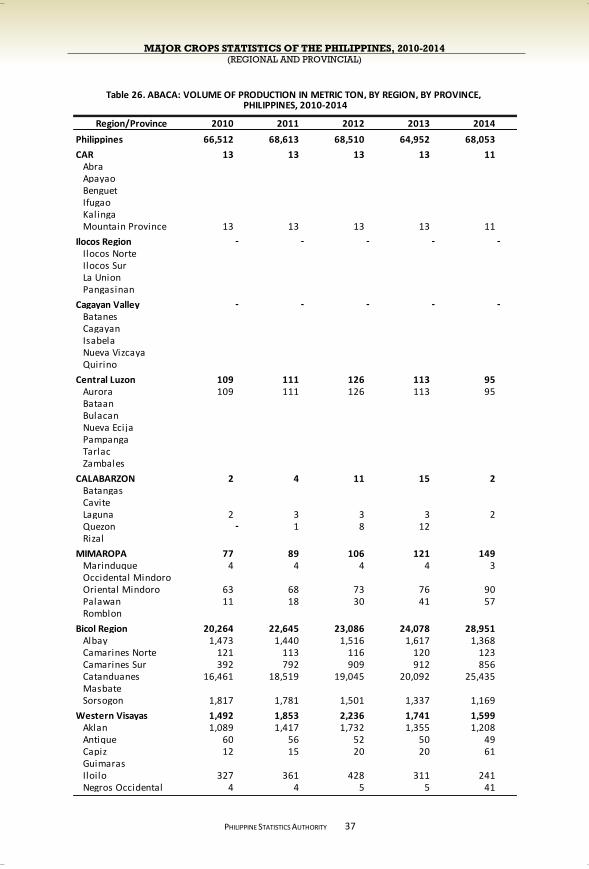
MAJOR CROPS STATISTICS OF THE PHILIPPINES, 2010-2014 (REGIONAL AND PROVINCIAL)
PHILIPPINE STATISTICS AUTHORITY
37
Region/Province 2010 2011 2012 2013 2014
Philippines 66,512 68,613 68,510 64,952 68,053
CAR 13 13 13 13 11 Abra Apayao Benguet Ifugao Kalinga Mountain Province 13 13 13 13 11
Ilocos Region - - - - - Ilocos Norte Ilocos Sur La Union Pangasinan
Cagayan Valley - - - - - Batanes Cagayan Isabela Nueva Vizcaya Quirino
Central Luzon 109 111 126 113 95 Aurora 109 111 126 113 95 Bataan Bulacan Nueva Ecija Pampanga Tarlac Zambales
CALABARZON 2 4 11 15 2 Batangas Cavite Laguna 2 3 3 3 2 Quezon - 1 8 12 Rizal
MIMAROPA 77 89 106 121 149 Marinduque 4 4 4 4 3 Occidental Mindoro Oriental Mindoro 63 68 73 76 90 Palawan 11 18 30 41 57 Romblon
Bicol Region 20,264 22,645 23,086 24,078 28,951 Albay 1,473 1,440 1,516 1,617 1,368 Camarines Norte 121 113 116 120 123 Camarines Sur 392 792 909 912 856 Catanduanes 16,461 18,519 19,045 20,092 25,435 Masbate Sorsogon 1,817 1,781 1,501 1,337 1,169
Western Visayas 1,492 1,853 2,236 1,741 1,599 Aklan 1,089 1,417 1,732 1,355 1,208 Antique 60 56 52 50 49 Capiz 12 15 20 20 61 Guimaras Iloilo 327 361 428 311 241 Negros Occidental 4 4 5 5 41
PHILIPPINES, 2010-2014Table 26. ABACA: VOLUME OF PRODUCTION IN METRIC TON, BY REGION, BY PROVINCE,
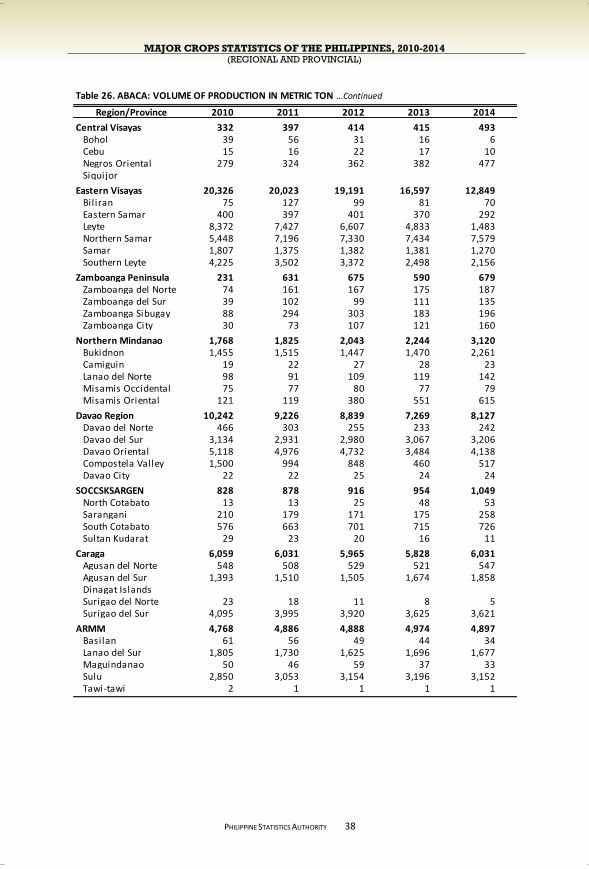
MAJOR CROPS STATISTICS OF THE PHILIPPINES, 2010-2014 (REGIONAL AND PROVINCIAL)
PHILIPPINE STATISTICS AUTHORITY
38
Region/Province 2010 2011 2012 2013 2014
Central Visayas 332 397 414 415 493 Bohol 39 56 31 16 6 Cebu 15 16 22 17 10 Negros Oriental 279 324 362 382 477 Siquijor
Eastern Visayas 20,326 20,023 19,191 16,597 12,849 Bil iran 75 127 99 81 70 Eastern Samar 400 397 401 370 292 Leyte 8,372 7,427 6,607 4,833 1,483 Northern Samar 5,448 7,196 7,330 7,434 7,579 Samar 1,807 1,375 1,382 1,381 1,270 Southern Leyte 4,225 3,502 3,372 2,498 2,156
Zamboanga Peninsula 231 631 675 590 679 Zamboanga del Norte 74 161 167 175 187 Zamboanga del Sur 39 102 99 111 135 Zamboanga Sibugay 88 294 303 183 196 Zamboanga City 30 73 107 121 160
Northern Mindanao 1,768 1,825 2,043 2,244 3,120 Bukidnon 1,455 1,515 1,447 1,470 2,261 Camiguin 19 22 27 28 23 Lanao del Norte 98 91 109 119 142 Misamis Occidental 75 77 80 77 79 Misamis Oriental 121 119 380 551 615
Davao Region 10,242 9,226 8,839 7,269 8,127 Davao del Norte 466 303 255 233 242 Davao del Sur 3,134 2,931 2,980 3,067 3,206 Davao Oriental 5,118 4,976 4,732 3,484 4,138 Compostela Valley 1,500 994 848 460 517 Davao City 22 22 25 24 24
SOCCSKSARGEN 828 878 916 954 1,049 North Cotabato 13 13 25 48 53 Sarangani 210 179 171 175 258 South Cotabato 576 663 701 715 726 Sultan Kudarat 29 23 20 16 11
Caraga 6,059 6,031 5,965 5,828 6,031 Agusan del Norte 548 508 529 521 547 Agusan del Sur 1,393 1,510 1,505 1,674 1,858 Dinagat Islands Surigao del Norte 23 18 11 8 5 Surigao del Sur 4,095 3,995 3,920 3,625 3,621
ARMM 4,768 4,886 4,888 4,974 4,897 Basilan 61 56 49 44 34 Lanao del Sur 1,805 1,730 1,625 1,696 1,677 Maguindanao 50 46 59 37 33 Sulu 2,850 3,053 3,154 3,196 3,152 Tawi-tawi 2 1 1 1 1
Table 26. ABACA: VOLUME OF PRODUCTION IN METRIC TON …Continued

MAJOR CROPS STATISTICS OF THE PHILIPPINES, 2010-2014 (REGIONAL AND PROVINCIAL)
PHILIPPINE STATISTICS AUTHORITY
39
Region/Province 2010 2011 2012 2013 2014
Philippines 135,090 138,991 138,523 138,369 134,773
CAR 579 579 550 499 481 Abra Apayao Benguet Ifugao Kalinga Mountain Province 579 579 550 499 481
Ilocos Region - - - - - Ilocos Norte Ilocos Sur La Union Pangasinan
Cagayan Valley - - - - - Batanes Cagayan Isabela Nueva Vizcaya Quirino
Central Luzon 520 529 534 543 600 Aurora 520 529 534 543 600 Bataan Bulacan Nueva Ecija Pampanga Tarlac Zambales
CALABARZON 251 345 352 331 331 Batangas Cavite Laguna 58 58 58 58 58 Quezon 172 266 273 273 273 Rizal 21 21 21
MIMAROPA 1,183 1,369 1,409 1,434 1,424 Marinduque 71 71 71 71 61 Occidental Mindoro Oriental Mindoro 692 698 698 723 723 Palawan 420 600 640 640 640 Romblon
Bicol Region 41,748 42,864 42,171 44,509 45,254 Albay 5,300 5,300 5,400 5,500 5,500 Camarines Norte 1,023 1,010 1,025 1,025 1,025 Camarines Sur 6,679 6,679 6,712 6,712 6,712 Catanduanes 22,384 22,384 22,384 24,622 25,367 Masbate Sorsogon 6,362 7,491 6,650 6,650 6,650
Western Visayas 3,903 6,562 6,567 6,530 6,334 Aklan 1,546 4,208 4,208 4,208 4,016 Antique 940 920 915 895 860 Capiz 175 175 185 185 210 Guimaras Iloilo 1,213 1,230 1,230 1,213 1,213 Negros Occidental 29 29 29 29 35
BY PROVINCE, PHILIPPINES, 2010-2014Table 27. ABACA: AREA PLANTED IN HECTARE, BY REGION, BY PROVINCE,
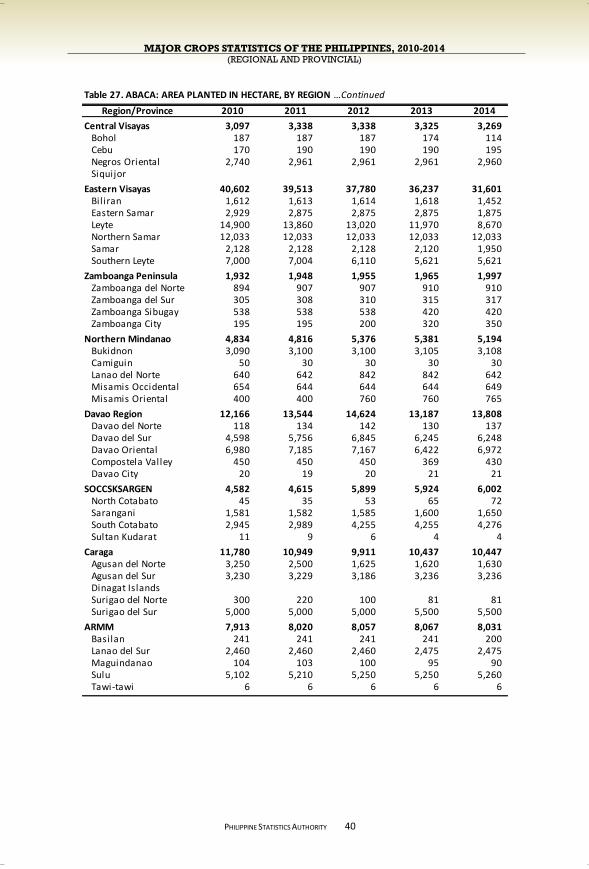
MAJOR CROPS STATISTICS OF THE PHILIPPINES, 2010-2014 (REGIONAL AND PROVINCIAL)
PHILIPPINE STATISTICS AUTHORITY
40
Region/Province 2010 2011 2012 2013 2014
Central Visayas 3,097 3,338 3,338 3,325 3,269 Bohol 187 187 187 174 114 Cebu 170 190 190 190 195 Negros Oriental 2,740 2,961 2,961 2,961 2,960 Siquijor
Eastern Visayas 40,602 39,513 37,780 36,237 31,601 Bil iran 1,612 1,613 1,614 1,618 1,452 Eastern Samar 2,929 2,875 2,875 2,875 1,875 Leyte 14,900 13,860 13,020 11,970 8,670 Northern Samar 12,033 12,033 12,033 12,033 12,033 Samar 2,128 2,128 2,128 2,120 1,950 Southern Leyte 7,000 7,004 6,110 5,621 5,621
Zamboanga Peninsula 1,932 1,948 1,955 1,965 1,997 Zamboanga del Norte 894 907 907 910 910 Zamboanga del Sur 305 308 310 315 317 Zamboanga Sibugay 538 538 538 420 420 Zamboanga City 195 195 200 320 350
Northern Mindanao 4,834 4,816 5,376 5,381 5,194 Bukidnon 3,090 3,100 3,100 3,105 3,108 Camiguin 50 30 30 30 30 Lanao del Norte 640 642 842 842 642 Misamis Occidental 654 644 644 644 649 Misamis Oriental 400 400 760 760 765
Davao Region 12,166 13,544 14,624 13,187 13,808 Davao del Norte 118 134 142 130 137 Davao del Sur 4,598 5,756 6,845 6,245 6,248 Davao Oriental 6,980 7,185 7,167 6,422 6,972 Compostela Valley 450 450 450 369 430 Davao City 20 19 20 21 21
SOCCSKSARGEN 4,582 4,615 5,899 5,924 6,002 North Cotabato 45 35 53 65 72 Sarangani 1,581 1,582 1,585 1,600 1,650 South Cotabato 2,945 2,989 4,255 4,255 4,276 Sultan Kudarat 11 9 6 4 4
Caraga 11,780 10,949 9,911 10,437 10,447 Agusan del Norte 3,250 2,500 1,625 1,620 1,630 Agusan del Sur 3,230 3,229 3,186 3,236 3,236 Dinagat Islands Surigao del Norte 300 220 100 81 81 Surigao del Sur 5,000 5,000 5,000 5,500 5,500
ARMM 7,913 8,020 8,057 8,067 8,031 Basilan 241 241 241 241 200 Lanao del Sur 2,460 2,460 2,460 2,475 2,475 Maguindanao 104 103 100 95 90 Sulu 5,102 5,210 5,250 5,250 5,260 Tawi-tawi 6 6 6 6 6
Table 27. ABACA: AREA PLANTED IN HECTARE, BY REGION …Continued
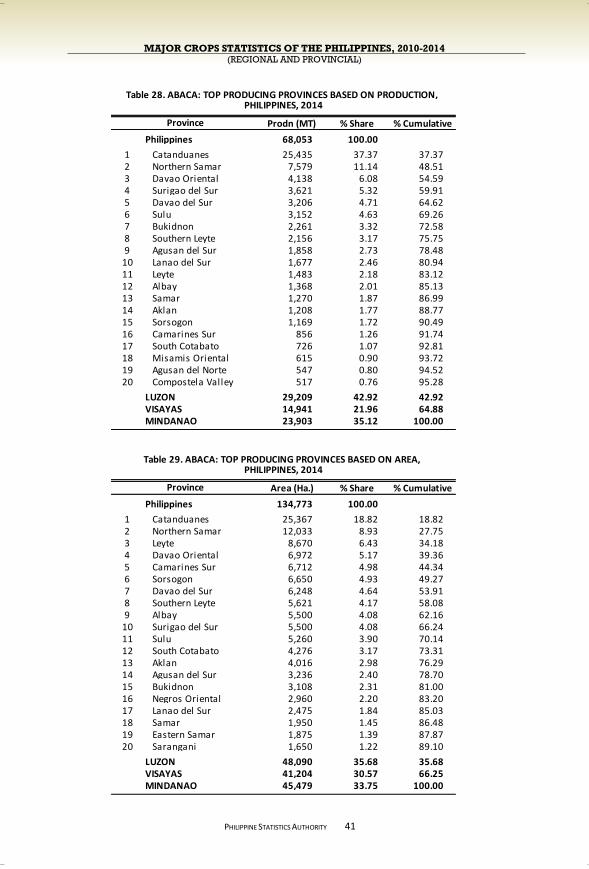
MAJOR CROPS STATISTICS OF THE PHILIPPINES, 2010-2014 (REGIONAL AND PROVINCIAL)
PHILIPPINE STATISTICS AUTHORITY
41
Prodn (MT) % Share % Cumulative
Philippines 68,053 100.00
1 Catanduanes 25,435 37.37 37.372 Northern Samar 7,579 11.14 48.513 Davao Oriental 4,138 6.08 54.594 Surigao del Sur 3,621 5.32 59.915 Davao del Sur 3,206 4.71 64.626 Sulu 3,152 4.63 69.267 Bukidnon 2,261 3.32 72.588 Southern Leyte 2,156 3.17 75.759 Agusan del Sur 1,858 2.73 78.48
10 Lanao del Sur 1,677 2.46 80.9411 Leyte 1,483 2.18 83.1212 Albay 1,368 2.01 85.1313 Samar 1,270 1.87 86.9914 Aklan 1,208 1.77 88.7715 Sorsogon 1,169 1.72 90.4916 Camarines Sur 856 1.26 91.7417 South Cotabato 726 1.07 92.8118 Misamis Oriental 615 0.90 93.7219 Agusan del Norte 547 0.80 94.5220 Compostela Valley 517 0.76 95.28
LUZON 29,209 42.92 42.92VISAYAS 14,941 21.96 64.88MINDANAO 23,903 35.12 100.00
Area (Ha.) % Share % Cumulative
Philippines 134,773 100.00
1 Catanduanes 25,367 18.82 18.822 Northern Samar 12,033 8.93 27.753 Leyte 8,670 6.43 34.184 Davao Oriental 6,972 5.17 39.365 Camarines Sur 6,712 4.98 44.346 Sorsogon 6,650 4.93 49.277 Davao del Sur 6,248 4.64 53.918 Southern Leyte 5,621 4.17 58.089 Albay 5,500 4.08 62.16
10 Surigao del Sur 5,500 4.08 66.2411 Sulu 5,260 3.90 70.1412 South Cotabato 4,276 3.17 73.3113 Aklan 4,016 2.98 76.2914 Agusan del Sur 3,236 2.40 78.7015 Bukidnon 3,108 2.31 81.0016 Negros Oriental 2,960 2.20 83.2017 Lanao del Sur 2,475 1.84 85.0318 Samar 1,950 1.45 86.4819 Eastern Samar 1,875 1.39 87.8720 Sarangani 1,650 1.22 89.10
LUZON 48,090 35.68 35.68VISAYAS 41,204 30.57 66.25MINDANAO 45,479 33.75 100.00
Province
Table 28. ABACA: TOP PRODUCING PROVINCES BASED ON PRODUCTION,
Table 29. ABACA: TOP PRODUCING PROVINCES BASED ON AREA,
Province
PHILIPPINES, 2014
PHILIPPINES, 2014
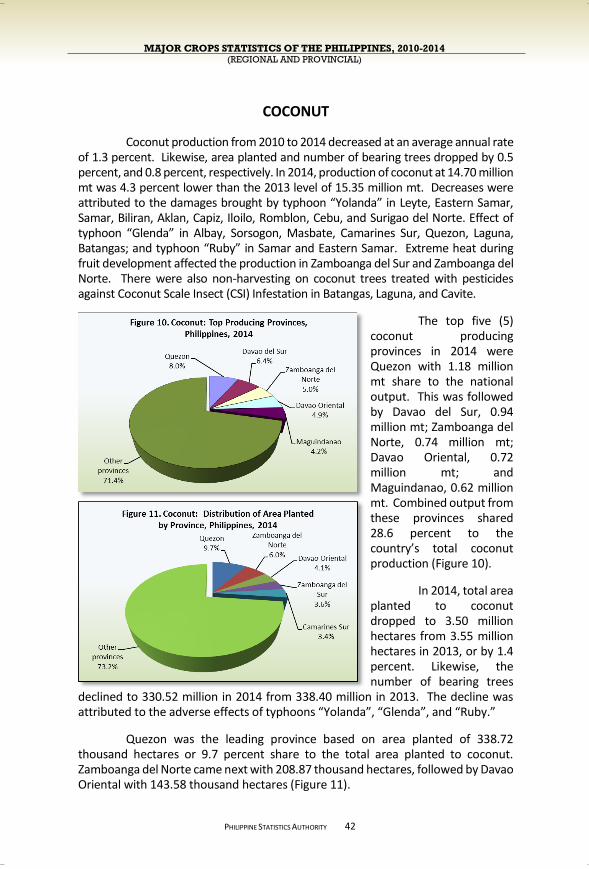
MAJOR CROPS STATISTICS OF THE PHILIPPINES, 2010-2014 (REGIONAL AND PROVINCIAL)
PHILIPPINE STATISTICS AUTHORITY
COCONUT
Coconut production from 2010 to 2014 decreased at an average annual rate of 1.3 percent. Likewise, area planted and number of bearing trees dropped by 0.5 percent, and 0.8 percent, respectively. In 2014, production of coconut at 14.70 million mt was 4.3 percent lower than the 2013 level of 15.35 million mt. Decreases were attributed to the damages brought by typhoon “Yolanda” in Leyte, Eastern Samar, Samar, Biliran, Aklan, Capiz, Iloilo, Romblon, Cebu, and Surigao del Norte. Effect of typhoon “Glenda” in Albay, Sorsogon, Masbate, Camarines Sur, Quezon, Laguna, Batangas; and typhoon “Ruby” in Samar and Eastern Samar. Extreme heat during fruit development affected the production in Zamboanga del Sur and Zamboanga del Norte. There were also non-harvesting on coconut trees treated with pesticides against Coconut Scale Insect (CSI) Infestation in Batangas, Laguna, and Cavite.
The top five (5)
coconut producing provinces in 2014 were Quezon with 1.18 million mt share to the national output. This was followed by Davao del Sur, 0.94 million mt; Zamboanga del Norte, 0.74 million mt; Davao Oriental, 0.72 million mt; and Maguindanao, 0.62 million mt. Combined output from these provinces shared 28.6 percent to the country’s total coconut production (Figure 10).
In 2014, total area
planted to coconut dropped to 3.50 million hectares from 3.55 million hectares in 2013, or by 1.4 percent. Likewise, the number of bearing trees
declined to 330.52 million in 2014 from 338.40 million in 2013. The decline was attributed to the adverse effects of typhoons “Yolanda”, “Glenda”, and “Ruby.”
Quezon was the leading province based on area planted of 338.72
thousand hectares or 9.7 percent share to the total area planted to coconut. Zamboanga del Norte came next with 208.87 thousand hectares, followed by Davao Oriental with 143.58 thousand hectares (Figure 11).
42
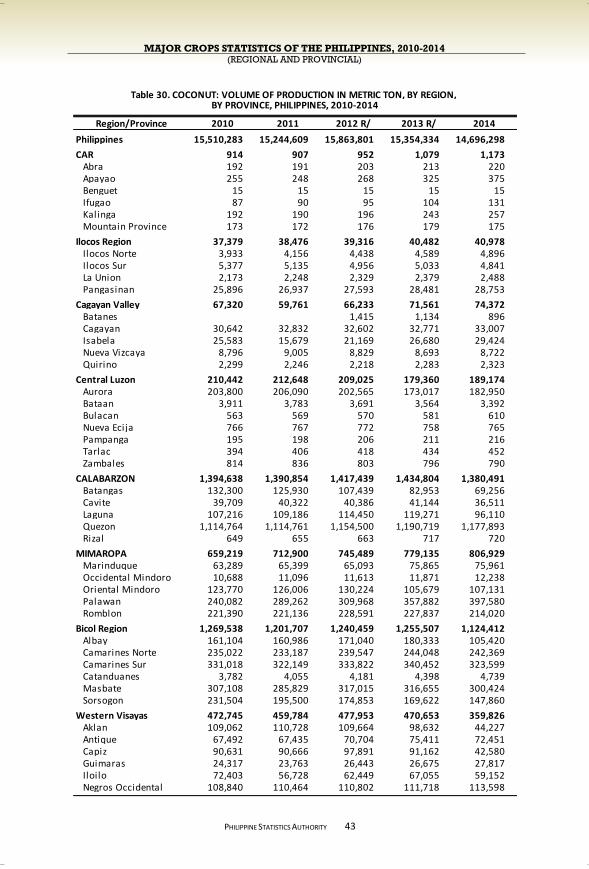
MAJOR CROPS STATISTICS OF THE PHILIPPINES, 2010-2014 (REGIONAL AND PROVINCIAL)
PHILIPPINE STATISTICS AUTHORITY
43
Region/Province 2010 2011 2012 R/ 2013 R/ 2014
Philippines 15,510,283 15,244,609 15,863,801 15,354,334 14,696,298
CAR 914 907 952 1,079 1,173 Abra 192 191 203 213 220 Apayao 255 248 268 325 375 Benguet 15 15 15 15 15 Ifugao 87 90 95 104 131 Kalinga 192 190 196 243 257 Mountain Province 173 172 176 179 175
Ilocos Region 37,379 38,476 39,316 40,482 40,978 Ilocos Norte 3,933 4,156 4,438 4,589 4,896 Ilocos Sur 5,377 5,135 4,956 5,033 4,841 La Union 2,173 2,248 2,329 2,379 2,488 Pangasinan 25,896 26,937 27,593 28,481 28,753
Cagayan Valley 67,320 59,761 66,233 71,561 74,372 Batanes 1,415 1,134 896 Cagayan 30,642 32,832 32,602 32,771 33,007 Isabela 25,583 15,679 21,169 26,680 29,424 Nueva Vizcaya 8,796 9,005 8,829 8,693 8,722 Quirino 2,299 2,246 2,218 2,283 2,323
Central Luzon 210,442 212,648 209,025 179,360 189,174 Aurora 203,800 206,090 202,565 173,017 182,950 Bataan 3,911 3,783 3,691 3,564 3,392 Bulacan 563 569 570 581 610 Nueva Ecija 766 767 772 758 765 Pampanga 195 198 206 211 216 Tarlac 394 406 418 434 452 Zambales 814 836 803 796 790
CALABARZON 1,394,638 1,390,854 1,417,439 1,434,804 1,380,491 Batangas 132,300 125,930 107,439 82,953 69,256 Cavite 39,709 40,322 40,386 41,144 36,511 Laguna 107,216 109,186 114,450 119,271 96,110 Quezon 1,114,764 1,114,761 1,154,500 1,190,719 1,177,893 Rizal 649 655 663 717 720
MIMAROPA 659,219 712,900 745,489 779,135 806,929 Marinduque 63,289 65,399 65,093 75,865 75,961 Occidental Mindoro 10,688 11,096 11,613 11,871 12,238 Oriental Mindoro 123,770 126,006 130,224 105,679 107,131 Palawan 240,082 289,262 309,968 357,882 397,580 Romblon 221,390 221,136 228,591 227,837 214,020
Bicol Region 1,269,538 1,201,707 1,240,459 1,255,507 1,124,412 Albay 161,104 160,986 171,040 180,333 105,420 Camarines Norte 235,022 233,187 239,547 244,048 242,369 Camarines Sur 331,018 322,149 333,822 340,452 323,599 Catanduanes 3,782 4,055 4,181 4,398 4,739 Masbate 307,108 285,829 317,015 316,655 300,424 Sorsogon 231,504 195,500 174,853 169,622 147,860
Western Visayas 472,745 459,784 477,953 470,653 359,826 Aklan 109,062 110,728 109,664 98,632 44,227 Antique 67,492 67,435 70,704 75,411 72,451 Capiz 90,631 90,666 97,891 91,162 42,580 Guimaras 24,317 23,763 26,443 26,675 27,817 Iloilo 72,403 56,728 62,449 67,055 59,152 Negros Occidental 108,840 110,464 110,802 111,718 113,598
BY PROVINCE, PHILIPPINES, 2010-2014Table 30. COCONUT: VOLUME OF PRODUCTION IN METRIC TON, BY REGION,
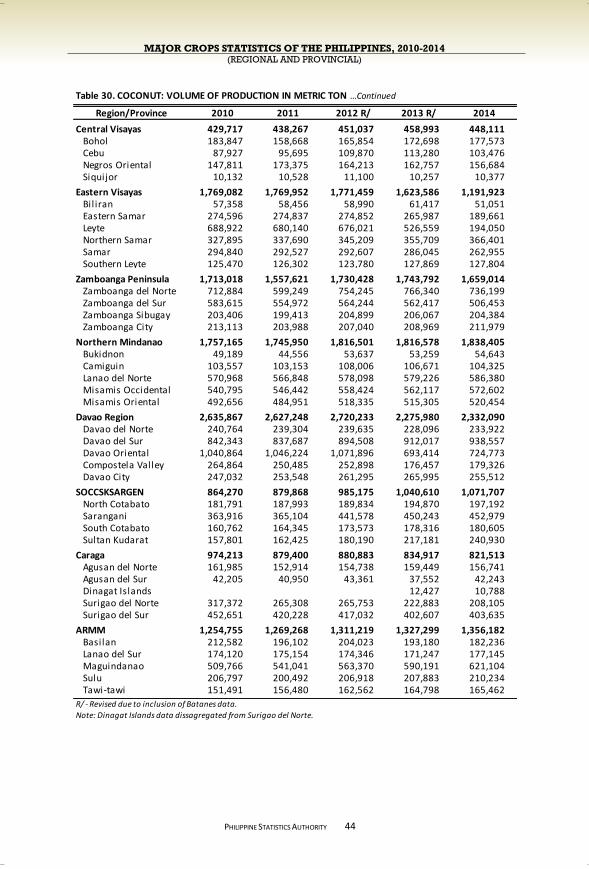
MAJOR CROPS STATISTICS OF THE PHILIPPINES, 2010-2014 (REGIONAL AND PROVINCIAL)
PHILIPPINE STATISTICS AUTHORITY
44
Region/Province 2010 2011 2012 R/ 2013 R/ 2014
Central Visayas 429,717 438,267 451,037 458,993 448,111 Bohol 183,847 158,668 165,854 172,698 177,573 Cebu 87,927 95,695 109,870 113,280 103,476 Negros Oriental 147,811 173,375 164,213 162,757 156,684 Siquijor 10,132 10,528 11,100 10,257 10,377
Eastern Visayas 1,769,082 1,769,952 1,771,459 1,623,586 1,191,923 Bil iran 57,358 58,456 58,990 61,417 51,051 Eastern Samar 274,596 274,837 274,852 265,987 189,661 Leyte 688,922 680,140 676,021 526,559 194,050 Northern Samar 327,895 337,690 345,209 355,709 366,401 Samar 294,840 292,527 292,607 286,045 262,955 Southern Leyte 125,470 126,302 123,780 127,869 127,804
Zamboanga Peninsula 1,713,018 1,557,621 1,730,428 1,743,792 1,659,014 Zamboanga del Norte 712,884 599,249 754,245 766,340 736,199 Zamboanga del Sur 583,615 554,972 564,244 562,417 506,453 Zamboanga Sibugay 203,406 199,413 204,899 206,067 204,384 Zamboanga City 213,113 203,988 207,040 208,969 211,979
Northern Mindanao 1,757,165 1,745,950 1,816,501 1,816,578 1,838,405 Bukidnon 49,189 44,556 53,637 53,259 54,643 Camiguin 103,557 103,153 108,006 106,671 104,325 Lanao del Norte 570,968 566,848 578,098 579,226 586,380 Misamis Occidental 540,795 546,442 558,424 562,117 572,602 Misamis Oriental 492,656 484,951 518,335 515,305 520,454
Davao Region 2,635,867 2,627,248 2,720,233 2,275,980 2,332,090 Davao del Norte 240,764 239,304 239,635 228,096 233,922 Davao del Sur 842,343 837,687 894,508 912,017 938,557 Davao Oriental 1,040,864 1,046,224 1,071,896 693,414 724,773 Compostela Valley 264,864 250,485 252,898 176,457 179,326 Davao City 247,032 253,548 261,295 265,995 255,512
SOCCSKSARGEN 864,270 879,868 985,175 1,040,610 1,071,707 North Cotabato 181,791 187,993 189,834 194,870 197,192 Sarangani 363,916 365,104 441,578 450,243 452,979 South Cotabato 160,762 164,345 173,573 178,316 180,605 Sultan Kudarat 157,801 162,425 180,190 217,181 240,930
Caraga 974,213 879,400 880,883 834,917 821,513 Agusan del Norte 161,985 152,914 154,738 159,449 156,741 Agusan del Sur 42,205 40,950 43,361 37,552 42,243 Dinagat Islands 12,427 10,788 Surigao del Norte 317,372 265,308 265,753 222,883 208,105 Surigao del Sur 452,651 420,228 417,032 402,607 403,635
ARMM 1,254,755 1,269,268 1,311,219 1,327,299 1,356,182 Basilan 212,582 196,102 204,023 193,180 182,236 Lanao del Sur 174,120 175,154 174,346 171,247 177,145 Maguindanao 509,766 541,041 563,370 590,191 621,104 Sulu 206,797 200,492 206,918 207,883 210,234 Tawi-tawi 151,491 156,480 162,562 164,798 165,462
R/ - Revised due to inclusion of Batanes data.
Note: Dinagat Islands data dissagregated from Surigao del Norte.
Table 30. COCONUT: VOLUME OF PRODUCTION IN METRIC TON …Continued
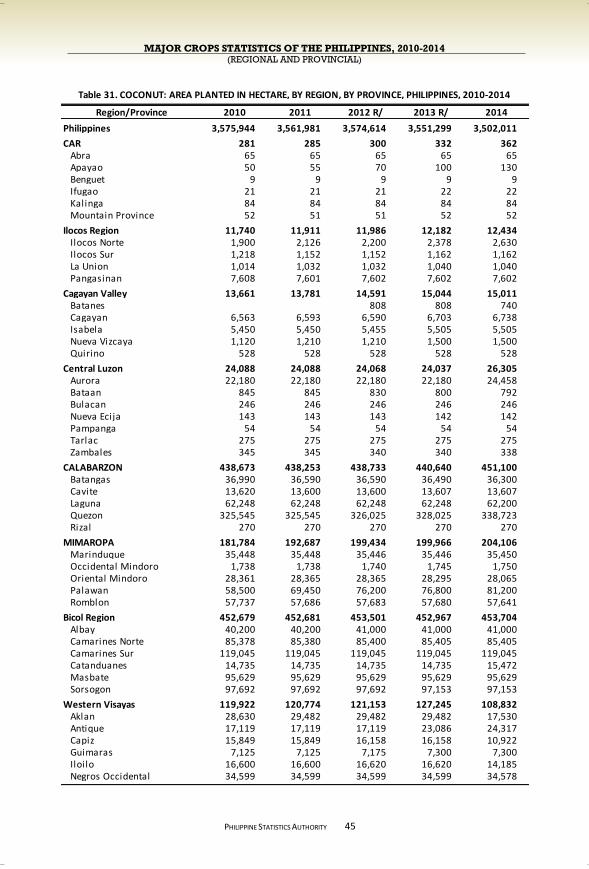
MAJOR CROPS STATISTICS OF THE PHILIPPINES, 2010-2014 (REGIONAL AND PROVINCIAL)
PHILIPPINE STATISTICS AUTHORITY
45
Region/Province 2010 2011 2012 R/ 2013 R/ 2014
Philippines 3,575,944 3,561,981 3,574,614 3,551,299 3,502,011
CAR 281 285 300 332 362 Abra 65 65 65 65 65 Apayao 50 55 70 100 130 Benguet 9 9 9 9 9 Ifugao 21 21 21 22 22 Kalinga 84 84 84 84 84 Mountain Province 52 51 51 52 52
Ilocos Region 11,740 11,911 11,986 12,182 12,434 Ilocos Norte 1,900 2,126 2,200 2,378 2,630 Ilocos Sur 1,218 1,152 1,152 1,162 1,162 La Union 1,014 1,032 1,032 1,040 1,040 Pangasinan 7,608 7,601 7,602 7,602 7,602
Cagayan Valley 13,661 13,781 14,591 15,044 15,011 Batanes 808 808 740 Cagayan 6,563 6,593 6,590 6,703 6,738 Isabela 5,450 5,450 5,455 5,505 5,505 Nueva Vizcaya 1,120 1,210 1,210 1,500 1,500 Quirino 528 528 528 528 528
Central Luzon 24,088 24,088 24,068 24,037 26,305 Aurora 22,180 22,180 22,180 22,180 24,458 Bataan 845 845 830 800 792 Bulacan 246 246 246 246 246 Nueva Ecija 143 143 143 142 142 Pampanga 54 54 54 54 54 Tarlac 275 275 275 275 275 Zambales 345 345 340 340 338
CALABARZON 438,673 438,253 438,733 440,640 451,100 Batangas 36,990 36,590 36,590 36,490 36,300 Cavite 13,620 13,600 13,600 13,607 13,607 Laguna 62,248 62,248 62,248 62,248 62,200 Quezon 325,545 325,545 326,025 328,025 338,723 Rizal 270 270 270 270 270
MIMAROPA 181,784 192,687 199,434 199,966 204,106 Marinduque 35,448 35,448 35,446 35,446 35,450 Occidental Mindoro 1,738 1,738 1,740 1,745 1,750 Oriental Mindoro 28,361 28,365 28,365 28,295 28,065 Palawan 58,500 69,450 76,200 76,800 81,200 Romblon 57,737 57,686 57,683 57,680 57,641
Bicol Region 452,679 452,681 453,501 452,967 453,704 Albay 40,200 40,200 41,000 41,000 41,000 Camarines Norte 85,378 85,380 85,400 85,405 85,405 Camarines Sur 119,045 119,045 119,045 119,045 119,045 Catanduanes 14,735 14,735 14,735 14,735 15,472 Masbate 95,629 95,629 95,629 95,629 95,629 Sorsogon 97,692 97,692 97,692 97,153 97,153
Western Visayas 119,922 120,774 121,153 127,245 108,832 Aklan 28,630 29,482 29,482 29,482 17,530 Antique 17,119 17,119 17,119 23,086 24,317 Capiz 15,849 15,849 16,158 16,158 10,922 Guimaras 7,125 7,125 7,175 7,300 7,300 Iloilo 16,600 16,600 16,620 16,620 14,185 Negros Occidental 34,599 34,599 34,599 34,599 34,578
Table 31. COCONUT: AREA PLANTED IN HECTARE, BY REGION, BY PROVINCE, PHILIPPINES, 2010-2014

MAJOR CROPS STATISTICS OF THE PHILIPPINES, 2010-2014 (REGIONAL AND PROVINCIAL)
PHILIPPINE STATISTICS AUTHORITY
46
Region/Province 2010 2011 2012 R/ 2013 R/ 2014
Central Visayas 128,677 128,533 128,660 128,666 126,347 Bohol 35,198 35,193 35,293 35,293 35,293 Cebu 42,594 42,450 42,490 42,490 40,174 Negros Oriental 45,545 45,545 45,530 45,530 45,525 Siquijor 5,340 5,345 5,347 5,353 5,355
Eastern Visayas 434,539 417,786 419,540 419,640 322,089 Bil iran 20,428 20,432 20,449 20,498 20,245 Eastern Samar 62,361 62,361 62,357 62,357 40,310 Leyte 166,257 166,257 167,973 167,974 94,744 Northern Samar 85,610 85,611 85,611 85,661 85,661 Samar 66,883 50,125 50,150 50,150 49,000 Southern Leyte 33,000 33,000 33,000 33,000 32,129
Zamboanga Peninsula 372,971 375,080 377,389 380,919 417,314 Zamboanga del Norte 169,030 170,889 172,900 172,900 208,870 Zamboanga del Sur 127,295 127,287 127,280 127,277 127,272 Zamboanga Sibugay 54,086 54,344 54,344 57,772 57,772 Zamboanga City 22,560 22,560 22,865 22,970 23,400
Northern Mindanao 301,257 301,697 301,660 302,433 302,818 Bukidnon 9,500 9,500 9,500 9,500 9,500 Camiguin 14,859 14,860 14,860 14,872 14,872 Lanao del Norte 76,002 76,248 76,211 77,186 77,571 Misamis Occidental 97,638 97,831 97,831 97,631 97,631 Misamis Oriental 103,258 103,258 103,258 103,244 103,244
Davao Region 375,885 375,630 375,622 348,483 356,480 Davao del Norte 39,221 39,116 39,112 39,084 39,063 Davao del Sur 97,012 97,012 97,012 97,007 97,007 Davao Oriental 155,705 155,905 155,905 145,679 143,584 Compostela Valley 51,504 51,154 51,154 34,275 44,388 Davao City 32,443 32,443 32,439 32,438 32,438
SOCCSKSARGEN 185,021 175,764 176,752 184,961 186,111 North Cotabato 40,950 42,700 42,710 46,100 46,200 Sarangani 89,424 78,457 78,465 80,500 81,000 South Cotabato 32,123 32,283 32,283 32,283 32,283 Sultan Kudarat 22,524 22,324 23,294 26,078 26,628
Caraga 219,121 218,613 215,285 191,107 191,108 Agusan del Norte 26,700 26,700 33,486 33,486 33,486 Agusan del Sur 12,561 12,561 14,884 14,884 14,885 Dinagat Islands 4,600 4,593 Surigao del Norte 90,000 89,500 89,500 60,722 60,729 Surigao del Sur 89,860 89,852 77,415 77,415 77,415
ARMM 315,645 314,418 315,940 322,677 327,890 Basilan 68,003 66,763 66,763 64,763 64,700 Lanao del Sur 46,380 46,380 46,381 46,381 46,381 Maguindanao 94,355 94,415 95,896 104,526 109,752 Sulu 66,850 66,800 66,840 66,950 67,000 Tawi-tawi 40,057 40,060 40,060 40,057 40,057
R/ - Revised due to inclusion of Batanes data.
Note: Dinagat Islands data dissagregated from Surigao del Norte.
Table 31. COCONUT: AREA PLANTED IN HECTARE …Continued
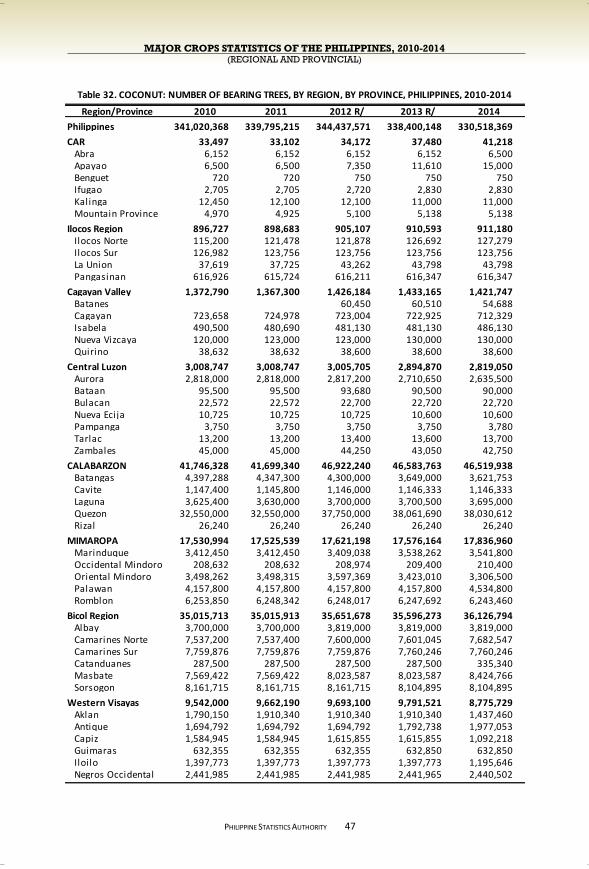
MAJOR CROPS STATISTICS OF THE PHILIPPINES, 2010-2014 (REGIONAL AND PROVINCIAL)
PHILIPPINE STATISTICS AUTHORITY
47
Region/Province 2010 2011 2012 R/ 2013 R/ 2014
Philippines 341,020,368 339,795,215 344,437,571 338,400,148 330,518,369
CAR 33,497 33,102 34,172 37,480 41,218 Abra 6,152 6,152 6,152 6,152 6,500 Apayao 6,500 6,500 7,350 11,610 15,000 Benguet 720 720 750 750 750 Ifugao 2,705 2,705 2,720 2,830 2,830 Kalinga 12,450 12,100 12,100 11,000 11,000 Mountain Province 4,970 4,925 5,100 5,138 5,138
Ilocos Region 896,727 898,683 905,107 910,593 911,180 Ilocos Norte 115,200 121,478 121,878 126,692 127,279 Ilocos Sur 126,982 123,756 123,756 123,756 123,756 La Union 37,619 37,725 43,262 43,798 43,798 Pangasinan 616,926 615,724 616,211 616,347 616,347
Cagayan Valley 1,372,790 1,367,300 1,426,184 1,433,165 1,421,747 Batanes 60,450 60,510 54,688 Cagayan 723,658 724,978 723,004 722,925 712,329 Isabela 490,500 480,690 481,130 481,130 486,130 Nueva Vizcaya 120,000 123,000 123,000 130,000 130,000 Quirino 38,632 38,632 38,600 38,600 38,600
Central Luzon 3,008,747 3,008,747 3,005,705 2,894,870 2,819,050 Aurora 2,818,000 2,818,000 2,817,200 2,710,650 2,635,500 Bataan 95,500 95,500 93,680 90,500 90,000 Bulacan 22,572 22,572 22,700 22,720 22,720 Nueva Ecija 10,725 10,725 10,725 10,600 10,600 Pampanga 3,750 3,750 3,750 3,750 3,780 Tarlac 13,200 13,200 13,400 13,600 13,700 Zambales 45,000 45,000 44,250 43,050 42,750
CALABARZON 41,746,328 41,699,340 46,922,240 46,583,763 46,519,938 Batangas 4,397,288 4,347,300 4,300,000 3,649,000 3,621,753 Cavite 1,147,400 1,145,800 1,146,000 1,146,333 1,146,333 Laguna 3,625,400 3,630,000 3,700,000 3,700,500 3,695,000 Quezon 32,550,000 32,550,000 37,750,000 38,061,690 38,030,612 Rizal 26,240 26,240 26,240 26,240 26,240
MIMAROPA 17,530,994 17,525,539 17,621,198 17,576,164 17,836,960 Marinduque 3,412,450 3,412,450 3,409,038 3,538,262 3,541,800 Occidental Mindoro 208,632 208,632 208,974 209,400 210,400 Oriental Mindoro 3,498,262 3,498,315 3,597,369 3,423,010 3,306,500 Palawan 4,157,800 4,157,800 4,157,800 4,157,800 4,534,800 Romblon 6,253,850 6,248,342 6,248,017 6,247,692 6,243,460
Bicol Region 35,015,713 35,015,913 35,651,678 35,596,273 36,126,794 Albay 3,700,000 3,700,000 3,819,000 3,819,000 3,819,000 Camarines Norte 7,537,200 7,537,400 7,600,000 7,601,045 7,682,547 Camarines Sur 7,759,876 7,759,876 7,759,876 7,760,246 7,760,246 Catanduanes 287,500 287,500 287,500 287,500 335,340 Masbate 7,569,422 7,569,422 8,023,587 8,023,587 8,424,766 Sorsogon 8,161,715 8,161,715 8,161,715 8,104,895 8,104,895
Western Visayas 9,542,000 9,662,190 9,693,100 9,791,521 8,775,729 Aklan 1,790,150 1,910,340 1,910,340 1,910,340 1,437,460 Antique 1,694,792 1,694,792 1,694,792 1,792,738 1,977,053 Capiz 1,584,945 1,584,945 1,615,855 1,615,855 1,092,218 Guimaras 632,355 632,355 632,355 632,850 632,850 Iloilo 1,397,773 1,397,773 1,397,773 1,397,773 1,195,646 Negros Occidental 2,441,985 2,441,985 2,441,985 2,441,965 2,440,502
Table 32. COCONUT: NUMBER OF BEARING TREES, BY REGION, BY PROVINCE, PHILIPPINES, 2010-2014
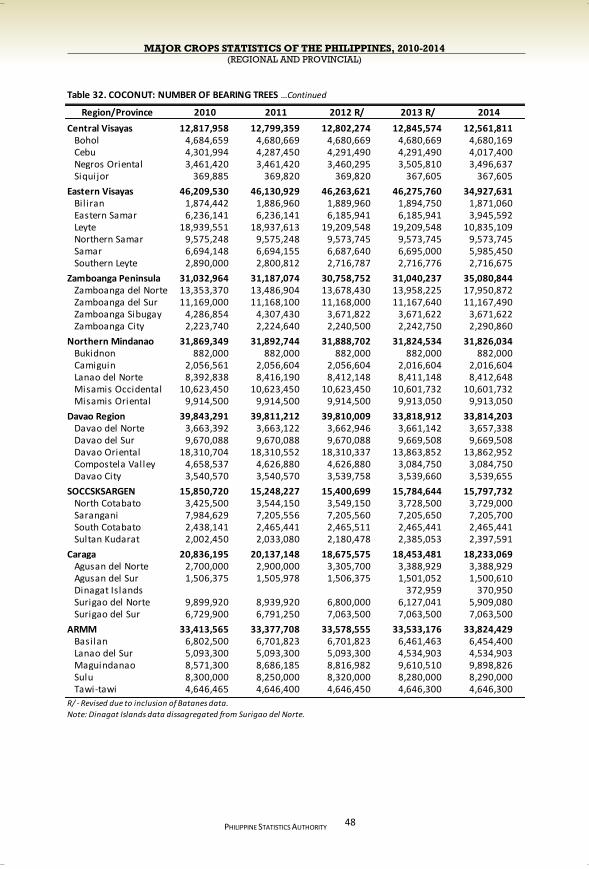
MAJOR CROPS STATISTICS OF THE PHILIPPINES, 2010-2014 (REGIONAL AND PROVINCIAL)
PHILIPPINE STATISTICS AUTHORITY
48
Region/Province 2010 2011 2012 R/ 2013 R/ 2014
Central Visayas 12,817,958 12,799,359 12,802,274 12,845,574 12,561,811 Bohol 4,684,659 4,680,669 4,680,669 4,680,669 4,680,169 Cebu 4,301,994 4,287,450 4,291,490 4,291,490 4,017,400 Negros Oriental 3,461,420 3,461,420 3,460,295 3,505,810 3,496,637 Siquijor 369,885 369,820 369,820 367,605 367,605
Eastern Visayas 46,209,530 46,130,929 46,263,621 46,275,760 34,927,631 Bil iran 1,874,442 1,886,960 1,889,960 1,894,750 1,871,060 Eastern Samar 6,236,141 6,236,141 6,185,941 6,185,941 3,945,592 Leyte 18,939,551 18,937,613 19,209,548 19,209,548 10,835,109 Northern Samar 9,575,248 9,575,248 9,573,745 9,573,745 9,573,745 Samar 6,694,148 6,694,155 6,687,640 6,695,000 5,985,450 Southern Leyte 2,890,000 2,800,812 2,716,787 2,716,776 2,716,675
Zamboanga Peninsula 31,032,964 31,187,074 30,758,752 31,040,237 35,080,844 Zamboanga del Norte 13,353,370 13,486,904 13,678,430 13,958,225 17,950,872 Zamboanga del Sur 11,169,000 11,168,100 11,168,000 11,167,640 11,167,490 Zamboanga Sibugay 4,286,854 4,307,430 3,671,822 3,671,622 3,671,622 Zamboanga City 2,223,740 2,224,640 2,240,500 2,242,750 2,290,860
Northern Mindanao 31,869,349 31,892,744 31,888,702 31,824,534 31,826,034 Bukidnon 882,000 882,000 882,000 882,000 882,000 Camiguin 2,056,561 2,056,604 2,056,604 2,016,604 2,016,604 Lanao del Norte 8,392,838 8,416,190 8,412,148 8,411,148 8,412,648 Misamis Occidental 10,623,450 10,623,450 10,623,450 10,601,732 10,601,732 Misamis Oriental 9,914,500 9,914,500 9,914,500 9,913,050 9,913,050
Davao Region 39,843,291 39,811,212 39,810,009 33,818,912 33,814,203 Davao del Norte 3,663,392 3,663,122 3,662,946 3,661,142 3,657,338 Davao del Sur 9,670,088 9,670,088 9,670,088 9,669,508 9,669,508 Davao Oriental 18,310,704 18,310,552 18,310,337 13,863,852 13,862,952 Compostela Valley 4,658,537 4,626,880 4,626,880 3,084,750 3,084,750 Davao City 3,540,570 3,540,570 3,539,758 3,539,660 3,539,655
SOCCSKSARGEN 15,850,720 15,248,227 15,400,699 15,784,644 15,797,732 North Cotabato 3,425,500 3,544,150 3,549,150 3,728,500 3,729,000 Sarangani 7,984,629 7,205,556 7,205,560 7,205,650 7,205,700 South Cotabato 2,438,141 2,465,441 2,465,511 2,465,441 2,465,441 Sultan Kudarat 2,002,450 2,033,080 2,180,478 2,385,053 2,397,591
Caraga 20,836,195 20,137,148 18,675,575 18,453,481 18,233,069 Agusan del Norte 2,700,000 2,900,000 3,305,700 3,388,929 3,388,929 Agusan del Sur 1,506,375 1,505,978 1,506,375 1,501,052 1,500,610 Dinagat Islands 372,959 370,950 Surigao del Norte 9,899,920 8,939,920 6,800,000 6,127,041 5,909,080 Surigao del Sur 6,729,900 6,791,250 7,063,500 7,063,500 7,063,500
ARMM 33,413,565 33,377,708 33,578,555 33,533,176 33,824,429 Basilan 6,802,500 6,701,823 6,701,823 6,461,463 6,454,400 Lanao del Sur 5,093,300 5,093,300 5,093,300 4,534,903 4,534,903 Maguindanao 8,571,300 8,686,185 8,816,982 9,610,510 9,898,826 Sulu 8,300,000 8,250,000 8,320,000 8,280,000 8,290,000 Tawi-tawi 4,646,465 4,646,400 4,646,450 4,646,300 4,646,300
R/ - Revised due to inclusion of Batanes data.
Note: Dinagat Islands data dissagregated from Surigao del Norte.
Table 32. COCONUT: NUMBER OF BEARING TREES …Continued
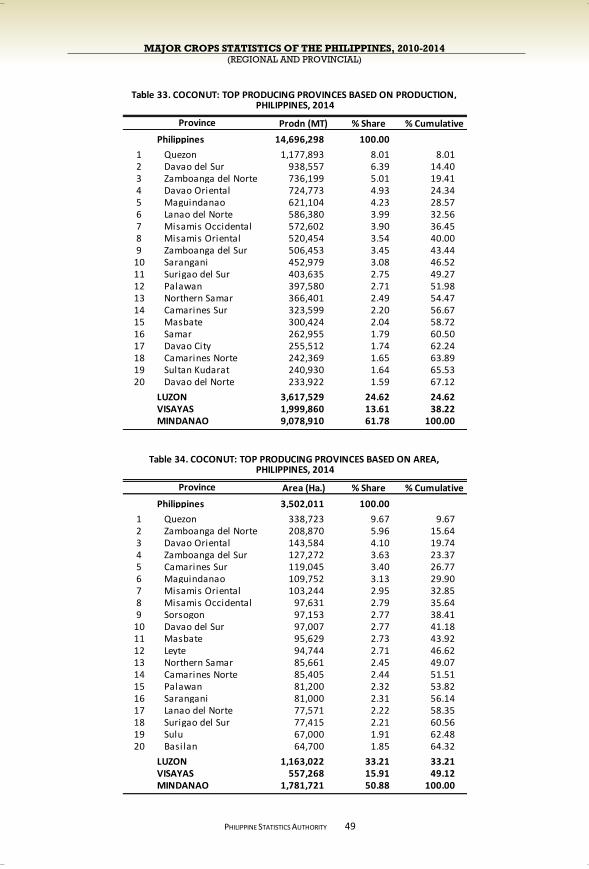
MAJOR CROPS STATISTICS OF THE PHILIPPINES, 2010-2014 (REGIONAL AND PROVINCIAL)
PHILIPPINE STATISTICS AUTHORITY
49
Prodn (MT) % Share % Cumulative
Philippines 14,696,298 100.00
1 Quezon 1,177,893 8.01 8.012 Davao del Sur 938,557 6.39 14.403 Zamboanga del Norte 736,199 5.01 19.414 Davao Oriental 724,773 4.93 24.345 Maguindanao 621,104 4.23 28.576 Lanao del Norte 586,380 3.99 32.567 Misamis Occidental 572,602 3.90 36.458 Misamis Oriental 520,454 3.54 40.009 Zamboanga del Sur 506,453 3.45 43.44
10 Sarangani 452,979 3.08 46.5211 Surigao del Sur 403,635 2.75 49.2712 Palawan 397,580 2.71 51.9813 Northern Samar 366,401 2.49 54.4714 Camarines Sur 323,599 2.20 56.6715 Masbate 300,424 2.04 58.7216 Samar 262,955 1.79 60.5017 Davao City 255,512 1.74 62.2418 Camarines Norte 242,369 1.65 63.8919 Sultan Kudarat 240,930 1.64 65.5320 Davao del Norte 233,922 1.59 67.12
LUZON 3,617,529 24.62 24.62VISAYAS 1,999,860 13.61 38.22MINDANAO 9,078,910 61.78 100.00
Area (Ha.) % Share % Cumulative
Philippines 3,502,011 100.00
1 Quezon 338,723 9.67 9.672 Zamboanga del Norte 208,870 5.96 15.643 Davao Oriental 143,584 4.10 19.744 Zamboanga del Sur 127,272 3.63 23.375 Camarines Sur 119,045 3.40 26.776 Maguindanao 109,752 3.13 29.907 Misamis Oriental 103,244 2.95 32.858 Misamis Occidental 97,631 2.79 35.649 Sorsogon 97,153 2.77 38.41
10 Davao del Sur 97,007 2.77 41.1811 Masbate 95,629 2.73 43.9212 Leyte 94,744 2.71 46.6213 Northern Samar 85,661 2.45 49.0714 Camarines Norte 85,405 2.44 51.5115 Palawan 81,200 2.32 53.8216 Sarangani 81,000 2.31 56.1417 Lanao del Norte 77,571 2.22 58.3518 Surigao del Sur 77,415 2.21 60.5619 Sulu 67,000 1.91 62.4820 Basilan 64,700 1.85 64.32
LUZON 1,163,022 33.21 33.21VISAYAS 557,268 15.91 49.12MINDANAO 1,781,721 50.88 100.00
Province
Table 33. COCONUT: TOP PRODUCING PROVINCES BASED ON PRODUCTION,
Table 34. COCONUT: TOP PRODUCING PROVINCES BASED ON AREA,
Province
PHILIPPINES, 2014
PHILIPPINES, 2014

MAJOR CROPS STATISTICS OF THE PHILIPPINES, 2010-2014 (REGIONAL AND PROVINCIAL)
PHILIPPINE STATISTICS AUTHORITY
COFFEE
Production of dried coffee berries of all varieties from 2010 to 2014 dropped at an average annual rate of 5.4 percent. During the same period, area planted and number of bearing trees went down by 0.8 percent and 1.5 percent, respectively.
In 2014, coffee production dropped to 75.45 thousand mt, 4.0 percent
below the 2013 level of 78.63 thousand mt. Decreases were due to cutting of old and less productive trees, effect of heavy rains and strong wind during fruit development in Sultan Kudarat, shifting to Cavendish and señorita banana production in Compostela Valley and to lakatan and latundan in Davao City. Decreases were also due to damages brought by typhoon “Yolanda” in Capiz and Iloilo and typhoon “Labuyo” in Kalinga during the flowering stage of the crop. Production was also affected by long dry season while some bearing trees were affected by scale insects in Batangas. There was also reported shifting of some coffee farms to production of pineapple in Cavite.
Sultan Kudarat
topped all the coffee producing provinces contributing 22.61 thousand mt or 30.0 percent of the country’s total coffee production. This was followed by Davao del Sur, Sulu, Bukidnon, and Cavite which had a combined output of 17.65 thousand mt (Figure 12).
50
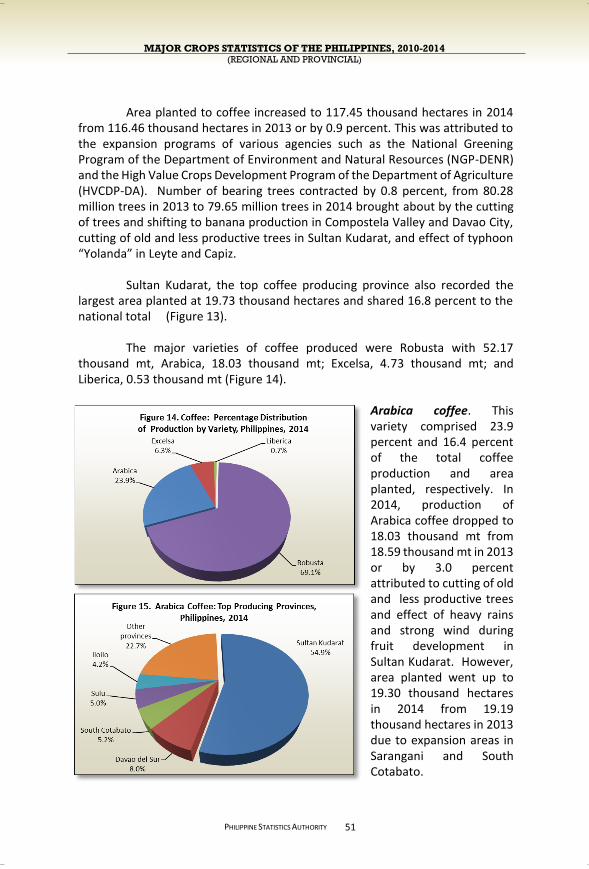
MAJOR CROPS STATISTICS OF THE PHILIPPINES, 2010-2014 (REGIONAL AND PROVINCIAL)
PHILIPPINE STATISTICS AUTHORITY
Area planted to coffee increased to 117.45 thousand hectares in 2014 from 116.46 thousand hectares in 2013 or by 0.9 percent. This was attributed to the expansion programs of various agencies such as the National Greening Program of the Department of Environment and Natural Resources (NGP-DENR) and the High Value Crops Development Program of the Department of Agriculture (HVCDP-DA). Number of bearing trees contracted by 0.8 percent, from 80.28 million trees in 2013 to 79.65 million trees in 2014 brought about by the cutting of trees and shifting to banana production in Compostela Valley and Davao City, cutting of old and less productive trees in Sultan Kudarat, and effect of typhoon “Yolanda” in Leyte and Capiz.
Sultan Kudarat, the top coffee producing province also recorded the
largest area planted at 19.73 thousand hectares and shared 16.8 percent to the national total (Figure 13).
The major varieties of coffee produced were Robusta with 52.17
thousand mt, Arabica, 18.03 thousand mt; Excelsa, 4.73 thousand mt; and Liberica, 0.53 thousand mt (Figure 14).
Arabica coffee. This variety comprised 23.9 percent and 16.4 percent of the total coffee production and area planted, respectively. In 2014, production of Arabica coffee dropped to 18.03 thousand mt from 18.59 thousand mt in 2013 or by 3.0 percent attributed to cutting of old and less productive trees and effect of heavy rains and strong wind during fruit development in Sultan Kudarat. However, area planted went up to 19.30 thousand hectares in 2014 from 19.19 thousand hectares in 2013 due to expansion areas in Sarangani and South Cotabato.
51
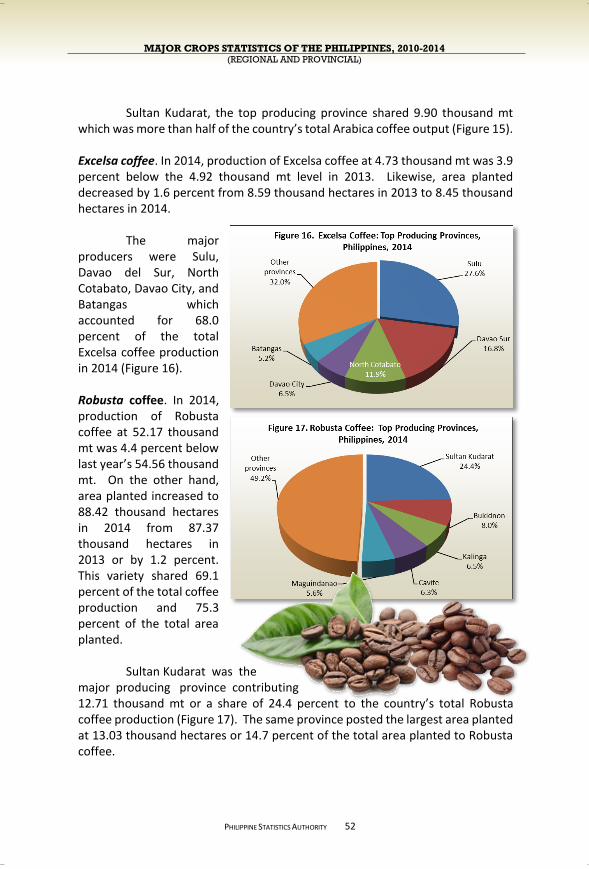
MAJOR CROPS STATISTICS OF THE PHILIPPINES, 2010-2014 (REGIONAL AND PROVINCIAL)
PHILIPPINE STATISTICS AUTHORITY
Sultan Kudarat, the top producing province shared 9.90 thousand mt which was more than half of the country’s total Arabica coffee output (Figure 15). Excelsa coffee. In 2014, production of Excelsa coffee at 4.73 thousand mt was 3.9 percent below the 4.92 thousand mt level in 2013. Likewise, area planted decreased by 1.6 percent from 8.59 thousand hectares in 2013 to 8.45 thousand hectares in 2014.
The major
producers were Sulu, Davao del Sur, North Cotabato, Davao City, and Batangas which accounted for 68.0 percent of the total Excelsa coffee production in 2014 (Figure 16).
Robusta coffee. In 2014, production of Robusta coffee at 52.17 thousand mt was 4.4 percent below last year’s 54.56 thousand mt. On the other hand, area planted increased to 88.42 thousand hectares in 2014 from 87.37 thousand hectares in 2013 or by 1.2 percent. This variety shared 69.1 percent of the total coffee production and 75.3 percent of the total area planted. Sultan Kudarat was the major producing province contributing 12.71 thousand mt or a share of 24.4 percent to the country’s total Robusta coffee production (Figure 17). The same province posted the largest area planted at 13.03 thousand hectares or 14.7 percent of the total area planted to Robusta coffee.
52
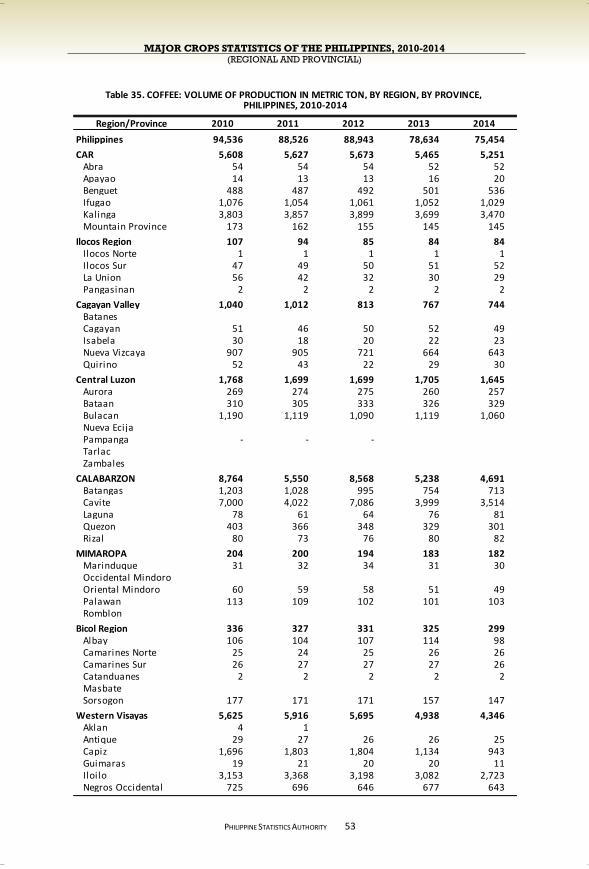
MAJOR CROPS STATISTICS OF THE PHILIPPINES, 2010-2014 (REGIONAL AND PROVINCIAL)
PHILIPPINE STATISTICS AUTHORITY
53
Region/Province 2010 2011 2012 2013 2014
Philippines 94,536 88,526 88,943 78,634 75,454
CAR 5,608 5,627 5,673 5,465 5,251 Abra 54 54 54 52 52 Apayao 14 13 13 16 20 Benguet 488 487 492 501 536 Ifugao 1,076 1,054 1,061 1,052 1,029 Kalinga 3,803 3,857 3,899 3,699 3,470 Mountain Province 173 162 155 145 145
Ilocos Region 107 94 85 84 84 Ilocos Norte 1 1 1 1 1 Ilocos Sur 47 49 50 51 52 La Union 56 42 32 30 29 Pangasinan 2 2 2 2 2
Cagayan Valley 1,040 1,012 813 767 744 Batanes Cagayan 51 46 50 52 49 Isabela 30 18 20 22 23 Nueva Vizcaya 907 905 721 664 643 Quirino 52 43 22 29 30
Central Luzon 1,768 1,699 1,699 1,705 1,645 Aurora 269 274 275 260 257 Bataan 310 305 333 326 329 Bulacan 1,190 1,119 1,090 1,119 1,060 Nueva Ecija Pampanga - - - Tarlac Zambales
CALABARZON 8,764 5,550 8,568 5,238 4,691 Batangas 1,203 1,028 995 754 713 Cavite 7,000 4,022 7,086 3,999 3,514 Laguna 78 61 64 76 81 Quezon 403 366 348 329 301 Rizal 80 73 76 80 82
MIMAROPA 204 200 194 183 182 Marinduque 31 32 34 31 30 Occidental Mindoro Oriental Mindoro 60 59 58 51 49 Palawan 113 109 102 101 103 Romblon
Bicol Region 336 327 331 325 299 Albay 106 104 107 114 98 Camarines Norte 25 24 25 26 26 Camarines Sur 26 27 27 27 26 Catanduanes 2 2 2 2 2 Masbate Sorsogon 177 171 171 157 147
Western Visayas 5,625 5,916 5,695 4,938 4,346 Aklan 4 1 Antique 29 27 26 26 25 Capiz 1,696 1,803 1,804 1,134 943 Guimaras 19 21 20 20 11 Iloilo 3,153 3,368 3,198 3,082 2,723 Negros Occidental 725 696 646 677 643
PHILIPPINES, 2010-2014Table 35. COFFEE: VOLUME OF PRODUCTION IN METRIC TON, BY REGION, BY PROVINCE,
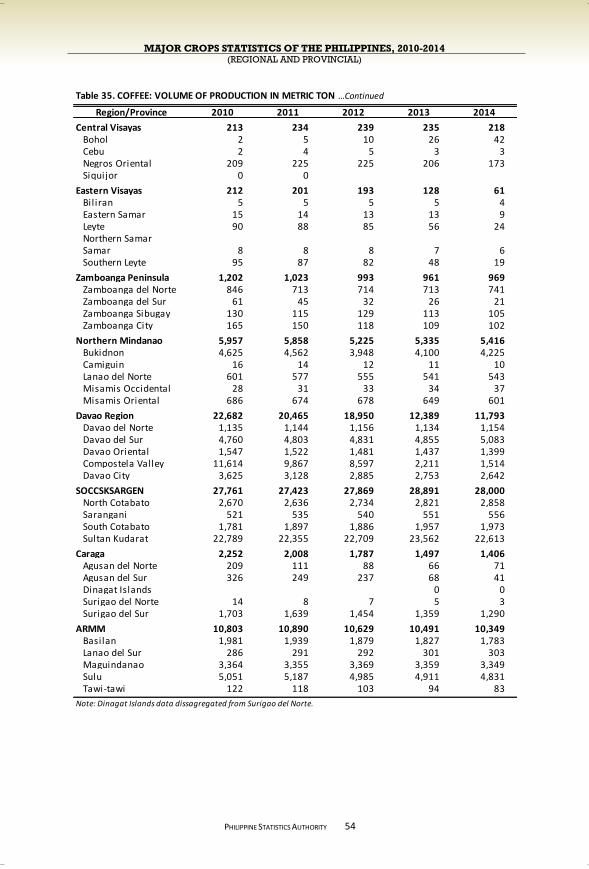
MAJOR CROPS STATISTICS OF THE PHILIPPINES, 2010-2014 (REGIONAL AND PROVINCIAL)
PHILIPPINE STATISTICS AUTHORITY
54
Region/Province 2010 2011 2012 2013 2014
Central Visayas 213 234 239 235 218 Bohol 2 5 10 26 42 Cebu 2 4 5 3 3 Negros Oriental 209 225 225 206 173 Siquijor 0 0
Eastern Visayas 212 201 193 128 61 Bil iran 5 5 5 5 4 Eastern Samar 15 14 13 13 9 Leyte 90 88 85 56 24 Northern Samar Samar 8 8 8 7 6 Southern Leyte 95 87 82 48 19
Zamboanga Peninsula 1,202 1,023 993 961 969 Zamboanga del Norte 846 713 714 713 741 Zamboanga del Sur 61 45 32 26 21 Zamboanga Sibugay 130 115 129 113 105 Zamboanga City 165 150 118 109 102
Northern Mindanao 5,957 5,858 5,225 5,335 5,416 Bukidnon 4,625 4,562 3,948 4,100 4,225 Camiguin 16 14 12 11 10 Lanao del Norte 601 577 555 541 543 Misamis Occidental 28 31 33 34 37 Misamis Oriental 686 674 678 649 601
Davao Region 22,682 20,465 18,950 12,389 11,793 Davao del Norte 1,135 1,144 1,156 1,134 1,154 Davao del Sur 4,760 4,803 4,831 4,855 5,083 Davao Oriental 1,547 1,522 1,481 1,437 1,399 Compostela Valley 11,614 9,867 8,597 2,211 1,514 Davao City 3,625 3,128 2,885 2,753 2,642
SOCCSKSARGEN 27,761 27,423 27,869 28,891 28,000 North Cotabato 2,670 2,636 2,734 2,821 2,858 Sarangani 521 535 540 551 556 South Cotabato 1,781 1,897 1,886 1,957 1,973 Sultan Kudarat 22,789 22,355 22,709 23,562 22,613
Caraga 2,252 2,008 1,787 1,497 1,406 Agusan del Norte 209 111 88 66 71 Agusan del Sur 326 249 237 68 41 Dinagat Islands 0 0 Surigao del Norte 14 8 7 5 3 Surigao del Sur 1,703 1,639 1,454 1,359 1,290
ARMM 10,803 10,890 10,629 10,491 10,349 Basilan 1,981 1,939 1,879 1,827 1,783 Lanao del Sur 286 291 292 301 303 Maguindanao 3,364 3,355 3,369 3,359 3,349 Sulu 5,051 5,187 4,985 4,911 4,831 Tawi-tawi 122 118 103 94 83
Note: Dinagat Islands data dissagregated from Surigao del Norte.
Table 35. COFFEE: VOLUME OF PRODUCTION IN METRIC TON …Continued
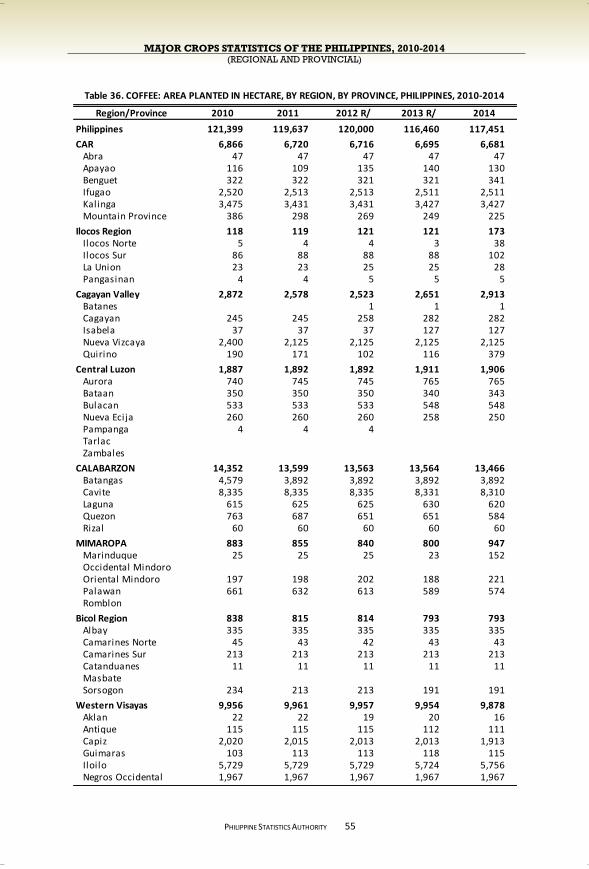
MAJOR CROPS STATISTICS OF THE PHILIPPINES, 2010-2014 (REGIONAL AND PROVINCIAL)
PHILIPPINE STATISTICS AUTHORITY
Region/Province 2010 2011 2012 R/ 2013 R/ 2014
Philippines 121,399 119,637 120,000 116,460 117,451
CAR 6,866 6,720 6,716 6,695 6,681 Abra 47 47 47 47 47 Apayao 116 109 135 140 130 Benguet 322 322 321 321 341 Ifugao 2,520 2,513 2,513 2,511 2,511 Kalinga 3,475 3,431 3,431 3,427 3,427 Mountain Province 386 298 269 249 225
Ilocos Region 118 119 121 121 173 Ilocos Norte 5 4 4 3 38 Ilocos Sur 86 88 88 88 102 La Union 23 23 25 25 28 Pangasinan 4 4 5 5 5
Cagayan Valley 2,872 2,578 2,523 2,651 2,913 Batanes 1 1 1 Cagayan 245 245 258 282 282 Isabela 37 37 37 127 127 Nueva Vizcaya 2,400 2,125 2,125 2,125 2,125 Quirino 190 171 102 116 379
Central Luzon 1,887 1,892 1,892 1,911 1,906 Aurora 740 745 745 765 765 Bataan 350 350 350 340 343 Bulacan 533 533 533 548 548 Nueva Ecija 260 260 260 258 250 Pampanga 4 4 4 Tarlac Zambales
CALABARZON 14,352 13,599 13,563 13,564 13,466 Batangas 4,579 3,892 3,892 3,892 3,892 Cavite 8,335 8,335 8,335 8,331 8,310 Laguna 615 625 625 630 620 Quezon 763 687 651 651 584 Rizal 60 60 60 60 60
MIMAROPA 883 855 840 800 947 Marinduque 25 25 25 23 152 Occidental Mindoro Oriental Mindoro 197 198 202 188 221 Palawan 661 632 613 589 574 Romblon
Bicol Region 838 815 814 793 793 Albay 335 335 335 335 335 Camarines Norte 45 43 42 43 43 Camarines Sur 213 213 213 213 213 Catanduanes 11 11 11 11 11 Masbate Sorsogon 234 213 213 191 191
Western Visayas 9,956 9,961 9,957 9,954 9,878 Aklan 22 22 19 20 16 Antique 115 115 115 112 111 Capiz 2,020 2,015 2,013 2,013 1,913 Guimaras 103 113 113 118 115 Iloilo 5,729 5,729 5,729 5,724 5,756 Negros Occidental 1,967 1,967 1,967 1,967 1,967
Table 36. COFFEE: AREA PLANTED IN HECTARE, BY REGION, BY PROVINCE, PHILIPPINES, 2010-2014
55
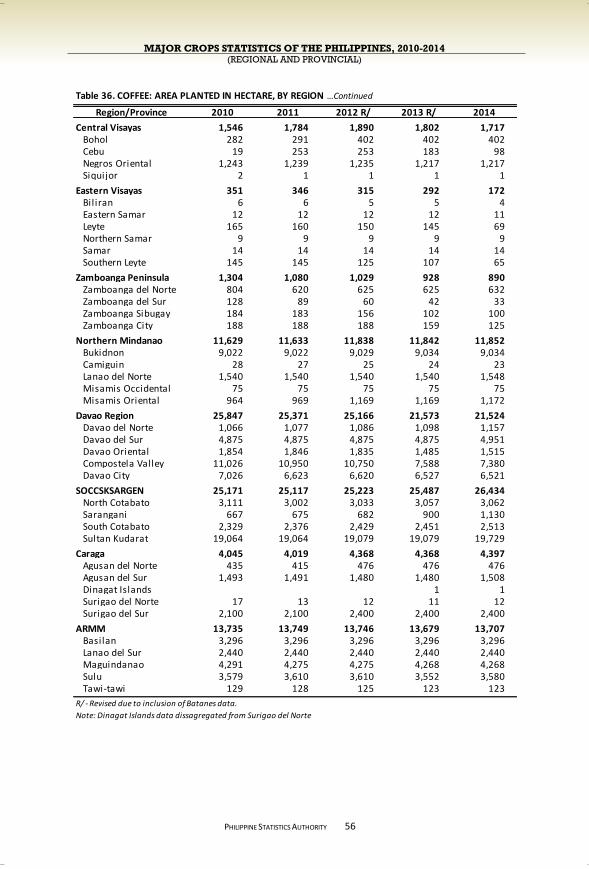
MAJOR CROPS STATISTICS OF THE PHILIPPINES, 2010-2014 (REGIONAL AND PROVINCIAL)
PHILIPPINE STATISTICS AUTHORITY
56
Region/Province 2010 2011 2012 R/ 2013 R/ 2014
Central Visayas 1,546 1,784 1,890 1,802 1,717 Bohol 282 291 402 402 402 Cebu 19 253 253 183 98 Negros Oriental 1,243 1,239 1,235 1,217 1,217 Siquijor 2 1 1 1 1
Eastern Visayas 351 346 315 292 172 Bil iran 6 6 5 5 4 Eastern Samar 12 12 12 12 11 Leyte 165 160 150 145 69 Northern Samar 9 9 9 9 9 Samar 14 14 14 14 14 Southern Leyte 145 145 125 107 65
Zamboanga Peninsula 1,304 1,080 1,029 928 890 Zamboanga del Norte 804 620 625 625 632 Zamboanga del Sur 128 89 60 42 33 Zamboanga Sibugay 184 183 156 102 100 Zamboanga City 188 188 188 159 125
Northern Mindanao 11,629 11,633 11,838 11,842 11,852 Bukidnon 9,022 9,022 9,029 9,034 9,034 Camiguin 28 27 25 24 23 Lanao del Norte 1,540 1,540 1,540 1,540 1,548 Misamis Occidental 75 75 75 75 75 Misamis Oriental 964 969 1,169 1,169 1,172
Davao Region 25,847 25,371 25,166 21,573 21,524 Davao del Norte 1,066 1,077 1,086 1,098 1,157 Davao del Sur 4,875 4,875 4,875 4,875 4,951 Davao Oriental 1,854 1,846 1,835 1,485 1,515 Compostela Valley 11,026 10,950 10,750 7,588 7,380 Davao City 7,026 6,623 6,620 6,527 6,521
SOCCSKSARGEN 25,171 25,117 25,223 25,487 26,434 North Cotabato 3,111 3,002 3,033 3,057 3,062 Sarangani 667 675 682 900 1,130 South Cotabato 2,329 2,376 2,429 2,451 2,513 Sultan Kudarat 19,064 19,064 19,079 19,079 19,729
Caraga 4,045 4,019 4,368 4,368 4,397 Agusan del Norte 435 415 476 476 476 Agusan del Sur 1,493 1,491 1,480 1,480 1,508 Dinagat Islands 1 1 Surigao del Norte 17 13 12 11 12 Surigao del Sur 2,100 2,100 2,400 2,400 2,400
ARMM 13,735 13,749 13,746 13,679 13,707 Basilan 3,296 3,296 3,296 3,296 3,296 Lanao del Sur 2,440 2,440 2,440 2,440 2,440 Maguindanao 4,291 4,275 4,275 4,268 4,268 Sulu 3,579 3,610 3,610 3,552 3,580 Tawi-tawi 129 128 125 123 123
R/ - Revised due to inclusion of Batanes data.
Note: Dinagat Islands data dissagregated from Surigao del Norte
Table 36. COFFEE: AREA PLANTED IN HECTARE, BY REGION …Continued
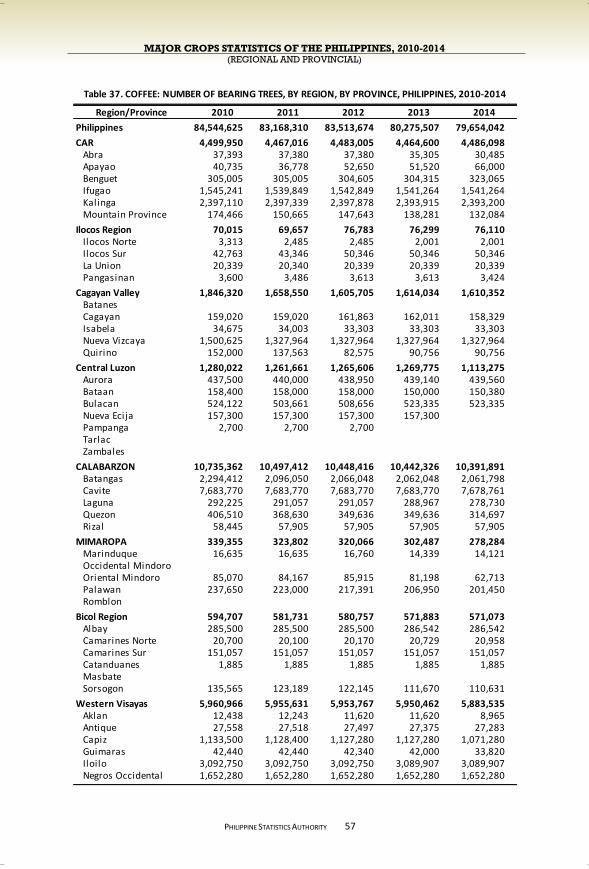
MAJOR CROPS STATISTICS OF THE PHILIPPINES, 2010-2014 (REGIONAL AND PROVINCIAL)
PHILIPPINE STATISTICS AUTHORITY
57
Region/Province 2010 2011 2012 2013 2014
Philippines 84,544,625 83,168,310 83,513,674 80,275,507 79,654,042
CAR 4,499,950 4,467,016 4,483,005 4,464,600 4,486,098 Abra 37,393 37,380 37,380 35,305 30,485 Apayao 40,735 36,778 52,650 51,520 66,000 Benguet 305,005 305,005 304,605 304,315 323,065 Ifugao 1,545,241 1,539,849 1,542,849 1,541,264 1,541,264 Kalinga 2,397,110 2,397,339 2,397,878 2,393,915 2,393,200 Mountain Province 174,466 150,665 147,643 138,281 132,084
Ilocos Region 70,015 69,657 76,783 76,299 76,110 Ilocos Norte 3,313 2,485 2,485 2,001 2,001 Ilocos Sur 42,763 43,346 50,346 50,346 50,346 La Union 20,339 20,340 20,339 20,339 20,339 Pangasinan 3,600 3,486 3,613 3,613 3,424
Cagayan Valley 1,846,320 1,658,550 1,605,705 1,614,034 1,610,352 Batanes Cagayan 159,020 159,020 161,863 162,011 158,329 Isabela 34,675 34,003 33,303 33,303 33,303 Nueva Vizcaya 1,500,625 1,327,964 1,327,964 1,327,964 1,327,964 Quirino 152,000 137,563 82,575 90,756 90,756
Central Luzon 1,280,022 1,261,661 1,265,606 1,269,775 1,113,275 Aurora 437,500 440,000 438,950 439,140 439,560 Bataan 158,400 158,000 158,000 150,000 150,380 Bulacan 524,122 503,661 508,656 523,335 523,335 Nueva Ecija 157,300 157,300 157,300 157,300 Pampanga 2,700 2,700 2,700 Tarlac Zambales
CALABARZON 10,735,362 10,497,412 10,448,416 10,442,326 10,391,891 Batangas 2,294,412 2,096,050 2,066,048 2,062,048 2,061,798 Cavite 7,683,770 7,683,770 7,683,770 7,683,770 7,678,761 Laguna 292,225 291,057 291,057 288,967 278,730 Quezon 406,510 368,630 349,636 349,636 314,697 Rizal 58,445 57,905 57,905 57,905 57,905
MIMAROPA 339,355 323,802 320,066 302,487 278,284 Marinduque 16,635 16,635 16,760 14,339 14,121 Occidental Mindoro Oriental Mindoro 85,070 84,167 85,915 81,198 62,713 Palawan 237,650 223,000 217,391 206,950 201,450 Romblon
Bicol Region 594,707 581,731 580,757 571,883 571,073 Albay 285,500 285,500 285,500 286,542 286,542 Camarines Norte 20,700 20,100 20,170 20,729 20,958 Camarines Sur 151,057 151,057 151,057 151,057 151,057 Catanduanes 1,885 1,885 1,885 1,885 1,885 Masbate Sorsogon 135,565 123,189 122,145 111,670 110,631
Western Visayas 5,960,966 5,955,631 5,953,767 5,950,462 5,883,535 Aklan 12,438 12,243 11,620 11,620 8,965 Antique 27,558 27,518 27,497 27,375 27,283 Capiz 1,133,500 1,128,400 1,127,280 1,127,280 1,071,280 Guimaras 42,440 42,440 42,340 42,000 33,820 Iloilo 3,092,750 3,092,750 3,092,750 3,089,907 3,089,907 Negros Occidental 1,652,280 1,652,280 1,652,280 1,652,280 1,652,280
Table 37. COFFEE: NUMBER OF BEARING TREES, BY REGION, BY PROVINCE, PHILIPPINES, 2010-2014
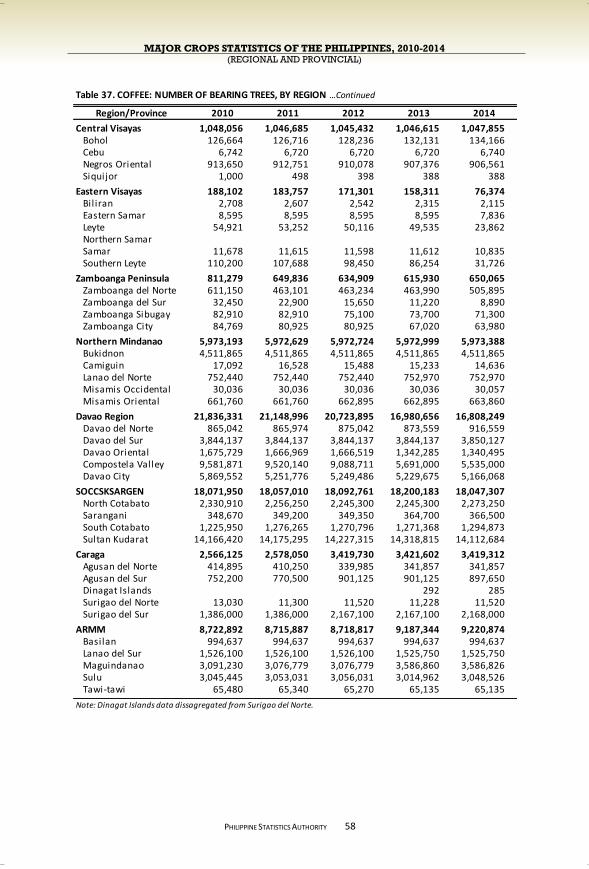
MAJOR CROPS STATISTICS OF THE PHILIPPINES, 2010-2014 (REGIONAL AND PROVINCIAL)
PHILIPPINE STATISTICS AUTHORITY
58
Region/Province 2010 2011 2012 2013 2014
Central Visayas 1,048,056 1,046,685 1,045,432 1,046,615 1,047,855 Bohol 126,664 126,716 128,236 132,131 134,166 Cebu 6,742 6,720 6,720 6,720 6,740 Negros Oriental 913,650 912,751 910,078 907,376 906,561 Siquijor 1,000 498 398 388 388
Eastern Visayas 188,102 183,757 171,301 158,311 76,374 Bil iran 2,708 2,607 2,542 2,315 2,115 Eastern Samar 8,595 8,595 8,595 8,595 7,836 Leyte 54,921 53,252 50,116 49,535 23,862 Northern Samar Samar 11,678 11,615 11,598 11,612 10,835 Southern Leyte 110,200 107,688 98,450 86,254 31,726
Zamboanga Peninsula 811,279 649,836 634,909 615,930 650,065 Zamboanga del Norte 611,150 463,101 463,234 463,990 505,895 Zamboanga del Sur 32,450 22,900 15,650 11,220 8,890 Zamboanga Sibugay 82,910 82,910 75,100 73,700 71,300 Zamboanga City 84,769 80,925 80,925 67,020 63,980
Northern Mindanao 5,973,193 5,972,629 5,972,724 5,972,999 5,973,388 Bukidnon 4,511,865 4,511,865 4,511,865 4,511,865 4,511,865 Camiguin 17,092 16,528 15,488 15,233 14,636 Lanao del Norte 752,440 752,440 752,440 752,970 752,970 Misamis Occidental 30,036 30,036 30,036 30,036 30,057 Misamis Oriental 661,760 661,760 662,895 662,895 663,860
Davao Region 21,836,331 21,148,996 20,723,895 16,980,656 16,808,249 Davao del Norte 865,042 865,974 875,042 873,559 916,559 Davao del Sur 3,844,137 3,844,137 3,844,137 3,844,137 3,850,127 Davao Oriental 1,675,729 1,666,969 1,666,519 1,342,285 1,340,495 Compostela Valley 9,581,871 9,520,140 9,088,711 5,691,000 5,535,000 Davao City 5,869,552 5,251,776 5,249,486 5,229,675 5,166,068
SOCCSKSARGEN 18,071,950 18,057,010 18,092,761 18,200,183 18,047,307 North Cotabato 2,330,910 2,256,250 2,245,300 2,245,300 2,273,250 Sarangani 348,670 349,200 349,350 364,700 366,500 South Cotabato 1,225,950 1,276,265 1,270,796 1,271,368 1,294,873 Sultan Kudarat 14,166,420 14,175,295 14,227,315 14,318,815 14,112,684
Caraga 2,566,125 2,578,050 3,419,730 3,421,602 3,419,312 Agusan del Norte 414,895 410,250 339,985 341,857 341,857 Agusan del Sur 752,200 770,500 901,125 901,125 897,650 Dinagat Islands 292 285 Surigao del Norte 13,030 11,300 11,520 11,228 11,520 Surigao del Sur 1,386,000 1,386,000 2,167,100 2,167,100 2,168,000
ARMM 8,722,892 8,715,887 8,718,817 9,187,344 9,220,874 Basilan 994,637 994,637 994,637 994,637 994,637 Lanao del Sur 1,526,100 1,526,100 1,526,100 1,525,750 1,525,750 Maguindanao 3,091,230 3,076,779 3,076,779 3,586,860 3,586,826 Sulu 3,045,445 3,053,031 3,056,031 3,014,962 3,048,526 Tawi-tawi 65,480 65,340 65,270 65,135 65,135
Note: Dinagat Islands data dissagregated from Surigao del Norte.
Table 37. COFFEE: NUMBER OF BEARING TREES, BY REGION …Continued
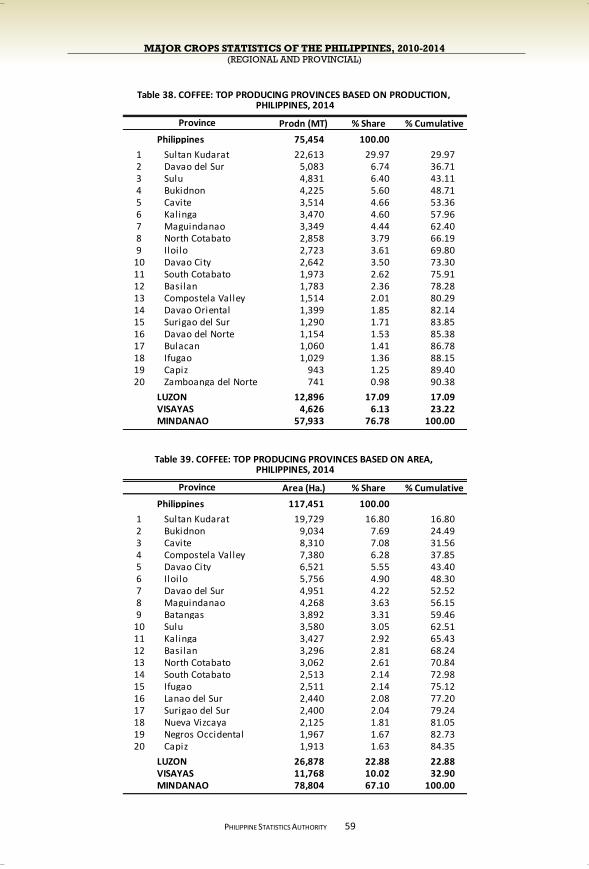
MAJOR CROPS STATISTICS OF THE PHILIPPINES, 2010-2014 (REGIONAL AND PROVINCIAL)
PHILIPPINE STATISTICS AUTHORITY
59
Prodn (MT) % Share % Cumulative
Philippines 75,454 100.00
1 Sultan Kudarat 22,613 29.97 29.972 Davao del Sur 5,083 6.74 36.713 Sulu 4,831 6.40 43.114 Bukidnon 4,225 5.60 48.715 Cavite 3,514 4.66 53.366 Kalinga 3,470 4.60 57.967 Maguindanao 3,349 4.44 62.408 North Cotabato 2,858 3.79 66.199 Iloilo 2,723 3.61 69.80
10 Davao City 2,642 3.50 73.3011 South Cotabato 1,973 2.62 75.9112 Basilan 1,783 2.36 78.2813 Compostela Valley 1,514 2.01 80.2914 Davao Oriental 1,399 1.85 82.1415 Surigao del Sur 1,290 1.71 83.8516 Davao del Norte 1,154 1.53 85.3817 Bulacan 1,060 1.41 86.7818 Ifugao 1,029 1.36 88.1519 Capiz 943 1.25 89.4020 Zamboanga del Norte 741 0.98 90.38
LUZON 12,896 17.09 17.09VISAYAS 4,626 6.13 23.22MINDANAO 57,933 76.78 100.00
Area (Ha.) % Share % Cumulative
Philippines 117,451 100.00
1 Sultan Kudarat 19,729 16.80 16.802 Bukidnon 9,034 7.69 24.493 Cavite 8,310 7.08 31.564 Compostela Valley 7,380 6.28 37.855 Davao City 6,521 5.55 43.406 Iloilo 5,756 4.90 48.307 Davao del Sur 4,951 4.22 52.528 Maguindanao 4,268 3.63 56.159 Batangas 3,892 3.31 59.46
10 Sulu 3,580 3.05 62.5111 Kalinga 3,427 2.92 65.4312 Basilan 3,296 2.81 68.2413 North Cotabato 3,062 2.61 70.8414 South Cotabato 2,513 2.14 72.9815 Ifugao 2,511 2.14 75.1216 Lanao del Sur 2,440 2.08 77.2017 Surigao del Sur 2,400 2.04 79.2418 Nueva Vizcaya 2,125 1.81 81.0519 Negros Occidental 1,967 1.67 82.7320 Capiz 1,913 1.63 84.35
LUZON 26,878 22.88 22.88VISAYAS 11,768 10.02 32.90MINDANAO 78,804 67.10 100.00
Province
Table 38. COFFEE: TOP PRODUCING PROVINCES BASED ON PRODUCTION,
Table 39. COFFEE: TOP PRODUCING PROVINCES BASED ON AREA,
Province
PHILIPPINES, 2014
PHILIPPINES, 2014
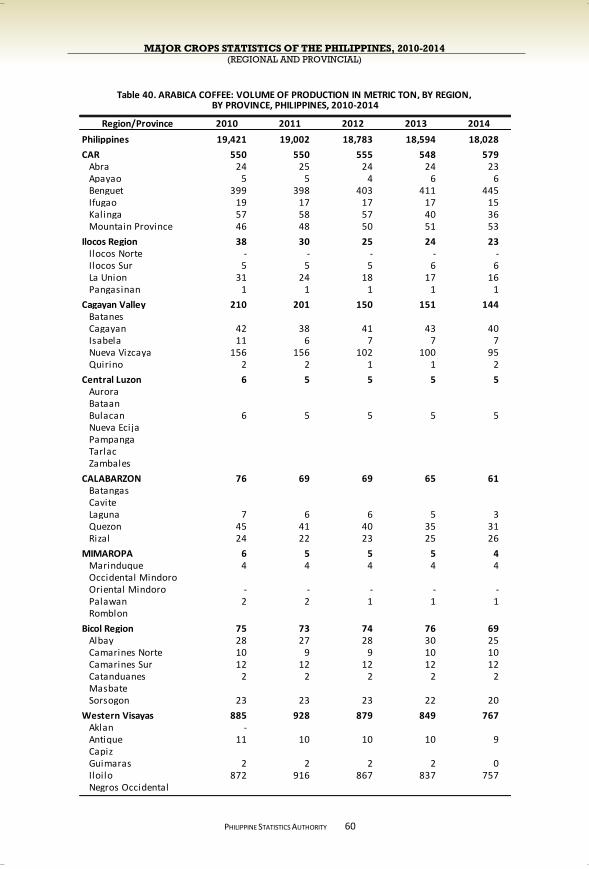
MAJOR CROPS STATISTICS OF THE PHILIPPINES, 2010-2014 (REGIONAL AND PROVINCIAL)
PHILIPPINE STATISTICS AUTHORITY
60
Region/Province 2010 2011 2012 2013 2014
Philippines 19,421 19,002 18,783 18,594 18,028
CAR 550 550 555 548 579 Abra 24 25 24 24 23 Apayao 5 5 4 6 6 Benguet 399 398 403 411 445 Ifugao 19 17 17 17 15 Kalinga 57 58 57 40 36 Mountain Province 46 48 50 51 53
Ilocos Region 38 30 25 24 23 Ilocos Norte - - - - - Ilocos Sur 5 5 5 6 6 La Union 31 24 18 17 16 Pangasinan 1 1 1 1 1
Cagayan Valley 210 201 150 151 144 Batanes Cagayan 42 38 41 43 40 Isabela 11 6 7 7 7 Nueva Vizcaya 156 156 102 100 95 Quirino 2 2 1 1 2
Central Luzon 6 5 5 5 5 Aurora Bataan Bulacan 6 5 5 5 5 Nueva Ecija Pampanga Tarlac Zambales
CALABARZON 76 69 69 65 61 Batangas Cavite Laguna 7 6 6 5 3 Quezon 45 41 40 35 31 Rizal 24 22 23 25 26
MIMAROPA 6 5 5 5 4 Marinduque 4 4 4 4 4 Occidental Mindoro Oriental Mindoro - - - - - Palawan 2 2 1 1 1 Romblon
Bicol Region 75 73 74 76 69 Albay 28 27 28 30 25 Camarines Norte 10 9 9 10 10 Camarines Sur 12 12 12 12 12 Catanduanes 2 2 2 2 2 Masbate Sorsogon 23 23 23 22 20
Western Visayas 885 928 879 849 767 Aklan - Antique 11 10 10 10 9 Capiz Guimaras 2 2 2 2 0 Iloilo 872 916 867 837 757 Negros Occidental
BY PROVINCE, PHILIPPINES, 2010-2014Table 40. ARABICA COFFEE: VOLUME OF PRODUCTION IN METRIC TON, BY REGION,

MAJOR CROPS STATISTICS OF THE PHILIPPINES, 2010-2014 (REGIONAL AND PROVINCIAL)
PHILIPPINE STATISTICS AUTHORITY
61
Region/Province 2010 2011 2012 2013 2014
Central Visayas 23 25 23 28 26 Bohol 2 2 2 3 4 Cebu - - - - - Negros Oriental 21 23 21 25 22 Siquijor 0 0
Eastern Visayas 65 62 58 41 23 Bil iran 3 2 2 2 2 Eastern Samar 3 3 2 2 1 Leyte 40 39 38 28 11 Northern Samar Samar 3 3 3 2 2 Southern Leyte 16 14 13 7 7
Zamboanga Peninsula 507 429 421 405 406 Zamboanga del Norte 375 311 311 308 314 Zamboanga del Sur 18 13 9 8 7 Zamboanga Sibugay 46 41 45 38 36 Zamboanga City 69 65 56 51 49
Northern Mindanao 386 381 378 379 380 Bukidnon 5 10 15 24 30 Camiguin 4 3 3 3 3 Lanao del Norte 349 338 329 322 316 Misamis Occidental 24 27 28 28 29 Misamis Oriental 4 4 4 3 3
Davao Region 3,004 2,799 2,691 2,385 2,355 Davao del Norte 352 353 358 351 358 Davao del Sur 1,335 1,344 1,352 1,358 1,436 Davao Oriental 81 81 80 76 76 Compostela Valley 650 551 458 178 98 Davao City 586 470 443 423 387
SOCCSKSARGEN 11,841 11,713 11,767 11,985 11,575 North Cotabato 397 397 415 449 464 Sarangani 255 263 266 272 274 South Cotabato 872 903 890 932 940 Sultan Kudarat 10,318 10,149 10,196 10,331 9,897
Caraga 2 - - - - Agusan del Norte Agusan del Sur Dinagat Islands Surigao del Norte 2 Surigao del Sur
ARMM 1,746 1,731 1,682 1,647 1,611 Basilan 280 270 260 255 245 Lanao del Sur 1 1 1 1 1 Maguindanao 452 449 447 437 428 Sulu 966 965 932 917 907 Tawi-tawi 47 46 42 37 30
Table 40. ARABICA COFFEE: VOLUME OF PRODUCTION IN METRIC TON …Continued
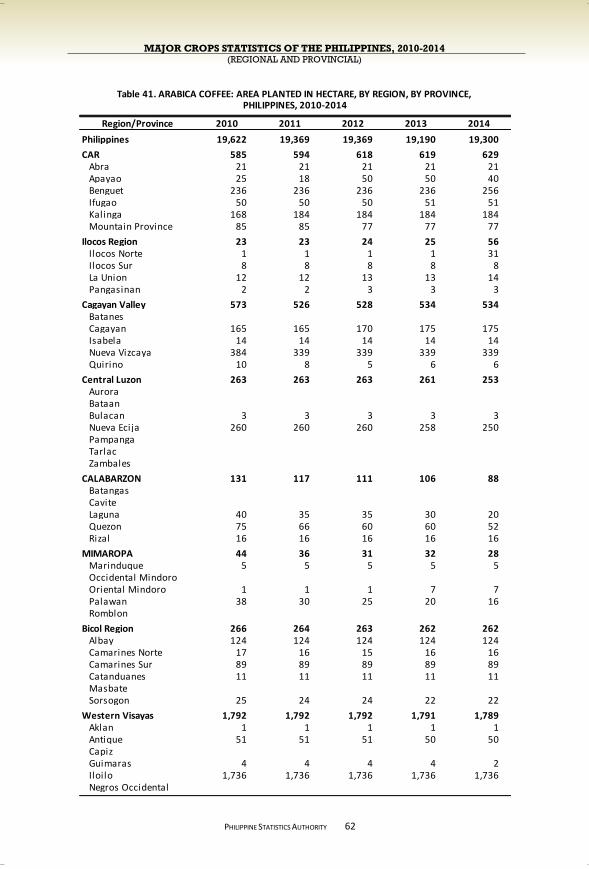
MAJOR CROPS STATISTICS OF THE PHILIPPINES, 2010-2014 (REGIONAL AND PROVINCIAL)
PHILIPPINE STATISTICS AUTHORITY
62
Region/Province 2010 2011 2012 2013 2014
Philippines 19,622 19,369 19,369 19,190 19,300
CAR 585 594 618 619 629 Abra 21 21 21 21 21 Apayao 25 18 50 50 40 Benguet 236 236 236 236 256 Ifugao 50 50 50 51 51 Kalinga 168 184 184 184 184 Mountain Province 85 85 77 77 77
Ilocos Region 23 23 24 25 56 Ilocos Norte 1 1 1 1 31 Ilocos Sur 8 8 8 8 8 La Union 12 12 13 13 14 Pangasinan 2 2 3 3 3
Cagayan Valley 573 526 528 534 534 Batanes Cagayan 165 165 170 175 175 Isabela 14 14 14 14 14 Nueva Vizcaya 384 339 339 339 339 Quirino 10 8 5 6 6
Central Luzon 263 263 263 261 253 Aurora Bataan Bulacan 3 3 3 3 3 Nueva Ecija 260 260 260 258 250 Pampanga Tarlac Zambales
CALABARZON 131 117 111 106 88 Batangas Cavite Laguna 40 35 35 30 20 Quezon 75 66 60 60 52 Rizal 16 16 16 16 16
MIMAROPA 44 36 31 32 28 Marinduque 5 5 5 5 5 Occidental Mindoro Oriental Mindoro 1 1 1 7 7 Palawan 38 30 25 20 16 Romblon
Bicol Region 266 264 263 262 262 Albay 124 124 124 124 124 Camarines Norte 17 16 15 16 16 Camarines Sur 89 89 89 89 89 Catanduanes 11 11 11 11 11 Masbate Sorsogon 25 24 24 22 22
Western Visayas 1,792 1,792 1,792 1,791 1,789 Aklan 1 1 1 1 1 Antique 51 51 51 50 50 Capiz Guimaras 4 4 4 4 2 Iloilo 1,736 1,736 1,736 1,736 1,736 Negros Occidental
PHILIPPINES, 2010-2014Table 41. ARABICA COFFEE: AREA PLANTED IN HECTARE, BY REGION, BY PROVINCE,
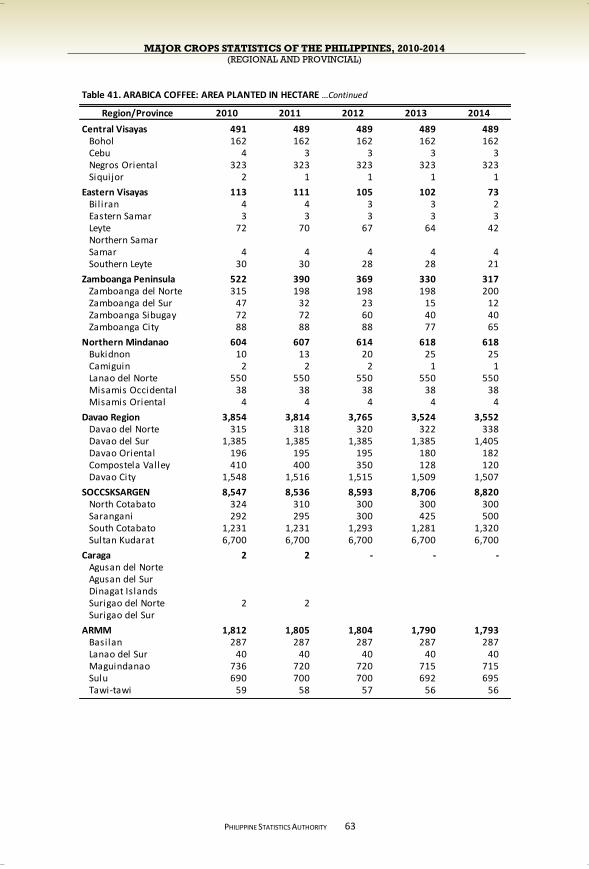
MAJOR CROPS STATISTICS OF THE PHILIPPINES, 2010-2014 (REGIONAL AND PROVINCIAL)
PHILIPPINE STATISTICS AUTHORITY
63
Region/Province 2010 2011 2012 2013 2014
Central Visayas 491 489 489 489 489 Bohol 162 162 162 162 162 Cebu 4 3 3 3 3 Negros Oriental 323 323 323 323 323 Siquijor 2 1 1 1 1
Eastern Visayas 113 111 105 102 73 Bil iran 4 4 3 3 2 Eastern Samar 3 3 3 3 3 Leyte 72 70 67 64 42 Northern Samar Samar 4 4 4 4 4 Southern Leyte 30 30 28 28 21
Zamboanga Peninsula 522 390 369 330 317 Zamboanga del Norte 315 198 198 198 200 Zamboanga del Sur 47 32 23 15 12 Zamboanga Sibugay 72 72 60 40 40 Zamboanga City 88 88 88 77 65
Northern Mindanao 604 607 614 618 618 Bukidnon 10 13 20 25 25 Camiguin 2 2 2 1 1 Lanao del Norte 550 550 550 550 550 Misamis Occidental 38 38 38 38 38 Misamis Oriental 4 4 4 4 4
Davao Region 3,854 3,814 3,765 3,524 3,552 Davao del Norte 315 318 320 322 338 Davao del Sur 1,385 1,385 1,385 1,385 1,405 Davao Oriental 196 195 195 180 182 Compostela Valley 410 400 350 128 120 Davao City 1,548 1,516 1,515 1,509 1,507
SOCCSKSARGEN 8,547 8,536 8,593 8,706 8,820 North Cotabato 324 310 300 300 300 Sarangani 292 295 300 425 500 South Cotabato 1,231 1,231 1,293 1,281 1,320 Sultan Kudarat 6,700 6,700 6,700 6,700 6,700
Caraga 2 2 - - - Agusan del Norte Agusan del Sur Dinagat Islands Surigao del Norte 2 2 Surigao del Sur
ARMM 1,812 1,805 1,804 1,790 1,793 Basilan 287 287 287 287 287 Lanao del Sur 40 40 40 40 40 Maguindanao 736 720 720 715 715 Sulu 690 700 700 692 695 Tawi-tawi 59 58 57 56 56
Table 41. ARABICA COFFEE: AREA PLANTED IN HECTARE …Continued
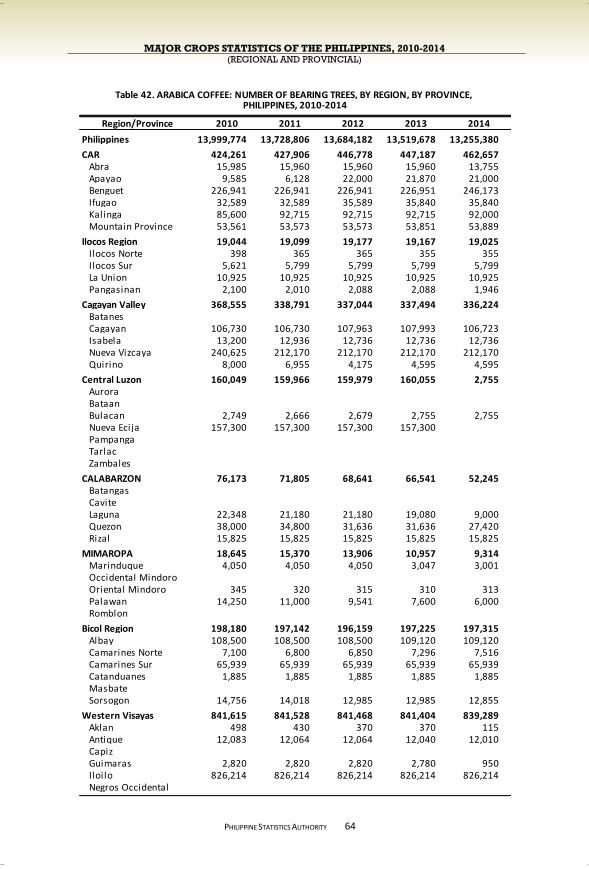
MAJOR CROPS STATISTICS OF THE PHILIPPINES, 2010-2014 (REGIONAL AND PROVINCIAL)
PHILIPPINE STATISTICS AUTHORITY
64
Region/Province 2010 2011 2012 2013 2014
Philippines 13,999,774 13,728,806 13,684,182 13,519,678 13,255,380
CAR 424,261 427,906 446,778 447,187 462,657 Abra 15,985 15,960 15,960 15,960 13,755 Apayao 9,585 6,128 22,000 21,870 21,000 Benguet 226,941 226,941 226,941 226,951 246,173 Ifugao 32,589 32,589 35,589 35,840 35,840 Kalinga 85,600 92,715 92,715 92,715 92,000 Mountain Province 53,561 53,573 53,573 53,851 53,889
Ilocos Region 19,044 19,099 19,177 19,167 19,025 Ilocos Norte 398 365 365 355 355 Ilocos Sur 5,621 5,799 5,799 5,799 5,799 La Union 10,925 10,925 10,925 10,925 10,925 Pangasinan 2,100 2,010 2,088 2,088 1,946
Cagayan Valley 368,555 338,791 337,044 337,494 336,224 Batanes Cagayan 106,730 106,730 107,963 107,993 106,723 Isabela 13,200 12,936 12,736 12,736 12,736 Nueva Vizcaya 240,625 212,170 212,170 212,170 212,170 Quirino 8,000 6,955 4,175 4,595 4,595
Central Luzon 160,049 159,966 159,979 160,055 2,755 Aurora Bataan Bulacan 2,749 2,666 2,679 2,755 2,755 Nueva Ecija 157,300 157,300 157,300 157,300 Pampanga Tarlac Zambales
CALABARZON 76,173 71,805 68,641 66,541 52,245 Batangas Cavite Laguna 22,348 21,180 21,180 19,080 9,000 Quezon 38,000 34,800 31,636 31,636 27,420 Rizal 15,825 15,825 15,825 15,825 15,825
MIMAROPA 18,645 15,370 13,906 10,957 9,314 Marinduque 4,050 4,050 4,050 3,047 3,001 Occidental Mindoro Oriental Mindoro 345 320 315 310 313 Palawan 14,250 11,000 9,541 7,600 6,000 Romblon
Bicol Region 198,180 197,142 196,159 197,225 197,315 Albay 108,500 108,500 108,500 109,120 109,120 Camarines Norte 7,100 6,800 6,850 7,296 7,516 Camarines Sur 65,939 65,939 65,939 65,939 65,939 Catanduanes 1,885 1,885 1,885 1,885 1,885 Masbate Sorsogon 14,756 14,018 12,985 12,985 12,855
Western Visayas 841,615 841,528 841,468 841,404 839,289 Aklan 498 430 370 370 115 Antique 12,083 12,064 12,064 12,040 12,010 Capiz Guimaras 2,820 2,820 2,820 2,780 950 Iloilo 826,214 826,214 826,214 826,214 826,214 Negros Occidental
Table 42. ARABICA COFFEE: NUMBER OF BEARING TREES, BY REGION, BY PROVINCE, PHILIPPINES, 2010-2014
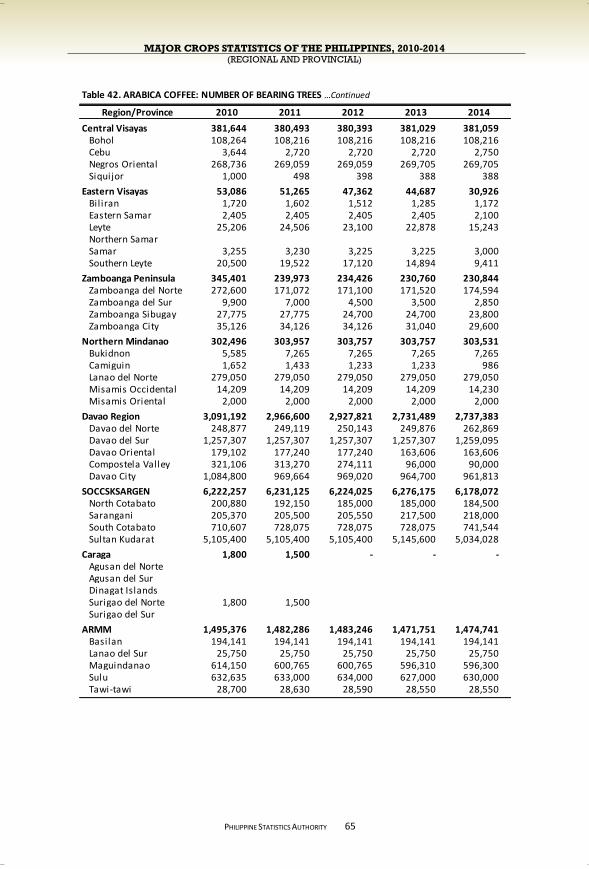
MAJOR CROPS STATISTICS OF THE PHILIPPINES, 2010-2014 (REGIONAL AND PROVINCIAL)
PHILIPPINE STATISTICS AUTHORITY
65
Region/Province 2010 2011 2012 2013 2014
Central Visayas 381,644 380,493 380,393 381,029 381,059 Bohol 108,264 108,216 108,216 108,216 108,216 Cebu 3,644 2,720 2,720 2,720 2,750 Negros Oriental 268,736 269,059 269,059 269,705 269,705 Siquijor 1,000 498 398 388 388
Eastern Visayas 53,086 51,265 47,362 44,687 30,926 Bil iran 1,720 1,602 1,512 1,285 1,172 Eastern Samar 2,405 2,405 2,405 2,405 2,100 Leyte 25,206 24,506 23,100 22,878 15,243 Northern Samar Samar 3,255 3,230 3,225 3,225 3,000 Southern Leyte 20,500 19,522 17,120 14,894 9,411
Zamboanga Peninsula 345,401 239,973 234,426 230,760 230,844 Zamboanga del Norte 272,600 171,072 171,100 171,520 174,594 Zamboanga del Sur 9,900 7,000 4,500 3,500 2,850 Zamboanga Sibugay 27,775 27,775 24,700 24,700 23,800 Zamboanga City 35,126 34,126 34,126 31,040 29,600
Northern Mindanao 302,496 303,957 303,757 303,757 303,531 Bukidnon 5,585 7,265 7,265 7,265 7,265 Camiguin 1,652 1,433 1,233 1,233 986 Lanao del Norte 279,050 279,050 279,050 279,050 279,050 Misamis Occidental 14,209 14,209 14,209 14,209 14,230 Misamis Oriental 2,000 2,000 2,000 2,000 2,000
Davao Region 3,091,192 2,966,600 2,927,821 2,731,489 2,737,383 Davao del Norte 248,877 249,119 250,143 249,876 262,869 Davao del Sur 1,257,307 1,257,307 1,257,307 1,257,307 1,259,095 Davao Oriental 179,102 177,240 177,240 163,606 163,606 Compostela Valley 321,106 313,270 274,111 96,000 90,000 Davao City 1,084,800 969,664 969,020 964,700 961,813
SOCCSKSARGEN 6,222,257 6,231,125 6,224,025 6,276,175 6,178,072 North Cotabato 200,880 192,150 185,000 185,000 184,500 Sarangani 205,370 205,500 205,550 217,500 218,000 South Cotabato 710,607 728,075 728,075 728,075 741,544 Sultan Kudarat 5,105,400 5,105,400 5,105,400 5,145,600 5,034,028
Caraga 1,800 1,500 - - - Agusan del Norte Agusan del Sur Dinagat Islands Surigao del Norte 1,800 1,500 Surigao del Sur
ARMM 1,495,376 1,482,286 1,483,246 1,471,751 1,474,741 Basilan 194,141 194,141 194,141 194,141 194,141 Lanao del Sur 25,750 25,750 25,750 25,750 25,750 Maguindanao 614,150 600,765 600,765 596,310 596,300 Sulu 632,635 633,000 634,000 627,000 630,000 Tawi-tawi 28,700 28,630 28,590 28,550 28,550
Table 42. ARABICA COFFEE: NUMBER OF BEARING TREES …Continued
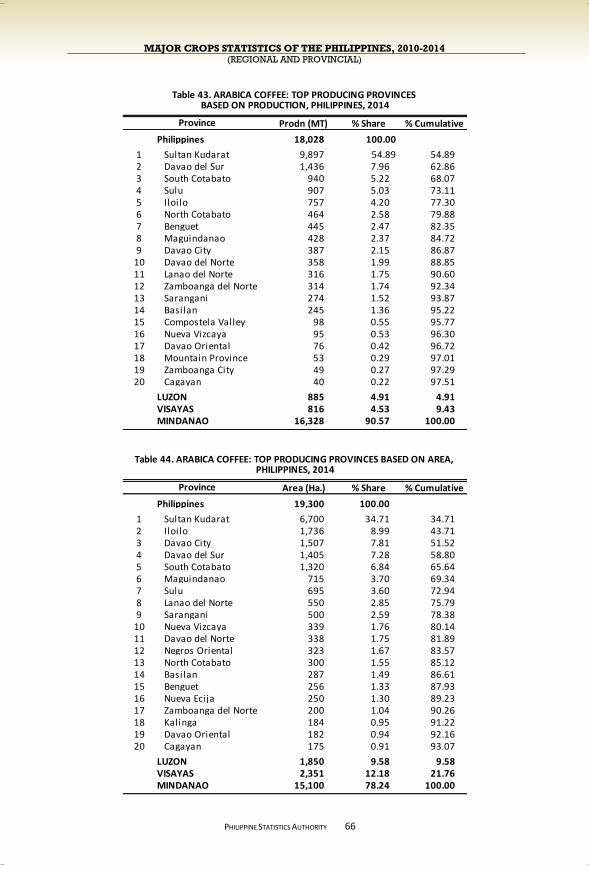
MAJOR CROPS STATISTICS OF THE PHILIPPINES, 2010-2014 (REGIONAL AND PROVINCIAL)
PHILIPPINE STATISTICS AUTHORITY
66
Prodn (MT) % Share % Cumulative
Philippines 18,028 100.00
1 Sultan Kudarat 9,897 54.89 54.892 Davao del Sur 1,436 7.96 62.863 South Cotabato 940 5.22 68.074 Sulu 907 5.03 73.115 Iloilo 757 4.20 77.306 North Cotabato 464 2.58 79.887 Benguet 445 2.47 82.358 Maguindanao 428 2.37 84.729 Davao City 387 2.15 86.87
10 Davao del Norte 358 1.99 88.8511 Lanao del Norte 316 1.75 90.6012 Zamboanga del Norte 314 1.74 92.3413 Sarangani 274 1.52 93.8714 Basilan 245 1.36 95.2215 Compostela Valley 98 0.55 95.7716 Nueva Vizcaya 95 0.53 96.3017 Davao Oriental 76 0.42 96.7218 Mountain Province 53 0.29 97.0119 Zamboanga City 49 0.27 97.2920 Cagayan 40 0.22 97.51
LUZON 885 4.91 4.91VISAYAS 816 4.53 9.43MINDANAO 16,328 90.57 100.00
Area (Ha.) % Share % Cumulative
Philippines 19,300 100.00
1 Sultan Kudarat 6,700 34.71 34.712 Iloilo 1,736 8.99 43.713 Davao City 1,507 7.81 51.524 Davao del Sur 1,405 7.28 58.805 South Cotabato 1,320 6.84 65.646 Maguindanao 715 3.70 69.347 Sulu 695 3.60 72.948 Lanao del Norte 550 2.85 75.799 Sarangani 500 2.59 78.38
10 Nueva Vizcaya 339 1.76 80.1411 Davao del Norte 338 1.75 81.8912 Negros Oriental 323 1.67 83.5713 North Cotabato 300 1.55 85.1214 Basilan 287 1.49 86.6115 Benguet 256 1.33 87.9316 Nueva Ecija 250 1.30 89.2317 Zamboanga del Norte 200 1.04 90.2618 Kalinga 184 0.95 91.2219 Davao Oriental 182 0.94 92.1620 Cagayan 175 0.91 93.07
LUZON 1,850 9.58 9.58VISAYAS 2,351 12.18 21.76MINDANAO 15,100 78.24 100.00
Table 43. ARABICA COFFEE: TOP PRODUCING PROVINCES BASED ON PRODUCTION, PHILIPPINES, 2014
Province
Table 44. ARABICA COFFEE: TOP PRODUCING PROVINCES BASED ON AREA, PHILIPPINES, 2014
Province
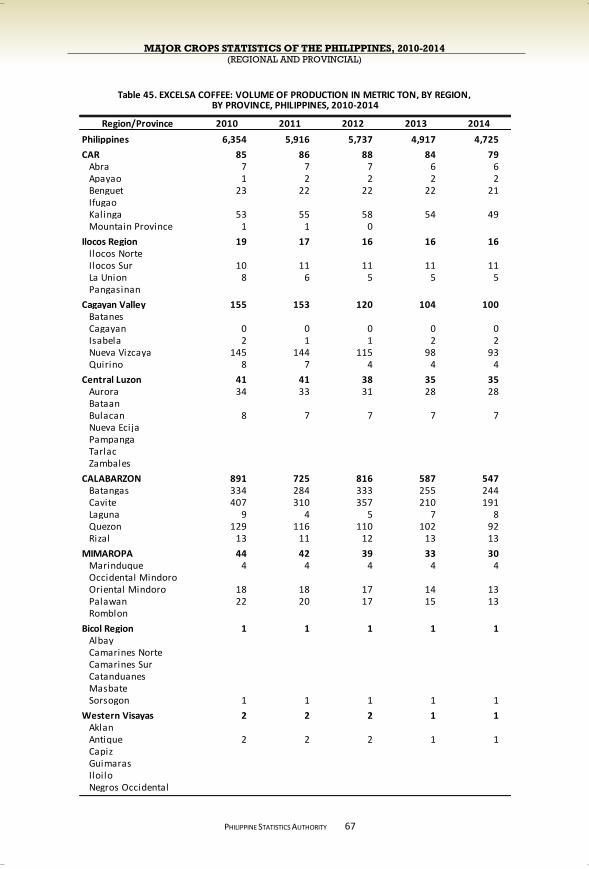
MAJOR CROPS STATISTICS OF THE PHILIPPINES, 2010-2014 (REGIONAL AND PROVINCIAL)
PHILIPPINE STATISTICS AUTHORITY
67
Region/Province 2010 2011 2012 2013 2014
Philippines 6,354 5,916 5,737 4,917 4,725
CAR 85 86 88 84 79 Abra 7 7 7 6 6 Apayao 1 2 2 2 2 Benguet 23 22 22 22 21 Ifugao Kalinga 53 55 58 54 49 Mountain Province 1 1 0
Ilocos Region 19 17 16 16 16 Ilocos Norte Ilocos Sur 10 11 11 11 11 La Union 8 6 5 5 5 Pangasinan
Cagayan Valley 155 153 120 104 100 Batanes Cagayan 0 0 0 0 0 Isabela 2 1 1 2 2 Nueva Vizcaya 145 144 115 98 93 Quirino 8 7 4 4 4
Central Luzon 41 41 38 35 35 Aurora 34 33 31 28 28 Bataan Bulacan 8 7 7 7 7 Nueva Ecija Pampanga Tarlac Zambales
CALABARZON 891 725 816 587 547 Batangas 334 284 333 255 244 Cavite 407 310 357 210 191 Laguna 9 4 5 7 8 Quezon 129 116 110 102 92 Rizal 13 11 12 13 13
MIMAROPA 44 42 39 33 30 Marinduque 4 4 4 4 4 Occidental Mindoro Oriental Mindoro 18 18 17 14 13 Palawan 22 20 17 15 13 Romblon
Bicol Region 1 1 1 1 1 Albay Camarines Norte Camarines Sur Catanduanes Masbate Sorsogon 1 1 1 1 1
Western Visayas 2 2 2 1 1 Aklan Antique 2 2 2 1 1 Capiz Guimaras Iloilo Negros Occidental
BY PROVINCE, PHILIPPINES, 2010-2014Table 45. EXCELSA COFFEE: VOLUME OF PRODUCTION IN METRIC TON, BY REGION,

MAJOR CROPS STATISTICS OF THE PHILIPPINES, 2010-2014 (REGIONAL AND PROVINCIAL)
PHILIPPINE STATISTICS AUTHORITY
68
Region/Province 2010 2011 2012 2013 2014
Central Visayas - - - - - Bohol Cebu Negros Oriental - Siquijor
Eastern Visayas 43 42 40 26 14 Bil iran 1 1 1 1 1 Eastern Samar Leyte 23 22 22 13 6 Northern Samar Samar 1 1 1 1 1 Southern Leyte 18 17 17 11 7
Zamboanga Peninsula 143 125 117 109 107 Zamboanga del Norte 64 54 55 54 55 Zamboanga del Sur 12 9 7 5 4 Zamboanga Sibugay 22 20 22 20 18 Zamboanga City 44 42 33 31 30
Northern Mindanao 354 349 346 298 261 Bukidnon 7 7 3 6 8 Camiguin Lanao del Norte 29 26 24 24 23 Misamis Occidental Misamis Oriental 318 316 319 268 230
Davao Region 2,433 2,236 2,062 1,602 1,505 Davao del Norte 182 182 185 179 185 Davao del Sur 743 755 762 768 793 Davao Oriental 124 122 120 114 114 Compostela Valley 938 797 646 209 105 Davao City 445 381 349 331 308
SOCCSKSARGEN 594 575 599 613 625 North Cotabato 535 516 540 552 564 Sarangani 50 52 52 53 54 South Cotabato - - - - 1 Sultan Kudarat 9 7 7 7 7
Caraga 61 30 22 10 7 Agusan del Norte 36 16 10 3 3 Agusan del Sur 22 13 11 6 4 Dinagat Islands 0 0 Surigao del Norte 2 2 2 1 1 Surigao del Sur
ARMM 1,489 1,492 1,429 1,398 1,397 Basilan 26 24 24 23 22 Lanao del Sur Maguindanao 24 21 21 17 16 Sulu 1,365 1,375 1,323 1,301 1,306 Tawi-tawi 75 72 61 57 53
Note: Dinagat Islands data dissagregated from Surigao del Norte.
Table 45. EXCELSA COFFEE: VOLUME OF PRODUCTION IN METRIC TON …Continued
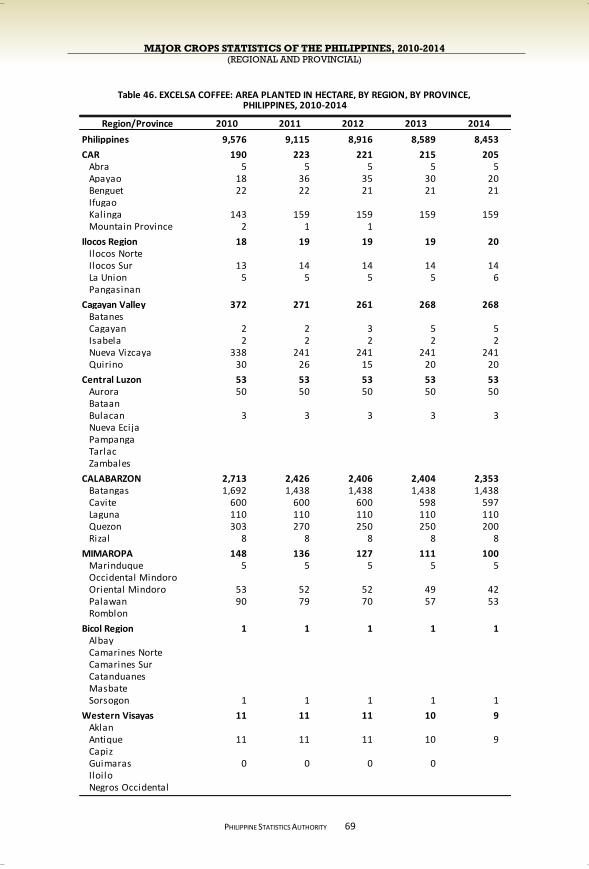
MAJOR CROPS STATISTICS OF THE PHILIPPINES, 2010-2014 (REGIONAL AND PROVINCIAL)
PHILIPPINE STATISTICS AUTHORITY
69
Region/Province 2010 2011 2012 2013 2014
Philippines 9,576 9,115 8,916 8,589 8,453
CAR 190 223 221 215 205 Abra 5 5 5 5 5 Apayao 18 36 35 30 20 Benguet 22 22 21 21 21 Ifugao Kalinga 143 159 159 159 159 Mountain Province 2 1 1
Ilocos Region 18 19 19 19 20 Ilocos Norte Ilocos Sur 13 14 14 14 14 La Union 5 5 5 5 6 Pangasinan
Cagayan Valley 372 271 261 268 268 Batanes Cagayan 2 2 3 5 5 Isabela 2 2 2 2 2 Nueva Vizcaya 338 241 241 241 241 Quirino 30 26 15 20 20
Central Luzon 53 53 53 53 53 Aurora 50 50 50 50 50 Bataan Bulacan 3 3 3 3 3 Nueva Ecija Pampanga Tarlac Zambales
CALABARZON 2,713 2,426 2,406 2,404 2,353 Batangas 1,692 1,438 1,438 1,438 1,438 Cavite 600 600 600 598 597 Laguna 110 110 110 110 110 Quezon 303 270 250 250 200 Rizal 8 8 8 8 8
MIMAROPA 148 136 127 111 100 Marinduque 5 5 5 5 5 Occidental Mindoro Oriental Mindoro 53 52 52 49 42 Palawan 90 79 70 57 53 Romblon
Bicol Region 1 1 1 1 1 Albay Camarines Norte Camarines Sur Catanduanes Masbate Sorsogon 1 1 1 1 1
Western Visayas 11 11 11 10 9 Aklan Antique 11 11 11 10 9 Capiz Guimaras 0 0 0 0 Iloilo Negros Occidental
PHILIPPINES, 2010-2014Table 46. EXCELSA COFFEE: AREA PLANTED IN HECTARE, BY REGION, BY PROVINCE,
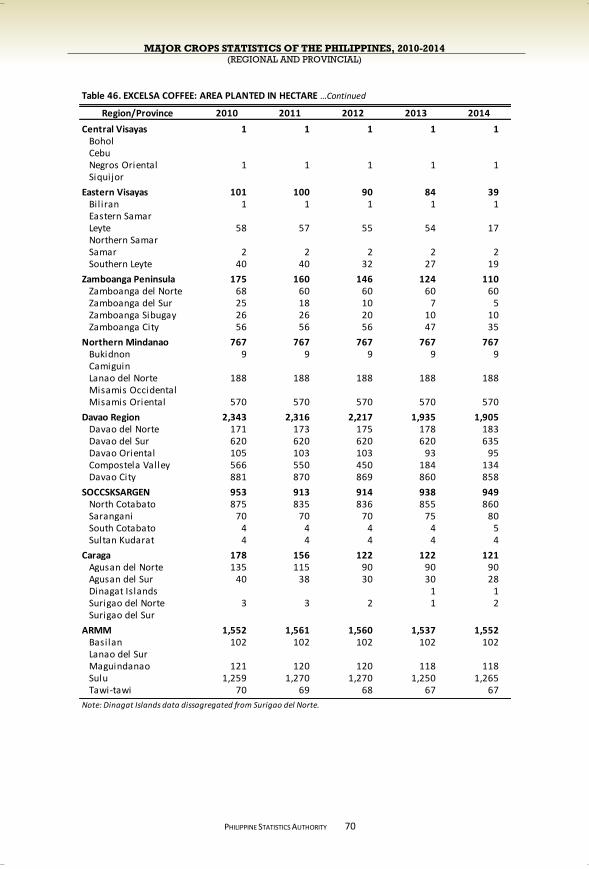
MAJOR CROPS STATISTICS OF THE PHILIPPINES, 2010-2014 (REGIONAL AND PROVINCIAL)
PHILIPPINE STATISTICS AUTHORITY
70
Region/Province 2010 2011 2012 2013 2014
Central Visayas 1 1 1 1 1 Bohol Cebu Negros Oriental 1 1 1 1 1 Siquijor
Eastern Visayas 101 100 90 84 39 Bil iran 1 1 1 1 1 Eastern Samar Leyte 58 57 55 54 17 Northern Samar Samar 2 2 2 2 2 Southern Leyte 40 40 32 27 19
Zamboanga Peninsula 175 160 146 124 110 Zamboanga del Norte 68 60 60 60 60 Zamboanga del Sur 25 18 10 7 5 Zamboanga Sibugay 26 26 20 10 10 Zamboanga City 56 56 56 47 35
Northern Mindanao 767 767 767 767 767 Bukidnon 9 9 9 9 9 Camiguin Lanao del Norte 188 188 188 188 188 Misamis Occidental Misamis Oriental 570 570 570 570 570
Davao Region 2,343 2,316 2,217 1,935 1,905 Davao del Norte 171 173 175 178 183 Davao del Sur 620 620 620 620 635 Davao Oriental 105 103 103 93 95 Compostela Valley 566 550 450 184 134 Davao City 881 870 869 860 858
SOCCSKSARGEN 953 913 914 938 949 North Cotabato 875 835 836 855 860 Sarangani 70 70 70 75 80 South Cotabato 4 4 4 4 5 Sultan Kudarat 4 4 4 4 4
Caraga 178 156 122 122 121 Agusan del Norte 135 115 90 90 90 Agusan del Sur 40 38 30 30 28 Dinagat Islands 1 1 Surigao del Norte 3 3 2 1 2 Surigao del Sur
ARMM 1,552 1,561 1,560 1,537 1,552 Basilan 102 102 102 102 102 Lanao del Sur Maguindanao 121 120 120 118 118 Sulu 1,259 1,270 1,270 1,250 1,265 Tawi-tawi 70 69 68 67 67
Note: Dinagat Islands data dissagregated from Surigao del Norte.
Table 46. EXCELSA COFFEE: AREA PLANTED IN HECTARE …Continued
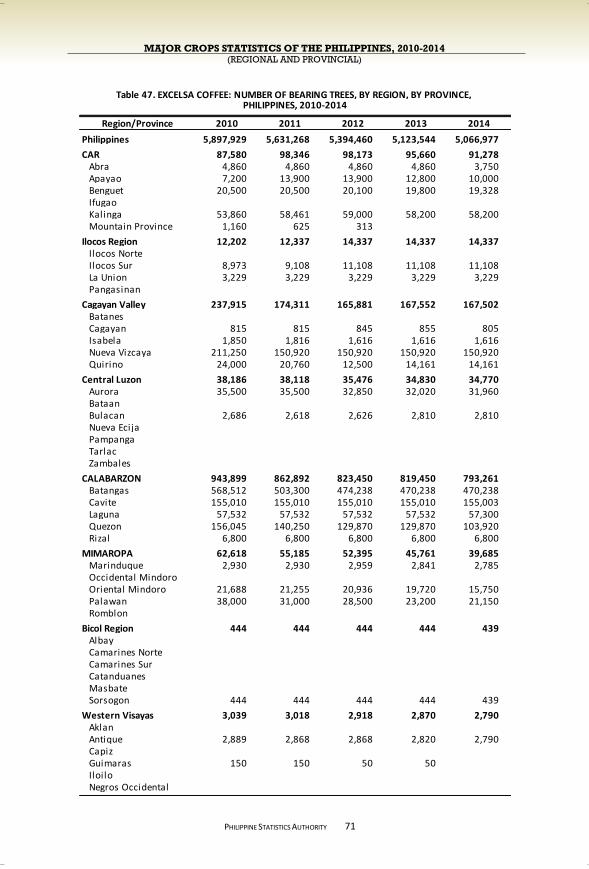
MAJOR CROPS STATISTICS OF THE PHILIPPINES, 2010-2014 (REGIONAL AND PROVINCIAL)
PHILIPPINE STATISTICS AUTHORITY
71
Region/Province 2010 2011 2012 2013 2014
Philippines 5,897,929 5,631,268 5,394,460 5,123,544 5,066,977
CAR 87,580 98,346 98,173 95,660 91,278 Abra 4,860 4,860 4,860 4,860 3,750 Apayao 7,200 13,900 13,900 12,800 10,000 Benguet 20,500 20,500 20,100 19,800 19,328 Ifugao Kalinga 53,860 58,461 59,000 58,200 58,200 Mountain Province 1,160 625 313
Ilocos Region 12,202 12,337 14,337 14,337 14,337 Ilocos Norte Ilocos Sur 8,973 9,108 11,108 11,108 11,108 La Union 3,229 3,229 3,229 3,229 3,229 Pangasinan
Cagayan Valley 237,915 174,311 165,881 167,552 167,502 Batanes Cagayan 815 815 845 855 805 Isabela 1,850 1,816 1,616 1,616 1,616 Nueva Vizcaya 211,250 150,920 150,920 150,920 150,920 Quirino 24,000 20,760 12,500 14,161 14,161
Central Luzon 38,186 38,118 35,476 34,830 34,770 Aurora 35,500 35,500 32,850 32,020 31,960 Bataan Bulacan 2,686 2,618 2,626 2,810 2,810 Nueva Ecija Pampanga Tarlac Zambales
CALABARZON 943,899 862,892 823,450 819,450 793,261 Batangas 568,512 503,300 474,238 470,238 470,238 Cavite 155,010 155,010 155,010 155,010 155,003 Laguna 57,532 57,532 57,532 57,532 57,300 Quezon 156,045 140,250 129,870 129,870 103,920 Rizal 6,800 6,800 6,800 6,800 6,800
MIMAROPA 62,618 55,185 52,395 45,761 39,685 Marinduque 2,930 2,930 2,959 2,841 2,785 Occidental Mindoro Oriental Mindoro 21,688 21,255 20,936 19,720 15,750 Palawan 38,000 31,000 28,500 23,200 21,150 Romblon
Bicol Region 444 444 444 444 439 Albay Camarines Norte Camarines Sur Catanduanes Masbate Sorsogon 444 444 444 444 439
Western Visayas 3,039 3,018 2,918 2,870 2,790 Aklan Antique 2,889 2,868 2,868 2,820 2,790 Capiz Guimaras 150 150 50 50 Iloilo Negros Occidental
PHILIPPINES, 2010-2014Table 47. EXCELSA COFFEE: NUMBER OF BEARING TREES, BY REGION, BY PROVINCE,
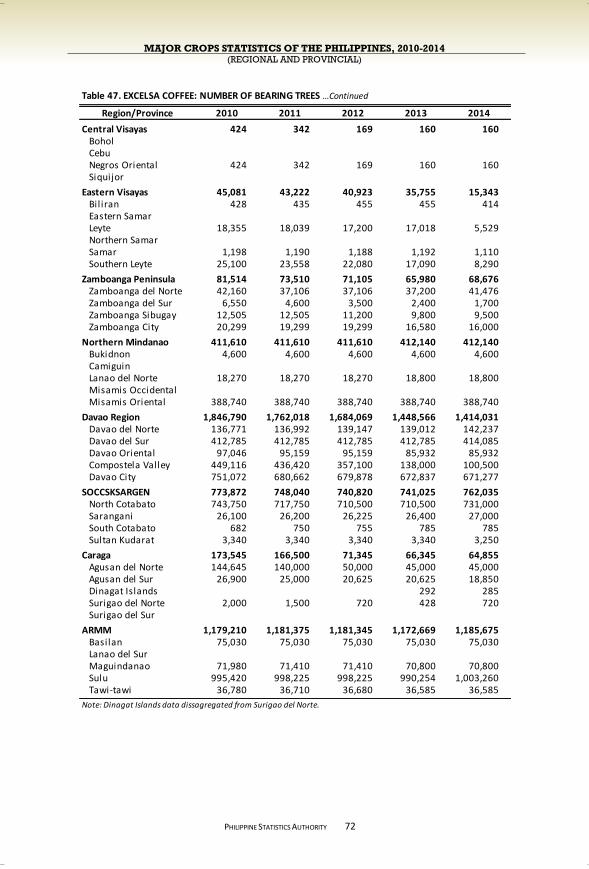
MAJOR CROPS STATISTICS OF THE PHILIPPINES, 2010-2014 (REGIONAL AND PROVINCIAL)
PHILIPPINE STATISTICS AUTHORITY
72
Region/Province 2010 2011 2012 2013 2014
Central Visayas 424 342 169 160 160 Bohol Cebu Negros Oriental 424 342 169 160 160 Siquijor
Eastern Visayas 45,081 43,222 40,923 35,755 15,343 Bil iran 428 435 455 455 414 Eastern Samar Leyte 18,355 18,039 17,200 17,018 5,529 Northern Samar Samar 1,198 1,190 1,188 1,192 1,110 Southern Leyte 25,100 23,558 22,080 17,090 8,290
Zamboanga Peninsula 81,514 73,510 71,105 65,980 68,676 Zamboanga del Norte 42,160 37,106 37,106 37,200 41,476 Zamboanga del Sur 6,550 4,600 3,500 2,400 1,700 Zamboanga Sibugay 12,505 12,505 11,200 9,800 9,500 Zamboanga City 20,299 19,299 19,299 16,580 16,000
Northern Mindanao 411,610 411,610 411,610 412,140 412,140 Bukidnon 4,600 4,600 4,600 4,600 4,600 Camiguin Lanao del Norte 18,270 18,270 18,270 18,800 18,800 Misamis Occidental Misamis Oriental 388,740 388,740 388,740 388,740 388,740
Davao Region 1,846,790 1,762,018 1,684,069 1,448,566 1,414,031 Davao del Norte 136,771 136,992 139,147 139,012 142,237 Davao del Sur 412,785 412,785 412,785 412,785 414,085 Davao Oriental 97,046 95,159 95,159 85,932 85,932 Compostela Valley 449,116 436,420 357,100 138,000 100,500 Davao City 751,072 680,662 679,878 672,837 671,277
SOCCSKSARGEN 773,872 748,040 740,820 741,025 762,035 North Cotabato 743,750 717,750 710,500 710,500 731,000 Sarangani 26,100 26,200 26,225 26,400 27,000 South Cotabato 682 750 755 785 785 Sultan Kudarat 3,340 3,340 3,340 3,340 3,250
Caraga 173,545 166,500 71,345 66,345 64,855 Agusan del Norte 144,645 140,000 50,000 45,000 45,000 Agusan del Sur 26,900 25,000 20,625 20,625 18,850 Dinagat Islands 292 285 Surigao del Norte 2,000 1,500 720 428 720 Surigao del Sur
ARMM 1,179,210 1,181,375 1,181,345 1,172,669 1,185,675 Basilan 75,030 75,030 75,030 75,030 75,030 Lanao del Sur Maguindanao 71,980 71,410 71,410 70,800 70,800 Sulu 995,420 998,225 998,225 990,254 1,003,260 Tawi-tawi 36,780 36,710 36,680 36,585 36,585
Note: Dinagat Islands data dissagregated from Surigao del Norte.
Table 47. EXCELSA COFFEE: NUMBER OF BEARING TREES …Continued
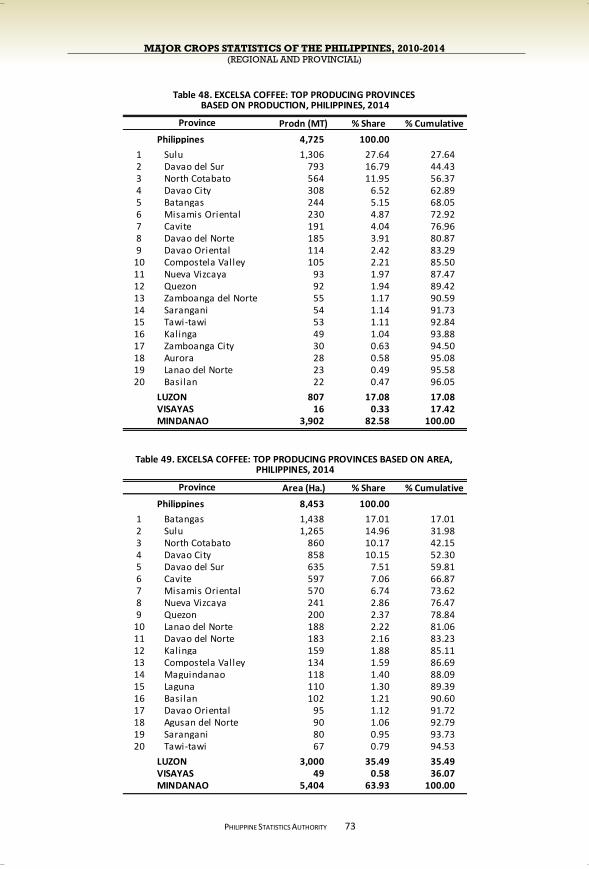
MAJOR CROPS STATISTICS OF THE PHILIPPINES, 2010-2014 (REGIONAL AND PROVINCIAL)
PHILIPPINE STATISTICS AUTHORITY
73
Prodn (MT) % Share % Cumulative
Philippines 4,725 100.00
1 Sulu 1,306 27.64 27.642 Davao del Sur 793 16.79 44.433 North Cotabato 564 11.95 56.374 Davao City 308 6.52 62.895 Batangas 244 5.15 68.056 Misamis Oriental 230 4.87 72.927 Cavite 191 4.04 76.968 Davao del Norte 185 3.91 80.879 Davao Oriental 114 2.42 83.29
10 Compostela Valley 105 2.21 85.5011 Nueva Vizcaya 93 1.97 87.4712 Quezon 92 1.94 89.4213 Zamboanga del Norte 55 1.17 90.5914 Sarangani 54 1.14 91.7315 Tawi-tawi 53 1.11 92.8416 Kalinga 49 1.04 93.8817 Zamboanga City 30 0.63 94.5018 Aurora 28 0.58 95.0819 Lanao del Norte 23 0.49 95.5820 Basilan 22 0.47 96.05
LUZON 807 17.08 17.08VISAYAS 16 0.33 17.42MINDANAO 3,902 82.58 100.00
Area (Ha.) % Share % Cumulative
Philippines 8,453 100.00
1 Batangas 1,438 17.01 17.012 Sulu 1,265 14.96 31.983 North Cotabato 860 10.17 42.154 Davao City 858 10.15 52.305 Davao del Sur 635 7.51 59.816 Cavite 597 7.06 66.877 Misamis Oriental 570 6.74 73.628 Nueva Vizcaya 241 2.86 76.479 Quezon 200 2.37 78.84
10 Lanao del Norte 188 2.22 81.0611 Davao del Norte 183 2.16 83.2312 Kalinga 159 1.88 85.1113 Compostela Valley 134 1.59 86.6914 Maguindanao 118 1.40 88.0915 Laguna 110 1.30 89.3916 Basilan 102 1.21 90.6017 Davao Oriental 95 1.12 91.7218 Agusan del Norte 90 1.06 92.7919 Sarangani 80 0.95 93.7320 Tawi-tawi 67 0.79 94.53
LUZON 3,000 35.49 35.49VISAYAS 49 0.58 36.07MINDANAO 5,404 63.93 100.00
Table 48. EXCELSA COFFEE: TOP PRODUCING PROVINCES BASED ON PRODUCTION, PHILIPPINES, 2014
Province
Table 49. EXCELSA COFFEE: TOP PRODUCING PROVINCES BASED ON AREA, PHILIPPINES, 2014
Province
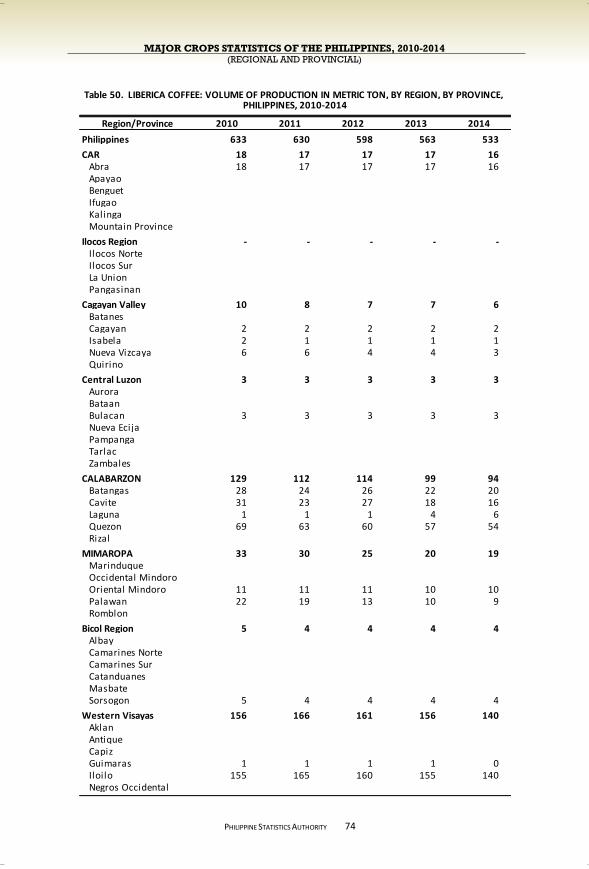
MAJOR CROPS STATISTICS OF THE PHILIPPINES, 2010-2014 (REGIONAL AND PROVINCIAL)
PHILIPPINE STATISTICS AUTHORITY
74
Region/Province 2010 2011 2012 2013 2014
Philippines 633 630 598 563 533
CAR 18 17 17 17 16 Abra 18 17 17 17 16 Apayao Benguet Ifugao Kalinga Mountain Province
Ilocos Region - - - - - Ilocos Norte Ilocos Sur La Union Pangasinan
Cagayan Valley 10 8 7 7 6 Batanes Cagayan 2 2 2 2 2 Isabela 2 1 1 1 1 Nueva Vizcaya 6 6 4 4 3 Quirino
Central Luzon 3 3 3 3 3 Aurora Bataan Bulacan 3 3 3 3 3 Nueva Ecija Pampanga Tarlac Zambales
CALABARZON 129 112 114 99 94 Batangas 28 24 26 22 20 Cavite 31 23 27 18 16 Laguna 1 1 1 4 6 Quezon 69 63 60 57 54 Rizal
MIMAROPA 33 30 25 20 19 Marinduque Occidental Mindoro Oriental Mindoro 11 11 11 10 10 Palawan 22 19 13 10 9 Romblon
Bicol Region 5 4 4 4 4 Albay Camarines Norte Camarines Sur Catanduanes Masbate Sorsogon 5 4 4 4 4
Western Visayas 156 166 161 156 140 Aklan Antique Capiz Guimaras 1 1 1 1 0 Iloilo 155 165 160 155 140 Negros Occidental
PHILIPPINES, 2010-2014Table 50. LIBERICA COFFEE: VOLUME OF PRODUCTION IN METRIC TON, BY REGION, BY PROVINCE,
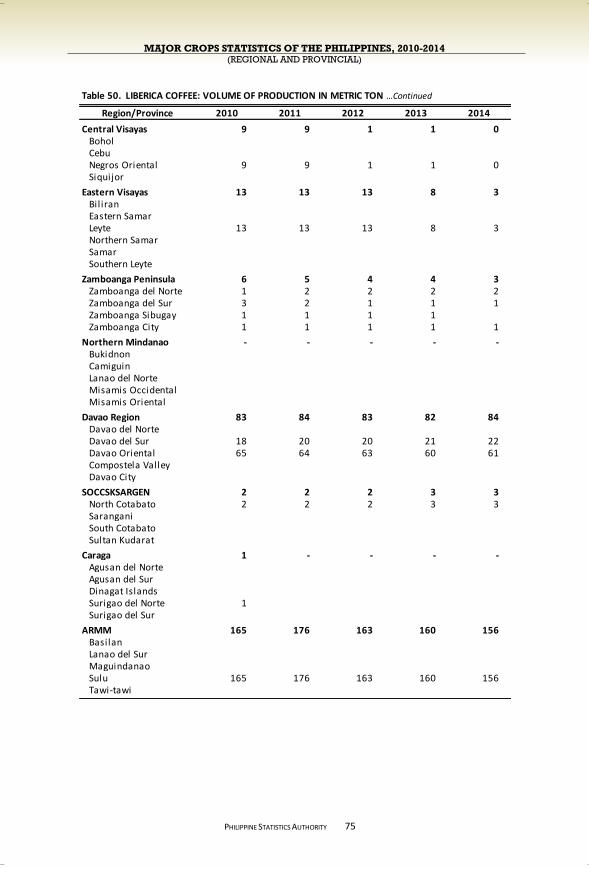
MAJOR CROPS STATISTICS OF THE PHILIPPINES, 2010-2014 (REGIONAL AND PROVINCIAL)
PHILIPPINE STATISTICS AUTHORITY
75
Region/Province 2010 2011 2012 2013 2014
Central Visayas 9 9 1 1 0 Bohol Cebu Negros Oriental 9 9 1 1 0 Siquijor
Eastern Visayas 13 13 13 8 3 Bil iran Eastern Samar Leyte 13 13 13 8 3 Northern Samar Samar Southern Leyte
Zamboanga Peninsula 6 5 4 4 3 Zamboanga del Norte 1 2 2 2 2 Zamboanga del Sur 3 2 1 1 1 Zamboanga Sibugay 1 1 1 1 Zamboanga City 1 1 1 1 1
Northern Mindanao - - - - - Bukidnon Camiguin Lanao del Norte Misamis Occidental Misamis Oriental
Davao Region 83 84 83 82 84 Davao del Norte Davao del Sur 18 20 20 21 22 Davao Oriental 65 64 63 60 61 Compostela Valley Davao City
SOCCSKSARGEN 2 2 2 3 3 North Cotabato 2 2 2 3 3 Sarangani South Cotabato Sultan Kudarat
Caraga 1 - - - - Agusan del Norte Agusan del Sur Dinagat Islands Surigao del Norte 1 Surigao del Sur
ARMM 165 176 163 160 156 Basilan Lanao del Sur Maguindanao Sulu 165 176 163 160 156 Tawi-tawi
Table 50. LIBERICA COFFEE: VOLUME OF PRODUCTION IN METRIC TON …Continued
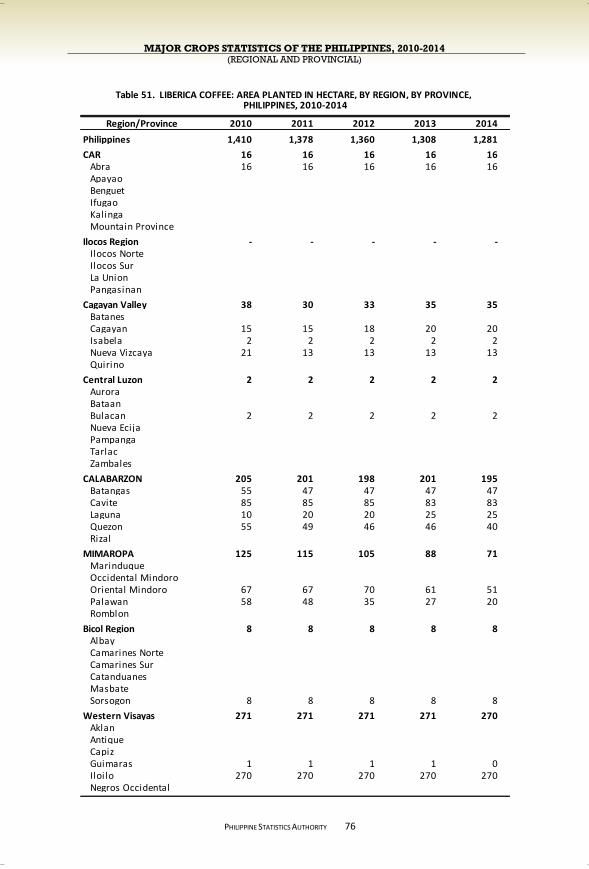
MAJOR CROPS STATISTICS OF THE PHILIPPINES, 2010-2014 (REGIONAL AND PROVINCIAL)
PHILIPPINE STATISTICS AUTHORITY
76
Region/Province 2010 2011 2012 2013 2014
Philippines 1,410 1,378 1,360 1,308 1,281
CAR 16 16 16 16 16 Abra 16 16 16 16 16 Apayao Benguet Ifugao Kalinga Mountain Province
Ilocos Region - - - - - Ilocos Norte Ilocos Sur La Union Pangasinan
Cagayan Valley 38 30 33 35 35 Batanes Cagayan 15 15 18 20 20 Isabela 2 2 2 2 2 Nueva Vizcaya 21 13 13 13 13 Quirino
Central Luzon 2 2 2 2 2 Aurora Bataan Bulacan 2 2 2 2 2 Nueva Ecija Pampanga Tarlac Zambales
CALABARZON 205 201 198 201 195 Batangas 55 47 47 47 47 Cavite 85 85 85 83 83 Laguna 10 20 20 25 25 Quezon 55 49 46 46 40 Rizal
MIMAROPA 125 115 105 88 71 Marinduque Occidental Mindoro Oriental Mindoro 67 67 70 61 51 Palawan 58 48 35 27 20 Romblon
Bicol Region 8 8 8 8 8 Albay Camarines Norte Camarines Sur Catanduanes Masbate Sorsogon 8 8 8 8 8
Western Visayas 271 271 271 271 270 Aklan Antique Capiz Guimaras 1 1 1 1 0 Iloilo 270 270 270 270 270 Negros Occidental
PHILIPPINES, 2010-2014Table 51. LIBERICA COFFEE: AREA PLANTED IN HECTARE, BY REGION, BY PROVINCE,
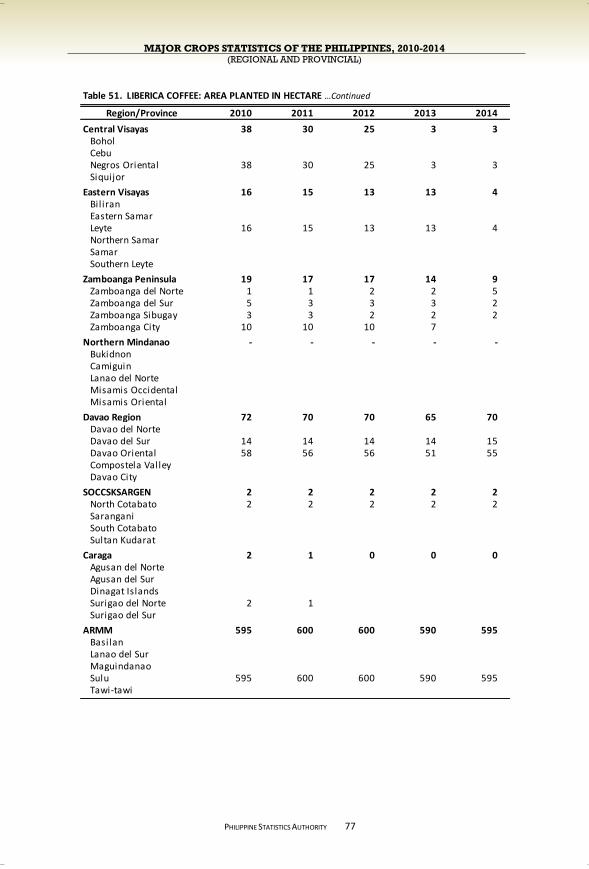
MAJOR CROPS STATISTICS OF THE PHILIPPINES, 2010-2014 (REGIONAL AND PROVINCIAL)
PHILIPPINE STATISTICS AUTHORITY
77
Region/Province 2010 2011 2012 2013 2014
Central Visayas 38 30 25 3 3 Bohol Cebu Negros Oriental 38 30 25 3 3 Siquijor
Eastern Visayas 16 15 13 13 4 Bil iran Eastern Samar Leyte 16 15 13 13 4 Northern Samar Samar Southern Leyte
Zamboanga Peninsula 19 17 17 14 9 Zamboanga del Norte 1 1 2 2 5 Zamboanga del Sur 5 3 3 3 2 Zamboanga Sibugay 3 3 2 2 2 Zamboanga City 10 10 10 7
Northern Mindanao - - - - - Bukidnon Camiguin Lanao del Norte Misamis Occidental Misamis Oriental
Davao Region 72 70 70 65 70 Davao del Norte Davao del Sur 14 14 14 14 15 Davao Oriental 58 56 56 51 55 Compostela Valley Davao City
SOCCSKSARGEN 2 2 2 2 2 North Cotabato 2 2 2 2 2 Sarangani South Cotabato Sultan Kudarat
Caraga 2 1 0 0 0 Agusan del Norte Agusan del Sur Dinagat Islands Surigao del Norte 2 1 Surigao del Sur
ARMM 595 600 600 590 595 Basilan Lanao del Sur Maguindanao Sulu 595 600 600 590 595 Tawi-tawi
Table 51. LIBERICA COFFEE: AREA PLANTED IN HECTARE …Continued

MAJOR CROPS STATISTICS OF THE PHILIPPINES, 2010-2014 (REGIONAL AND PROVINCIAL)
PHILIPPINE STATISTICS AUTHORITY
78
Region/Province 2010 2011 2012 2013 2014
Philippines 933,034 911,290 902,697 866,241 853,418
CAR 12,938 12,950 12,950 10,875 9,800 Abra 12,938 12,950 12,950 10,875 9,800 Apayao Benguet Ifugao Kalinga Mountain Province
Ilocos Region - - - - - Ilocos Norte Ilocos Sur La Union Pangasinan
Cagayan Valley 23,615 18,611 18,978 18,986 18,695 Batanes Cagayan 8,790 8,790 9,257 9,265 8,974 Isabela 1,700 1,667 1,567 1,567 1,567 Nueva Vizcaya 13,125 8,154 8,154 8,154 8,154 Quirino
Central Luzon 1,693 1,658 1,665 1,750 1,750 Aurora Bataan Bulacan 1,693 1,658 1,665 1,750 1,750 Nueva Ecija Pampanga Tarlac Zambales
CALABARZON 81,550 75,535 73,044 73,049 69,845 Batangas 31,900 28,200 27,260 27,260 27,160 Cavite 16,360 16,360 16,360 16,360 16,358 Laguna 5,625 5,625 5,625 5,630 5,630 Quezon 27,665 25,350 23,799 23,799 20,697 Rizal
MIMAROPA 53,252 48,565 44,016 37,320 29,220 Marinduque Occidental Mindoro Oriental Mindoro 29,052 28,765 30,066 26,570 21,420 Palawan 24,200 19,800 13,950 10,750 7,800 Romblon
Bicol Region 3,976 3,976 3,970 3,970 4,009 Albay Camarines Norte Camarines Sur Catanduanes Masbate Sorsogon 3,976 3,976 3,970 3,970 4,009
Western Visayas 150,806 150,806 150,806 150,806 150,056 Aklan Antique Capiz Guimaras 870 870 870 870 120 Iloilo 149,936 149,936 149,936 149,936 149,936 Negros Occidental
PHILIPPINES, 2010-2014Table 52. LIBERICA COFFEE: NUMBER OF BEARING TREES, BY REGION, BY PROVINCE,
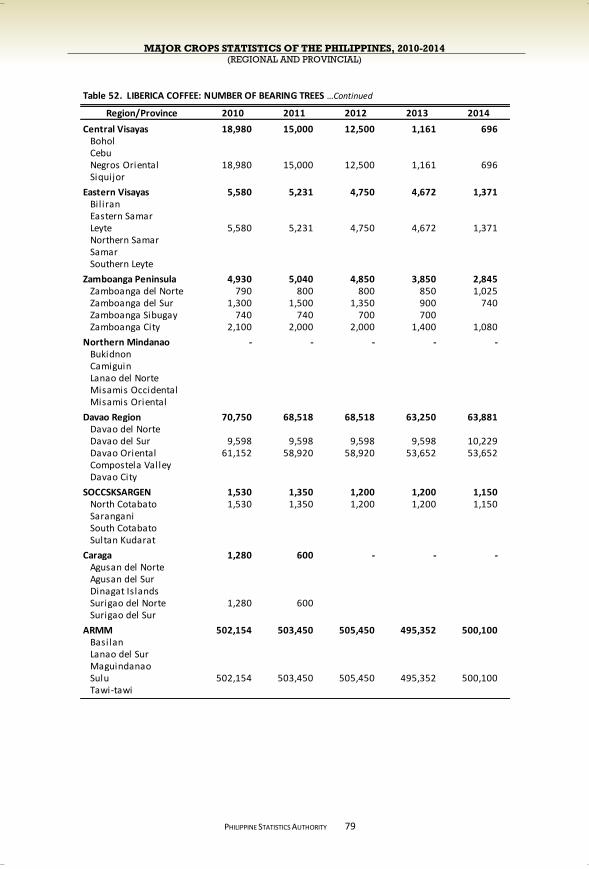
MAJOR CROPS STATISTICS OF THE PHILIPPINES, 2010-2014 (REGIONAL AND PROVINCIAL)
PHILIPPINE STATISTICS AUTHORITY
79
Region/Province 2010 2011 2012 2013 2014
Central Visayas 18,980 15,000 12,500 1,161 696 Bohol Cebu Negros Oriental 18,980 15,000 12,500 1,161 696 Siquijor
Eastern Visayas 5,580 5,231 4,750 4,672 1,371 Bil iran Eastern Samar Leyte 5,580 5,231 4,750 4,672 1,371 Northern Samar Samar Southern Leyte
Zamboanga Peninsula 4,930 5,040 4,850 3,850 2,845 Zamboanga del Norte 790 800 800 850 1,025 Zamboanga del Sur 1,300 1,500 1,350 900 740 Zamboanga Sibugay 740 740 700 700 Zamboanga City 2,100 2,000 2,000 1,400 1,080
Northern Mindanao - - - - - Bukidnon Camiguin Lanao del Norte Misamis Occidental Misamis Oriental
Davao Region 70,750 68,518 68,518 63,250 63,881 Davao del Norte Davao del Sur 9,598 9,598 9,598 9,598 10,229 Davao Oriental 61,152 58,920 58,920 53,652 53,652 Compostela Valley Davao City
SOCCSKSARGEN 1,530 1,350 1,200 1,200 1,150 North Cotabato 1,530 1,350 1,200 1,200 1,150 Sarangani South Cotabato Sultan Kudarat
Caraga 1,280 600 - - - Agusan del Norte Agusan del Sur Dinagat Islands Surigao del Norte 1,280 600 Surigao del Sur
ARMM 502,154 503,450 505,450 495,352 500,100 Basilan Lanao del Sur Maguindanao Sulu 502,154 503,450 505,450 495,352 500,100 Tawi-tawi
Table 52. LIBERICA COFFEE: NUMBER OF BEARING TREES …Continued

MAJOR CROPS STATISTICS OF THE PHILIPPINES, 2010-2014 (REGIONAL AND PROVINCIAL)
PHILIPPINE STATISTICS AUTHORITY
80
Prodn (MT) % Share % Cumulative
Philippines 533 100.00
1 Sulu 156 29.31 29.312 Iloilo 140 26.28 55.593 Davao Oriental 61 11.46 67.054 Quezon 54 10.09 77.145 Davao del Sur 22 4.22 81.356 Batangas 20 3.66 85.017 Abra 16 3.08 88.108 Cavite 16 2.93 91.029 Oriental Mindoro 10 1.85 92.87
10 Palawan 9 1.66 94.5311 Laguna 6 1.04 95.5712 Sorsogon 4 0.80 96.3813 Leyte 3 0.64 97.0114 Nueva Vizcaya 3 0.59 97.6015 Bulacan 3 0.58 98.1816 North Cotabato 3 0.52 98.7017 Zamboanga del Norte 2 0.34 99.0418 Cagayan 2 0.31 99.3519 Isabela 1 0.26 99.6120 Zamboanga del Sur 1 0.18 99.79
LUZON 143 26.85 26.85VISAYAS 144 27.03 53.88MINDANAO 246 46.12 100.00
Area (Ha.) % Share % Cumulative
Philippines 1,281 100.00
1 Sulu 595 46.46 46.462 Iloilo 270 21.08 67.553 Cavite 83 6.48 74.034 Davao Oriental 55 4.30 78.335 Oriental Mindoro 51 3.98 82.316 Batangas 47 3.67 85.987 Quezon 40 3.12 89.108 Laguna 25 1.95 91.059 Cagayan 20 1.56 92.62
10 Palawan 20 1.56 94.1811 Abra 16 1.25 95.4312 Davao del Sur 15 1.17 96.6013 Nueva Vizcaya 13 1.02 97.6214 Sorsogon 8 0.62 98.2415 Zamboanga del Norte 5 0.39 98.6316 Leyte 4 0.32 98.9617 Negros Oriental 3 0.23 99.1918 Bulacan 2 0.16 99.3619 Isabela 2 0.16 99.5120 Zamboanga del Sur 2 0.16 99.67
LUZON 327 25.55 25.55VISAYAS 277 21.66 47.21MINDANAO 676 52.79 100.00
Table 53. LIBERICA COFFEE: TOP PRODUCING PROVINCES BASED ON PRODUCTION, PHILIPPINES, 2014
Province
Table 54. LIBERICA COFFEE: TOP PRODUCING PROVINCES BASED ON AREA, PHILIPPINES, 2014
Province
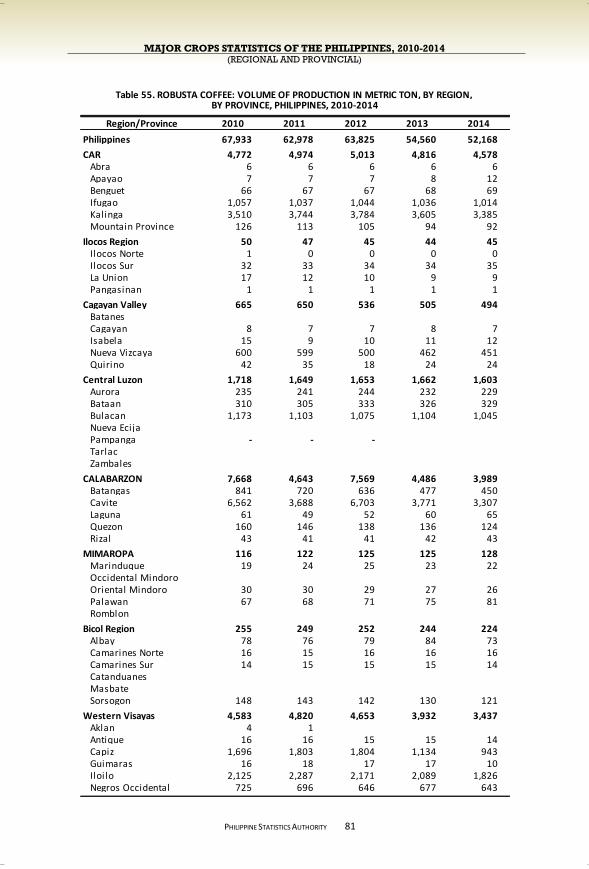
MAJOR CROPS STATISTICS OF THE PHILIPPINES, 2010-2014 (REGIONAL AND PROVINCIAL)
PHILIPPINE STATISTICS AUTHORITY
81
Region/Province 2010 2011 2012 2013 2014
Philippines 67,933 62,978 63,825 54,560 52,168
CAR 4,772 4,974 5,013 4,816 4,578 Abra 6 6 6 6 6 Apayao 7 7 7 8 12 Benguet 66 67 67 68 69 Ifugao 1,057 1,037 1,044 1,036 1,014 Kalinga 3,510 3,744 3,784 3,605 3,385 Mountain Province 126 113 105 94 92
Ilocos Region 50 47 45 44 45 Ilocos Norte 1 0 0 0 0 Ilocos Sur 32 33 34 34 35 La Union 17 12 10 9 9 Pangasinan 1 1 1 1 1
Cagayan Valley 665 650 536 505 494 Batanes Cagayan 8 7 7 8 7 Isabela 15 9 10 11 12 Nueva Vizcaya 600 599 500 462 451 Quirino 42 35 18 24 24
Central Luzon 1,718 1,649 1,653 1,662 1,603 Aurora 235 241 244 232 229 Bataan 310 305 333 326 329 Bulacan 1,173 1,103 1,075 1,104 1,045 Nueva Ecija Pampanga - - - Tarlac Zambales
CALABARZON 7,668 4,643 7,569 4,486 3,989 Batangas 841 720 636 477 450 Cavite 6,562 3,688 6,703 3,771 3,307 Laguna 61 49 52 60 65 Quezon 160 146 138 136 124 Rizal 43 41 41 42 43
MIMAROPA 116 122 125 125 128 Marinduque 19 24 25 23 22 Occidental Mindoro Oriental Mindoro 30 30 29 27 26 Palawan 67 68 71 75 81 Romblon
Bicol Region 255 249 252 244 224 Albay 78 76 79 84 73 Camarines Norte 16 15 16 16 16 Camarines Sur 14 15 15 15 14 Catanduanes Masbate Sorsogon 148 143 142 130 121
Western Visayas 4,583 4,820 4,653 3,932 3,437 Aklan 4 1 Antique 16 16 15 15 14 Capiz 1,696 1,803 1,804 1,134 943 Guimaras 16 18 17 17 10 Iloilo 2,125 2,287 2,171 2,089 1,826 Negros Occidental 725 696 646 677 643
BY PROVINCE, PHILIPPINES, 2010-2014Table 55. ROBUSTA COFFEE: VOLUME OF PRODUCTION IN METRIC TON, BY REGION,

MAJOR CROPS STATISTICS OF THE PHILIPPINES, 2010-2014 (REGIONAL AND PROVINCIAL)
PHILIPPINE STATISTICS AUTHORITY
82
Region/Province 2010 2011 2012 2013 2014
Central Visayas 181 200 215 207 192 Bohol 1 4 8 23 37 Cebu 2 3 4 3 3 Negros Oriental 178 193 203 180 151 Siquijor
Eastern Visayas 87 85 82 53 21 Bil iran 2 2 2 2 1 Eastern Samar 11 11 11 11 7 Leyte 14 13 13 7 4 Northern Samar Samar 4 4 4 4 3 Southern Leyte 57 55 52 29 5
Zamboanga Peninsula 546 464 451 443 453 Zamboanga del Norte 406 347 347 350 370 Zamboanga del Sur 29 21 14 12 9 Zamboanga Sibugay 60 54 60 54 51 Zamboanga City 51 43 29 27 23
Northern Mindanao 5,214 5,128 4,501 4,658 4,775 Bukidnon 4,610 4,545 3,930 4,070 4,187 Camiguin 13 11 9 8 7 Lanao del Norte 224 213 202 195 204 Misamis Occidental 4 4 5 6 8 Misamis Oriental 364 355 355 379 369
Davao Region 17,162 15,347 14,114 8,321 7,850 Davao del Norte 601 610 614 603 612 Davao del Sur 2,664 2,685 2,698 2,708 2,831 Davao Oriental 1,276 1,256 1,218 1,186 1,148 Compostela Valley 10,026 8,519 7,492 1,825 1,312 Davao City 2,594 2,278 2,093 1,999 1,947
SOCCSKSARGEN 15,325 15,134 15,499 16,292 15,797 North Cotabato 1,736 1,721 1,776 1,817 1,827 Sarangani 217 220 222 226 227 South Cotabato 909 993 995 1,025 1,033 Sultan Kudarat 12,463 12,199 12,506 13,225 12,710
Caraga 2,188 1,977 1,765 1,487 1,399 Agusan del Norte 173 96 79 62 69 Agusan del Sur 304 236 226 62 37 Dinagat Islands Surigao del Norte 9 6 6 4 3 Surigao del Sur 1,703 1,639 1,454 1,359 1,290
ARMM 7,403 7,491 7,354 7,287 7,185 Basilan 1,675 1,645 1,595 1,549 1,516 Lanao del Sur 285 290 291 300 302 Maguindanao 2,888 2,885 2,901 2,905 2,905 Sulu 2,554 2,671 2,567 2,533 2,462 Tawi-tawi
Table 55. ROBUSTA COFFEE: VOLUME OF PRODUCTION IN METRIC TON …Continued
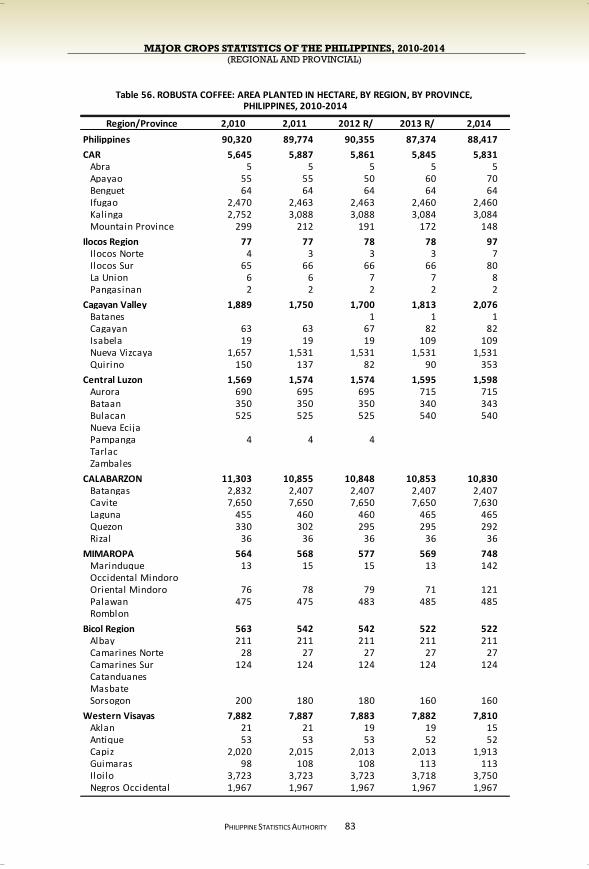
MAJOR CROPS STATISTICS OF THE PHILIPPINES, 2010-2014 (REGIONAL AND PROVINCIAL)
PHILIPPINE STATISTICS AUTHORITY
83
Region/Province 2,010 2,011 2012 R/ 2013 R/ 2,014
Philippines 90,320 89,774 90,355 87,374 88,417
CAR 5,645 5,887 5,861 5,845 5,831 Abra 5 5 5 5 5 Apayao 55 55 50 60 70 Benguet 64 64 64 64 64 Ifugao 2,470 2,463 2,463 2,460 2,460 Kalinga 2,752 3,088 3,088 3,084 3,084 Mountain Province 299 212 191 172 148
Ilocos Region 77 77 78 78 97 Ilocos Norte 4 3 3 3 7 Ilocos Sur 65 66 66 66 80 La Union 6 6 7 7 8 Pangasinan 2 2 2 2 2
Cagayan Valley 1,889 1,750 1,700 1,813 2,076 Batanes 1 1 1 Cagayan 63 63 67 82 82 Isabela 19 19 19 109 109 Nueva Vizcaya 1,657 1,531 1,531 1,531 1,531 Quirino 150 137 82 90 353
Central Luzon 1,569 1,574 1,574 1,595 1,598 Aurora 690 695 695 715 715 Bataan 350 350 350 340 343 Bulacan 525 525 525 540 540 Nueva Ecija Pampanga 4 4 4 Tarlac Zambales
CALABARZON 11,303 10,855 10,848 10,853 10,830 Batangas 2,832 2,407 2,407 2,407 2,407 Cavite 7,650 7,650 7,650 7,650 7,630 Laguna 455 460 460 465 465 Quezon 330 302 295 295 292 Rizal 36 36 36 36 36
MIMAROPA 564 568 577 569 748 Marinduque 13 15 15 13 142 Occidental Mindoro Oriental Mindoro 76 78 79 71 121 Palawan 475 475 483 485 485 Romblon
Bicol Region 563 542 542 522 522 Albay 211 211 211 211 211 Camarines Norte 28 27 27 27 27 Camarines Sur 124 124 124 124 124 Catanduanes Masbate Sorsogon 200 180 180 160 160
Western Visayas 7,882 7,887 7,883 7,882 7,810 Aklan 21 21 19 19 15 Antique 53 53 53 52 52 Capiz 2,020 2,015 2,013 2,013 1,913 Guimaras 98 108 108 113 113 Iloilo 3,723 3,723 3,723 3,718 3,750 Negros Occidental 1,967 1,967 1,967 1,967 1,967
PHILIPPINES, 2010-2014Table 56. ROBUSTA COFFEE: AREA PLANTED IN HECTARE, BY REGION, BY PROVINCE,
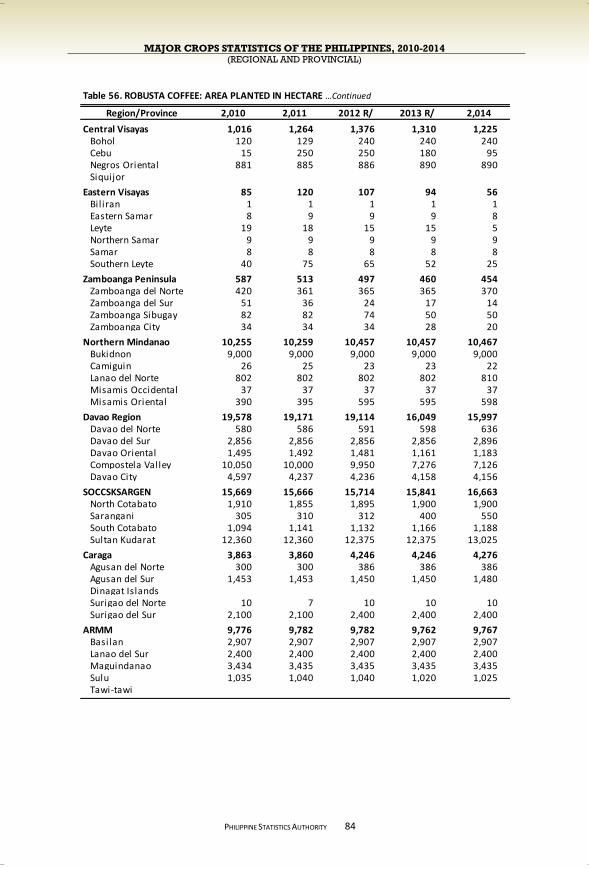
MAJOR CROPS STATISTICS OF THE PHILIPPINES, 2010-2014 (REGIONAL AND PROVINCIAL)
PHILIPPINE STATISTICS AUTHORITY
84
Region/Province 2,010 2,011 2012 R/ 2013 R/ 2,014
Central Visayas 1,016 1,264 1,376 1,310 1,225 Bohol 120 129 240 240 240 Cebu 15 250 250 180 95 Negros Oriental 881 885 886 890 890 Siquijor
Eastern Visayas 85 120 107 94 56 Bil iran 1 1 1 1 1 Eastern Samar 8 9 9 9 8 Leyte 19 18 15 15 5 Northern Samar 9 9 9 9 9 Samar 8 8 8 8 8 Southern Leyte 40 75 65 52 25
Zamboanga Peninsula 587 513 497 460 454 Zamboanga del Norte 420 361 365 365 370 Zamboanga del Sur 51 36 24 17 14 Zamboanga Sibugay 82 82 74 50 50 Zamboanga City 34 34 34 28 20
Northern Mindanao 10,255 10,259 10,457 10,457 10,467 Bukidnon 9,000 9,000 9,000 9,000 9,000 Camiguin 26 25 23 23 22 Lanao del Norte 802 802 802 802 810 Misamis Occidental 37 37 37 37 37 Misamis Oriental 390 395 595 595 598
Davao Region 19,578 19,171 19,114 16,049 15,997 Davao del Norte 580 586 591 598 636 Davao del Sur 2,856 2,856 2,856 2,856 2,896 Davao Oriental 1,495 1,492 1,481 1,161 1,183 Compostela Valley 10,050 10,000 9,950 7,276 7,126 Davao City 4,597 4,237 4,236 4,158 4,156
SOCCSKSARGEN 15,669 15,666 15,714 15,841 16,663 North Cotabato 1,910 1,855 1,895 1,900 1,900 Sarangani 305 310 312 400 550 South Cotabato 1,094 1,141 1,132 1,166 1,188 Sultan Kudarat 12,360 12,360 12,375 12,375 13,025
Caraga 3,863 3,860 4,246 4,246 4,276 Agusan del Norte 300 300 386 386 386 Agusan del Sur 1,453 1,453 1,450 1,450 1,480 Dinagat Islands Surigao del Norte 10 7 10 10 10 Surigao del Sur 2,100 2,100 2,400 2,400 2,400
ARMM 9,776 9,782 9,782 9,762 9,767 Basilan 2,907 2,907 2,907 2,907 2,907 Lanao del Sur 2,400 2,400 2,400 2,400 2,400 Maguindanao 3,434 3,435 3,435 3,435 3,435 Sulu 1,035 1,040 1,040 1,020 1,025 Tawi-tawi
Table 56. ROBUSTA COFFEE: AREA PLANTED IN HECTARE …Continued
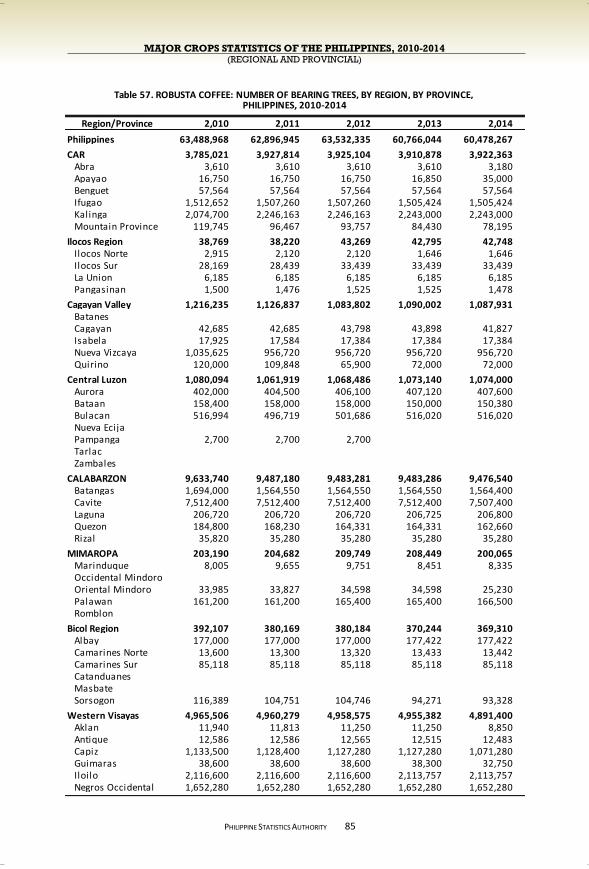
MAJOR CROPS STATISTICS OF THE PHILIPPINES, 2010-2014 (REGIONAL AND PROVINCIAL)
PHILIPPINE STATISTICS AUTHORITY
85
Region/Province 2,010 2,011 2,012 2,013 2,014
Philippines 63,488,968 62,896,945 63,532,335 60,766,044 60,478,267
CAR 3,785,021 3,927,814 3,925,104 3,910,878 3,922,363 Abra 3,610 3,610 3,610 3,610 3,180 Apayao 16,750 16,750 16,750 16,850 35,000 Benguet 57,564 57,564 57,564 57,564 57,564 Ifugao 1,512,652 1,507,260 1,507,260 1,505,424 1,505,424 Kalinga 2,074,700 2,246,163 2,246,163 2,243,000 2,243,000 Mountain Province 119,745 96,467 93,757 84,430 78,195
Ilocos Region 38,769 38,220 43,269 42,795 42,748 Ilocos Norte 2,915 2,120 2,120 1,646 1,646 Ilocos Sur 28,169 28,439 33,439 33,439 33,439 La Union 6,185 6,185 6,185 6,185 6,185 Pangasinan 1,500 1,476 1,525 1,525 1,478
Cagayan Valley 1,216,235 1,126,837 1,083,802 1,090,002 1,087,931 Batanes Cagayan 42,685 42,685 43,798 43,898 41,827 Isabela 17,925 17,584 17,384 17,384 17,384 Nueva Vizcaya 1,035,625 956,720 956,720 956,720 956,720 Quirino 120,000 109,848 65,900 72,000 72,000
Central Luzon 1,080,094 1,061,919 1,068,486 1,073,140 1,074,000 Aurora 402,000 404,500 406,100 407,120 407,600 Bataan 158,400 158,000 158,000 150,000 150,380 Bulacan 516,994 496,719 501,686 516,020 516,020 Nueva Ecija Pampanga 2,700 2,700 2,700 Tarlac Zambales
CALABARZON 9,633,740 9,487,180 9,483,281 9,483,286 9,476,540 Batangas 1,694,000 1,564,550 1,564,550 1,564,550 1,564,400 Cavite 7,512,400 7,512,400 7,512,400 7,512,400 7,507,400 Laguna 206,720 206,720 206,720 206,725 206,800 Quezon 184,800 168,230 164,331 164,331 162,660 Rizal 35,820 35,280 35,280 35,280 35,280
MIMAROPA 203,190 204,682 209,749 208,449 200,065 Marinduque 8,005 9,655 9,751 8,451 8,335 Occidental Mindoro Oriental Mindoro 33,985 33,827 34,598 34,598 25,230 Palawan 161,200 161,200 165,400 165,400 166,500 Romblon
Bicol Region 392,107 380,169 380,184 370,244 369,310 Albay 177,000 177,000 177,000 177,422 177,422 Camarines Norte 13,600 13,300 13,320 13,433 13,442 Camarines Sur 85,118 85,118 85,118 85,118 85,118 Catanduanes Masbate Sorsogon 116,389 104,751 104,746 94,271 93,328
Western Visayas 4,965,506 4,960,279 4,958,575 4,955,382 4,891,400 Aklan 11,940 11,813 11,250 11,250 8,850 Antique 12,586 12,586 12,565 12,515 12,483 Capiz 1,133,500 1,128,400 1,127,280 1,127,280 1,071,280 Guimaras 38,600 38,600 38,600 38,300 32,750 Iloilo 2,116,600 2,116,600 2,116,600 2,113,757 2,113,757 Negros Occidental 1,652,280 1,652,280 1,652,280 1,652,280 1,652,280
PHILIPPINES, 2010-2014Table 57. ROBUSTA COFFEE: NUMBER OF BEARING TREES, BY REGION, BY PROVINCE,
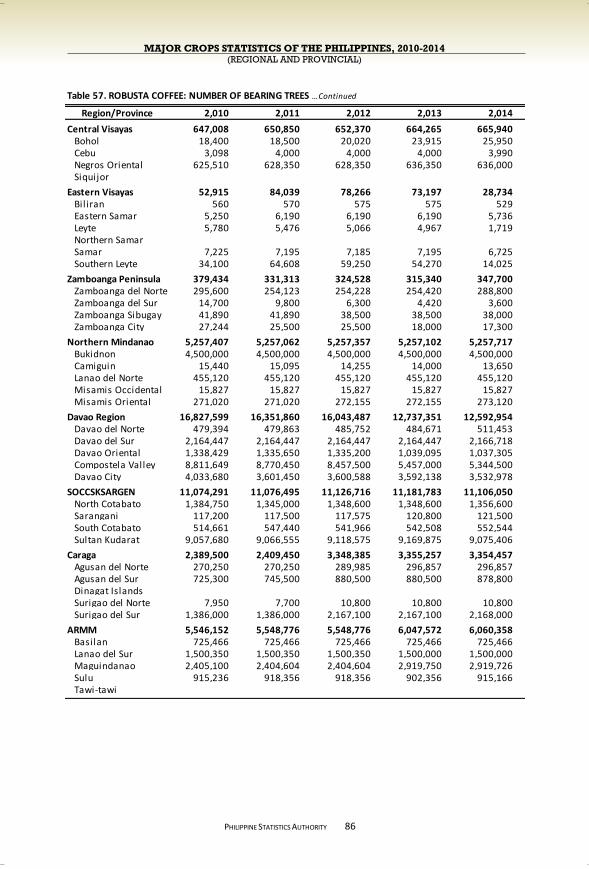
MAJOR CROPS STATISTICS OF THE PHILIPPINES, 2010-2014 (REGIONAL AND PROVINCIAL)
PHILIPPINE STATISTICS AUTHORITY
86
Region/Province 2,010 2,011 2,012 2,013 2,014
Central Visayas 647,008 650,850 652,370 664,265 665,940 Bohol 18,400 18,500 20,020 23,915 25,950 Cebu 3,098 4,000 4,000 4,000 3,990 Negros Oriental 625,510 628,350 628,350 636,350 636,000 Siquijor
Eastern Visayas 52,915 84,039 78,266 73,197 28,734 Bil iran 560 570 575 575 529 Eastern Samar 5,250 6,190 6,190 6,190 5,736 Leyte 5,780 5,476 5,066 4,967 1,719 Northern Samar Samar 7,225 7,195 7,185 7,195 6,725 Southern Leyte 34,100 64,608 59,250 54,270 14,025
Zamboanga Peninsula 379,434 331,313 324,528 315,340 347,700 Zamboanga del Norte 295,600 254,123 254,228 254,420 288,800 Zamboanga del Sur 14,700 9,800 6,300 4,420 3,600 Zamboanga Sibugay 41,890 41,890 38,500 38,500 38,000 Zamboanga City 27,244 25,500 25,500 18,000 17,300
Northern Mindanao 5,257,407 5,257,062 5,257,357 5,257,102 5,257,717 Bukidnon 4,500,000 4,500,000 4,500,000 4,500,000 4,500,000 Camiguin 15,440 15,095 14,255 14,000 13,650 Lanao del Norte 455,120 455,120 455,120 455,120 455,120 Misamis Occidental 15,827 15,827 15,827 15,827 15,827 Misamis Oriental 271,020 271,020 272,155 272,155 273,120
Davao Region 16,827,599 16,351,860 16,043,487 12,737,351 12,592,954 Davao del Norte 479,394 479,863 485,752 484,671 511,453 Davao del Sur 2,164,447 2,164,447 2,164,447 2,164,447 2,166,718 Davao Oriental 1,338,429 1,335,650 1,335,200 1,039,095 1,037,305 Compostela Valley 8,811,649 8,770,450 8,457,500 5,457,000 5,344,500 Davao City 4,033,680 3,601,450 3,600,588 3,592,138 3,532,978
SOCCSKSARGEN 11,074,291 11,076,495 11,126,716 11,181,783 11,106,050 North Cotabato 1,384,750 1,345,000 1,348,600 1,348,600 1,356,600 Sarangani 117,200 117,500 117,575 120,800 121,500 South Cotabato 514,661 547,440 541,966 542,508 552,544 Sultan Kudarat 9,057,680 9,066,555 9,118,575 9,169,875 9,075,406
Caraga 2,389,500 2,409,450 3,348,385 3,355,257 3,354,457 Agusan del Norte 270,250 270,250 289,985 296,857 296,857 Agusan del Sur 725,300 745,500 880,500 880,500 878,800 Dinagat Islands Surigao del Norte 7,950 7,700 10,800 10,800 10,800 Surigao del Sur 1,386,000 1,386,000 2,167,100 2,167,100 2,168,000
ARMM 5,546,152 5,548,776 5,548,776 6,047,572 6,060,358 Basilan 725,466 725,466 725,466 725,466 725,466 Lanao del Sur 1,500,350 1,500,350 1,500,350 1,500,000 1,500,000 Maguindanao 2,405,100 2,404,604 2,404,604 2,919,750 2,919,726 Sulu 915,236 918,356 918,356 902,356 915,166 Tawi-tawi
Table 57. ROBUSTA COFFEE: NUMBER OF BEARING TREES …Continued
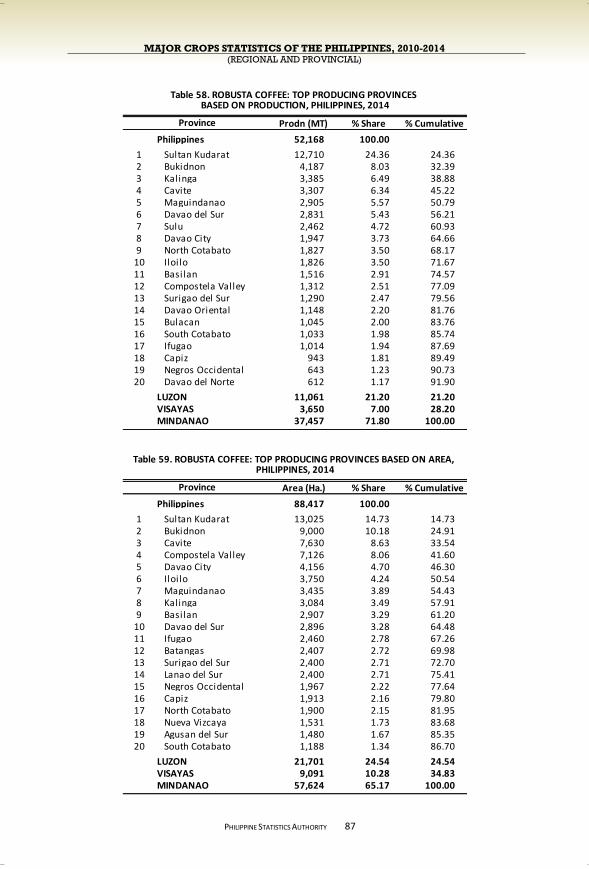
MAJOR CROPS STATISTICS OF THE PHILIPPINES, 2010-2014 (REGIONAL AND PROVINCIAL)
PHILIPPINE STATISTICS AUTHORITY
87
Prodn (MT) % Share % Cumulative
Philippines 52,168 100.00
1 Sultan Kudarat 12,710 24.36 24.362 Bukidnon 4,187 8.03 32.393 Kalinga 3,385 6.49 38.884 Cavite 3,307 6.34 45.225 Maguindanao 2,905 5.57 50.796 Davao del Sur 2,831 5.43 56.217 Sulu 2,462 4.72 60.938 Davao City 1,947 3.73 64.669 North Cotabato 1,827 3.50 68.17
10 Iloilo 1,826 3.50 71.6711 Basilan 1,516 2.91 74.5712 Compostela Valley 1,312 2.51 77.0913 Surigao del Sur 1,290 2.47 79.5614 Davao Oriental 1,148 2.20 81.7615 Bulacan 1,045 2.00 83.7616 South Cotabato 1,033 1.98 85.7417 Ifugao 1,014 1.94 87.6918 Capiz 943 1.81 89.4919 Negros Occidental 643 1.23 90.7320 Davao del Norte 612 1.17 91.90
LUZON 11,061 21.20 21.20VISAYAS 3,650 7.00 28.20MINDANAO 37,457 71.80 100.00
Area (Ha.) % Share % Cumulative
Philippines 88,417 100.00
1 Sultan Kudarat 13,025 14.73 14.732 Bukidnon 9,000 10.18 24.913 Cavite 7,630 8.63 33.544 Compostela Valley 7,126 8.06 41.605 Davao City 4,156 4.70 46.306 Iloilo 3,750 4.24 50.547 Maguindanao 3,435 3.89 54.438 Kalinga 3,084 3.49 57.919 Basilan 2,907 3.29 61.20
10 Davao del Sur 2,896 3.28 64.4811 Ifugao 2,460 2.78 67.2612 Batangas 2,407 2.72 69.9813 Surigao del Sur 2,400 2.71 72.7014 Lanao del Sur 2,400 2.71 75.4115 Negros Occidental 1,967 2.22 77.6416 Capiz 1,913 2.16 79.8017 North Cotabato 1,900 2.15 81.9518 Nueva Vizcaya 1,531 1.73 83.6819 Agusan del Sur 1,480 1.67 85.3520 South Cotabato 1,188 1.34 86.70
LUZON 21,701 24.54 24.54VISAYAS 9,091 10.28 34.83MINDANAO 57,624 65.17 100.00
Table 58. ROBUSTA COFFEE: TOP PRODUCING PROVINCES BASED ON PRODUCTION, PHILIPPINES, 2014
Province
Table 59. ROBUSTA COFFEE: TOP PRODUCING PROVINCES BASED ON AREA, PHILIPPINES, 2014
Province

MAJOR CROPS STATISTICS OF THE PHILIPPINES, 2010-2014 (REGIONAL AND PROVINCIAL)
PHILIPPINE STATISTICS AUTHORITY
RUBBER
During the period 2010-2014, rubber production, area planted, and number of tappable trees grew at an average annual rate of 3.5 percent, 12.0 percent, and 7.5 percent, respectively. In 2014, production of rubber cup lump grew by 1.9 percent to 453.05 thousand mt, from 444.82 thousand mt in 2013. Gains in output were attributed to the increase in number of trees tapped in rubber producing provinces of Mindanao, namely, Basilan, North Cotabato, Bukidnon, Agusan del Sur, and Zamboanga del Norte.
The top rubber producing province of the country was North Cotabato
at 173.11 thousand mt and shared 38.2 percent to total rubber production. This was followed by Zamboanga Sibugay with 143.08 thousand mt. The combined output from these provinces comprised 69.8 percent of the country’s total cup lump production (Figure 18).
In 2014, total area planted to rubber reached 217.69 thousand hectares,
17.4 percent more than the 2013 level of 185.48 thousand hectares. Similarly, number of tappable trees grew from 47.38 million to 52.46 million or by 10.7 percent. The province of Zamboanga Sibugay had the largest area planted to rubber at 70.21 thousand hectares, contributing 32.3 percent to the national total (Figure 19).
88
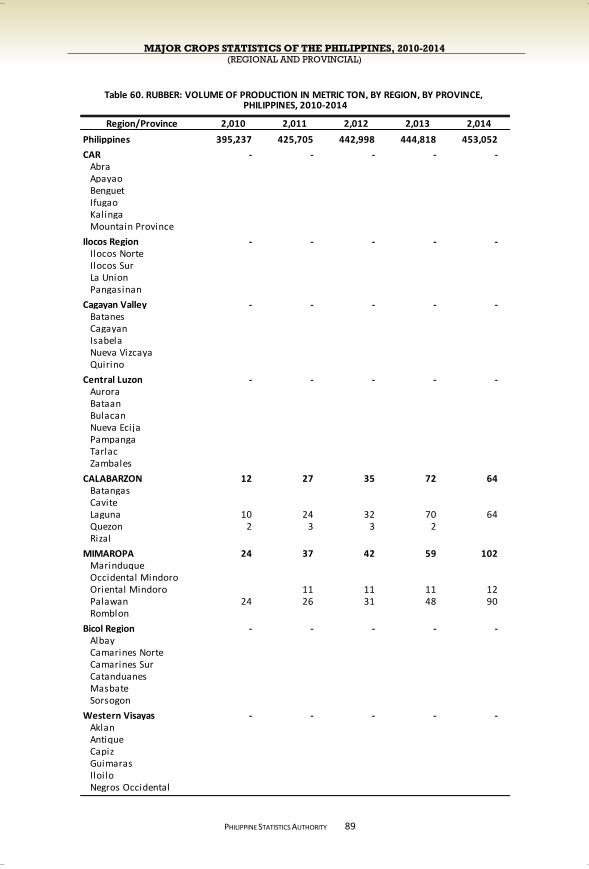
MAJOR CROPS STATISTICS OF THE PHILIPPINES, 2010-2014 (REGIONAL AND PROVINCIAL)
PHILIPPINE STATISTICS AUTHORITY
89
Region/Province 2,010 2,011 2,012 2,013 2,014
Philippines 395,237 425,705 442,998 444,818 453,052
CAR - - - - - Abra Apayao Benguet Ifugao Kalinga Mountain Province
Ilocos Region - - - - - Ilocos Norte Ilocos Sur La Union Pangasinan
Cagayan Valley - - - - - Batanes Cagayan Isabela Nueva Vizcaya Quirino
Central Luzon - - - - - Aurora Bataan Bulacan Nueva Ecija Pampanga Tarlac Zambales
CALABARZON 12 27 35 72 64 Batangas Cavite Laguna 10 24 32 70 64 Quezon 2 3 3 2 Rizal
MIMAROPA 24 37 42 59 102 Marinduque Occidental Mindoro Oriental Mindoro 11 11 11 12 Palawan 24 26 31 48 90 Romblon
Bicol Region - - - - - Albay Camarines Norte Camarines Sur Catanduanes Masbate Sorsogon
Western Visayas - - - - - Aklan Antique Capiz Guimaras Iloilo Negros Occidental
PHILIPPINES, 2010-2014Table 60. RUBBER: VOLUME OF PRODUCTION IN METRIC TON, BY REGION, BY PROVINCE,
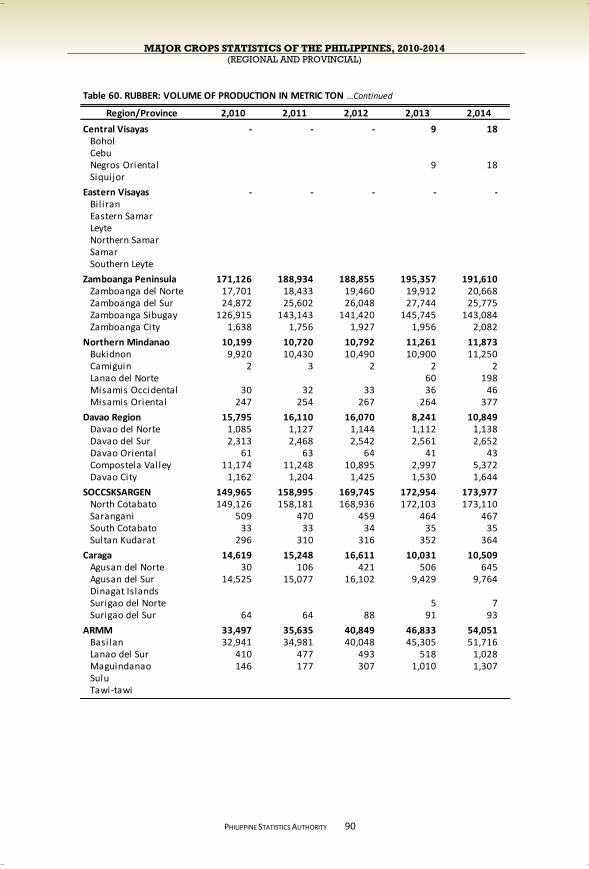
MAJOR CROPS STATISTICS OF THE PHILIPPINES, 2010-2014 (REGIONAL AND PROVINCIAL)
PHILIPPINE STATISTICS AUTHORITY
90
Region/Province 2,010 2,011 2,012 2,013 2,014
Central Visayas - - - 9 18 Bohol Cebu Negros Oriental 9 18 Siquijor
Eastern Visayas - - - - - Bil iran Eastern Samar Leyte Northern Samar Samar Southern Leyte
Zamboanga Peninsula 171,126 188,934 188,855 195,357 191,610 Zamboanga del Norte 17,701 18,433 19,460 19,912 20,668 Zamboanga del Sur 24,872 25,602 26,048 27,744 25,775 Zamboanga Sibugay 126,915 143,143 141,420 145,745 143,084 Zamboanga City 1,638 1,756 1,927 1,956 2,082
Northern Mindanao 10,199 10,720 10,792 11,261 11,873 Bukidnon 9,920 10,430 10,490 10,900 11,250 Camiguin 2 3 2 2 2 Lanao del Norte 60 198 Misamis Occidental 30 32 33 36 46 Misamis Oriental 247 254 267 264 377
Davao Region 15,795 16,110 16,070 8,241 10,849 Davao del Norte 1,085 1,127 1,144 1,112 1,138 Davao del Sur 2,313 2,468 2,542 2,561 2,652 Davao Oriental 61 63 64 41 43 Compostela Valley 11,174 11,248 10,895 2,997 5,372 Davao City 1,162 1,204 1,425 1,530 1,644
SOCCSKSARGEN 149,965 158,995 169,745 172,954 173,977 North Cotabato 149,126 158,181 168,936 172,103 173,110 Sarangani 509 470 459 464 467 South Cotabato 33 33 34 35 35 Sultan Kudarat 296 310 316 352 364
Caraga 14,619 15,248 16,611 10,031 10,509 Agusan del Norte 30 106 421 506 645 Agusan del Sur 14,525 15,077 16,102 9,429 9,764 Dinagat Islands Surigao del Norte 5 7 Surigao del Sur 64 64 88 91 93
ARMM 33,497 35,635 40,849 46,833 54,051 Basilan 32,941 34,981 40,048 45,305 51,716 Lanao del Sur 410 477 493 518 1,028 Maguindanao 146 177 307 1,010 1,307 Sulu Tawi-tawi
Table 60. RUBBER: VOLUME OF PRODUCTION IN METRIC TON …Continued
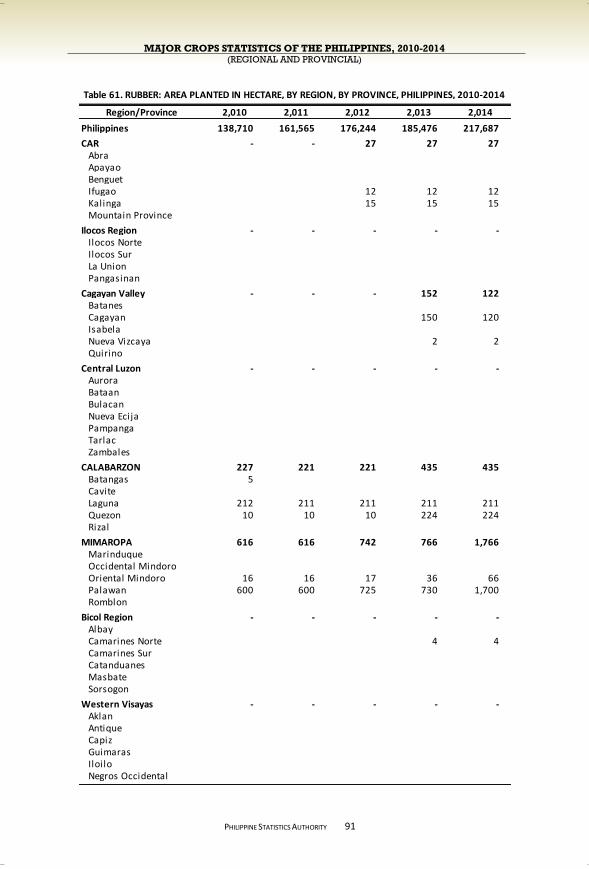
MAJOR CROPS STATISTICS OF THE PHILIPPINES, 2010-2014 (REGIONAL AND PROVINCIAL)
PHILIPPINE STATISTICS AUTHORITY
91
Region/Province 2,010 2,011 2,012 2,013 2,014
Philippines 138,710 161,565 176,244 185,476 217,687
CAR - - 27 27 27 Abra Apayao Benguet Ifugao 12 12 12 Kalinga 15 15 15 Mountain Province
Ilocos Region - - - - - Ilocos Norte Ilocos Sur La Union Pangasinan
Cagayan Valley - - - 152 122 Batanes Cagayan 150 120 Isabela Nueva Vizcaya 2 2 Quirino
Central Luzon - - - - - Aurora Bataan Bulacan Nueva Ecija Pampanga Tarlac Zambales
CALABARZON 227 221 221 435 435 Batangas 5 Cavite Laguna 212 211 211 211 211 Quezon 10 10 10 224 224 Rizal
MIMAROPA 616 616 742 766 1,766 Marinduque Occidental Mindoro Oriental Mindoro 16 16 17 36 66 Palawan 600 600 725 730 1,700 Romblon
Bicol Region - - - - - Albay Camarines Norte 4 4 Camarines Sur Catanduanes Masbate Sorsogon
Western Visayas - - - - - Aklan Antique Capiz Guimaras Iloilo Negros Occidental
Table 61. RUBBER: AREA PLANTED IN HECTARE, BY REGION, BY PROVINCE, PHILIPPINES, 2010-2014
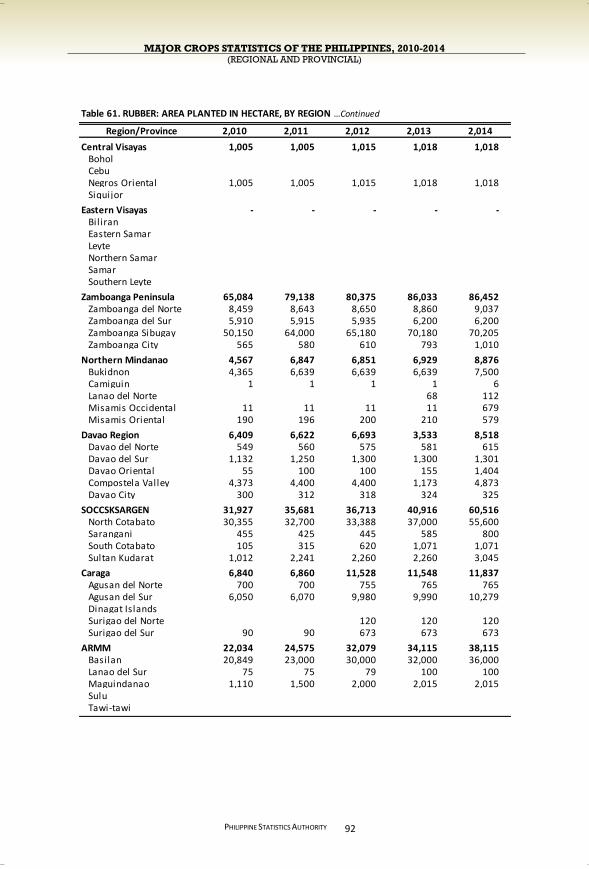
MAJOR CROPS STATISTICS OF THE PHILIPPINES, 2010-2014 (REGIONAL AND PROVINCIAL)
PHILIPPINE STATISTICS AUTHORITY
92
Region/Province 2,010 2,011 2,012 2,013 2,014
Central Visayas 1,005 1,005 1,015 1,018 1,018 Bohol Cebu Negros Oriental 1,005 1,005 1,015 1,018 1,018 Siquijor
Eastern Visayas - - - - - Bil iran Eastern Samar Leyte Northern Samar Samar Southern Leyte
Zamboanga Peninsula 65,084 79,138 80,375 86,033 86,452 Zamboanga del Norte 8,459 8,643 8,650 8,860 9,037 Zamboanga del Sur 5,910 5,915 5,935 6,200 6,200 Zamboanga Sibugay 50,150 64,000 65,180 70,180 70,205 Zamboanga City 565 580 610 793 1,010
Northern Mindanao 4,567 6,847 6,851 6,929 8,876 Bukidnon 4,365 6,639 6,639 6,639 7,500 Camiguin 1 1 1 1 6 Lanao del Norte 68 112 Misamis Occidental 11 11 11 11 679 Misamis Oriental 190 196 200 210 579
Davao Region 6,409 6,622 6,693 3,533 8,518 Davao del Norte 549 560 575 581 615 Davao del Sur 1,132 1,250 1,300 1,300 1,301 Davao Oriental 55 100 100 155 1,404 Compostela Valley 4,373 4,400 4,400 1,173 4,873 Davao City 300 312 318 324 325
SOCCSKSARGEN 31,927 35,681 36,713 40,916 60,516 North Cotabato 30,355 32,700 33,388 37,000 55,600 Sarangani 455 425 445 585 800 South Cotabato 105 315 620 1,071 1,071 Sultan Kudarat 1,012 2,241 2,260 2,260 3,045
Caraga 6,840 6,860 11,528 11,548 11,837 Agusan del Norte 700 700 755 765 765 Agusan del Sur 6,050 6,070 9,980 9,990 10,279 Dinagat Islands Surigao del Norte 120 120 120 Surigao del Sur 90 90 673 673 673
ARMM 22,034 24,575 32,079 34,115 38,115 Basilan 20,849 23,000 30,000 32,000 36,000 Lanao del Sur 75 75 79 100 100 Maguindanao 1,110 1,500 2,000 2,015 2,015 Sulu Tawi-tawi
Table 61. RUBBER: AREA PLANTED IN HECTARE, BY REGION …Continued
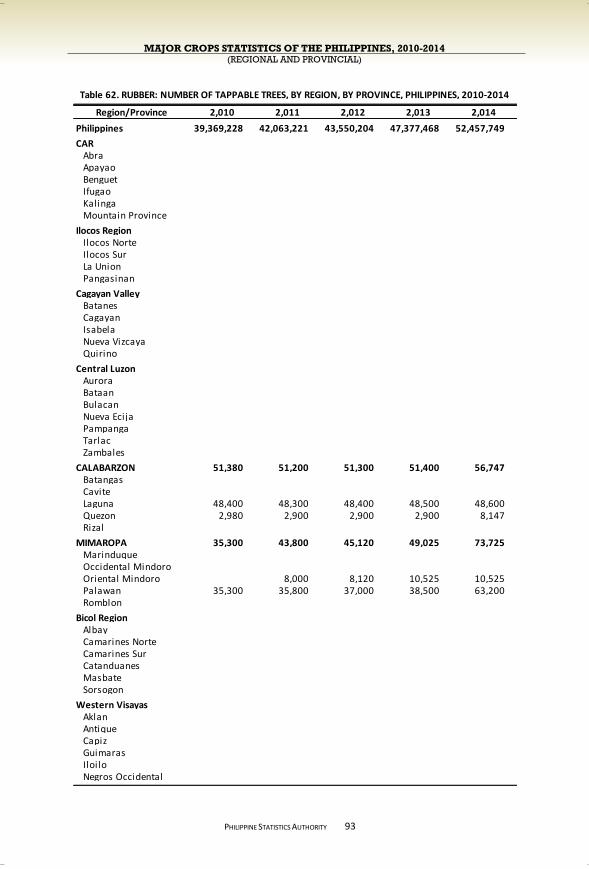
MAJOR CROPS STATISTICS OF THE PHILIPPINES, 2010-2014 (REGIONAL AND PROVINCIAL)
PHILIPPINE STATISTICS AUTHORITY
93
Region/Province 2,010 2,011 2,012 2,013 2,014
Philippines 39,369,228 42,063,221 43,550,204 47,377,468 52,457,749
CAR Abra Apayao Benguet Ifugao Kalinga Mountain Province
Ilocos Region Ilocos Norte Ilocos Sur La Union Pangasinan
Cagayan Valley Batanes Cagayan Isabela Nueva Vizcaya Quirino
Central Luzon Aurora Bataan Bulacan Nueva Ecija Pampanga Tarlac Zambales
CALABARZON 51,380 51,200 51,300 51,400 56,747 Batangas Cavite Laguna 48,400 48,300 48,400 48,500 48,600 Quezon 2,980 2,900 2,900 2,900 8,147 Rizal
MIMAROPA 35,300 43,800 45,120 49,025 73,725 Marinduque Occidental Mindoro Oriental Mindoro 8,000 8,120 10,525 10,525 Palawan 35,300 35,800 37,000 38,500 63,200 Romblon
Bicol Region Albay Camarines Norte Camarines Sur Catanduanes Masbate Sorsogon
Western Visayas Aklan Antique Capiz Guimaras Iloilo Negros Occidental
Table 62. RUBBER: NUMBER OF TAPPABLE TREES, BY REGION, BY PROVINCE, PHILIPPINES, 2010-2014
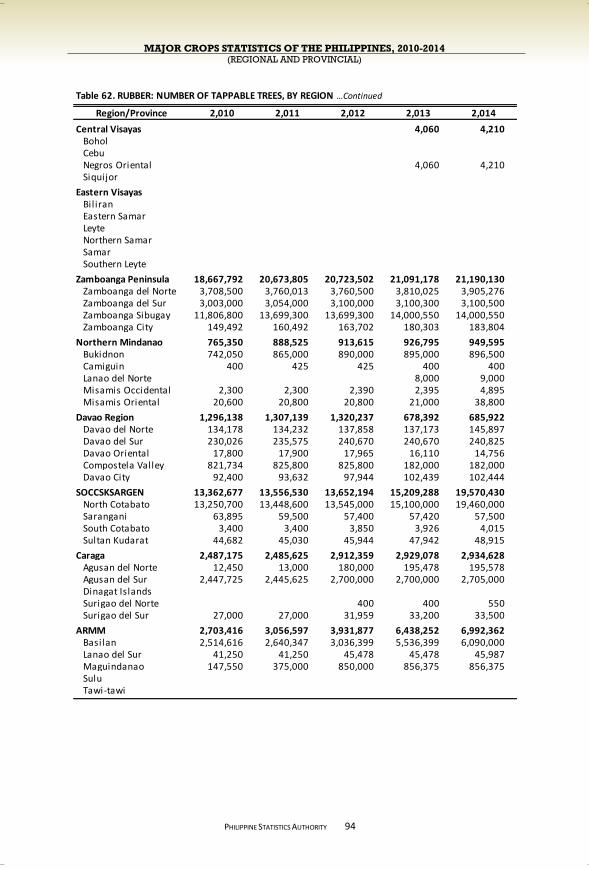
MAJOR CROPS STATISTICS OF THE PHILIPPINES, 2010-2014 (REGIONAL AND PROVINCIAL)
PHILIPPINE STATISTICS AUTHORITY
94
Table 62. RUBBER: NUMBER OF TAPPABLE TREES, BY REGION …Continued
Region/Province 2,010 2,011 2,012 2,013 2,014
Central Visayas 4,060 4,210 Bohol Cebu Negros Oriental 4,060 4,210 Siquijor
Eastern Visayas Bil iran Eastern Samar Leyte Northern Samar Samar Southern Leyte
Zamboanga Peninsula 18,667,792 20,673,805 20,723,502 21,091,178 21,190,130 Zamboanga del Norte 3,708,500 3,760,013 3,760,500 3,810,025 3,905,276 Zamboanga del Sur 3,003,000 3,054,000 3,100,000 3,100,300 3,100,500 Zamboanga Sibugay 11,806,800 13,699,300 13,699,300 14,000,550 14,000,550 Zamboanga City 149,492 160,492 163,702 180,303 183,804
Northern Mindanao 765,350 888,525 913,615 926,795 949,595 Bukidnon 742,050 865,000 890,000 895,000 896,500 Camiguin 400 425 425 400 400 Lanao del Norte 8,000 9,000 Misamis Occidental 2,300 2,300 2,390 2,395 4,895 Misamis Oriental 20,600 20,800 20,800 21,000 38,800
Davao Region 1,296,138 1,307,139 1,320,237 678,392 685,922 Davao del Norte 134,178 134,232 137,858 137,173 145,897 Davao del Sur 230,026 235,575 240,670 240,670 240,825 Davao Oriental 17,800 17,900 17,965 16,110 14,756 Compostela Valley 821,734 825,800 825,800 182,000 182,000 Davao City 92,400 93,632 97,944 102,439 102,444
SOCCSKSARGEN 13,362,677 13,556,530 13,652,194 15,209,288 19,570,430 North Cotabato 13,250,700 13,448,600 13,545,000 15,100,000 19,460,000 Sarangani 63,895 59,500 57,400 57,420 57,500 South Cotabato 3,400 3,400 3,850 3,926 4,015 Sultan Kudarat 44,682 45,030 45,944 47,942 48,915
Caraga 2,487,175 2,485,625 2,912,359 2,929,078 2,934,628 Agusan del Norte 12,450 13,000 180,000 195,478 195,578 Agusan del Sur 2,447,725 2,445,625 2,700,000 2,700,000 2,705,000 Dinagat Islands Surigao del Norte 400 400 550 Surigao del Sur 27,000 27,000 31,959 33,200 33,500
ARMM 2,703,416 3,056,597 3,931,877 6,438,252 6,992,362 Basilan 2,514,616 2,640,347 3,036,399 5,536,399 6,090,000 Lanao del Sur 41,250 41,250 45,478 45,478 45,987 Maguindanao 147,550 375,000 850,000 856,375 856,375 Sulu Tawi-tawi
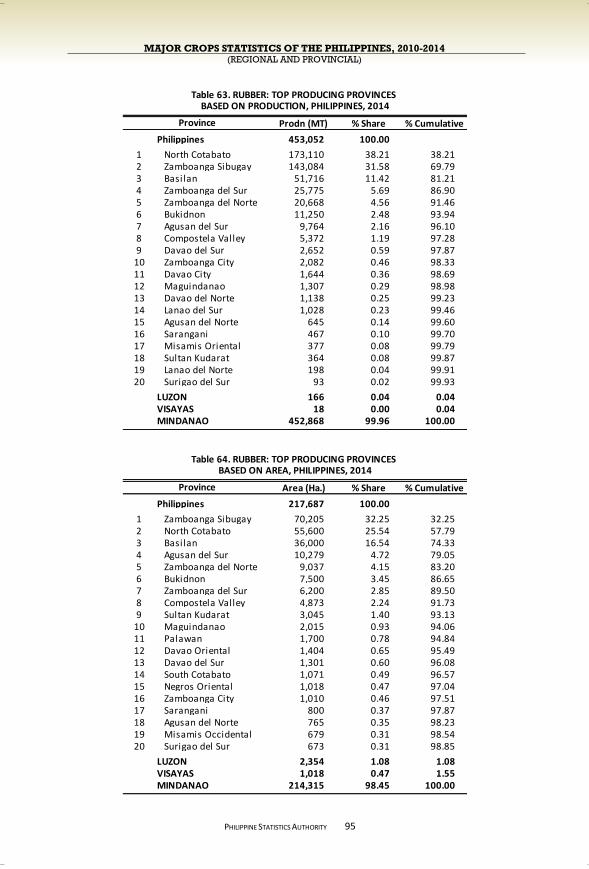
MAJOR CROPS STATISTICS OF THE PHILIPPINES, 2010-2014 (REGIONAL AND PROVINCIAL)
PHILIPPINE STATISTICS AUTHORITY
95
Prodn (MT) % Share % Cumulative
Philippines 453,052 100.00
1 North Cotabato 173,110 38.21 38.212 Zamboanga Sibugay 143,084 31.58 69.793 Basilan 51,716 11.42 81.214 Zamboanga del Sur 25,775 5.69 86.905 Zamboanga del Norte 20,668 4.56 91.466 Bukidnon 11,250 2.48 93.947 Agusan del Sur 9,764 2.16 96.108 Compostela Valley 5,372 1.19 97.289 Davao del Sur 2,652 0.59 97.87
10 Zamboanga City 2,082 0.46 98.3311 Davao City 1,644 0.36 98.6912 Maguindanao 1,307 0.29 98.9813 Davao del Norte 1,138 0.25 99.2314 Lanao del Sur 1,028 0.23 99.4615 Agusan del Norte 645 0.14 99.6016 Sarangani 467 0.10 99.7017 Misamis Oriental 377 0.08 99.7918 Sultan Kudarat 364 0.08 99.8719 Lanao del Norte 198 0.04 99.9120 Surigao del Sur 93 0.02 99.93
LUZON 166 0.04 0.04VISAYAS 18 0.00 0.04MINDANAO 452,868 99.96 100.00
Area (Ha.) % Share % Cumulative
Philippines 217,687 100.00
1 Zamboanga Sibugay 70,205 32.25 32.252 North Cotabato 55,600 25.54 57.793 Basilan 36,000 16.54 74.334 Agusan del Sur 10,279 4.72 79.055 Zamboanga del Norte 9,037 4.15 83.206 Bukidnon 7,500 3.45 86.657 Zamboanga del Sur 6,200 2.85 89.508 Compostela Valley 4,873 2.24 91.739 Sultan Kudarat 3,045 1.40 93.13
10 Maguindanao 2,015 0.93 94.0611 Palawan 1,700 0.78 94.8412 Davao Oriental 1,404 0.65 95.4913 Davao del Sur 1,301 0.60 96.0814 South Cotabato 1,071 0.49 96.5715 Negros Oriental 1,018 0.47 97.0416 Zamboanga City 1,010 0.46 97.5117 Sarangani 800 0.37 97.8718 Agusan del Norte 765 0.35 98.2319 Misamis Occidental 679 0.31 98.5420 Surigao del Sur 673 0.31 98.85
LUZON 2,354 1.08 1.08VISAYAS 1,018 0.47 1.55MINDANAO 214,315 98.45 100.00
Province
Table 63. RUBBER: TOP PRODUCING PROVINCES
Table 64. RUBBER: TOP PRODUCING PROVINCES
Province
BASED ON AREA, PHILIPPINES, 2014
BASED ON PRODUCTION, PHILIPPINES, 2014

MAJOR CROPS STATISTICS OF THE PHILIPPINES, 2010-2014 (REGIONAL AND PROVINCIAL)
PHILIPPINE STATISTICS AUTHORITY
SUGARCANE
From 2010 to 2014, total sugarcane production for all uses grew at an average annual rate of 11.6 percent. Area harvested expanded by 5.5 percent. In 2014, sugarcane output improved by 1.8 percent to 25.03 million mt. This was 24.58 million mt in 2013. The increase was brought about by higher yield attained as a result of efficient use of fertilizer in Negros Occidental and Negros Oriental. There were also expansions in harvest areas in Kalinga, Isabela, Capiz, Cebu, and Leyte.
Negros Occidental was the biggest sugarcane producer in 2014 at 12.72 million mt accounting for more than half of the country’s total sugarcane output. This was followed by Bukidnon, Negros Oriental, Batangas, and Iloilo with combined output of 8.10 million mt or a share of 32.4 percent (Figure 20).
Area harvested to sugarcane was recorded at 432.03 thousand hectares, 1.2 percent lower than last year’s 437.07 thousand hectares. Negros Occidental, the biggest sugarcane producer, likewise, had the largest area harvested at 186.79 thousand hectares covering 43.2 percent of the country’s total area harvested to sugarcane in 2014 (Figure 21).
96
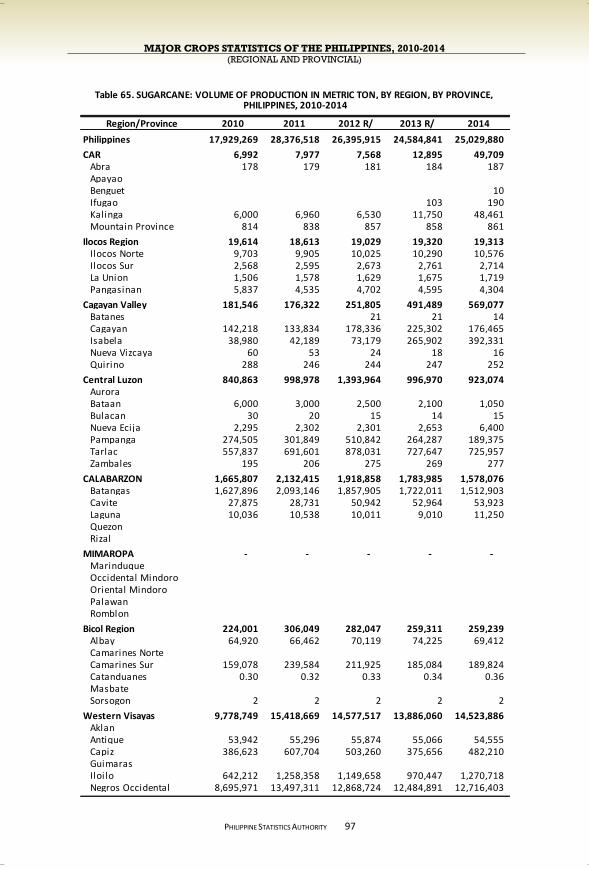
MAJOR CROPS STATISTICS OF THE PHILIPPINES, 2010-2014 (REGIONAL AND PROVINCIAL)
PHILIPPINE STATISTICS AUTHORITY
97
Region/Province 2010 2011 2012 R/ 2013 R/ 2014
Philippines 17,929,269 28,376,518 26,395,915 24,584,841 25,029,880
CAR 6,992 7,977 7,568 12,895 49,709 Abra 178 179 181 184 187 Apayao Benguet 10 Ifugao 103 190 Kalinga 6,000 6,960 6,530 11,750 48,461 Mountain Province 814 838 857 858 861
Ilocos Region 19,614 18,613 19,029 19,320 19,313 Ilocos Norte 9,703 9,905 10,025 10,290 10,576 Ilocos Sur 2,568 2,595 2,673 2,761 2,714 La Union 1,506 1,578 1,629 1,675 1,719 Pangasinan 5,837 4,535 4,702 4,595 4,304
Cagayan Valley 181,546 176,322 251,805 491,489 569,077 Batanes 21 21 14 Cagayan 142,218 133,834 178,336 225,302 176,465 Isabela 38,980 42,189 73,179 265,902 392,331 Nueva Vizcaya 60 53 24 18 16 Quirino 288 246 244 247 252
Central Luzon 840,863 998,978 1,393,964 996,970 923,074 Aurora Bataan 6,000 3,000 2,500 2,100 1,050 Bulacan 30 20 15 14 15 Nueva Ecija 2,295 2,302 2,301 2,653 6,400 Pampanga 274,505 301,849 510,842 264,287 189,375 Tarlac 557,837 691,601 878,031 727,647 725,957 Zambales 195 206 275 269 277
CALABARZON 1,665,807 2,132,415 1,918,858 1,783,985 1,578,076 Batangas 1,627,896 2,093,146 1,857,905 1,722,011 1,512,903 Cavite 27,875 28,731 50,942 52,964 53,923 Laguna 10,036 10,538 10,011 9,010 11,250 Quezon Rizal
MIMAROPA - - - - - Marinduque Occidental Mindoro Oriental Mindoro Palawan Romblon
Bicol Region 224,001 306,049 282,047 259,311 259,239 Albay 64,920 66,462 70,119 74,225 69,412 Camarines Norte Camarines Sur 159,078 239,584 211,925 185,084 189,824 Catanduanes 0.30 0.32 0.33 0.34 0.36 Masbate Sorsogon 2 2 2 2 2
Western Visayas 9,778,749 15,418,669 14,577,517 13,886,060 14,523,886 Aklan Antique 53,942 55,296 55,874 55,066 54,555 Capiz 386,623 607,704 503,260 375,656 482,210 Guimaras Iloilo 642,212 1,258,358 1,149,658 970,447 1,270,718 Negros Occidental 8,695,971 13,497,311 12,868,724 12,484,891 12,716,403
PHILIPPINES, 2010-2014Table 65. SUGARCANE: VOLUME OF PRODUCTION IN METRIC TON, BY REGION, BY PROVINCE,
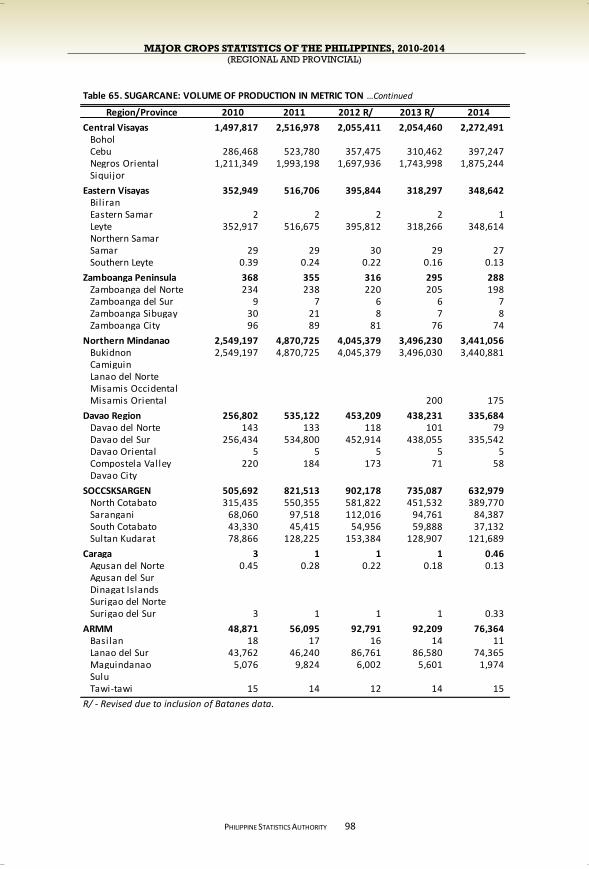
MAJOR CROPS STATISTICS OF THE PHILIPPINES, 2010-2014 (REGIONAL AND PROVINCIAL)
PHILIPPINE STATISTICS AUTHORITY
98
Region/Province 2010 2011 2012 R/ 2013 R/ 2014
Central Visayas 1,497,817 2,516,978 2,055,411 2,054,460 2,272,491 Bohol Cebu 286,468 523,780 357,475 310,462 397,247 Negros Oriental 1,211,349 1,993,198 1,697,936 1,743,998 1,875,244 Siquijor
Eastern Visayas 352,949 516,706 395,844 318,297 348,642 Bil iran Eastern Samar 2 2 2 2 1 Leyte 352,917 516,675 395,812 318,266 348,614 Northern Samar Samar 29 29 30 29 27 Southern Leyte 0.39 0.24 0.22 0.16 0.13
Zamboanga Peninsula 368 355 316 295 288 Zamboanga del Norte 234 238 220 205 198 Zamboanga del Sur 9 7 6 6 7 Zamboanga Sibugay 30 21 8 7 8 Zamboanga City 96 89 81 76 74
Northern Mindanao 2,549,197 4,870,725 4,045,379 3,496,230 3,441,056 Bukidnon 2,549,197 4,870,725 4,045,379 3,496,030 3,440,881 Camiguin Lanao del Norte Misamis Occidental Misamis Oriental 200 175
Davao Region 256,802 535,122 453,209 438,231 335,684 Davao del Norte 143 133 118 101 79 Davao del Sur 256,434 534,800 452,914 438,055 335,542 Davao Oriental 5 5 5 5 5 Compostela Valley 220 184 173 71 58 Davao City
SOCCSKSARGEN 505,692 821,513 902,178 735,087 632,979 North Cotabato 315,435 550,355 581,822 451,532 389,770 Sarangani 68,060 97,518 112,016 94,761 84,387 South Cotabato 43,330 45,415 54,956 59,888 37,132 Sultan Kudarat 78,866 128,225 153,384 128,907 121,689
Caraga 3 1 1 1 0.46 Agusan del Norte 0.45 0.28 0.22 0.18 0.13 Agusan del Sur Dinagat Islands Surigao del Norte Surigao del Sur 3 1 1 1 0.33
ARMM 48,871 56,095 92,791 92,209 76,364 Basilan 18 17 16 14 11 Lanao del Sur 43,762 46,240 86,761 86,580 74,365 Maguindanao 5,076 9,824 6,002 5,601 1,974 Sulu Tawi-tawi 15 14 12 14 15
R/ - Revised due to inclusion of Batanes data.
Table 65. SUGARCANE: VOLUME OF PRODUCTION IN METRIC TON …Continued
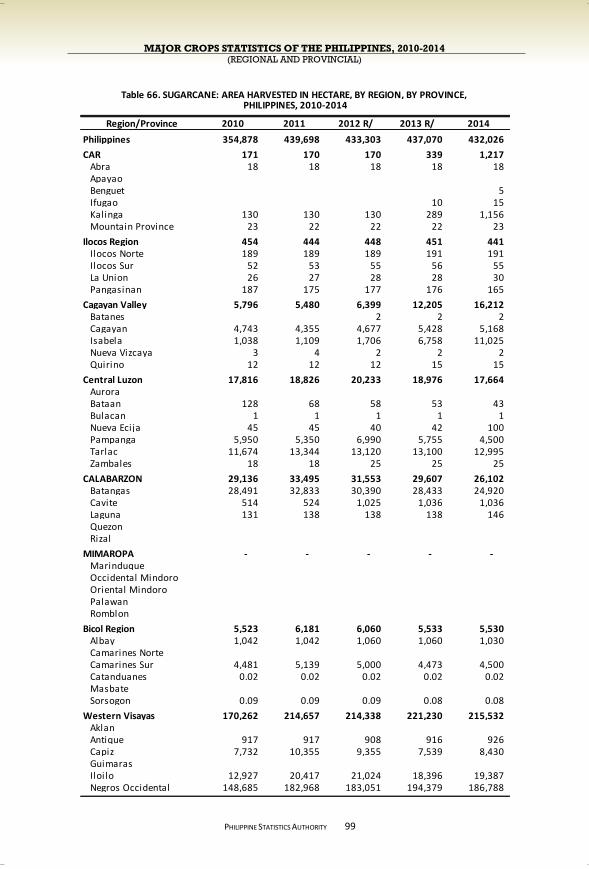
MAJOR CROPS STATISTICS OF THE PHILIPPINES, 2010-2014 (REGIONAL AND PROVINCIAL)
PHILIPPINE STATISTICS AUTHORITY
99
Region/Province 2010 2011 2012 R/ 2013 R/ 2014
Philippines 354,878 439,698 433,303 437,070 432,026
CAR 171 170 170 339 1,217 Abra 18 18 18 18 18 Apayao Benguet 5 Ifugao 10 15 Kalinga 130 130 130 289 1,156 Mountain Province 23 22 22 22 23
Ilocos Region 454 444 448 451 441 Ilocos Norte 189 189 189 191 191 Ilocos Sur 52 53 55 56 55 La Union 26 27 28 28 30 Pangasinan 187 175 177 176 165
Cagayan Valley 5,796 5,480 6,399 12,205 16,212 Batanes 2 2 2 Cagayan 4,743 4,355 4,677 5,428 5,168 Isabela 1,038 1,109 1,706 6,758 11,025 Nueva Vizcaya 3 4 2 2 2 Quirino 12 12 12 15 15
Central Luzon 17,816 18,826 20,233 18,976 17,664 Aurora Bataan 128 68 58 53 43 Bulacan 1 1 1 1 1 Nueva Ecija 45 45 40 42 100 Pampanga 5,950 5,350 6,990 5,755 4,500 Tarlac 11,674 13,344 13,120 13,100 12,995 Zambales 18 18 25 25 25
CALABARZON 29,136 33,495 31,553 29,607 26,102 Batangas 28,491 32,833 30,390 28,433 24,920 Cavite 514 524 1,025 1,036 1,036 Laguna 131 138 138 138 146 Quezon Rizal
MIMAROPA - - - - - Marinduque Occidental Mindoro Oriental Mindoro Palawan Romblon
Bicol Region 5,523 6,181 6,060 5,533 5,530 Albay 1,042 1,042 1,060 1,060 1,030 Camarines Norte Camarines Sur 4,481 5,139 5,000 4,473 4,500 Catanduanes 0.02 0.02 0.02 0.02 0.02 Masbate Sorsogon 0.09 0.09 0.09 0.08 0.08
Western Visayas 170,262 214,657 214,338 221,230 215,532 Aklan Antique 917 917 908 916 926 Capiz 7,732 10,355 9,355 7,539 8,430 Guimaras Iloilo 12,927 20,417 21,024 18,396 19,387 Negros Occidental 148,685 182,968 183,051 194,379 186,788
PHILIPPINES, 2010-2014Table 66. SUGARCANE: AREA HARVESTED IN HECTARE, BY REGION, BY PROVINCE,
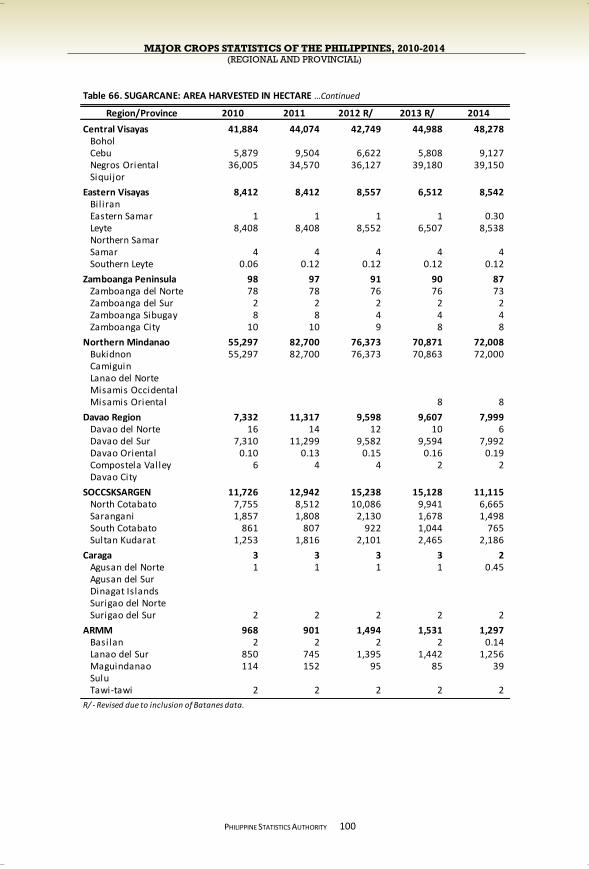
MAJOR CROPS STATISTICS OF THE PHILIPPINES, 2010-2014 (REGIONAL AND PROVINCIAL)
PHILIPPINE STATISTICS AUTHORITY
100
Region/Province 2010 2011 2012 R/ 2013 R/ 2014
Central Visayas 41,884 44,074 42,749 44,988 48,278 Bohol Cebu 5,879 9,504 6,622 5,808 9,127 Negros Oriental 36,005 34,570 36,127 39,180 39,150 Siquijor
Eastern Visayas 8,412 8,412 8,557 6,512 8,542 Bil iran Eastern Samar 1 1 1 1 0.30 Leyte 8,408 8,408 8,552 6,507 8,538 Northern Samar Samar 4 4 4 4 4 Southern Leyte 0.06 0.12 0.12 0.12 0.12
Zamboanga Peninsula 98 97 91 90 87 Zamboanga del Norte 78 78 76 76 73 Zamboanga del Sur 2 2 2 2 2 Zamboanga Sibugay 8 8 4 4 4 Zamboanga City 10 10 9 8 8
Northern Mindanao 55,297 82,700 76,373 70,871 72,008 Bukidnon 55,297 82,700 76,373 70,863 72,000 Camiguin Lanao del Norte Misamis Occidental Misamis Oriental 8 8
Davao Region 7,332 11,317 9,598 9,607 7,999 Davao del Norte 16 14 12 10 6 Davao del Sur 7,310 11,299 9,582 9,594 7,992 Davao Oriental 0.10 0.13 0.15 0.16 0.19 Compostela Valley 6 4 4 2 2 Davao City
SOCCSKSARGEN 11,726 12,942 15,238 15,128 11,115 North Cotabato 7,755 8,512 10,086 9,941 6,665 Sarangani 1,857 1,808 2,130 1,678 1,498 South Cotabato 861 807 922 1,044 765 Sultan Kudarat 1,253 1,816 2,101 2,465 2,186
Caraga 3 3 3 3 2 Agusan del Norte 1 1 1 1 0.45 Agusan del Sur Dinagat Islands Surigao del Norte Surigao del Sur 2 2 2 2 2
ARMM 968 901 1,494 1,531 1,297 Basilan 2 2 2 2 0.14 Lanao del Sur 850 745 1,395 1,442 1,256 Maguindanao 114 152 95 85 39 Sulu Tawi-tawi 2 2 2 2 2
R/ - Revised due to inclusion of Batanes data.
Table 66. SUGARCANE: AREA HARVESTED IN HECTARE …Continued
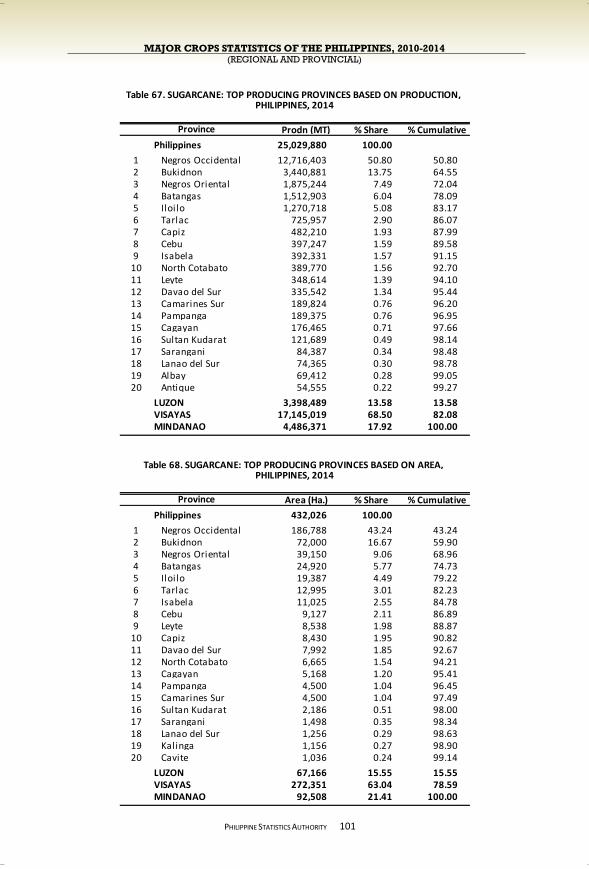
MAJOR CROPS STATISTICS OF THE PHILIPPINES, 2010-2014 (REGIONAL AND PROVINCIAL)
PHILIPPINE STATISTICS AUTHORITY
101
Prodn (MT) % Share % Cumulative
Philippines 25,029,880 100.00
1 Negros Occidental 12,716,403 50.80 50.802 Bukidnon 3,440,881 13.75 64.553 Negros Oriental 1,875,244 7.49 72.044 Batangas 1,512,903 6.04 78.095 Iloilo 1,270,718 5.08 83.176 Tarlac 725,957 2.90 86.077 Capiz 482,210 1.93 87.998 Cebu 397,247 1.59 89.589 Isabela 392,331 1.57 91.15
10 North Cotabato 389,770 1.56 92.7011 Leyte 348,614 1.39 94.1012 Davao del Sur 335,542 1.34 95.4413 Camarines Sur 189,824 0.76 96.2014 Pampanga 189,375 0.76 96.9515 Cagayan 176,465 0.71 97.6616 Sultan Kudarat 121,689 0.49 98.1417 Sarangani 84,387 0.34 98.4818 Lanao del Sur 74,365 0.30 98.7819 Albay 69,412 0.28 99.0520 Antique 54,555 0.22 99.27
LUZON 3,398,489 13.58 13.58VISAYAS 17,145,019 68.50 82.08MINDANAO 4,486,371 17.92 100.00
Area (Ha.) % Share % Cumulative
Philippines 432,026 100.00
1 Negros Occidental 186,788 43.24 43.242 Bukidnon 72,000 16.67 59.903 Negros Oriental 39,150 9.06 68.964 Batangas 24,920 5.77 74.735 Iloilo 19,387 4.49 79.226 Tarlac 12,995 3.01 82.237 Isabela 11,025 2.55 84.788 Cebu 9,127 2.11 86.899 Leyte 8,538 1.98 88.87
10 Capiz 8,430 1.95 90.8211 Davao del Sur 7,992 1.85 92.6712 North Cotabato 6,665 1.54 94.2113 Cagayan 5,168 1.20 95.4114 Pampanga 4,500 1.04 96.4515 Camarines Sur 4,500 1.04 97.4916 Sultan Kudarat 2,186 0.51 98.0017 Sarangani 1,498 0.35 98.3418 Lanao del Sur 1,256 0.29 98.6319 Kalinga 1,156 0.27 98.9020 Cavite 1,036 0.24 99.14
LUZON 67,166 15.55 15.55VISAYAS 272,351 63.04 78.59MINDANAO 92,508 21.41 100.00
Table 67. SUGARCANE: TOP PRODUCING PROVINCES BASED ON PRODUCTION,
Province
Table 68. SUGARCANE: TOP PRODUCING PROVINCES BASED ON AREA,
Province
PHILIPPINES, 2014
PHILIPPINES, 2014
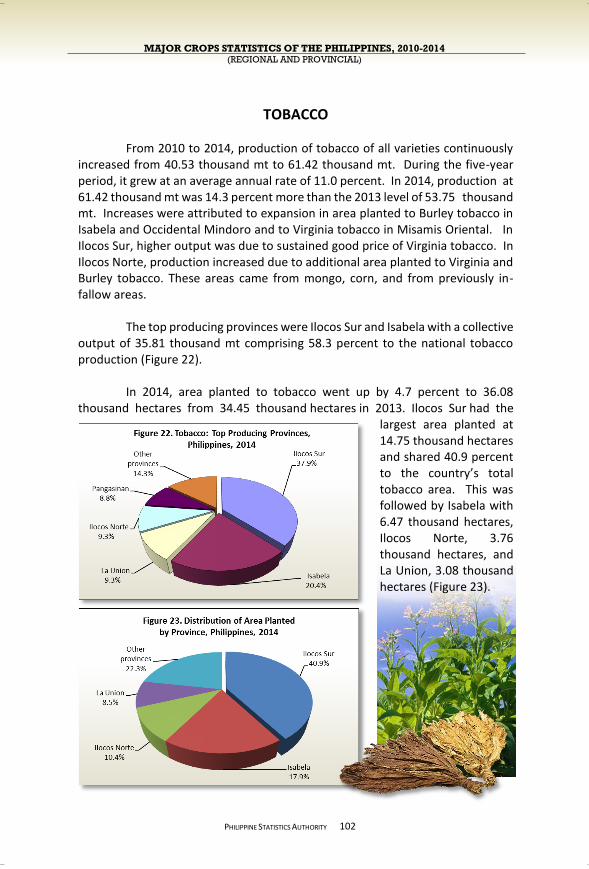
MAJOR CROPS STATISTICS OF THE PHILIPPINES, 2010-2014 (REGIONAL AND PROVINCIAL)
PHILIPPINE STATISTICS AUTHORITY
TOBACCO
From 2010 to 2014, production of tobacco of all varieties continuously increased from 40.53 thousand mt to 61.42 thousand mt. During the five-year period, it grew at an average annual rate of 11.0 percent. In 2014, production at 61.42 thousand mt was 14.3 percent more than the 2013 level of 53.75 thousand mt. Increases were attributed to expansion in area planted to Burley tobacco in Isabela and Occidental Mindoro and to Virginia tobacco in Misamis Oriental. In Ilocos Sur, higher output was due to sustained good price of Virginia tobacco. In Ilocos Norte, production increased due to additional area planted to Virginia and Burley tobacco. These areas came from mongo, corn, and from previously in-fallow areas.
The top producing provinces were Ilocos Sur and Isabela with a collective
output of 35.81 thousand mt comprising 58.3 percent to the national tobacco production (Figure 22).
In 2014, area planted to tobacco went up by 4.7 percent to 36.08
thousand hectares from 34.45 thousand hectares in 2013. Ilocos Sur had the largest area planted at 14.75 thousand hectares and shared 40.9 percent to the country’s total tobacco area. This was followed by Isabela with 6.47 thousand hectares, Ilocos Norte, 3.76 thousand hectares, and La Union, 3.08 thousand hectares (Figure 23).
102
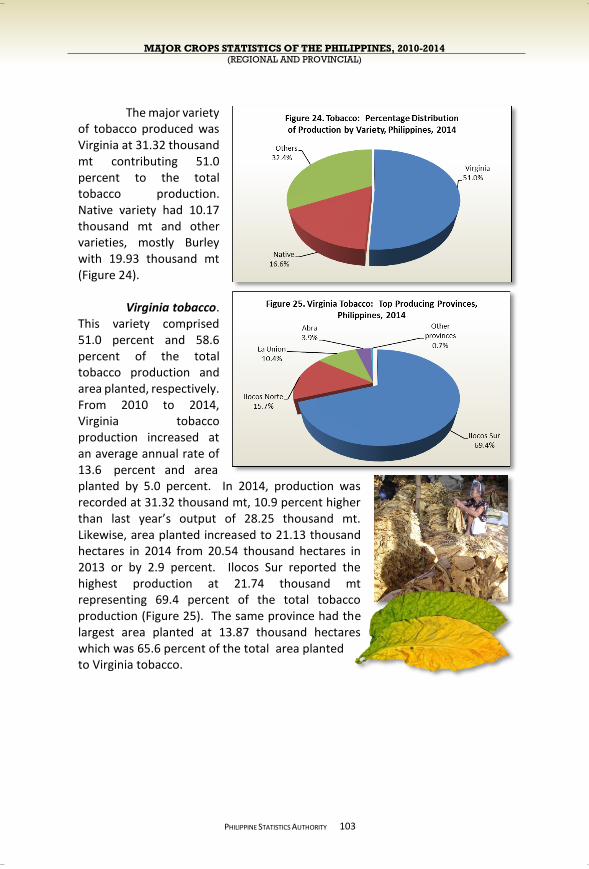
MAJOR CROPS STATISTICS OF THE PHILIPPINES, 2010-2014 (REGIONAL AND PROVINCIAL)
PHILIPPINE STATISTICS AUTHORITY
The major variety of tobacco produced was Virginia at 31.32 thousand mt contributing 51.0 percent to the total tobacco production. Native variety had 10.17 thousand mt and other varieties, mostly Burley with 19.93 thousand mt (Figure 24).
Virginia tobacco.
This variety comprised 51.0 percent and 58.6 percent of the total tobacco production and area planted, respectively. From 2010 to 2014, Virginia tobacco production increased at an average annual rate of 13.6 percent and area planted by 5.0 percent. In 2014, production was recorded at 31.32 thousand mt, 10.9 percent higher than last year’s output of 28.25 thousand mt. Likewise, area planted increased to 21.13 thousand hectares in 2014 from 20.54 thousand hectares in 2013 or by 2.9 percent. Ilocos Sur reported the highest production at 21.74 thousand mt representing 69.4 percent of the total tobacco production (Figure 25). The same province had the largest area planted at 13.87 thousand hectares which was 65.6 percent of the total area planted to Virginia tobacco.
103
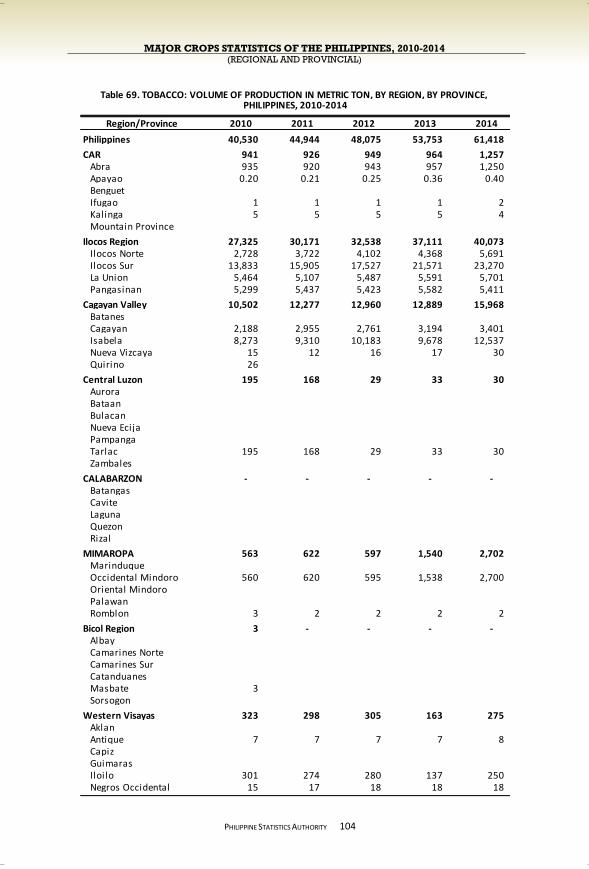
MAJOR CROPS STATISTICS OF THE PHILIPPINES, 2010-2014 (REGIONAL AND PROVINCIAL)
PHILIPPINE STATISTICS AUTHORITY
104
Region/Province 2010 2011 2012 2013 2014
Philippines 40,530 44,944 48,075 53,753 61,418
CAR 941 926 949 964 1,257 Abra 935 920 943 957 1,250 Apayao 0.20 0.21 0.25 0.36 0.40 Benguet Ifugao 1 1 1 1 2 Kalinga 5 5 5 5 4 Mountain Province
Ilocos Region 27,325 30,171 32,538 37,111 40,073 Ilocos Norte 2,728 3,722 4,102 4,368 5,691 Ilocos Sur 13,833 15,905 17,527 21,571 23,270 La Union 5,464 5,107 5,487 5,591 5,701 Pangasinan 5,299 5,437 5,423 5,582 5,411
Cagayan Valley 10,502 12,277 12,960 12,889 15,968 Batanes Cagayan 2,188 2,955 2,761 3,194 3,401 Isabela 8,273 9,310 10,183 9,678 12,537 Nueva Vizcaya 15 12 16 17 30 Quirino 26
Central Luzon 195 168 29 33 30 Aurora Bataan Bulacan Nueva Ecija Pampanga Tarlac 195 168 29 33 30 Zambales
CALABARZON - - - - - Batangas Cavite Laguna Quezon Rizal
MIMAROPA 563 622 597 1,540 2,702 Marinduque Occidental Mindoro 560 620 595 1,538 2,700 Oriental Mindoro Palawan Romblon 3 2 2 2 2
Bicol Region 3 - - - - Albay Camarines Norte Camarines Sur Catanduanes Masbate 3 Sorsogon
Western Visayas 323 298 305 163 275 Aklan Antique 7 7 7 7 8 Capiz Guimaras Iloilo 301 274 280 137 250 Negros Occidental 15 17 18 18 18
PHILIPPINES, 2010-2014Table 69. TOBACCO: VOLUME OF PRODUCTION IN METRIC TON, BY REGION, BY PROVINCE,

MAJOR CROPS STATISTICS OF THE PHILIPPINES, 2010-2014 (REGIONAL AND PROVINCIAL)
PHILIPPINE STATISTICS AUTHORITY
105
Region/Province 2010 2011 2012 2013 2014
Central Visayas 16 11 9 10 10 Bohol Cebu 4 3 2 1 1 Negros Oriental 12 8 7 8 9 Siquijor
Eastern Visayas 20 19 18 13 8 Bil iran 2 2 2 1 1 Eastern Samar Leyte 16 15 14 9 5 Northern Samar Samar 1 1 1 1 1 Southern Leyte 1 1 1 1 0.38
Zamboanga Peninsula 21 16 15 16 27 Zamboanga del Norte 2 2 2 2 2 Zamboanga del Sur 9 8 7 8 9 Zamboanga Sibugay 10 5 5 6 16 Zamboanga City 0.46 0.48 0.48 0.50 0.51
Northern Mindanao 481 311 547 936 1,005 Bukidnon Camiguin Lanao del Norte Misamis Occidental Misamis Oriental 481 311 547 936 1,005
Davao Region 22 20 19 17 17 Davao del Norte 5 5 5 5 5 Davao del Sur 7 6 6 6 6 Davao Oriental 5 5 4 4 4 Compostela Valley 3 3 3 1 1 Davao City 1 1 1 1 1
SOCCSKSARGEN 54 50 46 37 30 North Cotabato 31 31 28 20 15 Sarangani 12 9 8 7 6 South Cotabato 8 8 8 7 7 Sultan Kudarat 3 2 2 2 2
Caraga 4 2 2 1 1 Agusan del Norte Agusan del Sur Dinagat Islands Surigao del Norte Surigao del Sur 4 2 2 1 1
ARMM 61 54 41 24 15 Basilan Lanao del Sur Maguindanao 61 54 41 24 15 Sulu Tawi-tawi
Table 69. TOBACCO: VOLUME OF PRODUCTION IN METRIC TON …Continued

MAJOR CROPS STATISTICS OF THE PHILIPPINES, 2010-2014 (REGIONAL AND PROVINCIAL)
PHILIPPINE STATISTICS AUTHORITY
106
Region/Province 2010 2011 2012 2013 2014
Philippines 29,707 32,235 34,025 34,451 36,082
CAR 2,018 2,013 2,052 2,051 2,051 Abra 2,010 2,005 2,046 2,046 2,046 Apayao 2 2 2 2 2 Benguet Ifugao 1 1 1 1 1 Kalinga 5 5 3 2 2 Mountain Province
Ilocos Region 20,021 21,509 22,278 23,055 23,747 Ilocos Norte 2,644 2,987 3,233 3,313 3,755 Ilocos Sur 12,171 13,375 13,758 14,498 14,751 La Union 2,841 2,752 2,911 3,035 3,082 Pangasinan 2,365 2,396 2,376 2,209 2,159
Cagayan Valley 6,595 7,716 8,403 7,371 7,980 Batanes Cagayan 1,690 2,210 2,159 1,557 1,500 Isabela 4,873 5,498 6,235 5,805 6,465 Nueva Vizcaya 10 8 9 9 15 Quirino 22
Central Luzon 100 100 100 100 90 Aurora Bataan Bulacan Nueva Ecija Pampanga Tarlac 100 100 100 100 90 Zambales
CALABARZON - - - - - Batangas Cavite Laguna Quezon Rizal
MIMAROPA 265 308 301 700 1,121 Marinduque Occidental Mindoro 262 305 299 698 1,119 Oriental Mindoro Palawan Romblon 3 3 2 2 2
Bicol Region 4 - - - - Albay Camarines Norte Camarines Sur Catanduanes Masbate 4 Sorsogon
Western Visayas 184 182 181 107 169 Aklan Antique 11 12 10 10 11 Capiz Guimaras Iloilo 148 145 146 72 133 Negros Occidental 25 25 25 25 25
Table 70. TOBACCO: AREA PLANTED IN HECTARE, BY REGION, BY PROVINCE, PHILIPPINES, 2010-2014

MAJOR CROPS STATISTICS OF THE PHILIPPINES, 2010-2014 (REGIONAL AND PROVINCIAL)
PHILIPPINE STATISTICS AUTHORITY
107
Region/Province 2010 2011 2012 2013 2014
Central Visayas 26 25 20 19 19 Bohol Cebu 10 10 8 5 3 Negros Oriental 16 15 12 14 16 Siquijor
Eastern Visayas 29 26 24 22 17 Bil iran 1 1 1 1 1 Eastern Samar Leyte 25 22 20 19 14 Northern Samar Samar 2 2 2 2 2 Southern Leyte 1 1 1 1 0.25
Zamboanga Peninsula 30 28 23 30 31 Zamboanga del Norte 3 2 2 2 2 Zamboanga del Sur 18 17 15 15 16 Zamboanga Sibugay 8 8 5 12 12 Zamboanga City 1 1 1 1 1
Northern Mindanao 350 250 576 943 810 Bukidnon Camiguin Lanao del Norte Misamis Occidental Misamis Oriental 350 250 576 943 810
Davao Region 17 15 14 12 12 Davao del Norte 5 4 4 4 4 Davao del Sur 5 4 4 3 3 Davao Oriental 4 4 3 3 3 Compostela Valley 2 2 2 1 1 Davao City 1 1 1 1 1
SOCCSKSARGEN 40 38 34 28 22 North Cotabato 22 22 20 15 12 Sarangani 14 12 10 9 6 South Cotabato 2 2 2 2 2 Sultan Kudarat 2 2 2 2 2
Caraga 6 6 5 3 3 Agusan del Norte Agusan del Sur Dinagat Islands Surigao del Norte Surigao del Sur 6 6 5 3 3
ARMM 22 20 15 10 9 Basilan Lanao del Sur Maguindanao 22 20 15 10 9 Sulu Tawi-tawi
Table 70. TOBACCO: AREA PLANTED IN HECTARE …Continued
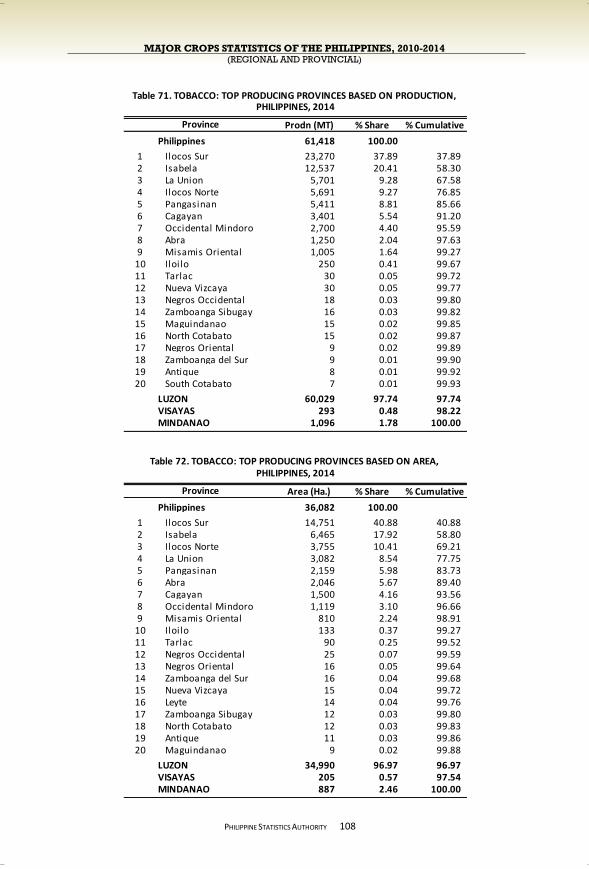
MAJOR CROPS STATISTICS OF THE PHILIPPINES, 2010-2014 (REGIONAL AND PROVINCIAL)
PHILIPPINE STATISTICS AUTHORITY
108
Prodn (MT) % Share % Cumulative
Philippines 61,418 100.00
1 Ilocos Sur 23,270 37.89 37.89 2 Isabela 12,537 20.41 58.30 3 La Union 5,701 9.28 67.58 4 Ilocos Norte 5,691 9.27 76.85 5 Pangasinan 5,411 8.81 85.66 6 Cagayan 3,401 5.54 91.20 7 Occidental Mindoro 2,700 4.40 95.59 8 Abra 1,250 2.04 97.63 9 Misamis Oriental 1,005 1.64 99.27
10 Iloilo 250 0.41 99.67 11 Tarlac 30 0.05 99.72 12 Nueva Vizcaya 30 0.05 99.77 13 Negros Occidental 18 0.03 99.80 14 Zamboanga Sibugay 16 0.03 99.82 15 Maguindanao 15 0.02 99.85 16 North Cotabato 15 0.02 99.87 17 Negros Oriental 9 0.02 99.89 18 Zamboanga del Sur 9 0.01 99.90 19 Antique 8 0.01 99.92 20 South Cotabato 7 0.01 99.93
LUZON 60,029 97.74 97.74 VISAYAS 293 0.48 98.22 MINDANAO 1,096 1.78 100.00
Area (Ha.) % Share % Cumulative
Philippines 36,082 100.00
1 Ilocos Sur 14,751 40.88 40.88 2 Isabela 6,465 17.92 58.80 3 Ilocos Norte 3,755 10.41 69.21 4 La Union 3,082 8.54 77.75 5 Pangasinan 2,159 5.98 83.73 6 Abra 2,046 5.67 89.40 7 Cagayan 1,500 4.16 93.56 8 Occidental Mindoro 1,119 3.10 96.66 9 Misamis Oriental 810 2.24 98.91
10 Iloilo 133 0.37 99.27 11 Tarlac 90 0.25 99.52 12 Negros Occidental 25 0.07 99.59 13 Negros Oriental 16 0.05 99.64 14 Zamboanga del Sur 16 0.04 99.68 15 Nueva Vizcaya 15 0.04 99.72 16 Leyte 14 0.04 99.76 17 Zamboanga Sibugay 12 0.03 99.80 18 North Cotabato 12 0.03 99.83 19 Antique 11 0.03 99.86 20 Maguindanao 9 0.02 99.88
LUZON 34,990 96.97 96.97 VISAYAS 205 0.57 97.54 MINDANAO 887 2.46 100.00
Province
Table 71. TOBACCO: TOP PRODUCING PROVINCES BASED ON PRODUCTION,
Table 72. TOBACCO: TOP PRODUCING PROVINCES BASED ON AREA,
Province
PHILIPPINES, 2014
PHILIPPINES, 2014
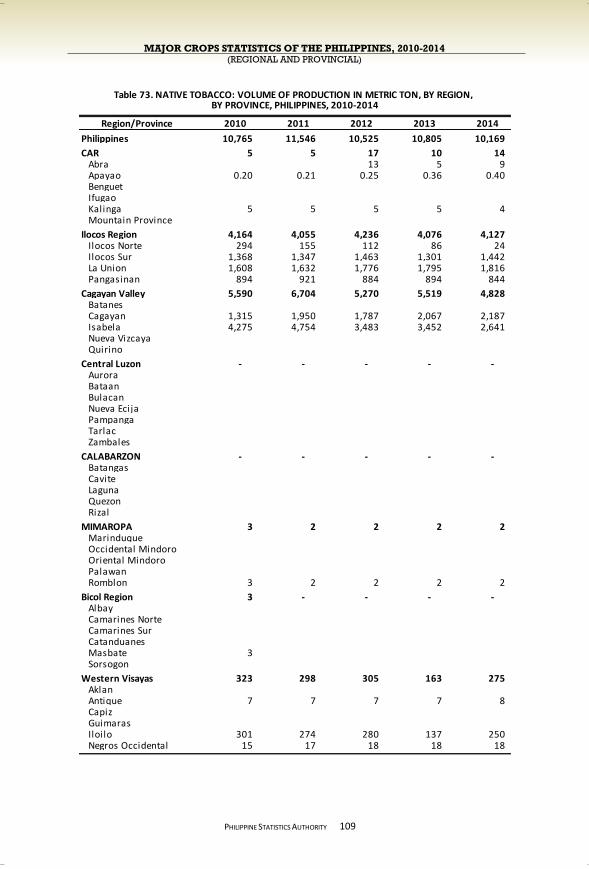
MAJOR CROPS STATISTICS OF THE PHILIPPINES, 2010-2014 (REGIONAL AND PROVINCIAL)
PHILIPPINE STATISTICS AUTHORITY
109
Region/Province 2010 2011 2012 2013 2014
Philippines 10,765 11,546 10,525 10,805 10,169
CAR 5 5 17 10 14 Abra 13 5 9 Apayao 0.20 0.21 0.25 0.36 0.40 Benguet Ifugao Kalinga 5 5 5 5 4 Mountain Province
Ilocos Region 4,164 4,055 4,236 4,076 4,127 Ilocos Norte 294 155 112 86 24 Ilocos Sur 1,368 1,347 1,463 1,301 1,442 La Union 1,608 1,632 1,776 1,795 1,816 Pangasinan 894 921 884 894 844
Cagayan Valley 5,590 6,704 5,270 5,519 4,828 Batanes Cagayan 1,315 1,950 1,787 2,067 2,187 Isabela 4,275 4,754 3,483 3,452 2,641 Nueva Vizcaya Quirino
Central Luzon - - - - - Aurora Bataan Bulacan Nueva Ecija Pampanga Tarlac Zambales
CALABARZON - - - - - Batangas Cavite Laguna Quezon Rizal
MIMAROPA 3 2 2 2 2 Marinduque Occidental Mindoro Oriental Mindoro Palawan Romblon 3 2 2 2 2
Bicol Region 3 - - - - Albay Camarines Norte Camarines Sur Catanduanes Masbate 3 Sorsogon
Western Visayas 323 298 305 163 275 Aklan Antique 7 7 7 7 8 Capiz Guimaras Iloilo 301 274 280 137 250 Negros Occidental 15 17 18 18 18
Table 73. NATIVE TOBACCO: VOLUME OF PRODUCTION IN METRIC TON, BY REGION, BY PROVINCE, PHILIPPINES, 2010-2014
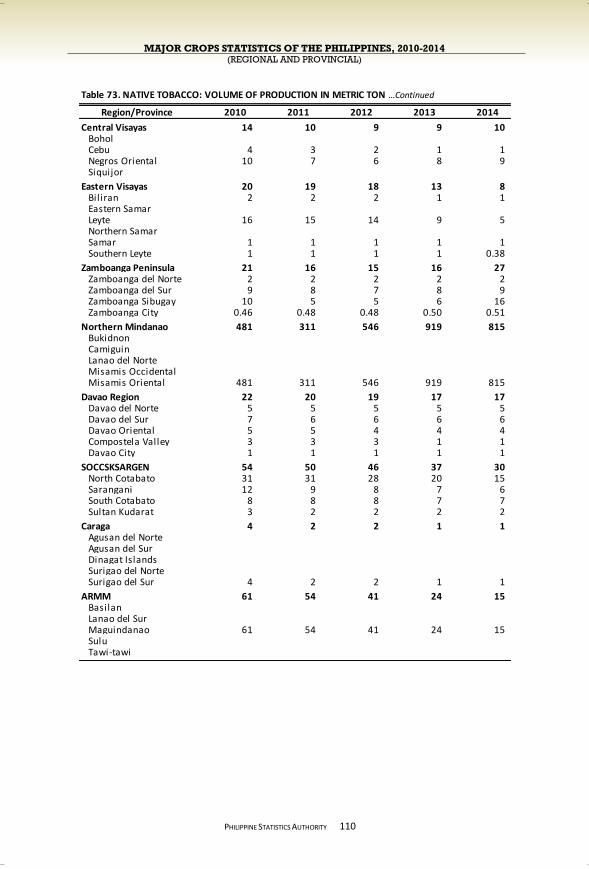
MAJOR CROPS STATISTICS OF THE PHILIPPINES, 2010-2014 (REGIONAL AND PROVINCIAL)
PHILIPPINE STATISTICS AUTHORITY
110
Region/Province 2010 2011 2012 2013 2014
Central Visayas 14 10 9 9 10 Bohol Cebu 4 3 2 1 1 Negros Oriental 10 7 6 8 9 Siquijor
Eastern Visayas 20 19 18 13 8 Bil iran 2 2 2 1 1 Eastern Samar Leyte 16 15 14 9 5 Northern Samar Samar 1 1 1 1 1 Southern Leyte 1 1 1 1 0.38
Zamboanga Peninsula 21 16 15 16 27 Zamboanga del Norte 2 2 2 2 2 Zamboanga del Sur 9 8 7 8 9 Zamboanga Sibugay 10 5 5 6 16 Zamboanga City 0.46 0.48 0.48 0.50 0.51
Northern Mindanao 481 311 546 919 815 Bukidnon Camiguin Lanao del Norte Misamis Occidental Misamis Oriental 481 311 546 919 815
Davao Region 22 20 19 17 17 Davao del Norte 5 5 5 5 5 Davao del Sur 7 6 6 6 6 Davao Oriental 5 5 4 4 4 Compostela Valley 3 3 3 1 1 Davao City 1 1 1 1 1
SOCCSKSARGEN 54 50 46 37 30 North Cotabato 31 31 28 20 15 Sarangani 12 9 8 7 6 South Cotabato 8 8 8 7 7 Sultan Kudarat 3 2 2 2 2
Caraga 4 2 2 1 1 Agusan del Norte Agusan del Sur Dinagat Islands Surigao del Norte Surigao del Sur 4 2 2 1 1
ARMM 61 54 41 24 15 Basilan Lanao del Sur Maguindanao 61 54 41 24 15 Sulu Tawi-tawi
Table 73. NATIVE TOBACCO: VOLUME OF PRODUCTION IN METRIC TON …Continued
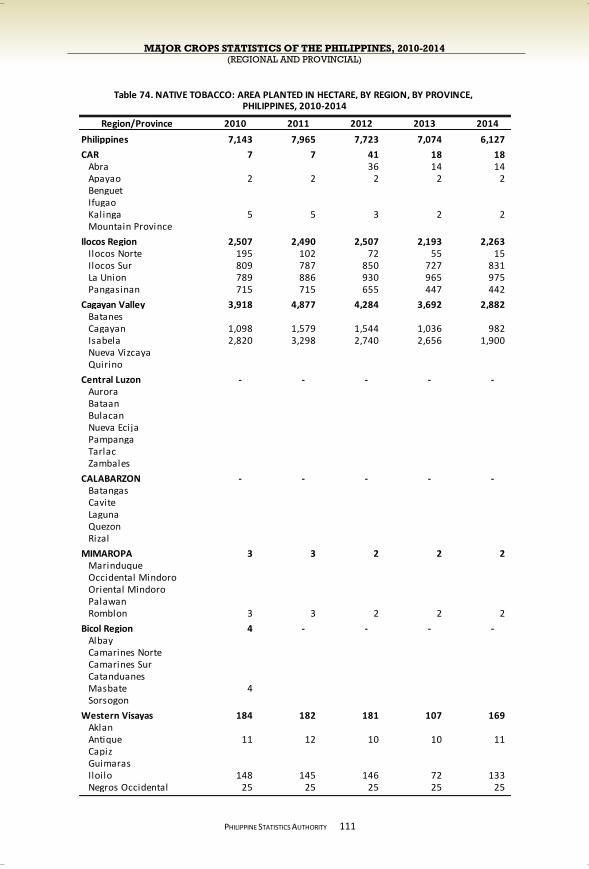
MAJOR CROPS STATISTICS OF THE PHILIPPINES, 2010-2014 (REGIONAL AND PROVINCIAL)
PHILIPPINE STATISTICS AUTHORITY
111
Region/Province 2010 2011 2012 2013 2014
Philippines 7,143 7,965 7,723 7,074 6,127
CAR 7 7 41 18 18 Abra 36 14 14 Apayao 2 2 2 2 2 Benguet Ifugao Kalinga 5 5 3 2 2 Mountain Province
Ilocos Region 2,507 2,490 2,507 2,193 2,263 Ilocos Norte 195 102 72 55 15 Ilocos Sur 809 787 850 727 831 La Union 789 886 930 965 975 Pangasinan 715 715 655 447 442
Cagayan Valley 3,918 4,877 4,284 3,692 2,882 Batanes Cagayan 1,098 1,579 1,544 1,036 982 Isabela 2,820 3,298 2,740 2,656 1,900 Nueva Vizcaya Quirino
Central Luzon - - - - - Aurora Bataan Bulacan Nueva Ecija Pampanga Tarlac Zambales
CALABARZON - - - - - Batangas Cavite Laguna Quezon Rizal
MIMAROPA 3 3 2 2 2 Marinduque Occidental Mindoro Oriental Mindoro Palawan Romblon 3 3 2 2 2
Bicol Region 4 - - - - Albay Camarines Norte Camarines Sur Catanduanes Masbate 4 Sorsogon
Western Visayas 184 182 181 107 169 Aklan Antique 11 12 10 10 11 Capiz Guimaras Iloilo 148 145 146 72 133 Negros Occidental 25 25 25 25 25
PHILIPPINES, 2010-2014Table 74. NATIVE TOBACCO: AREA PLANTED IN HECTARE, BY REGION, BY PROVINCE,
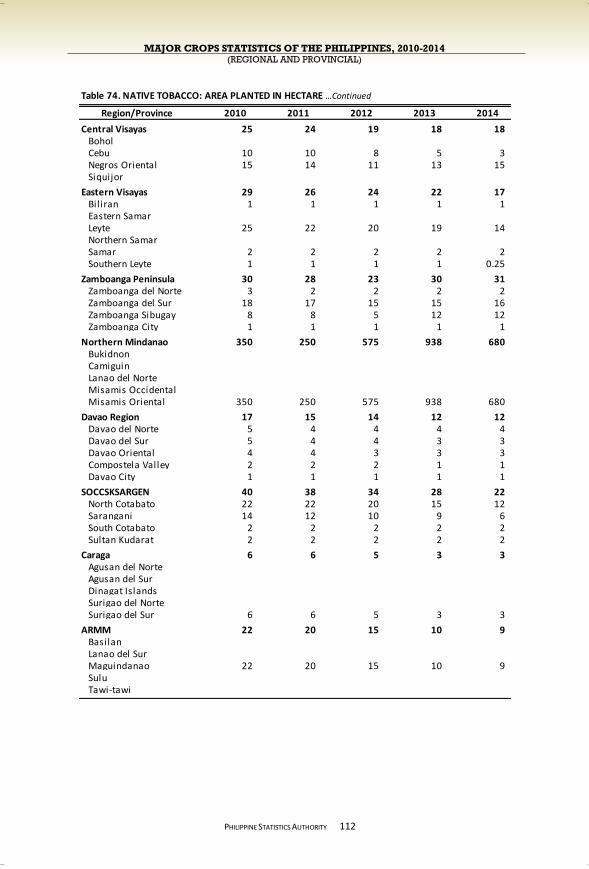
MAJOR CROPS STATISTICS OF THE PHILIPPINES, 2010-2014 (REGIONAL AND PROVINCIAL)
PHILIPPINE STATISTICS AUTHORITY
112
Region/Province 2010 2011 2012 2013 2014
Central Visayas 25 24 19 18 18 Bohol Cebu 10 10 8 5 3 Negros Oriental 15 14 11 13 15 Siquijor
Eastern Visayas 29 26 24 22 17 Bil iran 1 1 1 1 1 Eastern Samar Leyte 25 22 20 19 14 Northern Samar Samar 2 2 2 2 2 Southern Leyte 1 1 1 1 0.25
Zamboanga Peninsula 30 28 23 30 31 Zamboanga del Norte 3 2 2 2 2 Zamboanga del Sur 18 17 15 15 16 Zamboanga Sibugay 8 8 5 12 12 Zamboanga City 1 1 1 1 1
Northern Mindanao 350 250 575 938 680 Bukidnon Camiguin Lanao del Norte Misamis Occidental Misamis Oriental 350 250 575 938 680
Davao Region 17 15 14 12 12 Davao del Norte 5 4 4 4 4 Davao del Sur 5 4 4 3 3 Davao Oriental 4 4 3 3 3 Compostela Valley 2 2 2 1 1 Davao City 1 1 1 1 1
SOCCSKSARGEN 40 38 34 28 22 North Cotabato 22 22 20 15 12 Sarangani 14 12 10 9 6 South Cotabato 2 2 2 2 2 Sultan Kudarat 2 2 2 2 2
Caraga 6 6 5 3 3 Agusan del Norte Agusan del Sur Dinagat Islands Surigao del Norte Surigao del Sur 6 6 5 3 3
ARMM 22 20 15 10 9 Basilan Lanao del Sur Maguindanao 22 20 15 10 9 Sulu Tawi-tawi
Table 74. NATIVE TOBACCO: AREA PLANTED IN HECTARE …Continued
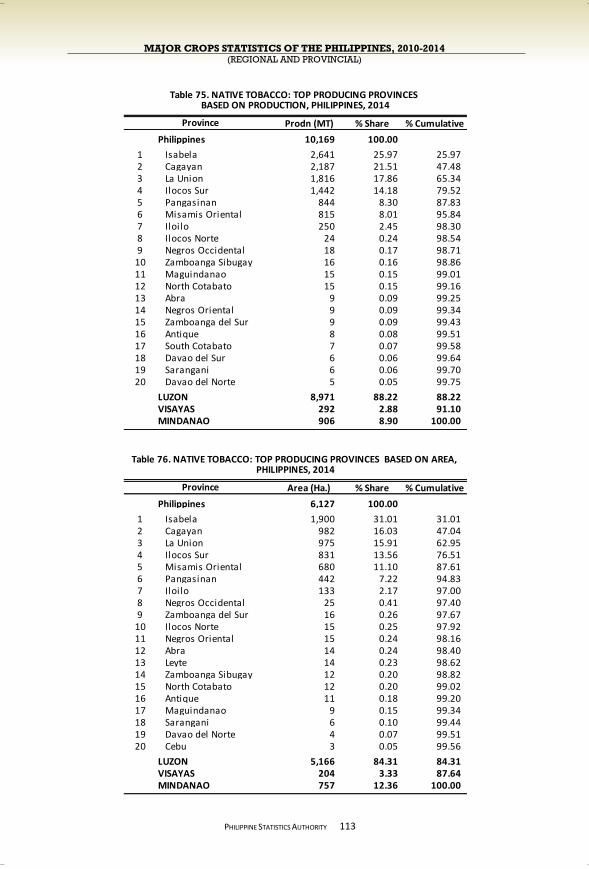
MAJOR CROPS STATISTICS OF THE PHILIPPINES, 2010-2014 (REGIONAL AND PROVINCIAL)
PHILIPPINE STATISTICS AUTHORITY
113
Prodn (MT) % Share % Cumulative
Philippines 10,169 100.00
1 Isabela 2,641 25.97 25.97 2 Cagayan 2,187 21.51 47.48 3 La Union 1,816 17.86 65.34 4 Ilocos Sur 1,442 14.18 79.52 5 Pangasinan 844 8.30 87.83 6 Misamis Oriental 815 8.01 95.84 7 Iloilo 250 2.45 98.30 8 Ilocos Norte 24 0.24 98.54 9 Negros Occidental 18 0.17 98.71
10 Zamboanga Sibugay 16 0.16 98.86 11 Maguindanao 15 0.15 99.01 12 North Cotabato 15 0.15 99.16 13 Abra 9 0.09 99.25 14 Negros Oriental 9 0.09 99.34 15 Zamboanga del Sur 9 0.09 99.43 16 Antique 8 0.08 99.51 17 South Cotabato 7 0.07 99.58 18 Davao del Sur 6 0.06 99.64 19 Sarangani 6 0.06 99.70 20 Davao del Norte 5 0.05 99.75
LUZON 8,971 88.22 88.22 VISAYAS 292 2.88 91.10 MINDANAO 906 8.90 100.00
Area (Ha.) % Share % Cumulative
Philippines 6,127 100.00
1 Isabela 1,900 31.01 31.01 2 Cagayan 982 16.03 47.04 3 La Union 975 15.91 62.95 4 Ilocos Sur 831 13.56 76.51 5 Misamis Oriental 680 11.10 87.61 6 Pangasinan 442 7.22 94.83 7 Iloilo 133 2.17 97.00 8 Negros Occidental 25 0.41 97.40 9 Zamboanga del Sur 16 0.26 97.67
10 Ilocos Norte 15 0.25 97.92 11 Negros Oriental 15 0.24 98.16 12 Abra 14 0.24 98.40 13 Leyte 14 0.23 98.62 14 Zamboanga Sibugay 12 0.20 98.82 15 North Cotabato 12 0.20 99.02 16 Antique 11 0.18 99.20 17 Maguindanao 9 0.15 99.34 18 Sarangani 6 0.10 99.44 19 Davao del Norte 4 0.07 99.51 20 Cebu 3 0.05 99.56
LUZON 5,166 84.31 84.31 VISAYAS 204 3.33 87.64 MINDANAO 757 12.36 100.00
Table 75. NATIVE TOBACCO: TOP PRODUCING PROVINCES BASED ON PRODUCTION, PHILIPPINES, 2014
Province
Table 76. NATIVE TOBACCO: TOP PRODUCING PROVINCES BASED ON AREA, PHILIPPINES, 2014
Province

MAJOR CROPS STATISTICS OF THE PHILIPPINES, 2010-2014 (REGIONAL AND PROVINCIAL)
PHILIPPINE STATISTICS AUTHORITY
114
Region/Province 2010 2011 2012 2013 2014
Philippines 18,839 21,447 23,644 28,245 31,321
CAR 935 920 930 944 1,226 Abra 935 920 930 944 1,226 Apayao Benguet Ifugao Kalinga Mountain Province
Ilocos Region 17,903 20,526 22,694 27,267 29,889 Ilocos Norte 2,120 3,134 3,496 3,785 4,909 Ilocos Sur 12,209 14,226 16,058 20,269 21,735 La Union 3,573 3,166 3,140 3,213 3,245 Pangasinan
Cagayan Valley - - 19 17 16 Batanes Cagayan Isabela 19 17 16 Nueva Vizcaya Quirino
Central Luzon - - - - - Aurora Bataan Bulacan Nueva Ecija Pampanga Tarlac Zambales
CALABARZON - - - - - Batangas Cavite Laguna Quezon Rizal
MIMAROPA - - - - - Marinduque Occidental Mindoro Oriental Mindoro Palawan Romblon
Bicol Region - - - - - Albay Camarines Norte Camarines Sur Catanduanes Masbate Sorsogon
Western Visayas - - - - - Aklan Antique Capiz Guimaras Iloilo Negros Occidental
BY PROVINCE, PHILIPPINES, 2010-2014Table 77. VIRGINIA TOBACCO: VOLUME OF PRODUCTION IN METRIC TON, BY REGION,
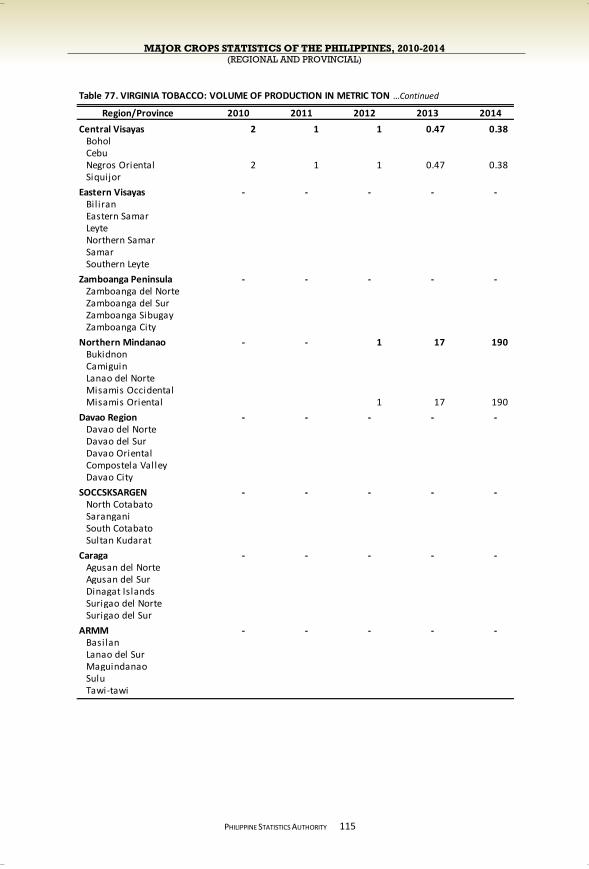
MAJOR CROPS STATISTICS OF THE PHILIPPINES, 2010-2014 (REGIONAL AND PROVINCIAL)
PHILIPPINE STATISTICS AUTHORITY
115
Region/Province 2010 2011 2012 2013 2014
Central Visayas 2 1 1 0.47 0.38 Bohol Cebu Negros Oriental 2 1 1 0.47 0.38 Siquijor
Eastern Visayas - - - - - Bil iran Eastern Samar Leyte Northern Samar Samar Southern Leyte
Zamboanga Peninsula - - - - - Zamboanga del Norte Zamboanga del Sur Zamboanga Sibugay Zamboanga City
Northern Mindanao - - 1 17 190 Bukidnon Camiguin Lanao del Norte Misamis Occidental Misamis Oriental 1 17 190
Davao Region - - - - - Davao del Norte Davao del Sur Davao Oriental Compostela Valley Davao City
SOCCSKSARGEN - - - - - North Cotabato Sarangani South Cotabato Sultan Kudarat
Caraga - - - - - Agusan del Norte Agusan del Sur Dinagat Islands Surigao del Norte Surigao del Sur
ARMM - - - - - Basilan Lanao del Sur Maguindanao Sulu Tawi-tawi
Table 77. VIRGINIA TOBACCO: VOLUME OF PRODUCTION IN METRIC TON …Continued
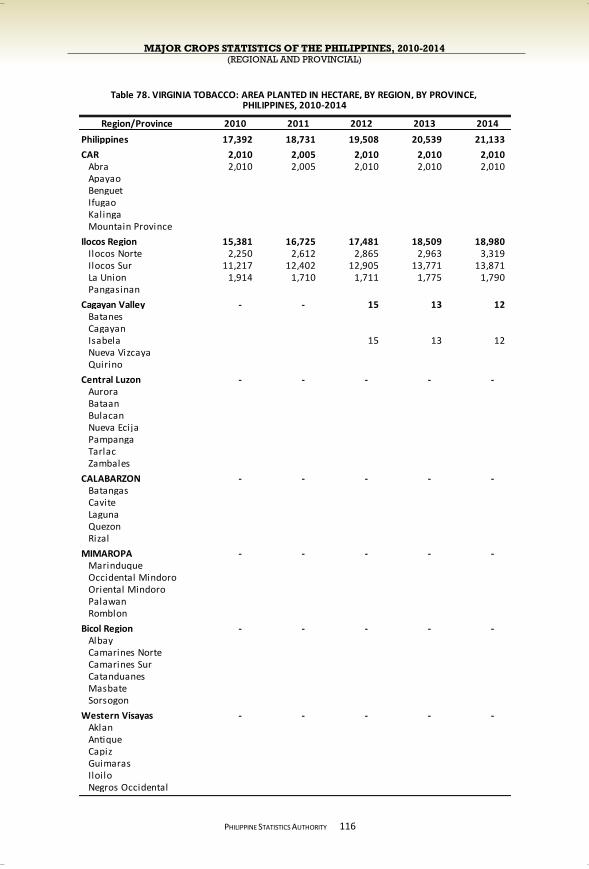
MAJOR CROPS STATISTICS OF THE PHILIPPINES, 2010-2014 (REGIONAL AND PROVINCIAL)
PHILIPPINE STATISTICS AUTHORITY
116
Region/Province 2010 2011 2012 2013 2014
Philippines 17,392 18,731 19,508 20,539 21,133
CAR 2,010 2,005 2,010 2,010 2,010 Abra 2,010 2,005 2,010 2,010 2,010 Apayao Benguet Ifugao Kalinga Mountain Province
Ilocos Region 15,381 16,725 17,481 18,509 18,980 Ilocos Norte 2,250 2,612 2,865 2,963 3,319 Ilocos Sur 11,217 12,402 12,905 13,771 13,871 La Union 1,914 1,710 1,711 1,775 1,790 Pangasinan
Cagayan Valley - - 15 13 12 Batanes Cagayan Isabela 15 13 12 Nueva Vizcaya Quirino
Central Luzon - - - - - Aurora Bataan Bulacan Nueva Ecija Pampanga Tarlac Zambales
CALABARZON - - - - - Batangas Cavite Laguna Quezon Rizal
MIMAROPA - - - - - Marinduque Occidental Mindoro Oriental Mindoro Palawan Romblon
Bicol Region - - - - - Albay Camarines Norte Camarines Sur Catanduanes Masbate Sorsogon
Western Visayas - - - - - Aklan Antique Capiz Guimaras Iloilo Negros Occidental
PHILIPPINES, 2010-2014Table 78. VIRGINIA TOBACCO: AREA PLANTED IN HECTARE, BY REGION, BY PROVINCE,
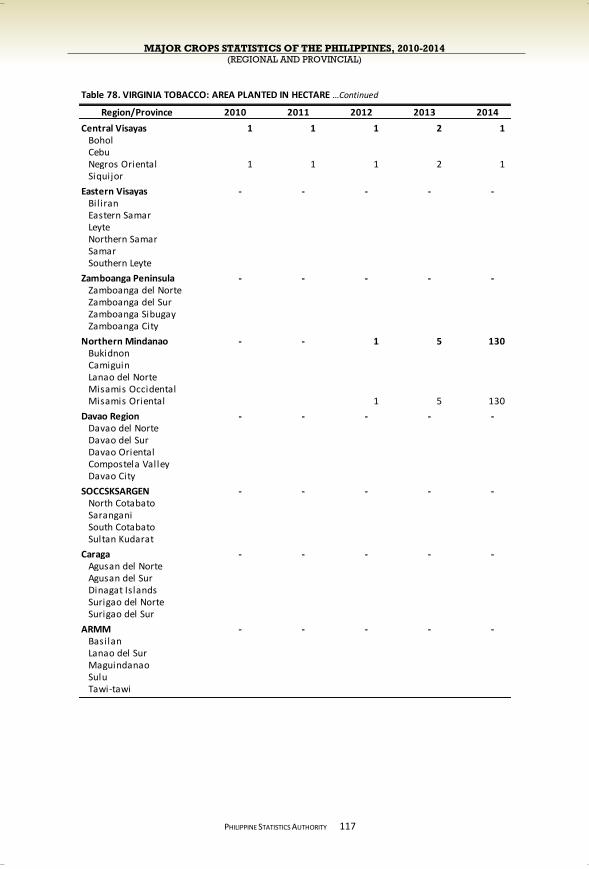
MAJOR CROPS STATISTICS OF THE PHILIPPINES, 2010-2014 (REGIONAL AND PROVINCIAL)
PHILIPPINE STATISTICS AUTHORITY
117
Region/Province 2010 2011 2012 2013 2014
Central Visayas 1 1 1 2 1 Bohol Cebu Negros Oriental 1 1 1 2 1 Siquijor
Eastern Visayas - - - - - Bil iran Eastern Samar Leyte Northern Samar Samar Southern Leyte
Zamboanga Peninsula - - - - - Zamboanga del Norte Zamboanga del Sur Zamboanga Sibugay Zamboanga City
Northern Mindanao - - 1 5 130 Bukidnon Camiguin Lanao del Norte Misamis Occidental Misamis Oriental 1 5 130
Davao Region - - - - - Davao del Norte Davao del Sur Davao Oriental Compostela Valley Davao City
SOCCSKSARGEN - - - - - North Cotabato Sarangani South Cotabato Sultan Kudarat
Caraga - - - - - Agusan del Norte Agusan del Sur Dinagat Islands Surigao del Norte Surigao del Sur
ARMM - - - - - Basilan Lanao del Sur Maguindanao Sulu Tawi-tawi
Table 78. VIRGINIA TOBACCO: AREA PLANTED IN HECTARE …Continued
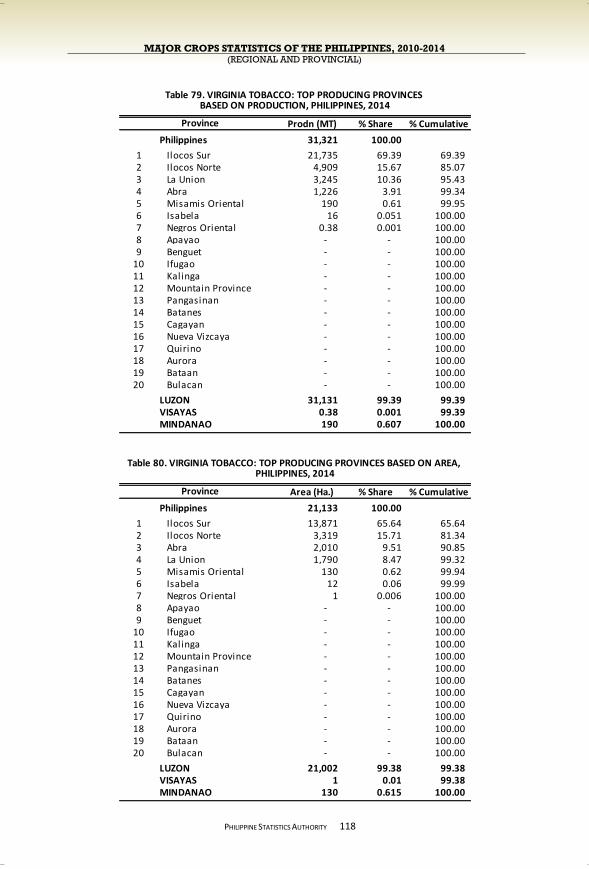
MAJOR CROPS STATISTICS OF THE PHILIPPINES, 2010-2014 (REGIONAL AND PROVINCIAL)
PHILIPPINE STATISTICS AUTHORITY
118
Prodn (MT) % Share % Cumulative
Philippines 31,321 100.00
1 Ilocos Sur 21,735 69.39 69.39 2 Ilocos Norte 4,909 15.67 85.07 3 La Union 3,245 10.36 95.43 4 Abra 1,226 3.91 99.34 5 Misamis Oriental 190 0.61 99.95 6 Isabela 16 0.051 100.00 7 Negros Oriental 0.38 0.001 100.00 8 Apayao - - 100.00 9 Benguet - - 100.00
10 Ifugao - - 100.00 11 Kalinga - - 100.00 12 Mountain Province - - 100.00 13 Pangasinan - - 100.00 14 Batanes - - 100.00 15 Cagayan - - 100.00 16 Nueva Vizcaya - - 100.00 17 Quirino - - 100.00 18 Aurora - - 100.00 19 Bataan - - 100.00 20 Bulacan - - 100.00
LUZON 31,131 99.39 99.39 VISAYAS 0.38 0.001 99.39 MINDANAO 190 0.607 100.00
Area (Ha.) % Share % Cumulative
Philippines 21,133 100.00
1 Ilocos Sur 13,871 65.64 65.64 2 Ilocos Norte 3,319 15.71 81.34 3 Abra 2,010 9.51 90.85 4 La Union 1,790 8.47 99.32 5 Misamis Oriental 130 0.62 99.94 6 Isabela 12 0.06 99.99 7 Negros Oriental 1 0.006 100.00 8 Apayao - - 100.00 9 Benguet - - 100.00
10 Ifugao - - 100.00 11 Kalinga - - 100.00 12 Mountain Province - - 100.00 13 Pangasinan - - 100.00 14 Batanes - - 100.00 15 Cagayan - - 100.00 16 Nueva Vizcaya - - 100.00 17 Quirino - - 100.00 18 Aurora - - 100.00 19 Bataan - - 100.00 20 Bulacan - - 100.00
LUZON 21,002 99.38 99.38 VISAYAS 1 0.01 99.38 MINDANAO 130 0.615 100.00
Table 79. VIRGINIA TOBACCO: TOP PRODUCING PROVINCES BASED ON PRODUCTION, PHILIPPINES, 2014
Province
Table 80. VIRGINIA TOBACCO: TOP PRODUCING PROVINCES BASED ON AREA, PHILIPPINES, 2014
Province
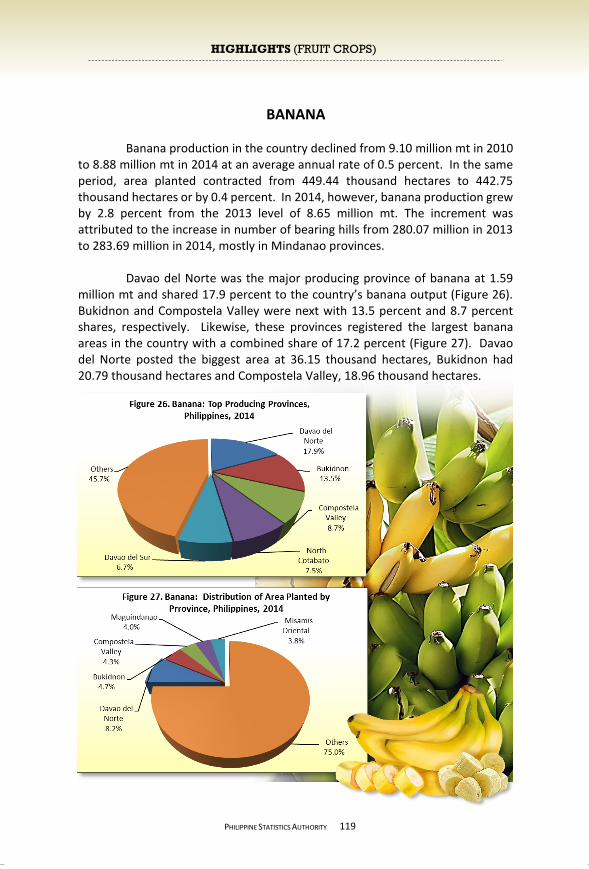
MAJOR CROPS STATISTICS OF THE PHILIPPINES, 2010-2014 (REGIONAL AND PROVINCIAL)
PHILIPPINE STATISTICS AUTHORITY
BANANA Banana production in the country declined from 9.10 million mt in 2010
to 8.88 million mt in 2014 at an average annual rate of 0.5 percent. In the same period, area planted contracted from 449.44 thousand hectares to 442.75 thousand hectares or by 0.4 percent. In 2014, however, banana production grew by 2.8 percent from the 2013 level of 8.65 million mt. The increment was attributed to the increase in number of bearing hills from 280.07 million in 2013 to 283.69 million in 2014, mostly in Mindanao provinces.
Davao del Norte was the major producing province of banana at 1.59
million mt and shared 17.9 percent to the country’s banana output (Figure 26). Bukidnon and Compostela Valley were next with 13.5 percent and 8.7 percent shares, respectively. Likewise, these provinces registered the largest banana areas in the country with a combined share of 17.2 percent (Figure 27). Davao del Norte posted the biggest area at 36.15 thousand hectares, Bukidnon had 20.79 thousand hectares and Compostela Valley, 18.96 thousand hectares.
119
HIGHLIGHTS (FRUIT CROPS)
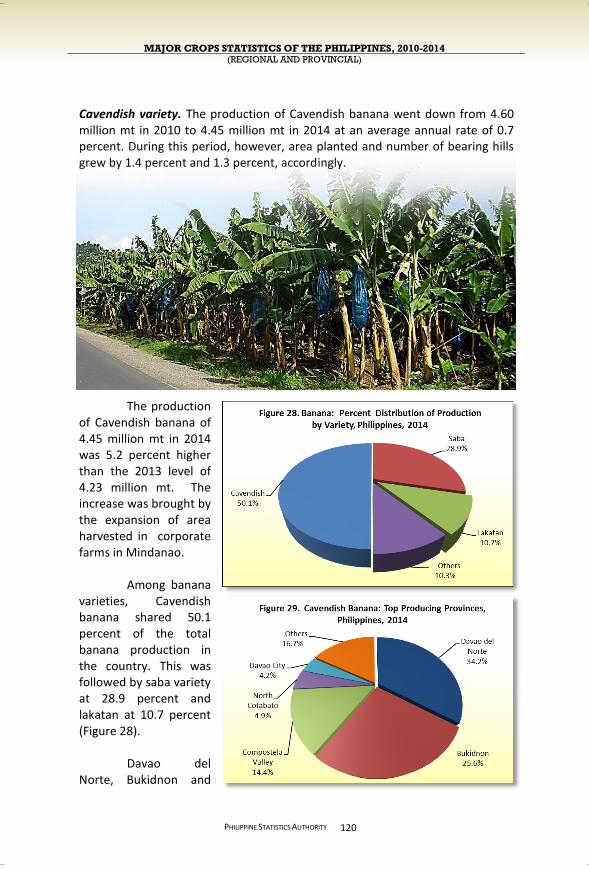
MAJOR CROPS STATISTICS OF THE PHILIPPINES, 2010-2014 (REGIONAL AND PROVINCIAL)
PHILIPPINE STATISTICS AUTHORITY
Cavendish variety. The production of Cavendish banana went down from 4.60 million mt in 2010 to 4.45 million mt in 2014 at an average annual rate of 0.7 percent. During this period, however, area planted and number of bearing hills grew by 1.4 percent and 1.3 percent, accordingly.
The production
of Cavendish banana of 4.45 million mt in 2014 was 5.2 percent higher than the 2013 level of 4.23 million mt. The increase was brought by the expansion of area harvested in corporate farms in Mindanao.
Among banana
varieties, Cavendish banana shared 50.1 percent of the total banana production in the country. This was followed by saba variety at 28.9 percent and lakatan at 10.7 percent (Figure 28).
Davao del Norte, Bukidnon and Compostela Valley were
120
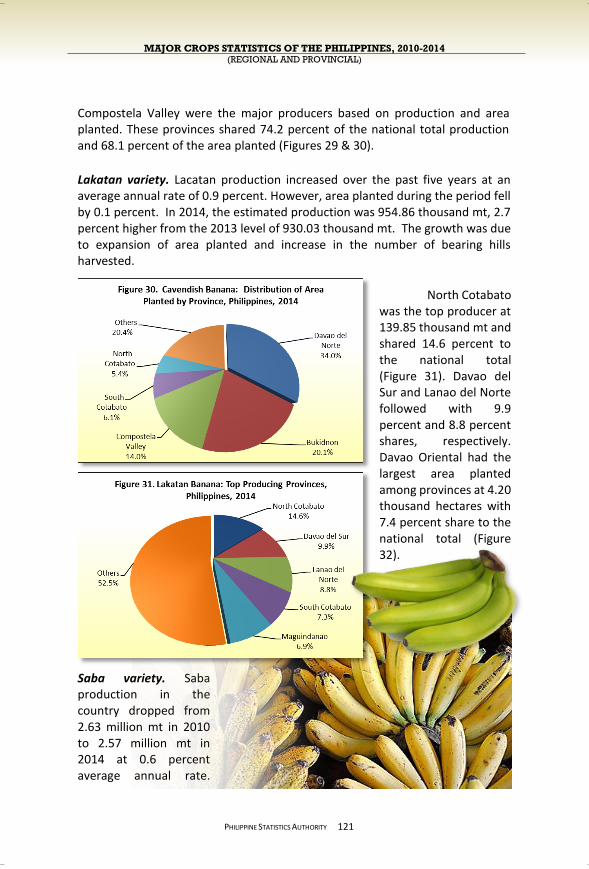
MAJOR CROPS STATISTICS OF THE PHILIPPINES, 2010-2014 (REGIONAL AND PROVINCIAL)
PHILIPPINE STATISTICS AUTHORITY
Compostela Valley were the major producers based on production and area planted. These provinces shared 74.2 percent of the national total production and 68.1 percent of the area planted (Figures 29 & 30).
Lakatan variety. Lacatan production increased over the past five years at an average annual rate of 0.9 percent. However, area planted during the period fell by 0.1 percent. In 2014, the estimated production was 954.86 thousand mt, 2.7 percent higher from the 2013 level of 930.03 thousand mt. The growth was due to expansion of area planted and increase in the number of bearing hills harvested.
North Cotabato
was the top producer at 139.85 thousand mt and shared 14.6 percent to the national total (Figure 31). Davao del Sur and Lanao del Norte followed with 9.9 percent and 8.8 percent shares, respectively. Davao Oriental had the largest area planted among provinces at 4.20 thousand hectares with 7.4 percent share to the national total (Figure 32).
Saba variety. Saba production in the country dropped from 2.63 million mt in 2010 to 2.57 million mt in 2014 at 0.6 percent average annual rate. However, production in
121
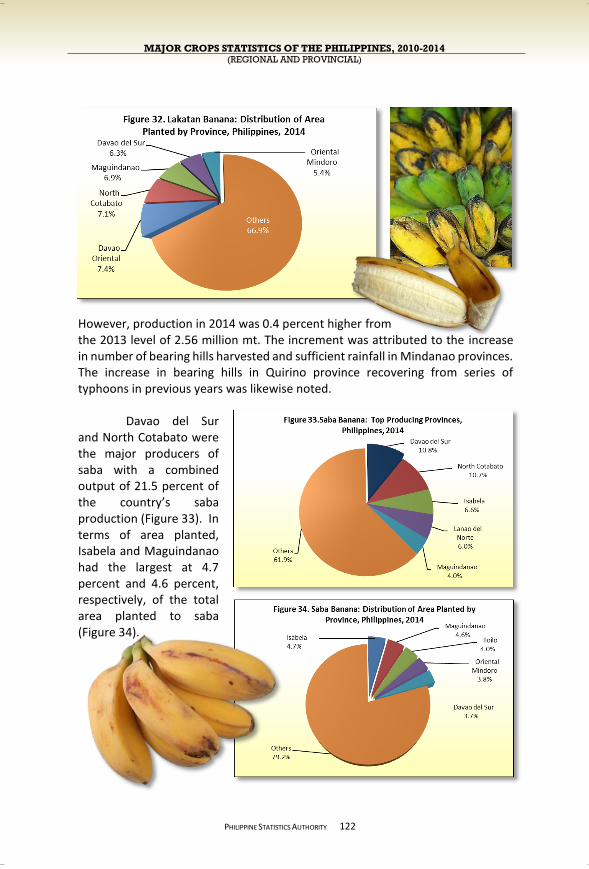
MAJOR CROPS STATISTICS OF THE PHILIPPINES, 2010-2014 (REGIONAL AND PROVINCIAL)
PHILIPPINE STATISTICS AUTHORITY
However, production in 2014 was 0.4 percent higher from the 2013 level of 2.56 million mt. The increment was attributed to the increase in number of bearing hills harvested and sufficient rainfall in Mindanao provinces. The increase in bearing hills in Quirino province recovering from series of typhoons in previous years was likewise noted.
Davao del Sur and North Cotabato were the major producers of saba with a combined output of 21.5 percent of the country’s saba production (Figure 33). In terms of area planted, Isabela and Maguindanao had the largest at 4.7 percent and 4.6 percent, respectively, of the total area planted to saba (Figure 34).
122
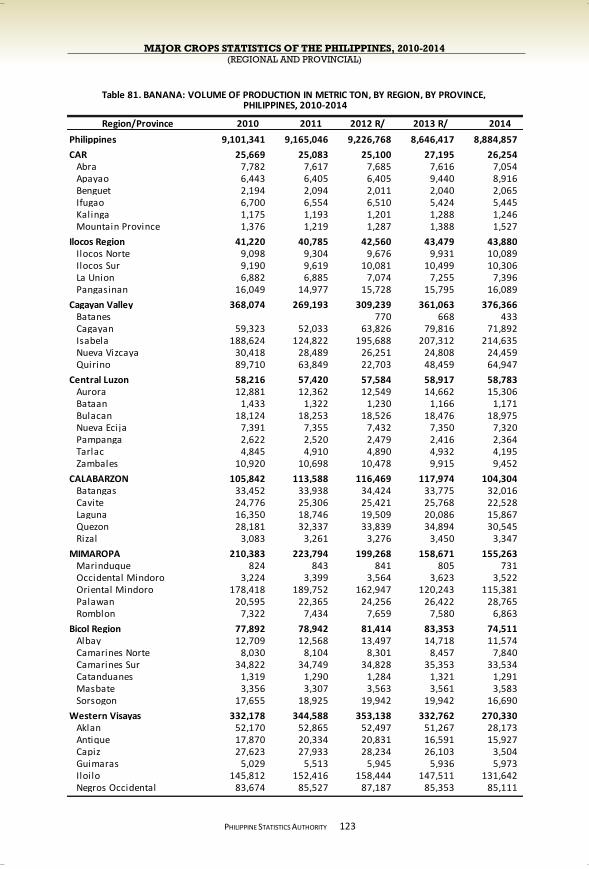
MAJOR CROPS STATISTICS OF THE PHILIPPINES, 2010-2014 (REGIONAL AND PROVINCIAL)
PHILIPPINE STATISTICS AUTHORITY
123
Region/Province 2010 2011 2012 R/ 2013 R/ 2014
Philippines 9,101,341 9,165,046 9,226,768 8,646,417 8,884,857
CAR 25,669 25,083 25,100 27,195 26,254 Abra 7,782 7,617 7,685 7,616 7,054 Apayao 6,443 6,405 6,405 9,440 8,916 Benguet 2,194 2,094 2,011 2,040 2,065 Ifugao 6,700 6,554 6,510 5,424 5,445 Kalinga 1,175 1,193 1,201 1,288 1,246 Mountain Province 1,376 1,219 1,287 1,388 1,527
Ilocos Region 41,220 40,785 42,560 43,479 43,880 Ilocos Norte 9,098 9,304 9,676 9,931 10,089 Ilocos Sur 9,190 9,619 10,081 10,499 10,306 La Union 6,882 6,885 7,074 7,255 7,396 Pangasinan 16,049 14,977 15,728 15,795 16,089
Cagayan Valley 368,074 269,193 309,239 361,063 376,366 Batanes 770 668 433 Cagayan 59,323 52,033 63,826 79,816 71,892 Isabela 188,624 124,822 195,688 207,312 214,635 Nueva Vizcaya 30,418 28,489 26,251 24,808 24,459 Quirino 89,710 63,849 22,703 48,459 64,947
Central Luzon 58,216 57,420 57,584 58,917 58,783 Aurora 12,881 12,362 12,549 14,662 15,306 Bataan 1,433 1,322 1,230 1,166 1,171 Bulacan 18,124 18,253 18,526 18,476 18,975 Nueva Ecija 7,391 7,355 7,432 7,350 7,320 Pampanga 2,622 2,520 2,479 2,416 2,364 Tarlac 4,845 4,910 4,890 4,932 4,195 Zambales 10,920 10,698 10,478 9,915 9,452
CALABARZON 105,842 113,588 116,469 117,974 104,304 Batangas 33,452 33,938 34,424 33,775 32,016 Cavite 24,776 25,306 25,421 25,768 22,528 Laguna 16,350 18,746 19,509 20,086 15,867 Quezon 28,181 32,337 33,839 34,894 30,545 Rizal 3,083 3,261 3,276 3,450 3,347
MIMAROPA 210,383 223,794 199,268 158,671 155,263 Marinduque 824 843 841 805 731 Occidental Mindoro 3,224 3,399 3,564 3,623 3,522 Oriental Mindoro 178,418 189,752 162,947 120,243 115,381 Palawan 20,595 22,365 24,256 26,422 28,765 Romblon 7,322 7,434 7,659 7,580 6,863
Bicol Region 77,892 78,942 81,414 83,353 74,511 Albay 12,709 12,568 13,497 14,718 11,574 Camarines Norte 8,030 8,104 8,301 8,457 7,840 Camarines Sur 34,822 34,749 34,828 35,353 33,534 Catanduanes 1,319 1,290 1,284 1,321 1,291 Masbate 3,356 3,307 3,563 3,561 3,583 Sorsogon 17,655 18,925 19,942 19,942 16,690
Western Visayas 332,178 344,588 353,138 332,762 270,330 Aklan 52,170 52,865 52,497 51,267 28,173 Antique 17,870 20,334 20,831 16,591 15,927 Capiz 27,623 27,933 28,234 26,103 3,504 Guimaras 5,029 5,513 5,945 5,936 5,973 Iloilo 145,812 152,416 158,444 147,511 131,642 Negros Occidental 83,674 85,527 87,187 85,353 85,111
PHILIPPINES, 2010-2014Table 81. BANANA: VOLUME OF PRODUCTION IN METRIC TON, BY REGION, BY PROVINCE,
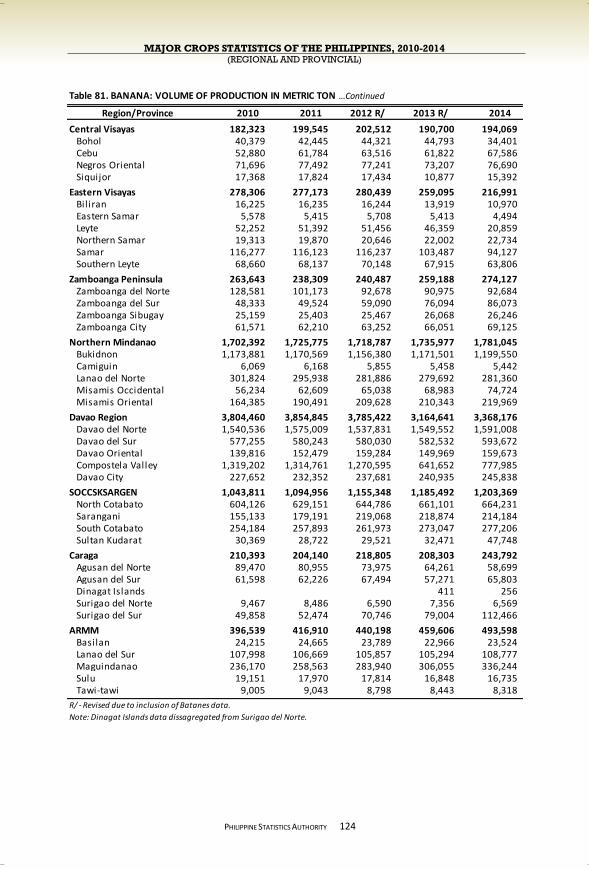
MAJOR CROPS STATISTICS OF THE PHILIPPINES, 2010-2014 (REGIONAL AND PROVINCIAL)
PHILIPPINE STATISTICS AUTHORITY
124
Region/Province 2010 2011 2012 R/ 2013 R/ 2014
Central Visayas 182,323 199,545 202,512 190,700 194,069 Bohol 40,379 42,445 44,321 44,793 34,401 Cebu 52,880 61,784 63,516 61,822 67,586 Negros Oriental 71,696 77,492 77,241 73,207 76,690 Siquijor 17,368 17,824 17,434 10,877 15,392
Eastern Visayas 278,306 277,173 280,439 259,095 216,991 Bil iran 16,225 16,235 16,244 13,919 10,970 Eastern Samar 5,578 5,415 5,708 5,413 4,494 Leyte 52,252 51,392 51,456 46,359 20,859 Northern Samar 19,313 19,870 20,646 22,002 22,734 Samar 116,277 116,123 116,237 103,487 94,127 Southern Leyte 68,660 68,137 70,148 67,915 63,806
Zamboanga Peninsula 263,643 238,309 240,487 259,188 274,127 Zamboanga del Norte 128,581 101,173 92,678 90,975 92,684 Zamboanga del Sur 48,333 49,524 59,090 76,094 86,073 Zamboanga Sibugay 25,159 25,403 25,467 26,068 26,246 Zamboanga City 61,571 62,210 63,252 66,051 69,125
Northern Mindanao 1,702,392 1,725,775 1,718,787 1,735,977 1,781,045 Bukidnon 1,173,881 1,170,569 1,156,380 1,171,501 1,199,550 Camiguin 6,069 6,168 5,855 5,458 5,442 Lanao del Norte 301,824 295,938 281,886 279,692 281,360 Misamis Occidental 56,234 62,609 65,038 68,983 74,724 Misamis Oriental 164,385 190,491 209,628 210,343 219,969
Davao Region 3,804,460 3,854,845 3,785,422 3,164,641 3,368,176 Davao del Norte 1,540,536 1,575,009 1,537,831 1,549,552 1,591,008 Davao del Sur 577,255 580,243 580,030 582,532 593,672 Davao Oriental 139,816 152,479 159,284 149,969 159,673 Compostela Valley 1,319,202 1,314,761 1,270,595 641,652 777,985 Davao City 227,652 232,352 237,681 240,935 245,838
SOCCSKSARGEN 1,043,811 1,094,956 1,155,348 1,185,492 1,203,369 North Cotabato 604,126 629,151 644,786 661,101 664,231 Sarangani 155,133 179,191 219,068 218,874 214,184 South Cotabato 254,184 257,893 261,973 273,047 277,206 Sultan Kudarat 30,369 28,722 29,521 32,471 47,748
Caraga 210,393 204,140 218,805 208,303 243,792 Agusan del Norte 89,470 80,955 73,975 64,261 58,699 Agusan del Sur 61,598 62,226 67,494 57,271 65,803 Dinagat Islands 411 256 Surigao del Norte 9,467 8,486 6,590 7,356 6,569 Surigao del Sur 49,858 52,474 70,746 79,004 112,466
ARMM 396,539 416,910 440,198 459,606 493,598 Basilan 24,215 24,665 23,789 22,966 23,524 Lanao del Sur 107,998 106,669 105,857 105,294 108,777 Maguindanao 236,170 258,563 283,940 306,055 336,244 Sulu 19,151 17,970 17,814 16,848 16,735 Tawi-tawi 9,005 9,043 8,798 8,443 8,318
R/ - Revised due to inclusion of Batanes data.
Note: Dinagat Islands data dissagregated from Surigao del Norte.
Table 81. BANANA: VOLUME OF PRODUCTION IN METRIC TON …Continued
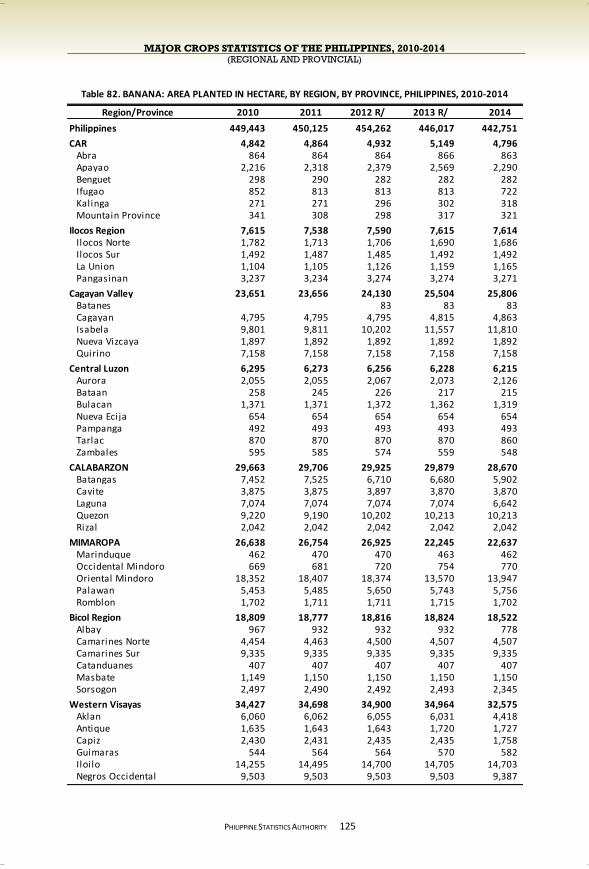
MAJOR CROPS STATISTICS OF THE PHILIPPINES, 2010-2014 (REGIONAL AND PROVINCIAL)
PHILIPPINE STATISTICS AUTHORITY
125
Region/Province 2010 2011 2012 R/ 2013 R/ 2014
Philippines 449,443 450,125 454,262 446,017 442,751
CAR 4,842 4,864 4,932 5,149 4,796 Abra 864 864 864 866 863 Apayao 2,216 2,318 2,379 2,569 2,290 Benguet 298 290 282 282 282 Ifugao 852 813 813 813 722 Kalinga 271 271 296 302 318 Mountain Province 341 308 298 317 321
Ilocos Region 7,615 7,538 7,590 7,615 7,614 Ilocos Norte 1,782 1,713 1,706 1,690 1,686 Ilocos Sur 1,492 1,487 1,485 1,492 1,492 La Union 1,104 1,105 1,126 1,159 1,165 Pangasinan 3,237 3,234 3,274 3,274 3,271
Cagayan Valley 23,651 23,656 24,130 25,504 25,806 Batanes 83 83 83 Cagayan 4,795 4,795 4,795 4,815 4,863 Isabela 9,801 9,811 10,202 11,557 11,810 Nueva Vizcaya 1,897 1,892 1,892 1,892 1,892 Quirino 7,158 7,158 7,158 7,158 7,158
Central Luzon 6,295 6,273 6,256 6,228 6,215 Aurora 2,055 2,055 2,067 2,073 2,126 Bataan 258 245 226 217 215 Bulacan 1,371 1,371 1,372 1,362 1,319 Nueva Ecija 654 654 654 654 654 Pampanga 492 493 493 493 493 Tarlac 870 870 870 870 860 Zambales 595 585 574 559 548
CALABARZON 29,663 29,706 29,925 29,879 28,670 Batangas 7,452 7,525 6,710 6,680 5,902 Cavite 3,875 3,875 3,897 3,870 3,870 Laguna 7,074 7,074 7,074 7,074 6,642 Quezon 9,220 9,190 10,202 10,213 10,213 Rizal 2,042 2,042 2,042 2,042 2,042
MIMAROPA 26,638 26,754 26,925 22,245 22,637 Marinduque 462 470 470 463 462 Occidental Mindoro 669 681 720 754 770 Oriental Mindoro 18,352 18,407 18,374 13,570 13,947 Palawan 5,453 5,485 5,650 5,743 5,756 Romblon 1,702 1,711 1,711 1,715 1,702
Bicol Region 18,809 18,777 18,816 18,824 18,522 Albay 967 932 932 932 778 Camarines Norte 4,454 4,463 4,500 4,507 4,507 Camarines Sur 9,335 9,335 9,335 9,335 9,335 Catanduanes 407 407 407 407 407 Masbate 1,149 1,150 1,150 1,150 1,150 Sorsogon 2,497 2,490 2,492 2,493 2,345
Western Visayas 34,427 34,698 34,900 34,964 32,575 Aklan 6,060 6,062 6,055 6,031 4,418 Antique 1,635 1,643 1,643 1,720 1,727 Capiz 2,430 2,431 2,435 2,435 1,758 Guimaras 544 564 564 570 582 Iloilo 14,255 14,495 14,700 14,705 14,703 Negros Occidental 9,503 9,503 9,503 9,503 9,387
Table 82. BANANA: AREA PLANTED IN HECTARE, BY REGION, BY PROVINCE, PHILIPPINES, 2010-2014
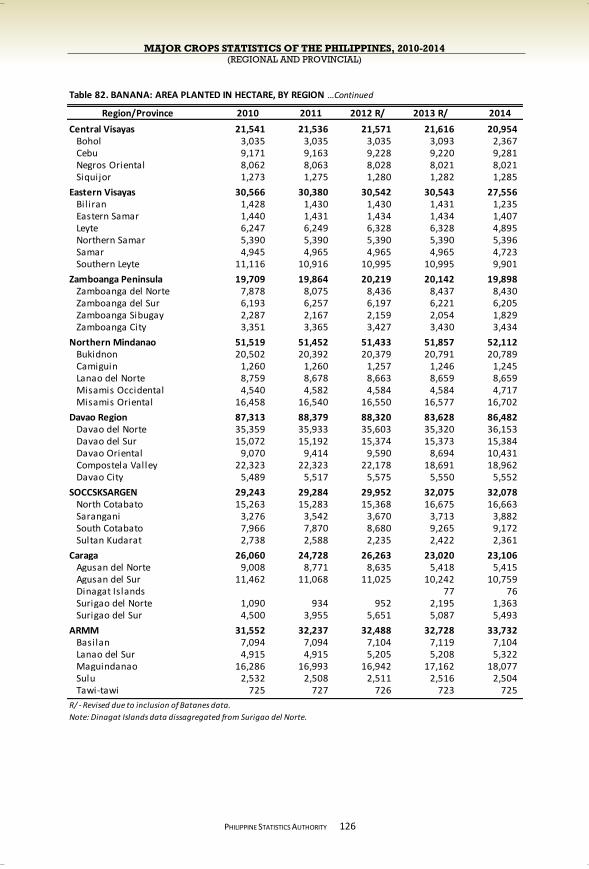
MAJOR CROPS STATISTICS OF THE PHILIPPINES, 2010-2014 (REGIONAL AND PROVINCIAL)
PHILIPPINE STATISTICS AUTHORITY
126
Table 82. BANANA: AREA PLANTED IN HECTARE, BY REGION …Continued
Region/Province 2010 2011 2012 R/ 2013 R/ 2014
Central Visayas 21,541 21,536 21,571 21,616 20,954 Bohol 3,035 3,035 3,035 3,093 2,367 Cebu 9,171 9,163 9,228 9,220 9,281 Negros Oriental 8,062 8,063 8,028 8,021 8,021 Siquijor 1,273 1,275 1,280 1,282 1,285
Eastern Visayas 30,566 30,380 30,542 30,543 27,556 Bil iran 1,428 1,430 1,430 1,431 1,235 Eastern Samar 1,440 1,431 1,434 1,434 1,407 Leyte 6,247 6,249 6,328 6,328 4,895 Northern Samar 5,390 5,390 5,390 5,390 5,396 Samar 4,945 4,965 4,965 4,965 4,723 Southern Leyte 11,116 10,916 10,995 10,995 9,901
Zamboanga Peninsula 19,709 19,864 20,219 20,142 19,898 Zamboanga del Norte 7,878 8,075 8,436 8,437 8,430 Zamboanga del Sur 6,193 6,257 6,197 6,221 6,205 Zamboanga Sibugay 2,287 2,167 2,159 2,054 1,829 Zamboanga City 3,351 3,365 3,427 3,430 3,434
Northern Mindanao 51,519 51,452 51,433 51,857 52,112 Bukidnon 20,502 20,392 20,379 20,791 20,789 Camiguin 1,260 1,260 1,257 1,246 1,245 Lanao del Norte 8,759 8,678 8,663 8,659 8,659 Misamis Occidental 4,540 4,582 4,584 4,584 4,717 Misamis Oriental 16,458 16,540 16,550 16,577 16,702
Davao Region 87,313 88,379 88,320 83,628 86,482 Davao del Norte 35,359 35,933 35,603 35,320 36,153 Davao del Sur 15,072 15,192 15,374 15,373 15,384 Davao Oriental 9,070 9,414 9,590 8,694 10,431 Compostela Valley 22,323 22,323 22,178 18,691 18,962 Davao City 5,489 5,517 5,575 5,550 5,552
SOCCSKSARGEN 29,243 29,284 29,952 32,075 32,078 North Cotabato 15,263 15,283 15,368 16,675 16,663 Sarangani 3,276 3,542 3,670 3,713 3,882 South Cotabato 7,966 7,870 8,680 9,265 9,172 Sultan Kudarat 2,738 2,588 2,235 2,422 2,361
Caraga 26,060 24,728 26,263 23,020 23,106 Agusan del Norte 9,008 8,771 8,635 5,418 5,415 Agusan del Sur 11,462 11,068 11,025 10,242 10,759 Dinagat Islands 77 76 Surigao del Norte 1,090 934 952 2,195 1,363 Surigao del Sur 4,500 3,955 5,651 5,087 5,493
ARMM 31,552 32,237 32,488 32,728 33,732 Basilan 7,094 7,094 7,104 7,119 7,104 Lanao del Sur 4,915 4,915 5,205 5,208 5,322 Maguindanao 16,286 16,993 16,942 17,162 18,077 Sulu 2,532 2,508 2,511 2,516 2,504 Tawi-tawi 725 727 726 723 725
R/ - Revised due to inclusion of Batanes data.
Note: Dinagat Islands data dissagregated from Surigao del Norte.
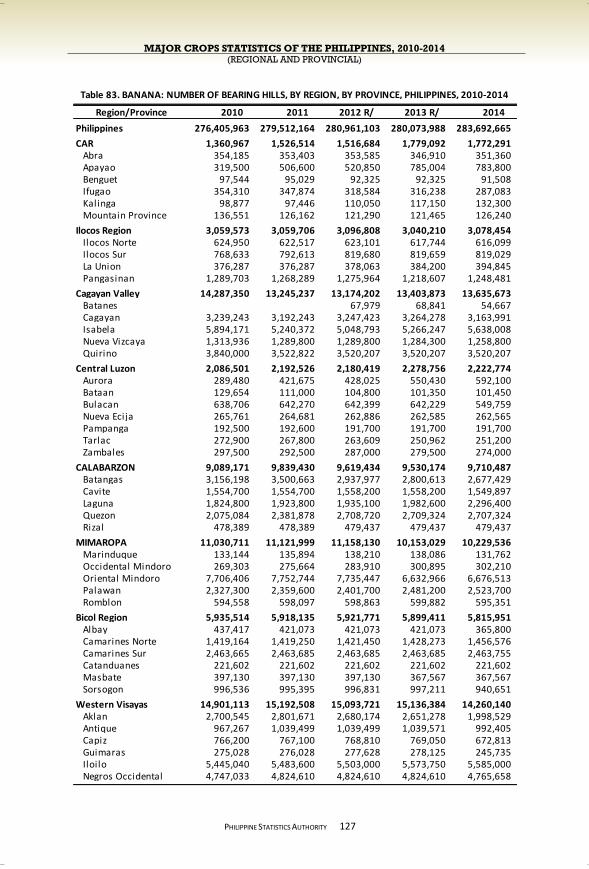
MAJOR CROPS STATISTICS OF THE PHILIPPINES, 2010-2014 (REGIONAL AND PROVINCIAL)
PHILIPPINE STATISTICS AUTHORITY
127
Region/Province 2010 2011 2012 R/ 2013 R/ 2014
Philippines 276,405,963 279,512,164 280,961,103 280,073,988 283,692,665
CAR 1,360,967 1,526,514 1,516,684 1,779,092 1,772,291 Abra 354,185 353,403 353,585 346,910 351,360 Apayao 319,500 506,600 520,850 785,004 783,800 Benguet 97,544 95,029 92,325 92,325 91,508 Ifugao 354,310 347,874 318,584 316,238 287,083 Kalinga 98,877 97,446 110,050 117,150 132,300 Mountain Province 136,551 126,162 121,290 121,465 126,240
Ilocos Region 3,059,573 3,059,706 3,096,808 3,040,210 3,078,454 Ilocos Norte 624,950 622,517 623,101 617,744 616,099 Ilocos Sur 768,633 792,613 819,680 819,659 819,029 La Union 376,287 376,287 378,063 384,200 394,845 Pangasinan 1,289,703 1,268,289 1,275,964 1,218,607 1,248,481
Cagayan Valley 14,287,350 13,245,237 13,174,202 13,403,873 13,635,673 Batanes 67,979 68,841 54,667 Cagayan 3,239,243 3,192,243 3,247,423 3,264,278 3,163,991 Isabela 5,894,171 5,240,372 5,048,793 5,266,247 5,638,008 Nueva Vizcaya 1,313,936 1,289,800 1,289,800 1,284,300 1,258,800 Quirino 3,840,000 3,522,822 3,520,207 3,520,207 3,520,207
Central Luzon 2,086,501 2,192,526 2,180,419 2,278,756 2,222,774 Aurora 289,480 421,675 428,025 550,430 592,100 Bataan 129,654 111,000 104,800 101,350 101,450 Bulacan 638,706 642,270 642,399 642,229 549,759 Nueva Ecija 265,761 264,681 262,886 262,585 262,565 Pampanga 192,500 192,600 191,700 191,700 191,700 Tarlac 272,900 267,800 263,609 250,962 251,200 Zambales 297,500 292,500 287,000 279,500 274,000
CALABARZON 9,089,171 9,839,430 9,619,434 9,530,174 9,710,487 Batangas 3,156,198 3,500,663 2,937,977 2,800,613 2,677,429 Cavite 1,554,700 1,554,700 1,558,200 1,558,200 1,549,897 Laguna 1,824,800 1,923,800 1,935,100 1,982,600 2,296,400 Quezon 2,075,084 2,381,878 2,708,720 2,709,324 2,707,324 Rizal 478,389 478,389 479,437 479,437 479,437
MIMAROPA 11,030,711 11,121,999 11,158,130 10,153,029 10,229,536 Marinduque 133,144 135,894 138,210 138,086 131,762 Occidental Mindoro 269,303 275,664 283,910 300,895 302,210 Oriental Mindoro 7,706,406 7,752,744 7,735,447 6,632,966 6,676,513 Palawan 2,327,300 2,359,600 2,401,700 2,481,200 2,523,700 Romblon 594,558 598,097 598,863 599,882 595,351
Bicol Region 5,935,514 5,918,135 5,921,771 5,899,411 5,815,951 Albay 437,417 421,073 421,073 421,073 365,800 Camarines Norte 1,419,164 1,419,250 1,421,450 1,428,273 1,456,576 Camarines Sur 2,463,665 2,463,685 2,463,685 2,463,685 2,463,755 Catanduanes 221,602 221,602 221,602 221,602 221,602 Masbate 397,130 397,130 397,130 367,567 367,567 Sorsogon 996,536 995,395 996,831 997,211 940,651
Western Visayas 14,901,113 15,192,508 15,093,721 15,136,384 14,260,140 Aklan 2,700,545 2,801,671 2,680,174 2,651,278 1,998,529 Antique 967,267 1,039,499 1,039,499 1,039,571 992,405 Capiz 766,200 767,100 768,810 769,050 672,813 Guimaras 275,028 276,028 277,628 278,125 245,735 Iloilo 5,445,040 5,483,600 5,503,000 5,573,750 5,585,000 Negros Occidental 4,747,033 4,824,610 4,824,610 4,824,610 4,765,658
Table 83. BANANA: NUMBER OF BEARING HILLS, BY REGION, BY PROVINCE, PHILIPPINES, 2010-2014
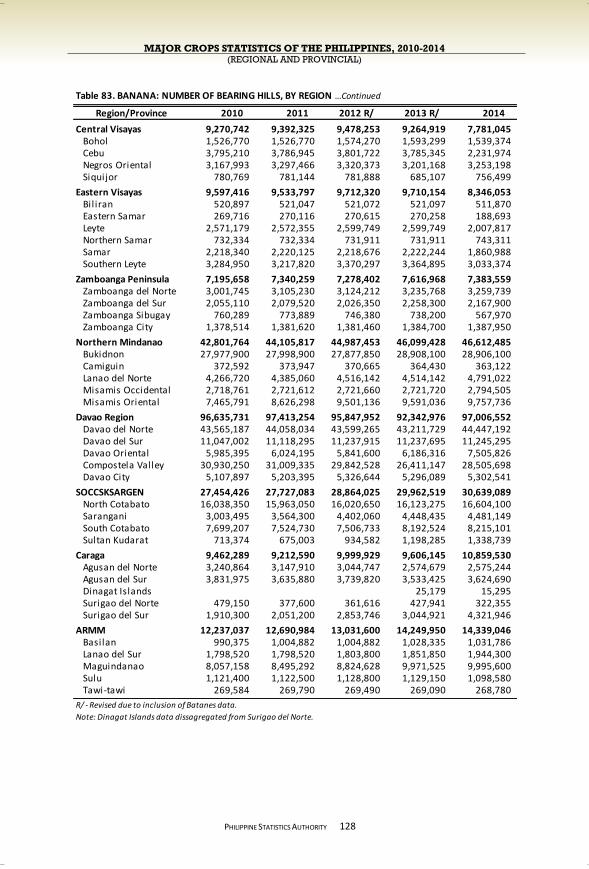
MAJOR CROPS STATISTICS OF THE PHILIPPINES, 2010-2014 (REGIONAL AND PROVINCIAL)
PHILIPPINE STATISTICS AUTHORITY
128
Region/Province 2010 2011 2012 R/ 2013 R/ 2014
Central Visayas 9,270,742 9,392,325 9,478,253 9,264,919 7,781,045 Bohol 1,526,770 1,526,770 1,574,270 1,593,299 1,539,374 Cebu 3,795,210 3,786,945 3,801,722 3,785,345 2,231,974 Negros Oriental 3,167,993 3,297,466 3,320,373 3,201,168 3,253,198 Siquijor 780,769 781,144 781,888 685,107 756,499
Eastern Visayas 9,597,416 9,533,797 9,712,320 9,710,154 8,346,053 Bil iran 520,897 521,047 521,072 521,097 511,870 Eastern Samar 269,716 270,116 270,615 270,258 188,693 Leyte 2,571,179 2,572,355 2,599,749 2,599,749 2,007,817 Northern Samar 732,334 732,334 731,911 731,911 743,311 Samar 2,218,340 2,220,125 2,218,676 2,222,244 1,860,988 Southern Leyte 3,284,950 3,217,820 3,370,297 3,364,895 3,033,374
Zamboanga Peninsula 7,195,658 7,340,259 7,278,402 7,616,968 7,383,559 Zamboanga del Norte 3,001,745 3,105,230 3,124,212 3,235,768 3,259,739 Zamboanga del Sur 2,055,110 2,079,520 2,026,350 2,258,300 2,167,900 Zamboanga Sibugay 760,289 773,889 746,380 738,200 567,970 Zamboanga City 1,378,514 1,381,620 1,381,460 1,384,700 1,387,950
Northern Mindanao 42,801,764 44,105,817 44,987,453 46,099,428 46,612,485 Bukidnon 27,977,900 27,998,900 27,877,850 28,908,100 28,906,100 Camiguin 372,592 373,947 370,665 364,430 363,122 Lanao del Norte 4,266,720 4,385,060 4,516,142 4,514,142 4,791,022 Misamis Occidental 2,718,761 2,721,612 2,721,660 2,721,720 2,794,505 Misamis Oriental 7,465,791 8,626,298 9,501,136 9,591,036 9,757,736
Davao Region 96,635,731 97,413,254 95,847,952 92,342,976 97,006,552 Davao del Norte 43,565,187 44,058,034 43,599,265 43,211,729 44,447,192 Davao del Sur 11,047,002 11,118,295 11,237,915 11,237,695 11,245,295 Davao Oriental 5,985,395 6,024,195 5,841,600 6,186,316 7,505,826 Compostela Valley 30,930,250 31,009,335 29,842,528 26,411,147 28,505,698 Davao City 5,107,897 5,203,395 5,326,644 5,296,089 5,302,541
SOCCSKSARGEN 27,454,426 27,727,083 28,864,025 29,962,519 30,639,089 North Cotabato 16,038,350 15,963,050 16,020,650 16,123,275 16,604,100 Sarangani 3,003,495 3,564,300 4,402,060 4,448,435 4,481,149 South Cotabato 7,699,207 7,524,730 7,506,733 8,192,524 8,215,101 Sultan Kudarat 713,374 675,003 934,582 1,198,285 1,338,739
Caraga 9,462,289 9,212,590 9,999,929 9,606,145 10,859,530 Agusan del Norte 3,240,864 3,147,910 3,044,747 2,574,679 2,575,244 Agusan del Sur 3,831,975 3,635,880 3,739,820 3,533,425 3,624,690 Dinagat Islands 25,179 15,295 Surigao del Norte 479,150 377,600 361,616 427,941 322,355 Surigao del Sur 1,910,300 2,051,200 2,853,746 3,044,921 4,321,946
ARMM 12,237,037 12,690,984 13,031,600 14,249,950 14,339,046 Basilan 990,375 1,004,882 1,004,882 1,028,335 1,031,786 Lanao del Sur 1,798,520 1,798,520 1,803,800 1,851,850 1,944,300 Maguindanao 8,057,158 8,495,292 8,824,628 9,971,525 9,995,600 Sulu 1,121,400 1,122,500 1,128,800 1,129,150 1,098,580 Tawi-tawi 269,584 269,790 269,490 269,090 268,780
R/ - Revised due to inclusion of Batanes data.
Note: Dinagat Islands data dissagregated from Surigao del Norte.
Table 83. BANANA: NUMBER OF BEARING HILLS, BY REGION …Continued
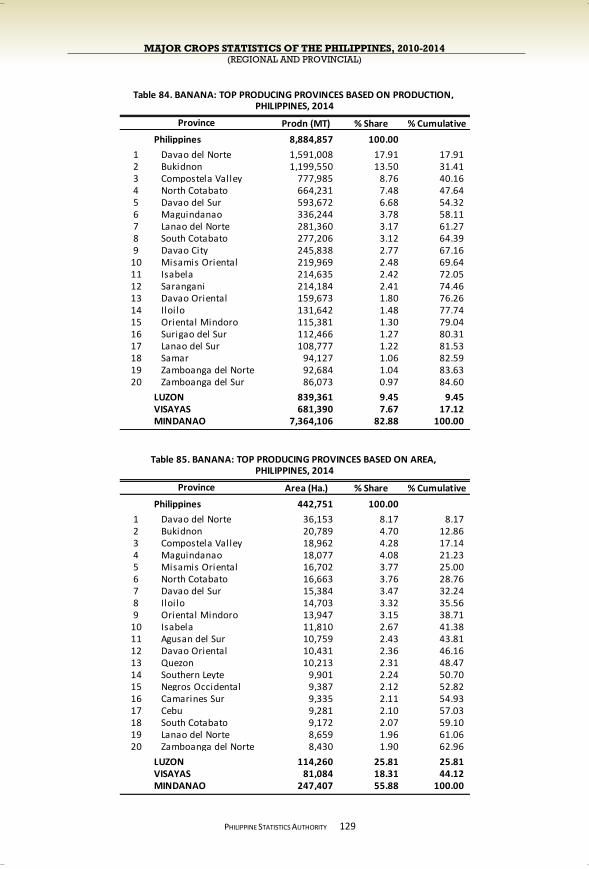
MAJOR CROPS STATISTICS OF THE PHILIPPINES, 2010-2014 (REGIONAL AND PROVINCIAL)
PHILIPPINE STATISTICS AUTHORITY
…
129
Prodn (MT) % Share % Cumulative
Philippines 8,884,857 100.00
1 Davao del Norte 1,591,008 17.91 17.91 2 Bukidnon 1,199,550 13.50 31.41 3 Compostela Valley 777,985 8.76 40.16 4 North Cotabato 664,231 7.48 47.64 5 Davao del Sur 593,672 6.68 54.32 6 Maguindanao 336,244 3.78 58.11 7 Lanao del Norte 281,360 3.17 61.27 8 South Cotabato 277,206 3.12 64.39 9 Davao City 245,838 2.77 67.16
10 Misamis Oriental 219,969 2.48 69.64 11 Isabela 214,635 2.42 72.05 12 Sarangani 214,184 2.41 74.46 13 Davao Oriental 159,673 1.80 76.26 14 Iloilo 131,642 1.48 77.74 15 Oriental Mindoro 115,381 1.30 79.04 16 Surigao del Sur 112,466 1.27 80.31 17 Lanao del Sur 108,777 1.22 81.53 18 Samar 94,127 1.06 82.59 19 Zamboanga del Norte 92,684 1.04 83.63 20 Zamboanga del Sur 86,073 0.97 84.60
LUZON 839,361 9.45 9.45 VISAYAS 681,390 7.67 17.12 MINDANAO 7,364,106 82.88 100.00
Area (Ha.) % Share % Cumulative
Philippines 442,751 100.00
1 Davao del Norte 36,153 8.17 8.17 2 Bukidnon 20,789 4.70 12.86 3 Compostela Valley 18,962 4.28 17.14 4 Maguindanao 18,077 4.08 21.23 5 Misamis Oriental 16,702 3.77 25.00 6 North Cotabato 16,663 3.76 28.76 7 Davao del Sur 15,384 3.47 32.24 8 Iloilo 14,703 3.32 35.56 9 Oriental Mindoro 13,947 3.15 38.71
10 Isabela 11,810 2.67 41.38 11 Agusan del Sur 10,759 2.43 43.81 12 Davao Oriental 10,431 2.36 46.16 13 Quezon 10,213 2.31 48.47 14 Southern Leyte 9,901 2.24 50.70 15 Negros Occidental 9,387 2.12 52.82 16 Camarines Sur 9,335 2.11 54.93 17 Cebu 9,281 2.10 57.03 18 South Cotabato 9,172 2.07 59.10 19 Lanao del Norte 8,659 1.96 61.06 20 Zamboanga del Norte 8,430 1.90 62.96
LUZON 114,260 25.81 25.81 VISAYAS 81,084 18.31 44.12 MINDANAO 247,407 55.88 100.00
Province
Table 84. BANANA: TOP PRODUCING PROVINCES BASED ON PRODUCTION,
Table 85. BANANA: TOP PRODUCING PROVINCES BASED ON AREA,
Province
PHILIPPINES, 2014
PHILIPPINES, 2014
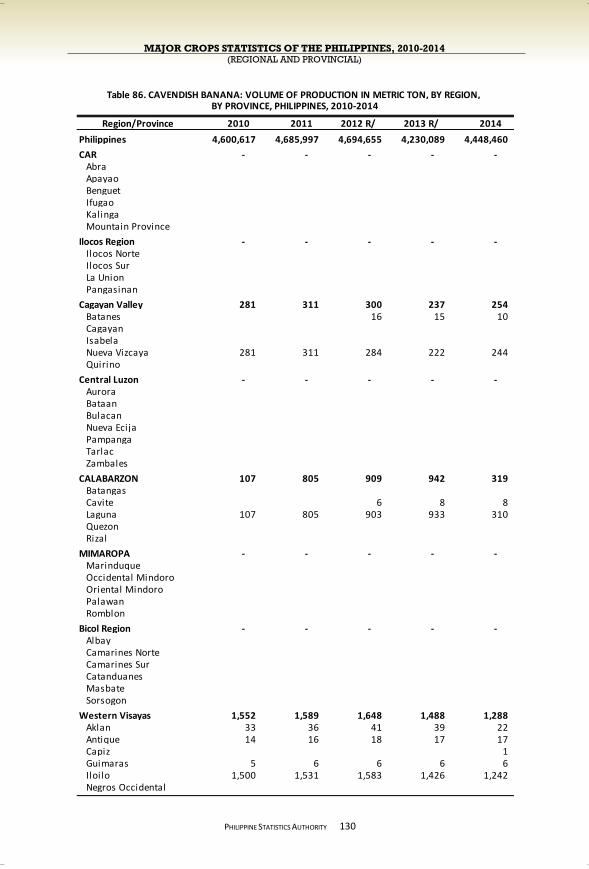
MAJOR CROPS STATISTICS OF THE PHILIPPINES, 2010-2014 (REGIONAL AND PROVINCIAL)
PHILIPPINE STATISTICS AUTHORITY
130
Region/Province 2010 2011 2012 R/ 2013 R/ 2014
Philippines 4,600,617 4,685,997 4,694,655 4,230,089 4,448,460
CAR - - - - - Abra Apayao Benguet Ifugao Kalinga Mountain Province
Ilocos Region - - - - - Ilocos Norte Ilocos Sur La Union Pangasinan
Cagayan Valley 281 311 300 237 254 Batanes 16 15 10 Cagayan Isabela Nueva Vizcaya 281 311 284 222 244 Quirino
Central Luzon - - - - - Aurora Bataan Bulacan Nueva Ecija Pampanga Tarlac Zambales
CALABARZON 107 805 909 942 319 Batangas Cavite 6 8 8 Laguna 107 805 903 933 310 Quezon Rizal
MIMAROPA - - - - - Marinduque Occidental Mindoro Oriental Mindoro Palawan Romblon
Bicol Region - - - - - Albay Camarines Norte Camarines Sur Catanduanes Masbate Sorsogon
Western Visayas 1,552 1,589 1,648 1,488 1,288 Aklan 33 36 41 39 22 Antique 14 16 18 17 17 Capiz 1 Guimaras 5 6 6 6 6 Iloilo 1,500 1,531 1,583 1,426 1,242 Negros Occidental
BY PROVINCE, PHILIPPINES, 2010-2014Table 86. CAVENDISH BANANA: VOLUME OF PRODUCTION IN METRIC TON, BY REGION,
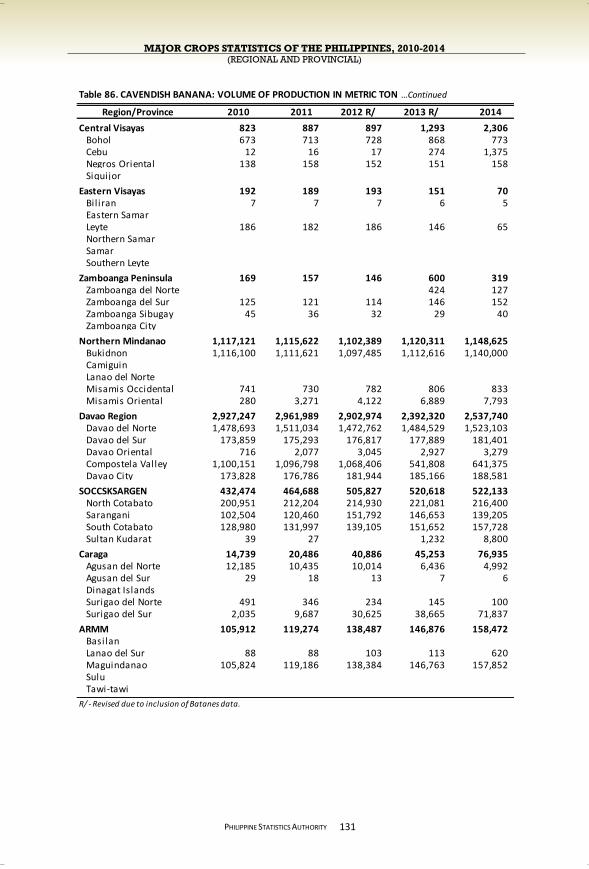
MAJOR CROPS STATISTICS OF THE PHILIPPINES, 2010-2014 (REGIONAL AND PROVINCIAL)
PHILIPPINE STATISTICS AUTHORITY
131
Region/Province 2010 2011 2012 R/ 2013 R/ 2014
Central Visayas 823 887 897 1,293 2,306 Bohol 673 713 728 868 773 Cebu 12 16 17 274 1,375 Negros Oriental 138 158 152 151 158 Siquijor
Eastern Visayas 192 189 193 151 70 Bil iran 7 7 7 6 5 Eastern Samar Leyte 186 182 186 146 65 Northern Samar Samar Southern Leyte
Zamboanga Peninsula 169 157 146 600 319 Zamboanga del Norte 424 127 Zamboanga del Sur 125 121 114 146 152 Zamboanga Sibugay 45 36 32 29 40 Zamboanga City
Northern Mindanao 1,117,121 1,115,622 1,102,389 1,120,311 1,148,625 Bukidnon 1,116,100 1,111,621 1,097,485 1,112,616 1,140,000 Camiguin Lanao del Norte Misamis Occidental 741 730 782 806 833 Misamis Oriental 280 3,271 4,122 6,889 7,793
Davao Region 2,927,247 2,961,989 2,902,974 2,392,320 2,537,740 Davao del Norte 1,478,693 1,511,034 1,472,762 1,484,529 1,523,103 Davao del Sur 173,859 175,293 176,817 177,889 181,401 Davao Oriental 716 2,077 3,045 2,927 3,279 Compostela Valley 1,100,151 1,096,798 1,068,406 541,808 641,375 Davao City 173,828 176,786 181,944 185,166 188,581
SOCCSKSARGEN 432,474 464,688 505,827 520,618 522,133 North Cotabato 200,951 212,204 214,930 221,081 216,400 Sarangani 102,504 120,460 151,792 146,653 139,205 South Cotabato 128,980 131,997 139,105 151,652 157,728 Sultan Kudarat 39 27 1,232 8,800
Caraga 14,739 20,486 40,886 45,253 76,935 Agusan del Norte 12,185 10,435 10,014 6,436 4,992 Agusan del Sur 29 18 13 7 6 Dinagat Islands Surigao del Norte 491 346 234 145 100 Surigao del Sur 2,035 9,687 30,625 38,665 71,837
ARMM 105,912 119,274 138,487 146,876 158,472 Basilan Lanao del Sur 88 88 103 113 620 Maguindanao 105,824 119,186 138,384 146,763 157,852 Sulu Tawi-tawi
R/ - Revised due to inclusion of Batanes data.
Table 86. CAVENDISH BANANA: VOLUME OF PRODUCTION IN METRIC TON …Continued
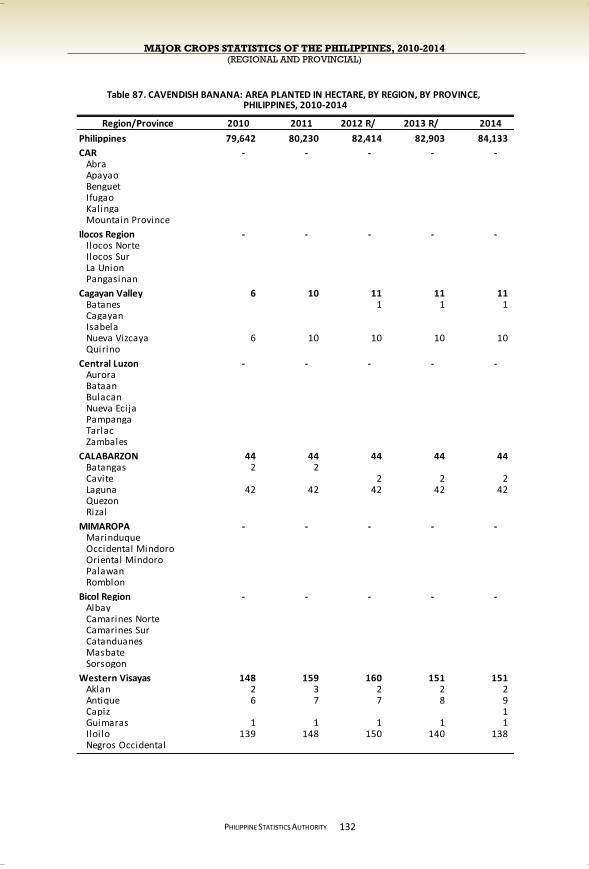
MAJOR CROPS STATISTICS OF THE PHILIPPINES, 2010-2014 (REGIONAL AND PROVINCIAL)
PHILIPPINE STATISTICS AUTHORITY
132
Region/Province 2010 2011 2012 R/ 2013 R/ 2014
Philippines 79,642 80,230 82,414 82,903 84,133
CAR - - - - - Abra Apayao Benguet Ifugao Kalinga Mountain Province
Ilocos Region - - - - - Ilocos Norte Ilocos Sur La Union Pangasinan
Cagayan Valley 6 10 11 11 11 Batanes 1 1 1 Cagayan Isabela Nueva Vizcaya 6 10 10 10 10 Quirino
Central Luzon - - - - - Aurora Bataan Bulacan Nueva Ecija Pampanga Tarlac Zambales
CALABARZON 44 44 44 44 44 Batangas 2 2 Cavite 2 2 2 Laguna 42 42 42 42 42 Quezon Rizal
MIMAROPA - - - - - Marinduque Occidental Mindoro Oriental Mindoro Palawan Romblon
Bicol Region - - - - - Albay Camarines Norte Camarines Sur Catanduanes Masbate Sorsogon
Western Visayas 148 159 160 151 151 Aklan 2 3 2 2 2 Antique 6 7 7 8 9 Capiz 1 Guimaras 1 1 1 1 1 Iloilo 139 148 150 140 138 Negros Occidental
PHILIPPINES, 2010-2014Table 87. CAVENDISH BANANA: AREA PLANTED IN HECTARE, BY REGION, BY PROVINCE,

MAJOR CROPS STATISTICS OF THE PHILIPPINES, 2010-2014 (REGIONAL AND PROVINCIAL)
PHILIPPINE STATISTICS AUTHORITY
133
Region/Province 2010 2011 2012 R/ 2013 R/ 2014
Central Visayas 94 97 112 112 170 Bohol 70 70 70 70 68 Cebu 3 5 20 20 79 Negros Oriental 21 22 22 22 22 Siquijor 1
Eastern Visayas 34 34 36 36 28 Bil iran 2 2 2 2 2 Eastern Samar Leyte 32 32 34 34 26 Northern Samar Samar Southern Leyte
Zamboanga Peninsula 30 29 98 72 68 Zamboanga del Norte 80 56 52 Zamboanga del Sur 26 25 15 13 13 Zamboanga Sibugay 4 4 3 3 3 Zamboanga City
Northern Mindanao 16,707 16,635 16,628 17,074 17,168 Bukidnon 16,600 16,490 16,481 16,900 16,900 Camiguin Lanao del Norte Misamis Occidental 40 32 34 34 34 Misamis Oriental 67 113 113 140 234
Davao Region 48,153 48,741 48,535 46,681 47,092 Davao del Norte 28,664 29,136 28,772 28,564 28,846 Davao del Sur 3,500 3,565 3,625 3,625 3,627 Davao Oriental 58 59 110 58 58 Compostela Valley 13,333 13,333 13,333 11,759 11,884 Davao City 2,598 2,648 2,695 2,675 2,677
SOCCSKSARGEN 9,219 9,283 10,140 11,668 11,784 North Cotabato 3,770 3,800 3,840 4,550 4,500 Sarangani 1,755 1,782 1,795 1,798 1,890 South Cotabato 3,692 3,699 4,483 5,110 5,174 Sultan Kudarat 2 2 22 210 220
Caraga 842 804 2,105 2,146 2,546 Agusan del Norte 470 390 300 230 230 Agusan del Sur 4 2 1 1 1 Dinagat Islands Surigao del Norte 68 50 50 15 15 Surigao del Sur 300 362 1,764 1,900 2,300
ARMM 4,365 4,395 4,545 4,908 5,072 Basilan Lanao del Sur 5 5 155 408 522 Maguindanao 4,360 4,390 4,390 4,500 4,550 Sulu Tawi-tawi
R/ - Revised due to inclusion of Batanes data.
Table 87. CAVENDISH BANANA: AREA PLANTED IN HECTARE …Continued
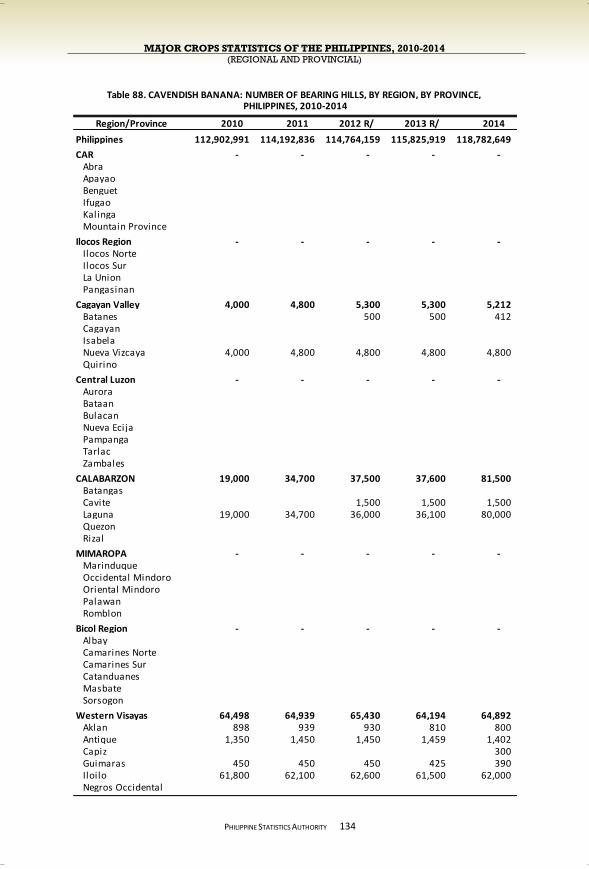
MAJOR CROPS STATISTICS OF THE PHILIPPINES, 2010-2014 (REGIONAL AND PROVINCIAL)
PHILIPPINE STATISTICS AUTHORITY
134
Region/Province 2010 2011 2012 R/ 2013 R/ 2014
Philippines 112,902,991 114,192,836 114,764,159 115,825,919 118,782,649
CAR - - - - - Abra Apayao Benguet Ifugao Kalinga Mountain Province
Ilocos Region - - - - - Ilocos Norte Ilocos Sur La Union Pangasinan
Cagayan Valley 4,000 4,800 5,300 5,300 5,212 Batanes 500 500 412 Cagayan Isabela Nueva Vizcaya 4,000 4,800 4,800 4,800 4,800 Quirino
Central Luzon - - - - - Aurora Bataan Bulacan Nueva Ecija Pampanga Tarlac Zambales
CALABARZON 19,000 34,700 37,500 37,600 81,500 Batangas Cavite 1,500 1,500 1,500 Laguna 19,000 34,700 36,000 36,100 80,000 Quezon Rizal
MIMAROPA - - - - - Marinduque Occidental Mindoro Oriental Mindoro Palawan Romblon
Bicol Region - - - - - Albay Camarines Norte Camarines Sur Catanduanes Masbate Sorsogon
Western Visayas 64,498 64,939 65,430 64,194 64,892 Aklan 898 939 930 810 800 Antique 1,350 1,450 1,450 1,459 1,402 Capiz 300 Guimaras 450 450 450 425 390 Iloilo 61,800 62,100 62,600 61,500 62,000 Negros Occidental
PHILIPPINES, 2010-2014Table 88. CAVENDISH BANANA: NUMBER OF BEARING HILLS, BY REGION, BY PROVINCE,
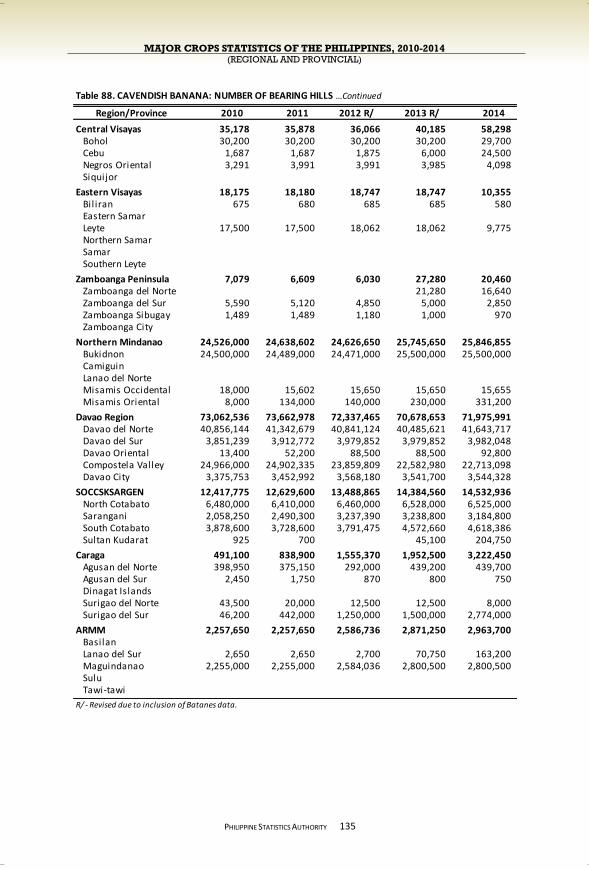
MAJOR CROPS STATISTICS OF THE PHILIPPINES, 2010-2014 (REGIONAL AND PROVINCIAL)
PHILIPPINE STATISTICS AUTHORITY
135
Region/Province 2010 2011 2012 R/ 2013 R/ 2014
Central Visayas 35,178 35,878 36,066 40,185 58,298 Bohol 30,200 30,200 30,200 30,200 29,700 Cebu 1,687 1,687 1,875 6,000 24,500 Negros Oriental 3,291 3,991 3,991 3,985 4,098 Siquijor
Eastern Visayas 18,175 18,180 18,747 18,747 10,355 Bil iran 675 680 685 685 580 Eastern Samar Leyte 17,500 17,500 18,062 18,062 9,775 Northern Samar Samar Southern Leyte
Zamboanga Peninsula 7,079 6,609 6,030 27,280 20,460 Zamboanga del Norte 21,280 16,640 Zamboanga del Sur 5,590 5,120 4,850 5,000 2,850 Zamboanga Sibugay 1,489 1,489 1,180 1,000 970 Zamboanga City
Northern Mindanao 24,526,000 24,638,602 24,626,650 25,745,650 25,846,855 Bukidnon 24,500,000 24,489,000 24,471,000 25,500,000 25,500,000 Camiguin Lanao del Norte Misamis Occidental 18,000 15,602 15,650 15,650 15,655 Misamis Oriental 8,000 134,000 140,000 230,000 331,200
Davao Region 73,062,536 73,662,978 72,337,465 70,678,653 71,975,991 Davao del Norte 40,856,144 41,342,679 40,841,124 40,485,621 41,643,717 Davao del Sur 3,851,239 3,912,772 3,979,852 3,979,852 3,982,048 Davao Oriental 13,400 52,200 88,500 88,500 92,800 Compostela Valley 24,966,000 24,902,335 23,859,809 22,582,980 22,713,098 Davao City 3,375,753 3,452,992 3,568,180 3,541,700 3,544,328
SOCCSKSARGEN 12,417,775 12,629,600 13,488,865 14,384,560 14,532,936 North Cotabato 6,480,000 6,410,000 6,460,000 6,528,000 6,525,000 Sarangani 2,058,250 2,490,300 3,237,390 3,238,800 3,184,800 South Cotabato 3,878,600 3,728,600 3,791,475 4,572,660 4,618,386 Sultan Kudarat 925 700 45,100 204,750
Caraga 491,100 838,900 1,555,370 1,952,500 3,222,450 Agusan del Norte 398,950 375,150 292,000 439,200 439,700 Agusan del Sur 2,450 1,750 870 800 750 Dinagat Islands Surigao del Norte 43,500 20,000 12,500 12,500 8,000 Surigao del Sur 46,200 442,000 1,250,000 1,500,000 2,774,000
ARMM 2,257,650 2,257,650 2,586,736 2,871,250 2,963,700 Basilan Lanao del Sur 2,650 2,650 2,700 70,750 163,200 Maguindanao 2,255,000 2,255,000 2,584,036 2,800,500 2,800,500 Sulu Tawi-tawi
R/ - Revised due to inclusion of Batanes data.
Table 88. CAVENDISH BANANA: NUMBER OF BEARING HILLS …Continued
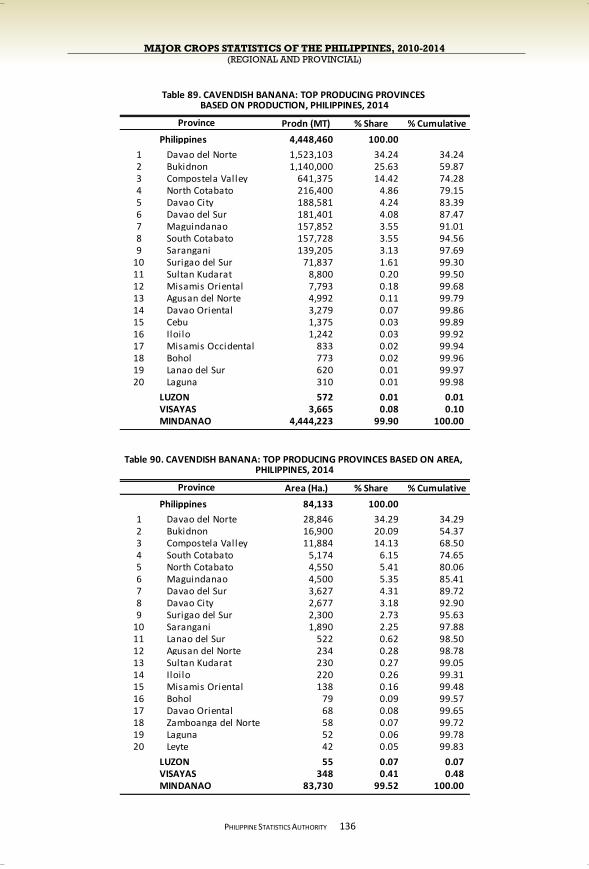
MAJOR CROPS STATISTICS OF THE PHILIPPINES, 2010-2014 (REGIONAL AND PROVINCIAL)
PHILIPPINE STATISTICS AUTHORITY
136
Prodn (MT) % Share % Cumulative
Philippines 4,448,460 100.00
1 Davao del Norte 1,523,103 34.24 34.24 2 Bukidnon 1,140,000 25.63 59.87 3 Compostela Valley 641,375 14.42 74.28 4 North Cotabato 216,400 4.86 79.15 5 Davao City 188,581 4.24 83.39 6 Davao del Sur 181,401 4.08 87.47 7 Maguindanao 157,852 3.55 91.01 8 South Cotabato 157,728 3.55 94.56 9 Sarangani 139,205 3.13 97.69
10 Surigao del Sur 71,837 1.61 99.30 11 Sultan Kudarat 8,800 0.20 99.50 12 Misamis Oriental 7,793 0.18 99.68 13 Agusan del Norte 4,992 0.11 99.79 14 Davao Oriental 3,279 0.07 99.86 15 Cebu 1,375 0.03 99.89 16 Iloilo 1,242 0.03 99.92 17 Misamis Occidental 833 0.02 99.94 18 Bohol 773 0.02 99.96 19 Lanao del Sur 620 0.01 99.97 20 Laguna 310 0.01 99.98
LUZON 572 0.01 0.01 VISAYAS 3,665 0.08 0.10 MINDANAO 4,444,223 99.90 100.00
Area (Ha.) % Share % Cumulative
Philippines 84,133 100.00
1 Davao del Norte 28,846 34.29 34.29 2 Bukidnon 16,900 20.09 54.37 3 Compostela Valley 11,884 14.13 68.50 4 South Cotabato 5,174 6.15 74.65 5 North Cotabato 4,550 5.41 80.06 6 Maguindanao 4,500 5.35 85.41 7 Davao del Sur 3,627 4.31 89.72 8 Davao City 2,677 3.18 92.90 9 Surigao del Sur 2,300 2.73 95.63
10 Sarangani 1,890 2.25 97.88 11 Lanao del Sur 522 0.62 98.50 12 Agusan del Norte 234 0.28 98.78 13 Sultan Kudarat 230 0.27 99.05 14 Iloilo 220 0.26 99.31 15 Misamis Oriental 138 0.16 99.48 16 Bohol 79 0.09 99.57 17 Davao Oriental 68 0.08 99.65 18 Zamboanga del Norte 58 0.07 99.72 19 Laguna 52 0.06 99.78 20 Leyte 42 0.05 99.83
LUZON 55 0.07 0.07 VISAYAS 348 0.41 0.48 MINDANAO 83,730 99.52 100.00
Province
Table 89. CAVENDISH BANANA: TOP PRODUCING PROVINCES
Table 90. CAVENDISH BANANA: TOP PRODUCING PROVINCES BASED ON AREA,
Province
PHILIPPINES, 2014
BASED ON PRODUCTION, PHILIPPINES, 2014
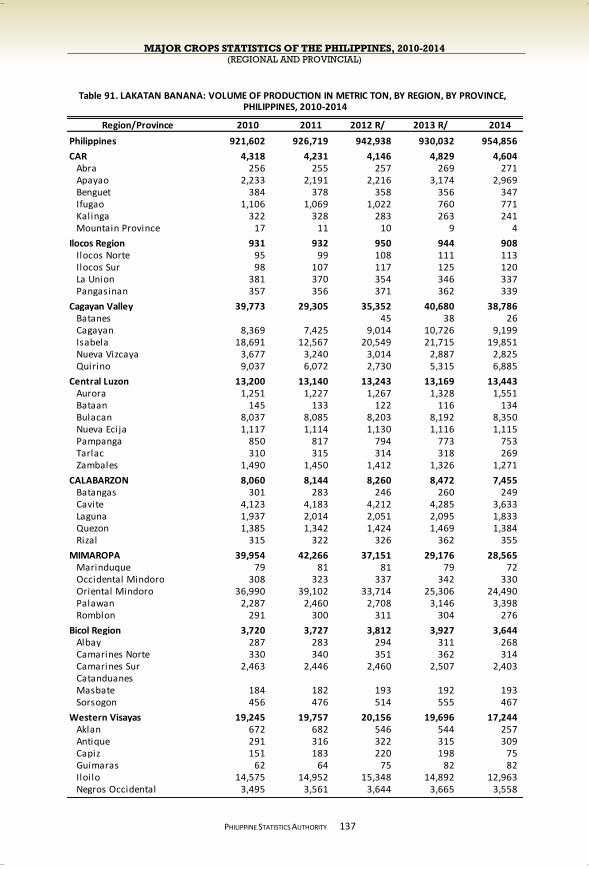
MAJOR CROPS STATISTICS OF THE PHILIPPINES, 2010-2014 (REGIONAL AND PROVINCIAL)
PHILIPPINE STATISTICS AUTHORITY
137
Region/Province 2010 2011 2012 R/ 2013 R/ 2014
Philippines 921,602 926,719 942,938 930,032 954,856
CAR 4,318 4,231 4,146 4,829 4,604 Abra 256 255 257 269 271 Apayao 2,233 2,191 2,216 3,174 2,969 Benguet 384 378 358 356 347 Ifugao 1,106 1,069 1,022 760 771 Kalinga 322 328 283 263 241 Mountain Province 17 11 10 9 4
Ilocos Region 931 932 950 944 908 Ilocos Norte 95 99 108 111 113 Ilocos Sur 98 107 117 125 120 La Union 381 370 354 346 337 Pangasinan 357 356 371 362 339
Cagayan Valley 39,773 29,305 35,352 40,680 38,786 Batanes 45 38 26 Cagayan 8,369 7,425 9,014 10,726 9,199 Isabela 18,691 12,567 20,549 21,715 19,851 Nueva Vizcaya 3,677 3,240 3,014 2,887 2,825 Quirino 9,037 6,072 2,730 5,315 6,885
Central Luzon 13,200 13,140 13,243 13,169 13,443 Aurora 1,251 1,227 1,267 1,328 1,551 Bataan 145 133 122 116 134 Bulacan 8,037 8,085 8,203 8,192 8,350 Nueva Ecija 1,117 1,114 1,130 1,116 1,115 Pampanga 850 817 794 773 753 Tarlac 310 315 314 318 269 Zambales 1,490 1,450 1,412 1,326 1,271
CALABARZON 8,060 8,144 8,260 8,472 7,455 Batangas 301 283 246 260 249 Cavite 4,123 4,183 4,212 4,285 3,633 Laguna 1,937 2,014 2,051 2,095 1,833 Quezon 1,385 1,342 1,424 1,469 1,384 Rizal 315 322 326 362 355
MIMAROPA 39,954 42,266 37,151 29,176 28,565 Marinduque 79 81 81 79 72 Occidental Mindoro 308 323 337 342 330 Oriental Mindoro 36,990 39,102 33,714 25,306 24,490 Palawan 2,287 2,460 2,708 3,146 3,398 Romblon 291 300 311 304 276
Bicol Region 3,720 3,727 3,812 3,927 3,644 Albay 287 283 294 311 268 Camarines Norte 330 340 351 362 314 Camarines Sur 2,463 2,446 2,460 2,507 2,403 Catanduanes Masbate 184 182 193 192 193 Sorsogon 456 476 514 555 467
Western Visayas 19,245 19,757 20,156 19,696 17,244 Aklan 672 682 546 544 257 Antique 291 316 322 315 309 Capiz 151 183 220 198 75 Guimaras 62 64 75 82 82 Iloilo 14,575 14,952 15,348 14,892 12,963 Negros Occidental 3,495 3,561 3,644 3,665 3,558
PHILIPPINES, 2010-2014Table 91. LAKATAN BANANA: VOLUME OF PRODUCTION IN METRIC TON, BY REGION, BY PROVINCE,
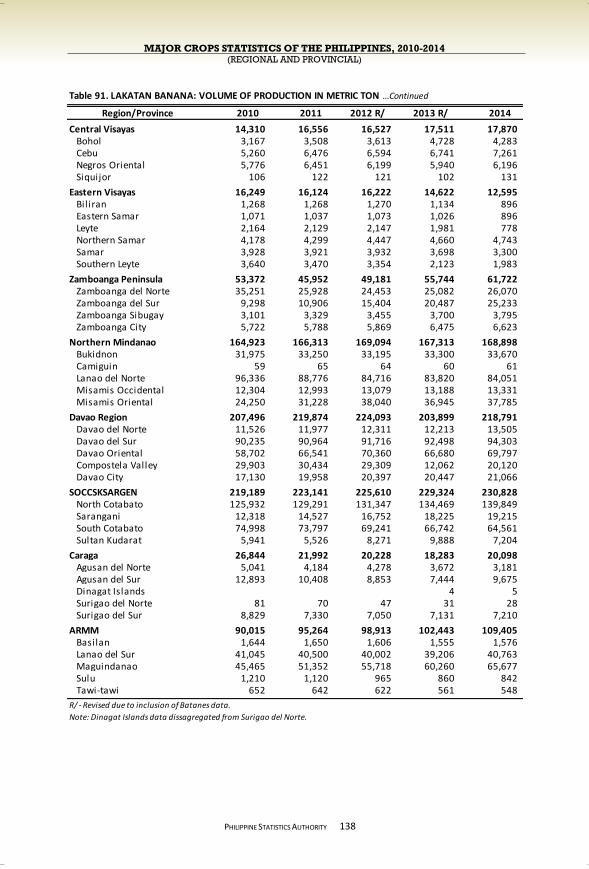
MAJOR CROPS STATISTICS OF THE PHILIPPINES, 2010-2014 (REGIONAL AND PROVINCIAL)
PHILIPPINE STATISTICS AUTHORITY
138
Region/Province 2010 2011 2012 R/ 2013 R/ 2014
Central Visayas 14,310 16,556 16,527 17,511 17,870 Bohol 3,167 3,508 3,613 4,728 4,283 Cebu 5,260 6,476 6,594 6,741 7,261 Negros Oriental 5,776 6,451 6,199 5,940 6,196 Siquijor 106 122 121 102 131
Eastern Visayas 16,249 16,124 16,222 14,622 12,595 Bil iran 1,268 1,268 1,270 1,134 896 Eastern Samar 1,071 1,037 1,073 1,026 896 Leyte 2,164 2,129 2,147 1,981 778 Northern Samar 4,178 4,299 4,447 4,660 4,743 Samar 3,928 3,921 3,932 3,698 3,300 Southern Leyte 3,640 3,470 3,354 2,123 1,983
Zamboanga Peninsula 53,372 45,952 49,181 55,744 61,722 Zamboanga del Norte 35,251 25,928 24,453 25,082 26,070 Zamboanga del Sur 9,298 10,906 15,404 20,487 25,233 Zamboanga Sibugay 3,101 3,329 3,455 3,700 3,795 Zamboanga City 5,722 5,788 5,869 6,475 6,623
Northern Mindanao 164,923 166,313 169,094 167,313 168,898 Bukidnon 31,975 33,250 33,195 33,300 33,670 Camiguin 59 65 64 60 61 Lanao del Norte 96,336 88,776 84,716 83,820 84,051 Misamis Occidental 12,304 12,993 13,079 13,188 13,331 Misamis Oriental 24,250 31,228 38,040 36,945 37,785
Davao Region 207,496 219,874 224,093 203,899 218,791 Davao del Norte 11,526 11,977 12,311 12,213 13,505 Davao del Sur 90,235 90,964 91,716 92,498 94,303 Davao Oriental 58,702 66,541 70,360 66,680 69,797 Compostela Valley 29,903 30,434 29,309 12,062 20,120 Davao City 17,130 19,958 20,397 20,447 21,066
SOCCSKSARGEN 219,189 223,141 225,610 229,324 230,828 North Cotabato 125,932 129,291 131,347 134,469 139,849 Sarangani 12,318 14,527 16,752 18,225 19,215 South Cotabato 74,998 73,797 69,241 66,742 64,561 Sultan Kudarat 5,941 5,526 8,271 9,888 7,204
Caraga 26,844 21,992 20,228 18,283 20,098 Agusan del Norte 5,041 4,184 4,278 3,672 3,181 Agusan del Sur 12,893 10,408 8,853 7,444 9,675 Dinagat Islands 4 5 Surigao del Norte 81 70 47 31 28 Surigao del Sur 8,829 7,330 7,050 7,131 7,210
ARMM 90,015 95,264 98,913 102,443 109,405 Basilan 1,644 1,650 1,606 1,555 1,576 Lanao del Sur 41,045 40,500 40,002 39,206 40,763 Maguindanao 45,465 51,352 55,718 60,260 65,677 Sulu 1,210 1,120 965 860 842 Tawi-tawi 652 642 622 561 548
R/ - Revised due to inclusion of Batanes data.
Note: Dinagat Islands data dissagregated from Surigao del Norte.
Table 91. LAKATAN BANANA: VOLUME OF PRODUCTION IN METRIC TON …Continued
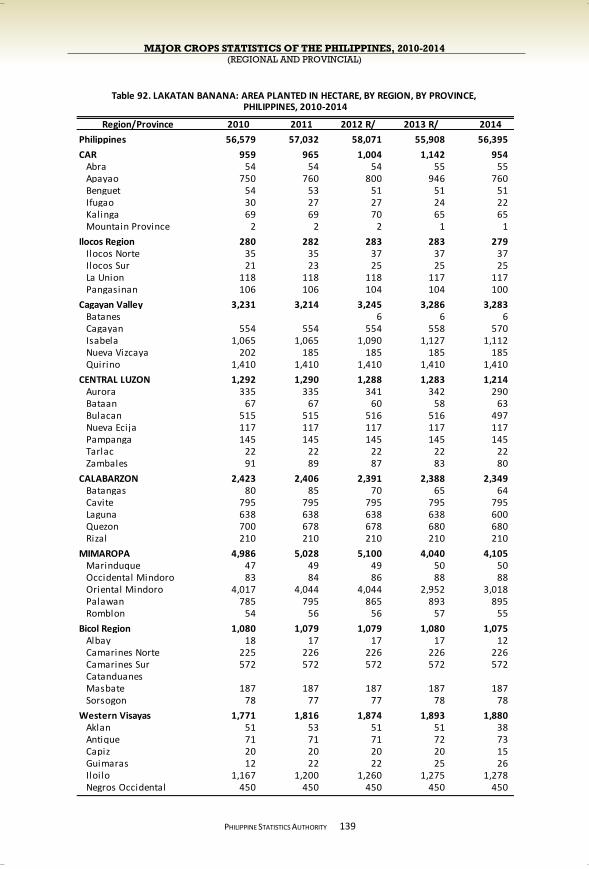
MAJOR CROPS STATISTICS OF THE PHILIPPINES, 2010-2014 (REGIONAL AND PROVINCIAL)
PHILIPPINE STATISTICS AUTHORITY
139
Region/Province 2010 2011 2012 R/ 2013 R/ 2014
Philippines 56,579 57,032 58,071 55,908 56,395
CAR 959 965 1,004 1,142 954 Abra 54 54 54 55 55 Apayao 750 760 800 946 760 Benguet 54 53 51 51 51 Ifugao 30 27 27 24 22 Kalinga 69 69 70 65 65 Mountain Province 2 2 2 1 1
Ilocos Region 280 282 283 283 279 Ilocos Norte 35 35 37 37 37 Ilocos Sur 21 23 25 25 25 La Union 118 118 118 117 117 Pangasinan 106 106 104 104 100
Cagayan Valley 3,231 3,214 3,245 3,286 3,283 Batanes 6 6 6 Cagayan 554 554 554 558 570 Isabela 1,065 1,065 1,090 1,127 1,112 Nueva Vizcaya 202 185 185 185 185 Quirino 1,410 1,410 1,410 1,410 1,410
CENTRAL LUZON 1,292 1,290 1,288 1,283 1,214 Aurora 335 335 341 342 290 Bataan 67 67 60 58 63 Bulacan 515 515 516 516 497 Nueva Ecija 117 117 117 117 117 Pampanga 145 145 145 145 145 Tarlac 22 22 22 22 22 Zambales 91 89 87 83 80
CALABARZON 2,423 2,406 2,391 2,388 2,349 Batangas 80 85 70 65 64 Cavite 795 795 795 795 795 Laguna 638 638 638 638 600 Quezon 700 678 678 680 680 Rizal 210 210 210 210 210
MIMAROPA 4,986 5,028 5,100 4,040 4,105 Marinduque 47 49 49 50 50 Occidental Mindoro 83 84 86 88 88 Oriental Mindoro 4,017 4,044 4,044 2,952 3,018 Palawan 785 795 865 893 895 Romblon 54 56 56 57 55
Bicol Region 1,080 1,079 1,079 1,080 1,075 Albay 18 17 17 17 12 Camarines Norte 225 226 226 226 226 Camarines Sur 572 572 572 572 572 Catanduanes Masbate 187 187 187 187 187 Sorsogon 78 77 77 78 78
Western Visayas 1,771 1,816 1,874 1,893 1,880 Aklan 51 53 51 51 38 Antique 71 71 71 72 73 Capiz 20 20 20 20 15 Guimaras 12 22 22 25 26 Iloilo 1,167 1,200 1,260 1,275 1,278 Negros Occidental 450 450 450 450 450
PHILIPPINES, 2010-2014Table 92. LAKATAN BANANA: AREA PLANTED IN HECTARE, BY REGION, BY PROVINCE,
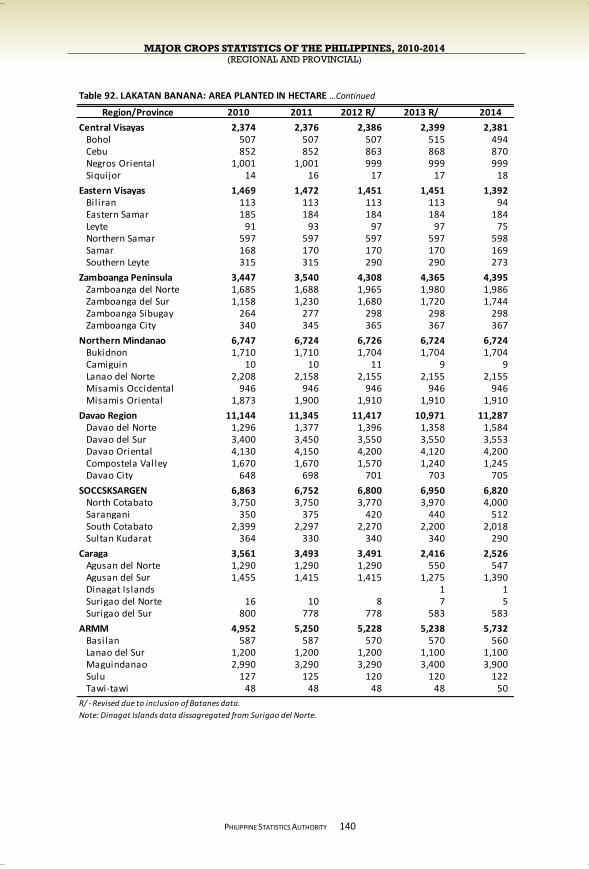
MAJOR CROPS STATISTICS OF THE PHILIPPINES, 2010-2014 (REGIONAL AND PROVINCIAL)
PHILIPPINE STATISTICS AUTHORITY
140
Region/Province 2010 2011 2012 R/ 2013 R/ 2014
Central Visayas 2,374 2,376 2,386 2,399 2,381 Bohol 507 507 507 515 494 Cebu 852 852 863 868 870 Negros Oriental 1,001 1,001 999 999 999 Siquijor 14 16 17 17 18
Eastern Visayas 1,469 1,472 1,451 1,451 1,392 Bil iran 113 113 113 113 94 Eastern Samar 185 184 184 184 184 Leyte 91 93 97 97 75 Northern Samar 597 597 597 597 598 Samar 168 170 170 170 169 Southern Leyte 315 315 290 290 273
Zamboanga Peninsula 3,447 3,540 4,308 4,365 4,395 Zamboanga del Norte 1,685 1,688 1,965 1,980 1,986 Zamboanga del Sur 1,158 1,230 1,680 1,720 1,744 Zamboanga Sibugay 264 277 298 298 298 Zamboanga City 340 345 365 367 367
Northern Mindanao 6,747 6,724 6,726 6,724 6,724 Bukidnon 1,710 1,710 1,704 1,704 1,704 Camiguin 10 10 11 9 9 Lanao del Norte 2,208 2,158 2,155 2,155 2,155 Misamis Occidental 946 946 946 946 946 Misamis Oriental 1,873 1,900 1,910 1,910 1,910
Davao Region 11,144 11,345 11,417 10,971 11,287 Davao del Norte 1,296 1,377 1,396 1,358 1,584 Davao del Sur 3,400 3,450 3,550 3,550 3,553 Davao Oriental 4,130 4,150 4,200 4,120 4,200 Compostela Valley 1,670 1,670 1,570 1,240 1,245 Davao City 648 698 701 703 705
SOCCSKSARGEN 6,863 6,752 6,800 6,950 6,820 North Cotabato 3,750 3,750 3,770 3,970 4,000 Sarangani 350 375 420 440 512 South Cotabato 2,399 2,297 2,270 2,200 2,018 Sultan Kudarat 364 330 340 340 290
Caraga 3,561 3,493 3,491 2,416 2,526 Agusan del Norte 1,290 1,290 1,290 550 547 Agusan del Sur 1,455 1,415 1,415 1,275 1,390 Dinagat Islands 1 1 Surigao del Norte 16 10 8 7 5 Surigao del Sur 800 778 778 583 583
ARMM 4,952 5,250 5,228 5,238 5,732 Basilan 587 587 570 570 560 Lanao del Sur 1,200 1,200 1,200 1,100 1,100 Maguindanao 2,990 3,290 3,290 3,400 3,900 Sulu 127 125 120 120 122 Tawi-tawi 48 48 48 48 50
R/ - Revised due to inclusion of Batanes data.
Note: Dinagat Islands data dissagregated from Surigao del Norte.
Table 92. LAKATAN BANANA: AREA PLANTED IN HECTARE …Continued
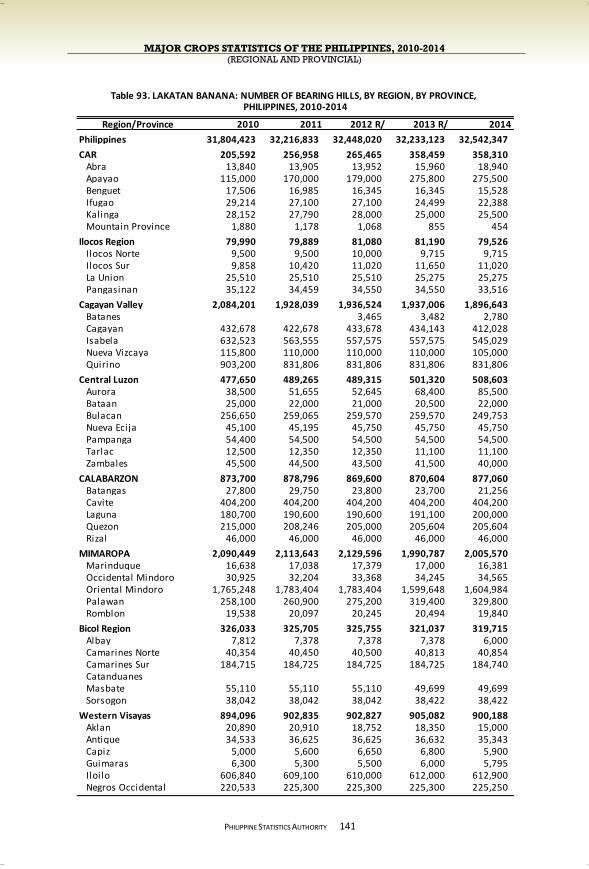
MAJOR CROPS STATISTICS OF THE PHILIPPINES, 2010-2014 (REGIONAL AND PROVINCIAL)
PHILIPPINE STATISTICS AUTHORITY
141
Region/Province 2010 2011 2012 R/ 2013 R/ 2014
Philippines 31,804,423 32,216,833 32,448,020 32,233,123 32,542,347
CAR 205,592 256,958 265,465 358,459 358,310 Abra 13,840 13,905 13,952 15,960 18,940 Apayao 115,000 170,000 179,000 275,800 275,500 Benguet 17,506 16,985 16,345 16,345 15,528 Ifugao 29,214 27,100 27,100 24,499 22,388 Kalinga 28,152 27,790 28,000 25,000 25,500 Mountain Province 1,880 1,178 1,068 855 454
Ilocos Region 79,990 79,889 81,080 81,190 79,526 Ilocos Norte 9,500 9,500 10,000 9,715 9,715 Ilocos Sur 9,858 10,420 11,020 11,650 11,020 La Union 25,510 25,510 25,510 25,275 25,275 Pangasinan 35,122 34,459 34,550 34,550 33,516
Cagayan Valley 2,084,201 1,928,039 1,936,524 1,937,006 1,896,643 Batanes 3,465 3,482 2,780 Cagayan 432,678 422,678 433,678 434,143 412,028 Isabela 632,523 563,555 557,575 557,575 545,029 Nueva Vizcaya 115,800 110,000 110,000 110,000 105,000 Quirino 903,200 831,806 831,806 831,806 831,806
Central Luzon 477,650 489,265 489,315 501,320 508,603 Aurora 38,500 51,655 52,645 68,400 85,500 Bataan 25,000 22,000 21,000 20,500 22,000 Bulacan 256,650 259,065 259,570 259,570 249,753 Nueva Ecija 45,100 45,195 45,750 45,750 45,750 Pampanga 54,400 54,500 54,500 54,500 54,500 Tarlac 12,500 12,350 12,350 11,100 11,100 Zambales 45,500 44,500 43,500 41,500 40,000
CALABARZON 873,700 878,796 869,600 870,604 877,060 Batangas 27,800 29,750 23,800 23,700 21,256 Cavite 404,200 404,200 404,200 404,200 404,200 Laguna 180,700 190,600 190,600 191,100 200,000 Quezon 215,000 208,246 205,000 205,604 205,604 Rizal 46,000 46,000 46,000 46,000 46,000
MIMAROPA 2,090,449 2,113,643 2,129,596 1,990,787 2,005,570 Marinduque 16,638 17,038 17,379 17,000 16,381 Occidental Mindoro 30,925 32,204 33,368 34,245 34,565 Oriental Mindoro 1,765,248 1,783,404 1,783,404 1,599,648 1,604,984 Palawan 258,100 260,900 275,200 319,400 329,800 Romblon 19,538 20,097 20,245 20,494 19,840
Bicol Region 326,033 325,705 325,755 321,037 319,715 Albay 7,812 7,378 7,378 7,378 6,000 Camarines Norte 40,354 40,450 40,500 40,813 40,854 Camarines Sur 184,715 184,725 184,725 184,725 184,740 Catanduanes Masbate 55,110 55,110 55,110 49,699 49,699 Sorsogon 38,042 38,042 38,042 38,422 38,422
Western Visayas 894,096 902,835 902,827 905,082 900,188 Aklan 20,890 20,910 18,752 18,350 15,000 Antique 34,533 36,625 36,625 36,632 35,343 Capiz 5,000 5,600 6,650 6,800 5,900 Guimaras 6,300 5,300 5,500 6,000 5,795 Iloilo 606,840 609,100 610,000 612,000 612,900 Negros Occidental 220,533 225,300 225,300 225,300 225,250
PHILIPPINES, 2010-2014Table 93. LAKATAN BANANA: NUMBER OF BEARING HILLS, BY REGION, BY PROVINCE,
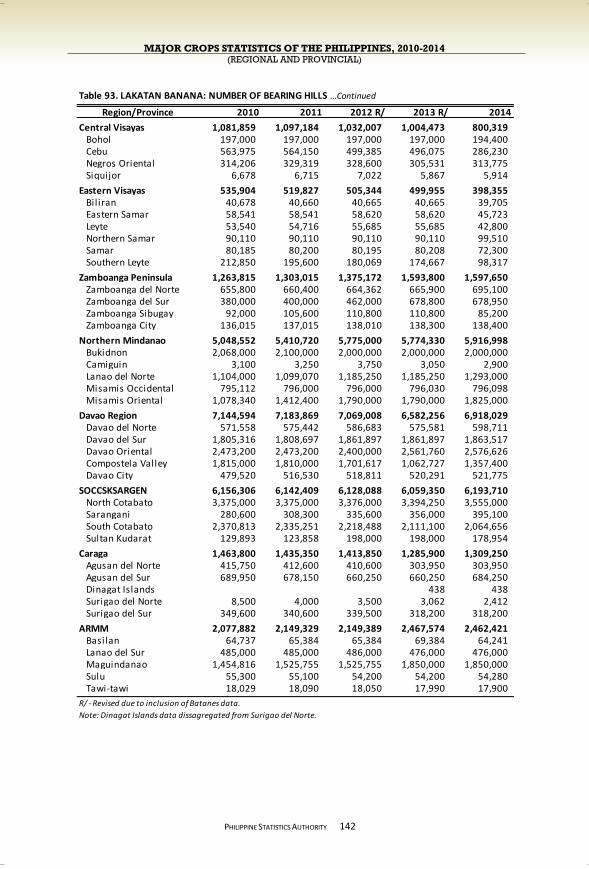
MAJOR CROPS STATISTICS OF THE PHILIPPINES, 2010-2014 (REGIONAL AND PROVINCIAL)
PHILIPPINE STATISTICS AUTHORITY
142
Region/Province 2010 2011 2012 R/ 2013 R/ 2014
Central Visayas 1,081,859 1,097,184 1,032,007 1,004,473 800,319 Bohol 197,000 197,000 197,000 197,000 194,400 Cebu 563,975 564,150 499,385 496,075 286,230 Negros Oriental 314,206 329,319 328,600 305,531 313,775 Siquijor 6,678 6,715 7,022 5,867 5,914
Eastern Visayas 535,904 519,827 505,344 499,955 398,355 Bil iran 40,678 40,660 40,665 40,665 39,705 Eastern Samar 58,541 58,541 58,620 58,620 45,723 Leyte 53,540 54,716 55,685 55,685 42,800 Northern Samar 90,110 90,110 90,110 90,110 99,510 Samar 80,185 80,200 80,195 80,208 72,300 Southern Leyte 212,850 195,600 180,069 174,667 98,317
Zamboanga Peninsula 1,263,815 1,303,015 1,375,172 1,593,800 1,597,650 Zamboanga del Norte 655,800 660,400 664,362 665,900 695,100 Zamboanga del Sur 380,000 400,000 462,000 678,800 678,950 Zamboanga Sibugay 92,000 105,600 110,800 110,800 85,200 Zamboanga City 136,015 137,015 138,010 138,300 138,400
Northern Mindanao 5,048,552 5,410,720 5,775,000 5,774,330 5,916,998 Bukidnon 2,068,000 2,100,000 2,000,000 2,000,000 2,000,000 Camiguin 3,100 3,250 3,750 3,050 2,900 Lanao del Norte 1,104,000 1,099,070 1,185,250 1,185,250 1,293,000 Misamis Occidental 795,112 796,000 796,000 796,030 796,098 Misamis Oriental 1,078,340 1,412,400 1,790,000 1,790,000 1,825,000
Davao Region 7,144,594 7,183,869 7,069,008 6,582,256 6,918,029 Davao del Norte 571,558 575,442 586,683 575,581 598,711 Davao del Sur 1,805,316 1,808,697 1,861,897 1,861,897 1,863,517 Davao Oriental 2,473,200 2,473,200 2,400,000 2,561,760 2,576,626 Compostela Valley 1,815,000 1,810,000 1,701,617 1,062,727 1,357,400 Davao City 479,520 516,530 518,811 520,291 521,775
SOCCSKSARGEN 6,156,306 6,142,409 6,128,088 6,059,350 6,193,710 North Cotabato 3,375,000 3,375,000 3,376,000 3,394,250 3,555,000 Sarangani 280,600 308,300 335,600 356,000 395,100 South Cotabato 2,370,813 2,335,251 2,218,488 2,111,100 2,064,656 Sultan Kudarat 129,893 123,858 198,000 198,000 178,954
Caraga 1,463,800 1,435,350 1,413,850 1,285,900 1,309,250 Agusan del Norte 415,750 412,600 410,600 303,950 303,950 Agusan del Sur 689,950 678,150 660,250 660,250 684,250 Dinagat Islands 438 438 Surigao del Norte 8,500 4,000 3,500 3,062 2,412 Surigao del Sur 349,600 340,600 339,500 318,200 318,200
ARMM 2,077,882 2,149,329 2,149,389 2,467,574 2,462,421 Basilan 64,737 65,384 65,384 69,384 64,241 Lanao del Sur 485,000 485,000 486,000 476,000 476,000 Maguindanao 1,454,816 1,525,755 1,525,755 1,850,000 1,850,000 Sulu 55,300 55,100 54,200 54,200 54,280 Tawi-tawi 18,029 18,090 18,050 17,990 17,900
R/ - Revised due to inclusion of Batanes data.
Note: Dinagat Islands data dissagregated from Surigao del Norte.
Table 93. LAKATAN BANANA: NUMBER OF BEARING HILLS …Continued
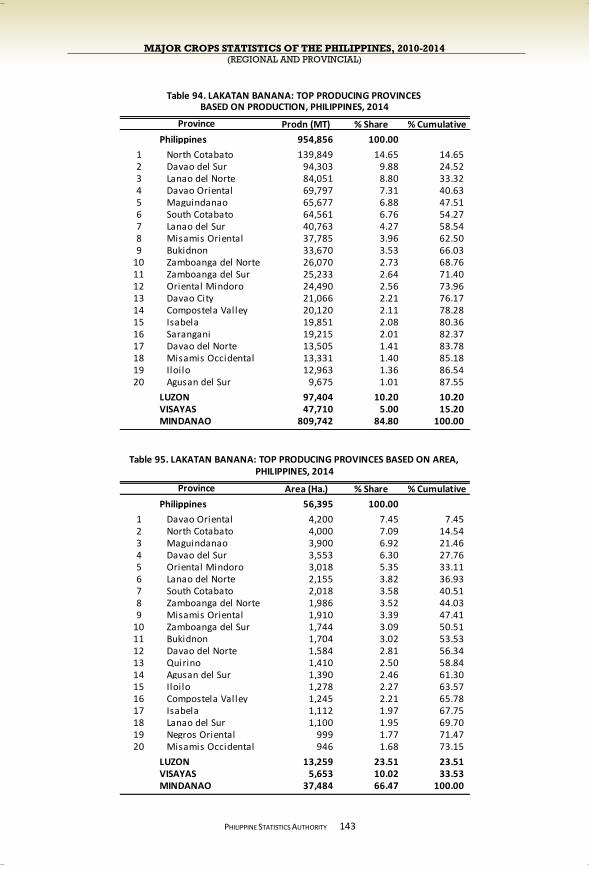
MAJOR CROPS STATISTICS OF THE PHILIPPINES, 2010-2014 (REGIONAL AND PROVINCIAL)
PHILIPPINE STATISTICS AUTHORITY
143
Prodn (MT) % Share % Cumulative
Philippines 954,856 100.00
1 North Cotabato 139,849 14.65 14.65 2 Davao del Sur 94,303 9.88 24.52 3 Lanao del Norte 84,051 8.80 33.32 4 Davao Oriental 69,797 7.31 40.63 5 Maguindanao 65,677 6.88 47.51 6 South Cotabato 64,561 6.76 54.27 7 Lanao del Sur 40,763 4.27 58.54 8 Misamis Oriental 37,785 3.96 62.50 9 Bukidnon 33,670 3.53 66.03
10 Zamboanga del Norte 26,070 2.73 68.76 11 Zamboanga del Sur 25,233 2.64 71.40 12 Oriental Mindoro 24,490 2.56 73.96 13 Davao City 21,066 2.21 76.17 14 Compostela Valley 20,120 2.11 78.28 15 Isabela 19,851 2.08 80.36 16 Sarangani 19,215 2.01 82.37 17 Davao del Norte 13,505 1.41 83.78 18 Misamis Occidental 13,331 1.40 85.18 19 Iloilo 12,963 1.36 86.54 20 Agusan del Sur 9,675 1.01 87.55
LUZON 97,404 10.20 10.20 VISAYAS 47,710 5.00 15.20 MINDANAO 809,742 84.80 100.00
Area (Ha.) % Share % Cumulative
Philippines 56,395 100.00
1 Davao Oriental 4,200 7.45 7.45 2 North Cotabato 4,000 7.09 14.54 3 Maguindanao 3,900 6.92 21.46 4 Davao del Sur 3,553 6.30 27.76 5 Oriental Mindoro 3,018 5.35 33.11 6 Lanao del Norte 2,155 3.82 36.93 7 South Cotabato 2,018 3.58 40.51 8 Zamboanga del Norte 1,986 3.52 44.03 9 Misamis Oriental 1,910 3.39 47.41
10 Zamboanga del Sur 1,744 3.09 50.51 11 Bukidnon 1,704 3.02 53.53 12 Davao del Norte 1,584 2.81 56.34 13 Quirino 1,410 2.50 58.84 14 Agusan del Sur 1,390 2.46 61.30 15 Iloilo 1,278 2.27 63.57 16 Compostela Valley 1,245 2.21 65.78 17 Isabela 1,112 1.97 67.75 18 Lanao del Sur 1,100 1.95 69.70 19 Negros Oriental 999 1.77 71.47 20 Misamis Occidental 946 1.68 73.15
LUZON 13,259 23.51 23.51 VISAYAS 5,653 10.02 33.53 MINDANAO 37,484 66.47 100.00
Province
Table 94. LAKATAN BANANA: TOP PRODUCING PROVINCES
Table 95. LAKATAN BANANA: TOP PRODUCING PROVINCES BASED ON AREA,
Province
PHILIPPINES, 2014
BASED ON PRODUCTION, PHILIPPINES, 2014
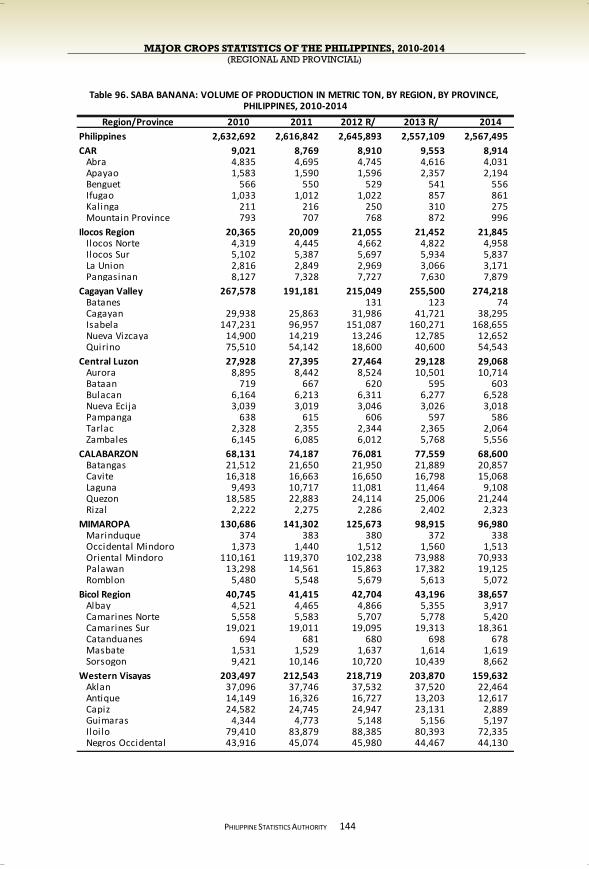
MAJOR CROPS STATISTICS OF THE PHILIPPINES, 2010-2014 (REGIONAL AND PROVINCIAL)
PHILIPPINE STATISTICS AUTHORITY
144
Region/Province 2010 2011 2012 R/ 2013 R/ 2014
Philippines 2,632,692 2,616,842 2,645,893 2,557,109 2,567,495
CAR 9,021 8,769 8,910 9,553 8,914 Abra 4,835 4,695 4,745 4,616 4,031 Apayao 1,583 1,590 1,596 2,357 2,194 Benguet 566 550 529 541 556 Ifugao 1,033 1,012 1,022 857 861 Kalinga 211 216 250 310 275 Mountain Province 793 707 768 872 996
Ilocos Region 20,365 20,009 21,055 21,452 21,845 Ilocos Norte 4,319 4,445 4,662 4,822 4,958 Ilocos Sur 5,102 5,387 5,697 5,934 5,837 La Union 2,816 2,849 2,969 3,066 3,171 Pangasinan 8,127 7,328 7,727 7,630 7,879
Cagayan Valley 267,578 191,181 215,049 255,500 274,218 Batanes 131 123 74 Cagayan 29,938 25,863 31,986 41,721 38,295 Isabela 147,231 96,957 151,087 160,271 168,655 Nueva Vizcaya 14,900 14,219 13,246 12,785 12,652 Quirino 75,510 54,142 18,600 40,600 54,543
Central Luzon 27,928 27,395 27,464 29,128 29,068 Aurora 8,895 8,442 8,524 10,501 10,714 Bataan 719 667 620 595 603 Bulacan 6,164 6,213 6,311 6,277 6,528 Nueva Ecija 3,039 3,019 3,046 3,026 3,018 Pampanga 638 615 606 597 586 Tarlac 2,328 2,355 2,344 2,365 2,064 Zambales 6,145 6,085 6,012 5,768 5,556
CALABARZON 68,131 74,187 76,081 77,559 68,600 Batangas 21,512 21,650 21,950 21,889 20,857 Cavite 16,318 16,663 16,650 16,798 15,068 Laguna 9,493 10,717 11,081 11,464 9,108 Quezon 18,585 22,883 24,114 25,006 21,244 Rizal 2,222 2,275 2,286 2,402 2,323
MIMAROPA 130,686 141,302 125,673 98,915 96,980 Marinduque 374 383 380 372 338 Occidental Mindoro 1,373 1,440 1,512 1,560 1,513 Oriental Mindoro 110,161 119,370 102,238 73,988 70,933 Palawan 13,298 14,561 15,863 17,382 19,125 Romblon 5,480 5,548 5,679 5,613 5,072
Bicol Region 40,745 41,415 42,704 43,196 38,657 Albay 4,521 4,465 4,866 5,355 3,917 Camarines Norte 5,558 5,583 5,707 5,778 5,420 Camarines Sur 19,021 19,011 19,095 19,313 18,361 Catanduanes 694 681 680 698 678 Masbate 1,531 1,529 1,637 1,614 1,619 Sorsogon 9,421 10,146 10,720 10,439 8,662
Western Visayas 203,497 212,543 218,719 203,870 159,632 Aklan 37,096 37,746 37,532 37,520 22,464 Antique 14,149 16,326 16,727 13,203 12,617 Capiz 24,582 24,745 24,947 23,131 2,889 Guimaras 4,344 4,773 5,148 5,156 5,197 Iloilo 79,410 83,879 88,385 80,393 72,335 Negros Occidental 43,916 45,074 45,980 44,467 44,130
PHILIPPINES, 2010-2014Table 96. SABA BANANA: VOLUME OF PRODUCTION IN METRIC TON, BY REGION, BY PROVINCE,

MAJOR CROPS STATISTICS OF THE PHILIPPINES, 2010-2014 (REGIONAL AND PROVINCIAL)
PHILIPPINE STATISTICS AUTHORITY
145
Region/Province 2010 2011 2012 R/ 2013 R/ 2014
Central Visayas 122,977 133,067 135,700 123,176 123,472 Bohol 28,611 30,056 31,368 29,369 20,669 Cebu 34,440 39,659 40,893 39,265 42,454 Negros Oriental 45,492 48,537 48,979 45,943 48,102 Siquijor 14,435 14,816 14,459 8,600 12,247
Eastern Visayas 182,217 181,739 183,557 169,427 145,577 Bil iran 10,714 10,716 10,720 9,262 7,301 Eastern Samar 2,462 2,383 2,502 2,393 1,880 Leyte 28,890 28,444 28,270 25,090 12,916 Northern Samar 7,137 7,364 7,696 8,447 8,790 Samar 95,125 95,010 95,094 85,070 77,644 Southern Leyte 37,890 37,822 39,275 39,164 37,046
Zamboanga Peninsula 143,631 131,131 131,884 138,878 147,029 Zamboanga del Norte 68,052 55,284 50,906 48,825 49,723 Zamboanga del Sur 25,877 25,614 29,699 37,165 40,928 Zamboanga Sibugay 12,244 12,390 12,708 12,907 14,039 Zamboanga City 37,457 37,843 38,570 39,982 42,339
Northern Mindanao 269,395 291,200 294,605 295,656 302,445 Bukidnon 20,970 20,915 20,875 20,770 21,085 Camiguin 4,779 4,850 4,577 4,253 4,232 Lanao del Norte 156,938 160,903 154,569 153,414 154,958 Misamis Occidental 35,865 41,116 43,160 46,728 51,664 Misamis Oriental 50,843 63,416 71,424 70,491 70,506
Davao Region 579,465 582,529 571,431 487,433 522,808 Davao del Norte 45,377 47,041 47,724 47,720 48,913 Davao del Sur 272,412 273,088 270,946 271,165 275,939 Davao Oriental 73,182 76,105 78,163 72,826 78,706 Compostela Valley 166,083 164,231 152,904 74,201 97,427 Davao City 22,411 22,065 21,694 21,520 21,823
SOCCSKSARGEN 321,523 334,401 348,477 356,727 369,172 North Cotabato 246,170 255,838 265,982 272,733 274,921 Sarangani 28,524 31,587 35,884 37,780 39,014 South Cotabato 27,176 28,149 28,951 29,466 29,680 Sultan Kudarat 19,653 18,826 17,660 16,749 25,557
Caraga 114,201 111,911 108,041 101,025 99,909 Agusan del Norte 54,645 50,365 43,486 39,176 36,787 Agusan del Sur 23,785 29,030 35,321 31,249 32,853 Dinagat Islands 312 215 Surigao del Norte 7,483 6,843 5,204 6,229 5,549 Surigao del Sur 28,288 25,673 24,030 24,059 24,505
ARMM 131,333 134,063 136,544 145,613 159,168 Basilan 14,532 14,814 14,123 13,517 13,886 Lanao del Sur 27,410 27,140 27,149 27,983 28,229 Maguindanao 74,491 77,976 81,292 90,879 103,909 Sulu 10,831 10,030 10,028 9,414 9,388 Tawi-tawi 4,069 4,103 3,952 3,821 3,757
R/ - Revised due to inclusion of Batanes data.
Note: Dinagat Islands data dissagregated from Surigao del Norte.
Table 96. SABA BANANA: VOLUME OF PRODUCTION IN METRIC TON …Continued
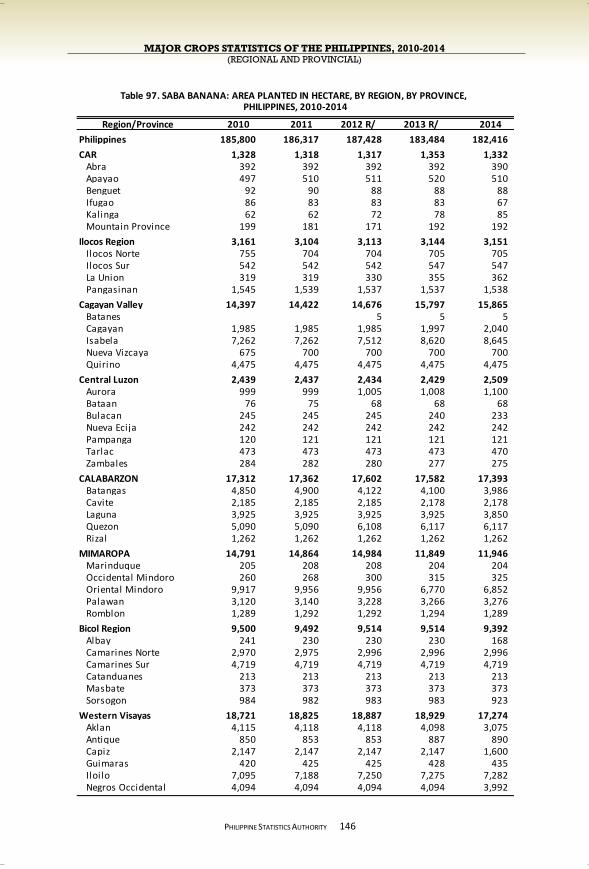
MAJOR CROPS STATISTICS OF THE PHILIPPINES, 2010-2014 (REGIONAL AND PROVINCIAL)
PHILIPPINE STATISTICS AUTHORITY
146
Region/Province 2010 2011 2012 R/ 2013 R/ 2014
Philippines 185,800 186,317 187,428 183,484 182,416
CAR 1,328 1,318 1,317 1,353 1,332 Abra 392 392 392 392 390 Apayao 497 510 511 520 510 Benguet 92 90 88 88 88 Ifugao 86 83 83 83 67 Kalinga 62 62 72 78 85 Mountain Province 199 181 171 192 192
Ilocos Region 3,161 3,104 3,113 3,144 3,151 Ilocos Norte 755 704 704 705 705 Ilocos Sur 542 542 542 547 547 La Union 319 319 330 355 362 Pangasinan 1,545 1,539 1,537 1,537 1,538
Cagayan Valley 14,397 14,422 14,676 15,797 15,865 Batanes 5 5 5 Cagayan 1,985 1,985 1,985 1,997 2,040 Isabela 7,262 7,262 7,512 8,620 8,645 Nueva Vizcaya 675 700 700 700 700 Quirino 4,475 4,475 4,475 4,475 4,475
Central Luzon 2,439 2,437 2,434 2,429 2,509 Aurora 999 999 1,005 1,008 1,100 Bataan 76 75 68 68 68 Bulacan 245 245 245 240 233 Nueva Ecija 242 242 242 242 242 Pampanga 120 121 121 121 121 Tarlac 473 473 473 473 470 Zambales 284 282 280 277 275
CALABARZON 17,312 17,362 17,602 17,582 17,393 Batangas 4,850 4,900 4,122 4,100 3,986 Cavite 2,185 2,185 2,185 2,178 2,178 Laguna 3,925 3,925 3,925 3,925 3,850 Quezon 5,090 5,090 6,108 6,117 6,117 Rizal 1,262 1,262 1,262 1,262 1,262
MIMAROPA 14,791 14,864 14,984 11,849 11,946 Marinduque 205 208 208 204 204 Occidental Mindoro 260 268 300 315 325 Oriental Mindoro 9,917 9,956 9,956 6,770 6,852 Palawan 3,120 3,140 3,228 3,266 3,276 Romblon 1,289 1,292 1,292 1,294 1,289
Bicol Region 9,500 9,492 9,514 9,514 9,392 Albay 241 230 230 230 168 Camarines Norte 2,970 2,975 2,996 2,996 2,996 Camarines Sur 4,719 4,719 4,719 4,719 4,719 Catanduanes 213 213 213 213 213 Masbate 373 373 373 373 373 Sorsogon 984 982 983 983 923
Western Visayas 18,721 18,825 18,887 18,929 17,274 Aklan 4,115 4,118 4,118 4,098 3,075 Antique 850 853 853 887 890 Capiz 2,147 2,147 2,147 2,147 1,600 Guimaras 420 425 425 428 435 Iloilo 7,095 7,188 7,250 7,275 7,282 Negros Occidental 4,094 4,094 4,094 4,094 3,992
PHILIPPINES, 2010-2014Table 97. SABA BANANA: AREA PLANTED IN HECTARE, BY REGION, BY PROVINCE,
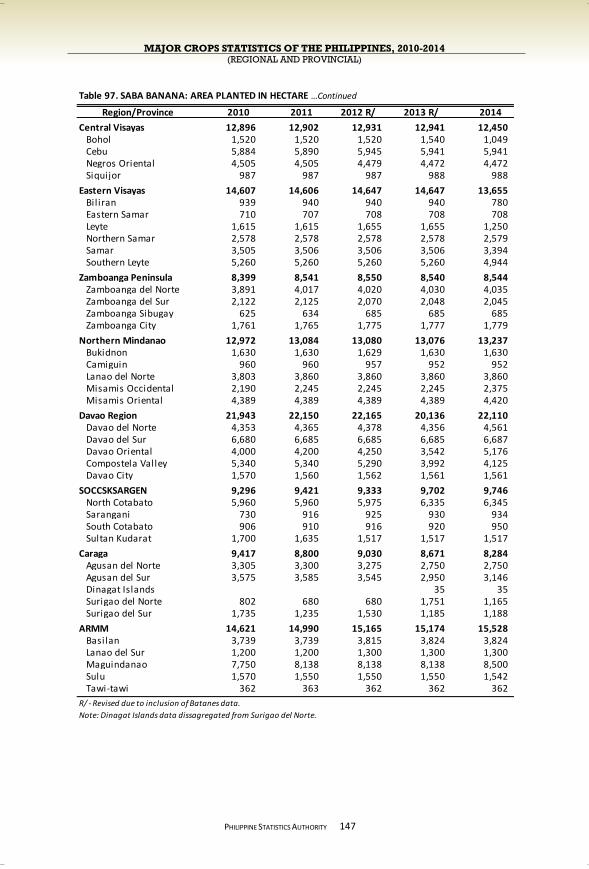
MAJOR CROPS STATISTICS OF THE PHILIPPINES, 2010-2014 (REGIONAL AND PROVINCIAL)
PHILIPPINE STATISTICS AUTHORITY
147
Region/Province 2010 2011 2012 R/ 2013 R/ 2014
Central Visayas 12,896 12,902 12,931 12,941 12,450 Bohol 1,520 1,520 1,520 1,540 1,049 Cebu 5,884 5,890 5,945 5,941 5,941 Negros Oriental 4,505 4,505 4,479 4,472 4,472 Siquijor 987 987 987 988 988
Eastern Visayas 14,607 14,606 14,647 14,647 13,655 Bil iran 939 940 940 940 780 Eastern Samar 710 707 708 708 708 Leyte 1,615 1,615 1,655 1,655 1,250 Northern Samar 2,578 2,578 2,578 2,578 2,579 Samar 3,505 3,506 3,506 3,506 3,394 Southern Leyte 5,260 5,260 5,260 5,260 4,944
Zamboanga Peninsula 8,399 8,541 8,550 8,540 8,544 Zamboanga del Norte 3,891 4,017 4,020 4,030 4,035 Zamboanga del Sur 2,122 2,125 2,070 2,048 2,045 Zamboanga Sibugay 625 634 685 685 685 Zamboanga City 1,761 1,765 1,775 1,777 1,779
Northern Mindanao 12,972 13,084 13,080 13,076 13,237 Bukidnon 1,630 1,630 1,629 1,630 1,630 Camiguin 960 960 957 952 952 Lanao del Norte 3,803 3,860 3,860 3,860 3,860 Misamis Occidental 2,190 2,245 2,245 2,245 2,375 Misamis Oriental 4,389 4,389 4,389 4,389 4,420
Davao Region 21,943 22,150 22,165 20,136 22,110 Davao del Norte 4,353 4,365 4,378 4,356 4,561 Davao del Sur 6,680 6,685 6,685 6,685 6,687 Davao Oriental 4,000 4,200 4,250 3,542 5,176 Compostela Valley 5,340 5,340 5,290 3,992 4,125 Davao City 1,570 1,560 1,562 1,561 1,561
SOCCSKSARGEN 9,296 9,421 9,333 9,702 9,746 North Cotabato 5,960 5,960 5,975 6,335 6,345 Sarangani 730 916 925 930 934 South Cotabato 906 910 916 920 950 Sultan Kudarat 1,700 1,635 1,517 1,517 1,517
Caraga 9,417 8,800 9,030 8,671 8,284 Agusan del Norte 3,305 3,300 3,275 2,750 2,750 Agusan del Sur 3,575 3,585 3,545 2,950 3,146 Dinagat Islands 35 35 Surigao del Norte 802 680 680 1,751 1,165 Surigao del Sur 1,735 1,235 1,530 1,185 1,188
ARMM 14,621 14,990 15,165 15,174 15,528 Basilan 3,739 3,739 3,815 3,824 3,824 Lanao del Sur 1,200 1,200 1,300 1,300 1,300 Maguindanao 7,750 8,138 8,138 8,138 8,500 Sulu 1,570 1,550 1,550 1,550 1,542 Tawi-tawi 362 363 362 362 362
R/ - Revised due to inclusion of Batanes data.
Note: Dinagat Islands data dissagregated from Surigao del Norte.
Table 97. SABA BANANA: AREA PLANTED IN HECTARE …Continued
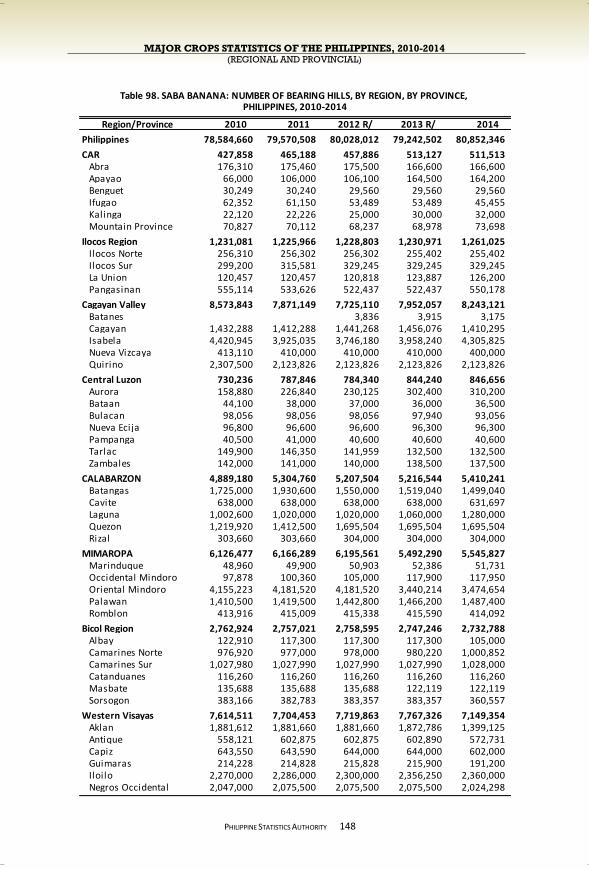
MAJOR CROPS STATISTICS OF THE PHILIPPINES, 2010-2014 (REGIONAL AND PROVINCIAL)
PHILIPPINE STATISTICS AUTHORITY
148
Region/Province 2010 2011 2012 R/ 2013 R/ 2014
Philippines 78,584,660 79,570,508 80,028,012 79,242,502 80,852,346
CAR 427,858 465,188 457,886 513,127 511,513 Abra 176,310 175,460 175,500 166,600 166,600 Apayao 66,000 106,000 106,100 164,500 164,200 Benguet 30,249 30,240 29,560 29,560 29,560 Ifugao 62,352 61,150 53,489 53,489 45,455 Kalinga 22,120 22,226 25,000 30,000 32,000 Mountain Province 70,827 70,112 68,237 68,978 73,698
Ilocos Region 1,231,081 1,225,966 1,228,803 1,230,971 1,261,025 Ilocos Norte 256,310 256,302 256,302 255,402 255,402 Ilocos Sur 299,200 315,581 329,245 329,245 329,245 La Union 120,457 120,457 120,818 123,887 126,200 Pangasinan 555,114 533,626 522,437 522,437 550,178
Cagayan Valley 8,573,843 7,871,149 7,725,110 7,952,057 8,243,121 Batanes 3,836 3,915 3,175 Cagayan 1,432,288 1,412,288 1,441,268 1,456,076 1,410,295 Isabela 4,420,945 3,925,035 3,746,180 3,958,240 4,305,825 Nueva Vizcaya 413,110 410,000 410,000 410,000 400,000 Quirino 2,307,500 2,123,826 2,123,826 2,123,826 2,123,826
Central Luzon 730,236 787,846 784,340 844,240 846,656 Aurora 158,880 226,840 230,125 302,400 310,200 Bataan 44,100 38,000 37,000 36,000 36,500 Bulacan 98,056 98,056 98,056 97,940 93,056 Nueva Ecija 96,800 96,600 96,600 96,300 96,300 Pampanga 40,500 41,000 40,600 40,600 40,600 Tarlac 149,900 146,350 141,959 132,500 132,500 Zambales 142,000 141,000 140,000 138,500 137,500
CALABARZON 4,889,180 5,304,760 5,207,504 5,216,544 5,410,241 Batangas 1,725,000 1,930,600 1,550,000 1,519,040 1,499,040 Cavite 638,000 638,000 638,000 638,000 631,697 Laguna 1,002,600 1,020,000 1,020,000 1,060,000 1,280,000 Quezon 1,219,920 1,412,500 1,695,504 1,695,504 1,695,504 Rizal 303,660 303,660 304,000 304,000 304,000
MIMAROPA 6,126,477 6,166,289 6,195,561 5,492,290 5,545,827 Marinduque 48,960 49,900 50,903 52,386 51,731 Occidental Mindoro 97,878 100,360 105,000 117,900 117,950 Oriental Mindoro 4,155,223 4,181,520 4,181,520 3,440,214 3,474,654 Palawan 1,410,500 1,419,500 1,442,800 1,466,200 1,487,400 Romblon 413,916 415,009 415,338 415,590 414,092
Bicol Region 2,762,924 2,757,021 2,758,595 2,747,246 2,732,788 Albay 122,910 117,300 117,300 117,300 105,000 Camarines Norte 976,920 977,000 978,000 980,220 1,000,852 Camarines Sur 1,027,980 1,027,990 1,027,990 1,027,990 1,028,000 Catanduanes 116,260 116,260 116,260 116,260 116,260 Masbate 135,688 135,688 135,688 122,119 122,119 Sorsogon 383,166 382,783 383,357 383,357 360,557
Western Visayas 7,614,511 7,704,453 7,719,863 7,767,326 7,149,354 Aklan 1,881,612 1,881,660 1,881,660 1,872,786 1,399,125 Antique 558,121 602,875 602,875 602,890 572,731 Capiz 643,550 643,590 644,000 644,000 602,000 Guimaras 214,228 214,828 215,828 215,900 191,200 Iloilo 2,270,000 2,286,000 2,300,000 2,356,250 2,360,000 Negros Occidental 2,047,000 2,075,500 2,075,500 2,075,500 2,024,298
Table 98. SABA BANANA: NUMBER OF BEARING HILLS, BY REGION, BY PROVINCE, PHILIPPINES, 2010-2014
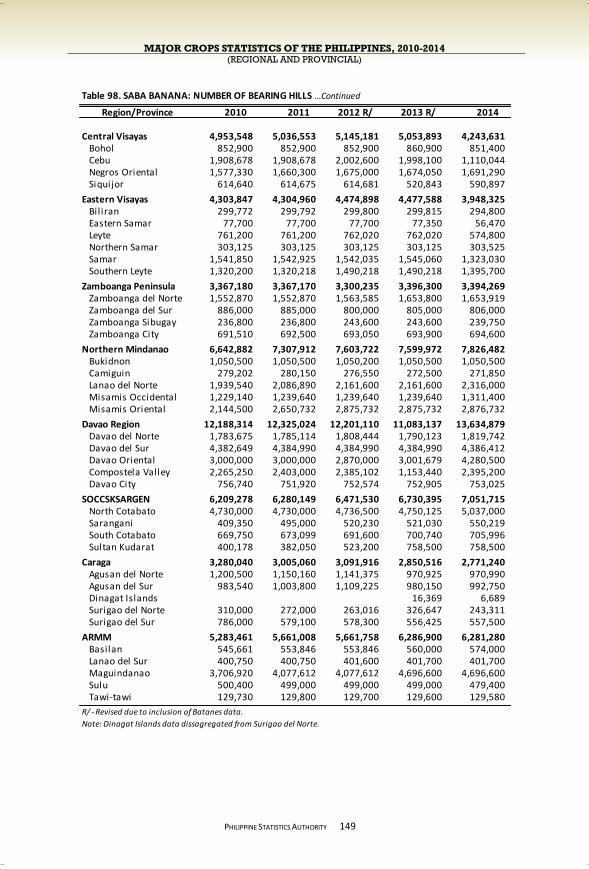
MAJOR CROPS STATISTICS OF THE PHILIPPINES, 2010-2014 (REGIONAL AND PROVINCIAL)
PHILIPPINE STATISTICS AUTHORITY
149
Region/Province 2010 2011 2012 R/ 2013 R/ 2014
Central Visayas 4,953,548 5,036,553 5,145,181 5,053,893 4,243,631 Bohol 852,900 852,900 852,900 860,900 851,400 Cebu 1,908,678 1,908,678 2,002,600 1,998,100 1,110,044 Negros Oriental 1,577,330 1,660,300 1,675,000 1,674,050 1,691,290 Siquijor 614,640 614,675 614,681 520,843 590,897
Eastern Visayas 4,303,847 4,304,960 4,474,898 4,477,588 3,948,325 Bil iran 299,772 299,792 299,800 299,815 294,800 Eastern Samar 77,700 77,700 77,700 77,350 56,470 Leyte 761,200 761,200 762,020 762,020 574,800 Northern Samar 303,125 303,125 303,125 303,125 303,525 Samar 1,541,850 1,542,925 1,542,035 1,545,060 1,323,030 Southern Leyte 1,320,200 1,320,218 1,490,218 1,490,218 1,395,700
Zamboanga Peninsula 3,367,180 3,367,170 3,300,235 3,396,300 3,394,269 Zamboanga del Norte 1,552,870 1,552,870 1,563,585 1,653,800 1,653,919 Zamboanga del Sur 886,000 885,000 800,000 805,000 806,000 Zamboanga Sibugay 236,800 236,800 243,600 243,600 239,750 Zamboanga City 691,510 692,500 693,050 693,900 694,600
Northern Mindanao 6,642,882 7,307,912 7,603,722 7,599,972 7,826,482 Bukidnon 1,050,500 1,050,500 1,050,200 1,050,500 1,050,500 Camiguin 279,202 280,150 276,550 272,500 271,850 Lanao del Norte 1,939,540 2,086,890 2,161,600 2,161,600 2,316,000 Misamis Occidental 1,229,140 1,239,640 1,239,640 1,239,640 1,311,400 Misamis Oriental 2,144,500 2,650,732 2,875,732 2,875,732 2,876,732
Davao Region 12,188,314 12,325,024 12,201,110 11,083,137 13,634,879 Davao del Norte 1,783,675 1,785,114 1,808,444 1,790,123 1,819,742 Davao del Sur 4,382,649 4,384,990 4,384,990 4,384,990 4,386,412 Davao Oriental 3,000,000 3,000,000 2,870,000 3,001,679 4,280,500 Compostela Valley 2,265,250 2,403,000 2,385,102 1,153,440 2,395,200 Davao City 756,740 751,920 752,574 752,905 753,025
SOCCSKSARGEN 6,209,278 6,280,149 6,471,530 6,730,395 7,051,715 North Cotabato 4,730,000 4,730,000 4,736,500 4,750,125 5,037,000 Sarangani 409,350 495,000 520,230 521,030 550,219 South Cotabato 669,750 673,099 691,600 700,740 705,996 Sultan Kudarat 400,178 382,050 523,200 758,500 758,500
Caraga 3,280,040 3,005,060 3,091,916 2,850,516 2,771,240 Agusan del Norte 1,200,500 1,150,160 1,141,375 970,925 970,990 Agusan del Sur 983,540 1,003,800 1,109,225 980,150 992,750 Dinagat Islands 16,369 6,689 Surigao del Norte 310,000 272,000 263,016 326,647 243,311 Surigao del Sur 786,000 579,100 578,300 556,425 557,500
ARMM 5,283,461 5,661,008 5,661,758 6,286,900 6,281,280 Basilan 545,661 553,846 553,846 560,000 574,000 Lanao del Sur 400,750 400,750 401,600 401,700 401,700 Maguindanao 3,706,920 4,077,612 4,077,612 4,696,600 4,696,600 Sulu 500,400 499,000 499,000 499,000 479,400 Tawi-tawi 129,730 129,800 129,700 129,600 129,580
R/ - Revised due to inclusion of Batanes data.
Note: Dinagat Islands data dissagregated from Surigao del Norte.
Table 98. SABA BANANA: NUMBER OF BEARING HILLS …Continued
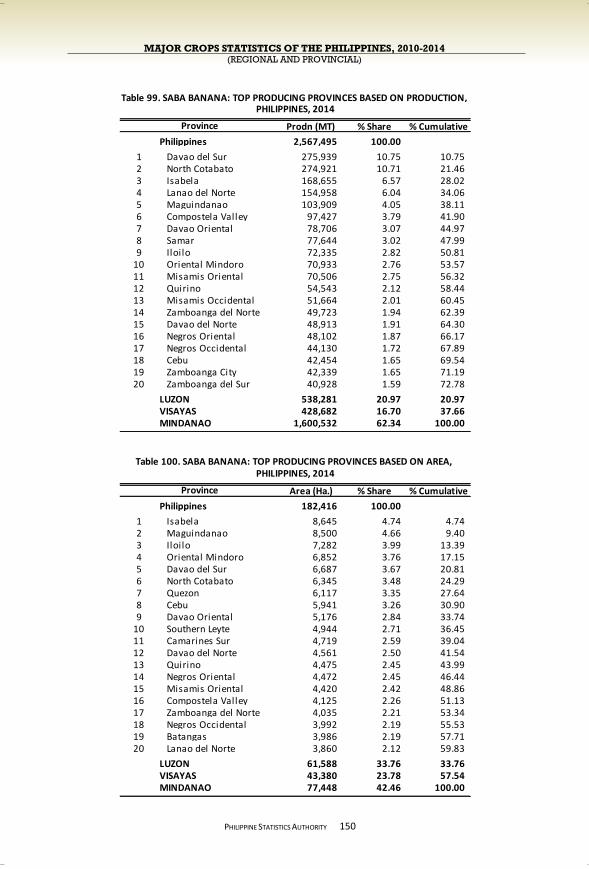
MAJOR CROPS STATISTICS OF THE PHILIPPINES, 2010-2014 (REGIONAL AND PROVINCIAL)
PHILIPPINE STATISTICS AUTHORITY
1500
Prodn (MT) % Share % Cumulative
Philippines 2,567,495 100.00
1 Davao del Sur 275,939 10.75 10.75 2 North Cotabato 274,921 10.71 21.46 3 Isabela 168,655 6.57 28.02 4 Lanao del Norte 154,958 6.04 34.06 5 Maguindanao 103,909 4.05 38.11 6 Compostela Valley 97,427 3.79 41.90 7 Davao Oriental 78,706 3.07 44.97 8 Samar 77,644 3.02 47.99 9 Iloilo 72,335 2.82 50.81
10 Oriental Mindoro 70,933 2.76 53.57 11 Misamis Oriental 70,506 2.75 56.32 12 Quirino 54,543 2.12 58.44 13 Misamis Occidental 51,664 2.01 60.45 14 Zamboanga del Norte 49,723 1.94 62.39 15 Davao del Norte 48,913 1.91 64.30 16 Negros Oriental 48,102 1.87 66.17 17 Negros Occidental 44,130 1.72 67.89 18 Cebu 42,454 1.65 69.54 19 Zamboanga City 42,339 1.65 71.19 20 Zamboanga del Sur 40,928 1.59 72.78
LUZON 538,281 20.97 20.97 VISAYAS 428,682 16.70 37.66 MINDANAO 1,600,532 62.34 100.00
Area (Ha.) % Share % Cumulative
Philippines 182,416 100.00
1 Isabela 8,645 4.74 4.74 2 Maguindanao 8,500 4.66 9.40 3 Iloilo 7,282 3.99 13.39 4 Oriental Mindoro 6,852 3.76 17.15 5 Davao del Sur 6,687 3.67 20.81 6 North Cotabato 6,345 3.48 24.29 7 Quezon 6,117 3.35 27.64 8 Cebu 5,941 3.26 30.90 9 Davao Oriental 5,176 2.84 33.74
10 Southern Leyte 4,944 2.71 36.45 11 Camarines Sur 4,719 2.59 39.04 12 Davao del Norte 4,561 2.50 41.54 13 Quirino 4,475 2.45 43.99 14 Negros Oriental 4,472 2.45 46.44 15 Misamis Oriental 4,420 2.42 48.86 16 Compostela Valley 4,125 2.26 51.13 17 Zamboanga del Norte 4,035 2.21 53.34 18 Negros Occidental 3,992 2.19 55.53 19 Batangas 3,986 2.19 57.71 20 Lanao del Norte 3,860 2.12 59.83
LUZON 61,588 33.76 33.76 VISAYAS 43,380 23.78 57.54 MINDANAO 77,448 42.46 100.00
Province
Table 99. SABA BANANA: TOP PRODUCING PROVINCES BASED ON PRODUCTION,
Table 100. SABA BANANA: TOP PRODUCING PROVINCES BASED ON AREA,
Province
PHILIPPINES, 2014
PHILIPPINES, 2014

MAJOR CROPS STATISTICS OF THE PHILIPPINES, 2010-2014 (REGIONAL AND PROVINCIAL)
PHILIPPINE STATISTICS AUTHORITY
CALAMANSI
Calamansi production in the country continuously decreased over the last five years. From the 188.34 thousand mt output in 2010, it decreased to 160.74 thousand mt in 2014 at an average annual rate of 3.9 percent. In the same period, both area planted and number of bearing trees had negative growths of 1.1 percent. The production in 2014 posted 160.74 thousand mt which was lower by 2.0 percent from the 2013 level of 164.09 thousand mt.
Oriental Mindoro remained the top producer of calamansi at 82.66
thousand mt which shared 51.4 percent of the country’s total output in 2014 (Figure 35). This province registered the largest area at 5.90 thousand hectares or 29.4 percent of the national total (Figure 36).
151
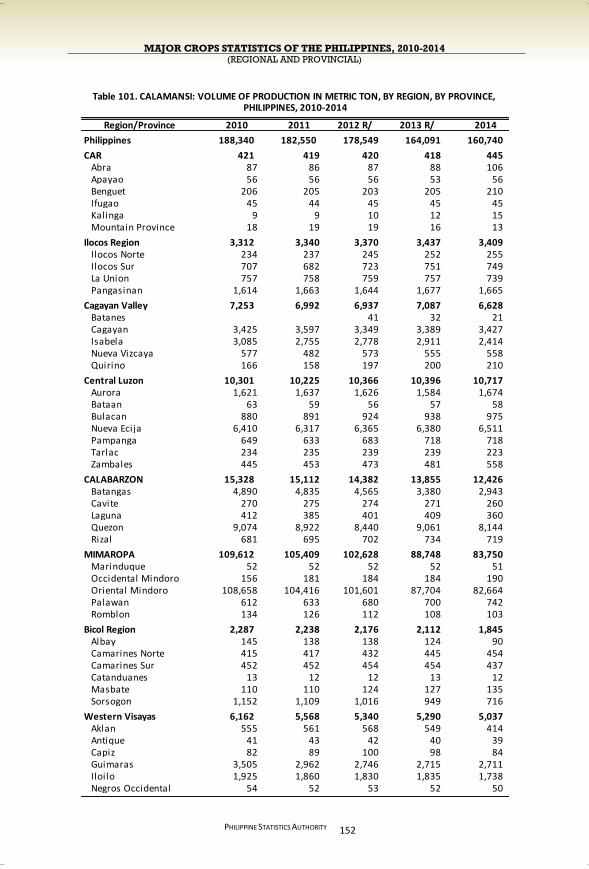
MAJOR CROPS STATISTICS OF THE PHILIPPINES, 2010-2014 (REGIONAL AND PROVINCIAL)
PHILIPPINE STATISTICS AUTHORITY
152
Region/Province 2010 2011 2012 R/ 2013 R/ 2014
Philippines 188,340 182,550 178,549 164,091 160,740
CAR 421 419 420 418 445 Abra 87 86 87 88 106 Apayao 56 56 56 53 56 Benguet 206 205 203 205 210 Ifugao 45 44 45 45 45 Kalinga 9 9 10 12 15 Mountain Province 18 19 19 16 13
Ilocos Region 3,312 3,340 3,370 3,437 3,409 Ilocos Norte 234 237 245 252 255 Ilocos Sur 707 682 723 751 749 La Union 757 758 759 757 739 Pangasinan 1,614 1,663 1,644 1,677 1,665
Cagayan Valley 7,253 6,992 6,937 7,087 6,628 Batanes 41 32 21 Cagayan 3,425 3,597 3,349 3,389 3,427 Isabela 3,085 2,755 2,778 2,911 2,414 Nueva Vizcaya 577 482 573 555 558 Quirino 166 158 197 200 210
Central Luzon 10,301 10,225 10,366 10,396 10,717 Aurora 1,621 1,637 1,626 1,584 1,674 Bataan 63 59 56 57 58 Bulacan 880 891 924 938 975 Nueva Ecija 6,410 6,317 6,365 6,380 6,511 Pampanga 649 633 683 718 718 Tarlac 234 235 239 239 223 Zambales 445 453 473 481 558
CALABARZON 15,328 15,112 14,382 13,855 12,426 Batangas 4,890 4,835 4,565 3,380 2,943 Cavite 270 275 274 271 260 Laguna 412 385 401 409 360 Quezon 9,074 8,922 8,440 9,061 8,144 Rizal 681 695 702 734 719
MIMAROPA 109,612 105,409 102,628 88,748 83,750 Marinduque 52 52 52 52 51 Occidental Mindoro 156 181 184 184 190 Oriental Mindoro 108,658 104,416 101,601 87,704 82,664 Palawan 612 633 680 700 742 Romblon 134 126 112 108 103
Bicol Region 2,287 2,238 2,176 2,112 1,845 Albay 145 138 138 124 90 Camarines Norte 415 417 432 445 454 Camarines Sur 452 452 454 454 437 Catanduanes 13 12 12 13 12 Masbate 110 110 124 127 135 Sorsogon 1,152 1,109 1,016 949 716
Western Visayas 6,162 5,568 5,340 5,290 5,037 Aklan 555 561 568 549 414 Antique 41 43 42 40 39 Capiz 82 89 100 98 84 Guimaras 3,505 2,962 2,746 2,715 2,711 Iloilo 1,925 1,860 1,830 1,835 1,738 Negros Occidental 54 52 53 52 50
PHILIPPINES, 2010-2014Table 101. CALAMANSI: VOLUME OF PRODUCTION IN METRIC TON, BY REGION, BY PROVINCE,
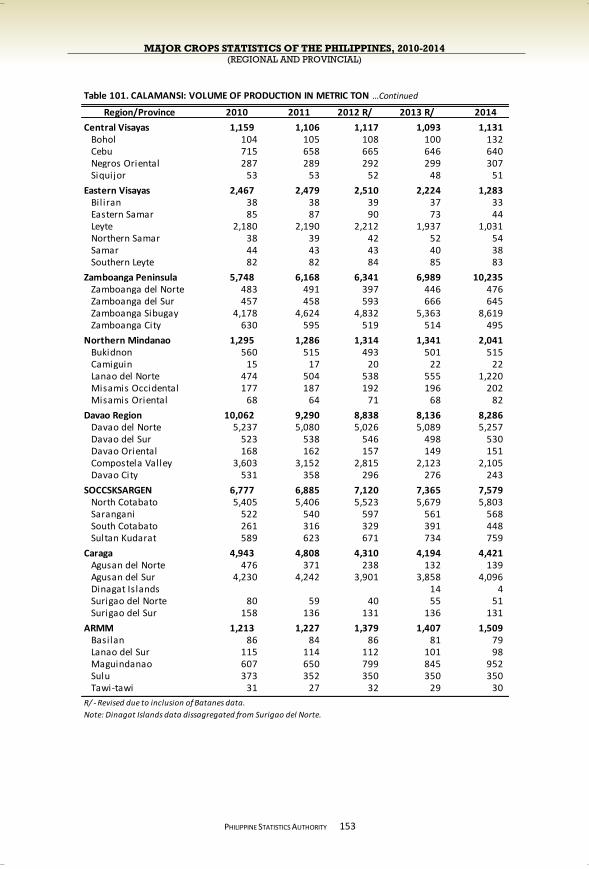
MAJOR CROPS STATISTICS OF THE PHILIPPINES, 2010-2014 (REGIONAL AND PROVINCIAL)
PHILIPPINE STATISTICS AUTHORITY
153
Region/Province 2010 2011 2012 R/ 2013 R/ 2014
Central Visayas 1,159 1,106 1,117 1,093 1,131 Bohol 104 105 108 100 132 Cebu 715 658 665 646 640 Negros Oriental 287 289 292 299 307 Siquijor 53 53 52 48 51
Eastern Visayas 2,467 2,479 2,510 2,224 1,283 Bil iran 38 38 39 37 33 Eastern Samar 85 87 90 73 44 Leyte 2,180 2,190 2,212 1,937 1,031 Northern Samar 38 39 42 52 54 Samar 44 43 43 40 38 Southern Leyte 82 82 84 85 83
Zamboanga Peninsula 5,748 6,168 6,341 6,989 10,235 Zamboanga del Norte 483 491 397 446 476 Zamboanga del Sur 457 458 593 666 645 Zamboanga Sibugay 4,178 4,624 4,832 5,363 8,619 Zamboanga City 630 595 519 514 495
Northern Mindanao 1,295 1,286 1,314 1,341 2,041 Bukidnon 560 515 493 501 515 Camiguin 15 17 20 22 22 Lanao del Norte 474 504 538 555 1,220 Misamis Occidental 177 187 192 196 202 Misamis Oriental 68 64 71 68 82
Davao Region 10,062 9,290 8,838 8,136 8,286 Davao del Norte 5,237 5,080 5,026 5,089 5,257 Davao del Sur 523 538 546 498 530 Davao Oriental 168 162 157 149 151 Compostela Valley 3,603 3,152 2,815 2,123 2,105 Davao City 531 358 296 276 243
SOCCSKSARGEN 6,777 6,885 7,120 7,365 7,579 North Cotabato 5,405 5,406 5,523 5,679 5,803 Sarangani 522 540 597 561 568 South Cotabato 261 316 329 391 448 Sultan Kudarat 589 623 671 734 759
Caraga 4,943 4,808 4,310 4,194 4,421 Agusan del Norte 476 371 238 132 139 Agusan del Sur 4,230 4,242 3,901 3,858 4,096 Dinagat Islands 14 4 Surigao del Norte 80 59 40 55 51 Surigao del Sur 158 136 131 136 131
ARMM 1,213 1,227 1,379 1,407 1,509 Basilan 86 84 86 81 79 Lanao del Sur 115 114 112 101 98 Maguindanao 607 650 799 845 952 Sulu 373 352 350 350 350 Tawi-tawi 31 27 32 29 30
R/ - Revised due to inclusion of Batanes data.
Note: Dinagat Islands data dissagregated from Surigao del Norte.
Table 101. CALAMANSI: VOLUME OF PRODUCTION IN METRIC TON …Continued
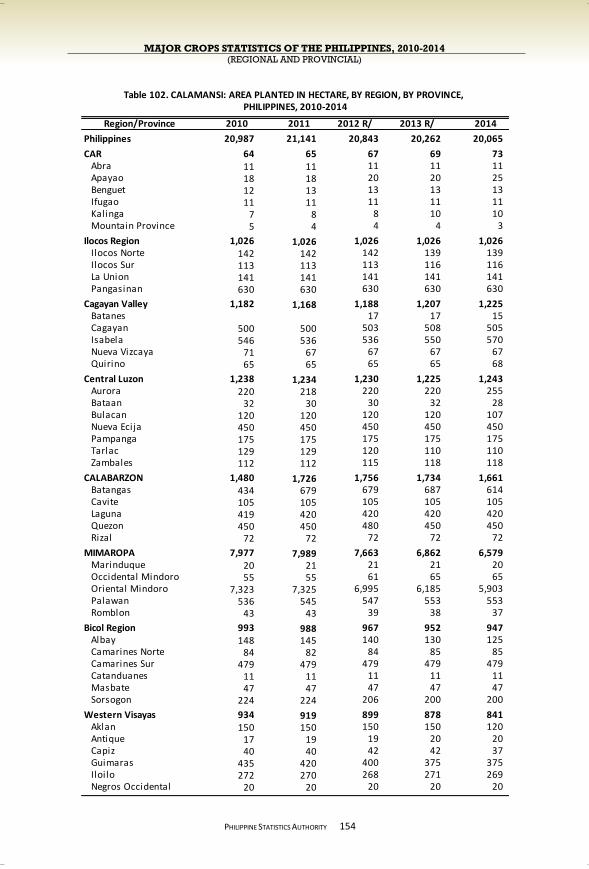
MAJOR CROPS STATISTICS OF THE PHILIPPINES, 2010-2014 (REGIONAL AND PROVINCIAL)
PHILIPPINE STATISTICS AUTHORITY
154
Region/Province 2010 2011 2012 R/ 2013 R/ 2014
Philippines 20,987 21,141 20,843 20,262 20,065
CAR 64 65 67 69 73 Abra 11 11 11 11 11 Apayao 18 18 20 20 25 Benguet 12 13 13 13 13 Ifugao 11 11 11 11 11 Kalinga 7 8 8 10 10 Mountain Province 5 4 4 4 3
Ilocos Region 1,026 1,026 1,026 1,026 1,026 Ilocos Norte 142 142 142 139 139 Ilocos Sur 113 113 113 116 116 La Union 141 141 141 141 141 Pangasinan 630 630 630 630 630
Cagayan Valley 1,182 1,168 1,188 1,207 1,225 Batanes 17 17 15 Cagayan 500 500 503 508 505 Isabela 546 536 536 550 570 Nueva Vizcaya 71 67 67 67 67 Quirino 65 65 65 65 68
Central Luzon 1,238 1,234 1,230 1,225 1,243 Aurora 220 218 220 220 255 Bataan 32 30 30 32 28 Bulacan 120 120 120 120 107 Nueva Ecija 450 450 450 450 450 Pampanga 175 175 175 175 175 Tarlac 129 129 120 110 110 Zambales 112 112 115 118 118
CALABARZON 1,480 1,726 1,756 1,734 1,661 Batangas 434 679 679 687 614 Cavite 105 105 105 105 105 Laguna 419 420 420 420 420 Quezon 450 450 480 450 450 Rizal 72 72 72 72 72
MIMAROPA 7,977 7,989 7,663 6,862 6,579 Marinduque 20 21 21 21 20 Occidental Mindoro 55 55 61 65 65 Oriental Mindoro 7,323 7,325 6,995 6,185 5,903 Palawan 536 545 547 553 553 Romblon 43 43 39 38 37
Bicol Region 993 988 967 952 947 Albay 148 145 140 130 125 Camarines Norte 84 82 84 85 85 Camarines Sur 479 479 479 479 479 Catanduanes 11 11 11 11 11 Masbate 47 47 47 47 47 Sorsogon 224 224 206 200 200
Western Visayas 934 919 899 878 841 Aklan 150 150 150 150 120 Antique 17 19 19 20 20 Capiz 40 40 42 42 37 Guimaras 435 420 400 375 375 Iloilo 272 270 268 271 269 Negros Occidental 20 20 20 20 20
PHILIPPINES, 2010-2014Table 102. CALAMANSI: AREA PLANTED IN HECTARE, BY REGION, BY PROVINCE,
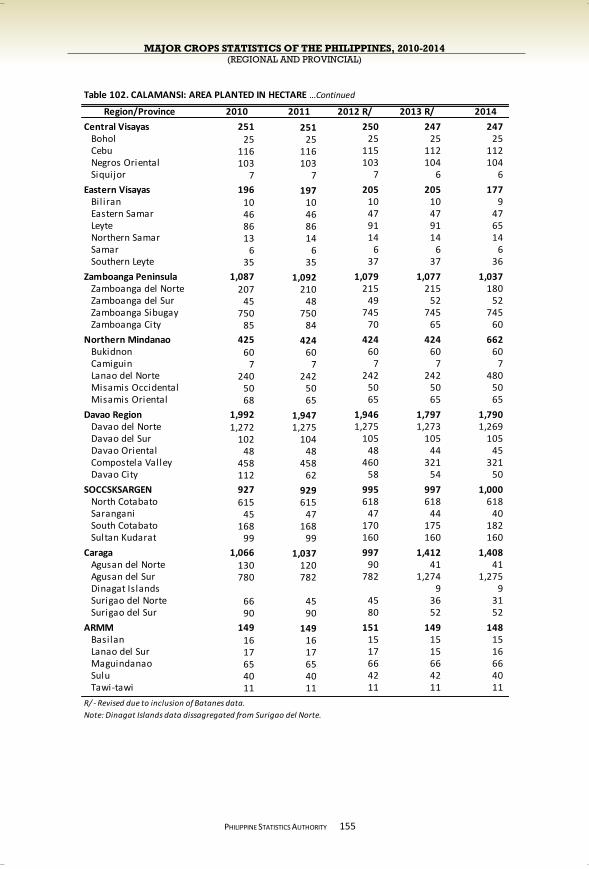
MAJOR CROPS STATISTICS OF THE PHILIPPINES, 2010-2014 (REGIONAL AND PROVINCIAL)
PHILIPPINE STATISTICS AUTHORITY
155
Region/Province 2010 2011 2012 R/ 2013 R/ 2014
Central Visayas 251 251 250 247 247 Bohol 25 25 25 25 25 Cebu 116 116 115 112 112 Negros Oriental 103 103 103 104 104 Siquijor 7 7 7 6 6
Eastern Visayas 196 197 205 205 177 Bil iran 10 10 10 10 9 Eastern Samar 46 46 47 47 47 Leyte 86 86 91 91 65 Northern Samar 13 14 14 14 14 Samar 6 6 6 6 6 Southern Leyte 35 35 37 37 36
Zamboanga Peninsula 1,087 1,092 1,079 1,077 1,037 Zamboanga del Norte 207 210 215 215 180 Zamboanga del Sur 45 48 49 52 52 Zamboanga Sibugay 750 750 745 745 745 Zamboanga City 85 84 70 65 60
Northern Mindanao 425 424 424 424 662 Bukidnon 60 60 60 60 60 Camiguin 7 7 7 7 7 Lanao del Norte 240 242 242 242 480 Misamis Occidental 50 50 50 50 50 Misamis Oriental 68 65 65 65 65
Davao Region 1,992 1,947 1,946 1,797 1,790 Davao del Norte 1,272 1,275 1,275 1,273 1,269 Davao del Sur 102 104 105 105 105 Davao Oriental 48 48 48 44 45 Compostela Valley 458 458 460 321 321 Davao City 112 62 58 54 50
SOCCSKSARGEN 927 929 995 997 1,000 North Cotabato 615 615 618 618 618 Sarangani 45 47 47 44 40 South Cotabato 168 168 170 175 182 Sultan Kudarat 99 99 160 160 160
Caraga 1,066 1,037 997 1,412 1,408 Agusan del Norte 130 120 90 41 41 Agusan del Sur 780 782 782 1,274 1,275 Dinagat Islands 9 9 Surigao del Norte 66 45 45 36 31 Surigao del Sur 90 90 80 52 52
ARMM 149 149 151 149 148 Basilan 16 16 15 15 15 Lanao del Sur 17 17 17 15 16 Maguindanao 65 65 66 66 66 Sulu 40 40 42 42 40 Tawi-tawi 11 11 11 11 11
R/ - Revised due to inclusion of Batanes data.
Note: Dinagat Islands data dissagregated from Surigao del Norte.
Table 102. CALAMANSI: AREA PLANTED IN HECTARE …Continued

MAJOR CROPS STATISTICS OF THE PHILIPPINES, 2010-2014 (REGIONAL AND PROVINCIAL)
PHILIPPINE STATISTICS AUTHORITY
156
Region/Province 2010 2011 2012 R/ 2013 R/ 2014
Philippines 9,163,050 9,402,373 9,256,118 8,925,945 8,744,131
CAR 33,009 32,966 33,116 34,210 34,759 Abra 5,842 5,784 5,784 5,792 5,792 Apayao 8,600 8,600 8,750 8,850 9,500 Benguet 7,142 7,142 7,142 7,142 7,142 Ifugao 5,920 5,920 5,920 5,920 5,820 Kalinga 3,365 3,370 3,370 4,500 4,800 Mountain Province 2,140 2,150 2,150 2,006 1,705
Ilocos Region 403,617 404,362 405,972 405,746 405,714 Ilocos Norte 50,264 50,264 50,264 50,038 50,038 Ilocos Sur 43,525 44,270 45,306 45,306 45,306 La Union 57,416 57,416 57,990 57,990 57,990 Pangasinan 252,412 252,412 252,412 252,412 252,380
Cagayan Valley 660,124 655,827 660,374 662,434 660,303 Batanes 8,704 8,712 8,530 Cagayan 258,224 258,486 258,486 258,738 258,778 Isabela 325,600 322,757 320,400 320,400 318,411 Nueva Vizcaya 36,500 34,784 34,784 34,784 34,784 Quirino 39,800 39,800 38,000 39,800 39,800
Central Luzon 526,515 526,682 528,044 526,724 517,167 Aurora 53,800 52,100 52,050 52,650 53,800 Bataan 8,800 8,800 8,800 8,900 9,300 Bulacan 66,665 68,132 68,150 68,150 53,743 Nueva Ecija 274,800 274,500 274,524 274,524 274,524 Pampanga 38,650 38,350 37,620 35,500 35,800 Tarlac 34,800 34,800 34,900 35,000 35,000 Zambales 49,000 50,000 52,000 52,000 55,000
CALABARZON 739,013 908,713 936,848 938,753 883,749 Batangas 230,000 399,500 410,795 412,500 357,496 Cavite 46,500 46,500 46,500 46,500 46,500 Laguna 174,450 174,650 174,660 174,860 174,860 Quezon 252,413 252,413 269,243 269,243 269,243 Rizal 35,650 35,650 35,650 35,650 35,650
MIMAROPA 3,313,647 3,319,657 3,166,516 2,727,229 2,610,778 Marinduque 4,711 4,716 4,716 4,720 4,716 Occidental Mindoro 25,400 28,900 28,954 28,645 29,450 Oriental Mindoro 3,187,650 3,187,655 3,036,200 2,597,700 2,480,670 Palawan 75,000 77,500 77,500 77,500 77,650 Romblon 20,886 20,886 19,146 18,664 18,292
Bicol Region 224,097 223,097 215,471 212,651 211,798 Albay 35,800 35,000 33,835 31,835 30,760 Camarines Norte 33,325 33,125 33,467 34,302 35,336 Camarines Sur 52,800 52,800 52,800 52,800 52,800 Catanduanes 1,850 1,850 1,850 1,850 1,850 Masbate 10,358 10,358 10,752 10,752 10,752 Sorsogon 89,964 89,964 82,767 81,112 80,300
Western Visayas 646,156 631,430 620,570 601,359 542,794 Aklan 35,185 35,185 35,185 35,365 28,200 Antique 4,001 4,035 4,035 4,044 3,914 Capiz 6,770 6,810 6,850 6,900 6,410 Guimaras 462,200 448,500 438,500 418,500 368,500 Iloilo 128,000 126,900 126,000 127,000 126,300 Negros Occidental 10,000 10,000 10,000 9,550 9,470
PHILIPPINES, 2010-2014Table 103. CALAMANSI: NUMBER OF BEARING TREES, BY REGION, BY PROVINCE,
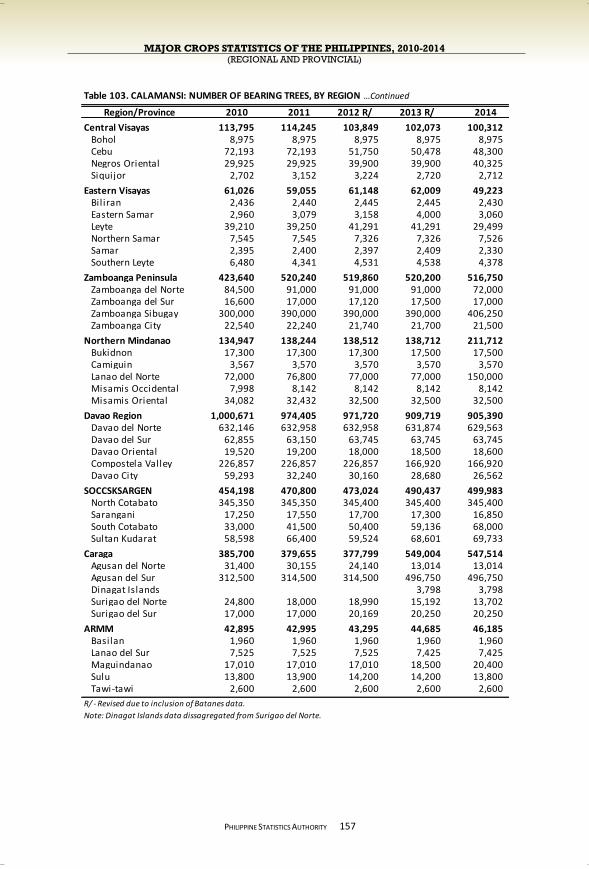
MAJOR CROPS STATISTICS OF THE PHILIPPINES, 2010-2014 (REGIONAL AND PROVINCIAL)
PHILIPPINE STATISTICS AUTHORITY
157
Region/Province 2010 2011 2012 R/ 2013 R/ 2014
Central Visayas 113,795 114,245 103,849 102,073 100,312 Bohol 8,975 8,975 8,975 8,975 8,975 Cebu 72,193 72,193 51,750 50,478 48,300 Negros Oriental 29,925 29,925 39,900 39,900 40,325 Siquijor 2,702 3,152 3,224 2,720 2,712
Eastern Visayas 61,026 59,055 61,148 62,009 49,223 Bil iran 2,436 2,440 2,445 2,445 2,430 Eastern Samar 2,960 3,079 3,158 4,000 3,060 Leyte 39,210 39,250 41,291 41,291 29,499 Northern Samar 7,545 7,545 7,326 7,326 7,526 Samar 2,395 2,400 2,397 2,409 2,330 Southern Leyte 6,480 4,341 4,531 4,538 4,378
Zamboanga Peninsula 423,640 520,240 519,860 520,200 516,750 Zamboanga del Norte 84,500 91,000 91,000 91,000 72,000 Zamboanga del Sur 16,600 17,000 17,120 17,500 17,000 Zamboanga Sibugay 300,000 390,000 390,000 390,000 406,250 Zamboanga City 22,540 22,240 21,740 21,700 21,500
Northern Mindanao 134,947 138,244 138,512 138,712 211,712 Bukidnon 17,300 17,300 17,300 17,500 17,500 Camiguin 3,567 3,570 3,570 3,570 3,570 Lanao del Norte 72,000 76,800 77,000 77,000 150,000 Misamis Occidental 7,998 8,142 8,142 8,142 8,142 Misamis Oriental 34,082 32,432 32,500 32,500 32,500
Davao Region 1,000,671 974,405 971,720 909,719 905,390 Davao del Norte 632,146 632,958 632,958 631,874 629,563 Davao del Sur 62,855 63,150 63,745 63,745 63,745 Davao Oriental 19,520 19,200 18,000 18,500 18,600 Compostela Valley 226,857 226,857 226,857 166,920 166,920 Davao City 59,293 32,240 30,160 28,680 26,562
SOCCSKSARGEN 454,198 470,800 473,024 490,437 499,983 North Cotabato 345,350 345,350 345,400 345,400 345,400 Sarangani 17,250 17,550 17,700 17,300 16,850 South Cotabato 33,000 41,500 50,400 59,136 68,000 Sultan Kudarat 58,598 66,400 59,524 68,601 69,733
Caraga 385,700 379,655 377,799 549,004 547,514 Agusan del Norte 31,400 30,155 24,140 13,014 13,014 Agusan del Sur 312,500 314,500 314,500 496,750 496,750 Dinagat Islands 3,798 3,798 Surigao del Norte 24,800 18,000 18,990 15,192 13,702 Surigao del Sur 17,000 17,000 20,169 20,250 20,250
ARMM 42,895 42,995 43,295 44,685 46,185 Basilan 1,960 1,960 1,960 1,960 1,960 Lanao del Sur 7,525 7,525 7,525 7,425 7,425 Maguindanao 17,010 17,010 17,010 18,500 20,400 Sulu 13,800 13,900 14,200 14,200 13,800 Tawi-tawi 2,600 2,600 2,600 2,600 2,600
R/ - Revised due to inclusion of Batanes data.
Note: Dinagat Islands data dissagregated from Surigao del Norte.
Table 103. CALAMANSI: NUMBER OF BEARING TREES, BY REGION …Continued
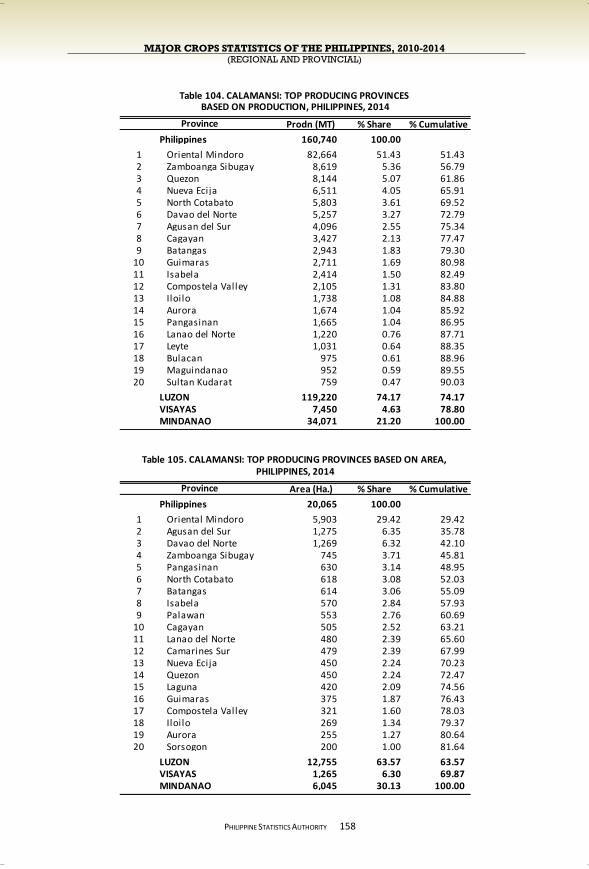
MAJOR CROPS STATISTICS OF THE PHILIPPINES, 2010-2014 (REGIONAL AND PROVINCIAL)
PHILIPPINE STATISTICS AUTHORITY
158
Prodn (MT) % Share % Cumulative
Philippines 160,740 100.00
1 Oriental Mindoro 82,664 51.43 51.43 2 Zamboanga Sibugay 8,619 5.36 56.79 3 Quezon 8,144 5.07 61.86 4 Nueva Ecija 6,511 4.05 65.91 5 North Cotabato 5,803 3.61 69.52 6 Davao del Norte 5,257 3.27 72.79 7 Agusan del Sur 4,096 2.55 75.34 8 Cagayan 3,427 2.13 77.47 9 Batangas 2,943 1.83 79.30
10 Guimaras 2,711 1.69 80.98 11 Isabela 2,414 1.50 82.49 12 Compostela Valley 2,105 1.31 83.80 13 Iloilo 1,738 1.08 84.88 14 Aurora 1,674 1.04 85.92 15 Pangasinan 1,665 1.04 86.95 16 Lanao del Norte 1,220 0.76 87.71 17 Leyte 1,031 0.64 88.35 18 Bulacan 975 0.61 88.96 19 Maguindanao 952 0.59 89.55 20 Sultan Kudarat 759 0.47 90.03
LUZON 119,220 74.17 74.17 VISAYAS 7,450 4.63 78.80 MINDANAO 34,071 21.20 100.00
Area (Ha.) % Share % Cumulative
Philippines 20,065 100.00
1 Oriental Mindoro 5,903 29.42 29.42 2 Agusan del Sur 1,275 6.35 35.78 3 Davao del Norte 1,269 6.32 42.10 4 Zamboanga Sibugay 745 3.71 45.81 5 Pangasinan 630 3.14 48.95 6 North Cotabato 618 3.08 52.03 7 Batangas 614 3.06 55.09 8 Isabela 570 2.84 57.93 9 Palawan 553 2.76 60.69
10 Cagayan 505 2.52 63.21 11 Lanao del Norte 480 2.39 65.60 12 Camarines Sur 479 2.39 67.99 13 Nueva Ecija 450 2.24 70.23 14 Quezon 450 2.24 72.47 15 Laguna 420 2.09 74.56 16 Guimaras 375 1.87 76.43 17 Compostela Valley 321 1.60 78.03 18 Iloilo 269 1.34 79.37 19 Aurora 255 1.27 80.64 20 Sorsogon 200 1.00 81.64
LUZON 12,755 63.57 63.57 VISAYAS 1,265 6.30 69.87 MINDANAO 6,045 30.13 100.00
Province
Table 104. CALAMANSI: TOP PRODUCING PROVINCES
Table 105. CALAMANSI: TOP PRODUCING PROVINCES BASED ON AREA,
Province
PHILIPPINES, 2014
BASED ON PRODUCTION, PHILIPPINES, 2014

MAJOR CROPS STATISTICS OF THE PHILIPPINES, 2010-2014 (REGIONAL AND PROVINCIAL)
PHILIPPINE STATISTICS AUTHORITY
MANGO
In 2010-2014, the country’s mango production grew an average annual rate of 1.9 percent, from 825.68 thousand mt in 2010 to 885.04 thousand mt in 2014. The number of bearing trees during the period also grew by 1.9 percent. However, area planted contracted by 0.2 percent. In 2014, mango production went up by 8.4 percent from the 2013 level of 816.38 thousand mt. This is attributed to the increase in natural fruiting and lesser damage of cicid fly in Pangasinan, favorable weather condition during flowering stage, and use of inducer.
Pangasinan
was the top producer of mango at 212.37 thousand mt and shared 24.0 percent of the total mango output of the country in 2014 (Figure 37). Other top producing provinces were Zamboanga del Norte, Cebu, Davao del Sur and Batangas with a combined share of 22.4 percent to the national total.
In terms of area
planted, Davao del Sur was the largest among provinces at 13.81 thousand hectares. This was followed by Pangasinan and Zamboanga Norte with 13.73 thousand hectares and 11.84
159
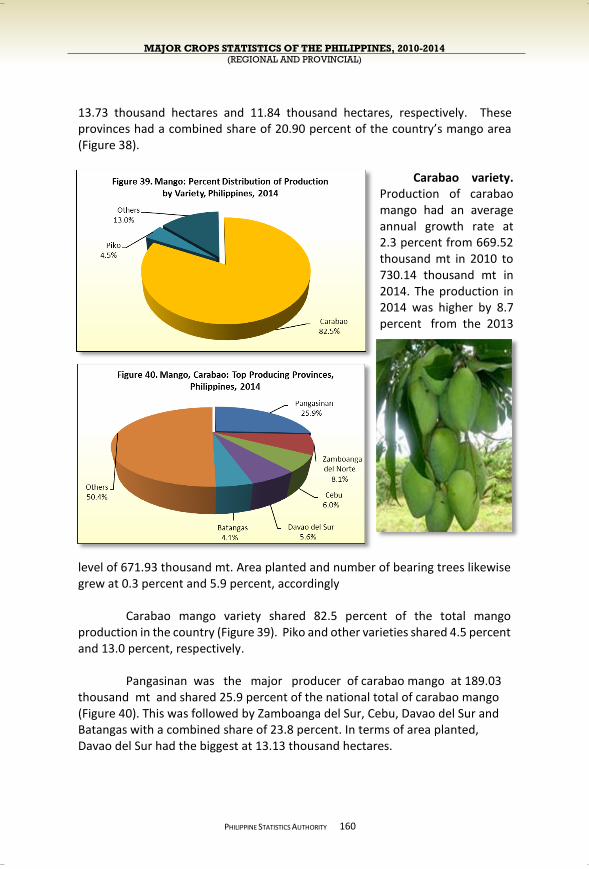
MAJOR CROPS STATISTICS OF THE PHILIPPINES, 2010-2014 (REGIONAL AND PROVINCIAL)
PHILIPPINE STATISTICS AUTHORITY
13.73 thousand hectares and 11.84 thousand hectares, respectively. These provinces had a combined share of 20.90 percent of the country’s mango area (Figure 38).
Carabao variety. Production of carabao mango had an average annual growth rate at 2.3 percent from 669.52 thousand mt in 2010 to 730.14 thousand mt in 2014. The production in 2014 was higher by 8.7 percent from the 2013
level of 671.93 thousand mt. Area planted and number of bearing trees likewise grew at 0.3 percent and 5.9 percent, accordingly
Carabao mango variety shared 82.5 percent of the total mango production in the country (Figure 39). Piko and other varieties shared 4.5 percent and 13.0 percent, respectively.
Pangasinan was the major producer of carabao mango at 189.03 thousand mt and shared 25.9 percent of the national total of carabao mango (Figure 40). This was followed by Zamboanga del Sur, Cebu, Davao del Sur and Batangas with a combined share of 23.8 percent. In terms of area planted, Davao del Sur had the biggest at 13.13 thousand hectares.
160
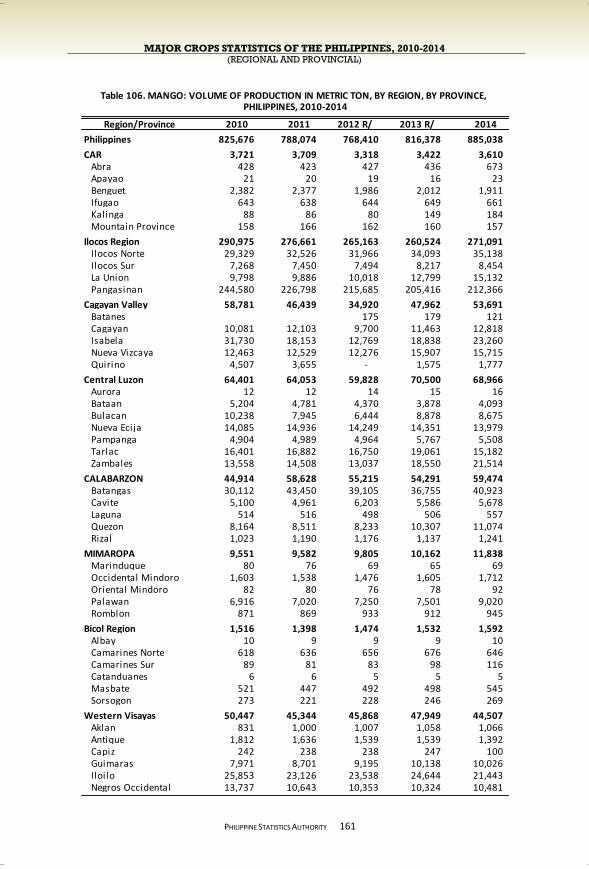
MAJOR CROPS STATISTICS OF THE PHILIPPINES, 2010-2014 (REGIONAL AND PROVINCIAL)
PHILIPPINE STATISTICS AUTHORITY
161
Region/Province 2010 2011 2012 R/ 2013 R/ 2014
Philippines 825,676 788,074 768,410 816,378 885,038
CAR 3,721 3,709 3,318 3,422 3,610 Abra 428 423 427 436 673 Apayao 21 20 19 16 23 Benguet 2,382 2,377 1,986 2,012 1,911 Ifugao 643 638 644 649 661 Kalinga 88 86 80 149 184 Mountain Province 158 166 162 160 157
Ilocos Region 290,975 276,661 265,163 260,524 271,091 Ilocos Norte 29,329 32,526 31,966 34,093 35,138 Ilocos Sur 7,268 7,450 7,494 8,217 8,454 La Union 9,798 9,886 10,018 12,799 15,132 Pangasinan 244,580 226,798 215,685 205,416 212,366
Cagayan Valley 58,781 46,439 34,920 47,962 53,691 Batanes 175 179 121 Cagayan 10,081 12,103 9,700 11,463 12,818 Isabela 31,730 18,153 12,769 18,838 23,260 Nueva Vizcaya 12,463 12,529 12,276 15,907 15,715 Quirino 4,507 3,655 - 1,575 1,777
Central Luzon 64,401 64,053 59,828 70,500 68,966 Aurora 12 12 14 15 16 Bataan 5,204 4,781 4,370 3,878 4,093 Bulacan 10,238 7,945 6,444 8,878 8,675 Nueva Ecija 14,085 14,936 14,249 14,351 13,979 Pampanga 4,904 4,989 4,964 5,767 5,508 Tarlac 16,401 16,882 16,750 19,061 15,182 Zambales 13,558 14,508 13,037 18,550 21,514
CALABARZON 44,914 58,628 55,215 54,291 59,474 Batangas 30,112 43,450 39,105 36,755 40,923 Cavite 5,100 4,961 6,203 5,586 5,678 Laguna 514 516 498 506 557 Quezon 8,164 8,511 8,233 10,307 11,074 Rizal 1,023 1,190 1,176 1,137 1,241
MIMAROPA 9,551 9,582 9,805 10,162 11,838 Marinduque 80 76 69 65 69 Occidental Mindoro 1,603 1,538 1,476 1,605 1,712 Oriental Mindoro 82 80 76 78 92 Palawan 6,916 7,020 7,250 7,501 9,020 Romblon 871 869 933 912 945
Bicol Region 1,516 1,398 1,474 1,532 1,592 Albay 10 9 9 9 10 Camarines Norte 618 636 656 676 646 Camarines Sur 89 81 83 98 116 Catanduanes 6 6 5 5 5 Masbate 521 447 492 498 545 Sorsogon 273 221 228 246 269
Western Visayas 50,447 45,344 45,868 47,949 44,507 Aklan 831 1,000 1,007 1,058 1,066 Antique 1,812 1,636 1,539 1,539 1,392 Capiz 242 238 238 247 100 Guimaras 7,971 8,701 9,195 10,138 10,026 Iloilo 25,853 23,126 23,538 24,644 21,443 Negros Occidental 13,737 10,643 10,353 10,324 10,481
PHILIPPINES, 2010-2014Table 106. MANGO: VOLUME OF PRODUCTION IN METRIC TON, BY REGION, BY PROVINCE,
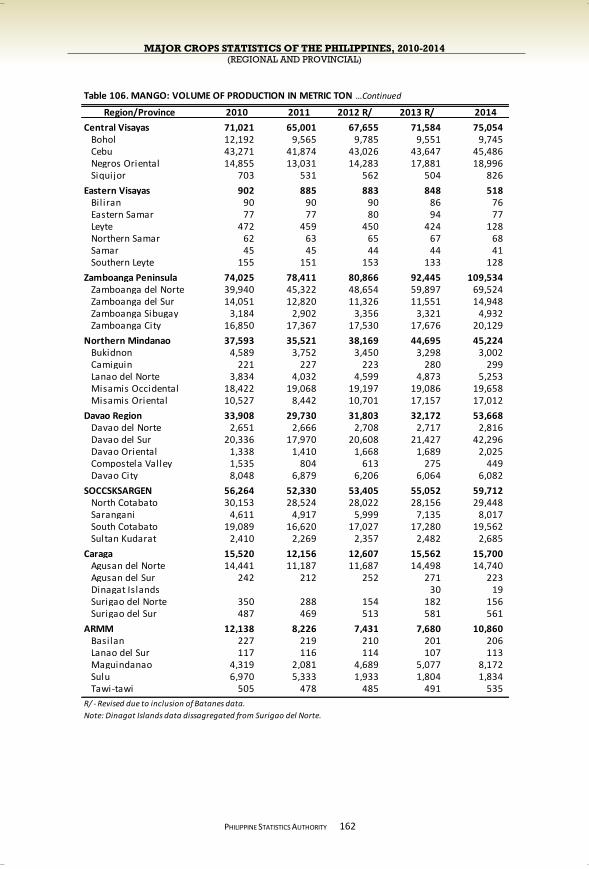
MAJOR CROPS STATISTICS OF THE PHILIPPINES, 2010-2014 (REGIONAL AND PROVINCIAL)
PHILIPPINE STATISTICS AUTHORITY
162
Region/Province 2010 2011 2012 R/ 2013 R/ 2014
Central Visayas 71,021 65,001 67,655 71,584 75,054 Bohol 12,192 9,565 9,785 9,551 9,745 Cebu 43,271 41,874 43,026 43,647 45,486 Negros Oriental 14,855 13,031 14,283 17,881 18,996 Siquijor 703 531 562 504 826
Eastern Visayas 902 885 883 848 518 Bil iran 90 90 90 86 76 Eastern Samar 77 77 80 94 77 Leyte 472 459 450 424 128 Northern Samar 62 63 65 67 68 Samar 45 45 44 44 41 Southern Leyte 155 151 153 133 128
Zamboanga Peninsula 74,025 78,411 80,866 92,445 109,534 Zamboanga del Norte 39,940 45,322 48,654 59,897 69,524 Zamboanga del Sur 14,051 12,820 11,326 11,551 14,948 Zamboanga Sibugay 3,184 2,902 3,356 3,321 4,932 Zamboanga City 16,850 17,367 17,530 17,676 20,129
Northern Mindanao 37,593 35,521 38,169 44,695 45,224 Bukidnon 4,589 3,752 3,450 3,298 3,002 Camiguin 221 227 223 280 299 Lanao del Norte 3,834 4,032 4,599 4,873 5,253 Misamis Occidental 18,422 19,068 19,197 19,086 19,658 Misamis Oriental 10,527 8,442 10,701 17,157 17,012
Davao Region 33,908 29,730 31,803 32,172 53,668 Davao del Norte 2,651 2,666 2,708 2,717 2,816 Davao del Sur 20,336 17,970 20,608 21,427 42,296 Davao Oriental 1,338 1,410 1,668 1,689 2,025 Compostela Valley 1,535 804 613 275 449 Davao City 8,048 6,879 6,206 6,064 6,082
SOCCSKSARGEN 56,264 52,330 53,405 55,052 59,712 North Cotabato 30,153 28,524 28,022 28,156 29,448 Sarangani 4,611 4,917 5,999 7,135 8,017 South Cotabato 19,089 16,620 17,027 17,280 19,562 Sultan Kudarat 2,410 2,269 2,357 2,482 2,685
Caraga 15,520 12,156 12,607 15,562 15,700 Agusan del Norte 14,441 11,187 11,687 14,498 14,740 Agusan del Sur 242 212 252 271 223 Dinagat Islands 30 19 Surigao del Norte 350 288 154 182 156 Surigao del Sur 487 469 513 581 561
ARMM 12,138 8,226 7,431 7,680 10,860 Basilan 227 219 210 201 206 Lanao del Sur 117 116 114 107 113 Maguindanao 4,319 2,081 4,689 5,077 8,172 Sulu 6,970 5,333 1,933 1,804 1,834 Tawi-tawi 505 478 485 491 535
R/ - Revised due to inclusion of Batanes data.
Note: Dinagat Islands data dissagregated from Surigao del Norte.
Table 106. MANGO: VOLUME OF PRODUCTION IN METRIC TON …Continued
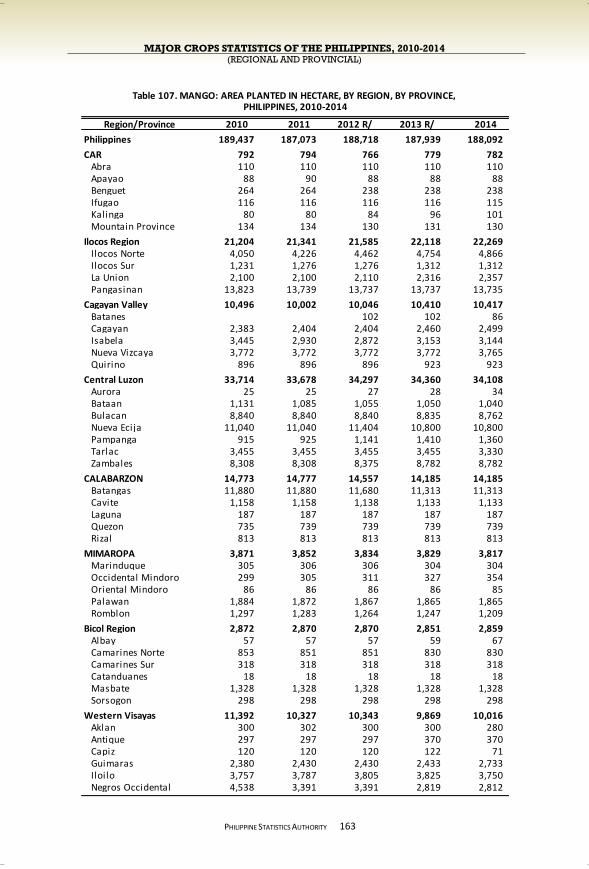
MAJOR CROPS STATISTICS OF THE PHILIPPINES, 2010-2014 (REGIONAL AND PROVINCIAL)
PHILIPPINE STATISTICS AUTHORITY
163
Region/Province 2010 2011 2012 R/ 2013 R/ 2014
Philippines 189,437 187,073 188,718 187,939 188,092
CAR 792 794 766 779 782 Abra 110 110 110 110 110 Apayao 88 90 88 88 88 Benguet 264 264 238 238 238 Ifugao 116 116 116 116 115 Kalinga 80 80 84 96 101 Mountain Province 134 134 130 131 130
Ilocos Region 21,204 21,341 21,585 22,118 22,269 Ilocos Norte 4,050 4,226 4,462 4,754 4,866 Ilocos Sur 1,231 1,276 1,276 1,312 1,312 La Union 2,100 2,100 2,110 2,316 2,357 Pangasinan 13,823 13,739 13,737 13,737 13,735
Cagayan Valley 10,496 10,002 10,046 10,410 10,417 Batanes 102 102 86 Cagayan 2,383 2,404 2,404 2,460 2,499 Isabela 3,445 2,930 2,872 3,153 3,144 Nueva Vizcaya 3,772 3,772 3,772 3,772 3,765 Quirino 896 896 896 923 923
Central Luzon 33,714 33,678 34,297 34,360 34,108 Aurora 25 25 27 28 34 Bataan 1,131 1,085 1,055 1,050 1,040 Bulacan 8,840 8,840 8,840 8,835 8,762 Nueva Ecija 11,040 11,040 11,404 10,800 10,800 Pampanga 915 925 1,141 1,410 1,360 Tarlac 3,455 3,455 3,455 3,455 3,330 Zambales 8,308 8,308 8,375 8,782 8,782
CALABARZON 14,773 14,777 14,557 14,185 14,185 Batangas 11,880 11,880 11,680 11,313 11,313 Cavite 1,158 1,158 1,138 1,133 1,133 Laguna 187 187 187 187 187 Quezon 735 739 739 739 739 Rizal 813 813 813 813 813
MIMAROPA 3,871 3,852 3,834 3,829 3,817 Marinduque 305 306 306 304 304 Occidental Mindoro 299 305 311 327 354 Oriental Mindoro 86 86 86 86 85 Palawan 1,884 1,872 1,867 1,865 1,865 Romblon 1,297 1,283 1,264 1,247 1,209
Bicol Region 2,872 2,870 2,870 2,851 2,859 Albay 57 57 57 59 67 Camarines Norte 853 851 851 830 830 Camarines Sur 318 318 318 318 318 Catanduanes 18 18 18 18 18 Masbate 1,328 1,328 1,328 1,328 1,328 Sorsogon 298 298 298 298 298
Western Visayas 11,392 10,327 10,343 9,869 10,016 Aklan 300 302 300 300 280 Antique 297 297 297 370 370 Capiz 120 120 120 122 71 Guimaras 2,380 2,430 2,430 2,433 2,733 Iloilo 3,757 3,787 3,805 3,825 3,750 Negros Occidental 4,538 3,391 3,391 2,819 2,812
PHILIPPINES, 2010-2014Table 107. MANGO: AREA PLANTED IN HECTARE, BY REGION, BY PROVINCE,
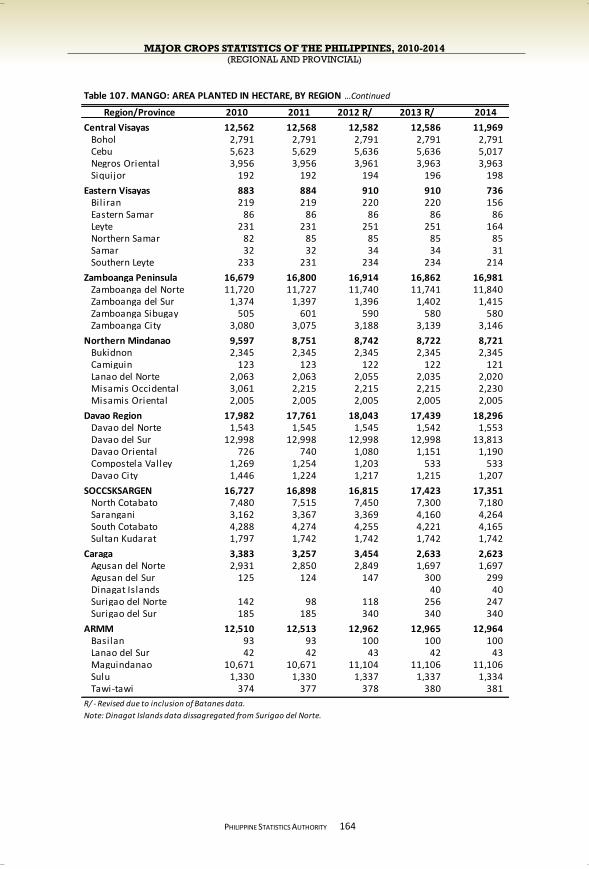
MAJOR CROPS STATISTICS OF THE PHILIPPINES, 2010-2014 (REGIONAL AND PROVINCIAL)
PHILIPPINE STATISTICS AUTHORITY
164
Region/Province 2010 2011 2012 R/ 2013 R/ 2014
Central Visayas 12,562 12,568 12,582 12,586 11,969 Bohol 2,791 2,791 2,791 2,791 2,791 Cebu 5,623 5,629 5,636 5,636 5,017 Negros Oriental 3,956 3,956 3,961 3,963 3,963 Siquijor 192 192 194 196 198
Eastern Visayas 883 884 910 910 736 Bil iran 219 219 220 220 156 Eastern Samar 86 86 86 86 86 Leyte 231 231 251 251 164 Northern Samar 82 85 85 85 85 Samar 32 32 34 34 31 Southern Leyte 233 231 234 234 214
Zamboanga Peninsula 16,679 16,800 16,914 16,862 16,981 Zamboanga del Norte 11,720 11,727 11,740 11,741 11,840 Zamboanga del Sur 1,374 1,397 1,396 1,402 1,415 Zamboanga Sibugay 505 601 590 580 580 Zamboanga City 3,080 3,075 3,188 3,139 3,146
Northern Mindanao 9,597 8,751 8,742 8,722 8,721 Bukidnon 2,345 2,345 2,345 2,345 2,345 Camiguin 123 123 122 122 121 Lanao del Norte 2,063 2,063 2,055 2,035 2,020 Misamis Occidental 3,061 2,215 2,215 2,215 2,230 Misamis Oriental 2,005 2,005 2,005 2,005 2,005
Davao Region 17,982 17,761 18,043 17,439 18,296 Davao del Norte 1,543 1,545 1,545 1,542 1,553 Davao del Sur 12,998 12,998 12,998 12,998 13,813 Davao Oriental 726 740 1,080 1,151 1,190 Compostela Valley 1,269 1,254 1,203 533 533 Davao City 1,446 1,224 1,217 1,215 1,207
SOCCSKSARGEN 16,727 16,898 16,815 17,423 17,351 North Cotabato 7,480 7,515 7,450 7,300 7,180 Sarangani 3,162 3,367 3,369 4,160 4,264 South Cotabato 4,288 4,274 4,255 4,221 4,165 Sultan Kudarat 1,797 1,742 1,742 1,742 1,742
Caraga 3,383 3,257 3,454 2,633 2,623 Agusan del Norte 2,931 2,850 2,849 1,697 1,697 Agusan del Sur 125 124 147 300 299 Dinagat Islands 40 40 Surigao del Norte 142 98 118 256 247 Surigao del Sur 185 185 340 340 340
ARMM 12,510 12,513 12,962 12,965 12,964 Basilan 93 93 100 100 100 Lanao del Sur 42 42 43 42 43 Maguindanao 10,671 10,671 11,104 11,106 11,106 Sulu 1,330 1,330 1,337 1,337 1,334 Tawi-tawi 374 377 378 380 381
R/ - Revised due to inclusion of Batanes data.
Note: Dinagat Islands data dissagregated from Surigao del Norte.
Table 107. MANGO: AREA PLANTED IN HECTARE, BY REGION …Continued
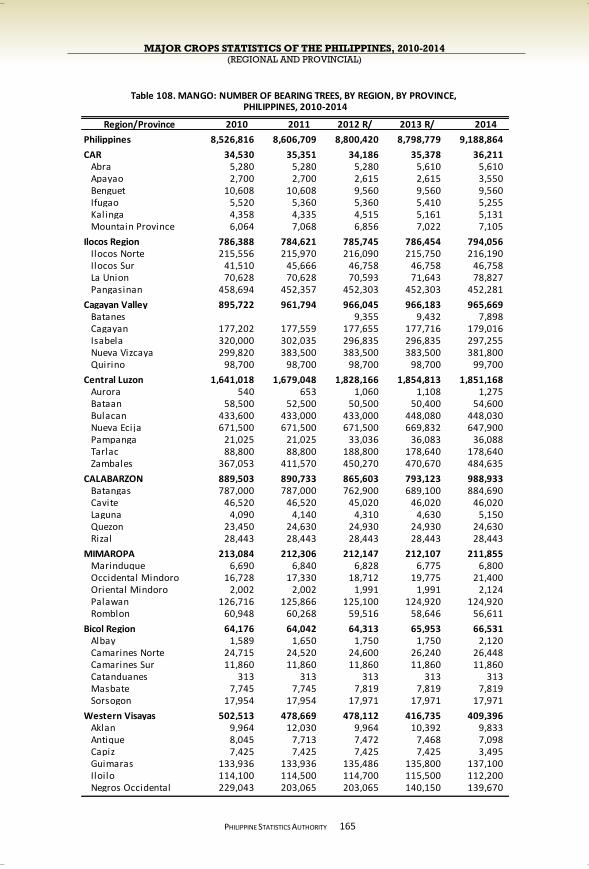
MAJOR CROPS STATISTICS OF THE PHILIPPINES, 2010-2014 (REGIONAL AND PROVINCIAL)
PHILIPPINE STATISTICS AUTHORITY
165
Region/Province 2010 2011 2012 R/ 2013 R/ 2014
Philippines 8,526,816 8,606,709 8,800,420 8,798,779 9,188,864
CAR 34,530 35,351 34,186 35,378 36,211 Abra 5,280 5,280 5,280 5,610 5,610 Apayao 2,700 2,700 2,615 2,615 3,550 Benguet 10,608 10,608 9,560 9,560 9,560 Ifugao 5,520 5,360 5,360 5,410 5,255 Kalinga 4,358 4,335 4,515 5,161 5,131 Mountain Province 6,064 7,068 6,856 7,022 7,105
Ilocos Region 786,388 784,621 785,745 786,454 794,056 Ilocos Norte 215,556 215,970 216,090 215,750 216,190 Ilocos Sur 41,510 45,666 46,758 46,758 46,758 La Union 70,628 70,628 70,593 71,643 78,827 Pangasinan 458,694 452,357 452,303 452,303 452,281
Cagayan Valley 895,722 961,794 966,045 966,183 965,669 Batanes 9,355 9,432 7,898 Cagayan 177,202 177,559 177,655 177,716 179,016 Isabela 320,000 302,035 296,835 296,835 297,255 Nueva Vizcaya 299,820 383,500 383,500 383,500 381,800 Quirino 98,700 98,700 98,700 98,700 99,700
Central Luzon 1,641,018 1,679,048 1,828,166 1,854,813 1,851,168 Aurora 540 653 1,060 1,108 1,275 Bataan 58,500 52,500 50,500 50,400 54,600 Bulacan 433,600 433,000 433,000 448,080 448,030 Nueva Ecija 671,500 671,500 671,500 669,832 647,900 Pampanga 21,025 21,025 33,036 36,083 36,088 Tarlac 88,800 88,800 188,800 178,640 178,640 Zambales 367,053 411,570 450,270 470,670 484,635
CALABARZON 889,503 890,733 865,603 793,123 988,933 Batangas 787,000 787,000 762,900 689,100 884,690 Cavite 46,520 46,520 45,020 46,020 46,020 Laguna 4,090 4,140 4,310 4,630 5,150 Quezon 23,450 24,630 24,930 24,930 24,630 Rizal 28,443 28,443 28,443 28,443 28,443
MIMAROPA 213,084 212,306 212,147 212,107 211,855 Marinduque 6,690 6,840 6,828 6,775 6,800 Occidental Mindoro 16,728 17,330 18,712 19,775 21,400 Oriental Mindoro 2,002 2,002 1,991 1,991 2,124 Palawan 126,716 125,866 125,100 124,920 124,920 Romblon 60,948 60,268 59,516 58,646 56,611
Bicol Region 64,176 64,042 64,313 65,953 66,531 Albay 1,589 1,650 1,750 1,750 2,120 Camarines Norte 24,715 24,520 24,600 26,240 26,448 Camarines Sur 11,860 11,860 11,860 11,860 11,860 Catanduanes 313 313 313 313 313 Masbate 7,745 7,745 7,819 7,819 7,819 Sorsogon 17,954 17,954 17,971 17,971 17,971
Western Visayas 502,513 478,669 478,112 416,735 409,396 Aklan 9,964 12,030 9,964 10,392 9,833 Antique 8,045 7,713 7,472 7,468 7,098 Capiz 7,425 7,425 7,425 7,425 3,495 Guimaras 133,936 133,936 135,486 135,800 137,100 Iloilo 114,100 114,500 114,700 115,500 112,200 Negros Occidental 229,043 203,065 203,065 140,150 139,670
Table 108. MANGO: NUMBER OF BEARING TREES, BY REGION, BY PROVINCE, PHILIPPINES, 2010-2014
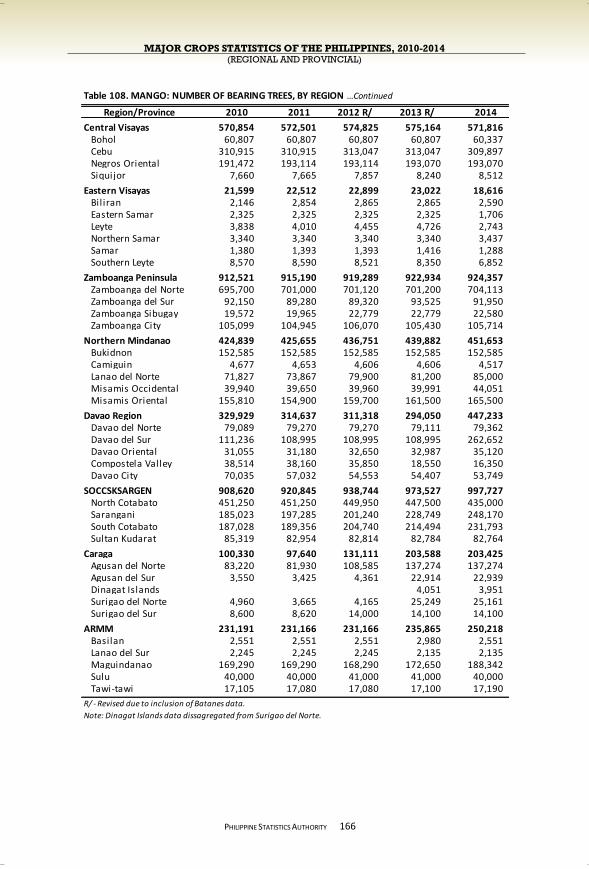
MAJOR CROPS STATISTICS OF THE PHILIPPINES, 2010-2014 (REGIONAL AND PROVINCIAL)
PHILIPPINE STATISTICS AUTHORITY
166
Region/Province 2010 2011 2012 R/ 2013 R/ 2014
Central Visayas 570,854 572,501 574,825 575,164 571,816 Bohol 60,807 60,807 60,807 60,807 60,337 Cebu 310,915 310,915 313,047 313,047 309,897 Negros Oriental 191,472 193,114 193,114 193,070 193,070 Siquijor 7,660 7,665 7,857 8,240 8,512
Eastern Visayas 21,599 22,512 22,899 23,022 18,616 Bil iran 2,146 2,854 2,865 2,865 2,590 Eastern Samar 2,325 2,325 2,325 2,325 1,706 Leyte 3,838 4,010 4,455 4,726 2,743 Northern Samar 3,340 3,340 3,340 3,340 3,437 Samar 1,380 1,393 1,393 1,416 1,288 Southern Leyte 8,570 8,590 8,521 8,350 6,852
Zamboanga Peninsula 912,521 915,190 919,289 922,934 924,357 Zamboanga del Norte 695,700 701,000 701,120 701,200 704,113 Zamboanga del Sur 92,150 89,280 89,320 93,525 91,950 Zamboanga Sibugay 19,572 19,965 22,779 22,779 22,580 Zamboanga City 105,099 104,945 106,070 105,430 105,714
Northern Mindanao 424,839 425,655 436,751 439,882 451,653 Bukidnon 152,585 152,585 152,585 152,585 152,585 Camiguin 4,677 4,653 4,606 4,606 4,517 Lanao del Norte 71,827 73,867 79,900 81,200 85,000 Misamis Occidental 39,940 39,650 39,960 39,991 44,051 Misamis Oriental 155,810 154,900 159,700 161,500 165,500
Davao Region 329,929 314,637 311,318 294,050 447,233 Davao del Norte 79,089 79,270 79,270 79,111 79,362 Davao del Sur 111,236 108,995 108,995 108,995 262,652 Davao Oriental 31,055 31,180 32,650 32,987 35,120 Compostela Valley 38,514 38,160 35,850 18,550 16,350 Davao City 70,035 57,032 54,553 54,407 53,749
SOCCSKSARGEN 908,620 920,845 938,744 973,527 997,727 North Cotabato 451,250 451,250 449,950 447,500 435,000 Sarangani 185,023 197,285 201,240 228,749 248,170 South Cotabato 187,028 189,356 204,740 214,494 231,793 Sultan Kudarat 85,319 82,954 82,814 82,784 82,764
Caraga 100,330 97,640 131,111 203,588 203,425 Agusan del Norte 83,220 81,930 108,585 137,274 137,274 Agusan del Sur 3,550 3,425 4,361 22,914 22,939 Dinagat Islands 4,051 3,951 Surigao del Norte 4,960 3,665 4,165 25,249 25,161 Surigao del Sur 8,600 8,620 14,000 14,100 14,100
ARMM 231,191 231,166 231,166 235,865 250,218 Basilan 2,551 2,551 2,551 2,980 2,551 Lanao del Sur 2,245 2,245 2,245 2,135 2,135 Maguindanao 169,290 169,290 168,290 172,650 188,342 Sulu 40,000 40,000 41,000 41,000 40,000 Tawi-tawi 17,105 17,080 17,080 17,100 17,190
R/ - Revised due to inclusion of Batanes data.
Note: Dinagat Islands data dissagregated from Surigao del Norte.
Table 108. MANGO: NUMBER OF BEARING TREES, BY REGION …Continued
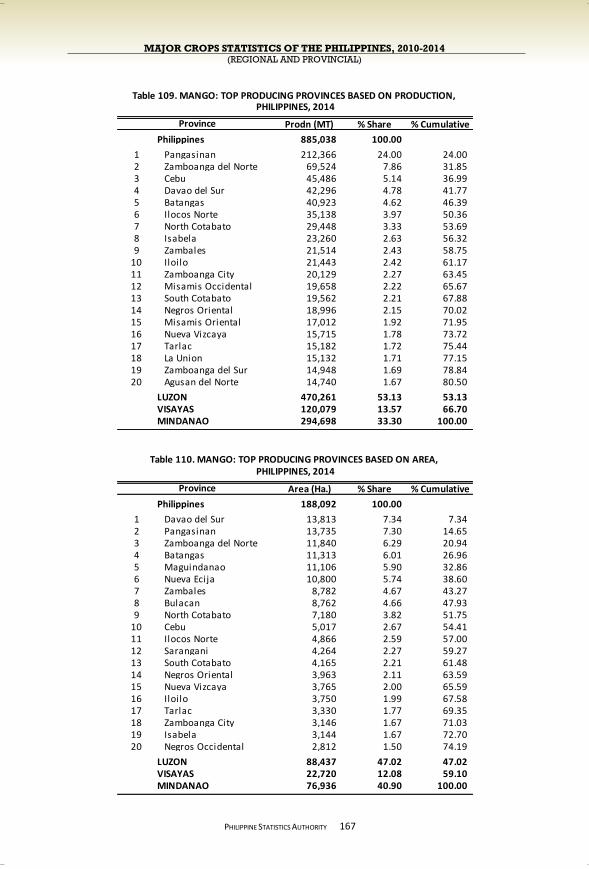
MAJOR CROPS STATISTICS OF THE PHILIPPINES, 2010-2014 (REGIONAL AND PROVINCIAL)
PHILIPPINE STATISTICS AUTHORITY
167
Prodn (MT) % Share % Cumulative
Philippines 885,038 100.00
1 Pangasinan 212,366 24.00 24.00 2 Zamboanga del Norte 69,524 7.86 31.85 3 Cebu 45,486 5.14 36.99 4 Davao del Sur 42,296 4.78 41.77 5 Batangas 40,923 4.62 46.39 6 Ilocos Norte 35,138 3.97 50.36 7 North Cotabato 29,448 3.33 53.69 8 Isabela 23,260 2.63 56.32 9 Zambales 21,514 2.43 58.75
10 Iloilo 21,443 2.42 61.17 11 Zamboanga City 20,129 2.27 63.45 12 Misamis Occidental 19,658 2.22 65.67 13 South Cotabato 19,562 2.21 67.88 14 Negros Oriental 18,996 2.15 70.02 15 Misamis Oriental 17,012 1.92 71.95 16 Nueva Vizcaya 15,715 1.78 73.72 17 Tarlac 15,182 1.72 75.44 18 La Union 15,132 1.71 77.15 19 Zamboanga del Sur 14,948 1.69 78.84 20 Agusan del Norte 14,740 1.67 80.50
LUZON 470,261 53.13 53.13 VISAYAS 120,079 13.57 66.70 MINDANAO 294,698 33.30 100.00
Area (Ha.) % Share % Cumulative
Philippines 188,092 100.00
1 Davao del Sur 13,813 7.34 7.34 2 Pangasinan 13,735 7.30 14.65 3 Zamboanga del Norte 11,840 6.29 20.94 4 Batangas 11,313 6.01 26.96 5 Maguindanao 11,106 5.90 32.86 6 Nueva Ecija 10,800 5.74 38.60 7 Zambales 8,782 4.67 43.27 8 Bulacan 8,762 4.66 47.93 9 North Cotabato 7,180 3.82 51.75
10 Cebu 5,017 2.67 54.41 11 Ilocos Norte 4,866 2.59 57.00 12 Sarangani 4,264 2.27 59.27 13 South Cotabato 4,165 2.21 61.48 14 Negros Oriental 3,963 2.11 63.59 15 Nueva Vizcaya 3,765 2.00 65.59 16 Iloilo 3,750 1.99 67.58 17 Tarlac 3,330 1.77 69.35 18 Zamboanga City 3,146 1.67 71.03 19 Isabela 3,144 1.67 72.70 20 Negros Occidental 2,812 1.50 74.19
LUZON 88,437 47.02 47.02 VISAYAS 22,720 12.08 59.10 MINDANAO 76,936 40.90 100.00
Province
Table 109. MANGO: TOP PRODUCING PROVINCES BASED ON PRODUCTION,
Table 110. MANGO: TOP PRODUCING PROVINCES BASED ON AREA,
Province
PHILIPPINES, 2014
PHILIPPINES, 2014
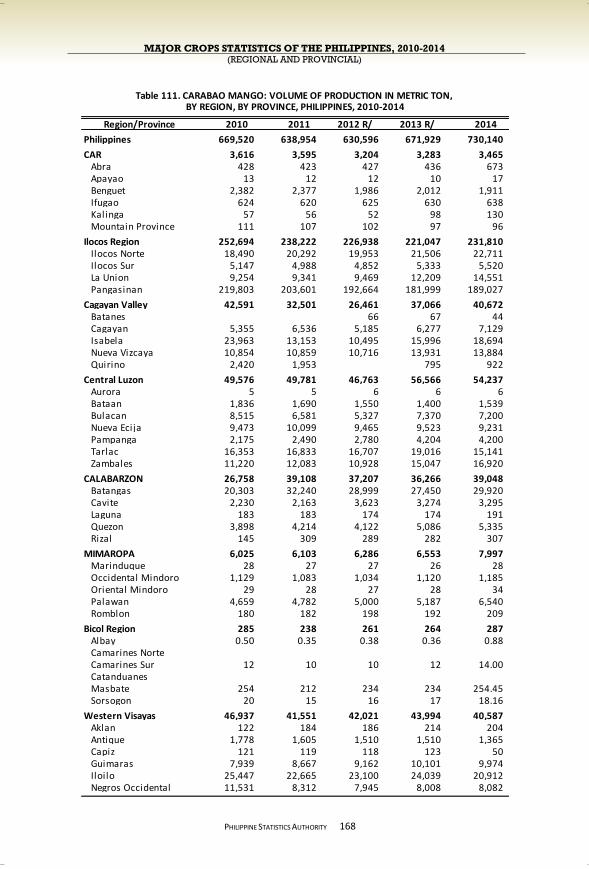
MAJOR CROPS STATISTICS OF THE PHILIPPINES, 2010-2014 (REGIONAL AND PROVINCIAL)
PHILIPPINE STATISTICS AUTHORITY
168
Region/Province 2010 2011 2012 R/ 2013 R/ 2014
Philippines 669,520 638,954 630,596 671,929 730,140
CAR 3,616 3,595 3,204 3,283 3,465 Abra 428 423 427 436 673 Apayao 13 12 12 10 17 Benguet 2,382 2,377 1,986 2,012 1,911 Ifugao 624 620 625 630 638 Kalinga 57 56 52 98 130 Mountain Province 111 107 102 97 96
Ilocos Region 252,694 238,222 226,938 221,047 231,810 Ilocos Norte 18,490 20,292 19,953 21,506 22,711 Ilocos Sur 5,147 4,988 4,852 5,333 5,520 La Union 9,254 9,341 9,469 12,209 14,551 Pangasinan 219,803 203,601 192,664 181,999 189,027
Cagayan Valley 42,591 32,501 26,461 37,066 40,672 Batanes 66 67 44 Cagayan 5,355 6,536 5,185 6,277 7,129 Isabela 23,963 13,153 10,495 15,996 18,694 Nueva Vizcaya 10,854 10,859 10,716 13,931 13,884 Quirino 2,420 1,953 795 922
Central Luzon 49,576 49,781 46,763 56,566 54,237 Aurora 5 5 6 6 6 Bataan 1,836 1,690 1,550 1,400 1,539 Bulacan 8,515 6,581 5,327 7,370 7,200 Nueva Ecija 9,473 10,099 9,465 9,523 9,231 Pampanga 2,175 2,490 2,780 4,204 4,200 Tarlac 16,353 16,833 16,707 19,016 15,141 Zambales 11,220 12,083 10,928 15,047 16,920
CALABARZON 26,758 39,108 37,207 36,266 39,048 Batangas 20,303 32,240 28,999 27,450 29,920 Cavite 2,230 2,163 3,623 3,274 3,295 Laguna 183 183 174 174 191 Quezon 3,898 4,214 4,122 5,086 5,335 Rizal 145 309 289 282 307
MIMAROPA 6,025 6,103 6,286 6,553 7,997 Marinduque 28 27 27 26 28 Occidental Mindoro 1,129 1,083 1,034 1,120 1,185 Oriental Mindoro 29 28 27 28 34 Palawan 4,659 4,782 5,000 5,187 6,540 Romblon 180 182 198 192 209
Bicol Region 285 238 261 264 287 Albay 0.50 0.35 0.38 0.36 0.88 Camarines Norte Camarines Sur 12 10 10 12 14.00 Catanduanes Masbate 254 212 234 234 254.45 Sorsogon 20 15 16 17 18.16
Western Visayas 46,937 41,551 42,021 43,994 40,587 Aklan 122 184 186 214 204 Antique 1,778 1,605 1,510 1,510 1,365 Capiz 121 119 118 123 50 Guimaras 7,939 8,667 9,162 10,101 9,974 Iloilo 25,447 22,665 23,100 24,039 20,912 Negros Occidental 11,531 8,312 7,945 8,008 8,082
BY REGION, BY PROVINCE, PHILIPPINES, 2010-2014Table 111. CARABAO MANGO: VOLUME OF PRODUCTION IN METRIC TON,
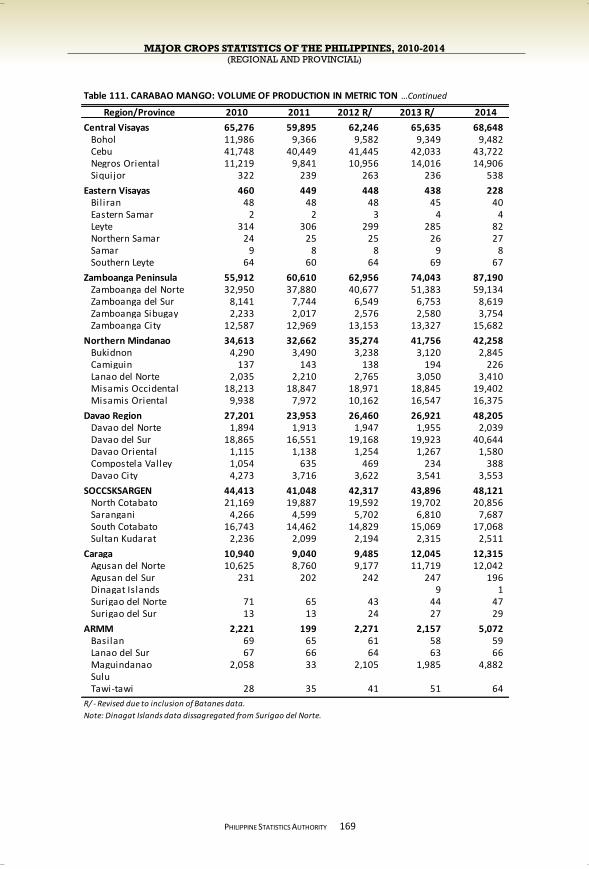
MAJOR CROPS STATISTICS OF THE PHILIPPINES, 2010-2014 (REGIONAL AND PROVINCIAL)
PHILIPPINE STATISTICS AUTHORITY
169
Region/Province 2010 2011 2012 R/ 2013 R/ 2014
Central Visayas 65,276 59,895 62,246 65,635 68,648 Bohol 11,986 9,366 9,582 9,349 9,482 Cebu 41,748 40,449 41,445 42,033 43,722 Negros Oriental 11,219 9,841 10,956 14,016 14,906 Siquijor 322 239 263 236 538
Eastern Visayas 460 449 448 438 228 Bil iran 48 48 48 45 40 Eastern Samar 2 2 3 4 4 Leyte 314 306 299 285 82 Northern Samar 24 25 25 26 27 Samar 9 8 8 9 8 Southern Leyte 64 60 64 69 67
Zamboanga Peninsula 55,912 60,610 62,956 74,043 87,190 Zamboanga del Norte 32,950 37,880 40,677 51,383 59,134 Zamboanga del Sur 8,141 7,744 6,549 6,753 8,619 Zamboanga Sibugay 2,233 2,017 2,576 2,580 3,754 Zamboanga City 12,587 12,969 13,153 13,327 15,682
Northern Mindanao 34,613 32,662 35,274 41,756 42,258 Bukidnon 4,290 3,490 3,238 3,120 2,845 Camiguin 137 143 138 194 226 Lanao del Norte 2,035 2,210 2,765 3,050 3,410 Misamis Occidental 18,213 18,847 18,971 18,845 19,402 Misamis Oriental 9,938 7,972 10,162 16,547 16,375
Davao Region 27,201 23,953 26,460 26,921 48,205 Davao del Norte 1,894 1,913 1,947 1,955 2,039 Davao del Sur 18,865 16,551 19,168 19,923 40,644 Davao Oriental 1,115 1,138 1,254 1,267 1,580 Compostela Valley 1,054 635 469 234 388 Davao City 4,273 3,716 3,622 3,541 3,553
SOCCSKSARGEN 44,413 41,048 42,317 43,896 48,121 North Cotabato 21,169 19,887 19,592 19,702 20,856 Sarangani 4,266 4,599 5,702 6,810 7,687 South Cotabato 16,743 14,462 14,829 15,069 17,068 Sultan Kudarat 2,236 2,099 2,194 2,315 2,511
Caraga 10,940 9,040 9,485 12,045 12,315 Agusan del Norte 10,625 8,760 9,177 11,719 12,042 Agusan del Sur 231 202 242 247 196 Dinagat Islands 9 1 Surigao del Norte 71 65 43 44 47 Surigao del Sur 13 13 24 27 29
ARMM 2,221 199 2,271 2,157 5,072 Basilan 69 65 61 58 59 Lanao del Sur 67 66 64 63 66 Maguindanao 2,058 33 2,105 1,985 4,882 Sulu Tawi-tawi 28 35 41 51 64
R/ - Revised due to inclusion of Batanes data.
Note: Dinagat Islands data dissagregated from Surigao del Norte.
Table 111. CARABAO MANGO: VOLUME OF PRODUCTION IN METRIC TON …Continued
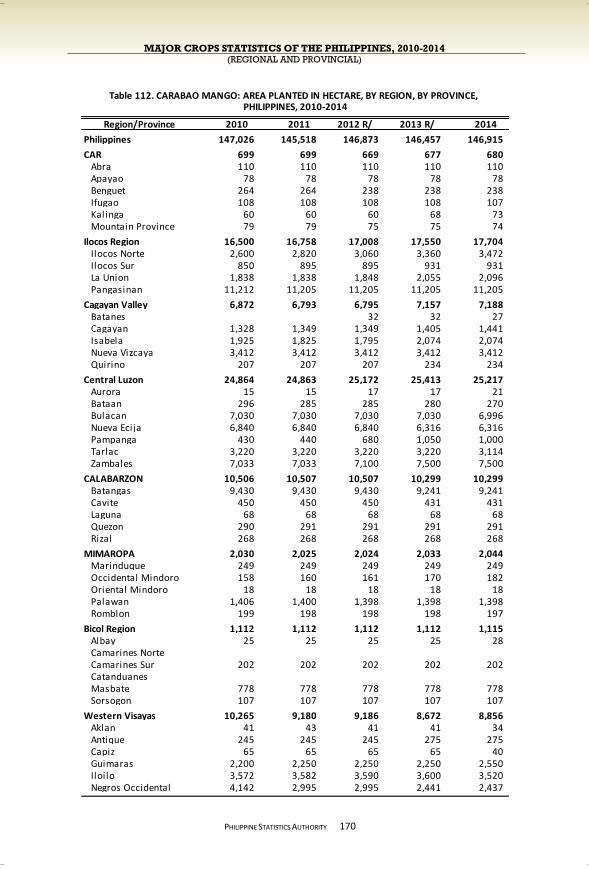
MAJOR CROPS STATISTICS OF THE PHILIPPINES, 2010-2014 (REGIONAL AND PROVINCIAL)
PHILIPPINE STATISTICS AUTHORITY
170
Region/Province 2010 2011 2012 R/ 2013 R/ 2014
Philippines 147,026 145,518 146,873 146,457 146,915
CAR 699 699 669 677 680 Abra 110 110 110 110 110 Apayao 78 78 78 78 78 Benguet 264 264 238 238 238 Ifugao 108 108 108 108 107 Kalinga 60 60 60 68 73 Mountain Province 79 79 75 75 74
Ilocos Region 16,500 16,758 17,008 17,550 17,704 Ilocos Norte 2,600 2,820 3,060 3,360 3,472 Ilocos Sur 850 895 895 931 931 La Union 1,838 1,838 1,848 2,055 2,096 Pangasinan 11,212 11,205 11,205 11,205 11,205
Cagayan Valley 6,872 6,793 6,795 7,157 7,188 Batanes 32 32 27 Cagayan 1,328 1,349 1,349 1,405 1,441 Isabela 1,925 1,825 1,795 2,074 2,074 Nueva Vizcaya 3,412 3,412 3,412 3,412 3,412 Quirino 207 207 207 234 234
Central Luzon 24,864 24,863 25,172 25,413 25,217 Aurora 15 15 17 17 21 Bataan 296 285 285 280 270 Bulacan 7,030 7,030 7,030 7,030 6,996 Nueva Ecija 6,840 6,840 6,840 6,316 6,316 Pampanga 430 440 680 1,050 1,000 Tarlac 3,220 3,220 3,220 3,220 3,114 Zambales 7,033 7,033 7,100 7,500 7,500
CALABARZON 10,506 10,507 10,507 10,299 10,299 Batangas 9,430 9,430 9,430 9,241 9,241 Cavite 450 450 450 431 431 Laguna 68 68 68 68 68 Quezon 290 291 291 291 291 Rizal 268 268 268 268 268
MIMAROPA 2,030 2,025 2,024 2,033 2,044 Marinduque 249 249 249 249 249 Occidental Mindoro 158 160 161 170 182 Oriental Mindoro 18 18 18 18 18 Palawan 1,406 1,400 1,398 1,398 1,398 Romblon 199 198 198 198 197
Bicol Region 1,112 1,112 1,112 1,112 1,115 Albay 25 25 25 25 28 Camarines Norte Camarines Sur 202 202 202 202 202 Catanduanes Masbate 778 778 778 778 778 Sorsogon 107 107 107 107 107
Western Visayas 10,265 9,180 9,186 8,672 8,856 Aklan 41 43 41 41 34 Antique 245 245 245 275 275 Capiz 65 65 65 65 40 Guimaras 2,200 2,250 2,250 2,250 2,550 Iloilo 3,572 3,582 3,590 3,600 3,520 Negros Occidental 4,142 2,995 2,995 2,441 2,437
PHILIPPINES, 2010-2014Table 112. CARABAO MANGO: AREA PLANTED IN HECTARE, BY REGION, BY PROVINCE,
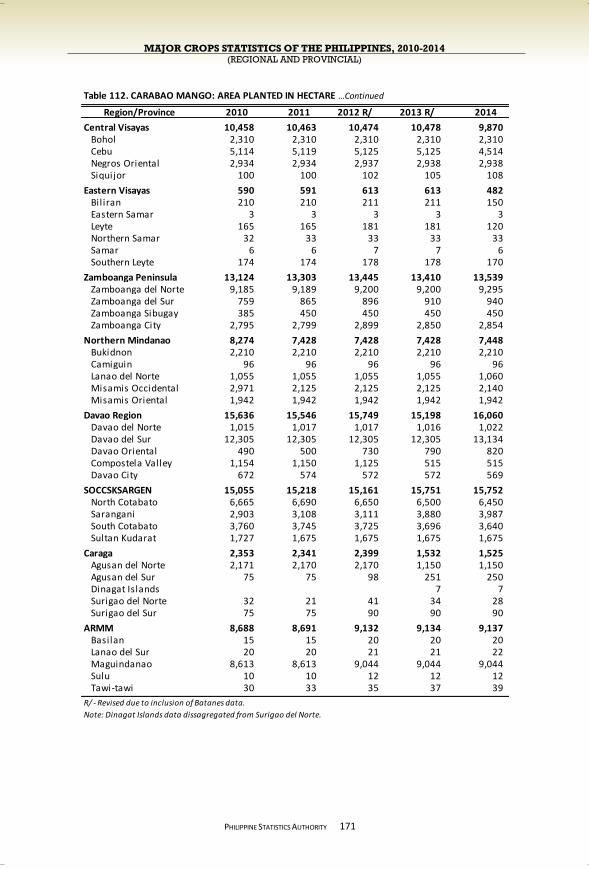
MAJOR CROPS STATISTICS OF THE PHILIPPINES, 2010-2014 (REGIONAL AND PROVINCIAL)
PHILIPPINE STATISTICS AUTHORITY
171
Region/Province 2010 2011 2012 R/ 2013 R/ 2014
Central Visayas 10,458 10,463 10,474 10,478 9,870 Bohol 2,310 2,310 2,310 2,310 2,310 Cebu 5,114 5,119 5,125 5,125 4,514 Negros Oriental 2,934 2,934 2,937 2,938 2,938 Siquijor 100 100 102 105 108
Eastern Visayas 590 591 613 613 482 Bil iran 210 210 211 211 150 Eastern Samar 3 3 3 3 3 Leyte 165 165 181 181 120 Northern Samar 32 33 33 33 33 Samar 6 6 7 7 6 Southern Leyte 174 174 178 178 170
Zamboanga Peninsula 13,124 13,303 13,445 13,410 13,539 Zamboanga del Norte 9,185 9,189 9,200 9,200 9,295 Zamboanga del Sur 759 865 896 910 940 Zamboanga Sibugay 385 450 450 450 450 Zamboanga City 2,795 2,799 2,899 2,850 2,854
Northern Mindanao 8,274 7,428 7,428 7,428 7,448 Bukidnon 2,210 2,210 2,210 2,210 2,210 Camiguin 96 96 96 96 96 Lanao del Norte 1,055 1,055 1,055 1,055 1,060 Misamis Occidental 2,971 2,125 2,125 2,125 2,140 Misamis Oriental 1,942 1,942 1,942 1,942 1,942
Davao Region 15,636 15,546 15,749 15,198 16,060 Davao del Norte 1,015 1,017 1,017 1,016 1,022 Davao del Sur 12,305 12,305 12,305 12,305 13,134 Davao Oriental 490 500 730 790 820 Compostela Valley 1,154 1,150 1,125 515 515 Davao City 672 574 572 572 569
SOCCSKSARGEN 15,055 15,218 15,161 15,751 15,752 North Cotabato 6,665 6,690 6,650 6,500 6,450 Sarangani 2,903 3,108 3,111 3,880 3,987 South Cotabato 3,760 3,745 3,725 3,696 3,640 Sultan Kudarat 1,727 1,675 1,675 1,675 1,675
Caraga 2,353 2,341 2,399 1,532 1,525 Agusan del Norte 2,171 2,170 2,170 1,150 1,150 Agusan del Sur 75 75 98 251 250 Dinagat Islands 7 7 Surigao del Norte 32 21 41 34 28 Surigao del Sur 75 75 90 90 90
ARMM 8,688 8,691 9,132 9,134 9,137 Basilan 15 15 20 20 20 Lanao del Sur 20 20 21 21 22 Maguindanao 8,613 8,613 9,044 9,044 9,044 Sulu 10 10 12 12 12 Tawi-tawi 30 33 35 37 39
R/ - Revised due to inclusion of Batanes data.
Note: Dinagat Islands data dissagregated from Surigao del Norte.
Table 112. CARABAO MANGO: AREA PLANTED IN HECTARE …Continued

MAJOR CROPS STATISTICS OF THE PHILIPPINES, 2010-2014 (REGIONAL AND PROVINCIAL)
PHILIPPINE STATISTICS AUTHORITY
172
Region/Province 2010 2011 2012 R/ 2013 R/ 2014
Philippines 6,228,015 6,333,898 6,531,308 6,499,493 6,884,636
CAR 30,291 30,116 28,856 29,486 30,102 Abra 5,280 5,280 5,280 5,610 5,610 Apayao 2,200 2,200 2,200 2,200 2,950 Benguet 10,608 10,608 9,560 9,560 9,560 Ifugao 5,360 5,200 5,200 5,250 5,100 Kalinga 3,150 3,135 3,135 3,385 3,385 Mountain Province 3,693 3,693 3,481 3,481 3,497
Ilocos Region 541,887 543,765 544,978 547,447 555,071 Ilocos Norte 102,500 102,920 103,040 104,460 104,900 Ilocos Sur 23,157 27,313 28,405 28,405 28,405 La Union 64,016 64,016 64,016 65,066 72,250 Pangasinan 352,214 349,516 349,516 349,516 349,516
Cagayan Valley 508,914 584,015 584,111 584,149 588,089 Batanes 3,000 3,052 2,558 Cagayan 60,814 60,885 60,981 60,967 62,296 Isabela 170,970 162,000 159,000 159,000 161,105 Nueva Vizcaya 256,000 340,000 340,000 340,000 340,000 Quirino 21,130 21,130 21,130 21,130 22,130
Central Luzon 1,145,970 1,187,828 1,334,224 1,345,551 1,330,969 Aurora 250 308 680 710 850 Bataan 18,000 16,500 15,500 15,500 15,800 Bulacan 350,700 350,250 350,250 356,796 356,796 Nueva Ecija 401,870 401,870 401,870 401,872 384,000 Pampanga 9,500 10,500 23,324 26,833 26,833 Tarlac 66,400 66,400 166,400 156,240 156,240 Zambales 299,250 342,000 376,200 387,600 390,450
CALABARZON 659,473 660,323 660,623 595,093 790,463 Batangas 620,000 620,000 620,000 554,460 750,050 Cavite 17,500 17,500 17,500 17,500 17,500 Laguna 1,660 1,660 1,660 1,670 1,750 Quezon 8,350 9,200 9,500 9,500 9,200 Rizal 11,963 11,963 11,963 11,963 11,963
MIMAROPA 104,583 104,526 104,952 105,597 106,148 Marinduque 3,885 3,885 3,885 3,880 3,850 Occidental Mindoro 8,712 9,255 9,850 10,500 11,100 Oriental Mindoro 452 452 452 452 475 Palawan 85,766 85,166 85,000 85,000 85,000 Romblon 5,768 5,768 5,765 5,765 5,723
Bicol Region 9,874 9,910 10,037 10,037 10,127 Albay 864 900 950 950 1,040 Camarines Norte Camarines Sur 750 750 750 750 750 Catanduanes Masbate 4,785 4,785 4,859 4,859 4,859 Sorsogon 3,475 3,475 3,478 3,478 3,478
Western Visayas 453,842 428,162 429,429 368,675 364,183 Aklan 480 760 480 760 612 Antique 7,042 6,760 6,557 6,545 6,229 Capiz 3,600 3,600 3,600 3,600 2,000 Guimaras 119,950 119,950 121,500 121,500 122,800 Iloilo 110,500 110,800 111,000 111,500 108,000 Negros Occidental 212,270 186,292 186,292 124,770 124,542
PHILIPPINES, 2010-2014Table 113. CARABAO MANGO: NUMBER OF BEARING TREES, BY REGION, BY PROVINCE,

MAJOR CROPS STATISTICS OF THE PHILIPPINES, 2010-2014 (REGIONAL AND PROVINCIAL)
PHILIPPINE STATISTICS AUTHORITY
173
Region/Province 2010 2011 2012 R/ 2013 R/ 2014
Central Visayas 475,755 477,402 477,808 478,205 475,835 Bohol 48,493 48,493 48,493 48,493 48,493 Cebu 287,447 287,447 287,597 287,597 284,897 Negros Oriental 135,815 137,457 137,457 137,430 137,430 Siquijor 4,000 4,005 4,261 4,685 5,015
Eastern Visayas 10,488 11,336 11,679 11,853 10,081 Bil iran 1,645 2,340 2,345 2,345 2,120 Eastern Samar 110 110 110 110 86 Leyte 2,520 2,660 2,998 3,168 1,821 Northern Samar 2,053 2,053 2,053 2,053 2,110 Samar 210 215 215 217 209 Southern Leyte 3,950 3,958 3,958 3,960 3,735
Zamboanga Peninsula 720,410 724,450 732,310 731,870 732,965 Zamboanga del Norte 559,800 560,000 560,100 560,145 560,855 Zamboanga del Sur 60,000 63,400 67,520 67,525 67,550 Zamboanga Sibugay 14,750 15,060 17,700 17,700 17,820 Zamboanga City 85,860 85,990 86,990 86,500 86,740
Northern Mindanao 366,545 368,361 378,151 380,651 392,711 Bukidnon 140,050 140,050 140,050 140,050 140,050 Camiguin 2,725 2,701 2,701 2,701 2,701 Lanao del Norte 33,760 35,800 42,000 43,500 47,500 Misamis Occidental 38,400 38,110 38,400 38,400 42,460 Misamis Oriental 151,610 151,700 155,000 156,000 160,000
Davao Region 241,279 232,026 232,360 218,485 368,190 Davao del Norte 52,946 53,127 53,127 53,087 53,212 Davao del Sur 101,347 99,138 99,138 99,138 247,845 Davao Oriental 23,455 23,455 24,600 24,740 26,700 Compostela Valley 31,265 31,050 30,375 16,400 15,450 Davao City 32,266 25,256 25,120 25,120 24,983
SOCCSKSARGEN 767,374 779,938 797,509 834,316 861,360 North Cotabato 368,000 368,000 367,500 367,500 360,000 Sarangani 168,550 181,090 185,110 212,604 232,160 South Cotabato 153,180 155,464 169,335 178,648 193,636 Sultan Kudarat 77,644 75,384 75,564 75,564 75,564
Caraga 58,370 58,755 71,276 121,213 121,213 Agusan del Norte 54,170 54,920 65,000 93,689 93,689 Agusan del Sur 2,400 2,400 3,111 21,664 21,664 Dinagat Islands 659 659 Surigao del Norte 1,050 665 1,165 3,201 3,201 Surigao del Sur 750 770 2,000 2,000 2,000
ARMM 132,960 132,985 133,005 136,865 147,129 Basilan 420 420 420 500 420 Lanao del Sur 765 765 765 765 765 Maguindanao 131,250 131,250 131,250 135,000 145,244 Sulu Tawi-tawi 525 550 570 600 700
R/ - Revised due to inclusion of Batanes data.
Note: Dinagat Islands data dissagregated from Surigao del Norte.
Table 113. CARABAO MANGO: NUMBER OF BEARING TREES …Continued
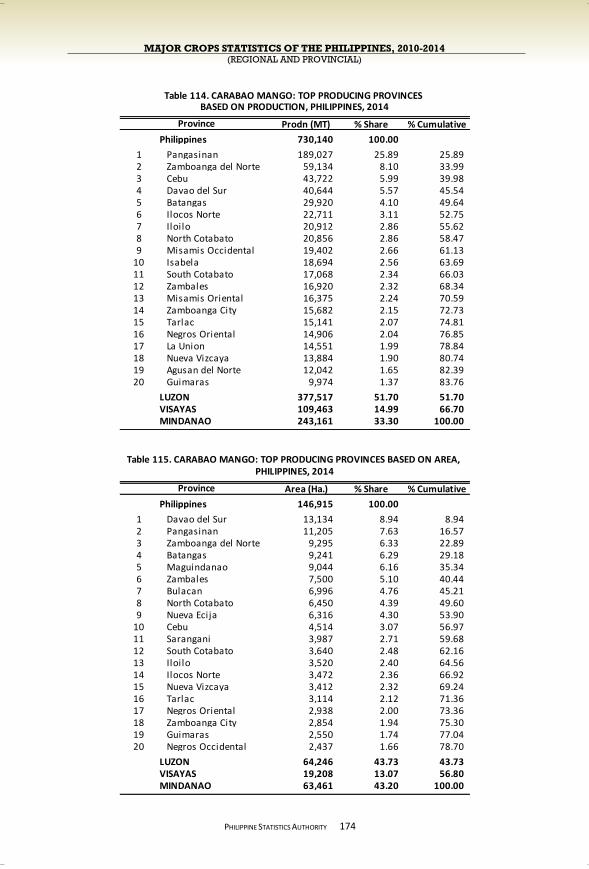
MAJOR CROPS STATISTICS OF THE PHILIPPINES, 2010-2014 (REGIONAL AND PROVINCIAL)
PHILIPPINE STATISTICS AUTHORITY
174
Prodn (MT) % Share % Cumulative
Philippines 730,140 100.00
1 Pangasinan 189,027 25.89 25.89 2 Zamboanga del Norte 59,134 8.10 33.99 3 Cebu 43,722 5.99 39.98 4 Davao del Sur 40,644 5.57 45.54 5 Batangas 29,920 4.10 49.64 6 Ilocos Norte 22,711 3.11 52.75 7 Iloilo 20,912 2.86 55.62 8 North Cotabato 20,856 2.86 58.47 9 Misamis Occidental 19,402 2.66 61.13
10 Isabela 18,694 2.56 63.69 11 South Cotabato 17,068 2.34 66.03 12 Zambales 16,920 2.32 68.34 13 Misamis Oriental 16,375 2.24 70.59 14 Zamboanga City 15,682 2.15 72.73 15 Tarlac 15,141 2.07 74.81 16 Negros Oriental 14,906 2.04 76.85 17 La Union 14,551 1.99 78.84 18 Nueva Vizcaya 13,884 1.90 80.74 19 Agusan del Norte 12,042 1.65 82.39 20 Guimaras 9,974 1.37 83.76
LUZON 377,517 51.70 51.70 VISAYAS 109,463 14.99 66.70 MINDANAO 243,161 33.30 100.00
Area (Ha.) % Share % Cumulative
Philippines 146,915 100.00
1 Davao del Sur 13,134 8.94 8.94 2 Pangasinan 11,205 7.63 16.57 3 Zamboanga del Norte 9,295 6.33 22.89 4 Batangas 9,241 6.29 29.18 5 Maguindanao 9,044 6.16 35.34 6 Zambales 7,500 5.10 40.44 7 Bulacan 6,996 4.76 45.21 8 North Cotabato 6,450 4.39 49.60 9 Nueva Ecija 6,316 4.30 53.90
10 Cebu 4,514 3.07 56.97 11 Sarangani 3,987 2.71 59.68 12 South Cotabato 3,640 2.48 62.16 13 Iloilo 3,520 2.40 64.56 14 Ilocos Norte 3,472 2.36 66.92 15 Nueva Vizcaya 3,412 2.32 69.24 16 Tarlac 3,114 2.12 71.36 17 Negros Oriental 2,938 2.00 73.36 18 Zamboanga City 2,854 1.94 75.30 19 Guimaras 2,550 1.74 77.04 20 Negros Occidental 2,437 1.66 78.70
LUZON 64,246 43.73 43.73 VISAYAS 19,208 13.07 56.80 MINDANAO 63,461 43.20 100.00
Province
Table 114. CARABAO MANGO: TOP PRODUCING PROVINCES
Table 115. CARABAO MANGO: TOP PRODUCING PROVINCES BASED ON AREA,
Province
PHILIPPINES, 2014
BASED ON PRODUCTION, PHILIPPINES, 2014
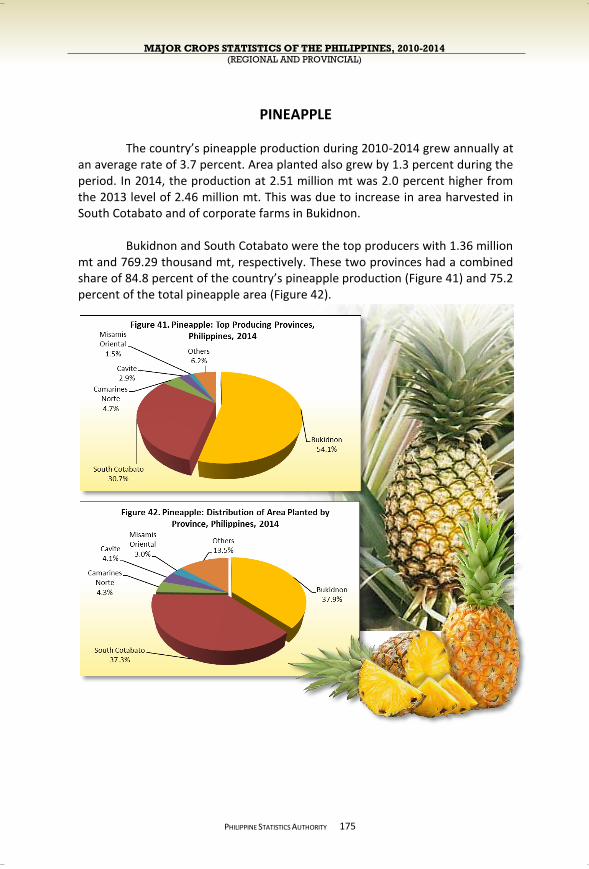
MAJOR CROPS STATISTICS OF THE PHILIPPINES, 2010-2014 (REGIONAL AND PROVINCIAL)
PHILIPPINE STATISTICS AUTHORITY
PINEAPPLE
The country’s pineapple production during 2010-2014 grew annually at an average rate of 3.7 percent. Area planted also grew by 1.3 percent during the period. In 2014, the production at 2.51 million mt was 2.0 percent higher from the 2013 level of 2.46 million mt. This was due to increase in area harvested in South Cotabato and of corporate farms in Bukidnon.
Bukidnon and South Cotabato were the top producers with 1.36 million mt and 769.29 thousand mt, respectively. These two provinces had a combined share of 84.8 percent of the country’s pineapple production (Figure 41) and 75.2 percent of the total pineapple area (Figure 42).
175
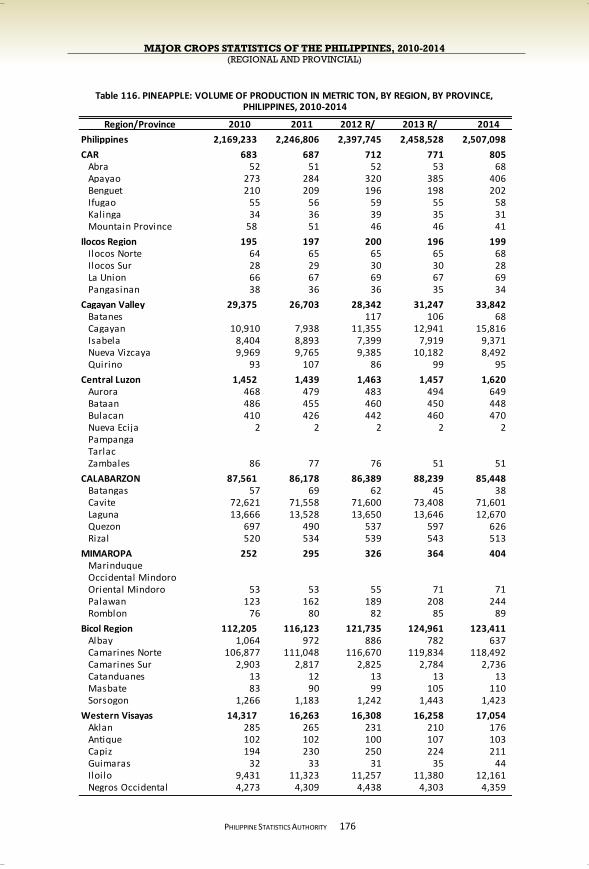
MAJOR CROPS STATISTICS OF THE PHILIPPINES, 2010-2014 (REGIONAL AND PROVINCIAL)
PHILIPPINE STATISTICS AUTHORITY
176
Region/Province 2010 2011 2012 R/ 2013 R/ 2014
Philippines 2,169,233 2,246,806 2,397,745 2,458,528 2,507,098
CAR 683 687 712 771 805 Abra 52 51 52 53 68 Apayao 273 284 320 385 406 Benguet 210 209 196 198 202 Ifugao 55 56 59 55 58 Kalinga 34 36 39 35 31 Mountain Province 58 51 46 46 41
Ilocos Region 195 197 200 196 199 Ilocos Norte 64 65 65 65 68 Ilocos Sur 28 29 30 30 28 La Union 66 67 69 67 69 Pangasinan 38 36 36 35 34
Cagayan Valley 29,375 26,703 28,342 31,247 33,842 Batanes 117 106 68 Cagayan 10,910 7,938 11,355 12,941 15,816 Isabela 8,404 8,893 7,399 7,919 9,371 Nueva Vizcaya 9,969 9,765 9,385 10,182 8,492 Quirino 93 107 86 99 95
Central Luzon 1,452 1,439 1,463 1,457 1,620 Aurora 468 479 483 494 649 Bataan 486 455 460 450 448 Bulacan 410 426 442 460 470 Nueva Ecija 2 2 2 2 2 Pampanga Tarlac Zambales 86 77 76 51 51
CALABARZON 87,561 86,178 86,389 88,239 85,448 Batangas 57 69 62 45 38 Cavite 72,621 71,558 71,600 73,408 71,601 Laguna 13,666 13,528 13,650 13,646 12,670 Quezon 697 490 537 597 626 Rizal 520 534 539 543 513
MIMAROPA 252 295 326 364 404 Marinduque Occidental Mindoro Oriental Mindoro 53 53 55 71 71 Palawan 123 162 189 208 244 Romblon 76 80 82 85 89
Bicol Region 112,205 116,123 121,735 124,961 123,411 Albay 1,064 972 886 782 637 Camarines Norte 106,877 111,048 116,670 119,834 118,492 Camarines Sur 2,903 2,817 2,825 2,784 2,736 Catanduanes 13 12 13 13 13 Masbate 83 90 99 105 110 Sorsogon 1,266 1,183 1,242 1,443 1,423
Western Visayas 14,317 16,263 16,308 16,258 17,054 Aklan 285 265 231 210 176 Antique 102 102 100 107 103 Capiz 194 230 250 224 211 Guimaras 32 33 31 35 44 Iloilo 9,431 11,323 11,257 11,380 12,161 Negros Occidental 4,273 4,309 4,438 4,303 4,359
PHILIPPINES, 2010-2014Table 116. PINEAPPLE: VOLUME OF PRODUCTION IN METRIC TON, BY REGION, BY PROVINCE,
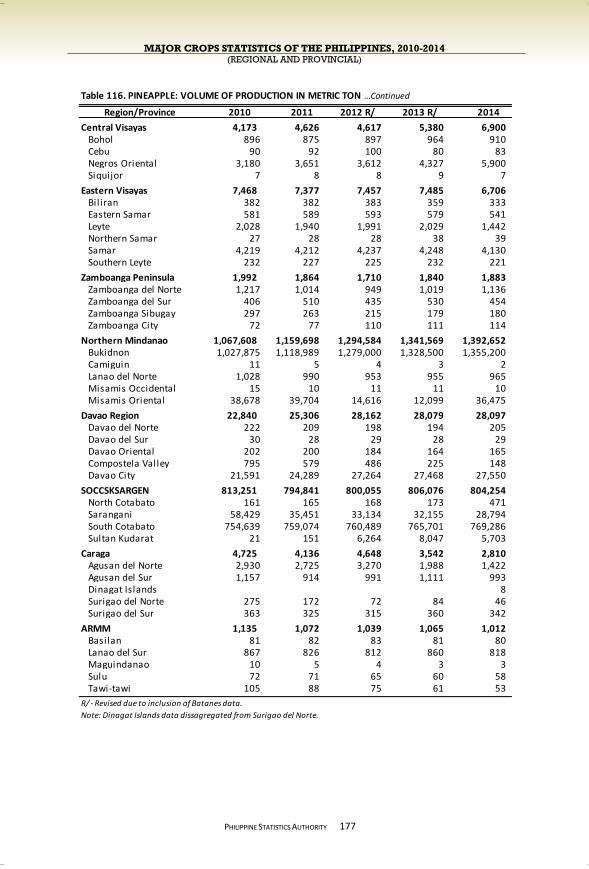
MAJOR CROPS STATISTICS OF THE PHILIPPINES, 2010-2014 (REGIONAL AND PROVINCIAL)
PHILIPPINE STATISTICS AUTHORITY
177
Region/Province 2010 2011 2012 R/ 2013 R/ 2014
Central Visayas 4,173 4,626 4,617 5,380 6,900 Bohol 896 875 897 964 910 Cebu 90 92 100 80 83 Negros Oriental 3,180 3,651 3,612 4,327 5,900 Siquijor 7 8 8 9 7
Eastern Visayas 7,468 7,377 7,457 7,485 6,706 Bil iran 382 382 383 359 333 Eastern Samar 581 589 593 579 541 Leyte 2,028 1,940 1,991 2,029 1,442 Northern Samar 27 28 28 38 39 Samar 4,219 4,212 4,237 4,248 4,130 Southern Leyte 232 227 225 232 221
Zamboanga Peninsula 1,992 1,864 1,710 1,840 1,883 Zamboanga del Norte 1,217 1,014 949 1,019 1,136 Zamboanga del Sur 406 510 435 530 454 Zamboanga Sibugay 297 263 215 179 180 Zamboanga City 72 77 110 111 114
Northern Mindanao 1,067,608 1,159,698 1,294,584 1,341,569 1,392,652 Bukidnon 1,027,875 1,118,989 1,279,000 1,328,500 1,355,200 Camiguin 11 5 4 3 2 Lanao del Norte 1,028 990 953 955 965 Misamis Occidental 15 10 11 11 10 Misamis Oriental 38,678 39,704 14,616 12,099 36,475
Davao Region 22,840 25,306 28,162 28,079 28,097 Davao del Norte 222 209 198 194 205 Davao del Sur 30 28 29 28 29 Davao Oriental 202 200 184 164 165 Compostela Valley 795 579 486 225 148 Davao City 21,591 24,289 27,264 27,468 27,550
SOCCSKSARGEN 813,251 794,841 800,055 806,076 804,254 North Cotabato 161 165 168 173 471 Sarangani 58,429 35,451 33,134 32,155 28,794 South Cotabato 754,639 759,074 760,489 765,701 769,286 Sultan Kudarat 21 151 6,264 8,047 5,703
Caraga 4,725 4,136 4,648 3,542 2,810 Agusan del Norte 2,930 2,725 3,270 1,988 1,422 Agusan del Sur 1,157 914 991 1,111 993 Dinagat Islands 8 Surigao del Norte 275 172 72 84 46 Surigao del Sur 363 325 315 360 342
ARMM 1,135 1,072 1,039 1,065 1,012 Basilan 81 82 83 81 80 Lanao del Sur 867 826 812 860 818 Maguindanao 10 5 4 3 3 Sulu 72 71 65 60 58 Tawi-tawi 105 88 75 61 53
R/ - Revised due to inclusion of Batanes data.
Note: Dinagat Islands data dissagregated from Surigao del Norte.
Table 116. PINEAPPLE: VOLUME OF PRODUCTION IN METRIC TON …Continued

MAJOR CROPS STATISTICS OF THE PHILIPPINES, 2010-2014 (REGIONAL AND PROVINCIAL)
PHILIPPINE STATISTICS AUTHORITY
178
Region/Province 2010 2011 2012 R/ 2013 R/ 2014
Philippines 58,547 58,457 58,450 60,759 61,643
CAR 117 114 117 111 109 Abra 3 3 3 3 3 Apayao 32 34 38 40 40 Benguet 41 40 40 40 40 Ifugao 11 11 11 11 12 Kalinga 21 18 18 10 8 Mountain Province 9 8 7 7 6
Ilocos Region 30 27 27 26 26 Ilocos Norte 12 10 10 9 8 Ilocos Sur 6 6 6 6 6 La Union 9 9 9 9 9 Pangasinan 2 2 2 2 2
Cagayan Valley 1,506 1,528 1,225 1,251 1,295 Batanes 8 9 7 Cagayan 632 652 642 652 697 Isabela 598 600 300 315 316 Nueva Vizcaya 268 268 268 268 268 Quirino 8 8 7 7 7
CENTRAL LUZON 146 151 153 157 163 Aurora 92 97 98 102 112 Bataan 21 21 21 21 20 Bulacan 25 26 27 27 25 Nueva Ecija 3 2 2 2 1 Pampanga Tarlac Zambales 5 5 5 5 5
CALABARZON 4,023 3,869 3,837 3,840 3,772 Batangas 20 25 25 19 4 Cavite 2,630 2,635 2,600 2,610 2,639 Laguna 1,264 1,100 1,101 1,102 1,020 Quezon 67 67 69 67 67 Rizal 42 42 42 42 42
MIMAROPA 66 70 73 75 77 Marinduque Occidental Mindoro Oriental Mindoro 5 5 4 5 6 Palawan 42 45 49 49 50 Romblon 19 20 20 21 21
Bicol Region 3,079 3,084 3,093 3,083 3,078 Albay 75 70 70 60 55 Camarines Norte 2,510 2,520 2,525 2,525 2,525 Camarines Sur 335 335 335 335 335 Catanduanes 4 4 4 4 4 Masbate 6 6 6 6 6 Sorsogon 149 149 153 153 153
Western Visayas 725 782 839 845 860 Aklan 18 16 12 12 4 Antique 16 16 16 17 17 Capiz 17 20 22 22 19 Guimaras 9 10 12 12 10 Iloilo 265 320 377 382 410 Negros Occidental 400 400 400 400 400
Table 117. PINEAPPLE: AREA PLANTED IN HECTARE, BY REGION, BY PROVINCE, PHILIPPINES, 2010-2014

MAJOR CROPS STATISTICS OF THE PHILIPPINES, 2010-2014 (REGIONAL AND PROVINCIAL)
PHILIPPINE STATISTICS AUTHORITY
179
Region/Province 2010 2011 2012 R/ 2013 R/ 2014
Central Visayas 451 452 452 474 470 Bohol 44 44 45 45 42 Cebu 6 6 6 4 4 Negros Oriental 399 400 399 424 424 Siquijor 2 2 2 2 1
Eastern Visayas 560 566 583 584 552 Bil iran 46 46 46 45 40 Eastern Samar 30 32 32 32 25 Leyte 160 162 178 178 160 Northern Samar 6 6 6 6 6 Samar 265 267 275 277 277 Southern Leyte 53 53 46 46 44
Zamboanga Peninsula 398 356 350 327 305 Zamboanga del Norte 280 246 245 240 240 Zamboanga del Sur 58 50 44 41 39 Zamboanga Sibugay 55 55 55 40 20 Zamboanga City 5 5 6 6 6
Northern Mindanao 21,547 21,979 21,593 23,108 24,100 Bukidnon 20,000 20,500 21,000 22,000 23,000 Camiguin 1 1 1 1 0.40 Lanao del Norte 128 120 100 102 95 Misamis Occidental 5 5 5 5 5 Misamis Oriental 1,413 1,353 487 1,000 1,000
Davao Region 2,053 2,052 2,033 1,978 1,978 Davao del Norte 48 47 46 42 44 Davao del Sur 6 6 5 5 5 Davao Oriental 48 47 45 38 40 Compostela Valley 120 120 105 68 65 Davao City 1,831 1,832 1,832 1,825 1,824
SOCCSKSARGEN 23,269 22,850 23,485 24,580 24,545 North Cotabato 48 49 49 115 135 Sarangani 1,440 982 942 885 784 South Cotabato 21,707 21,710 22,144 23,230 23,346 Sultan Kudarat 74 109 350 350 280
Caraga 488 488 499 230 219 Agusan del Norte 260 265 266 65 65 Agusan del Sur 143 145 150 85 80 Dinagat Islands 10 Surigao del Norte 35 28 28 30 19 Surigao del Sur 50 50 55 50 45
ARMM 89 90 92 91 93 Basilan 8 8 8 8 8 Lanao del Sur 55 55 57 57 60 Maguindanao 2 2 2 2 2 Sulu 9 10 11 11 10 Tawi-tawi 15 15 14 13 13
R/ - Revised due to inclusion of Batanes data.
Note: Dinagat Islands data dissagregated from Surigao del Norte.
Table 117. PINEAPPLE: AREA PLANTED IN HECTARE, BY REGION …Continued
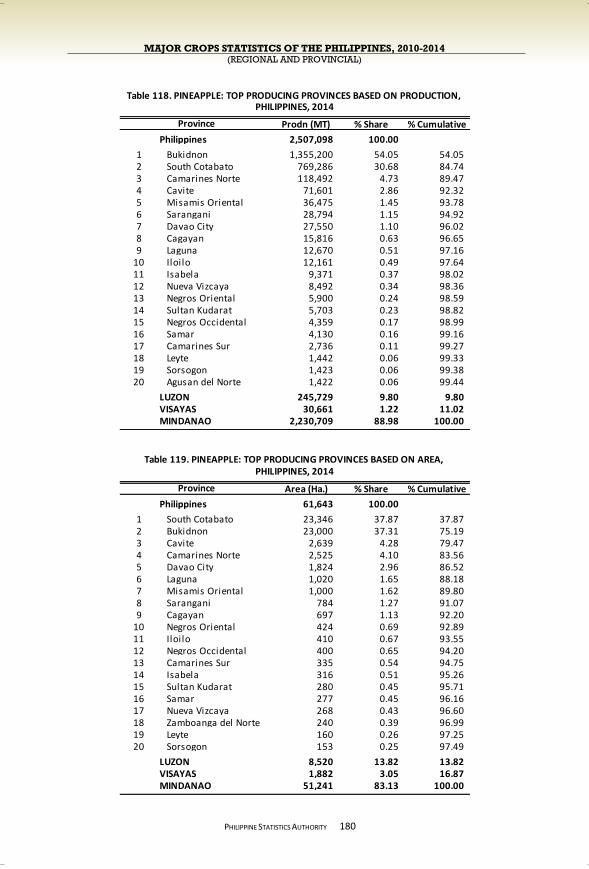
MAJOR CROPS STATISTICS OF THE PHILIPPINES, 2010-2014 (REGIONAL AND PROVINCIAL)
PHILIPPINE STATISTICS AUTHORITY
180
Prodn (MT) % Share % Cumulative
Philippines 2,507,098 100.00
1 Bukidnon 1,355,200 54.05 54.05 2 South Cotabato 769,286 30.68 84.74 3 Camarines Norte 118,492 4.73 89.47 4 Cavite 71,601 2.86 92.32 5 Misamis Oriental 36,475 1.45 93.78 6 Sarangani 28,794 1.15 94.92 7 Davao City 27,550 1.10 96.02 8 Cagayan 15,816 0.63 96.65 9 Laguna 12,670 0.51 97.16
10 Iloilo 12,161 0.49 97.64 11 Isabela 9,371 0.37 98.02 12 Nueva Vizcaya 8,492 0.34 98.36 13 Negros Oriental 5,900 0.24 98.59 14 Sultan Kudarat 5,703 0.23 98.82 15 Negros Occidental 4,359 0.17 98.99 16 Samar 4,130 0.16 99.16 17 Camarines Sur 2,736 0.11 99.27 18 Leyte 1,442 0.06 99.33 19 Sorsogon 1,423 0.06 99.38 20 Agusan del Norte 1,422 0.06 99.44
LUZON 245,729 9.80 9.80 VISAYAS 30,661 1.22 11.02 MINDANAO 2,230,709 88.98 100.00
Area (Ha.) % Share % Cumulative
Philippines 61,643 100.00
1 South Cotabato 23,346 37.87 37.87 2 Bukidnon 23,000 37.31 75.19 3 Cavite 2,639 4.28 79.47 4 Camarines Norte 2,525 4.10 83.56 5 Davao City 1,824 2.96 86.52 6 Laguna 1,020 1.65 88.18 7 Misamis Oriental 1,000 1.62 89.80 8 Sarangani 784 1.27 91.07 9 Cagayan 697 1.13 92.20
10 Negros Oriental 424 0.69 92.89 11 Iloilo 410 0.67 93.55 12 Negros Occidental 400 0.65 94.20 13 Camarines Sur 335 0.54 94.75 14 Isabela 316 0.51 95.26 15 Sultan Kudarat 280 0.45 95.71 16 Samar 277 0.45 96.16 17 Nueva Vizcaya 268 0.43 96.60 18 Zamboanga del Norte 240 0.39 96.99 19 Leyte 160 0.26 97.25 20 Sorsogon 153 0.25 97.49
LUZON 8,520 13.82 13.82 VISAYAS 1,882 3.05 16.87 MINDANAO 51,241 83.13 100.00
Province
Table 118. PINEAPPLE: TOP PRODUCING PROVINCES BASED ON PRODUCTION,
Table 119. PINEAPPLE: TOP PRODUCING PROVINCES BASED ON AREA,
Province
PHILIPPINES, 2014
PHILIPPINES, 2014
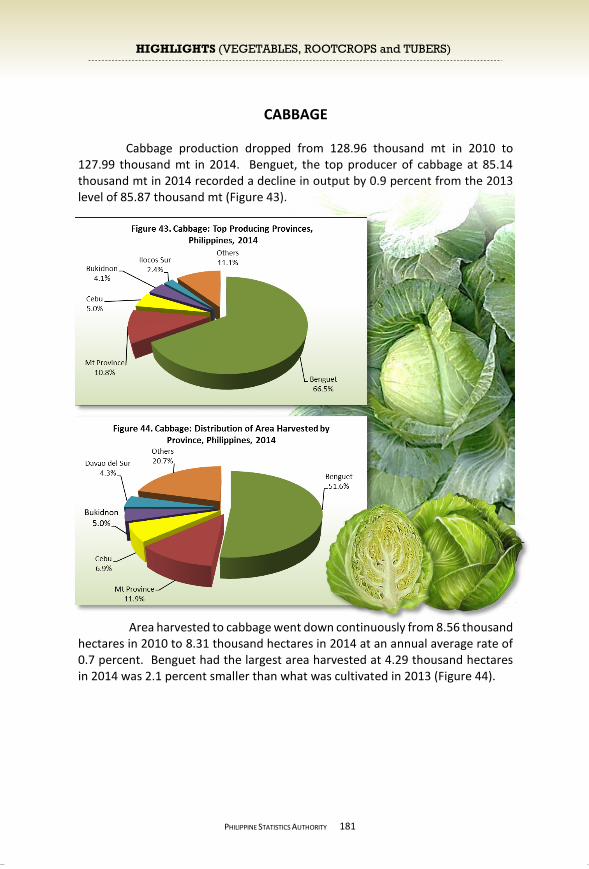
MAJOR CROPS STATISTICS OF THE PHILIPPINES, 2010-2014 (REGIONAL AND PROVINCIAL)
PHILIPPINE STATISTICS AUTHORITY
CABBAGE Cabbage production dropped from 128.96 thousand mt in 2010 to
127.99 thousand mt in 2014. Benguet, the top producer of cabbage at 85.14 thousand mt in 2014 recorded a decline in output by 0.9 percent from the 2013 level of 85.87 thousand mt (Figure 43).
Area harvested to cabbage went down continuously from 8.56 thousand hectares in 2010 to 8.31 thousand hectares in 2014 at an annual average rate of 0.7 percent. Benguet had the largest area harvested at 4.29 thousand hectares in 2014 was 2.1 percent smaller than what was cultivated in 2013 (Figure 44).
181
HIGHLIGHTS (VEGETABLES, ROOTCROPS and TUBERS)
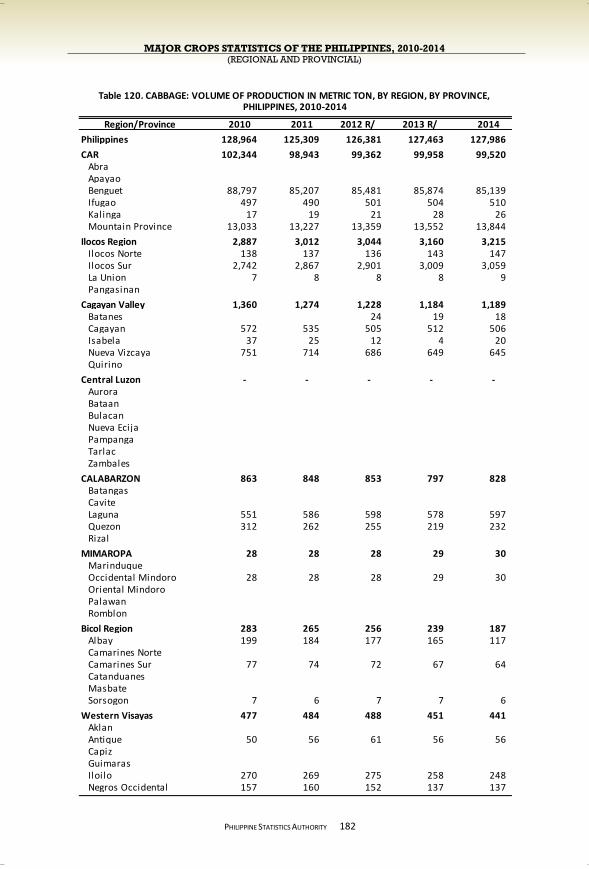
MAJOR CROPS STATISTICS OF THE PHILIPPINES, 2010-2014 (REGIONAL AND PROVINCIAL)
PHILIPPINE STATISTICS AUTHORITY
*9
182
Region/Province 2010 2011 2012 R/ 2013 R/ 2014
Philippines 128,964 125,309 126,381 127,463 127,986
CAR 102,344 98,943 99,362 99,958 99,520 Abra Apayao Benguet 88,797 85,207 85,481 85,874 85,139 Ifugao 497 490 501 504 510 Kalinga 17 19 21 28 26 Mountain Province 13,033 13,227 13,359 13,552 13,844
Ilocos Region 2,887 3,012 3,044 3,160 3,215 Ilocos Norte 138 137 136 143 147 Ilocos Sur 2,742 2,867 2,901 3,009 3,059 La Union 7 8 8 8 9 Pangasinan
Cagayan Valley 1,360 1,274 1,228 1,184 1,189 Batanes 24 19 18 Cagayan 572 535 505 512 506 Isabela 37 25 12 4 20 Nueva Vizcaya 751 714 686 649 645 Quirino
Central Luzon - - - - - Aurora Bataan Bulacan Nueva Ecija Pampanga Tarlac Zambales
CALABARZON 863 848 853 797 828 Batangas Cavite Laguna 551 586 598 578 597 Quezon 312 262 255 219 232 Rizal
MIMAROPA 28 28 28 29 30 Marinduque Occidental Mindoro 28 28 28 29 30 Oriental Mindoro Palawan Romblon
Bicol Region 283 265 256 239 187 Albay 199 184 177 165 117 Camarines Norte Camarines Sur 77 74 72 67 64 Catanduanes Masbate Sorsogon 7 6 7 7 6
Western Visayas 477 484 488 451 441 Aklan Antique 50 56 61 56 56 Capiz Guimaras Iloilo 270 269 275 258 248 Negros Occidental 157 160 152 137 137
PHILIPPINES, 2010-2014Table 120. CABBAGE: VOLUME OF PRODUCTION IN METRIC TON, BY REGION, BY PROVINCE,

MAJOR CROPS STATISTICS OF THE PHILIPPINES, 2010-2014 (REGIONAL AND PROVINCIAL)
PHILIPPINE STATISTICS AUTHORITY
183
Region/Province 2010 2011 2012 R/ 2013 R/ 2014
Central Visayas 7,786 7,947 8,199 8,519 8,688 Bohol Cebu 5,877 5,991 5,921 6,214 6,418 Negros Oriental 1,910 1,957 2,278 2,303 2,270 Siquijor 0.06 1 0.34
Eastern Visayas 188 181 180 149 133 Bil iran 90 86 86 85 80 Eastern Samar Leyte 75 73 73 54 45 Northern Samar Samar Southern Leyte 23 22 20 11 8
Zamboanga Peninsula 314 317 326 534 773 Zamboanga del Norte 32 29 27 47 48 Zamboanga del Sur 45 46 47 135 182 Zamboanga Sibugay 13 13 13 10 10 Zamboanga City 224 229 238 342 533
Northern Mindanao 5,736 5,752 6,091 6,297 6,710 Bukidnon 4,795 4,835 5,075 5,136 5,300 Camiguin 2 Lanao del Norte 185 168 143 129 108 Misamis Occidental 359 406 433 445 458 Misamis Oriental 397 343 440 587 842
Davao Region 4,522 4,212 4,215 4,144 4,247 Davao del Norte Davao del Sur 2,620 2,635 2,744 2,766 2,880 Davao Oriental 11 10 1 Compostela Valley 272 210 150 100 78 Davao City 1,618 1,357 1,320 1,278 1,288
SOCCSKSARGEN 1,545 1,564 1,641 1,532 1,564 North Cotabato 1,071 1,087 1,117 1,006 1,034 Sarangani 95 69 66 56 51 South Cotabato 350 368 401 412 422 Sultan Kudarat 29 40 56 57 57
Caraga 77 18 21 11 4 Agusan del Norte 55 1 Agusan del Sur 19 17 19 11 4 Dinagat Islands Surigao del Norte 3 1 1 Surigao del Sur
ARMM 556 465 450 459 460 Basilan Lanao del Sur 55 54 57 62 61 Maguindanao 502 412 393 397 399 Sulu Tawi-tawi
R/ - Revised due to inclusion of Batanes data.
Table 120. CABBAGE: VOLUME OF PRODUCTION IN METRIC TON …Continued

MAJOR CROPS STATISTICS OF THE PHILIPPINES, 2010-2014 (REGIONAL AND PROVINCIAL)
PHILIPPINE STATISTICS AUTHORITY
184
Region/Province 2010 2011 2012 R/ 2013 R/ 2014
Philippines 8,561 8,550 8,531 8,439 8,310
CAR 5,436 5,444 5,442 5,402 5,316 Abra Apayao Benguet 4,438 4,440 4,425 4,385 4,291 Ifugao 29 29 29 29 30 Kalinga 6 6 7 8 7 Mountain Province 964 969 981 980 988
Ilocos Region 367 369 367 369 372 Ilocos Norte 21 20 19 19 20 Ilocos Sur 345 347 347 349 351 La Union 2 2 1 2 1 Pangasinan
Cagayan Valley 195 193 197 191 193 Batanes 4 3 3 Cagayan 74 73 73 75 72 Isabela 7 3 2 1 3 Nueva Vizcaya 115 116 118 112 115 Quirino
Central Luzon - - - - - Aurora Bataan Bulacan Nueva Ecija Pampanga Tarlac Zambales
CALABARZON 130 133 132 127 130 Batangas Cavite Laguna 44 52 53 50 51 Quezon 86 81 79 77 79 Rizal
MIMAROPA 17 20 22 22 21 Marinduque Occidental Mindoro 17 20 22 22 21 Oriental Mindoro Palawan Romblon
Bicol Region 32 27 26 24 21 Albay 14 10 9 8 5 Camarines Norte Camarines Sur 14 13 13 12 12 Catanduanes Masbate Sorsogon 4 4 4 4 4
Western Visayas 67 67 69 65 65 Aklan Antique 9 10 11 10 10 Capiz Guimaras Iloilo 36 35 37 36 36 Negros Occidental 22 22 21 19 19
PHILIPPINES, 2010-2014Table 121. CABBAGE: AREA HARVESTED IN HECTARE, BY REGION, BY PROVINCE,
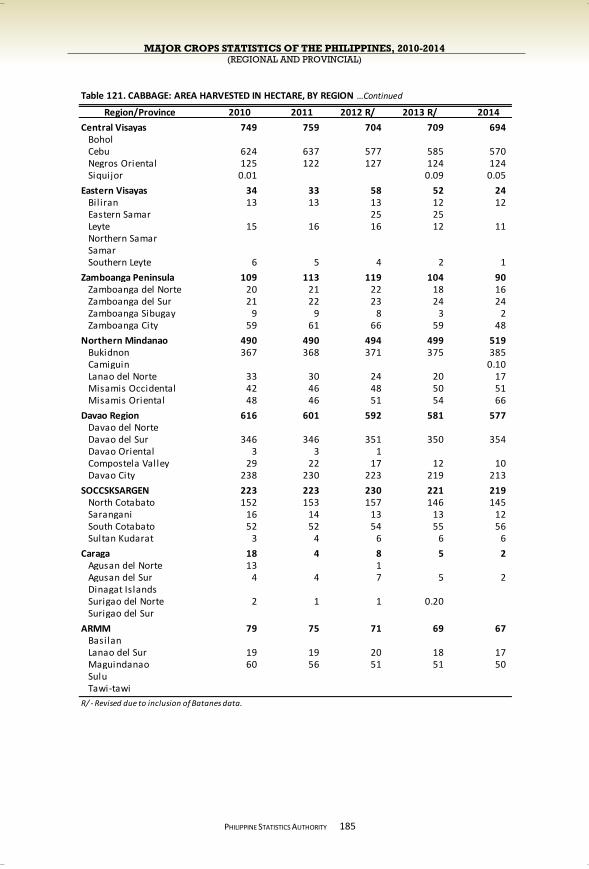
MAJOR CROPS STATISTICS OF THE PHILIPPINES, 2010-2014 (REGIONAL AND PROVINCIAL)
PHILIPPINE STATISTICS AUTHORITY
185
Region/Province 2010 2011 2012 R/ 2013 R/ 2014
Central Visayas 749 759 704 709 694 Bohol Cebu 624 637 577 585 570 Negros Oriental 125 122 127 124 124 Siquijor 0.01 0.09 0.05
Eastern Visayas 34 33 58 52 24 Bil iran 13 13 13 12 12 Eastern Samar 25 25 Leyte 15 16 16 12 11 Northern Samar Samar Southern Leyte 6 5 4 2 1
Zamboanga Peninsula 109 113 119 104 90 Zamboanga del Norte 20 21 22 18 16 Zamboanga del Sur 21 22 23 24 24 Zamboanga Sibugay 9 9 8 3 2 Zamboanga City 59 61 66 59 48
Northern Mindanao 490 490 494 499 519 Bukidnon 367 368 371 375 385 Camiguin 0.10 Lanao del Norte 33 30 24 20 17 Misamis Occidental 42 46 48 50 51 Misamis Oriental 48 46 51 54 66
Davao Region 616 601 592 581 577 Davao del Norte Davao del Sur 346 346 351 350 354 Davao Oriental 3 3 1 Compostela Valley 29 22 17 12 10 Davao City 238 230 223 219 213
SOCCSKSARGEN 223 223 230 221 219 North Cotabato 152 153 157 146 145 Sarangani 16 14 13 13 12 South Cotabato 52 52 54 55 56 Sultan Kudarat 3 4 6 6 6
Caraga 18 4 8 5 2 Agusan del Norte 13 1 Agusan del Sur 4 4 7 5 2 Dinagat Islands Surigao del Norte 2 1 1 0.20 Surigao del Sur
ARMM 79 75 71 69 67 Basilan Lanao del Sur 19 19 20 18 17 Maguindanao 60 56 51 51 50 Sulu Tawi-tawi
R/ - Revised due to inclusion of Batanes data.
Table 121. CABBAGE: AREA HARVESTED IN HECTARE, BY REGION …Continued
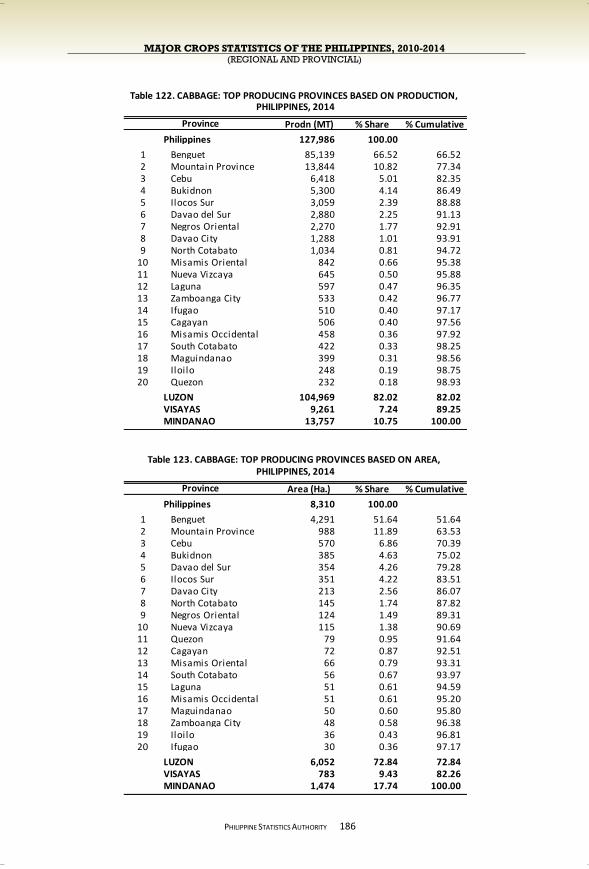
MAJOR CROPS STATISTICS OF THE PHILIPPINES, 2010-2014 (REGIONAL AND PROVINCIAL)
PHILIPPINE STATISTICS AUTHORITY
186
Prodn (MT) % Share % Cumulative
Philippines 127,986 100.00
1 Benguet 85,139 66.52 66.52 2 Mountain Province 13,844 10.82 77.34 3 Cebu 6,418 5.01 82.35 4 Bukidnon 5,300 4.14 86.49 5 Ilocos Sur 3,059 2.39 88.88 6 Davao del Sur 2,880 2.25 91.13 7 Negros Oriental 2,270 1.77 92.91 8 Davao City 1,288 1.01 93.91 9 North Cotabato 1,034 0.81 94.72
10 Misamis Oriental 842 0.66 95.38 11 Nueva Vizcaya 645 0.50 95.88 12 Laguna 597 0.47 96.35 13 Zamboanga City 533 0.42 96.77 14 Ifugao 510 0.40 97.17 15 Cagayan 506 0.40 97.56 16 Misamis Occidental 458 0.36 97.92 17 South Cotabato 422 0.33 98.25 18 Maguindanao 399 0.31 98.56 19 Iloilo 248 0.19 98.75 20 Quezon 232 0.18 98.93
LUZON 104,969 82.02 82.02 VISAYAS 9,261 7.24 89.25 MINDANAO 13,757 10.75 100.00
Area (Ha.) % Share % Cumulative
Philippines 8,310 100.00
1 Benguet 4,291 51.64 51.64 2 Mountain Province 988 11.89 63.53 3 Cebu 570 6.86 70.39 4 Bukidnon 385 4.63 75.02 5 Davao del Sur 354 4.26 79.28 6 Ilocos Sur 351 4.22 83.51 7 Davao City 213 2.56 86.07 8 North Cotabato 145 1.74 87.82 9 Negros Oriental 124 1.49 89.31
10 Nueva Vizcaya 115 1.38 90.69 11 Quezon 79 0.95 91.64 12 Cagayan 72 0.87 92.51 13 Misamis Oriental 66 0.79 93.31 14 South Cotabato 56 0.67 93.97 15 Laguna 51 0.61 94.59 16 Misamis Occidental 51 0.61 95.20 17 Maguindanao 50 0.60 95.80 18 Zamboanga City 48 0.58 96.38 19 Iloilo 36 0.43 96.81 20 Ifugao 30 0.36 97.17
LUZON 6,052 72.84 72.84 VISAYAS 783 9.43 82.26 MINDANAO 1,474 17.74 100.00
Province
Table 122. CABBAGE: TOP PRODUCING PROVINCES BASED ON PRODUCTION,
Table 123. CABBAGE: TOP PRODUCING PROVINCES BASED ON AREA,
Province
PHILIPPINES, 2014
PHILIPPINES, 2014
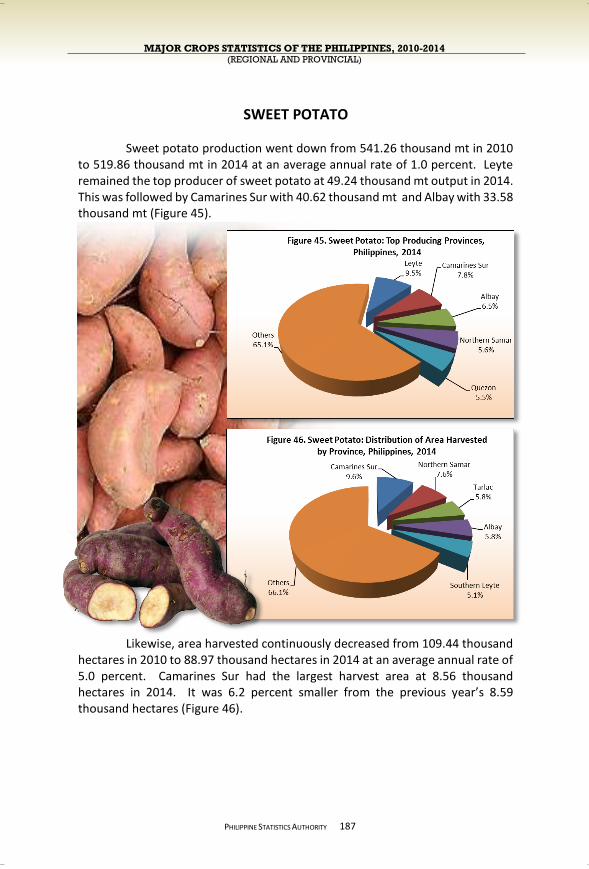
MAJOR CROPS STATISTICS OF THE PHILIPPINES, 2010-2014 (REGIONAL AND PROVINCIAL)
PHILIPPINE STATISTICS AUTHORITY
SWEET POTATO
Sweet potato production went down from 541.26 thousand mt in 2010 to 519.86 thousand mt in 2014 at an average annual rate of 1.0 percent. Leyte remained the top producer of sweet potato at 49.24 thousand mt output in 2014. This was followed by Camarines Sur with 40.62 thousand mt and Albay with 33.58 thousand mt (Figure 45).
Likewise, area harvested continuously decreased from 109.44 thousand hectares in 2010 to 88.97 thousand hectares in 2014 at an average annual rate of 5.0 percent. Camarines Sur had the largest harvest area at 8.56 thousand hectares in 2014. It was 6.2 percent smaller from the previous year’s 8.59 thousand hectares (Figure 46).
187
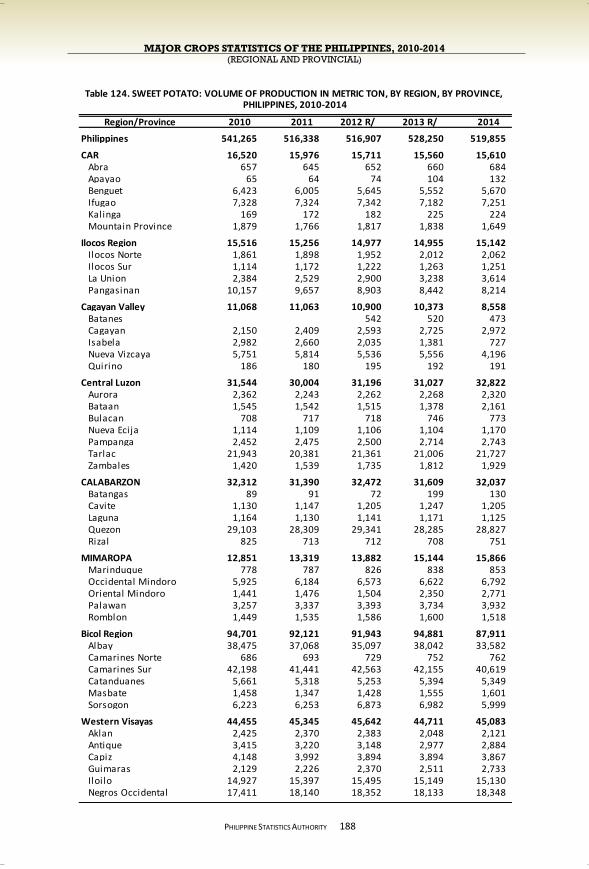
MAJOR CROPS STATISTICS OF THE PHILIPPINES, 2010-2014 (REGIONAL AND PROVINCIAL)
PHILIPPINE STATISTICS AUTHORITY
188
Region/Province 2010 2011 2012 R/ 2013 R/ 2014
Philippines 541,265 516,338 516,907 528,250 519,855
CAR 16,520 15,976 15,711 15,560 15,610 Abra 657 645 652 660 684 Apayao 65 64 74 104 132 Benguet 6,423 6,005 5,645 5,552 5,670 Ifugao 7,328 7,324 7,342 7,182 7,251 Kalinga 169 172 182 225 224 Mountain Province 1,879 1,766 1,817 1,838 1,649
Ilocos Region 15,516 15,256 14,977 14,955 15,142 Ilocos Norte 1,861 1,898 1,952 2,012 2,062 Ilocos Sur 1,114 1,172 1,222 1,263 1,251 La Union 2,384 2,529 2,900 3,238 3,614 Pangasinan 10,157 9,657 8,903 8,442 8,214
Cagayan Valley 11,068 11,063 10,900 10,373 8,558 Batanes 542 520 473 Cagayan 2,150 2,409 2,593 2,725 2,972 Isabela 2,982 2,660 2,035 1,381 727 Nueva Vizcaya 5,751 5,814 5,536 5,556 4,196 Quirino 186 180 195 192 191
Central Luzon 31,544 30,004 31,196 31,027 32,822 Aurora 2,362 2,243 2,262 2,268 2,320 Bataan 1,545 1,542 1,515 1,378 2,161 Bulacan 708 717 718 746 773 Nueva Ecija 1,114 1,109 1,106 1,104 1,170 Pampanga 2,452 2,475 2,500 2,714 2,743 Tarlac 21,943 20,381 21,361 21,006 21,727 Zambales 1,420 1,539 1,735 1,812 1,929
CALABARZON 32,312 31,390 32,472 31,609 32,037 Batangas 89 91 72 199 130 Cavite 1,130 1,147 1,205 1,247 1,205 Laguna 1,164 1,130 1,141 1,171 1,125 Quezon 29,103 28,309 29,341 28,285 28,827 Rizal 825 713 712 708 751
MIMAROPA 12,851 13,319 13,882 15,144 15,866 Marinduque 778 787 826 838 853 Occidental Mindoro 5,925 6,184 6,573 6,622 6,792 Oriental Mindoro 1,441 1,476 1,504 2,350 2,771 Palawan 3,257 3,337 3,393 3,734 3,932 Romblon 1,449 1,535 1,586 1,600 1,518
Bicol Region 94,701 92,121 91,943 94,881 87,911 Albay 38,475 37,068 35,097 38,042 33,582 Camarines Norte 686 693 729 752 762 Camarines Sur 42,198 41,441 42,563 42,155 40,619 Catanduanes 5,661 5,318 5,253 5,394 5,349 Masbate 1,458 1,347 1,428 1,555 1,601 Sorsogon 6,223 6,253 6,873 6,982 5,999
Western Visayas 44,455 45,345 45,642 44,711 45,083 Aklan 2,425 2,370 2,383 2,048 2,121 Antique 3,415 3,220 3,148 2,977 2,884 Capiz 4,148 3,992 3,894 3,894 3,867 Guimaras 2,129 2,226 2,370 2,511 2,733 Iloilo 14,927 15,397 15,495 15,149 15,130 Negros Occidental 17,411 18,140 18,352 18,133 18,348
PHILIPPINES, 2010-2014Table 124. SWEET POTATO: VOLUME OF PRODUCTION IN METRIC TON, BY REGION, BY PROVINCE,
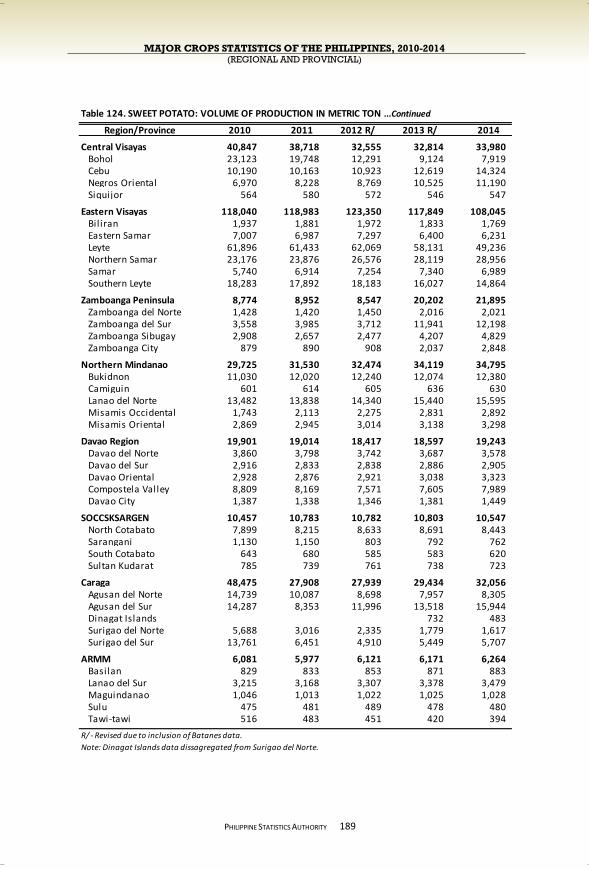
MAJOR CROPS STATISTICS OF THE PHILIPPINES, 2010-2014 (REGIONAL AND PROVINCIAL)
PHILIPPINE STATISTICS AUTHORITY
189
Region/Province 2010 2011 2012 R/ 2013 R/ 2014
Central Visayas 40,847 38,718 32,555 32,814 33,980 Bohol 23,123 19,748 12,291 9,124 7,919 Cebu 10,190 10,163 10,923 12,619 14,324 Negros Oriental 6,970 8,228 8,769 10,525 11,190 Siquijor 564 580 572 546 547
Eastern Visayas 118,040 118,983 123,350 117,849 108,045 Bil iran 1,937 1,881 1,972 1,833 1,769 Eastern Samar 7,007 6,987 7,297 6,400 6,231 Leyte 61,896 61,433 62,069 58,131 49,236 Northern Samar 23,176 23,876 26,576 28,119 28,956 Samar 5,740 6,914 7,254 7,340 6,989 Southern Leyte 18,283 17,892 18,183 16,027 14,864
Zamboanga Peninsula 8,774 8,952 8,547 20,202 21,895 Zamboanga del Norte 1,428 1,420 1,450 2,016 2,021 Zamboanga del Sur 3,558 3,985 3,712 11,941 12,198 Zamboanga Sibugay 2,908 2,657 2,477 4,207 4,829 Zamboanga City 879 890 908 2,037 2,848
Northern Mindanao 29,725 31,530 32,474 34,119 34,795 Bukidnon 11,030 12,020 12,240 12,074 12,380 Camiguin 601 614 605 636 630 Lanao del Norte 13,482 13,838 14,340 15,440 15,595 Misamis Occidental 1,743 2,113 2,275 2,831 2,892 Misamis Oriental 2,869 2,945 3,014 3,138 3,298
Davao Region 19,901 19,014 18,417 18,597 19,243 Davao del Norte 3,860 3,798 3,742 3,687 3,578 Davao del Sur 2,916 2,833 2,838 2,886 2,905 Davao Oriental 2,928 2,876 2,921 3,038 3,323 Compostela Valley 8,809 8,169 7,571 7,605 7,989 Davao City 1,387 1,338 1,346 1,381 1,449
SOCCSKSARGEN 10,457 10,783 10,782 10,803 10,547 North Cotabato 7,899 8,215 8,633 8,691 8,443 Sarangani 1,130 1,150 803 792 762 South Cotabato 643 680 585 583 620 Sultan Kudarat 785 739 761 738 723
Caraga 48,475 27,908 27,939 29,434 32,056 Agusan del Norte 14,739 10,087 8,698 7,957 8,305 Agusan del Sur 14,287 8,353 11,996 13,518 15,944 Dinagat Islands 732 483 Surigao del Norte 5,688 3,016 2,335 1,779 1,617 Surigao del Sur 13,761 6,451 4,910 5,449 5,707
ARMM 6,081 5,977 6,121 6,171 6,264 Basilan 829 833 853 871 883 Lanao del Sur 3,215 3,168 3,307 3,378 3,479 Maguindanao 1,046 1,013 1,022 1,025 1,028 Sulu 475 481 489 478 480 Tawi-tawi 516 483 451 420 394
R/ - Revised due to inclusion of Batanes data.
Note: Dinagat Islands data dissagregated from Surigao del Norte.
Table 124. SWEET POTATO: VOLUME OF PRODUCTION IN METRIC TON ...Continued
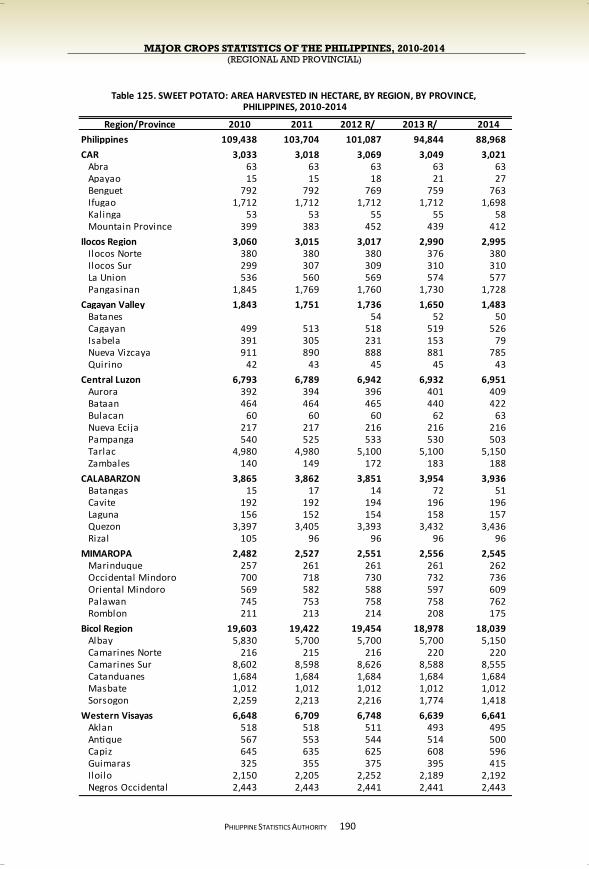
MAJOR CROPS STATISTICS OF THE PHILIPPINES, 2010-2014 (REGIONAL AND PROVINCIAL)
PHILIPPINE STATISTICS AUTHORITY
190
Region/Province 2010 2011 2012 R/ 2013 R/ 2014
Philippines 109,438 103,704 101,087 94,844 88,968
CAR 3,033 3,018 3,069 3,049 3,021 Abra 63 63 63 63 63 Apayao 15 15 18 21 27 Benguet 792 792 769 759 763 Ifugao 1,712 1,712 1,712 1,712 1,698 Kalinga 53 53 55 55 58 Mountain Province 399 383 452 439 412
Ilocos Region 3,060 3,015 3,017 2,990 2,995 Ilocos Norte 380 380 380 376 380 Ilocos Sur 299 307 309 310 310 La Union 536 560 569 574 577 Pangasinan 1,845 1,769 1,760 1,730 1,728
Cagayan Valley 1,843 1,751 1,736 1,650 1,483 Batanes 54 52 50 Cagayan 499 513 518 519 526 Isabela 391 305 231 153 79 Nueva Vizcaya 911 890 888 881 785 Quirino 42 43 45 45 43
Central Luzon 6,793 6,789 6,942 6,932 6,951 Aurora 392 394 396 401 409 Bataan 464 464 465 440 422 Bulacan 60 60 60 62 63 Nueva Ecija 217 217 216 216 216 Pampanga 540 525 533 530 503 Tarlac 4,980 4,980 5,100 5,100 5,150 Zambales 140 149 172 183 188
CALABARZON 3,865 3,862 3,851 3,954 3,936 Batangas 15 17 14 72 51 Cavite 192 192 194 196 196 Laguna 156 152 154 158 157 Quezon 3,397 3,405 3,393 3,432 3,436 Rizal 105 96 96 96 96
MIMAROPA 2,482 2,527 2,551 2,556 2,545 Marinduque 257 261 261 261 262 Occidental Mindoro 700 718 730 732 736 Oriental Mindoro 569 582 588 597 609 Palawan 745 753 758 758 762 Romblon 211 213 214 208 175
Bicol Region 19,603 19,422 19,454 18,978 18,039 Albay 5,830 5,700 5,700 5,700 5,150 Camarines Norte 216 215 216 220 220 Camarines Sur 8,602 8,598 8,626 8,588 8,555 Catanduanes 1,684 1,684 1,684 1,684 1,684 Masbate 1,012 1,012 1,012 1,012 1,012 Sorsogon 2,259 2,213 2,216 1,774 1,418
Western Visayas 6,648 6,709 6,748 6,639 6,641 Aklan 518 518 511 493 495 Antique 567 553 544 514 500 Capiz 645 635 625 608 596 Guimaras 325 355 375 395 415 Iloilo 2,150 2,205 2,252 2,189 2,192 Negros Occidental 2,443 2,443 2,441 2,441 2,443
PHILIPPINES, 2010-2014Table 125. SWEET POTATO: AREA HARVESTED IN HECTARE, BY REGION, BY PROVINCE,

MAJOR CROPS STATISTICS OF THE PHILIPPINES, 2010-2014 (REGIONAL AND PROVINCIAL)
PHILIPPINE STATISTICS AUTHORITY
191
Region/Province 2010 2011 2012 R/ 2013 R/ 2014
Central Visayas 11,548 10,237 8,432 7,301 5,968 Bohol 7,189 6,009 4,151 3,008 1,720 Cebu 2,170 2,170 2,205 2,262 2,195 Negros Oriental 2,035 1,910 1,929 1,919 1,969 Siquijor 154 148 147 112 84
Eastern Visayas 25,491 24,876 24,655 22,809 20,574 Bil iran 433 421 406 366 301 Eastern Samar 2,266 2,272 2,274 2,270 2,213 Leyte 4,616 4,615 4,872 4,622 3,663 Northern Samar 7,624 7,710 7,310 7,170 6,770 Samar 4,115 3,627 3,647 3,630 3,130 Southern Leyte 6,437 6,231 6,146 4,751 4,497
Zamboanga Peninsula 3,076 3,041 2,956 2,605 2,425 Zamboanga del Norte 367 367 368 372 372 Zamboanga del Sur 1,395 1,405 1,367 1,367 1,368 Zamboanga Sibugay 1,061 1,015 960 610 450 Zamboanga City 253 254 261 256 235
Northern Mindanao 2,602 2,644 2,674 2,717 2,731 Bukidnon 578 605 620 620 627 Camiguin 95 91 86 89 86 Lanao del Norte 1,272 1,279 1,290 1,306 1,312 Misamis Occidental 289 297 305 323 325 Misamis Oriental 368 372 373 379 382
Davao Region 4,155 3,833 3,742 3,729 3,717 Davao del Norte 756 757 749 740 722 Davao del Sur 1,138 838 838 839 839 Davao Oriental 665 665 658 658 663 Compostela Valley 1,320 1,300 1,224 1,216 1,218 Davao City 276 273 273 276 275
SOCCSKSARGEN 1,574 1,574 1,550 1,549 1,479 North Cotabato 1,252 1,256 1,261 1,261 1,190 Sarangani 127 127 107 106 104 South Cotabato 92 93 81 82 85 Sultan Kudarat 103 98 101 100 100
Caraga 11,099 7,915 7,229 5,149 4,746 Agusan del Norte 3,128 2,615 1,700 788 789 Agusan del Sur 2,608 1,910 2,419 2,298 2,320 Dinagat Islands 158 85 Surigao del Norte 2,343 1,480 1,200 542 170 Surigao del Sur 3,020 1,910 1,910 1,363 1,382
ARMM 2,566 2,491 2,481 2,238 1,718 Basilan 687 687 687 687 447 Lanao del Sur 1170 1,170 1,165 930 930 Maguindanao 306 234 232 232 108 Sulu 136 136 136 130 89 Tawi-tawi 267 264 261 259 144
R/ - Revised due to inclusion of Batanes data.
Note: Dinagat Islands data dissagregated from Surigao del Norte.
Table 125. SWEET POTATO: AREA HARVESTED IN HECTARE, BY REGION …Continued
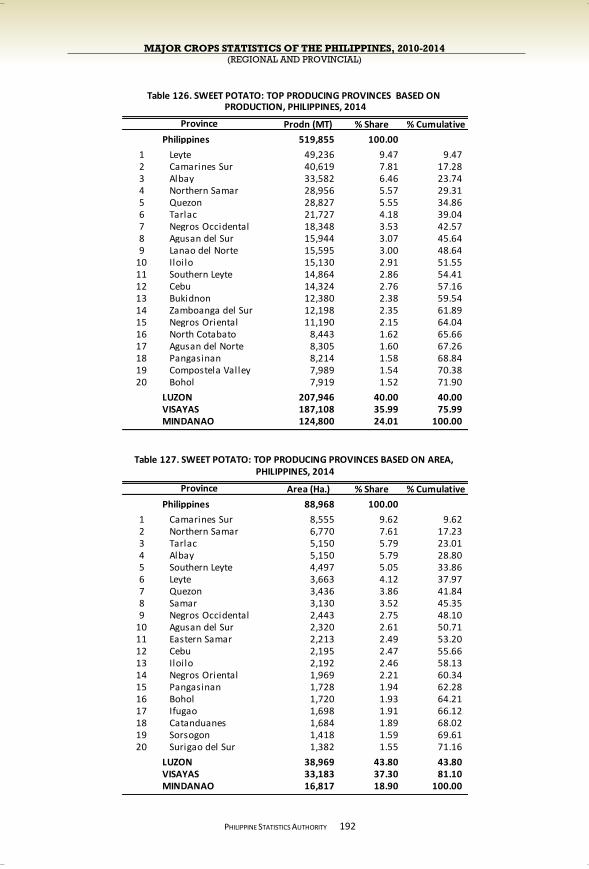
MAJOR CROPS STATISTICS OF THE PHILIPPINES, 2010-2014 (REGIONAL AND PROVINCIAL)
PHILIPPINE STATISTICS AUTHORITY
192
Prodn (MT) % Share % Cumulative
Philippines 519,855 100.00
1 Leyte 49,236 9.47 9.47 2 Camarines Sur 40,619 7.81 17.28 3 Albay 33,582 6.46 23.74 4 Northern Samar 28,956 5.57 29.31 5 Quezon 28,827 5.55 34.86 6 Tarlac 21,727 4.18 39.04 7 Negros Occidental 18,348 3.53 42.57 8 Agusan del Sur 15,944 3.07 45.64 9 Lanao del Norte 15,595 3.00 48.64
10 Iloilo 15,130 2.91 51.55 11 Southern Leyte 14,864 2.86 54.41 12 Cebu 14,324 2.76 57.16 13 Bukidnon 12,380 2.38 59.54 14 Zamboanga del Sur 12,198 2.35 61.89 15 Negros Oriental 11,190 2.15 64.04 16 North Cotabato 8,443 1.62 65.66 17 Agusan del Norte 8,305 1.60 67.26 18 Pangasinan 8,214 1.58 68.84 19 Compostela Valley 7,989 1.54 70.38 20 Bohol 7,919 1.52 71.90
LUZON 207,946 40.00 40.00 VISAYAS 187,108 35.99 75.99 MINDANAO 124,800 24.01 100.00
Area (Ha.) % Share % Cumulative
Philippines 88,968 100.00
1 Camarines Sur 8,555 9.62 9.62 2 Northern Samar 6,770 7.61 17.23 3 Tarlac 5,150 5.79 23.01 4 Albay 5,150 5.79 28.80 5 Southern Leyte 4,497 5.05 33.86 6 Leyte 3,663 4.12 37.97 7 Quezon 3,436 3.86 41.84 8 Samar 3,130 3.52 45.35 9 Negros Occidental 2,443 2.75 48.10
10 Agusan del Sur 2,320 2.61 50.71 11 Eastern Samar 2,213 2.49 53.20 12 Cebu 2,195 2.47 55.66 13 Iloilo 2,192 2.46 58.13 14 Negros Oriental 1,969 2.21 60.34 15 Pangasinan 1,728 1.94 62.28 16 Bohol 1,720 1.93 64.21 17 Ifugao 1,698 1.91 66.12 18 Catanduanes 1,684 1.89 68.02 19 Sorsogon 1,418 1.59 69.61 20 Surigao del Sur 1,382 1.55 71.16
LUZON 38,969 43.80 43.80 VISAYAS 33,183 37.30 81.10 MINDANAO 16,817 18.90 100.00
Province
PHILIPPINES, 2014Table 127. SWEET POTATO: TOP PRODUCING PROVINCES BASED ON AREA,
Province
PRODUCTION, PHILIPPINES, 2014Table 126. SWEET POTATO: TOP PRODUCING PROVINCES BASED ON

MAJOR CROPS STATISTICS OF THE PHILIPPINES, 2010-2014 (REGIONAL AND PROVINCIAL)
PHILIPPINE STATISTICS AUTHORITY
CASSAVA
In 2010 to 2014, cassava production increased from 2.10 million mt to 2.54 million mt at an annual average rate of 4.9 percent. The country’s top cassava producer in 2014 was Lanao del Sur at 518.10 thousand mt production shared 20.4 percent to the national total. Bukidnon was the second largest producer with a share of 17.5 percent, followed by Basilan with 10.2 percent share (Figure 47).
Area harvested to cassava decreased from 217.62 thousand hectares in
2010 to 216.78 thousand hectares in 2014 at an annual average rate of 0.1 percent. Lanao del Sur had the largest area harvested at 33.50 thousand hectares or 15.5 percent of the country’s total cassava area. This was followed by Sulu with 12.6 percent share and Tawi-tawi with 8.7 percent (Figure 48).
193
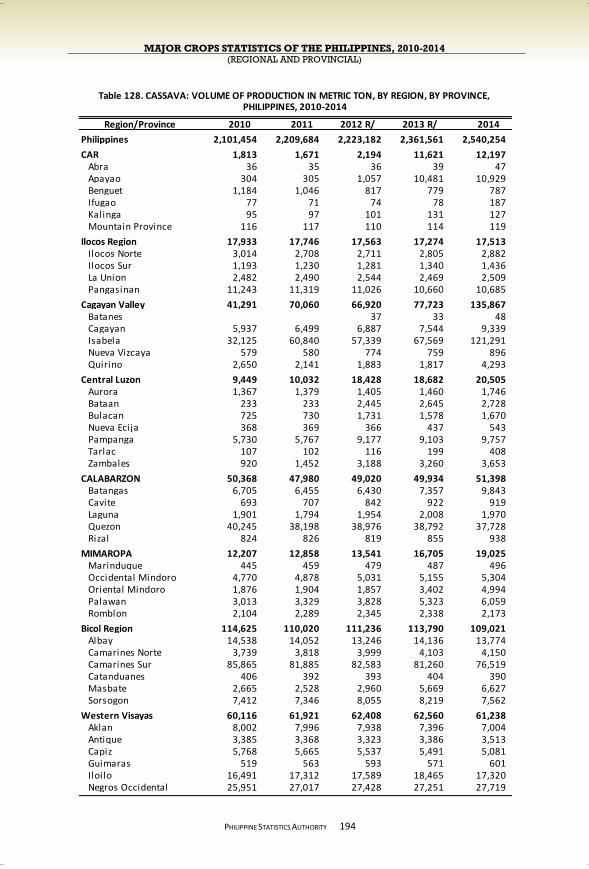
MAJOR CROPS STATISTICS OF THE PHILIPPINES, 2010-2014 (REGIONAL AND PROVINCIAL)
PHILIPPINE STATISTICS AUTHORITY
194
Region/Province 2010 2011 2012 R/ 2013 R/ 2014
Philippines 2,101,454 2,209,684 2,223,182 2,361,561 2,540,254
CAR 1,813 1,671 2,194 11,621 12,197 Abra 36 35 36 39 47 Apayao 304 305 1,057 10,481 10,929 Benguet 1,184 1,046 817 779 787 Ifugao 77 71 74 78 187 Kalinga 95 97 101 131 127 Mountain Province 116 117 110 114 119
Ilocos Region 17,933 17,746 17,563 17,274 17,513 Ilocos Norte 3,014 2,708 2,711 2,805 2,882 Ilocos Sur 1,193 1,230 1,281 1,340 1,436 La Union 2,482 2,490 2,544 2,469 2,509 Pangasinan 11,243 11,319 11,026 10,660 10,685
Cagayan Valley 41,291 70,060 66,920 77,723 135,867 Batanes 37 33 48 Cagayan 5,937 6,499 6,887 7,544 9,339 Isabela 32,125 60,840 57,339 67,569 121,291 Nueva Vizcaya 579 580 774 759 896 Quirino 2,650 2,141 1,883 1,817 4,293
Central Luzon 9,449 10,032 18,428 18,682 20,505 Aurora 1,367 1,379 1,405 1,460 1,746 Bataan 233 233 2,445 2,645 2,728 Bulacan 725 730 1,731 1,578 1,670 Nueva Ecija 368 369 366 437 543 Pampanga 5,730 5,767 9,177 9,103 9,757 Tarlac 107 102 116 199 408 Zambales 920 1,452 3,188 3,260 3,653
CALABARZON 50,368 47,980 49,020 49,934 51,398 Batangas 6,705 6,455 6,430 7,357 9,843 Cavite 693 707 842 922 919 Laguna 1,901 1,794 1,954 2,008 1,970 Quezon 40,245 38,198 38,976 38,792 37,728 Rizal 824 826 819 855 938
MIMAROPA 12,207 12,858 13,541 16,705 19,025 Marinduque 445 459 479 487 496 Occidental Mindoro 4,770 4,878 5,031 5,155 5,304 Oriental Mindoro 1,876 1,904 1,857 3,402 4,994 Palawan 3,013 3,329 3,828 5,323 6,059 Romblon 2,104 2,289 2,345 2,338 2,173
Bicol Region 114,625 110,020 111,236 113,790 109,021 Albay 14,538 14,052 13,246 14,136 13,774 Camarines Norte 3,739 3,818 3,999 4,103 4,150 Camarines Sur 85,865 81,885 82,583 81,260 76,519 Catanduanes 406 392 393 404 390 Masbate 2,665 2,528 2,960 5,669 6,627 Sorsogon 7,412 7,346 8,055 8,219 7,562
Western Visayas 60,116 61,921 62,408 62,560 61,238 Aklan 8,002 7,996 7,938 7,396 7,004 Antique 3,385 3,368 3,323 3,386 3,513 Capiz 5,768 5,665 5,537 5,491 5,081 Guimaras 519 563 593 571 601 Iloilo 16,491 17,312 17,589 18,465 17,320 Negros Occidental 25,951 27,017 27,428 27,251 27,719
PHILIPPINES, 2010-2014Table 128. CASSAVA: VOLUME OF PRODUCTION IN METRIC TON, BY REGION, BY PROVINCE,

MAJOR CROPS STATISTICS OF THE PHILIPPINES, 2010-2014 (REGIONAL AND PROVINCIAL)
PHILIPPINE STATISTICS AUTHORITY
195
Region/Province 2010 2011 2012 R/ 2013 R/ 2014
Central Visayas 118,668 128,156 109,571 90,698 90,556 Bohol 83,167 89,643 67,596 48,006 39,716 Cebu 16,331 17,275 20,181 20,408 21,035 Negros Oriental 15,505 17,923 18,466 19,203 26,203 Siquijor 3,665 3,316 3,329 3,081 3,602
Eastern Visayas 73,392 78,805 81,918 90,331 79,976 Bil iran 3,136 3,106 3,167 3,581 3,428 Eastern Samar 15,518 15,441 15,472 15,898 15,392 Leyte 31,557 35,507 37,366 43,853 35,563 Northern Samar 7,133 7,509 8,139 8,968 9,263 Samar 8,135 9,338 9,808 10,370 10,171 Southern Leyte 7,914 7,906 7,967 7,662 6,158
Zamboanga Peninsula 30,746 30,352 30,053 52,310 77,185 Zamboanga del Norte 6,798 6,157 5,878 7,703 9,794 Zamboanga del Sur 12,061 12,251 12,099 21,060 33,739 Zamboanga Sibugay 2,773 2,803 2,783 3,600 4,345 Zamboanga City 9,114 9,141 9,294 19,947 29,308
Northern Mindanao 471,511 551,123 558,955 601,289 663,580 Bukidnon 255,200 306,178 312,000 397,051 445,000 Camiguin 3,379 3,251 3,002 3,456 3,524 Lanao del Norte 23,900 24,350 24,770 24,599 23,930 Misamis Occidental 42,518 46,383 49,268 42,351 39,530 Misamis Oriental 146,514 170,961 169,915 133,832 151,596
Davao Region 14,788 14,511 14,454 15,969 17,958 Davao del Norte 2,846 2,912 3,004 3,116 3,253 Davao del Sur 4,984 4,600 4,544 4,638 4,745 Davao Oriental 2,190 2,288 2,259 2,297 3,205 Compostela Valley 3,922 3,793 3,631 3,657 3,912 Davao City 846 917 1,016 2,261 2,843
SOCCSKSARGEN 34,556 43,386 47,852 89,868 121,823 North Cotabato 10,143 10,465 10,823 11,071 10,940 Sarangani 1,720 1,755 1,768 2,013 2,022 South Cotabato 20,690 28,506 32,855 74,622 106,580 Sultan Kudarat 2,003 2,660 2,407 2,163 2,281
Caraga 41,124 23,609 20,101 17,700 17,181 Agusan del Norte 7,589 5,708 5,148 4,324 3,637 Agusan del Sur 5,694 3,594 3,792 4,210 4,729 Dinagat Islands 586 468 Surigao del Norte 8,401 4,154 3,266 2,535 2,100 Surigao del Sur 19,440 10,153 7,895 6,045 6,246
ARMM 1,008,867 1,007,454 1,018,969 1,035,107 1,045,233 Basilan 240,151 245,924 249,966 257,532 259,920 Lanao del Sur 493,780 485,745 495,878 505,129 518,096 Maguindanao 4,000 3,732 3,653 3,835 4,216 Sulu 172,509 173,800 172,990 172,975 168,200 Tawi-tawi 98,428 98,253 96,482 95,636 94,802
R/ - Revised due to inclusion of Batanes data.
Note: Dinagat Islands data dissagregated from Surigao del Norte.
Table 128. CASSAVA: VOLUME OF PRODUCTION IN METRIC TON …Continued
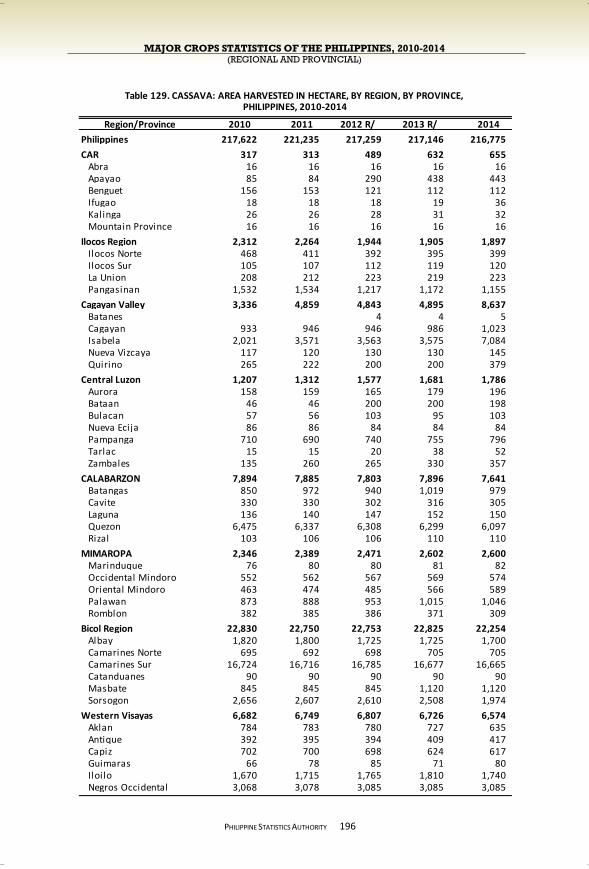
MAJOR CROPS STATISTICS OF THE PHILIPPINES, 2010-2014 (REGIONAL AND PROVINCIAL)
PHILIPPINE STATISTICS AUTHORITY
196
Region/Province 2010 2011 2012 R/ 2013 R/ 2014
Philippines 217,622 221,235 217,259 217,146 216,775
CAR 317 313 489 632 655 Abra 16 16 16 16 16 Apayao 85 84 290 438 443 Benguet 156 153 121 112 112 Ifugao 18 18 18 19 36 Kalinga 26 26 28 31 32 Mountain Province 16 16 16 16 16
Ilocos Region 2,312 2,264 1,944 1,905 1,897 Ilocos Norte 468 411 392 395 399 Ilocos Sur 105 107 112 119 120 La Union 208 212 223 219 223 Pangasinan 1,532 1,534 1,217 1,172 1,155
Cagayan Valley 3,336 4,859 4,843 4,895 8,637 Batanes 4 4 5 Cagayan 933 946 946 986 1,023 Isabela 2,021 3,571 3,563 3,575 7,084 Nueva Vizcaya 117 120 130 130 145 Quirino 265 222 200 200 379
Central Luzon 1,207 1,312 1,577 1,681 1,786 Aurora 158 159 165 179 196 Bataan 46 46 200 200 198 Bulacan 57 56 103 95 103 Nueva Ecija 86 86 84 84 84 Pampanga 710 690 740 755 796 Tarlac 15 15 20 38 52 Zambales 135 260 265 330 357
CALABARZON 7,894 7,885 7,803 7,896 7,641 Batangas 850 972 940 1,019 979 Cavite 330 330 302 316 305 Laguna 136 140 147 152 150 Quezon 6,475 6,337 6,308 6,299 6,097 Rizal 103 106 106 110 110
MIMAROPA 2,346 2,389 2,471 2,602 2,600 Marinduque 76 80 80 81 82 Occidental Mindoro 552 562 567 569 574 Oriental Mindoro 463 474 485 566 589 Palawan 873 888 953 1,015 1,046 Romblon 382 385 386 371 309
Bicol Region 22,830 22,750 22,753 22,825 22,254 Albay 1,820 1,800 1,725 1,725 1,700 Camarines Norte 695 692 698 705 705 Camarines Sur 16,724 16,716 16,785 16,677 16,665 Catanduanes 90 90 90 90 90 Masbate 845 845 845 1,120 1,120 Sorsogon 2,656 2,607 2,610 2,508 1,974
Western Visayas 6,682 6,749 6,807 6,726 6,574 Aklan 784 783 780 727 635 Antique 392 395 394 409 417 Capiz 702 700 698 624 617 Guimaras 66 78 85 71 80 Iloilo 1,670 1,715 1,765 1,810 1,740 Negros Occidental 3,068 3,078 3,085 3,085 3,085
PHILIPPINES, 2010-2014Table 129. CASSAVA: AREA HARVESTED IN HECTARE, BY REGION, BY PROVINCE,
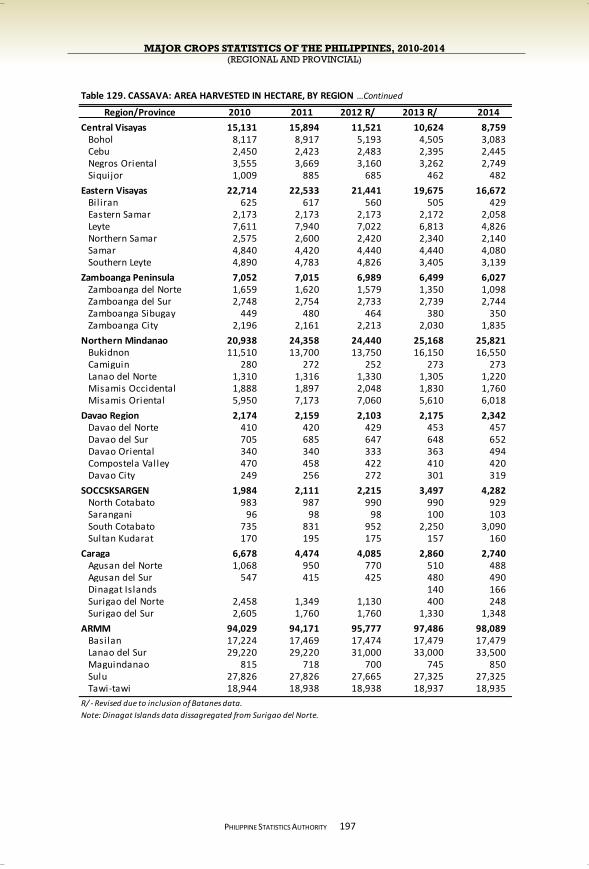
MAJOR CROPS STATISTICS OF THE PHILIPPINES, 2010-2014 (REGIONAL AND PROVINCIAL)
PHILIPPINE STATISTICS AUTHORITY
197
Region/Province 2010 2011 2012 R/ 2013 R/ 2014
Central Visayas 15,131 15,894 11,521 10,624 8,759 Bohol 8,117 8,917 5,193 4,505 3,083 Cebu 2,450 2,423 2,483 2,395 2,445 Negros Oriental 3,555 3,669 3,160 3,262 2,749 Siquijor 1,009 885 685 462 482
Eastern Visayas 22,714 22,533 21,441 19,675 16,672 Bil iran 625 617 560 505 429 Eastern Samar 2,173 2,173 2,173 2,172 2,058 Leyte 7,611 7,940 7,022 6,813 4,826 Northern Samar 2,575 2,600 2,420 2,340 2,140 Samar 4,840 4,420 4,440 4,440 4,080 Southern Leyte 4,890 4,783 4,826 3,405 3,139
Zamboanga Peninsula 7,052 7,015 6,989 6,499 6,027 Zamboanga del Norte 1,659 1,620 1,579 1,350 1,098 Zamboanga del Sur 2,748 2,754 2,733 2,739 2,744 Zamboanga Sibugay 449 480 464 380 350 Zamboanga City 2,196 2,161 2,213 2,030 1,835
Northern Mindanao 20,938 24,358 24,440 25,168 25,821 Bukidnon 11,510 13,700 13,750 16,150 16,550 Camiguin 280 272 252 273 273 Lanao del Norte 1,310 1,316 1,330 1,305 1,220 Misamis Occidental 1,888 1,897 2,048 1,830 1,760 Misamis Oriental 5,950 7,173 7,060 5,610 6,018
Davao Region 2,174 2,159 2,103 2,175 2,342 Davao del Norte 410 420 429 453 457 Davao del Sur 705 685 647 648 652 Davao Oriental 340 340 333 363 494 Compostela Valley 470 458 422 410 420 Davao City 249 256 272 301 319
SOCCSKSARGEN 1,984 2,111 2,215 3,497 4,282 North Cotabato 983 987 990 990 929 Sarangani 96 98 98 100 103 South Cotabato 735 831 952 2,250 3,090 Sultan Kudarat 170 195 175 157 160
Caraga 6,678 4,474 4,085 2,860 2,740 Agusan del Norte 1,068 950 770 510 488 Agusan del Sur 547 415 425 480 490 Dinagat Islands 140 166 Surigao del Norte 2,458 1,349 1,130 400 248 Surigao del Sur 2,605 1,760 1,760 1,330 1,348
ARMM 94,029 94,171 95,777 97,486 98,089 Basilan 17,224 17,469 17,474 17,479 17,479 Lanao del Sur 29,220 29,220 31,000 33,000 33,500 Maguindanao 815 718 700 745 850 Sulu 27,826 27,826 27,665 27,325 27,325 Tawi-tawi 18,944 18,938 18,938 18,937 18,935
R/ - Revised due to inclusion of Batanes data.
Note: Dinagat Islands data dissagregated from Surigao del Norte.
Table 129. CASSAVA: AREA HARVESTED IN HECTARE, BY REGION …Continued
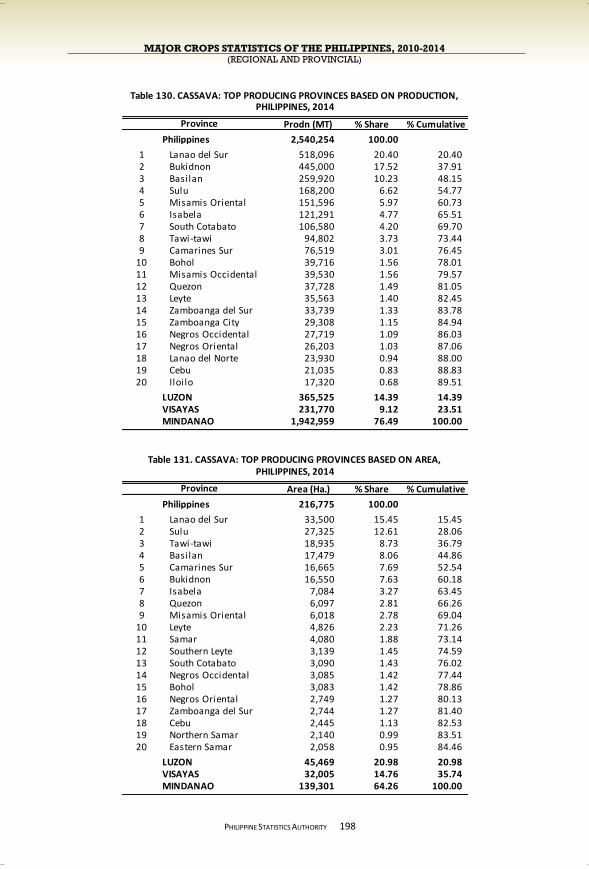
MAJOR CROPS STATISTICS OF THE PHILIPPINES, 2010-2014 (REGIONAL AND PROVINCIAL)
PHILIPPINE STATISTICS AUTHORITY
198
Prodn (MT) % Share % Cumulative
Philippines 2,540,254 100.00
1 Lanao del Sur 518,096 20.40 20.40 2 Bukidnon 445,000 17.52 37.91 3 Basilan 259,920 10.23 48.15 4 Sulu 168,200 6.62 54.77 5 Misamis Oriental 151,596 5.97 60.73 6 Isabela 121,291 4.77 65.51 7 South Cotabato 106,580 4.20 69.70 8 Tawi-tawi 94,802 3.73 73.44 9 Camarines Sur 76,519 3.01 76.45
10 Bohol 39,716 1.56 78.01 11 Misamis Occidental 39,530 1.56 79.57 12 Quezon 37,728 1.49 81.05 13 Leyte 35,563 1.40 82.45 14 Zamboanga del Sur 33,739 1.33 83.78 15 Zamboanga City 29,308 1.15 84.94 16 Negros Occidental 27,719 1.09 86.03 17 Negros Oriental 26,203 1.03 87.06 18 Lanao del Norte 23,930 0.94 88.00 19 Cebu 21,035 0.83 88.83 20 Iloilo 17,320 0.68 89.51
LUZON 365,525 14.39 14.39 VISAYAS 231,770 9.12 23.51 MINDANAO 1,942,959 76.49 100.00
Area (Ha.) % Share % Cumulative
Philippines 216,775 100.00
1 Lanao del Sur 33,500 15.45 15.45 2 Sulu 27,325 12.61 28.06 3 Tawi-tawi 18,935 8.73 36.79 4 Basilan 17,479 8.06 44.86 5 Camarines Sur 16,665 7.69 52.54 6 Bukidnon 16,550 7.63 60.18 7 Isabela 7,084 3.27 63.45 8 Quezon 6,097 2.81 66.26 9 Misamis Oriental 6,018 2.78 69.04
10 Leyte 4,826 2.23 71.26 11 Samar 4,080 1.88 73.14 12 Southern Leyte 3,139 1.45 74.59 13 South Cotabato 3,090 1.43 76.02 14 Negros Occidental 3,085 1.42 77.44 15 Bohol 3,083 1.42 78.86 16 Negros Oriental 2,749 1.27 80.13 17 Zamboanga del Sur 2,744 1.27 81.40 18 Cebu 2,445 1.13 82.53 19 Northern Samar 2,140 0.99 83.51 20 Eastern Samar 2,058 0.95 84.46
LUZON 45,469 20.98 20.98 VISAYAS 32,005 14.76 35.74 MINDANAO 139,301 64.26 100.00
Province
Table 130. CASSAVA: TOP PRODUCING PROVINCES BASED ON PRODUCTION,
Table 131. CASSAVA: TOP PRODUCING PROVINCES BASED ON AREA,
Province
PHILIPPINES, 2014
PHILIPPINES, 2014
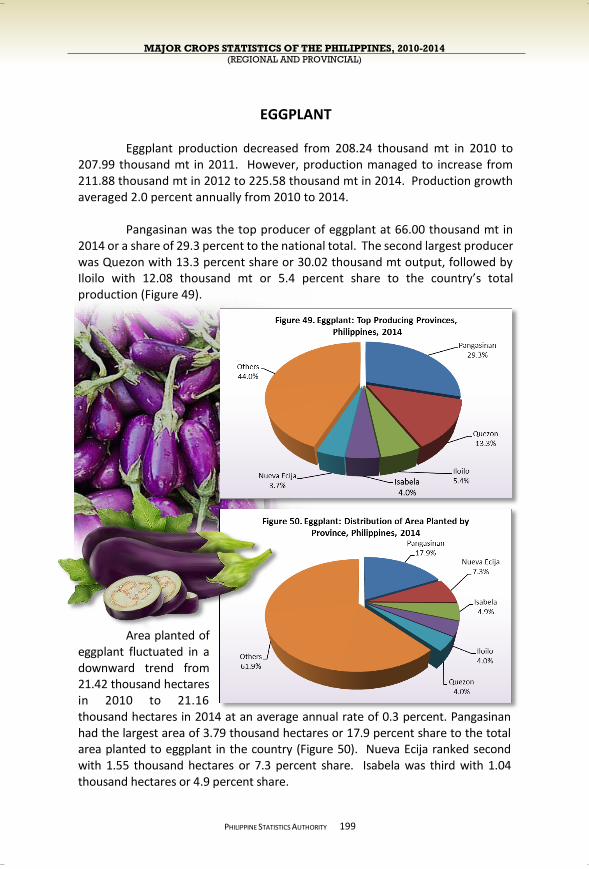
MAJOR CROPS STATISTICS OF THE PHILIPPINES, 2010-2014 (REGIONAL AND PROVINCIAL)
PHILIPPINE STATISTICS AUTHORITY
EGGPLANT
Eggplant production decreased from 208.24 thousand mt in 2010 to 207.99 thousand mt in 2011. However, production managed to increase from 211.88 thousand mt in 2012 to 225.58 thousand mt in 2014. Production growth averaged 2.0 percent annually from 2010 to 2014.
Pangasinan was the top producer of eggplant at 66.00 thousand mt in
2014 or a share of 29.3 percent to the national total. The second largest producer was Quezon with 13.3 percent share or 30.02 thousand mt output, followed by Iloilo with 12.08 thousand mt or 5.4 percent share to the country’s total production (Figure 49).
Area planted of
eggplant fluctuated in a downward trend from 21.42 thousand hectares in 2010 to 21.16 thousand hectares in 2014 at an average annual rate of 0.3 percent. Pangasinan had the largest area of 3.79 thousand hectares or 17.9 percent share to the total area planted to eggplant in the country (Figure 50). Nueva Ecija ranked second with 1.55 thousand hectares or 7.3 percent share. Isabela was third with 1.04 thousand hectares or 4.9 percent share.
199

MAJOR CROPS STATISTICS OF THE PHILIPPINES, 2010-2014 (REGIONAL AND PROVINCIAL)
PHILIPPINE STATISTICS AUTHORITY
200
Region/Province 2010 2011 2012 R/ 2013 R/ 2014
Philippines 208,242 207,994 211,885 219,911 225,579
CAR 796 805 823 892 957 Abra 623 631 635 643 675 Apayao 25 24 39 80 113 Benguet 13 12 12 12 12 Ifugao 22 23 24 24 24 Kalinga 93 94 98 118 117 Mountain Province 21 21 16 16 15
Ilocos Region 73,659 75,375 76,193 78,136 79,400 Ilocos Norte 5,434 5,641 6,007 6,400 6,830 Ilocos Sur 3,975 4,240 4,351 4,603 4,773 La Union 1,408 1,371 1,542 1,646 1,794 Pangasinan 62,842 64,123 64,293 65,487 66,002
Cagayan Valley 18,264 19,320 19,872 20,477 19,723 Batanes 31 26 22 Cagayan 6,400 7,009 7,385 7,740 7,309 Isabela 9,210 9,702 9,900 10,234 9,834 Nueva Vizcaya 2,365 2,323 2,276 2,181 2,259 Quirino 289 286 280 295 299
Central Luzon 19,225 18,863 19,019 19,358 20,918 Aurora 243 246 251 232 266 Bataan 443 438 420 420 478 Bulacan 2,141 2,157 2,111 2,058 2,193 Nueva Ecija 6,960 6,923 6,885 7,018 8,406 Pampanga 2,252 2,248 2,345 2,443 2,471 Tarlac 5,998 5,576 5,633 5,781 5,652 Zambales 1,188 1,275 1,374 1,406 1,452
CALABARZON 37,573 36,401 36,150 36,667 36,872 Batangas 6,751 6,290 5,625 4,950 4,198 Cavite 351 343 373 365 299 Laguna 1,935 1,781 1,812 1,812 1,759 Quezon 28,018 27,468 27,812 28,980 30,025 Rizal 518 519 528 559 592
MIMAROPA 2,458 2,625 2,768 3,444 3,768 Marinduque 429 437 466 737 714 Occidental Mindoro 881 927 971 1,063 1,095 Oriental Mindoro 263 292 289 383 416 Palawan 190 267 349 564 834 Romblon 695 702 692 698 709
Bicol Region 7,159 6,937 7,306 7,882 7,115 Albay 2,978 2,918 3,117 3,369 2,712 Camarines Norte 280 276 289 297 284 Camarines Sur 2,393 2,331 2,378 2,391 2,390 Catanduanes 24 23 23 24 23 Masbate 1,355 1,260 1,346 1,643 1,548 Sorsogon 130 130 153 160 158
Western Visayas 14,730 15,086 15,660 16,051 17,022 Aklan 295 296 294 278 254 Antique 547 574 588 601 621 Capiz 770 752 820 815 823 Guimaras 222 227 238 240 257 Iloilo 10,090 10,368 10,813 11,191 12,076 Negros Occidental 2,807 2,868 2,907 2,926 2,991
PHILIPPINES, 2010-2014Table 132. EGGPLANT: VOLUME OF PRODUCTION IN METRIC TON, BY REGION, BY PROVINCE,
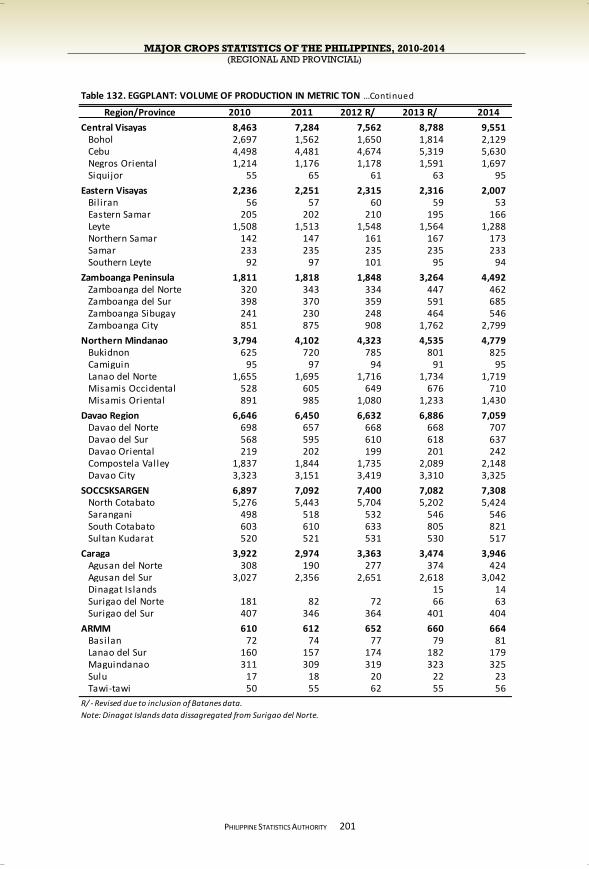
MAJOR CROPS STATISTICS OF THE PHILIPPINES, 2010-2014 (REGIONAL AND PROVINCIAL)
PHILIPPINE STATISTICS AUTHORITY
201
Region/Province 2010 2011 2012 R/ 2013 R/ 2014
Central Visayas 8,463 7,284 7,562 8,788 9,551 Bohol 2,697 1,562 1,650 1,814 2,129 Cebu 4,498 4,481 4,674 5,319 5,630 Negros Oriental 1,214 1,176 1,178 1,591 1,697 Siquijor 55 65 61 63 95
Eastern Visayas 2,236 2,251 2,315 2,316 2,007 Bil iran 56 57 60 59 53 Eastern Samar 205 202 210 195 166 Leyte 1,508 1,513 1,548 1,564 1,288 Northern Samar 142 147 161 167 173 Samar 233 235 235 235 233 Southern Leyte 92 97 101 95 94
Zamboanga Peninsula 1,811 1,818 1,848 3,264 4,492 Zamboanga del Norte 320 343 334 447 462 Zamboanga del Sur 398 370 359 591 685 Zamboanga Sibugay 241 230 248 464 546 Zamboanga City 851 875 908 1,762 2,799
Northern Mindanao 3,794 4,102 4,323 4,535 4,779 Bukidnon 625 720 785 801 825 Camiguin 95 97 94 91 95 Lanao del Norte 1,655 1,695 1,716 1,734 1,719 Misamis Occidental 528 605 649 676 710 Misamis Oriental 891 985 1,080 1,233 1,430
Davao Region 6,646 6,450 6,632 6,886 7,059 Davao del Norte 698 657 668 668 707 Davao del Sur 568 595 610 618 637 Davao Oriental 219 202 199 201 242 Compostela Valley 1,837 1,844 1,735 2,089 2,148 Davao City 3,323 3,151 3,419 3,310 3,325
SOCCSKSARGEN 6,897 7,092 7,400 7,082 7,308 North Cotabato 5,276 5,443 5,704 5,202 5,424 Sarangani 498 518 532 546 546 South Cotabato 603 610 633 805 821 Sultan Kudarat 520 521 531 530 517
Caraga 3,922 2,974 3,363 3,474 3,946 Agusan del Norte 308 190 277 374 424 Agusan del Sur 3,027 2,356 2,651 2,618 3,042 Dinagat Islands 15 14 Surigao del Norte 181 82 72 66 63 Surigao del Sur 407 346 364 401 404
ARMM 610 612 652 660 664 Basilan 72 74 77 79 81 Lanao del Sur 160 157 174 182 179 Maguindanao 311 309 319 323 325 Sulu 17 18 20 22 23 Tawi-tawi 50 55 62 55 56
R/ - Revised due to inclusion of Batanes data.
Note: Dinagat Islands data dissagregated from Surigao del Norte.
Table 132. EGGPLANT: VOLUME OF PRODUCTION IN METRIC TON …Continued
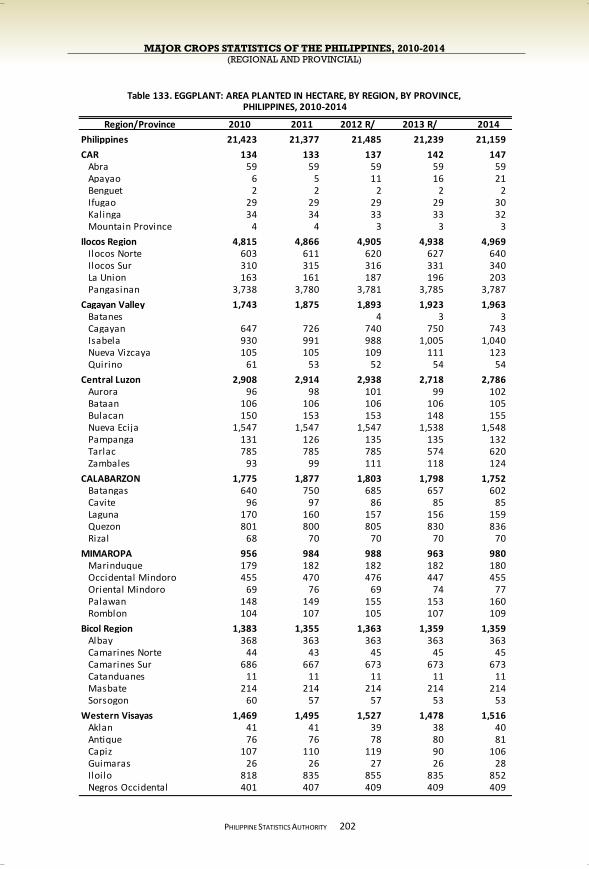
MAJOR CROPS STATISTICS OF THE PHILIPPINES, 2010-2014 (REGIONAL AND PROVINCIAL)
PHILIPPINE STATISTICS AUTHORITY
202
Region/Province 2010 2011 2012 R/ 2013 R/ 2014
Philippines 21,423 21,377 21,485 21,239 21,159
CAR 134 133 137 142 147 Abra 59 59 59 59 59 Apayao 6 5 11 16 21 Benguet 2 2 2 2 2 Ifugao 29 29 29 29 30 Kalinga 34 34 33 33 32 Mountain Province 4 4 3 3 3
Ilocos Region 4,815 4,866 4,905 4,938 4,969 Ilocos Norte 603 611 620 627 640 Ilocos Sur 310 315 316 331 340 La Union 163 161 187 196 203 Pangasinan 3,738 3,780 3,781 3,785 3,787
Cagayan Valley 1,743 1,875 1,893 1,923 1,963 Batanes 4 3 3 Cagayan 647 726 740 750 743 Isabela 930 991 988 1,005 1,040 Nueva Vizcaya 105 105 109 111 123 Quirino 61 53 52 54 54
Central Luzon 2,908 2,914 2,938 2,718 2,786 Aurora 96 98 101 99 102 Bataan 106 106 106 106 105 Bulacan 150 153 153 148 155 Nueva Ecija 1,547 1,547 1,547 1,538 1,548 Pampanga 131 126 135 135 132 Tarlac 785 785 785 574 620 Zambales 93 99 111 118 124
CALABARZON 1,775 1,877 1,803 1,798 1,752 Batangas 640 750 685 657 602 Cavite 96 97 86 85 85 Laguna 170 160 157 156 159 Quezon 801 800 805 830 836 Rizal 68 70 70 70 70
MIMAROPA 956 984 988 963 980 Marinduque 179 182 182 182 180 Occidental Mindoro 455 470 476 447 455 Oriental Mindoro 69 76 69 74 77 Palawan 148 149 155 153 160 Romblon 104 107 105 107 109
Bicol Region 1,383 1,355 1,363 1,359 1,359 Albay 368 363 363 363 363 Camarines Norte 44 43 45 45 45 Camarines Sur 686 667 673 673 673 Catanduanes 11 11 11 11 11 Masbate 214 214 214 214 214 Sorsogon 60 57 57 53 53
Western Visayas 1,469 1,495 1,527 1,478 1,516 Aklan 41 41 39 38 40 Antique 76 76 78 80 81 Capiz 107 110 119 90 106 Guimaras 26 26 27 26 28 Iloilo 818 835 855 835 852 Negros Occidental 401 407 409 409 409
Table 133. EGGPLANT: AREA PLANTED IN HECTARE, BY REGION, BY PROVINCE, PHILIPPINES, 2010-2014

MAJOR CROPS STATISTICS OF THE PHILIPPINES, 2010-2014 (REGIONAL AND PROVINCIAL)
PHILIPPINE STATISTICS AUTHORITY
203
Region/Province 2010 2011 2012 R/ 2013 R/ 2014
Central Visayas 1,918 1,649 1,632 1,642 1,401 Bohol 637 390 418 423 406 Cebu 943 944 894 852 705 Negros Oriental 313 289 296 355 280 Siquijor 25 26 24 12 10
Eastern Visayas 343 352 355 344 324 Bil iran 18 23 23 22 21 Eastern Samar 69 69 70 68 66 Leyte 162 163 165 164 146 Northern Samar 31 31 31 30 31 Samar 32 33 32 32 31 Southern Leyte 31 33 33 28 29
Zamboanga Peninsula 594 593 602 559 545 Zamboanga del Norte 107 110 109 86 88 Zamboanga del Sur 64 59 56 60 60 Zamboanga Sibugay 107 103 109 100 81 Zamboanga City 316 321 328 313 316
Northern Mindanao 775 795 814 831 839 Bukidnon 175 185 195 195 198 Camiguin 18 17 16 16 16 Lanao del Norte 248 250 252 256 256 Misamis Occidental 132 137 142 144 144 Misamis Oriental 202 206 209 220 225
Davao Region 1,219 1,173 1,162 1,174 1,162 Davao del Norte 348 338 345 345 310 Davao del Sur 78 83 90 91 94 Davao Oriental 180 180 181 181 198 Compostela Valley 257 252 223 230 233 Davao City 356 320 323 327 327
SOCCSKSARGEN 624 631 638 626 642 North Cotabato 434 440 442 407 420 Sarangani 47 49 49 50 51 South Cotabato 68 68 71 93 98 Sultan Kudarat 75 74 75 76 74
Caraga 544 468 499 510 560 Agusan del Norte 34 31 31 37 39 Agusan del Sur 416 355 385 385 440 Dinagat Islands 3 3 Surigao del Norte 17 9 10 12 6 Surigao del Sur 77 73 74 73 72
ARMM 225 219 230 236 215 Basilan 14 16 17 18 18 Lanao del Sur 28 28 29 34 33 Maguindanao 150 140 146 146 145 Sulu 23 25 27 27 11 Tawi-tawi 10 11 11 11 8
R/ - Revised due to inclusion of Batanes data.
Note: Dinagat Islands data dissagregated from Surigao del Norte.
Table 133. EGGPLANT: AREA PLANTED IN HECTARE …Continued
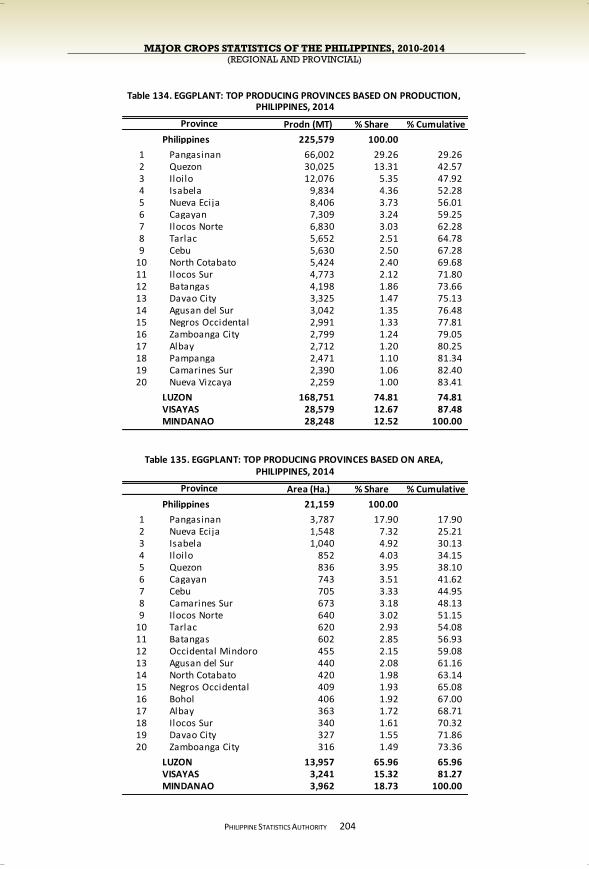
MAJOR CROPS STATISTICS OF THE PHILIPPINES, 2010-2014 (REGIONAL AND PROVINCIAL)
PHILIPPINE STATISTICS AUTHORITY
204
Prodn (MT) % Share % Cumulative
Philippines 225,579 100.00
1 Pangasinan 66,002 29.26 29.26 2 Quezon 30,025 13.31 42.57 3 Iloilo 12,076 5.35 47.92 4 Isabela 9,834 4.36 52.28 5 Nueva Ecija 8,406 3.73 56.01 6 Cagayan 7,309 3.24 59.25 7 Ilocos Norte 6,830 3.03 62.28 8 Tarlac 5,652 2.51 64.78 9 Cebu 5,630 2.50 67.28
10 North Cotabato 5,424 2.40 69.68 11 Ilocos Sur 4,773 2.12 71.80 12 Batangas 4,198 1.86 73.66 13 Davao City 3,325 1.47 75.13 14 Agusan del Sur 3,042 1.35 76.48 15 Negros Occidental 2,991 1.33 77.81 16 Zamboanga City 2,799 1.24 79.05 17 Albay 2,712 1.20 80.25 18 Pampanga 2,471 1.10 81.34 19 Camarines Sur 2,390 1.06 82.40 20 Nueva Vizcaya 2,259 1.00 83.41
LUZON 168,751 74.81 74.81 VISAYAS 28,579 12.67 87.48 MINDANAO 28,248 12.52 100.00
Area (Ha.) % Share % Cumulative
Philippines 21,159 100.00
1 Pangasinan 3,787 17.90 17.90 2 Nueva Ecija 1,548 7.32 25.21 3 Isabela 1,040 4.92 30.13 4 Iloilo 852 4.03 34.15 5 Quezon 836 3.95 38.10 6 Cagayan 743 3.51 41.62 7 Cebu 705 3.33 44.95 8 Camarines Sur 673 3.18 48.13 9 Ilocos Norte 640 3.02 51.15
10 Tarlac 620 2.93 54.08 11 Batangas 602 2.85 56.93 12 Occidental Mindoro 455 2.15 59.08 13 Agusan del Sur 440 2.08 61.16 14 North Cotabato 420 1.98 63.14 15 Negros Occidental 409 1.93 65.08 16 Bohol 406 1.92 67.00 17 Albay 363 1.72 68.71 18 Ilocos Sur 340 1.61 70.32 19 Davao City 327 1.55 71.86 20 Zamboanga City 316 1.49 73.36
LUZON 13,957 65.96 65.96 VISAYAS 3,241 15.32 81.27 MINDANAO 3,962 18.73 100.00
Province
Table 134. EGGPLANT: TOP PRODUCING PROVINCES BASED ON PRODUCTION,
Table 135. EGGPLANT: TOP PRODUCING PROVINCES BASED ON AREA,
Province
PHILIPPINES, 2014
PHILIPPINES, 2014

MAJOR CROPS STATISTICS OF THE PHILIPPINES, 2010-2014 (REGIONAL AND PROVINCIAL)
PHILIPPINE STATISTICS AUTHORITY
GARLIC
Production of garlic in 2010 was 9.56 thousand mt. It continuously dropped to 8.81 thousand mt in 2012 at an average annual rate of 4.0 percent. Production managed to increase by 2.0 percent in 2013 and by 0.1 percent in 2014. Ilocos Norte contributed the bulk of production at 5.71 thousand mt in 2014, or 63.4 percent share to the country’s total garlic production (Figure 51). The second largest producer of garlic was Occidental Mindoro with 1.69 thousand mt or 18.8 percent share followed by Nueva Ecija with 0.36 thousand mt production or 4.0 percent share to the national total.
Area harvested to garlic likewise continuously dropped from 3.04 thousand hectares in 2010 to 2.54
thousand hectares in 2013. It contracted at an average annual rate of 5.8 percent. However, it managed to increase to 2.56 thousand hectares in 2014 or by 0.6 percent. Ilocos Norte shared 1.75 thousand hectares or 68.5 percent to the country’s total garlic area in 2014 (Figure 52). Occidental Mindoro had the second largest area of 254 hectares or 9.9 percent share followed by Nueva Ecija with 133 hectares or 5.2 percent share.
205
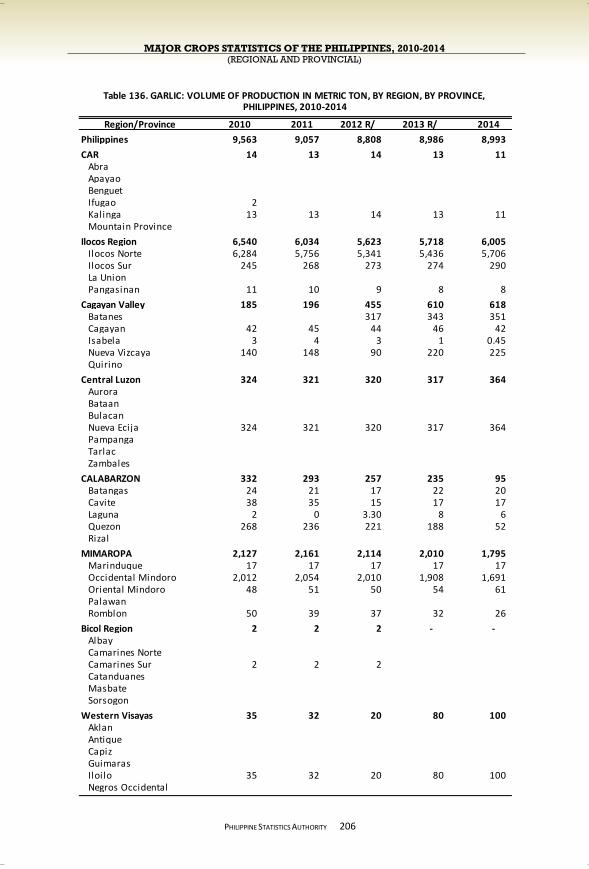
MAJOR CROPS STATISTICS OF THE PHILIPPINES, 2010-2014 (REGIONAL AND PROVINCIAL)
PHILIPPINE STATISTICS AUTHORITY
206
Region/Province 2010 2011 2012 R/ 2013 R/ 2014
Philippines 9,563 9,057 8,808 8,986 8,993
CAR 14 13 14 13 11 Abra Apayao Benguet Ifugao 2 Kalinga 13 13 14 13 11 Mountain Province
Ilocos Region 6,540 6,034 5,623 5,718 6,005 Ilocos Norte 6,284 5,756 5,341 5,436 5,706 Ilocos Sur 245 268 273 274 290 La Union Pangasinan 11 10 9 8 8
Cagayan Valley 185 196 455 610 618 Batanes 317 343 351 Cagayan 42 45 44 46 42 Isabela 3 4 3 1 0.45 Nueva Vizcaya 140 148 90 220 225 Quirino
Central Luzon 324 321 320 317 364 Aurora Bataan Bulacan Nueva Ecija 324 321 320 317 364 Pampanga Tarlac Zambales
CALABARZON 332 293 257 235 95 Batangas 24 21 17 22 20 Cavite 38 35 15 17 17 Laguna 2 0 3.30 8 6 Quezon 268 236 221 188 52 Rizal
MIMAROPA 2,127 2,161 2,114 2,010 1,795 Marinduque 17 17 17 17 17 Occidental Mindoro 2,012 2,054 2,010 1,908 1,691 Oriental Mindoro 48 51 50 54 61 Palawan Romblon 50 39 37 32 26
Bicol Region 2 2 2 - - Albay Camarines Norte Camarines Sur 2 2 2 Catanduanes Masbate Sorsogon
Western Visayas 35 32 20 80 100 Aklan Antique Capiz Guimaras Iloilo 35 32 20 80 100 Negros Occidental
PHILIPPINES, 2010-2014Table 136. GARLIC: VOLUME OF PRODUCTION IN METRIC TON, BY REGION, BY PROVINCE,

MAJOR CROPS STATISTICS OF THE PHILIPPINES, 2010-2014 (REGIONAL AND PROVINCIAL)
PHILIPPINE STATISTICS AUTHORITY
207
Region/Province 2010 2011 2012 R/ 2013 R/ 2014
Central Visayas - - - - 1 Bohol Cebu Negros Oriental Siquijor 1
Eastern Visayas 4 4 4 4 4 Bil iran Eastern Samar Leyte Northern Samar Samar 4 4 4 4 4 Southern Leyte
Zamboanga Peninsula - - - - - Zamboanga del Norte Zamboanga del Sur Zamboanga Sibugay Zamboanga City
Northern Mindanao - - - - - Bukidnon Camiguin Lanao del Norte Misamis Occidental Misamis Oriental
Davao Region - - - - - Davao del Norte Davao del Sur Davao Oriental Compostela Valley Davao City
SOCCSKSARGEN - - - - - North Cotabato Sarangani South Cotabato Sultan Kudarat
Caraga - - - - - Agusan del Norte Agusan del Sur Dinagat Islands Surigao del Norte Surigao del Sur
ARMM - - - - - Basilan Lanao del Sur Maguindanao Sulu Tawi-tawi
R/ - Revised due to inclusion of Batanes data.
Table 136. GARLIC: VOLUME OF PRODUCTION IN METRIC TON …Continued
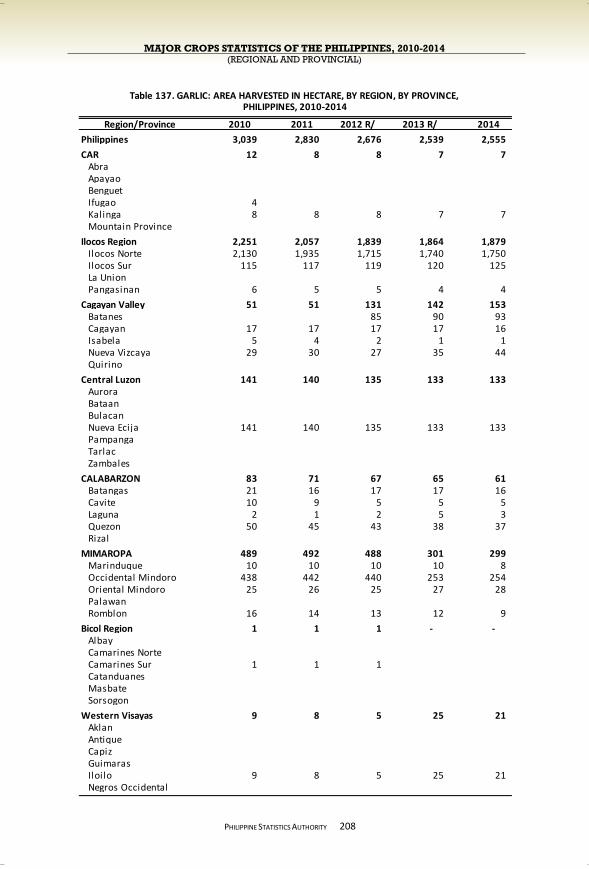
MAJOR CROPS STATISTICS OF THE PHILIPPINES, 2010-2014 (REGIONAL AND PROVINCIAL)
PHILIPPINE STATISTICS AUTHORITY
208
Region/Province 2010 2011 2012 R/ 2013 R/ 2014
Philippines 3,039 2,830 2,676 2,539 2,555
CAR 12 8 8 7 7 Abra Apayao Benguet Ifugao 4 Kalinga 8 8 8 7 7 Mountain Province
Ilocos Region 2,251 2,057 1,839 1,864 1,879 Ilocos Norte 2,130 1,935 1,715 1,740 1,750 Ilocos Sur 115 117 119 120 125 La Union Pangasinan 6 5 5 4 4
Cagayan Valley 51 51 131 142 153 Batanes 85 90 93 Cagayan 17 17 17 17 16 Isabela 5 4 2 1 1 Nueva Vizcaya 29 30 27 35 44 Quirino
Central Luzon 141 140 135 133 133 Aurora Bataan Bulacan Nueva Ecija 141 140 135 133 133 Pampanga Tarlac Zambales
CALABARZON 83 71 67 65 61 Batangas 21 16 17 17 16 Cavite 10 9 5 5 5 Laguna 2 1 2 5 3 Quezon 50 45 43 38 37 Rizal
MIMAROPA 489 492 488 301 299 Marinduque 10 10 10 10 8 Occidental Mindoro 438 442 440 253 254 Oriental Mindoro 25 26 25 27 28 Palawan Romblon 16 14 13 12 9
Bicol Region 1 1 1 - - Albay Camarines Norte Camarines Sur 1 1 1 Catanduanes Masbate Sorsogon
Western Visayas 9 8 5 25 21 Aklan Antique Capiz Guimaras Iloilo 9 8 5 25 21 Negros Occidental
PHILIPPINES, 2010-2014Table 137. GARLIC: AREA HARVESTED IN HECTARE, BY REGION, BY PROVINCE,
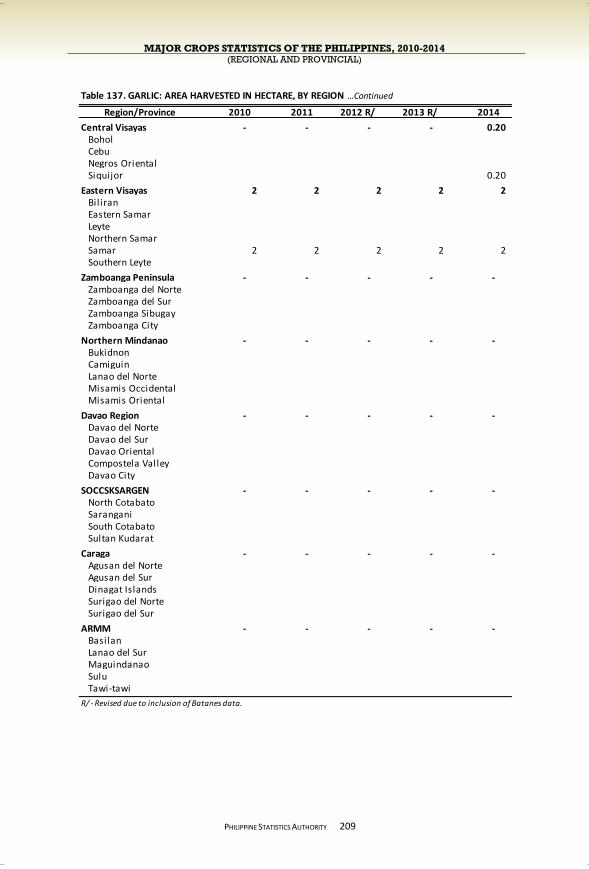
MAJOR CROPS STATISTICS OF THE PHILIPPINES, 2010-2014 (REGIONAL AND PROVINCIAL)
PHILIPPINE STATISTICS AUTHORITY
209
Region/Province 2010 2011 2012 R/ 2013 R/ 2014
Central Visayas - - - - 0.20 Bohol Cebu Negros Oriental Siquijor 0.20
Eastern Visayas 2 2 2 2 2 Bil iran Eastern Samar Leyte Northern Samar Samar 2 2 2 2 2 Southern Leyte
Zamboanga Peninsula - - - - - Zamboanga del Norte Zamboanga del Sur Zamboanga Sibugay Zamboanga City
Northern Mindanao - - - - - Bukidnon Camiguin Lanao del Norte Misamis Occidental Misamis Oriental
Davao Region - - - - - Davao del Norte Davao del Sur Davao Oriental Compostela Valley Davao City
SOCCSKSARGEN - - - - - North Cotabato Sarangani South Cotabato Sultan Kudarat
Caraga - - - - - Agusan del Norte Agusan del Sur Dinagat Islands Surigao del Norte Surigao del Sur
ARMM - - - - - Basilan Lanao del Sur Maguindanao Sulu Tawi-tawi
R/ - Revised due to inclusion of Batanes data.
Table 137. GARLIC: AREA HARVESTED IN HECTARE, BY REGION …Continued
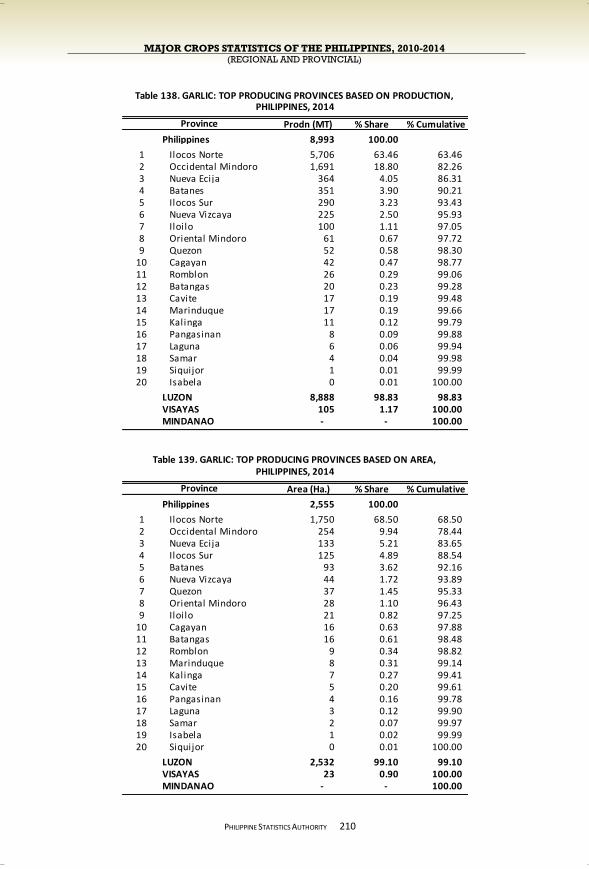
MAJOR CROPS STATISTICS OF THE PHILIPPINES, 2010-2014 (REGIONAL AND PROVINCIAL)
PHILIPPINE STATISTICS AUTHORITY
210
Prodn (MT) % Share % Cumulative
Philippines 8,993 100.00
1 Ilocos Norte 5,706 63.46 63.46 2 Occidental Mindoro 1,691 18.80 82.26 3 Nueva Ecija 364 4.05 86.31 4 Batanes 351 3.90 90.21 5 Ilocos Sur 290 3.23 93.43 6 Nueva Vizcaya 225 2.50 95.93 7 Iloilo 100 1.11 97.05 8 Oriental Mindoro 61 0.67 97.72 9 Quezon 52 0.58 98.30
10 Cagayan 42 0.47 98.77 11 Romblon 26 0.29 99.06 12 Batangas 20 0.23 99.28 13 Cavite 17 0.19 99.48 14 Marinduque 17 0.19 99.66 15 Kalinga 11 0.12 99.79 16 Pangasinan 8 0.09 99.88 17 Laguna 6 0.06 99.94 18 Samar 4 0.04 99.98 19 Siquijor 1 0.01 99.99 20 Isabela 0 0.01 100.00
LUZON 8,888 98.83 98.83 VISAYAS 105 1.17 100.00 MINDANAO - - 100.00
Area (Ha.) % Share % Cumulative
Philippines 2,555 100.00
1 Ilocos Norte 1,750 68.50 68.50 2 Occidental Mindoro 254 9.94 78.44 3 Nueva Ecija 133 5.21 83.65 4 Ilocos Sur 125 4.89 88.54 5 Batanes 93 3.62 92.16 6 Nueva Vizcaya 44 1.72 93.89 7 Quezon 37 1.45 95.33 8 Oriental Mindoro 28 1.10 96.43 9 Iloilo 21 0.82 97.25
10 Cagayan 16 0.63 97.88 11 Batangas 16 0.61 98.48 12 Romblon 9 0.34 98.82 13 Marinduque 8 0.31 99.14 14 Kalinga 7 0.27 99.41 15 Cavite 5 0.20 99.61 16 Pangasinan 4 0.16 99.78 17 Laguna 3 0.12 99.90 18 Samar 2 0.07 99.97 19 Isabela 1 0.02 99.99 20 Siquijor 0 0.01 100.00
LUZON 2,532 99.10 99.10 VISAYAS 23 0.90 100.00 MINDANAO - - 100.00
Province
Table 138. GARLIC: TOP PRODUCING PROVINCES BASED ON PRODUCTION,
Table 139. GARLIC: TOP PRODUCING PROVINCES BASED ON AREA,
Province
PHILIPPINES, 2014
PHILIPPINES, 2014
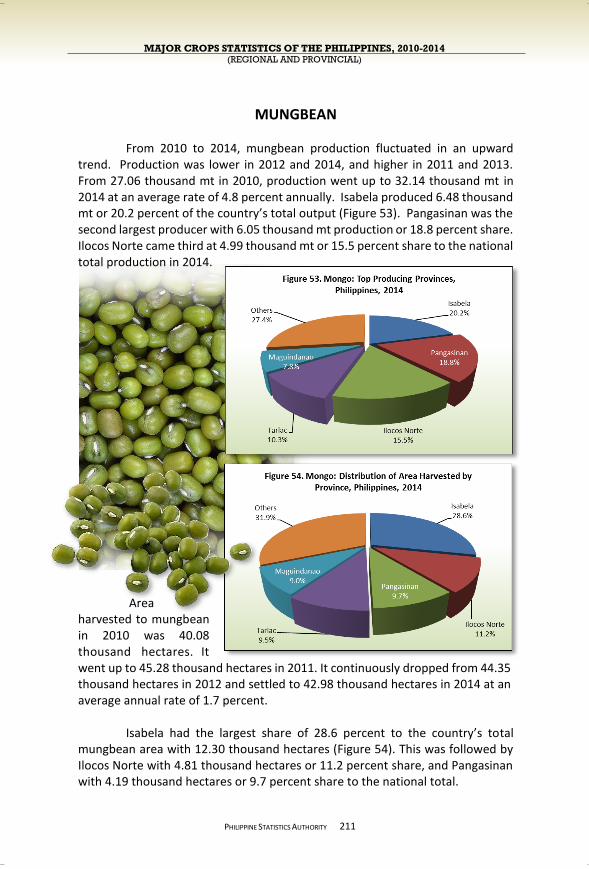
MAJOR CROPS STATISTICS OF THE PHILIPPINES, 2010-2014 (REGIONAL AND PROVINCIAL)
PHILIPPINE STATISTICS AUTHORITY
MUNGBEAN
From 2010 to 2014, mungbean production fluctuated in an upward trend. Production was lower in 2012 and 2014, and higher in 2011 and 2013. From 27.06 thousand mt in 2010, production went up to 32.14 thousand mt in 2014 at an average rate of 4.8 percent annually. Isabela produced 6.48 thousand mt or 20.2 percent of the country’s total output (Figure 53). Pangasinan was the second largest producer with 6.05 thousand mt production or 18.8 percent share. Ilocos Norte came third at 4.99 thousand mt or 15.5 percent share to the national total production in 2014.
Area
harvested to mungbean in 2010 was 40.08 thousand hectares. It went up to 45.28 thousand hectares in 2011. It continuously dropped from 44.35 thousand hectares in 2012 and settled to 42.98 thousand hectares in 2014 at an average annual rate of 1.7 percent.
Isabela had the largest share of 28.6 percent to the country’s total
mungbean area with 12.30 thousand hectares (Figure 54). This was followed by Ilocos Norte with 4.81 thousand hectares or 11.2 percent share, and Pangasinan with 4.19 thousand hectares or 9.7 percent share to the national total.
211
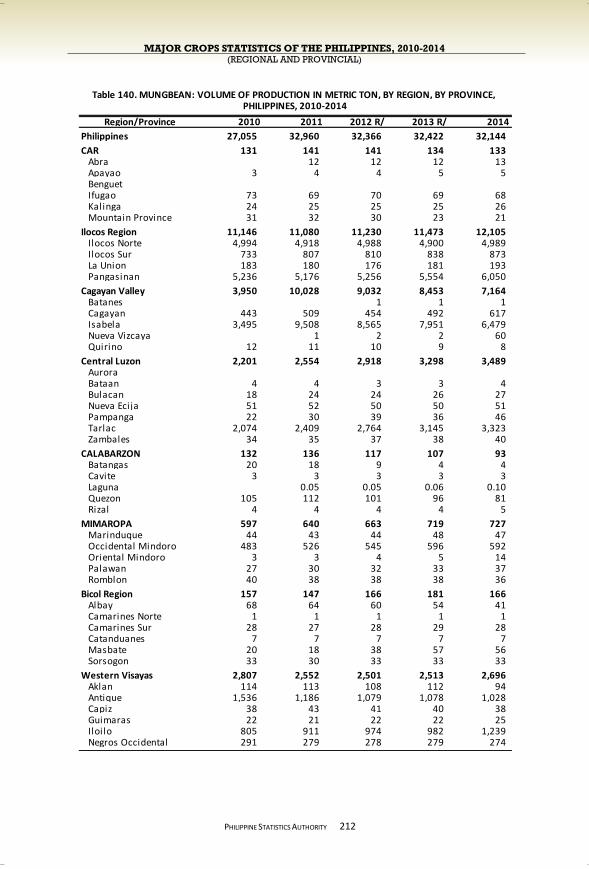
MAJOR CROPS STATISTICS OF THE PHILIPPINES, 2010-2014 (REGIONAL AND PROVINCIAL)
PHILIPPINE STATISTICS AUTHORITY
212
Region/Province 2010 2011 2012 R/ 2013 R/ 2014
Philippines 27,055 32,960 32,366 32,422 32,144
CAR 131 141 141 134 133 Abra 12 12 12 13 Apayao 3 4 4 5 5 Benguet Ifugao 73 69 70 69 68 Kalinga 24 25 25 25 26 Mountain Province 31 32 30 23 21
Ilocos Region 11,146 11,080 11,230 11,473 12,105 Ilocos Norte 4,994 4,918 4,988 4,900 4,989 Ilocos Sur 733 807 810 838 873 La Union 183 180 176 181 193 Pangasinan 5,236 5,176 5,256 5,554 6,050
Cagayan Valley 3,950 10,028 9,032 8,453 7,164 Batanes 1 1 1 Cagayan 443 509 454 492 617 Isabela 3,495 9,508 8,565 7,951 6,479 Nueva Vizcaya 1 2 2 60 Quirino 12 11 10 9 8
Central Luzon 2,201 2,554 2,918 3,298 3,489 Aurora Bataan 4 4 3 3 4 Bulacan 18 24 24 26 27 Nueva Ecija 51 52 50 50 51 Pampanga 22 30 39 36 46 Tarlac 2,074 2,409 2,764 3,145 3,323 Zambales 34 35 37 38 40
CALABARZON 132 136 117 107 93 Batangas 20 18 9 4 4 Cavite 3 3 3 3 3 Laguna 0.05 0.05 0.06 0.10 Quezon 105 112 101 96 81 Rizal 4 4 4 4 5
MIMAROPA 597 640 663 719 727 Marinduque 44 43 44 48 47 Occidental Mindoro 483 526 545 596 592 Oriental Mindoro 3 3 4 5 14 Palawan 27 30 32 33 37 Romblon 40 38 38 38 36
Bicol Region 157 147 166 181 166 Albay 68 64 60 54 41 Camarines Norte 1 1 1 1 1 Camarines Sur 28 27 28 29 28 Catanduanes 7 7 7 7 7 Masbate 20 18 38 57 56 Sorsogon 33 30 33 33 33
Western Visayas 2,807 2,552 2,501 2,513 2,696 Aklan 114 113 108 112 94 Antique 1,536 1,186 1,079 1,078 1,028 Capiz 38 43 41 40 38 Guimaras 22 21 22 22 25 Iloilo 805 911 974 982 1,239 Negros Occidental 291 279 278 279 274
PHILIPPINES, 2010-2014Table 140. MUNGBEAN: VOLUME OF PRODUCTION IN METRIC TON, BY REGION, BY PROVINCE,
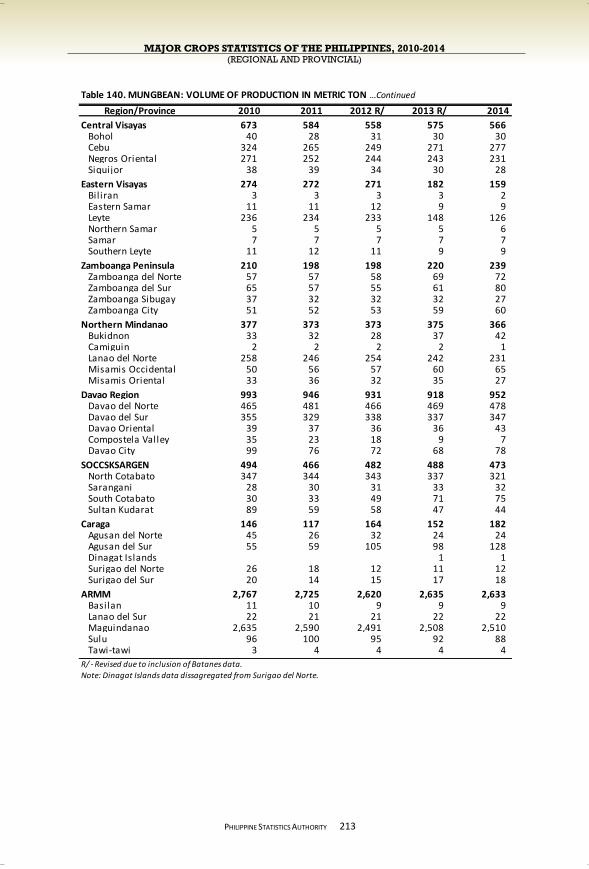
MAJOR CROPS STATISTICS OF THE PHILIPPINES, 2010-2014 (REGIONAL AND PROVINCIAL)
PHILIPPINE STATISTICS AUTHORITY
213
Region/Province 2010 2011 2012 R/ 2013 R/ 2014
Central Visayas 673 584 558 575 566 Bohol 40 28 31 30 30 Cebu 324 265 249 271 277 Negros Oriental 271 252 244 243 231 Siquijor 38 39 34 30 28
Eastern Visayas 274 272 271 182 159 Bil iran 3 3 3 3 2 Eastern Samar 11 11 12 9 9 Leyte 236 234 233 148 126 Northern Samar 5 5 5 5 6 Samar 7 7 7 7 7 Southern Leyte 11 12 11 9 9
Zamboanga Peninsula 210 198 198 220 239 Zamboanga del Norte 57 57 58 69 72 Zamboanga del Sur 65 57 55 61 80 Zamboanga Sibugay 37 32 32 32 27 Zamboanga City 51 52 53 59 60
Northern Mindanao 377 373 373 375 366 Bukidnon 33 32 28 37 42 Camiguin 2 2 2 2 1 Lanao del Norte 258 246 254 242 231 Misamis Occidental 50 56 57 60 65 Misamis Oriental 33 36 32 35 27
Davao Region 993 946 931 918 952 Davao del Norte 465 481 466 469 478 Davao del Sur 355 329 338 337 347 Davao Oriental 39 37 36 36 43 Compostela Valley 35 23 18 9 7 Davao City 99 76 72 68 78
SOCCSKSARGEN 494 466 482 488 473 North Cotabato 347 344 343 337 321 Sarangani 28 30 31 33 32 South Cotabato 30 33 49 71 75 Sultan Kudarat 89 59 58 47 44
Caraga 146 117 164 152 182 Agusan del Norte 45 26 32 24 24 Agusan del Sur 55 59 105 98 128 Dinagat Islands 1 1 Surigao del Norte 26 18 12 11 12 Surigao del Sur 20 14 15 17 18
ARMM 2,767 2,725 2,620 2,635 2,633 Basilan 11 10 9 9 9 Lanao del Sur 22 21 21 22 22 Maguindanao 2,635 2,590 2,491 2,508 2,510 Sulu 96 100 95 92 88 Tawi-tawi 3 4 4 4 4
R/ - Revised due to inclusion of Batanes data.
Note: Dinagat Islands data dissagregated from Surigao del Norte.
Table 140. MUNGBEAN: VOLUME OF PRODUCTION IN METRIC TON …Continued
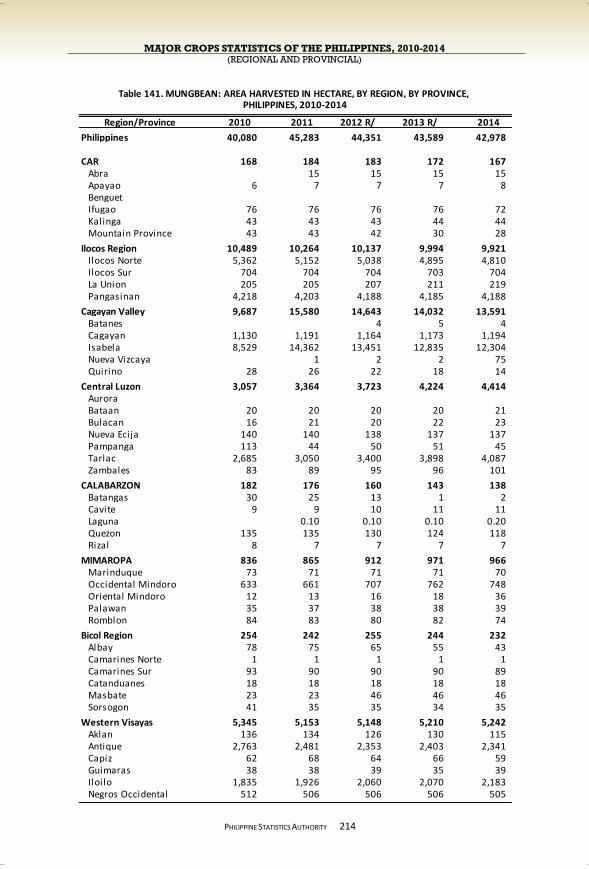
MAJOR CROPS STATISTICS OF THE PHILIPPINES, 2010-2014 (REGIONAL AND PROVINCIAL)
PHILIPPINE STATISTICS AUTHORITY
214
Region/Province 2010 2011 2012 R/ 2013 R/ 2014
Philippines 40,080 45,283 44,351 43,589 42,978
CAR 168 184 183 172 167 Abra 15 15 15 15 Apayao 6 7 7 7 8 Benguet Ifugao 76 76 76 76 72 Kalinga 43 43 43 44 44 Mountain Province 43 43 42 30 28
Ilocos Region 10,489 10,264 10,137 9,994 9,921 Ilocos Norte 5,362 5,152 5,038 4,895 4,810 Ilocos Sur 704 704 704 703 704 La Union 205 205 207 211 219 Pangasinan 4,218 4,203 4,188 4,185 4,188
Cagayan Valley 9,687 15,580 14,643 14,032 13,591 Batanes 4 5 4 Cagayan 1,130 1,191 1,164 1,173 1,194 Isabela 8,529 14,362 13,451 12,835 12,304 Nueva Vizcaya 1 2 2 75 Quirino 28 26 22 18 14
Central Luzon 3,057 3,364 3,723 4,224 4,414 Aurora Bataan 20 20 20 20 21 Bulacan 16 21 20 22 23 Nueva Ecija 140 140 138 137 137 Pampanga 113 44 50 51 45 Tarlac 2,685 3,050 3,400 3,898 4,087 Zambales 83 89 95 96 101
CALABARZON 182 176 160 143 138 Batangas 30 25 13 1 2 Cavite 9 9 10 11 11 Laguna 0.10 0.10 0.10 0.20 Quezon 135 135 130 124 118 Rizal 8 7 7 7 7
MIMAROPA 836 865 912 971 966 Marinduque 73 71 71 71 70 Occidental Mindoro 633 661 707 762 748 Oriental Mindoro 12 13 16 18 36 Palawan 35 37 38 38 39 Romblon 84 83 80 82 74
Bicol Region 254 242 255 244 232 Albay 78 75 65 55 43 Camarines Norte 1 1 1 1 1 Camarines Sur 93 90 90 90 89 Catanduanes 18 18 18 18 18 Masbate 23 23 46 46 46 Sorsogon 41 35 35 34 35
Western Visayas 5,345 5,153 5,148 5,210 5,242 Aklan 136 134 126 130 115 Antique 2,763 2,481 2,353 2,403 2,341 Capiz 62 68 64 66 59 Guimaras 38 38 39 35 39 Iloilo 1,835 1,926 2,060 2,070 2,183 Negros Occidental 512 506 506 506 505
PHILIPPINES, 2010-2014Table 141. MUNGBEAN: AREA HARVESTED IN HECTARE, BY REGION, BY PROVINCE,
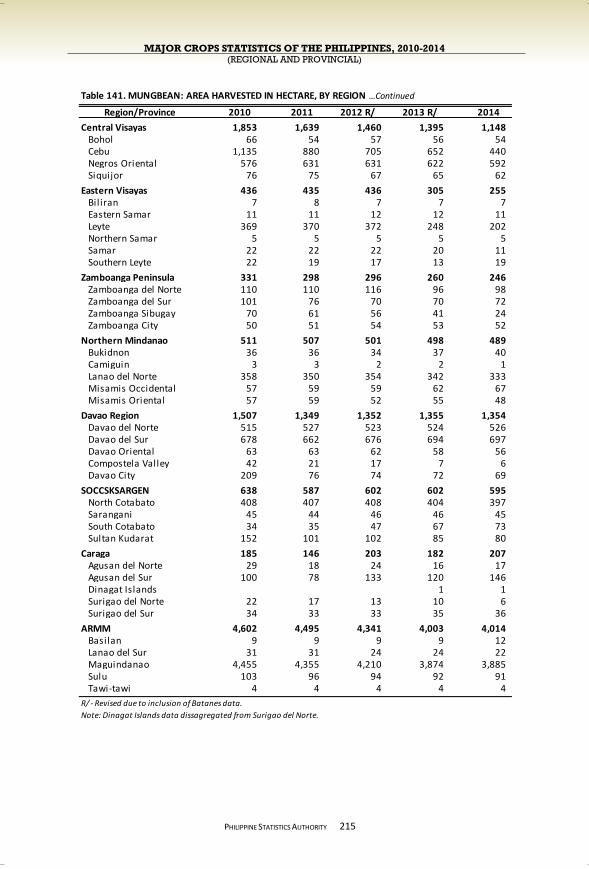
MAJOR CROPS STATISTICS OF THE PHILIPPINES, 2010-2014 (REGIONAL AND PROVINCIAL)
PHILIPPINE STATISTICS AUTHORITY
215
Region/Province 2010 2011 2012 R/ 2013 R/ 2014
Central Visayas 1,853 1,639 1,460 1,395 1,148 Bohol 66 54 57 56 54 Cebu 1,135 880 705 652 440 Negros Oriental 576 631 631 622 592 Siquijor 76 75 67 65 62
Eastern Visayas 436 435 436 305 255 Bil iran 7 8 7 7 7 Eastern Samar 11 11 12 12 11 Leyte 369 370 372 248 202 Northern Samar 5 5 5 5 5 Samar 22 22 22 20 11 Southern Leyte 22 19 17 13 19
Zamboanga Peninsula 331 298 296 260 246 Zamboanga del Norte 110 110 116 96 98 Zamboanga del Sur 101 76 70 70 72 Zamboanga Sibugay 70 61 56 41 24 Zamboanga City 50 51 54 53 52
Northern Mindanao 511 507 501 498 489 Bukidnon 36 36 34 37 40 Camiguin 3 3 2 2 1 Lanao del Norte 358 350 354 342 333 Misamis Occidental 57 59 59 62 67 Misamis Oriental 57 59 52 55 48
Davao Region 1,507 1,349 1,352 1,355 1,354 Davao del Norte 515 527 523 524 526 Davao del Sur 678 662 676 694 697 Davao Oriental 63 63 62 58 56 Compostela Valley 42 21 17 7 6 Davao City 209 76 74 72 69
SOCCSKSARGEN 638 587 602 602 595 North Cotabato 408 407 408 404 397 Sarangani 45 44 46 46 45 South Cotabato 34 35 47 67 73 Sultan Kudarat 152 101 102 85 80
Caraga 185 146 203 182 207 Agusan del Norte 29 18 24 16 17 Agusan del Sur 100 78 133 120 146 Dinagat Islands 1 1 Surigao del Norte 22 17 13 10 6 Surigao del Sur 34 33 33 35 36
ARMM 4,602 4,495 4,341 4,003 4,014 Basilan 9 9 9 9 12 Lanao del Sur 31 31 24 24 22 Maguindanao 4,455 4,355 4,210 3,874 3,885 Sulu 103 96 94 92 91 Tawi-tawi 4 4 4 4 4
R/ - Revised due to inclusion of Batanes data.
Note: Dinagat Islands data dissagregated from Surigao del Norte.
Table 141. MUNGBEAN: AREA HARVESTED IN HECTARE, BY REGION …Continued
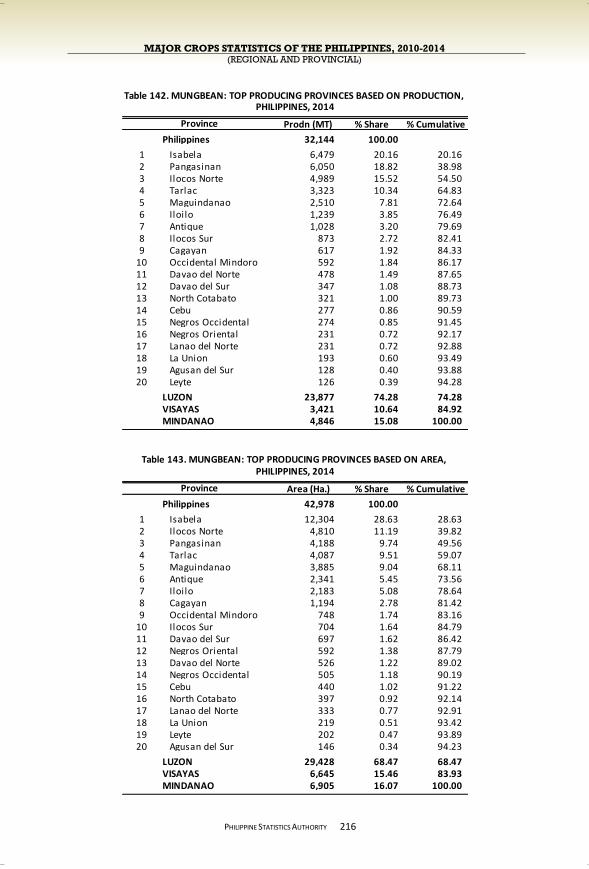
MAJOR CROPS STATISTICS OF THE PHILIPPINES, 2010-2014 (REGIONAL AND PROVINCIAL)
PHILIPPINE STATISTICS AUTHORITY
216
Prodn (MT) % Share % Cumulative
Philippines 32,144 100.00
1 Isabela 6,479 20.16 20.16 2 Pangasinan 6,050 18.82 38.98 3 Ilocos Norte 4,989 15.52 54.50 4 Tarlac 3,323 10.34 64.83 5 Maguindanao 2,510 7.81 72.64 6 Iloilo 1,239 3.85 76.49 7 Antique 1,028 3.20 79.69 8 Ilocos Sur 873 2.72 82.41 9 Cagayan 617 1.92 84.33
10 Occidental Mindoro 592 1.84 86.17 11 Davao del Norte 478 1.49 87.65 12 Davao del Sur 347 1.08 88.73 13 North Cotabato 321 1.00 89.73 14 Cebu 277 0.86 90.59 15 Negros Occidental 274 0.85 91.45 16 Negros Oriental 231 0.72 92.17 17 Lanao del Norte 231 0.72 92.88 18 La Union 193 0.60 93.49 19 Agusan del Sur 128 0.40 93.88 20 Leyte 126 0.39 94.28
LUZON 23,877 74.28 74.28 VISAYAS 3,421 10.64 84.92 MINDANAO 4,846 15.08 100.00
Area (Ha.) % Share % Cumulative
Philippines 42,978 100.00
1 Isabela 12,304 28.63 28.63 2 Ilocos Norte 4,810 11.19 39.82 3 Pangasinan 4,188 9.74 49.56 4 Tarlac 4,087 9.51 59.07 5 Maguindanao 3,885 9.04 68.11 6 Antique 2,341 5.45 73.56 7 Iloilo 2,183 5.08 78.64 8 Cagayan 1,194 2.78 81.42 9 Occidental Mindoro 748 1.74 83.16
10 Ilocos Sur 704 1.64 84.79 11 Davao del Sur 697 1.62 86.42 12 Negros Oriental 592 1.38 87.79 13 Davao del Norte 526 1.22 89.02 14 Negros Occidental 505 1.18 90.19 15 Cebu 440 1.02 91.22 16 North Cotabato 397 0.92 92.14 17 Lanao del Norte 333 0.77 92.91 18 La Union 219 0.51 93.42 19 Leyte 202 0.47 93.89 20 Agusan del Sur 146 0.34 94.23
LUZON 29,428 68.47 68.47 VISAYAS 6,645 15.46 83.93 MINDANAO 6,905 16.07 100.00
Province
Table 142. MUNGBEAN: TOP PRODUCING PROVINCES BASED ON PRODUCTION,
Table 143. MUNGBEAN: TOP PRODUCING PROVINCES BASED ON AREA,
Province
PHILIPPINES, 2014
PHILIPPINES, 2014
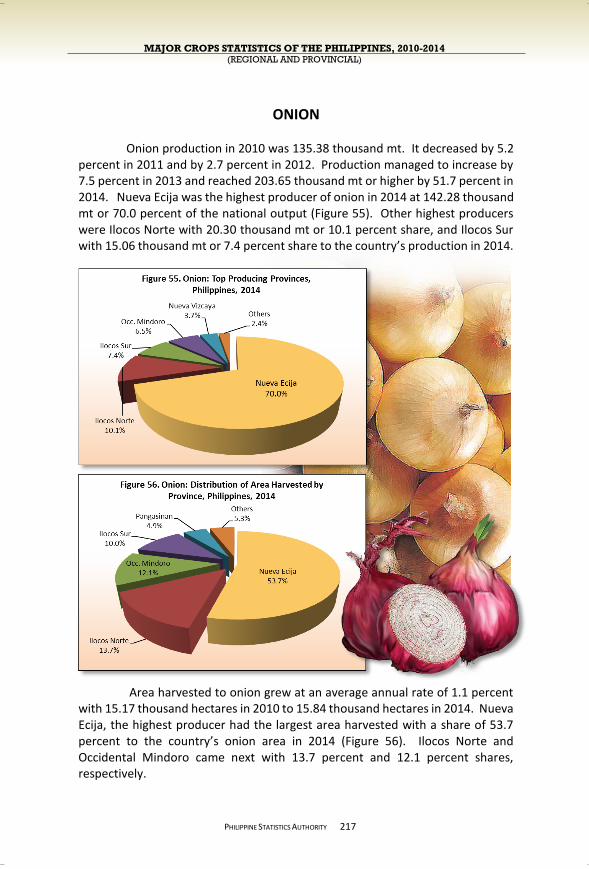
MAJOR CROPS STATISTICS OF THE PHILIPPINES, 2010-2014 (REGIONAL AND PROVINCIAL)
PHILIPPINE STATISTICS AUTHORITY
ONION
Onion production in 2010 was 135.38 thousand mt. It decreased by 5.2 percent in 2011 and by 2.7 percent in 2012. Production managed to increase by 7.5 percent in 2013 and reached 203.65 thousand mt or higher by 51.7 percent in 2014. Nueva Ecija was the highest producer of onion in 2014 at 142.28 thousand mt or 70.0 percent of the national output (Figure 55). Other highest producers were Ilocos Norte with 20.30 thousand mt or 10.1 percent share, and Ilocos Sur with 15.06 thousand mt or 7.4 percent share to the country’s production in 2014.
Area harvested to onion grew at an average annual rate of 1.1 percent
with 15.17 thousand hectares in 2010 to 15.84 thousand hectares in 2014. Nueva Ecija, the highest producer had the largest area harvested with a share of 53.7 percent to the country’s onion area in 2014 (Figure 56). Ilocos Norte and Occidental Mindoro came next with 13.7 percent and 12.1 percent shares, respectively.
217
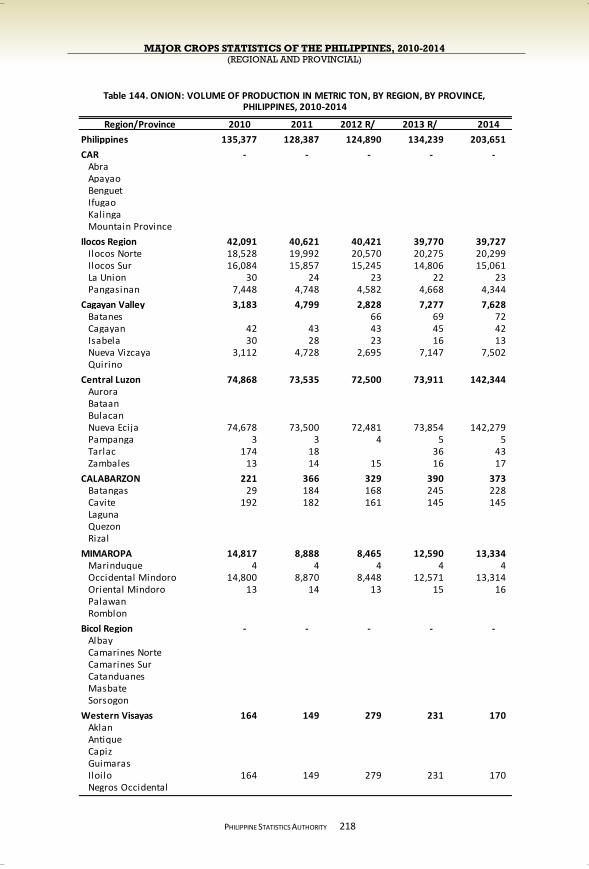
MAJOR CROPS STATISTICS OF THE PHILIPPINES, 2010-2014 (REGIONAL AND PROVINCIAL)
PHILIPPINE STATISTICS AUTHORITY
218
Region/Province 2010 2011 2012 R/ 2013 R/ 2014
Philippines 135,377 128,387 124,890 134,239 203,651
CAR - - - - - Abra Apayao Benguet Ifugao Kalinga Mountain Province
Ilocos Region 42,091 40,621 40,421 39,770 39,727 Ilocos Norte 18,528 19,992 20,570 20,275 20,299 Ilocos Sur 16,084 15,857 15,245 14,806 15,061 La Union 30 24 23 22 23 Pangasinan 7,448 4,748 4,582 4,668 4,344
Cagayan Valley 3,183 4,799 2,828 7,277 7,628 Batanes 66 69 72 Cagayan 42 43 43 45 42 Isabela 30 28 23 16 13 Nueva Vizcaya 3,112 4,728 2,695 7,147 7,502 Quirino
Central Luzon 74,868 73,535 72,500 73,911 142,344 Aurora Bataan Bulacan Nueva Ecija 74,678 73,500 72,481 73,854 142,279 Pampanga 3 3 4 5 5 Tarlac 174 18 36 43 Zambales 13 14 15 16 17
CALABARZON 221 366 329 390 373 Batangas 29 184 168 245 228 Cavite 192 182 161 145 145 Laguna Quezon Rizal
MIMAROPA 14,817 8,888 8,465 12,590 13,334 Marinduque 4 4 4 4 4 Occidental Mindoro 14,800 8,870 8,448 12,571 13,314 Oriental Mindoro 13 14 13 15 16 Palawan Romblon
Bicol Region - - - - - Albay Camarines Norte Camarines Sur Catanduanes Masbate Sorsogon
Western Visayas 164 149 279 231 170 Aklan Antique Capiz Guimaras Iloilo 164 149 279 231 170 Negros Occidental
PHILIPPINES, 2010-2014Table 144. ONION: VOLUME OF PRODUCTION IN METRIC TON, BY REGION, BY PROVINCE,
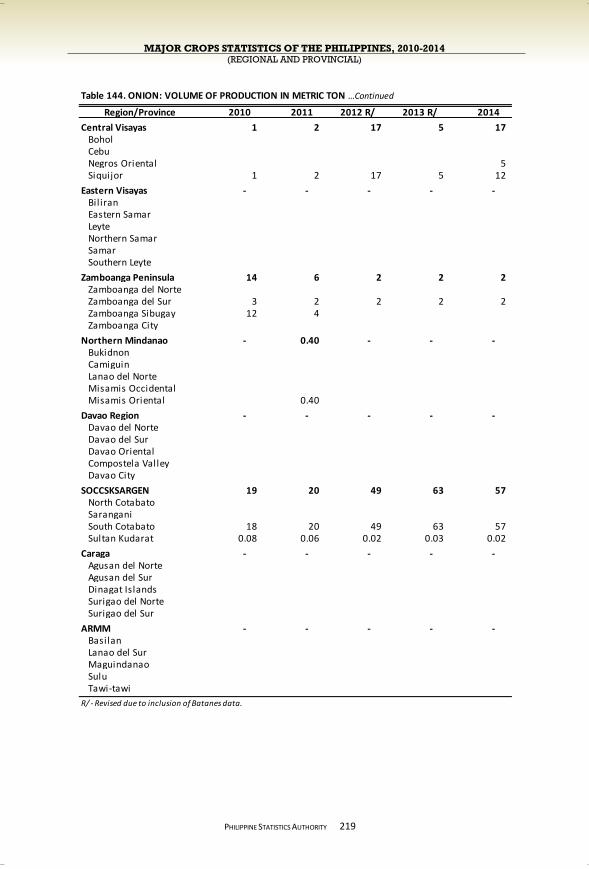
MAJOR CROPS STATISTICS OF THE PHILIPPINES, 2010-2014 (REGIONAL AND PROVINCIAL)
PHILIPPINE STATISTICS AUTHORITY
219
Region/Province 2010 2011 2012 R/ 2013 R/ 2014
Central Visayas 1 2 17 5 17 Bohol Cebu Negros Oriental 5 Siquijor 1 2 17 5 12
Eastern Visayas - - - - - Bil iran Eastern Samar Leyte Northern Samar Samar Southern Leyte
Zamboanga Peninsula 14 6 2 2 2 Zamboanga del Norte Zamboanga del Sur 3 2 2 2 2 Zamboanga Sibugay 12 4 Zamboanga City
Northern Mindanao - 0.40 - - - Bukidnon Camiguin Lanao del Norte Misamis Occidental Misamis Oriental 0.40
Davao Region - - - - - Davao del Norte Davao del Sur Davao Oriental Compostela Valley Davao City
SOCCSKSARGEN 19 20 49 63 57 North Cotabato Sarangani South Cotabato 18 20 49 63 57 Sultan Kudarat 0.08 0.06 0.02 0.03 0.02
Caraga - - - - - Agusan del Norte Agusan del Sur Dinagat Islands Surigao del Norte Surigao del Sur
ARMM - - - - - Basilan Lanao del Sur Maguindanao Sulu Tawi-tawi
R/ - Revised due to inclusion of Batanes data.
Table 144. ONION: VOLUME OF PRODUCTION IN METRIC TON …Continued
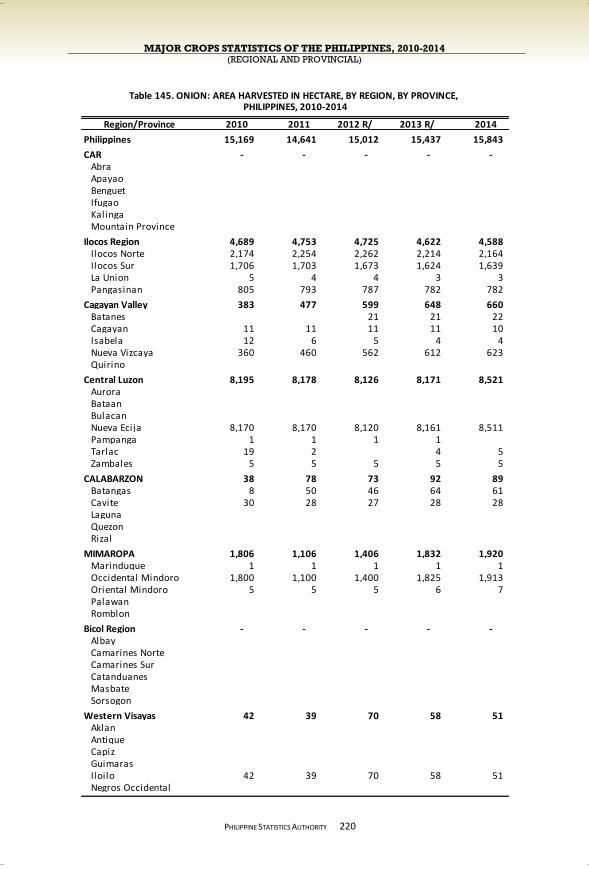
MAJOR CROPS STATISTICS OF THE PHILIPPINES, 2010-2014 (REGIONAL AND PROVINCIAL)
PHILIPPINE STATISTICS AUTHORITY
220
Region/Province 2010 2011 2012 R/ 2013 R/ 2014
Philippines 15,169 14,641 15,012 15,437 15,843
CAR - - - - - Abra Apayao Benguet Ifugao Kalinga Mountain Province
Ilocos Region 4,689 4,753 4,725 4,622 4,588 Ilocos Norte 2,174 2,254 2,262 2,214 2,164 Ilocos Sur 1,706 1,703 1,673 1,624 1,639 La Union 5 4 4 3 3 Pangasinan 805 793 787 782 782
Cagayan Valley 383 477 599 648 660 Batanes 21 21 22 Cagayan 11 11 11 11 10 Isabela 12 6 5 4 4 Nueva Vizcaya 360 460 562 612 623 Quirino
Central Luzon 8,195 8,178 8,126 8,171 8,521 Aurora Bataan Bulacan Nueva Ecija 8,170 8,170 8,120 8,161 8,511 Pampanga 1 1 1 1 Tarlac 19 2 4 5 Zambales 5 5 5 5 5
CALABARZON 38 78 73 92 89 Batangas 8 50 46 64 61 Cavite 30 28 27 28 28 Laguna Quezon Rizal
MIMAROPA 1,806 1,106 1,406 1,832 1,920 Marinduque 1 1 1 1 1 Occidental Mindoro 1,800 1,100 1,400 1,825 1,913 Oriental Mindoro 5 5 5 6 7 Palawan Romblon
Bicol Region - - - - - Albay Camarines Norte Camarines Sur Catanduanes Masbate Sorsogon
Western Visayas 42 39 70 58 51 Aklan Antique Capiz Guimaras Iloilo 42 39 70 58 51 Negros Occidental
PHILIPPINES, 2010-2014Table 145. ONION: AREA HARVESTED IN HECTARE, BY REGION, BY PROVINCE,
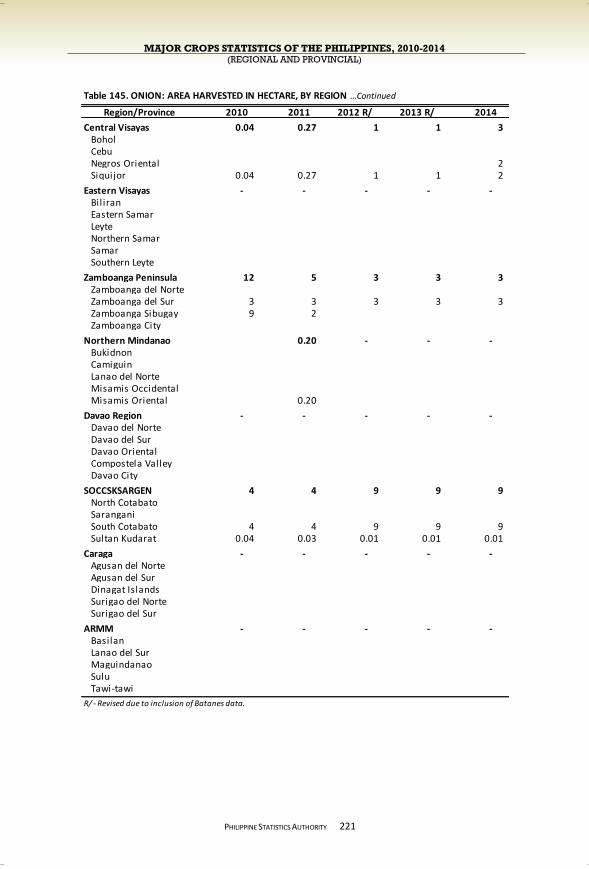
MAJOR CROPS STATISTICS OF THE PHILIPPINES, 2010-2014 (REGIONAL AND PROVINCIAL)
PHILIPPINE STATISTICS AUTHORITY
221
Region/Province 2010 2011 2012 R/ 2013 R/ 2014
Central Visayas 0.04 0.27 1 1 3 Bohol Cebu Negros Oriental 2 Siquijor 0.04 0.27 1 1 2
Eastern Visayas - - - - - Bil iran Eastern Samar Leyte Northern Samar Samar Southern Leyte
Zamboanga Peninsula 12 5 3 3 3 Zamboanga del Norte Zamboanga del Sur 3 3 3 3 3 Zamboanga Sibugay 9 2 Zamboanga City
Northern Mindanao 0.20 - - - Bukidnon Camiguin Lanao del Norte Misamis Occidental Misamis Oriental 0.20
Davao Region - - - - - Davao del Norte Davao del Sur Davao Oriental Compostela Valley Davao City
SOCCSKSARGEN 4 4 9 9 9 North Cotabato Sarangani South Cotabato 4 4 9 9 9 Sultan Kudarat 0.04 0.03 0.01 0.01 0.01
Caraga - - - - - Agusan del Norte Agusan del Sur Dinagat Islands Surigao del Norte Surigao del Sur
ARMM - - - - - Basilan Lanao del Sur Maguindanao Sulu Tawi-tawi
R/ - Revised due to inclusion of Batanes data.
Table 145. ONION: AREA HARVESTED IN HECTARE, BY REGION …Continued

MAJOR CROPS STATISTICS OF THE PHILIPPINES, 2010-2014 (REGIONAL AND PROVINCIAL)
PHILIPPINE STATISTICS AUTHORITY
222
Prodn (MT) % Share % Cumulative
Philippines 203,651 100.00
1 Nueva Ecija 142,279 69.86 69.86 2 Ilocos Norte 20,299 9.97 79.83 3 Ilocos Sur 15,061 7.40 87.23 4 Occidental Mindoro 13,314 6.54 93.76 5 Nueva Vizcaya 7,502 3.68 97.45 6 Pangasinan 4,344 2.13 99.58 7 Batangas 228 0.11 99.69 8 Iloilo 170 0.08 99.78 9 Cavite 145 0.07 99.85
10 Batanes 72 0.04 99.88 11 South Cotabato 57 0.03 99.91 12 Tarlac 43 0.02 99.93 13 Cagayan 42 0.02 99.95 14 La Union 23 0.01 99.96 15 Zambales 17 0.01 99.97 16 Oriental Mindoro 16 0.01 99.98 17 Isabela 13 0.006 99.99 18 Siquijor 12 0.006 99.99 19 Negros Oriental 5 0.00246 100.00 20 Pampanga 5 0.002 100.00
LUZON 203,406 99.88 99.88 VISAYAS 187 0.09 99.97 MINDANAO 59 0.03 100.00
Area (Ha.) % Share % Cumulative
Philippines 15,843 100.00
1 Nueva Ecija 8,511 53.72 53.72 2 Ilocos Norte 2,164 13.66 67.38 3 Occidental Mindoro 1,913 12.07 79.45 4 Ilocos Sur 1,639 10.35 89.80 5 Pangasinan 782 4.94 94.73 6 Nueva Vizcaya 623 3.93 98.67 7 Batangas 61 0.39 99.05 8 Iloilo 51 0.32 99.37 9 Cavite 28 0.18 99.55
10 Batanes 22 0.14 99.69 11 Cagayan 10 0.06 99.75 12 South Cotabato 9 0.05 99.80 13 Oriental Mindoro 7 0.04 99.85 14 Tarlac 5 0.03 99.88 15 Zambales 5 0.03 99.91 16 Isabela 4 0.03 99.94 17 La Union 3 0.02 99.96 18 Zamboanga del Sur 3 0.02 99.97 19 Siquijor 2 0.01 99.98 20 Negros Oriental 1.50 0.0095 99.99
LUZON 15,778 99.59 99.59 VISAYAS 54 0.34 99.93 MINDANAO 12 0.07 100.00
Province
Table 146. ONION: TOP PRODUCING PROVINCES BASED ON PRODUCTION,
Table 147. ONION: TOP PRODUCING PROVINCES BASED ON AREA,
Province
PHILIPPINES, 2014
PHILIPPINES, 2014

MAJOR CROPS STATISTICS OF THE PHILIPPINES, 2010-2014 (REGIONAL AND PROVINCIAL)
PHILIPPINE STATISTICS AUTHORITY
PEANUT
Production of peanut fluctuated at a downward trend from 29.62 thousand mt in 2010 to 29.20 thousand mt in 2014 at an average annual rate of 0.4 percent. Pangasinan was the highest producer of peanut at 6.03 thousand mt with 20.6 percent share to the country’s total output (Figure 57). Other top peanut producers with corresponding shares are: La Union, 2.72 thousand mt or 9.3 percent; and Lanao del Norte, 1.87 thousand mt or 6.4 percent.
Peanut area
harvested continuously decreased from 27.12 thousand hectares in 2010 to 25.05 thousand hectares in 2014 at an average annual rate of 2.0 percent. Pangasinan, with share of 12.0 percent; La Union and Iloilo, with shares of 8.0 percent and 7.9 percent, respectively, to the national total, have the largest area harvested of peanut in 2014 (Figure 58).
223
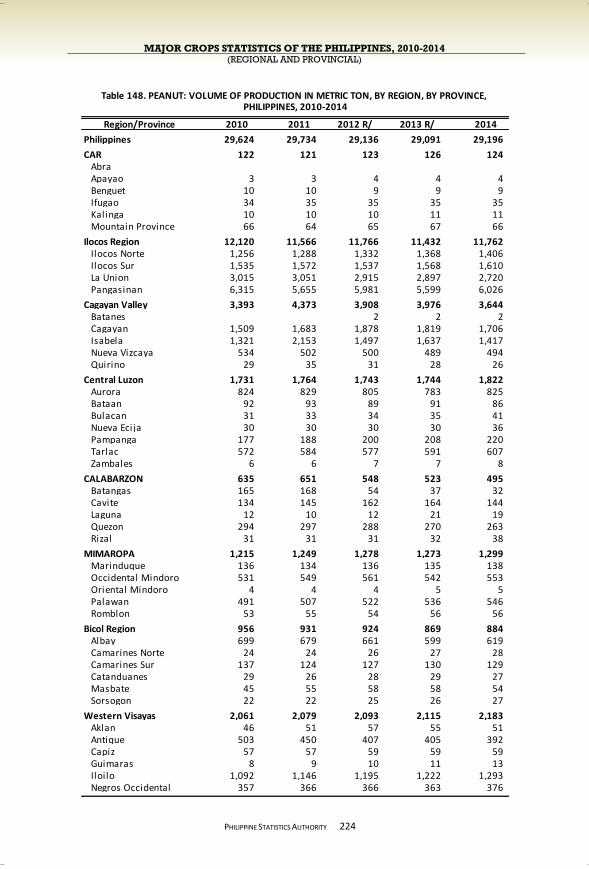
MAJOR CROPS STATISTICS OF THE PHILIPPINES, 2010-2014 (REGIONAL AND PROVINCIAL)
PHILIPPINE STATISTICS AUTHORITY
224
Region/Province 2010 2011 2012 R/ 2013 R/ 2014
Philippines 29,624 29,734 29,136 29,091 29,196
CAR 122 121 123 126 124 Abra Apayao 3 3 4 4 4 Benguet 10 10 9 9 9 Ifugao 34 35 35 35 35 Kalinga 10 10 10 11 11 Mountain Province 66 64 65 67 66
Ilocos Region 12,120 11,566 11,766 11,432 11,762 Ilocos Norte 1,256 1,288 1,332 1,368 1,406 Ilocos Sur 1,535 1,572 1,537 1,568 1,610 La Union 3,015 3,051 2,915 2,897 2,720 Pangasinan 6,315 5,655 5,981 5,599 6,026
Cagayan Valley 3,393 4,373 3,908 3,976 3,644 Batanes 2 2 2 Cagayan 1,509 1,683 1,878 1,819 1,706 Isabela 1,321 2,153 1,497 1,637 1,417 Nueva Vizcaya 534 502 500 489 494 Quirino 29 35 31 28 26
Central Luzon 1,731 1,764 1,743 1,744 1,822 Aurora 824 829 805 783 825 Bataan 92 93 89 91 86 Bulacan 31 33 34 35 41 Nueva Ecija 30 30 30 30 36 Pampanga 177 188 200 208 220 Tarlac 572 584 577 591 607 Zambales 6 6 7 7 8
CALABARZON 635 651 548 523 495 Batangas 165 168 54 37 32 Cavite 134 145 162 164 144 Laguna 12 10 12 21 19 Quezon 294 297 288 270 263 Rizal 31 31 31 32 38
MIMAROPA 1,215 1,249 1,278 1,273 1,299 Marinduque 136 134 136 135 138 Occidental Mindoro 531 549 561 542 553 Oriental Mindoro 4 4 4 5 5 Palawan 491 507 522 536 546 Romblon 53 55 54 56 56
Bicol Region 956 931 924 869 884 Albay 699 679 661 599 619 Camarines Norte 24 24 26 27 28 Camarines Sur 137 124 127 130 129 Catanduanes 29 26 28 29 27 Masbate 45 55 58 58 54 Sorsogon 22 22 25 26 27
Western Visayas 2,061 2,079 2,093 2,115 2,183 Aklan 46 51 57 55 51 Antique 503 450 407 405 392 Capiz 57 57 59 59 59 Guimaras 8 9 10 11 13 Iloilo 1,092 1,146 1,195 1,222 1,293 Negros Occidental 357 366 366 363 376
PHILIPPINES, 2010-2014Table 148. PEANUT: VOLUME OF PRODUCTION IN METRIC TON, BY REGION, BY PROVINCE,

MAJOR CROPS STATISTICS OF THE PHILIPPINES, 2010-2014 (REGIONAL AND PROVINCIAL)
PHILIPPINE STATISTICS AUTHORITY
225
Region/Province 2010 2011 2012 R/ 2013 R/ 2014
Central Visayas 1,147 1,071 1,031 1,014 1,005 Bohol 219 223 240 237 216 Cebu 354 327 324 336 361 Negros Oriental 388 341 299 293 289 Siquijor 186 181 168 148 139
Eastern Visayas 563 575 579 572 498 Bil iran 29 28 28 28 26 Eastern Samar 20 20 21 20 15 Leyte 251 257 258 252 184 Northern Samar 66 67 70 72 74 Samar 181 187 187 188 187 Southern Leyte 16 16 16 13 13
Zamboanga Peninsula 515 497 492 893 1,071 Zamboanga del Norte 122 123 132 109 116 Zamboanga del Sur 262 254 261 685 832 Zamboanga Sibugay 98 85 63 51 64 Zamboanga City 33 34 36 48 59
Northern Mindanao 3,091 2,923 2,739 2,633 2,453 Bukidnon 475 503 496 510 527 Camiguin 9 9 9 9 8 Lanao del Norte 2,561 2,364 2,180 2,050 1,870 Misamis Occidental 23 24 32 29 28 Misamis Oriental 23 23 21 35 20
Davao Region 654 580 548 543 555 Davao del Norte 66 68 70 71 78 Davao del Sur 68 69 60 60 59 Davao Oriental 47 44 40 40 41 Compostela Valley 175 158 141 130 133 Davao City 297 241 236 242 245
SOCCSKSARGEN 644 658 684 674 671 North Cotabato 233 227 229 239 237 Sarangani 41 43 44 46 45 South Cotabato 26 26 30 31 33 Sultan Kudarat 344 362 380 358 356
Caraga 162 92 104 124 151 Agusan del Norte 51 13 15 22 23 Agusan del Sur 68 42 54 65 90 Dinagat Islands 1 1 Surigao del Norte 14 11 9 6 6 Surigao del Sur 30 26 27 30 32
ARMM 613 604 576 581 579 Basilan 48 47 47 48 46 Lanao del Sur 204 198 184 192 195 Maguindanao 125 127 124 127 128 Sulu 180 179 171 169 167 Tawi-tawi 56 54 50 44 43
R/ - Revised due to inclusion of Batanes data.
Note: Dinagat Islands data dissagregated from Surigao del Norte.
Table 148. PEANUT: VOLUME OF PRODUCTION IN METRIC TON …Continued

MAJOR CROPS STATISTICS OF THE PHILIPPINES, 2010-2014 (REGIONAL AND PROVINCIAL)
PHILIPPINE STATISTICS AUTHORITY
226
Region/Province 2010 2011 2012 R/ 2013 R/ 2014
Philippines 27,123 26,902 26,110 25,602 25,048
CAR 254 252 249 250 239 Abra Apayao 5 5 5 5 5 Benguet 26 26 24 24 23 Ifugao 92 92 92 92 92 Kalinga 25 25 17 18 15 Mountain Province 106 104 111 111 104
Ilocos Region 7,808 7,593 7,515 7,421 7,439 Ilocos Norte 1,093 1,093 1,104 1,114 1,118 Ilocos Sur 1,135 1,135 1,135 1,170 1,191 La Union 2,079 2,099 2,008 2,005 1,997 Pangasinan 3,501 3,265 3,268 3,131 3,133
Cagayan Valley 3,159 3,780 3,516 3,508 3,439 Batanes 2 2 2 Cagayan 1,551 1,605 1,607 1,593 1,571 Isabela 1,071 1,647 1,412 1,426 1,402 Nueva Vizcaya 492 480 451 446 424 Quirino 45 48 44 41 40
Central Luzon 1,403 1,285 1,267 1,283 1,275 Aurora 603 605 581 597 604 Bataan 61 61 58 54 42 Bulacan 32 34 35 36 36 Nueva Ecija 62 61 60 58 56 Pampanga 256 134 141 145 139 Tarlac 376 376 376 376 381 Zambales 13 14 16 17 17
CALABARZON 849 804 584 543 497 Batangas 337 287 94 55 30 Cavite 164 169 143 144 131 Laguna 4 6 7 10 9 Quezon 278 286 284 278 271 Rizal 66 56 56 56 56
MIMAROPA 1,173 1,182 1,177 1,155 1,156 Marinduque 131 129 129 129 122 Occidental Mindoro 435 442 448 424 430 Oriental Mindoro 9 10 11 12 14 Palawan 550 552 540 540 540 Romblon 48 49 49 50 51
Bicol Region 1,367 1,338 1,332 1,276 1,214 Albay 833 820 815 760 700 Camarines Norte 22 21 22 22 22 Camarines Sur 308 297 295 295 293 Catanduanes 84 84 84 84 84 Masbate 59 59 59 59 59 Sorsogon 61 57 57 56 56
Western Visayas 3,314 3,337 3,349 3,377 3,387 Aklan 67 69 75 75 69 Antique 671 623 590 596 585 Capiz 87 86 89 93 91 Guimaras 13 15 17 17 17 Iloilo 1,840 1,905 1,939 1,958 1,986 Negros Occidental 636 639 639 639 639
PHILIPPINES, 2010-2014Table 149. PEANUT: AREA HARVESTED IN HECTARE, BY REGION, BY PROVINCE,
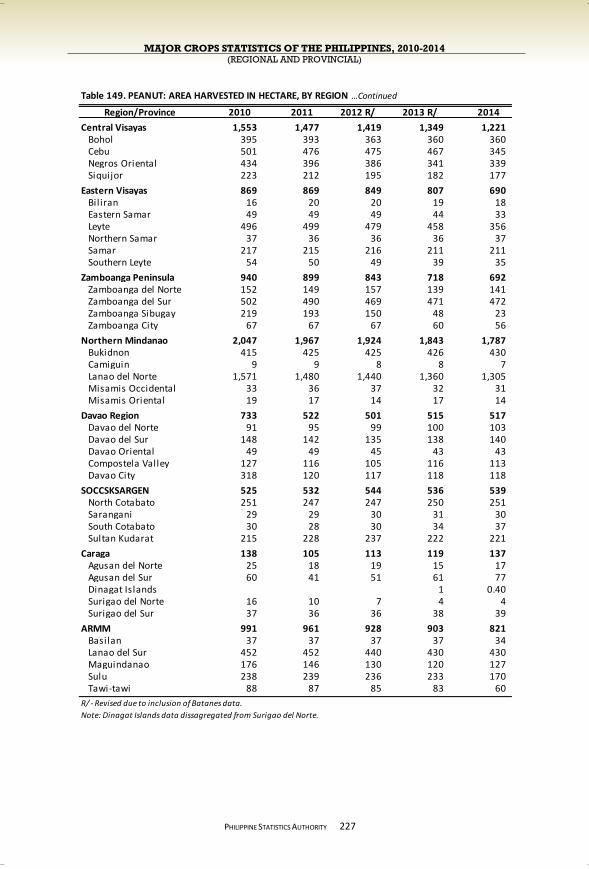
MAJOR CROPS STATISTICS OF THE PHILIPPINES, 2010-2014 (REGIONAL AND PROVINCIAL)
PHILIPPINE STATISTICS AUTHORITY
227
Region/Province 2010 2011 2012 R/ 2013 R/ 2014
Central Visayas 1,553 1,477 1,419 1,349 1,221 Bohol 395 393 363 360 360 Cebu 501 476 475 467 345 Negros Oriental 434 396 386 341 339 Siquijor 223 212 195 182 177
Eastern Visayas 869 869 849 807 690 Bil iran 16 20 20 19 18 Eastern Samar 49 49 49 44 33 Leyte 496 499 479 458 356 Northern Samar 37 36 36 36 37 Samar 217 215 216 211 211 Southern Leyte 54 50 49 39 35
Zamboanga Peninsula 940 899 843 718 692 Zamboanga del Norte 152 149 157 139 141 Zamboanga del Sur 502 490 469 471 472 Zamboanga Sibugay 219 193 150 48 23 Zamboanga City 67 67 67 60 56
Northern Mindanao 2,047 1,967 1,924 1,843 1,787 Bukidnon 415 425 425 426 430 Camiguin 9 9 8 8 7 Lanao del Norte 1,571 1,480 1,440 1,360 1,305 Misamis Occidental 33 36 37 32 31 Misamis Oriental 19 17 14 17 14
Davao Region 733 522 501 515 517 Davao del Norte 91 95 99 100 103 Davao del Sur 148 142 135 138 140 Davao Oriental 49 49 45 43 43 Compostela Valley 127 116 105 116 113 Davao City 318 120 117 118 118
SOCCSKSARGEN 525 532 544 536 539 North Cotabato 251 247 247 250 251 Sarangani 29 29 30 31 30 South Cotabato 30 28 30 34 37 Sultan Kudarat 215 228 237 222 221
Caraga 138 105 113 119 137 Agusan del Norte 25 18 19 15 17 Agusan del Sur 60 41 51 61 77 Dinagat Islands 1 0.40 Surigao del Norte 16 10 7 4 4 Surigao del Sur 37 36 36 38 39
ARMM 991 961 928 903 821 Basilan 37 37 37 37 34 Lanao del Sur 452 452 440 430 430 Maguindanao 176 146 130 120 127 Sulu 238 239 236 233 170 Tawi-tawi 88 87 85 83 60
R/ - Revised due to inclusion of Batanes data.
Note: Dinagat Islands data dissagregated from Surigao del Norte.
Table 149. PEANUT: AREA HARVESTED IN HECTARE, BY REGION …Continued
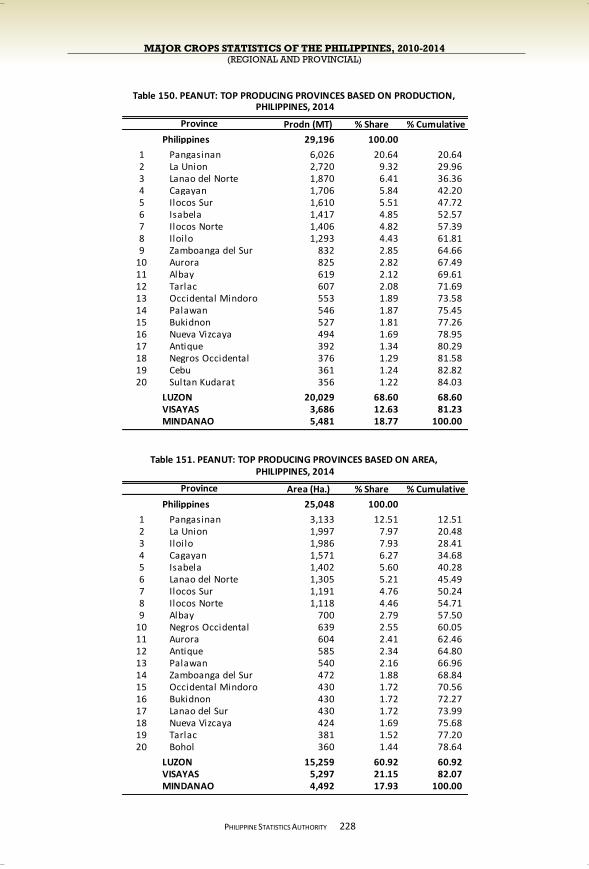
MAJOR CROPS STATISTICS OF THE PHILIPPINES, 2010-2014 (REGIONAL AND PROVINCIAL)
PHILIPPINE STATISTICS AUTHORITY
228
Prodn (MT) % Share % Cumulative
Philippines 29,196 100.00
1 Pangasinan 6,026 20.64 20.64 2 La Union 2,720 9.32 29.96 3 Lanao del Norte 1,870 6.41 36.36 4 Cagayan 1,706 5.84 42.20 5 Ilocos Sur 1,610 5.51 47.72 6 Isabela 1,417 4.85 52.57 7 Ilocos Norte 1,406 4.82 57.39 8 Iloilo 1,293 4.43 61.81 9 Zamboanga del Sur 832 2.85 64.66
10 Aurora 825 2.82 67.49 11 Albay 619 2.12 69.61 12 Tarlac 607 2.08 71.69 13 Occidental Mindoro 553 1.89 73.58 14 Palawan 546 1.87 75.45 15 Bukidnon 527 1.81 77.26 16 Nueva Vizcaya 494 1.69 78.95 17 Antique 392 1.34 80.29 18 Negros Occidental 376 1.29 81.58 19 Cebu 361 1.24 82.82 20 Sultan Kudarat 356 1.22 84.03
LUZON 20,029 68.60 68.60 VISAYAS 3,686 12.63 81.23 MINDANAO 5,481 18.77 100.00
Area (Ha.) % Share % Cumulative
Philippines 25,048 100.00
1 Pangasinan 3,133 12.51 12.51 2 La Union 1,997 7.97 20.48 3 Iloilo 1,986 7.93 28.41 4 Cagayan 1,571 6.27 34.68 5 Isabela 1,402 5.60 40.28 6 Lanao del Norte 1,305 5.21 45.49 7 Ilocos Sur 1,191 4.76 50.24 8 Ilocos Norte 1,118 4.46 54.71 9 Albay 700 2.79 57.50
10 Negros Occidental 639 2.55 60.05 11 Aurora 604 2.41 62.46 12 Antique 585 2.34 64.80 13 Palawan 540 2.16 66.96 14 Zamboanga del Sur 472 1.88 68.84 15 Occidental Mindoro 430 1.72 70.56 16 Bukidnon 430 1.72 72.27 17 Lanao del Sur 430 1.72 73.99 18 Nueva Vizcaya 424 1.69 75.68 19 Tarlac 381 1.52 77.20 20 Bohol 360 1.44 78.64
LUZON 15,259 60.92 60.92 VISAYAS 5,297 21.15 82.07 MINDANAO 4,492 17.93 100.00
Province
Table 150. PEANUT: TOP PRODUCING PROVINCES BASED ON PRODUCTION,
Table 151. PEANUT: TOP PRODUCING PROVINCES BASED ON AREA,
Province
PHILIPPINES, 2014
PHILIPPINES, 2014
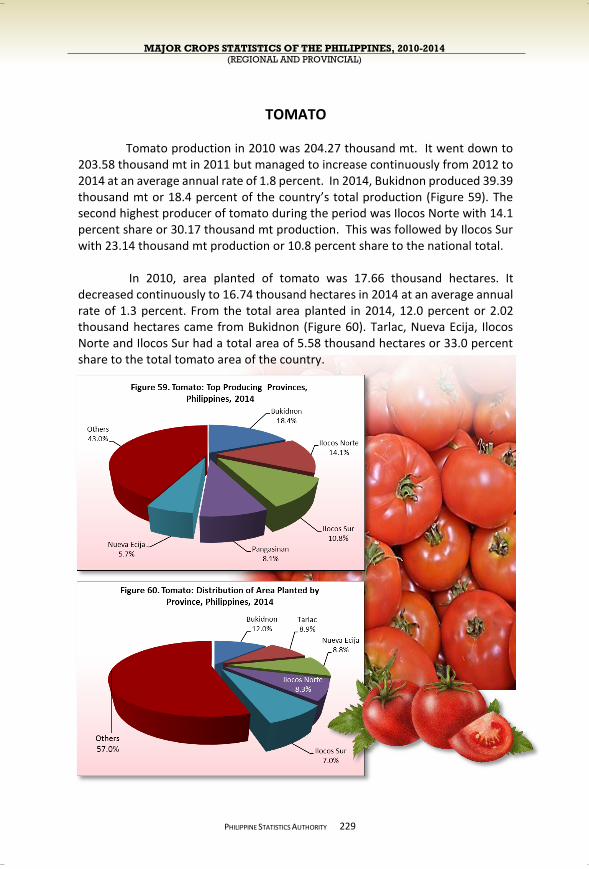
MAJOR CROPS STATISTICS OF THE PHILIPPINES, 2010-2014 (REGIONAL AND PROVINCIAL)
PHILIPPINE STATISTICS AUTHORITY
TOMATO
Tomato production in 2010 was 204.27 thousand mt. It went down to 203.58 thousand mt in 2011 but managed to increase continuously from 2012 to 2014 at an average annual rate of 1.8 percent. In 2014, Bukidnon produced 39.39 thousand mt or 18.4 percent of the country’s total production (Figure 59). The second highest producer of tomato during the period was Ilocos Norte with 14.1 percent share or 30.17 thousand mt production. This was followed by Ilocos Sur with 23.14 thousand mt production or 10.8 percent share to the national total.
In 2010, area planted of tomato was 17.66 thousand hectares. It decreased continuously to 16.74 thousand hectares in 2014 at an average annual rate of 1.3 percent. From the total area planted in 2014, 12.0 percent or 2.02 thousand hectares came from Bukidnon (Figure 60). Tarlac, Nueva Ecija, Ilocos Norte and Ilocos Sur had a total area of 5.58 thousand hectares or 33.0 percent share to the total tomato area of the country.
229
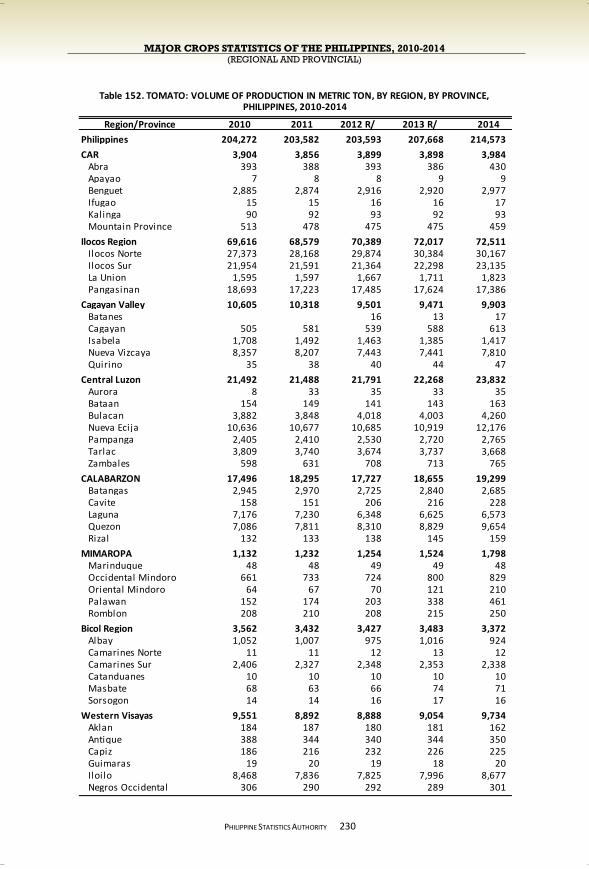
MAJOR CROPS STATISTICS OF THE PHILIPPINES, 2010-2014 (REGIONAL AND PROVINCIAL)
PHILIPPINE STATISTICS AUTHORITY
230
Region/Province 2010 2011 2012 R/ 2013 R/ 2014
Philippines 204,272 203,582 203,593 207,668 214,573
CAR 3,904 3,856 3,899 3,898 3,984 Abra 393 388 393 386 430 Apayao 7 8 8 9 9 Benguet 2,885 2,874 2,916 2,920 2,977 Ifugao 15 15 16 16 17 Kalinga 90 92 93 92 93 Mountain Province 513 478 475 475 459
Ilocos Region 69,616 68,579 70,389 72,017 72,511 Ilocos Norte 27,373 28,168 29,874 30,384 30,167 Ilocos Sur 21,954 21,591 21,364 22,298 23,135 La Union 1,595 1,597 1,667 1,711 1,823 Pangasinan 18,693 17,223 17,485 17,624 17,386
Cagayan Valley 10,605 10,318 9,501 9,471 9,903 Batanes 16 13 17 Cagayan 505 581 539 588 613 Isabela 1,708 1,492 1,463 1,385 1,417 Nueva Vizcaya 8,357 8,207 7,443 7,441 7,810 Quirino 35 38 40 44 47
Central Luzon 21,492 21,488 21,791 22,268 23,832 Aurora 8 33 35 33 35 Bataan 154 149 141 143 163 Bulacan 3,882 3,848 4,018 4,003 4,260 Nueva Ecija 10,636 10,677 10,685 10,919 12,176 Pampanga 2,405 2,410 2,530 2,720 2,765 Tarlac 3,809 3,740 3,674 3,737 3,668 Zambales 598 631 708 713 765
CALABARZON 17,496 18,295 17,727 18,655 19,299 Batangas 2,945 2,970 2,725 2,840 2,685 Cavite 158 151 206 216 228 Laguna 7,176 7,230 6,348 6,625 6,573 Quezon 7,086 7,811 8,310 8,829 9,654 Rizal 132 133 138 145 159
MIMAROPA 1,132 1,232 1,254 1,524 1,798 Marinduque 48 48 49 49 48 Occidental Mindoro 661 733 724 800 829 Oriental Mindoro 64 67 70 121 210 Palawan 152 174 203 338 461 Romblon 208 210 208 215 250
Bicol Region 3,562 3,432 3,427 3,483 3,372 Albay 1,052 1,007 975 1,016 924 Camarines Norte 11 11 12 13 12 Camarines Sur 2,406 2,327 2,348 2,353 2,338 Catanduanes 10 10 10 10 10 Masbate 68 63 66 74 71 Sorsogon 14 14 16 17 16
Western Visayas 9,551 8,892 8,888 9,054 9,734 Aklan 184 187 180 181 162 Antique 388 344 340 344 350 Capiz 186 216 232 226 225 Guimaras 19 20 19 18 20 Iloilo 8,468 7,836 7,825 7,996 8,677 Negros Occidental 306 290 292 289 301
PHILIPPINES, 2010-2014Table 152. TOMATO: VOLUME OF PRODUCTION IN METRIC TON, BY REGION, BY PROVINCE,
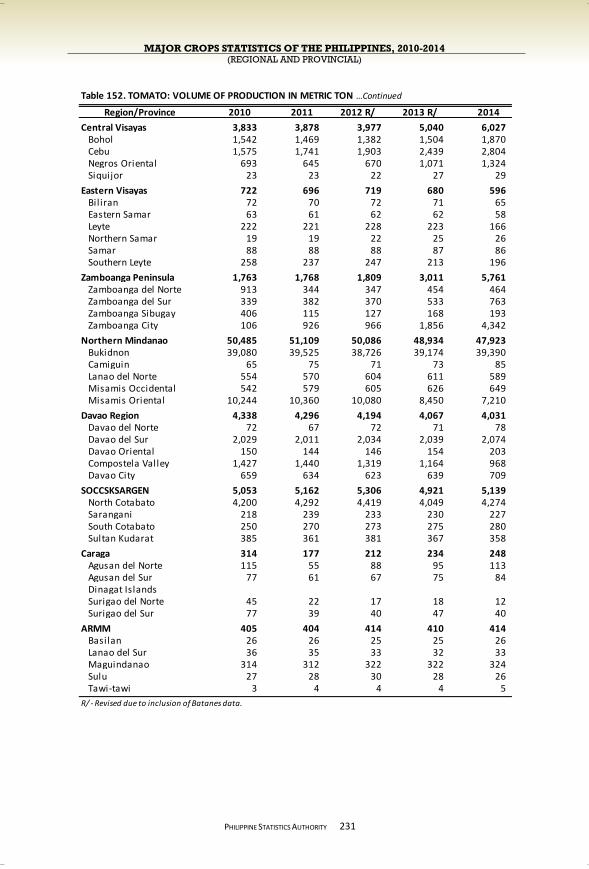
MAJOR CROPS STATISTICS OF THE PHILIPPINES, 2010-2014 (REGIONAL AND PROVINCIAL)
PHILIPPINE STATISTICS AUTHORITY
231
Region/Province 2010 2011 2012 R/ 2013 R/ 2014
Central Visayas 3,833 3,878 3,977 5,040 6,027 Bohol 1,542 1,469 1,382 1,504 1,870 Cebu 1,575 1,741 1,903 2,439 2,804 Negros Oriental 693 645 670 1,071 1,324 Siquijor 23 23 22 27 29
Eastern Visayas 722 696 719 680 596 Bil iran 72 70 72 71 65 Eastern Samar 63 61 62 62 58 Leyte 222 221 228 223 166 Northern Samar 19 19 22 25 26 Samar 88 88 88 87 86 Southern Leyte 258 237 247 213 196
Zamboanga Peninsula 1,763 1,768 1,809 3,011 5,761 Zamboanga del Norte 913 344 347 454 464 Zamboanga del Sur 339 382 370 533 763 Zamboanga Sibugay 406 115 127 168 193 Zamboanga City 106 926 966 1,856 4,342
Northern Mindanao 50,485 51,109 50,086 48,934 47,923 Bukidnon 39,080 39,525 38,726 39,174 39,390 Camiguin 65 75 71 73 85 Lanao del Norte 554 570 604 611 589 Misamis Occidental 542 579 605 626 649 Misamis Oriental 10,244 10,360 10,080 8,450 7,210
Davao Region 4,338 4,296 4,194 4,067 4,031 Davao del Norte 72 67 72 71 78 Davao del Sur 2,029 2,011 2,034 2,039 2,074 Davao Oriental 150 144 146 154 203 Compostela Valley 1,427 1,440 1,319 1,164 968 Davao City 659 634 623 639 709
SOCCSKSARGEN 5,053 5,162 5,306 4,921 5,139 North Cotabato 4,200 4,292 4,419 4,049 4,274 Sarangani 218 239 233 230 227 South Cotabato 250 270 273 275 280 Sultan Kudarat 385 361 381 367 358
Caraga 314 177 212 234 248 Agusan del Norte 115 55 88 95 113 Agusan del Sur 77 61 67 75 84 Dinagat Islands Surigao del Norte 45 22 17 18 12 Surigao del Sur 77 39 40 47 40
ARMM 405 404 414 410 414 Basilan 26 26 25 25 26 Lanao del Sur 36 35 33 32 33 Maguindanao 314 312 322 322 324 Sulu 27 28 30 28 26 Tawi-tawi 3 4 4 4 5
R/ - Revised due to inclusion of Batanes data.
Table 152. TOMATO: VOLUME OF PRODUCTION IN METRIC TON …Continued
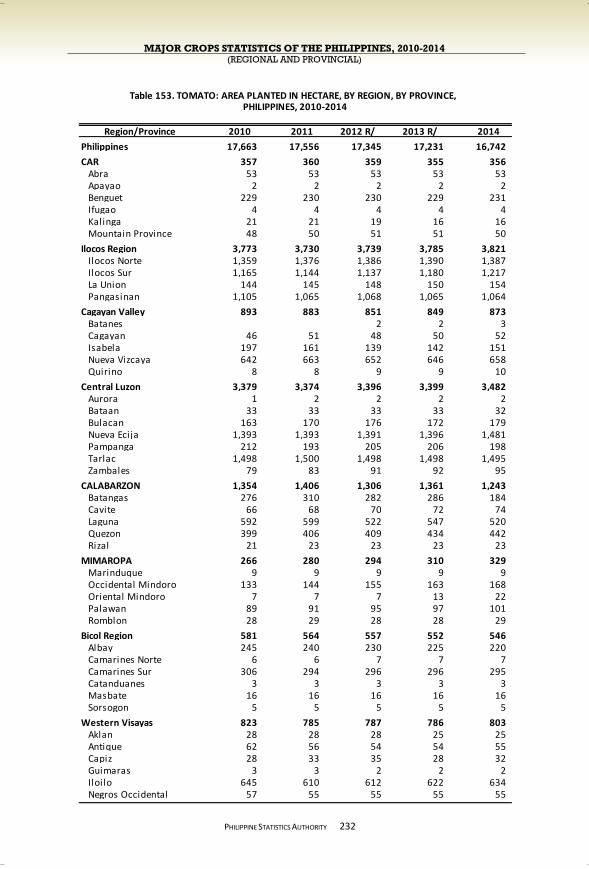
MAJOR CROPS STATISTICS OF THE PHILIPPINES, 2010-2014 (REGIONAL AND PROVINCIAL)
PHILIPPINE STATISTICS AUTHORITY
232
Region/Province 2010 2011 2012 R/ 2013 R/ 2014
Philippines 17,663 17,556 17,345 17,231 16,742
CAR 357 360 359 355 356 Abra 53 53 53 53 53 Apayao 2 2 2 2 2 Benguet 229 230 230 229 231 Ifugao 4 4 4 4 4 Kalinga 21 21 19 16 16 Mountain Province 48 50 51 51 50
Ilocos Region 3,773 3,730 3,739 3,785 3,821 Ilocos Norte 1,359 1,376 1,386 1,390 1,387 Ilocos Sur 1,165 1,144 1,137 1,180 1,217 La Union 144 145 148 150 154 Pangasinan 1,105 1,065 1,068 1,065 1,064
Cagayan Valley 893 883 851 849 873 Batanes 2 2 3 Cagayan 46 51 48 50 52 Isabela 197 161 139 142 151 Nueva Vizcaya 642 663 652 646 658 Quirino 8 8 9 9 10
Central Luzon 3,379 3,374 3,396 3,399 3,482 Aurora 1 2 2 2 2 Bataan 33 33 33 33 32 Bulacan 163 170 176 172 179 Nueva Ecija 1,393 1,393 1,391 1,396 1,481 Pampanga 212 193 205 206 198 Tarlac 1,498 1,500 1,498 1,498 1,495 Zambales 79 83 91 92 95
CALABARZON 1,354 1,406 1,306 1,361 1,243 Batangas 276 310 282 286 184 Cavite 66 68 70 72 74 Laguna 592 599 522 547 520 Quezon 399 406 409 434 442 Rizal 21 23 23 23 23
MIMAROPA 266 280 294 310 329 Marinduque 9 9 9 9 9 Occidental Mindoro 133 144 155 163 168 Oriental Mindoro 7 7 7 13 22 Palawan 89 91 95 97 101 Romblon 28 29 28 28 29
Bicol Region 581 564 557 552 546 Albay 245 240 230 225 220 Camarines Norte 6 6 7 7 7 Camarines Sur 306 294 296 296 295 Catanduanes 3 3 3 3 3 Masbate 16 16 16 16 16 Sorsogon 5 5 5 5 5
Western Visayas 823 785 787 786 803 Aklan 28 28 28 25 25 Antique 62 56 54 54 55 Capiz 28 33 35 28 32 Guimaras 3 3 2 2 2 Iloilo 645 610 612 622 634 Negros Occidental 57 55 55 55 55
PHILIPPINES, 2010-2014Table 153. TOMATO: AREA PLANTED IN HECTARE, BY REGION, BY PROVINCE,
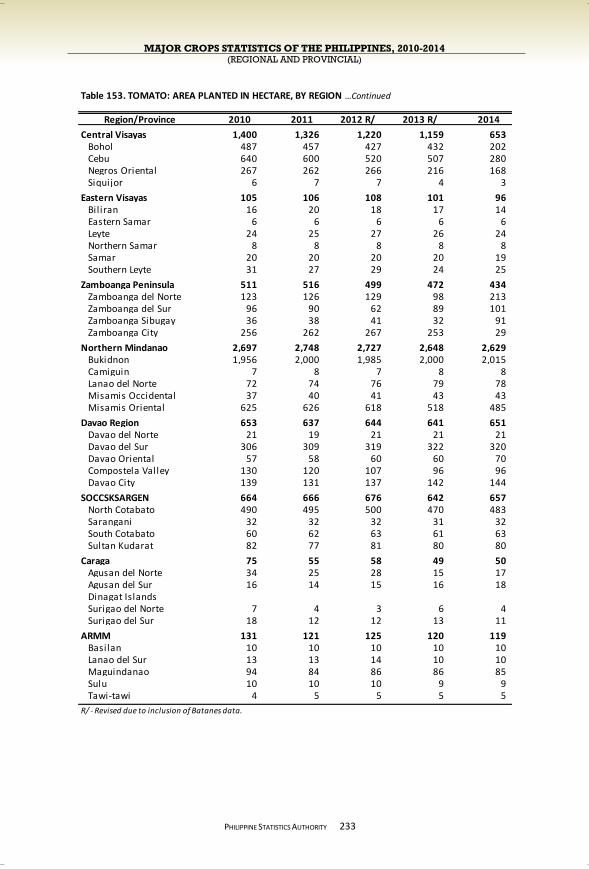
MAJOR CROPS STATISTICS OF THE PHILIPPINES, 2010-2014 (REGIONAL AND PROVINCIAL)
PHILIPPINE STATISTICS AUTHORITY
233
Region/Province 2010 2011 2012 R/ 2013 R/ 2014
Central Visayas 1,400 1,326 1,220 1,159 653 Bohol 487 457 427 432 202 Cebu 640 600 520 507 280 Negros Oriental 267 262 266 216 168 Siquijor 6 7 7 4 3
Eastern Visayas 105 106 108 101 96 Bil iran 16 20 18 17 14 Eastern Samar 6 6 6 6 6 Leyte 24 25 27 26 24 Northern Samar 8 8 8 8 8 Samar 20 20 20 20 19 Southern Leyte 31 27 29 24 25
Zamboanga Peninsula 511 516 499 472 434 Zamboanga del Norte 123 126 129 98 213 Zamboanga del Sur 96 90 62 89 101 Zamboanga Sibugay 36 38 41 32 91 Zamboanga City 256 262 267 253 29
Northern Mindanao 2,697 2,748 2,727 2,648 2,629 Bukidnon 1,956 2,000 1,985 2,000 2,015 Camiguin 7 8 7 8 8 Lanao del Norte 72 74 76 79 78 Misamis Occidental 37 40 41 43 43 Misamis Oriental 625 626 618 518 485
Davao Region 653 637 644 641 651 Davao del Norte 21 19 21 21 21 Davao del Sur 306 309 319 322 320 Davao Oriental 57 58 60 60 70 Compostela Valley 130 120 107 96 96 Davao City 139 131 137 142 144
SOCCSKSARGEN 664 666 676 642 657 North Cotabato 490 495 500 470 483 Sarangani 32 32 32 31 32 South Cotabato 60 62 63 61 63 Sultan Kudarat 82 77 81 80 80
Caraga 75 55 58 49 50 Agusan del Norte 34 25 28 15 17 Agusan del Sur 16 14 15 16 18 Dinagat Islands Surigao del Norte 7 4 3 6 4 Surigao del Sur 18 12 12 13 11
ARMM 131 121 125 120 119 Basilan 10 10 10 10 10 Lanao del Sur 13 13 14 10 10 Maguindanao 94 84 86 86 85 Sulu 10 10 10 9 9 Tawi-tawi 4 5 5 5 5
R/ - Revised due to inclusion of Batanes data.
Table 153. TOMATO: AREA PLANTED IN HECTARE, BY REGION …Continued
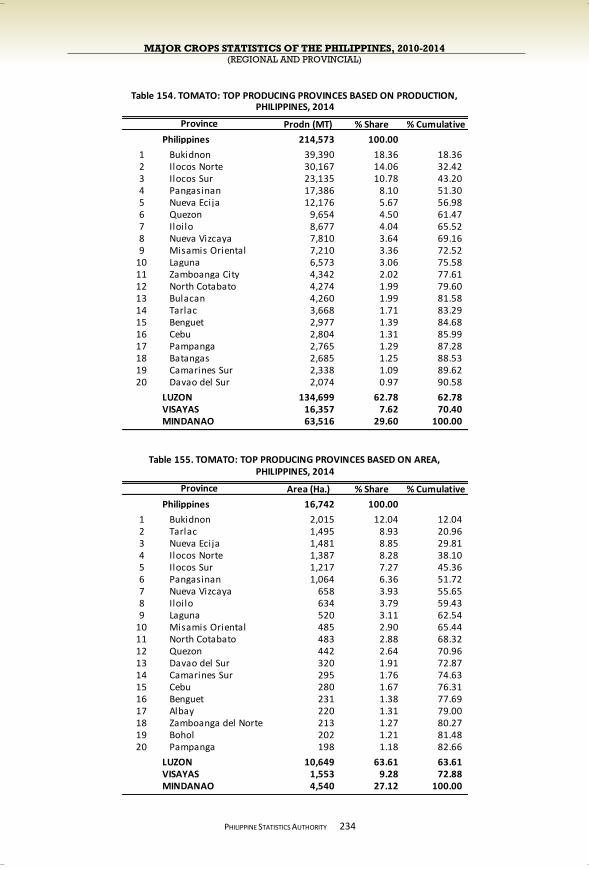
MAJOR CROPS STATISTICS OF THE PHILIPPINES, 2010-2014 (REGIONAL AND PROVINCIAL)
PHILIPPINE STATISTICS AUTHORITY
234
Prodn (MT) % Share % Cumulative
Philippines 214,573 100.00
1 Bukidnon 39,390 18.36 18.36 2 Ilocos Norte 30,167 14.06 32.42 3 Ilocos Sur 23,135 10.78 43.20 4 Pangasinan 17,386 8.10 51.30 5 Nueva Ecija 12,176 5.67 56.98 6 Quezon 9,654 4.50 61.47 7 Iloilo 8,677 4.04 65.52 8 Nueva Vizcaya 7,810 3.64 69.16 9 Misamis Oriental 7,210 3.36 72.52
10 Laguna 6,573 3.06 75.58 11 Zamboanga City 4,342 2.02 77.61 12 North Cotabato 4,274 1.99 79.60 13 Bulacan 4,260 1.99 81.58 14 Tarlac 3,668 1.71 83.29 15 Benguet 2,977 1.39 84.68 16 Cebu 2,804 1.31 85.99 17 Pampanga 2,765 1.29 87.28 18 Batangas 2,685 1.25 88.53 19 Camarines Sur 2,338 1.09 89.62 20 Davao del Sur 2,074 0.97 90.58
LUZON 134,699 62.78 62.78 VISAYAS 16,357 7.62 70.40 MINDANAO 63,516 29.60 100.00
Area (Ha.) % Share % Cumulative
Philippines 16,742 100.00
1 Bukidnon 2,015 12.04 12.04 2 Tarlac 1,495 8.93 20.96 3 Nueva Ecija 1,481 8.85 29.81 4 Ilocos Norte 1,387 8.28 38.10 5 Ilocos Sur 1,217 7.27 45.36 6 Pangasinan 1,064 6.36 51.72 7 Nueva Vizcaya 658 3.93 55.65 8 Iloilo 634 3.79 59.43 9 Laguna 520 3.11 62.54
10 Misamis Oriental 485 2.90 65.44 11 North Cotabato 483 2.88 68.32 12 Quezon 442 2.64 70.96 13 Davao del Sur 320 1.91 72.87 14 Camarines Sur 295 1.76 74.63 15 Cebu 280 1.67 76.31 16 Benguet 231 1.38 77.69 17 Albay 220 1.31 79.00 18 Zamboanga del Norte 213 1.27 80.27 19 Bohol 202 1.21 81.48 20 Pampanga 198 1.18 82.66
LUZON 10,649 63.61 63.61 VISAYAS 1,553 9.28 72.88 MINDANAO 4,540 27.12 100.00
Province
Table 154. TOMATO: TOP PRODUCING PROVINCES BASED ON PRODUCTION,
Table 155. TOMATO: TOP PRODUCING PROVINCES BASED ON AREA,
Province
PHILIPPINES, 2014
PHILIPPINES, 2014
MAJOR CROPS STATISTICS OF THE PHILIPPINES, 2010-2014 (REGIONAL AND PROVINCIAL)
PHILIPPINE STATISTICS AUTHORITY

MAJOR CROPS STATISTICS OF THE PHILIPPINES, 2010-2014 (REGIONAL AND PROVINCIAL)
PHILIPPINE STATISTICS AUTHORITY
Republic of the Philippines PHILIPPINE STATISTICS AUTHORITY 16th Floor. ETON Cyberpod Centris 3
EDSA. Corner Quezon Avenue, Quezon City
www.psa.gov.ph