making numbers meaningful: goal-directed communication
TRANSCRIPT

Making Numbers Meaningful: Goal-directed communication with numbers
Jessica S Ancker, MPH, PhD
Weill Cornell Medical College
Brian J Zikmund-Fisher, PhD
University of Michigan
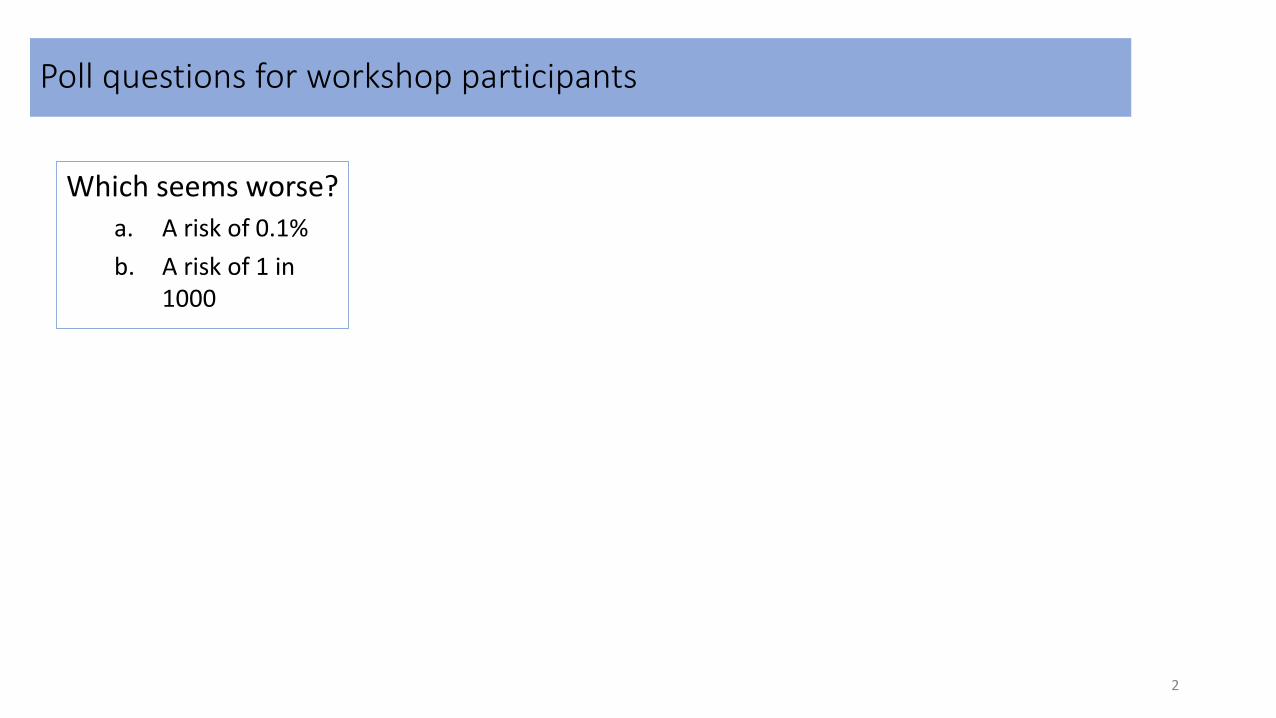
Poll questions for workshop participants
Which seems worse?
a. A risk of 0.1%
b. A risk of 1 in 1000
2
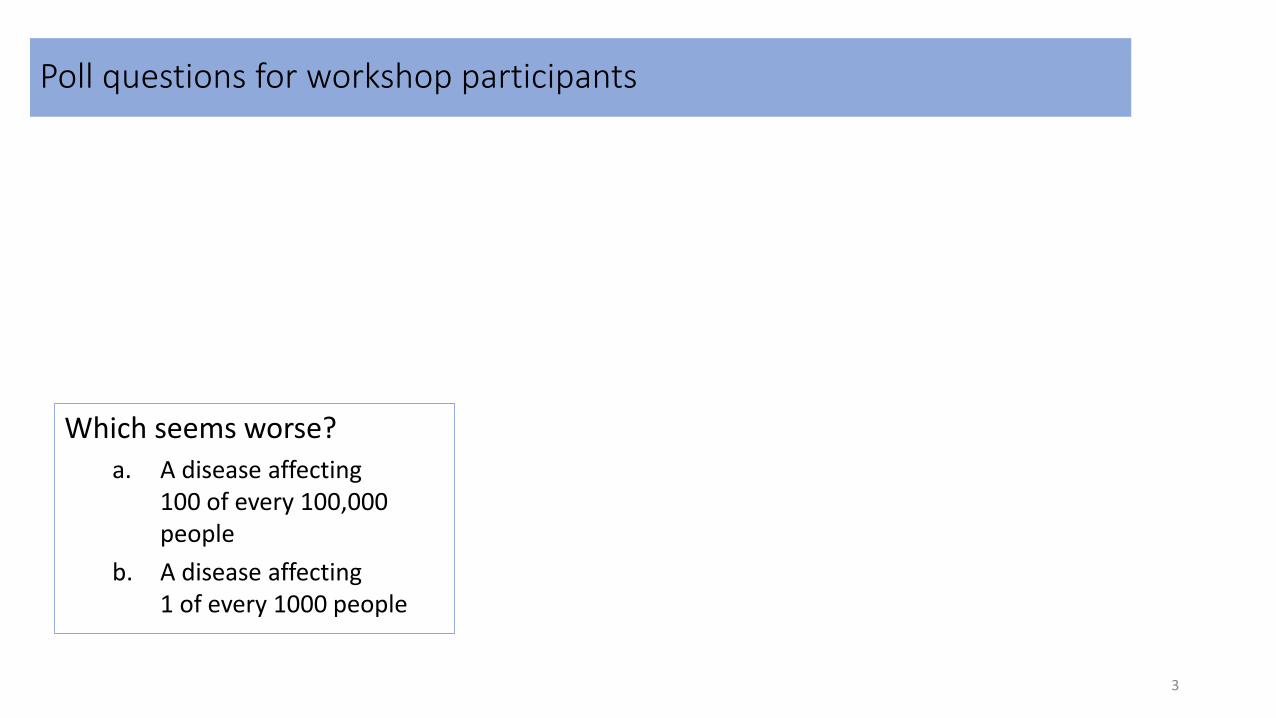
Poll questions for workshop participants
Which seems worse?
a. A disease affecting 100 of every 100,000 people
b. A disease affecting 1 of every 1000 people
3
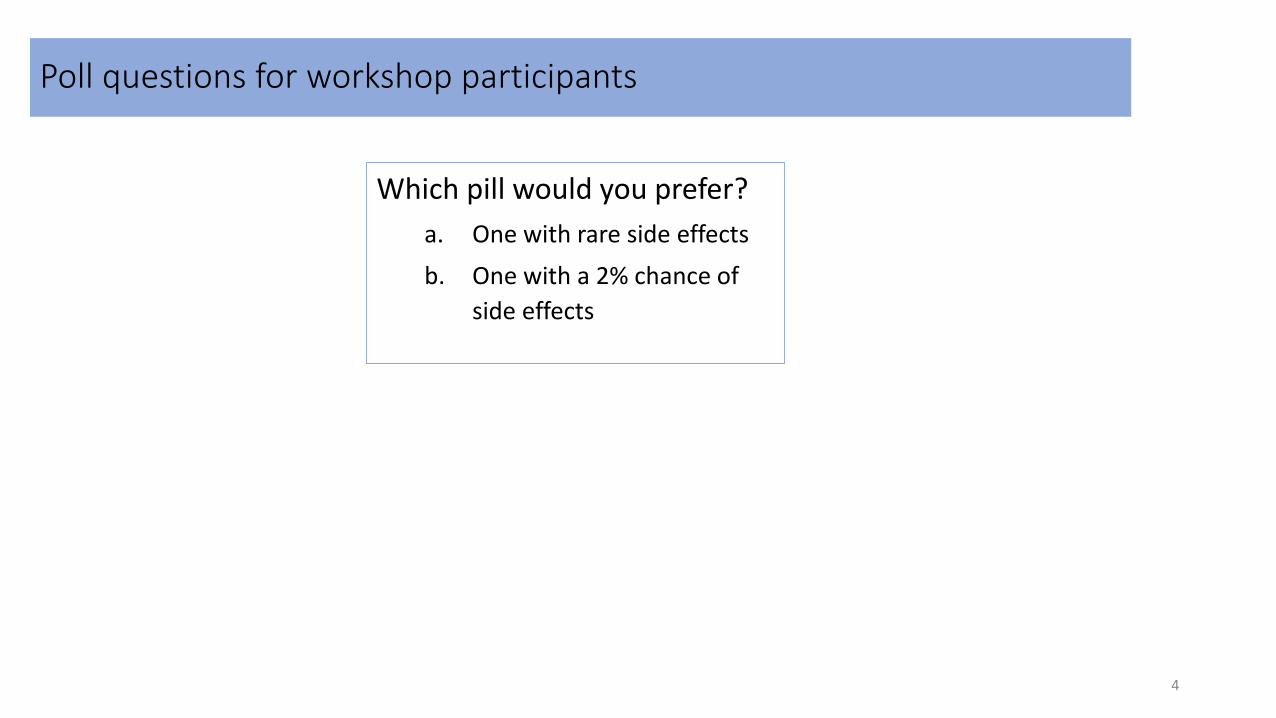
Poll questions for workshop participants
Which pill would you prefer?
a. One with rare side effects
b. One with a 2% chance of
side effects
4
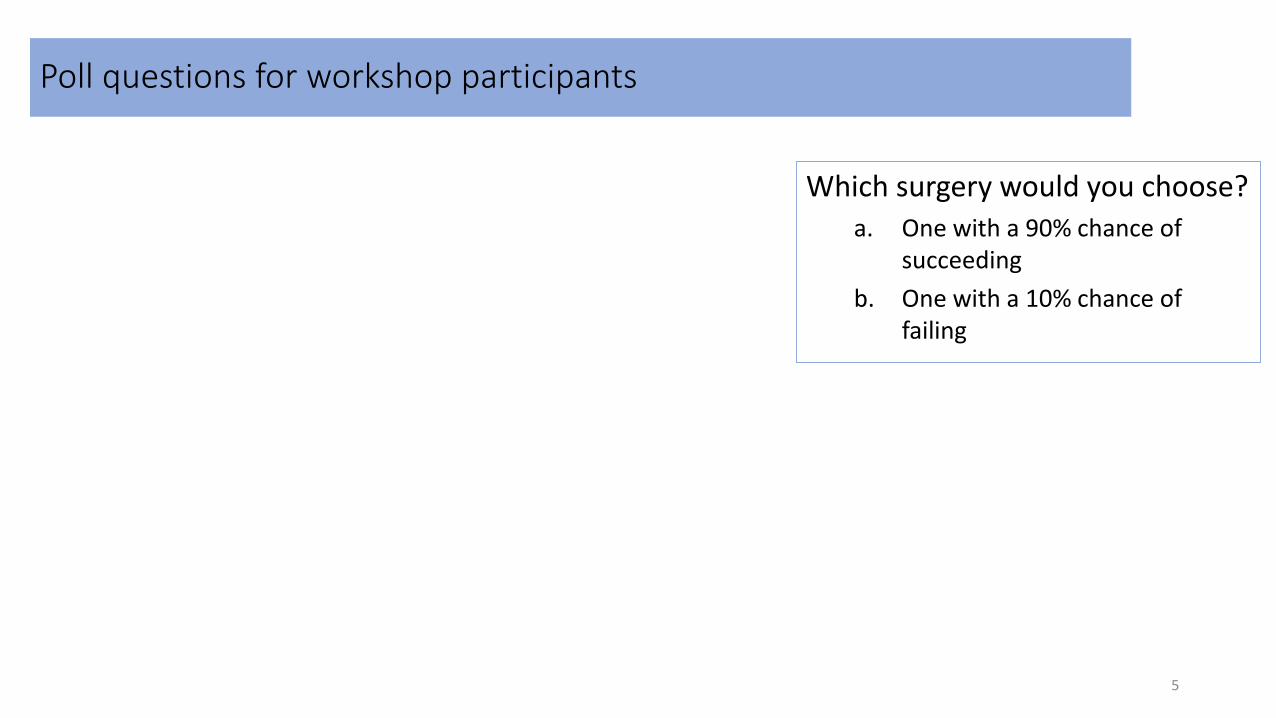
Poll questions for workshop participants
Which surgery would you choose?
a. One with a 90% chance of succeeding
b. One with a 10% chance of failing
5
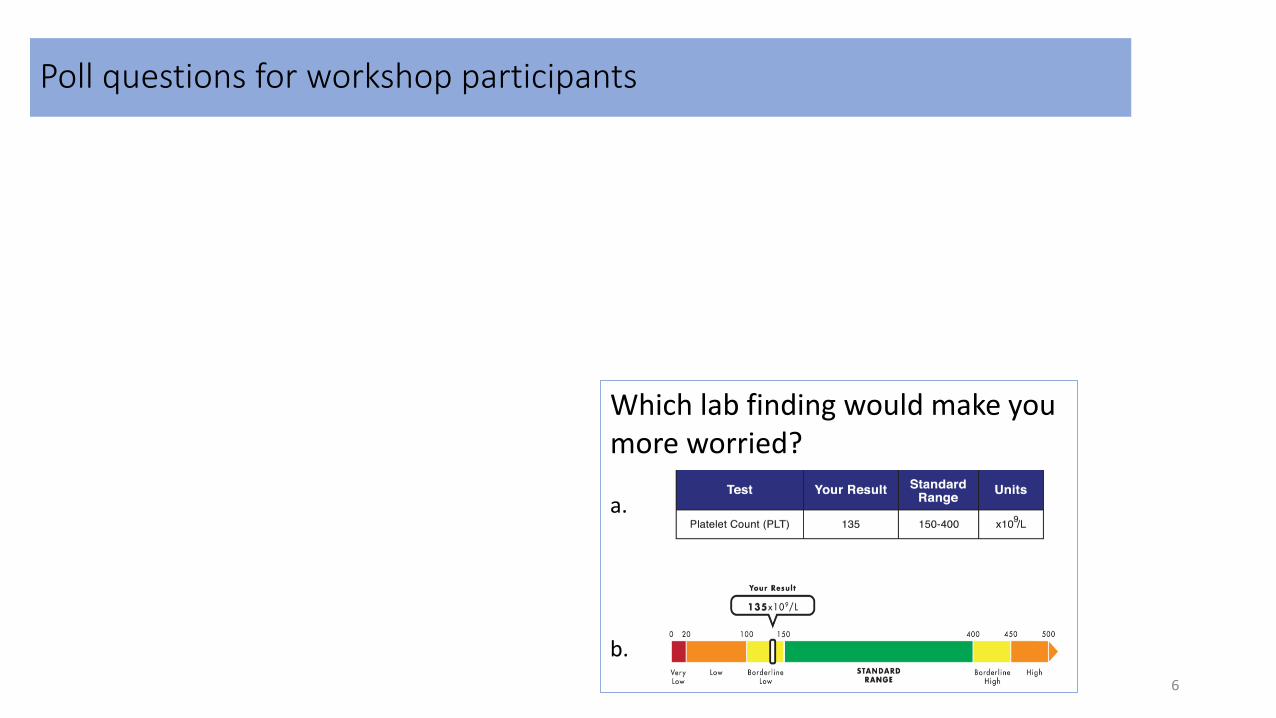
Poll questions for workshop participants
Which lab finding would make you more worried?
a.
b.
6

Poll questions for workshop participants
Which seems worse?
a. A risk of 0.1%
b. A risk of 1 in 1000
Which surgery would you choose?
a. One with a 90% chance of succeeding
b. One with a 10% chance of failing
Which lab finding would make you more worried?
a.
b.
Which pill would you prefer?
a. One with rare side effects
b. One with a 2% chance of
side effects
Which seems worse?
a. A disease affecting 100 of every 100,000 people
b. A disease affecting 1 of every 1000 people
7
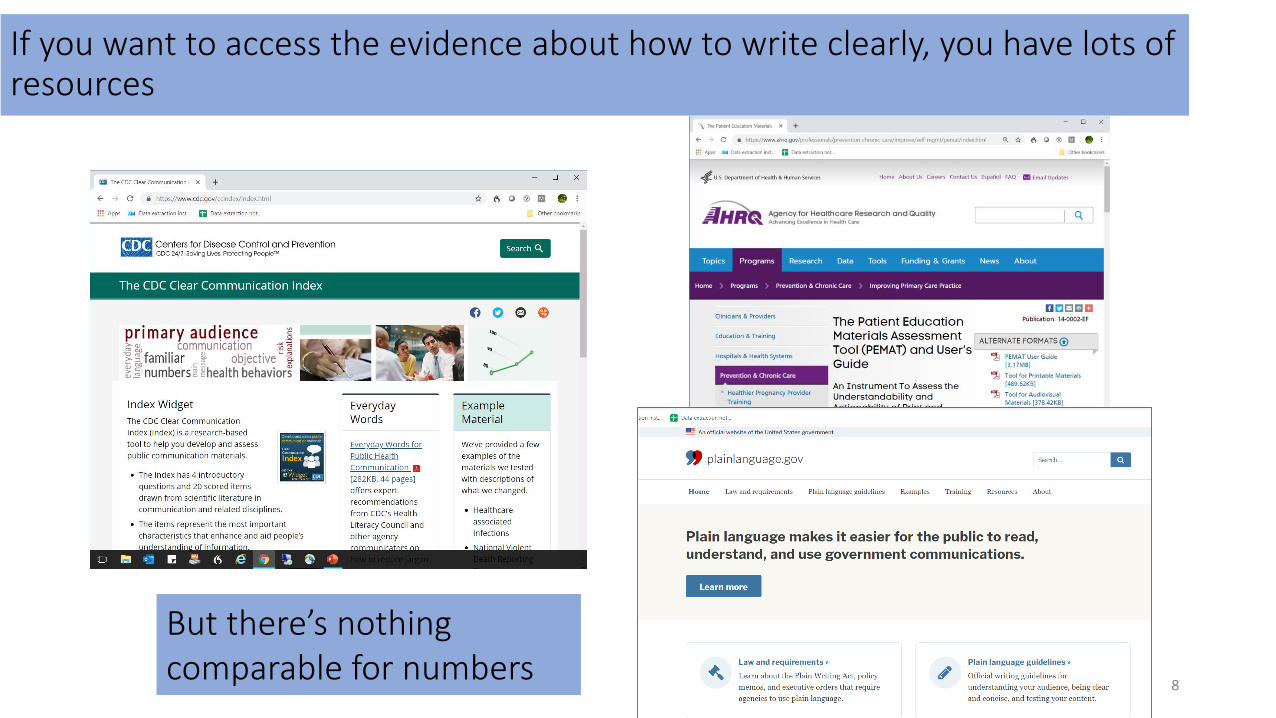
If you want to access the evidence about how to write clearly, you have lots of resources
8
But there’s nothing comparable for numbers
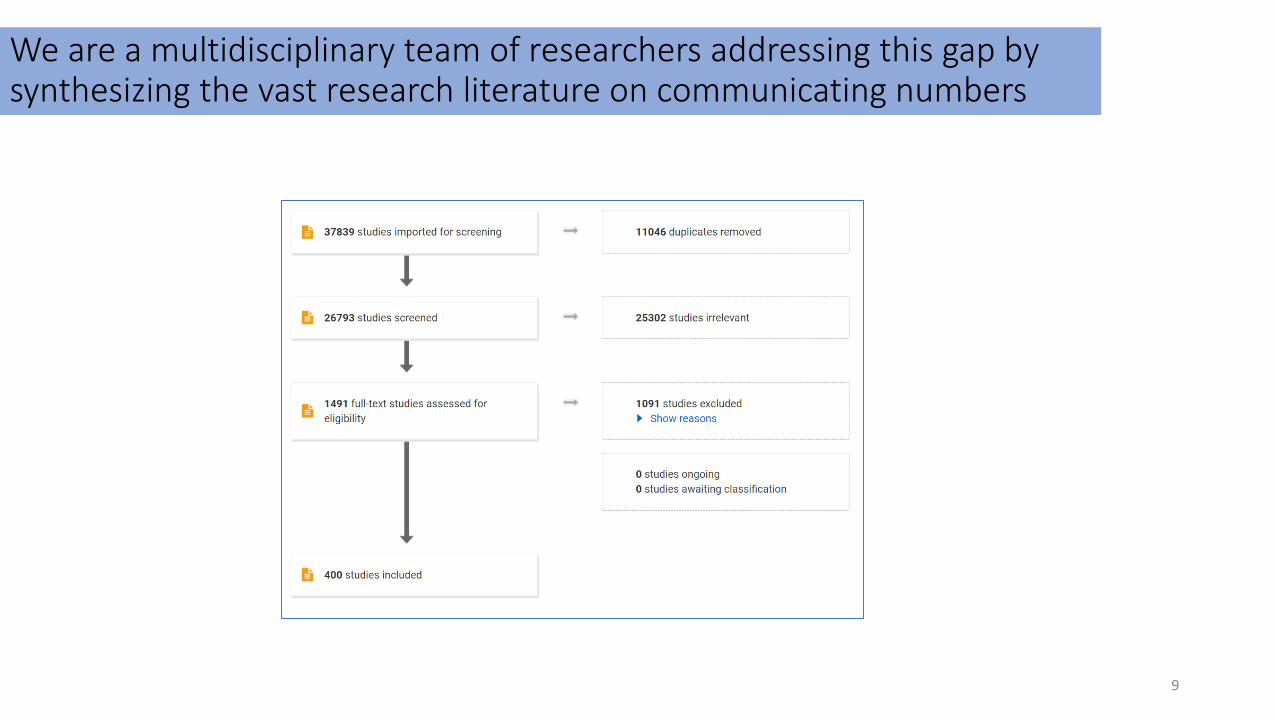
We are a multidisciplinary team of researchers addressing this gap by synthesizing the vast research literature on communicating numbers
9
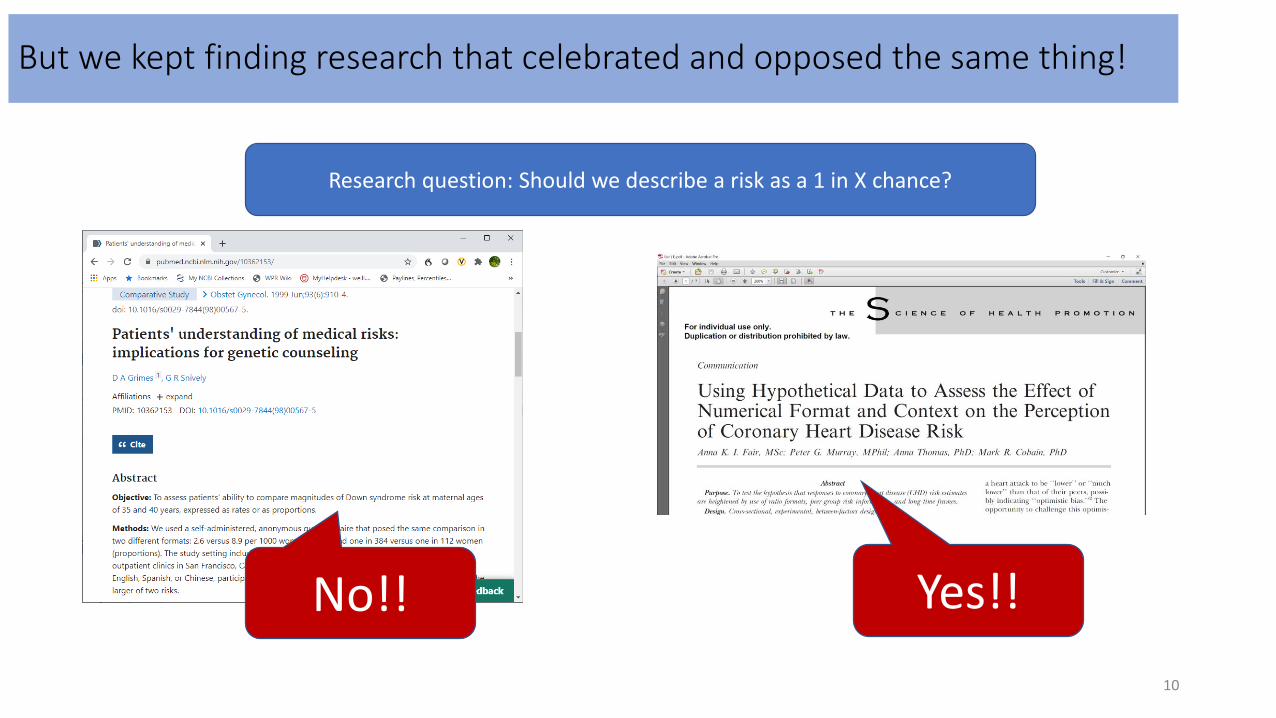
But we kept finding research that celebrated and opposed the same thing!
10
No!! Yes!!
Research question: Should we describe a risk as a 1 in X chance?
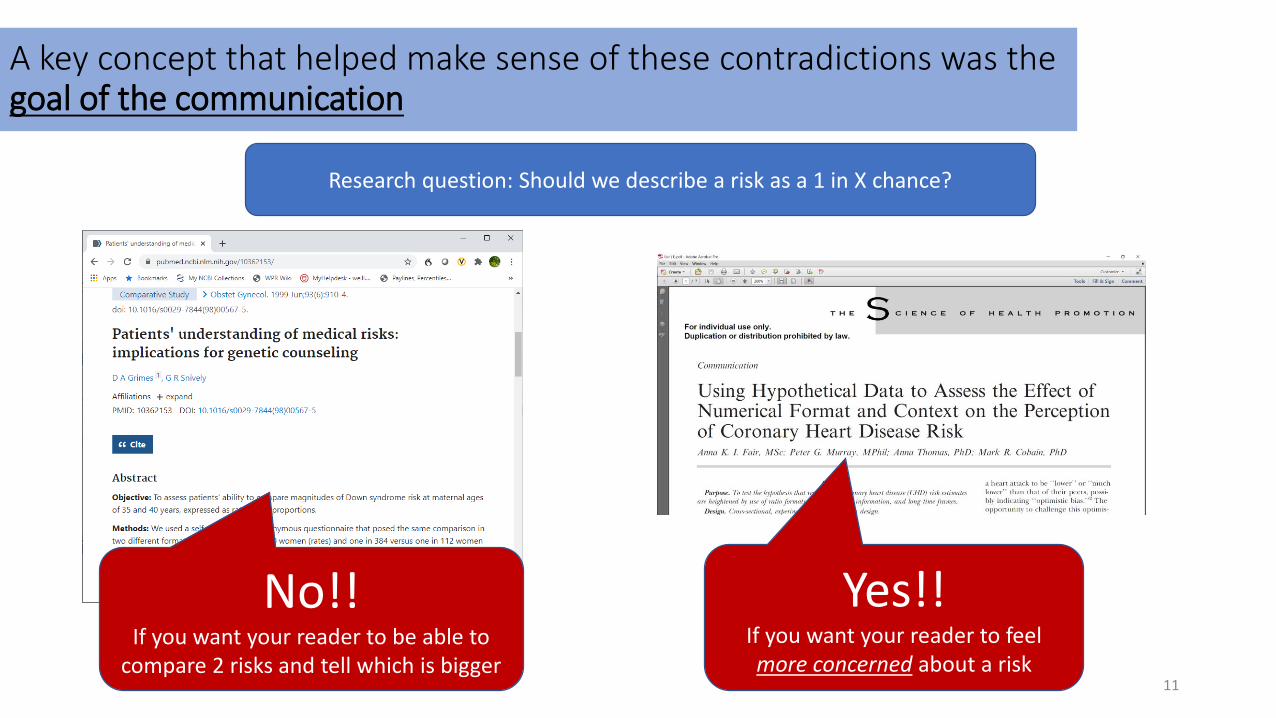
A key concept that helped make sense of these contradictions was the goal of the communication
11
Research question: Should we describe a risk as a 1 in X chance?
No!!If you want your reader to be able to
compare 2 risks and tell which is bigger
Yes!!If you want your reader to feel more concerned about a risk
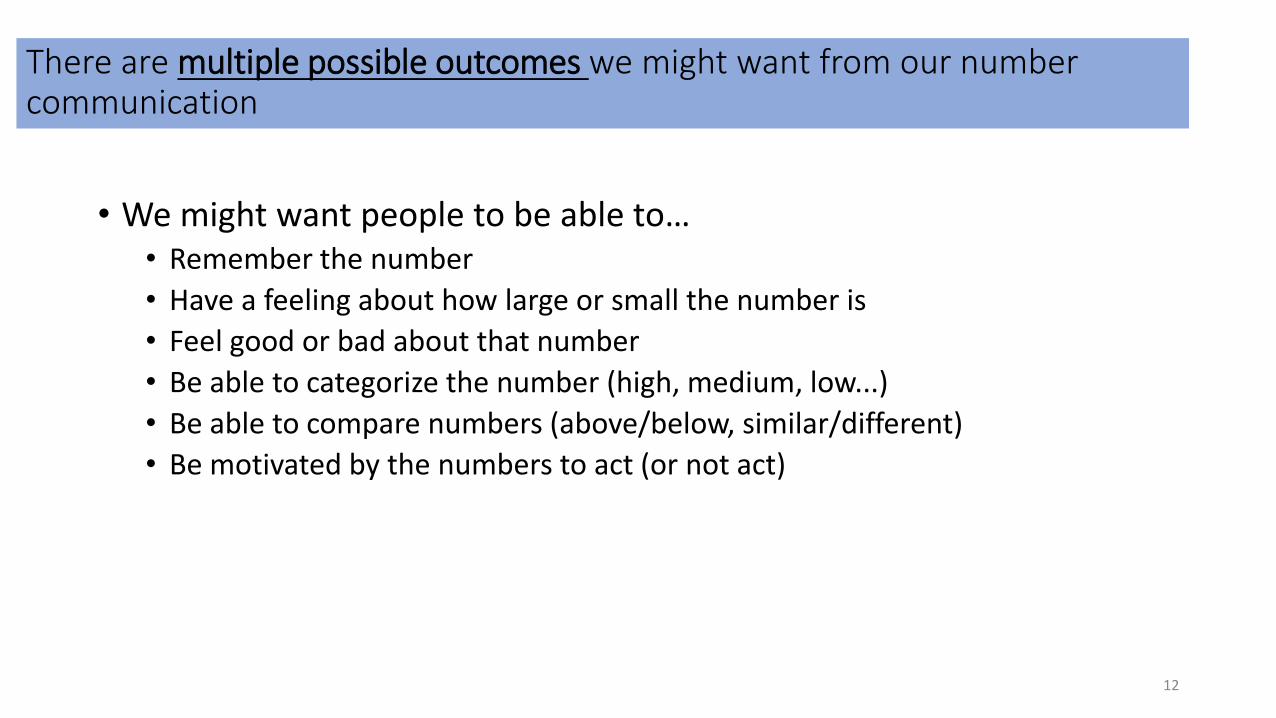
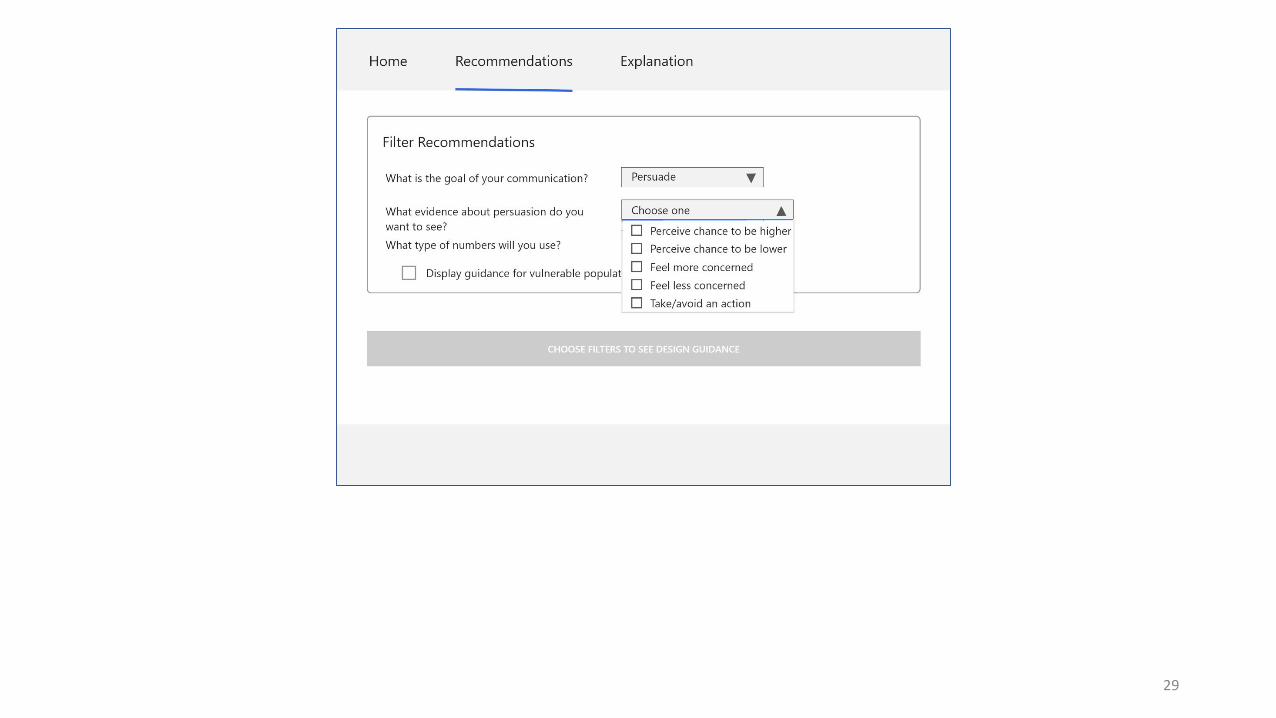
There are multiple possible outcomes we might want from our number communication
12
• We might want people to be able to…• Remember the number
• Have a feeling about how large or small the number is
• Feel good or bad about that number
• Be able to categorize the number (high, medium, low...)
• Be able to compare numbers (above/below, similar/different)
• Be motivated by the numbers to act (or not act)
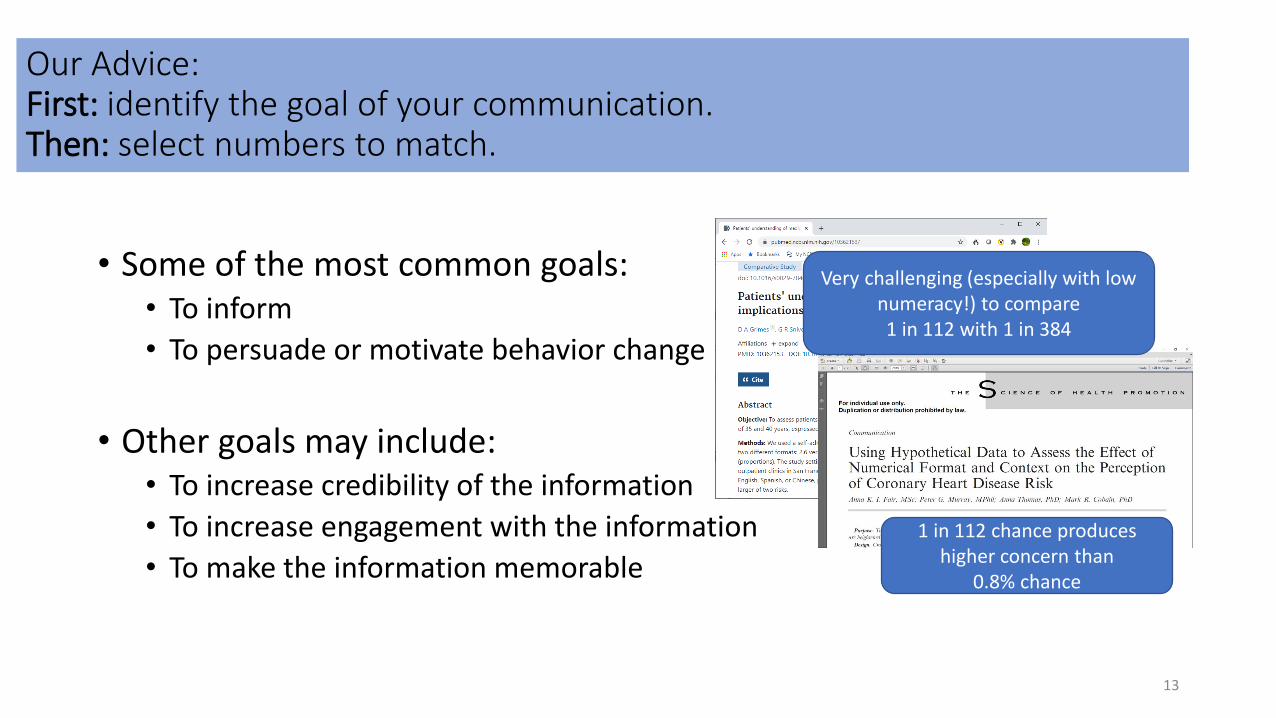
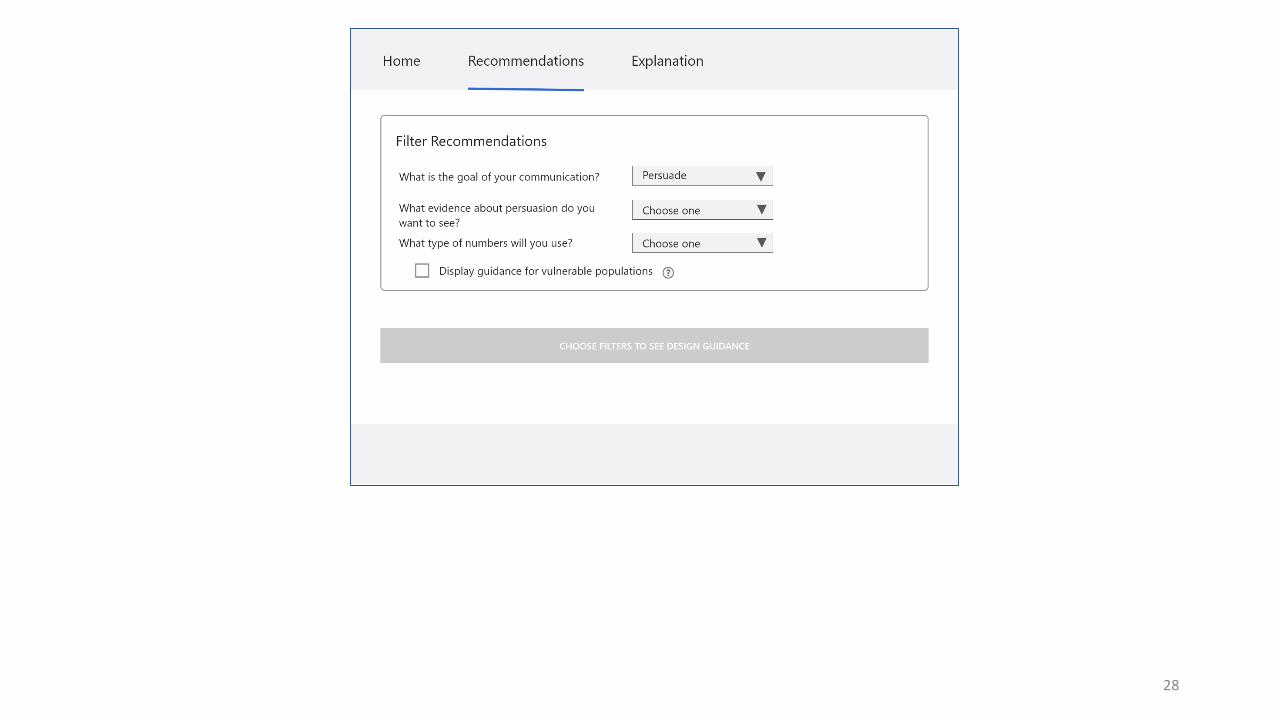
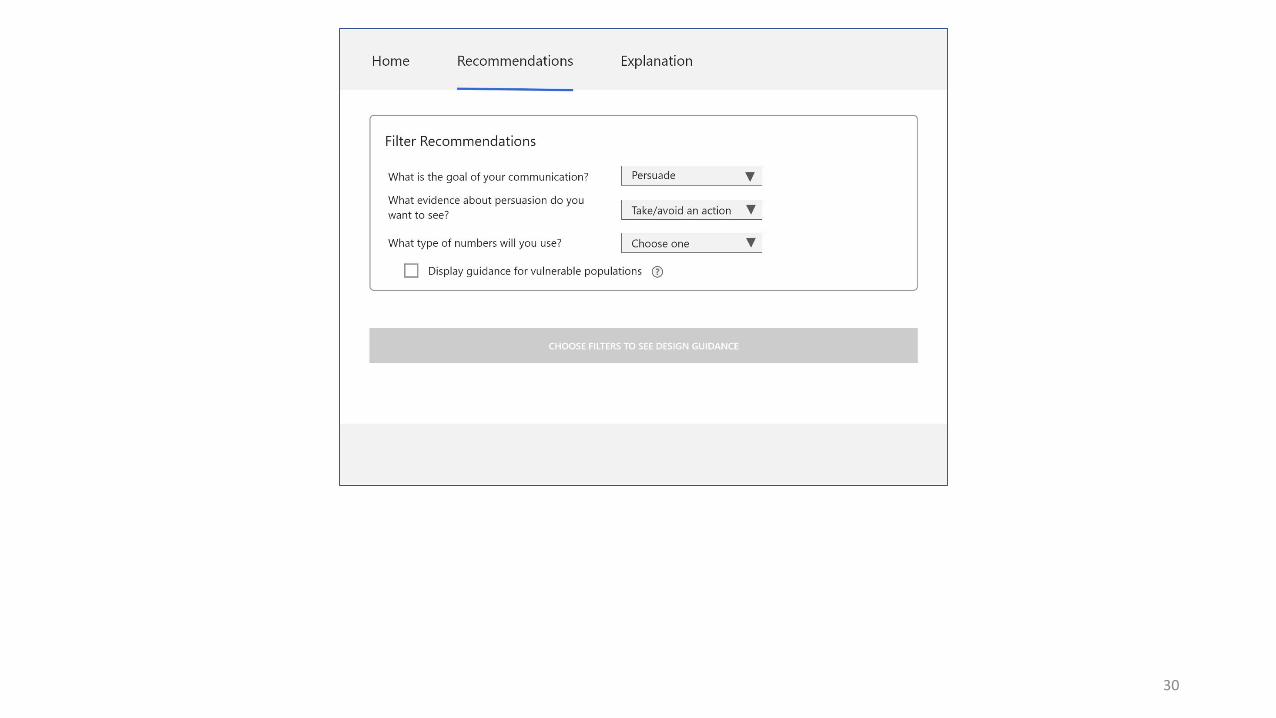
Our Advice: First: identify the goal of your communication. Then: select numbers to match.
13
• Some of the most common goals:• To inform
• To persuade or motivate behavior change
• Other goals may include:• To increase credibility of the information
• To increase engagement with the information
• To make the information memorable
Very challenging (especially with low numeracy!) to compare 1 in 112 with 1 in 384
1 in 112 chance produces higher concern than
0.8% chance
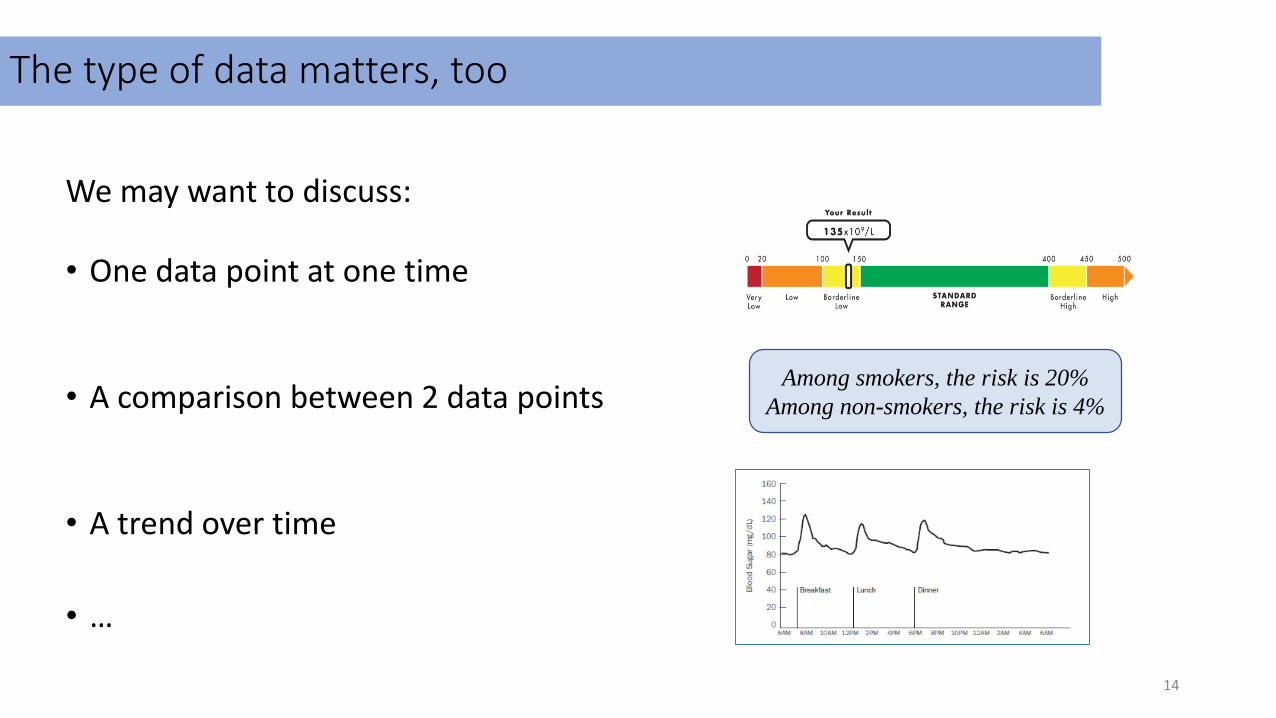
The type of data matters, too
We may want to discuss:
• One data point at one time
• A comparison between 2 data points
• A trend over time
• …
14
Among smokers, the risk is 20%
Among non-smokers, the risk is 4%
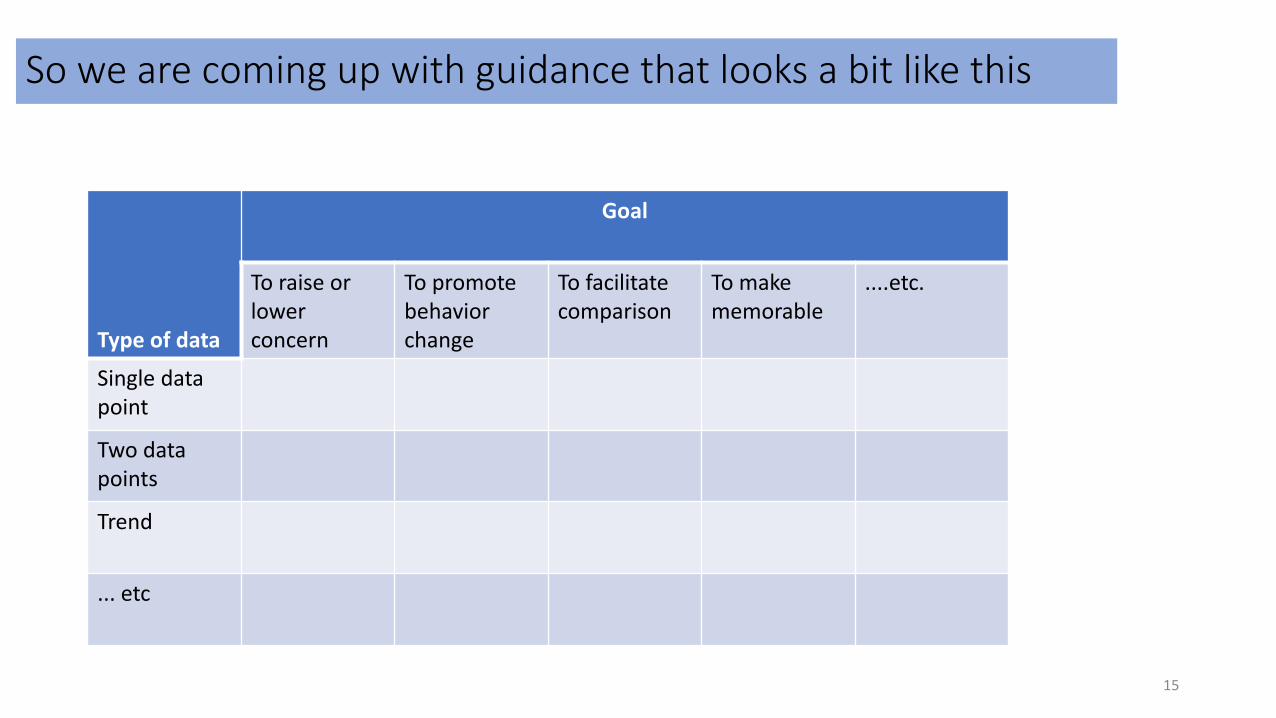
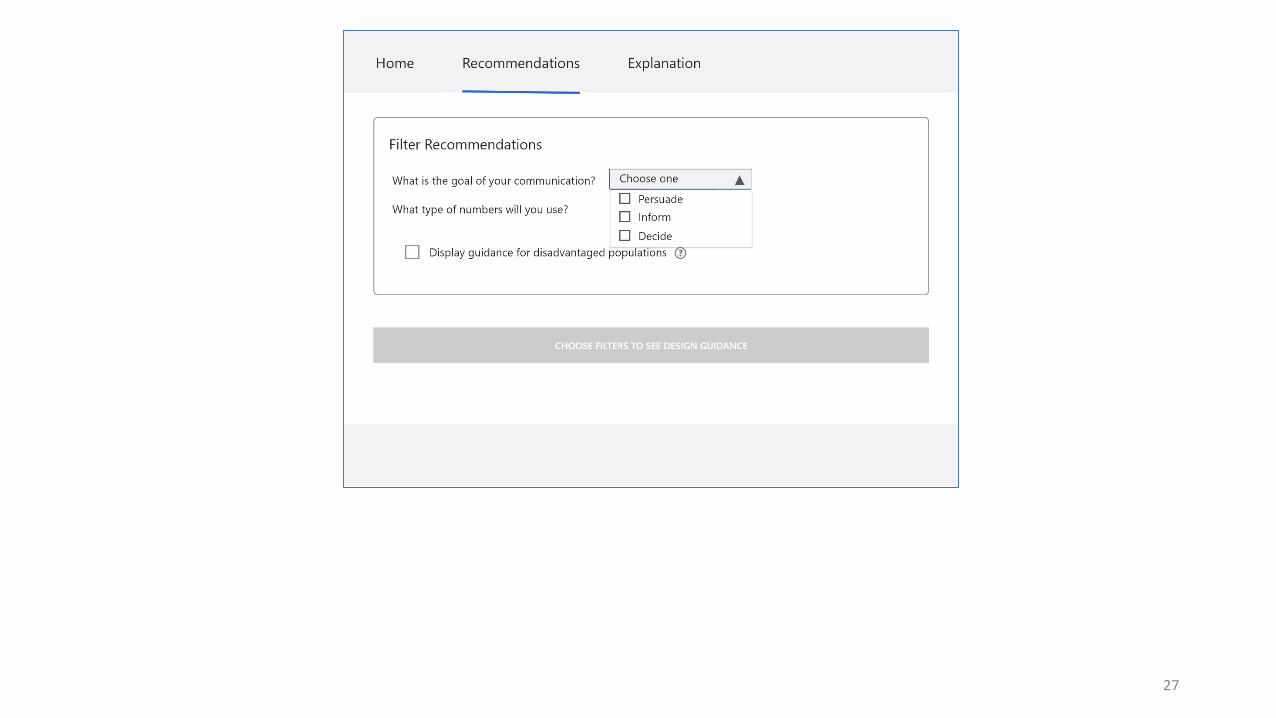
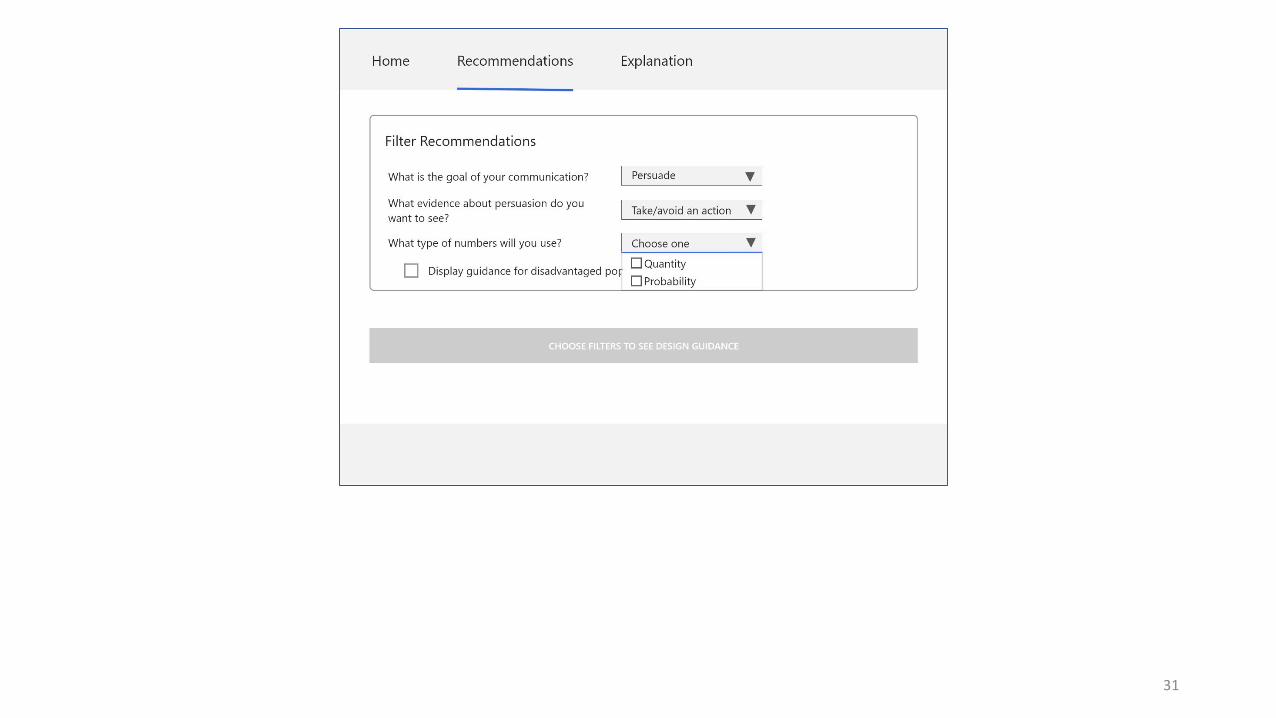
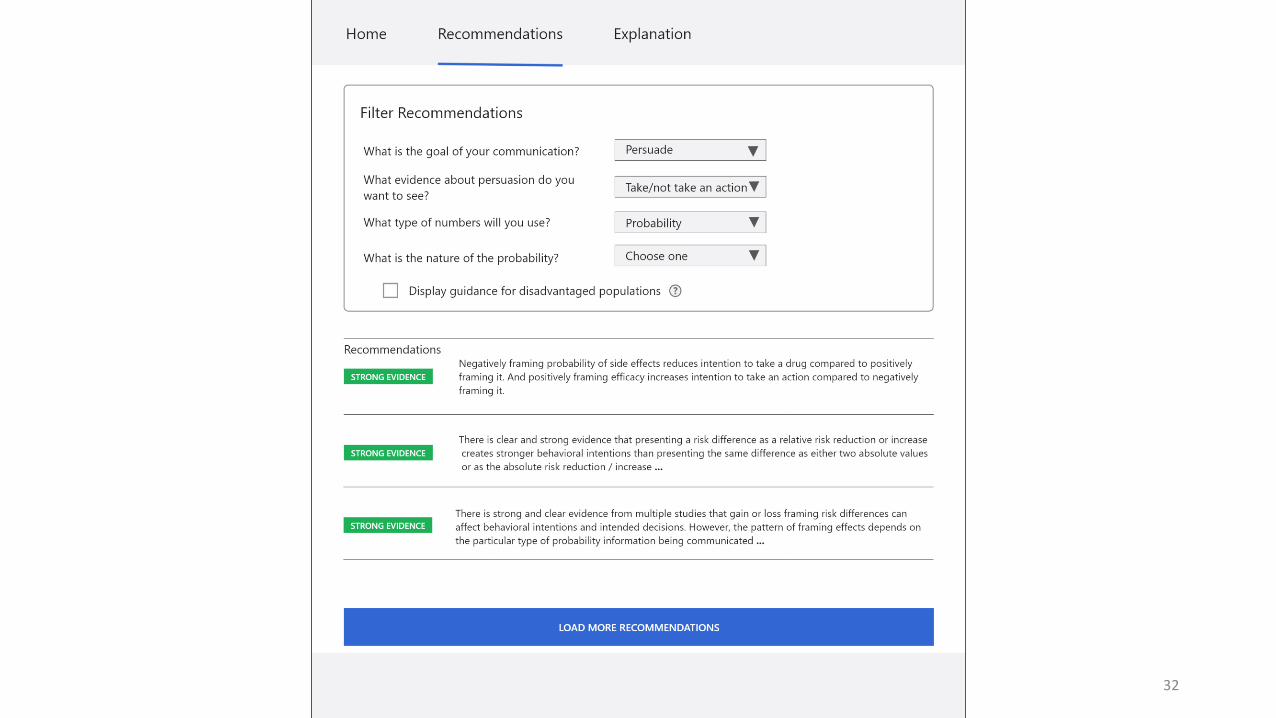
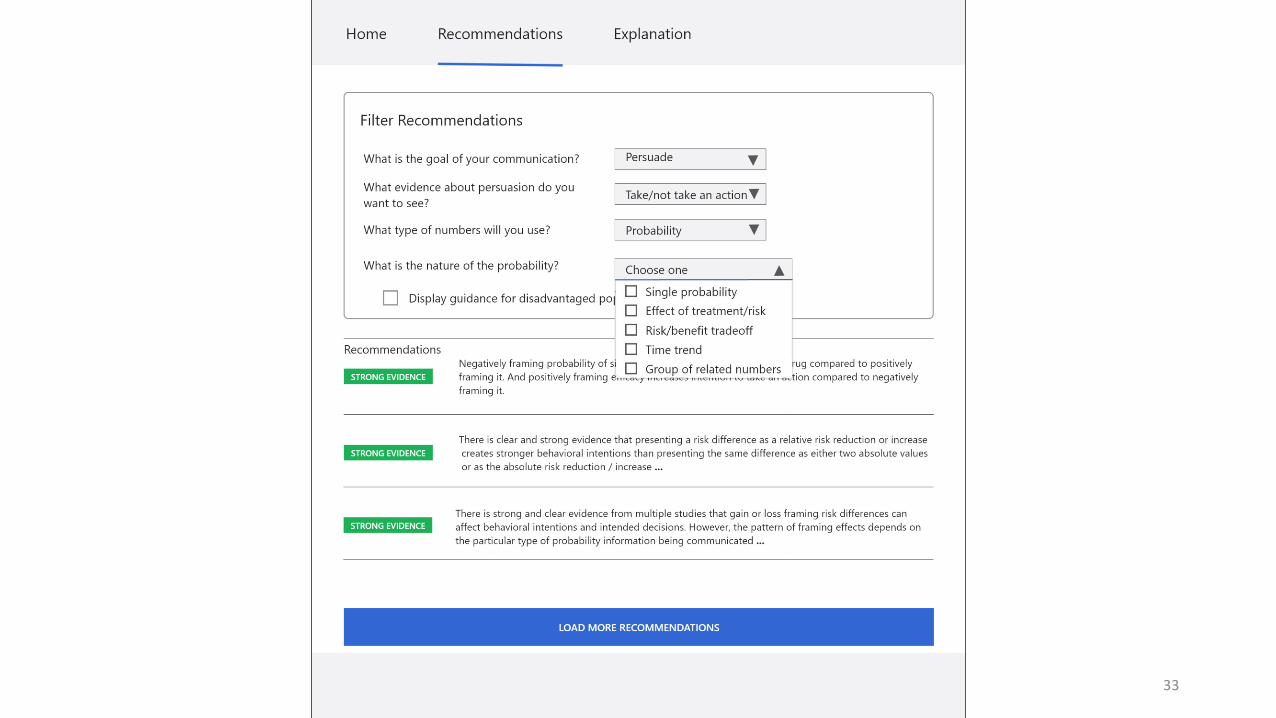
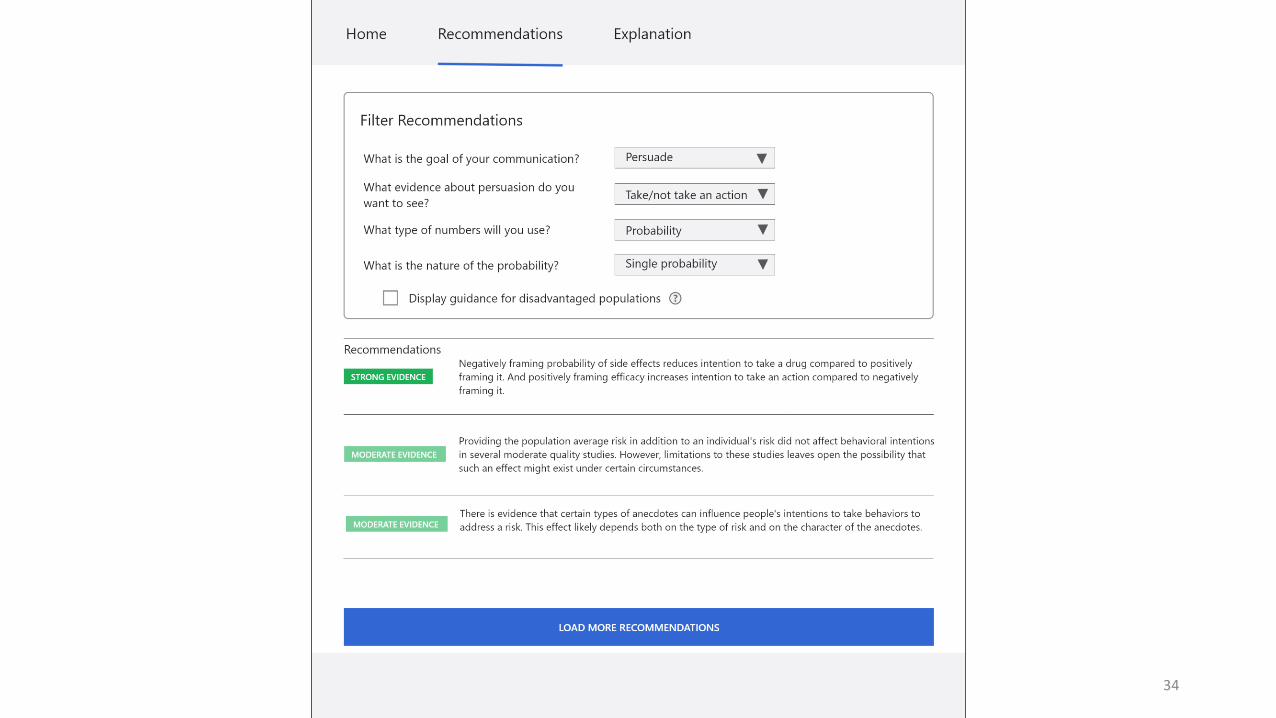
So we are coming up with guidance that looks a bit like this
Type of data
Goal
To raise or lower concern
To promote behavior change
To facilitate comparison
To make memorable
....etc.
Single data point
Two data points
Trend
... etc
15
Some examples based on your earlier answers
16
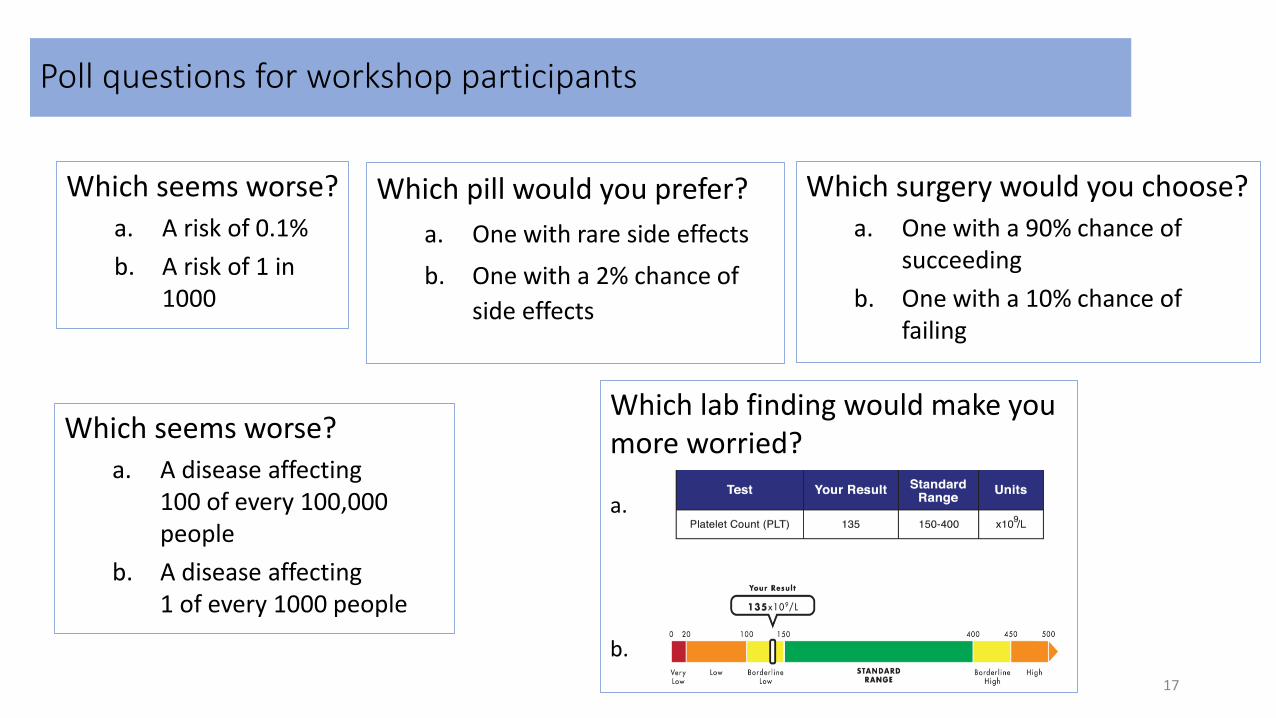
Poll questions for workshop participants
Which seems worse?
a. A risk of 0.1%
b. A risk of 1 in 1000
Which surgery would you choose?
a. One with a 90% chance of succeeding
b. One with a 10% chance of failing
Which lab finding would make you more worried?
a.
b.
Which pill would you prefer?
a. One with rare side effects
b. One with a 2% chance of
side effects
Which seems worse?
a. A disease affecting 100 of every 100,000 people
b. A disease affecting 1 of every 1000 people
17
Poll questions for workshop participants
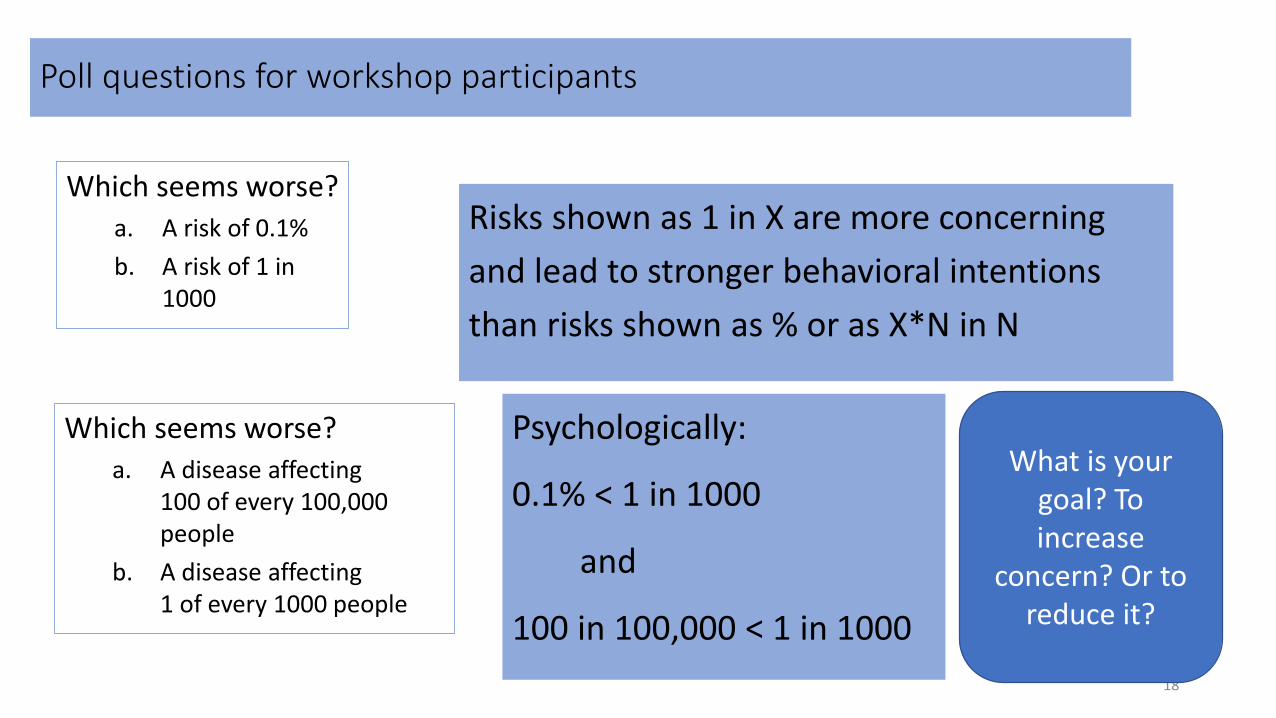
Which seems worse?
a. A risk of 0.1%
b. A risk of 1 in 1000
Which seems worse?
a. A disease affecting 100 of every 100,000 people
b. A disease affecting 1 of every 1000 people
18
Risks shown as 1 in X are more concerning
and lead to stronger behavioral intentions
than risks shown as % or as X*N in N
Psychologically:
0.1% < 1 in 1000
and
100 in 100,000 < 1 in 1000
What is your goal? To increase
concern? Or to reduce it?
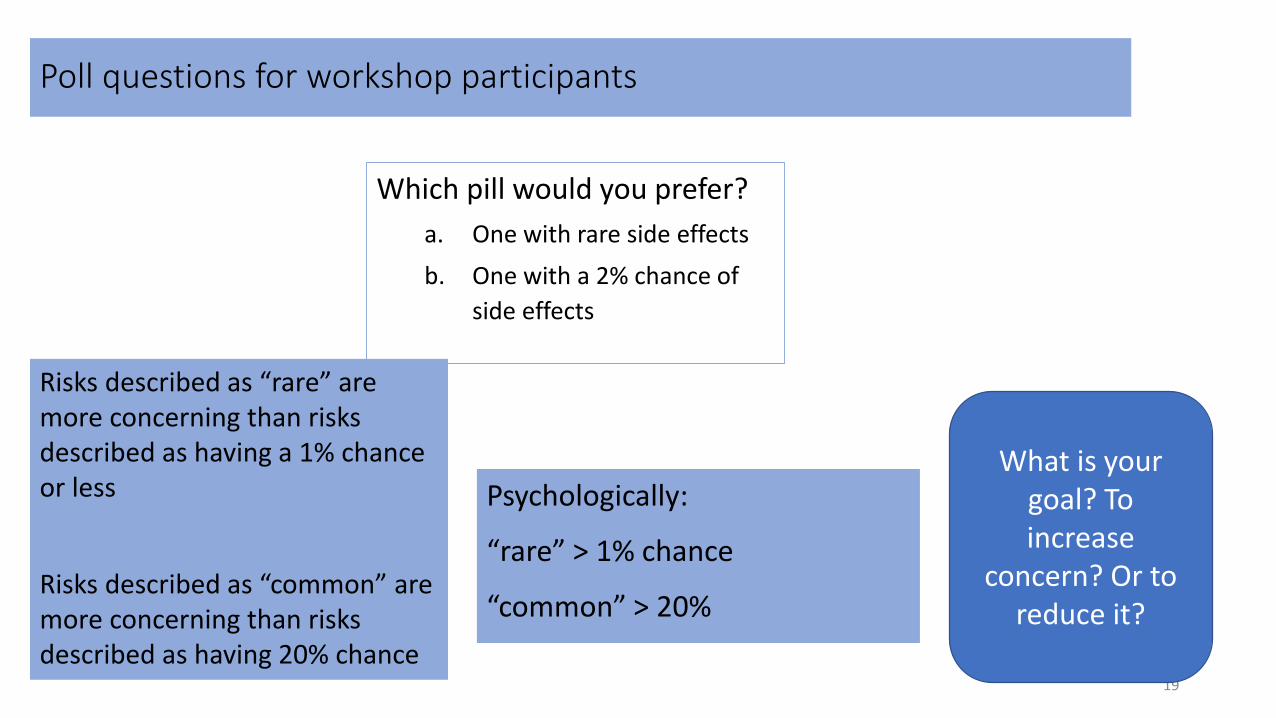
Poll questions for workshop participants
Which pill would you prefer?
a. One with rare side effects
b. One with a 2% chance of
side effects
19
Risks described as “rare” are more concerning than risks described as having a 1% chance or less
Risks described as “common” are more concerning than risks described as having 20% chance
Psychologically:
“rare” > 1% chance
“common” > 20%
What is your goal? To increase
concern? Or to reduce it?
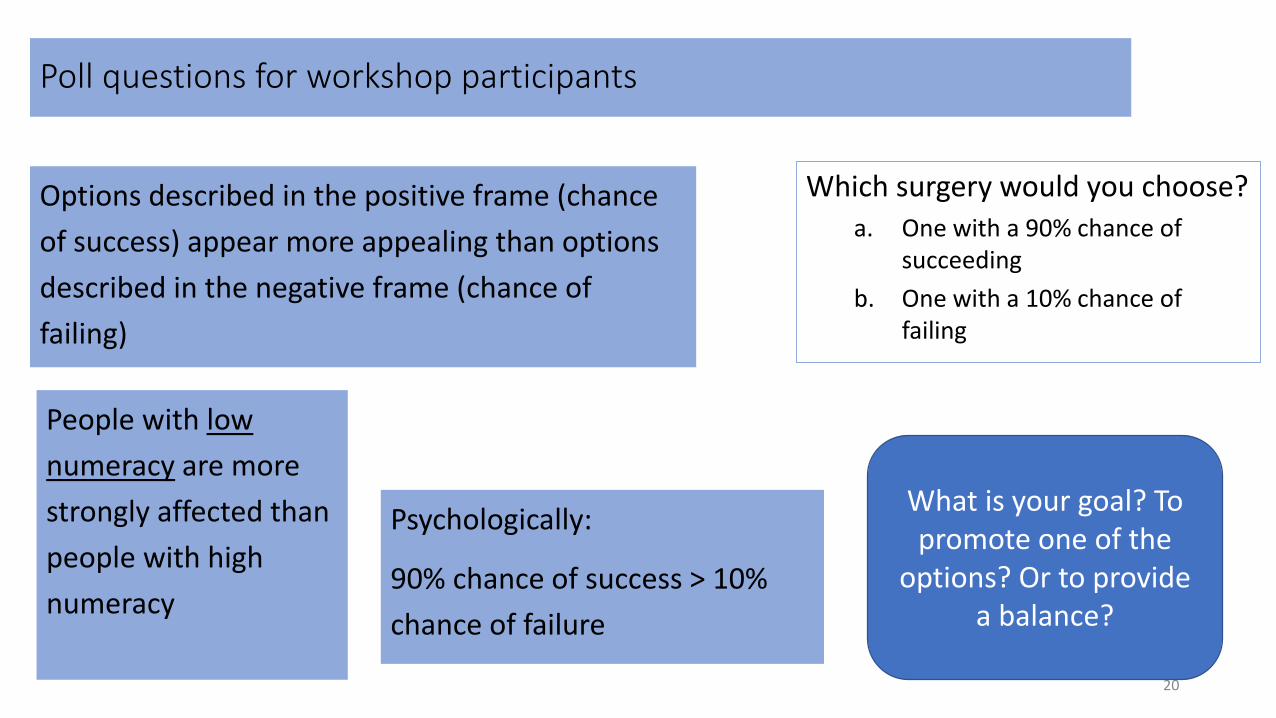
Poll questions for workshop participants
Which surgery would you choose?
a. One with a 90% chance of succeeding
b. One with a 10% chance of failing
20
Options described in the positive frame (chance
of success) appear more appealing than options
described in the negative frame (chance of
failing)
Psychologically:
90% chance of success > 10%
chance of failure
What is your goal? To promote one of the
options? Or to provide a balance?
People with low
numeracy are more
strongly affected than
people with high
numeracy
21
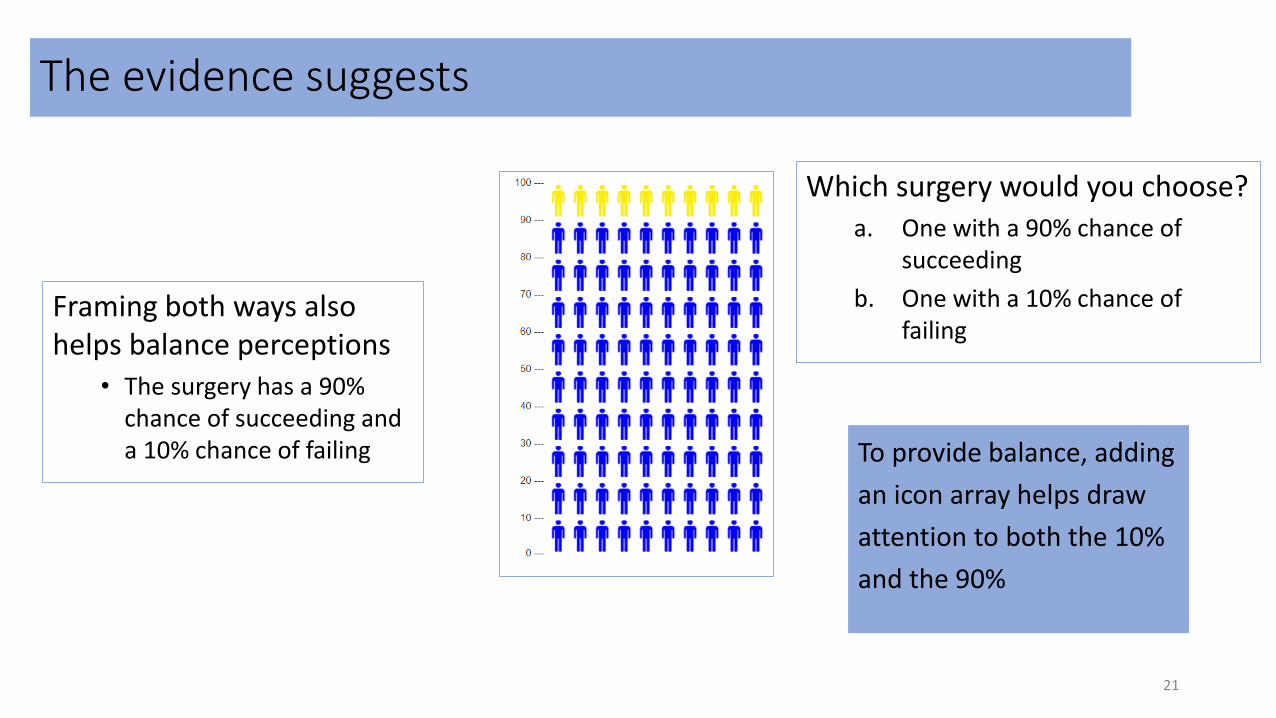
The evidence suggests
To provide balance, adding
an icon array helps draw
attention to both the 10%
and the 90%
Framing both ways also helps balance perceptions
• The surgery has a 90% chance of succeeding and a 10% chance of failing
Which surgery would you choose?
a. One with a 90% chance of succeeding
b. One with a 10% chance of failing
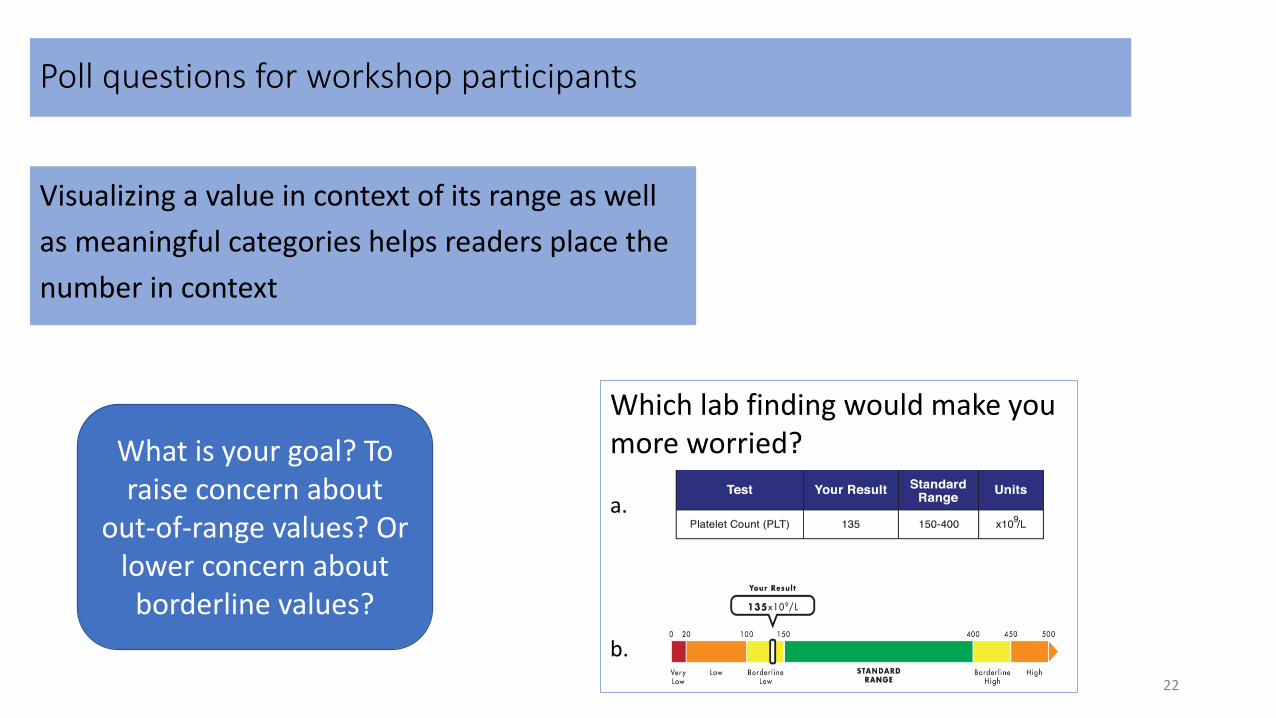
Poll questions for workshop participants
Which lab finding would make you more worried?
a.
b.
22
Visualizing a value in context of its range as well
as meaningful categories helps readers place the
number in context
What is your goal? To raise concern about
out-of-range values? Or lower concern about
borderline values?
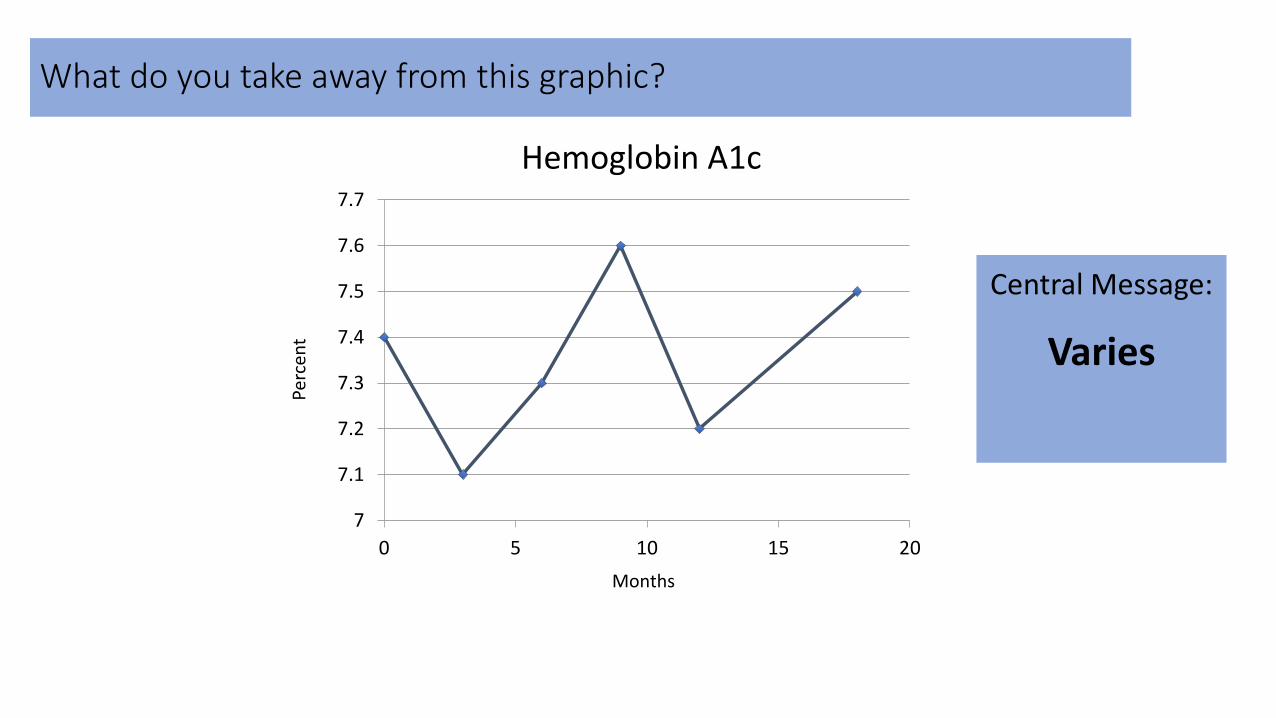
7
7.1
7.2
7.3
7.4
7.5
7.6
7.7
0 5 10 15 20
Hemoglobin A1c
Per
cen
t
Months
Central Message:
Varies
What do you take away from this graphic?
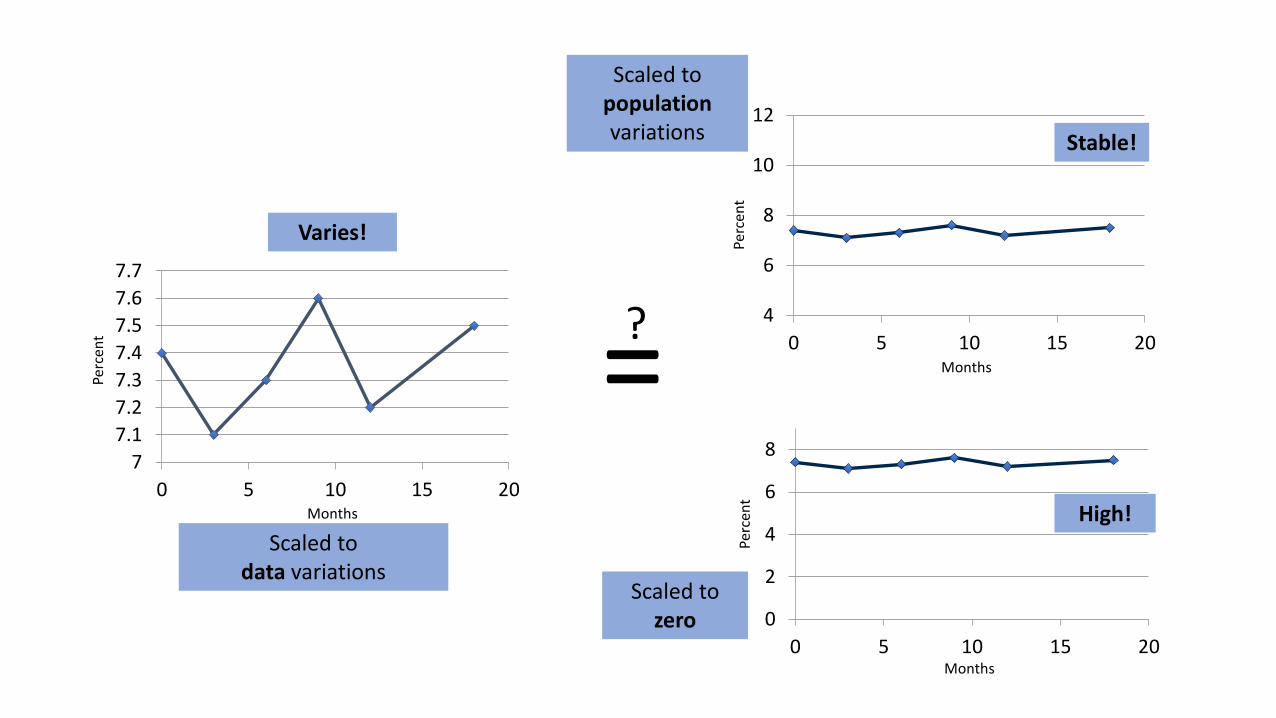
7
7.1
7.2
7.3
7.4
7.5
7.6
7.7
0 5 10 15 20
4
6
8
10
12
0 5 10 15 20
0
2
4
6
8
0 5 10 15 20
=?
Scaled to data variations
Scaled to population variations
Scaled to zero
Months
Months
Months
Perc
ent
Perc
ent
Perc
ent
Varies!
Stable!
High!
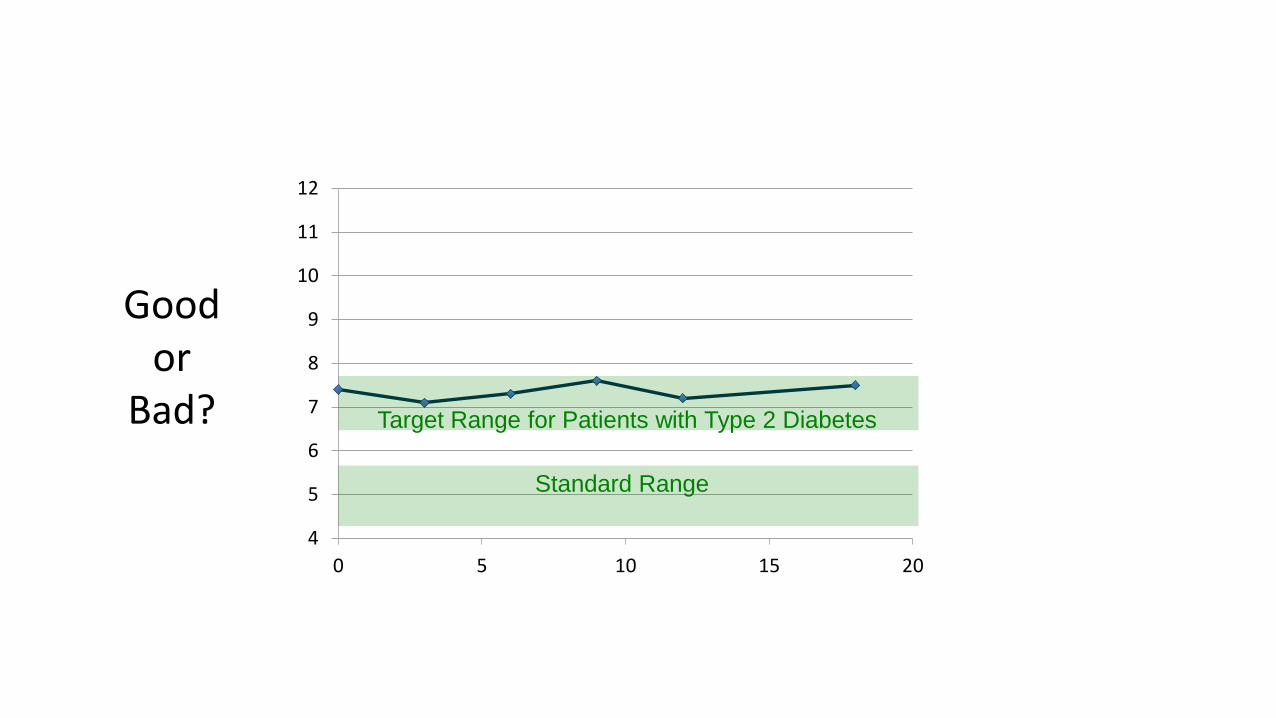
4
5
6
7
8
9
10
11
12
0 5 10 15 20
Standard Range
Goodor
Bad? Target Range for Patients with Type 2 Diabetes
26
27
28
29
30
31
32
33
34
35
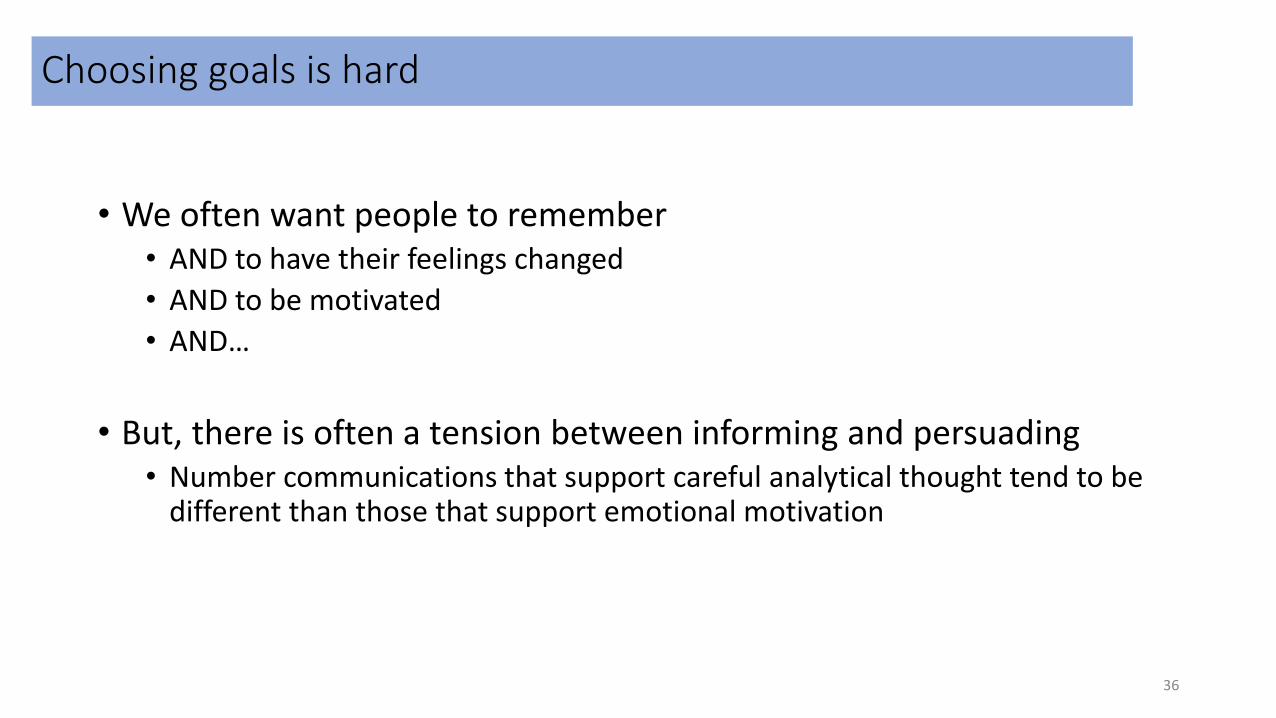
Choosing goals is hard
• We often want people to remember • AND to have their feelings changed
• AND to be motivated
• AND…
• But, there is often a tension between informing and persuading• Number communications that support careful analytical thought tend to be
different than those that support emotional motivation
36
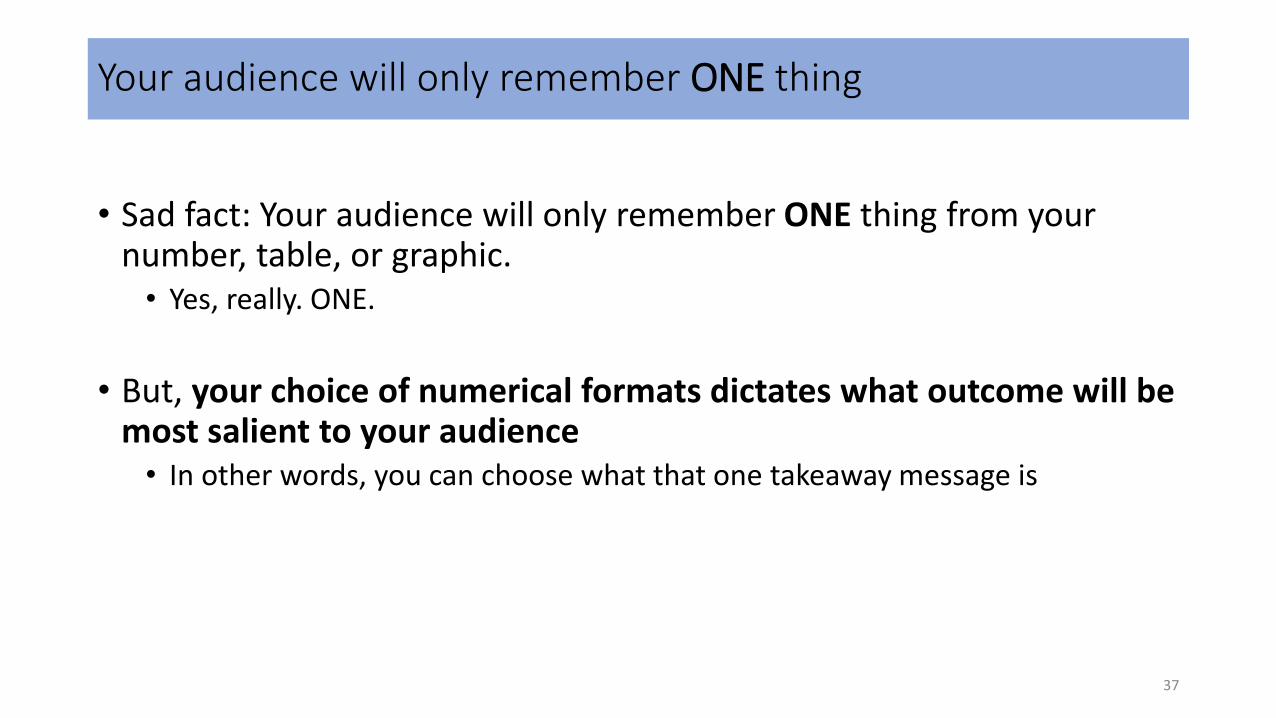
Your audience will only remember ONE thing
• Sad fact: Your audience will only remember ONE thing from your number, table, or graphic.• Yes, really. ONE.
• But, your choice of numerical formats dictates what outcome will be most salient to your audience• In other words, you can choose what that one takeaway message is
37
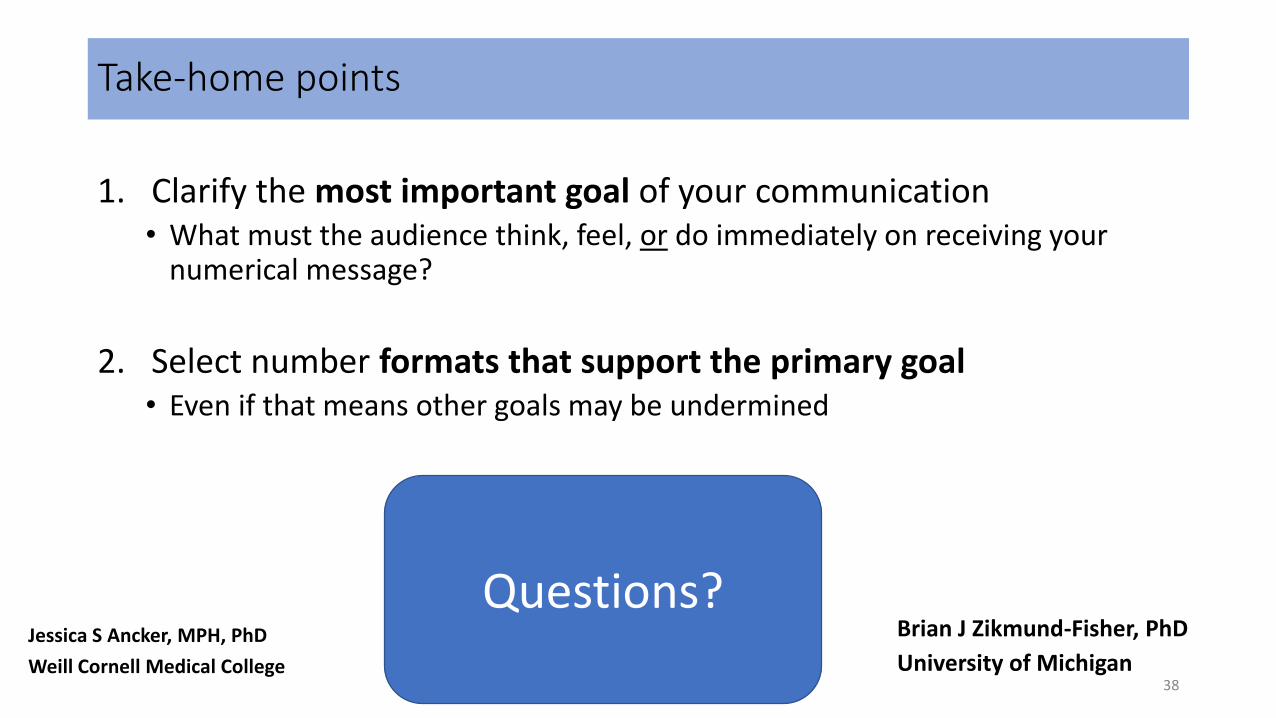
Take-home points
1. Clarify the most important goal of your communication• What must the audience think, feel, or do immediately on receiving your
numerical message?
2. Select number formats that support the primary goal• Even if that means other goals may be undermined
38
Questions? Jessica S Ancker, MPH, PhD
Weill Cornell Medical College
Brian J Zikmund-Fisher, PhD
University of Michigan