marjukka hiltunen economic environmental policy
TRANSCRIPT
Economic environmentalpolicy instruments
in Finland
T h e F i n n i s h E n v i r o n m e n t
Marjukka Hiltunen
676en
Economic environmental policy instruments in Finland
Economic environm
ental policy instruments in Finland
FINNISH ENVIRONMENT INSTITUTE P.O. BOX 140, FIN-00251 HELSINKI
ENVIRONMENTALPOLICY
. . . . . . . . . . . . . . . . . . . . . . . . . . . . . . . . . . . . . . . . . . . . . . . . . . . . . .
676en
ENVIRONMENTALPOLICY
F I N N I S H E N V I R O N M E N T I N S T I T U T E
T h e F i n n i s h E n v i r o n m e n t
This publication is also available in the Internet:www.environment.fi/publications
ISBN 952-11-1728-1ISBN 952-11-1729-X (PDF)ISSN 1238-7312
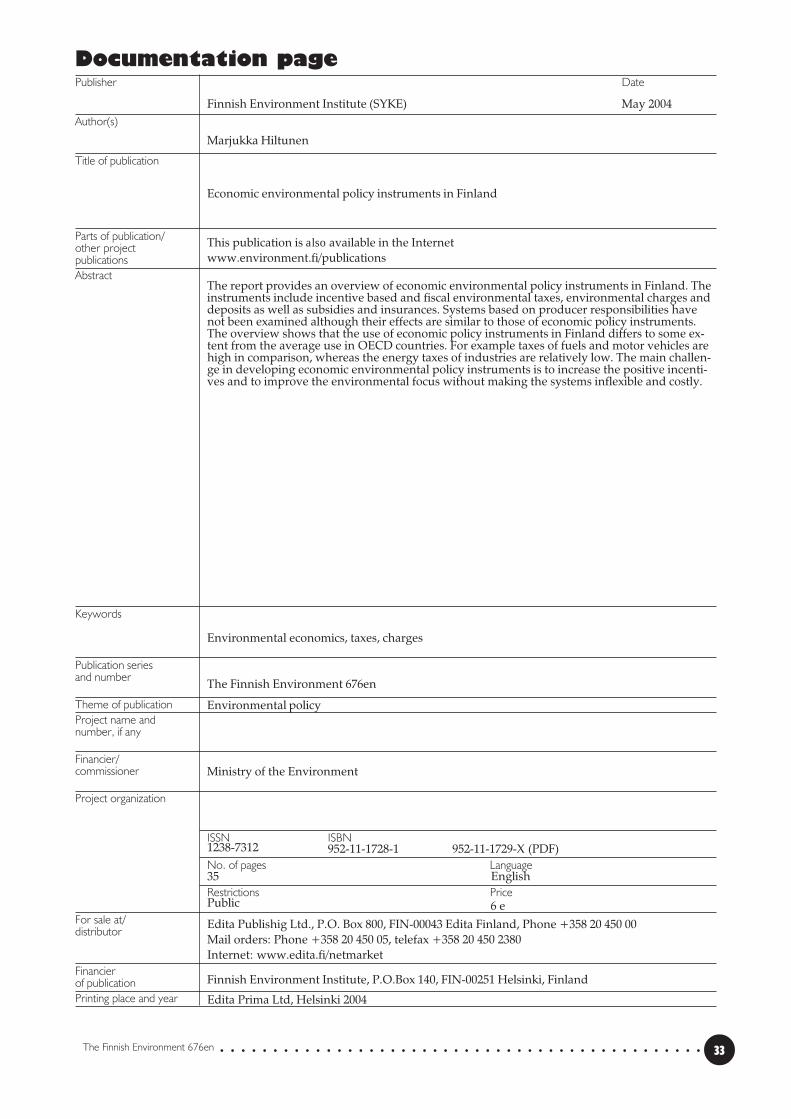
The report provides an overview of economic environmental policy instruments inFinland. The instruments include incentive based and fiscal environmental taxes,environmental charges and deposits as well as subsidies and insurances. Systemsbased on producer responsibilities have not been examined although their effectsare similar to those of economic policy instruments. The overview shows that theuse of economic policy instruments in Finland differs to some extent from theaverage use in OECD countries. For example taxes of fuels and motor vehicles arehigh in comparison, whereas the energy taxes of industries are relatively low. Themain challenge in developing economic environmental policy instruments is toincrease the positive incentives and to improve the environmental focus withoutmaking the systems inflexible and costly.
Edita Publishing Ltd.P.O.Box 800, FIN-00043 EDITA, FinlandPhone +358 20 450 00Mail orders:Phone +358 20 450 05, fax +358 20 450 2380Edita-bookshop in Helsinki:Annankatu 44, phone +358 20 450 2566

Economic environmentalpolicy instruments
in Finland
T h e F i n n i s h E n v i r o n m e n t
Marjukka Hiltunen
. . . . . . . . . . . . . . . . . . . . . . . . . . .F I N N I S H E N V I R O N M E N T I N S T I T U T E
HELSINKI 2004
676en

. . . . . . . . . . . . . . . . . . . . . . . . . . . . . . . . . . . . . . . . . . . . . . . . . . . . . . . .2 The Finnish Environment 676en
ISBN 952-11-1728-1ISBN 952-11-1729-X (PDF)
ISSN 1238-7312
Cover photo: Jonatan HildénLayout: Ritva Koskinen
Edita Prima Ltd, Helsinki 2004
The publication is also available in the Internet:www.environment.fi/publications
. . . . . . . . . . . . . . . . . . . . . . . . . . . . . . . . . . . . . . . . . . . . . . . . . . . . . . . . 3The Finnish Environment 676en
Foreword
An economic environmental policy instrument can be defined in a number of ways.According to Määttä,1 economic policy instruments are, in a narrow sense, econo-mic instruments aimed at improving the state of the environment or at least distri-buting the reductions in loads in a more cost-effective way. According to a broaderdefinition, economic policy instruments also include other taxes and subsidies thatmay have a positive impact on the environment. In the broadest sense, all methodsthat help to improve the functioning of the markets so that better consideration canbe given to the negative external environmental impacts can be considered econo-mic policy instruments. Thus, arrangements such as voluntary agreements shouldalso be considered as economic policy instruments.
The economic policy instruments discussed in this publication are the incenti-ve-based2 and fiscal3 environmental taxes, environmental charges4 and deposits5
and different types of subsidy and insurance. Finland has adopted a practice inwhich permit applicants pay most of the administrative expenses charged in con-nection with the granting of the permits, and this publication does not examine thepermit-related charges in any greater detail. Moreover, in a number of sectors Fin-nish manufacturers have been made responsible for the recovery and recycling oftheir products, and they manage their obligation by, for example, charging a re-cycling fee for their products (such as for discarded tyres). Such systems based onproducer-liability are not covered by this publication even though some of themhave effects similar to those of economic policy instruments.
Of the subsidies with an impact on environmental protection, this publicationdiscusses arrangements that have the improvement of the state of the environmentas their primary aim. The publication also covers interest-subsidy loans, State gua-rantees for environmental investment, the depreciation of purchases related toenvironmental protection, and environmental insurance.

. . . . . . . . . . . . . . . . . . . . . . . . . . . . . . . . . . . . . . . . . . . . . . . . . . . . . . . .4 The Finnish Environment 676en
. . . . . . . . . . . . . . . . . . . . . . . . . . . . . . . . . . . . . . . . . . . . . . . . . . . . . . . . 5The Finnish Environment 676en
Foreword .......................................................................................... 3
1 Environmentally based taxes and fees........................................... 7
2 Energy ........................................................................................... 92.1 Taxes ............................................................................................................................ 92.2 Tax subsidies and tax refunds ............................................................................... 102.3 Nuclear waste management fees, strategic stockpile fees and oilprotection charges ......................................................................................................... 112.4 Other subsidies ....................................................................................................... 12
3 Motor vehicles ............................................................................ 133.1 Taxes .......................................................................................................................... 133.2 Tax exemptions ........................................................................................................ 13
4 Waste and packaging ..................................................................144.1 Taxes and fees .......................................................................................................... 144.2 Grants, loans and export guarantees ................................................................... 15
5 Water ..........................................................................................16
6 Fees related to fishing and hunting .............................................17
7 Other fees and charges ...............................................................18
8 Other subsidies ............................................................................ 19
9 Environmental insurance.............................................................22
10 Impacts of economic policy instruments ...................................2310.1 Energy taxes ........................................................................................................... 2310.2 Taxation of vehicles .............................................................................................. 2510.3 Waste taxes ............................................................................................................. 2510.4 Environmentally based subsidies ...................................................................... 26
11 Discussion .................................................................................. 27
Notes .............................................................................................. 29
References...................................................................................... 32
Documentation pages .................................................................... 33
Contents

. . . . . . . . . . . . . . . . . . . . . . . . . . . . . . . . . . . . . . . . . . . . . . . . . . . . . . . .6 The Finnish Environment 676en
. . . . . . . . . . . . . . . . . . . . . . . . . . . . . . . . . . . . . . . . . . . . . . . . . . . . . . . . 7The Finnish Environment 676en
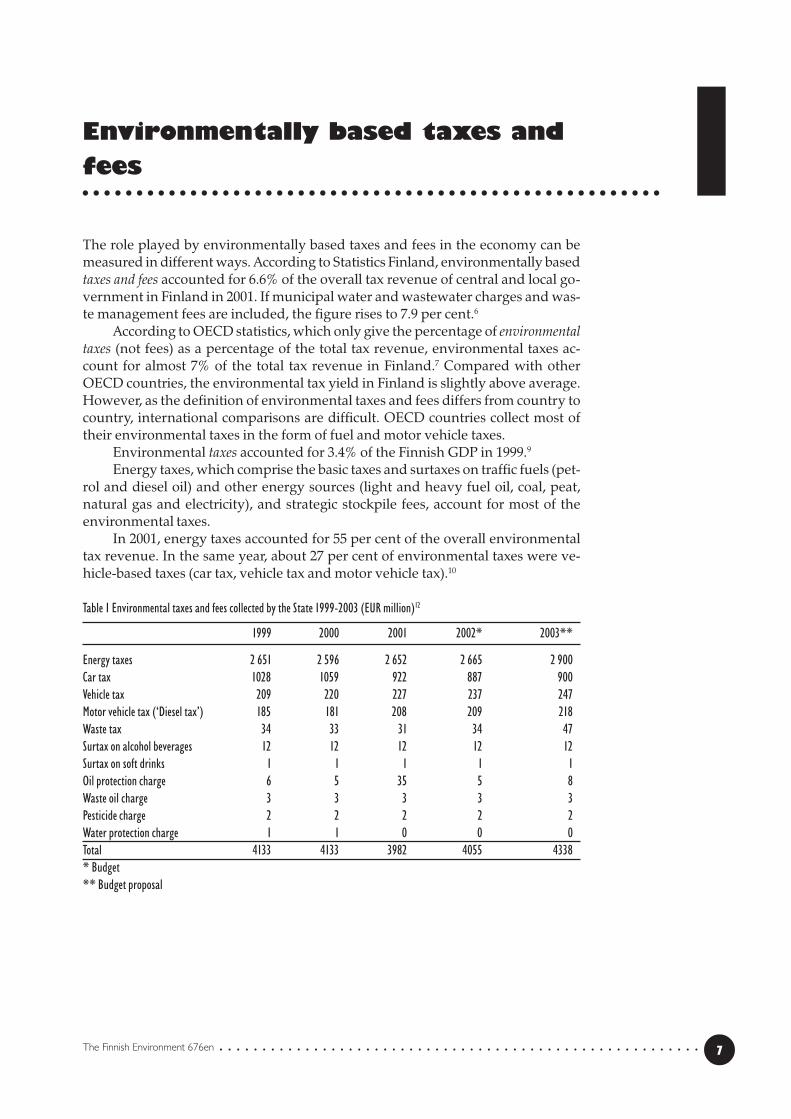
Environmentally based taxes andfees
The role played by environmentally based taxes and fees in the economy can bemeasured in different ways. According to Statistics Finland, environmentally basedtaxes and fees accounted for 6.6% of the overall tax revenue of central and local go-vernment in Finland in 2001. If municipal water and wastewater charges and was-te management fees are included, the figure rises to 7.9 per cent.6
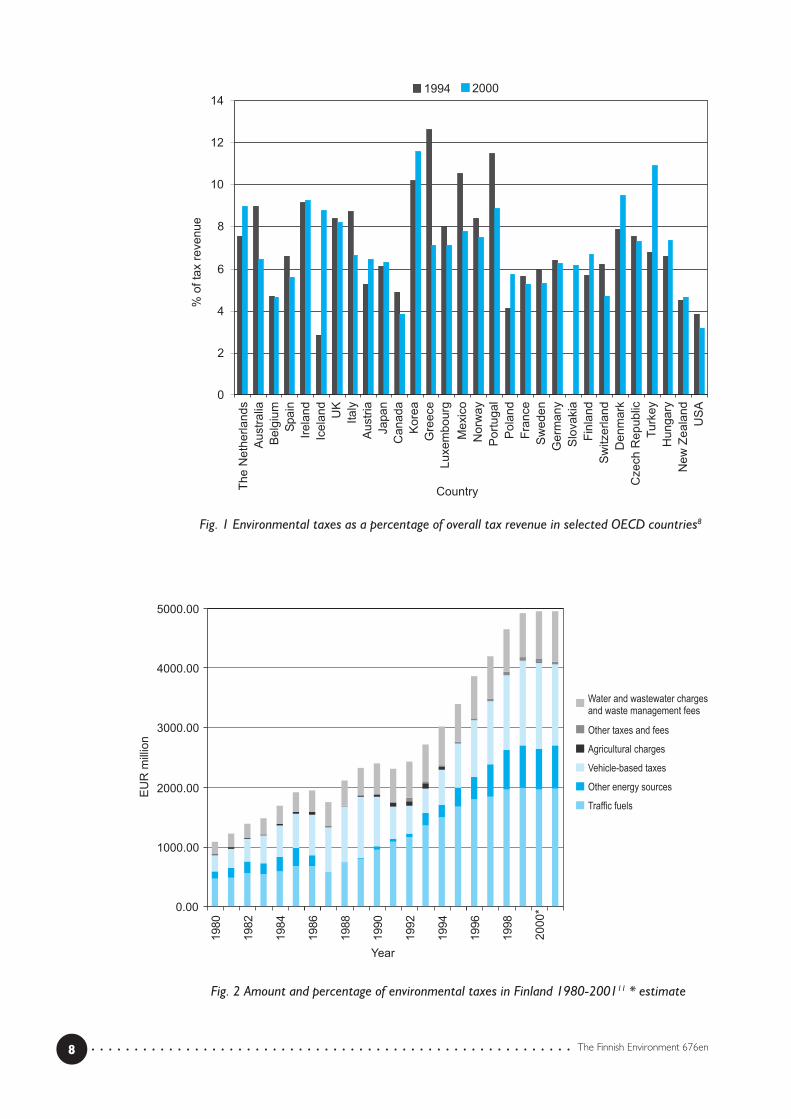
According to OECD statistics, which only give the percentage of environmentaltaxes (not fees) as a percentage of the total tax revenue, environmental taxes ac-count for almost 7% of the total tax revenue in Finland.7 Compared with otherOECD countries, the environmental tax yield in Finland is slightly above average.However, as the definition of environmental taxes and fees differs from country tocountry, international comparisons are difficult. OECD countries collect most oftheir environmental taxes in the form of fuel and motor vehicle taxes.
Environmental taxes accounted for 3.4% of the Finnish GDP in 1999.9
Energy taxes, which comprise the basic taxes and surtaxes on traffic fuels (pet-rol and diesel oil) and other energy sources (light and heavy fuel oil, coal, peat,natural gas and electricity), and strategic stockpile fees, account for most of theenvironmental taxes.
In 2001, energy taxes accounted for 55 per cent of the overall environmentaltax revenue. In the same year, about 27 per cent of environmental taxes were ve-hicle-based taxes (car tax, vehicle tax and motor vehicle tax).10
Table 1 Environmental taxes and fees collected by the State 1999-2003 (EUR million)12
1999 2000 2001 2002* 2003**
Energy taxes 2 651 2 596 2 652 2 665 2 900Car tax 1028 1059 922 887 900Vehicle tax 209 220 227 237 247Motor vehicle tax (‘Diesel tax’) 185 181 208 209 218Waste tax 34 33 31 34 47Surtax on alcohol beverages 12 12 12 12 12Surtax on soft drinks 1 1 1 1 1Oil protection charge 6 5 35 5 8Waste oil charge 3 3 3 3 3Pesticide charge 2 2 2 2 2Water protection charge 1 1 0 0 0Total 4133 4133 3982 4055 4338* Budget** Budget proposal
○ ○ ○ ○ ○ ○ ○ ○ ○ ○ ○ ○ ○ ○ ○ ○ ○ ○ ○ ○ ○ ○ ○ ○ ○ ○ ○ ○ ○ ○ ○ ○ ○ ○ ○ ○ ○ ○ ○ ○ ○ ○ ○ ○ ○ ○ ○ ○ ○ ○ ○ ○ ○ ○ 1
. . . . . . . . . . . . . . . . . . . . . . . . . . . . . . . . . . . . . . . . . . . . . . . . . . . . . . . .8 The Finnish Environment 676en
Fig. 1 Environmental taxes as a percentage of overall tax revenue in selected OECD countries8
Fig. 2 Amount and percentage of environmental taxes in Finland 1980-200111 * estimate
. . . . . . . . . . . . . . . . . . . . . . . . . . . . . . . . . . . . . . . . . . . . . . . . . . . . . . . . 9The Finnish Environment 676en
Energy
2.1 TaxesIn 1990, Finland introduced a carbon dioxide tax,13 which was initially set at EUR1.2 for each tonne of carbon dioxide. The surtax on petrol, diesel oil, natural gas andpeat was, however, on a different basis. The tax was introduced in order to slowdown the growth in energy consumption and to reduce harmful environmentalimpacts.14 From the beginning of 1995, the structure of energy taxation was chan-ged so that a tax based on energy content was imposed on all sources of primaryenergy while at the same time an additional tax based on carbon content was im-posed on fossil fuels. The tax based on energy content did not apply to wood, windenergy and waste fuel.15 The taxes based on energy and carbon content were in theform of a fuel surtax 40% of which came from the energy component and 60% fromthe carbon dioxide component.16 A basic tax was also imposed on nuclear power,hydropower and imported electricity.17
The tax structure had to be changed substantially in the late 1990s. One reasonwas the opening of the Nordic electricity market and the development of the elect-ricity exchange. In Finland the tax was directed at the production of primary ener-gy, while in other Nordic countries it was based on consumption. This weakenedthe competitiveness of Finnish electricity production, and the tax structure wasalso considered to be in violation of EU regulations. It was, therefore, decided tointroduce a tax system in which the tax is levied on consumption and not on theproduction of electricity. The system, which has been in force since the beginningof 1997, has different tax classes for industry and households, and the tax is thesame irrespective of the fuel used. However, there is a separate tax on heat genera-tion, which is based solely on the carbon dioxide content of the fuel. This tax wasintroduced to compensate for the fact that exempting electricity-generating fuelsfrom the carbon dioxide tax weakened the impact of economic environmental po-licy instruments.18
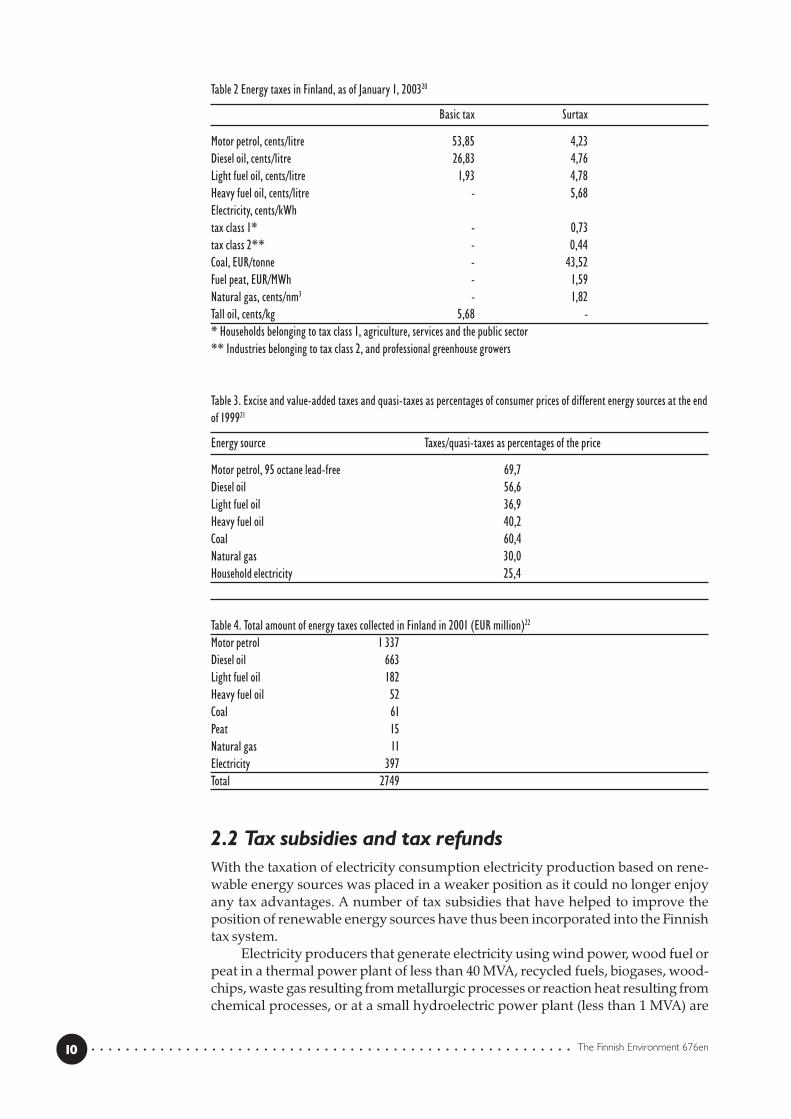
Table 2 below shows the level of energy taxation in Finland in 2003. The car-bon dioxide tax on fuels is based on the carbon dioxide content of the fuel (EUR18.05/tonne of carbon dioxide). For natural gas, however, the tax is 50 per cent lo-wer, while the surtax on peat is one quarter of the level that it would normally haveunder the tax code.19 Table 3 shows excise and value-added taxes and quasi-taxes aspercentages of consumer prices of different energy sources at the end of 1999. Table4 shows how much was collected in the form of energy taxes in Finland in 2001.
○ ○ ○ ○ ○ ○ ○ ○ ○ ○ ○ ○ ○ ○ ○ ○ ○ ○ ○ ○ ○ ○ ○ ○ ○ ○ ○ ○ ○ ○ ○ ○ ○ ○ ○ ○ ○ ○ ○ ○ ○ ○ ○ ○ ○ ○ ○ ○ ○ ○ ○ ○ ○ ○2
. . . . . . . . . . . . . . . . . . . . . . . . . . . . . . . . . . . . . . . . . . . . . . . . . . . . . . . .10 The Finnish Environment 676en
Table 2 Energy taxes in Finland, as of January 1, 200320
Basic tax Surtax
Motor petrol, cents/litre 53,85 4,23Diesel oil, cents/litre 26,83 4,76Light fuel oil, cents/litre 1,93 4,78Heavy fuel oil, cents/litre - 5,68Electricity, cents/kWhtax class 1* - 0,73tax class 2** - 0,44Coal, EUR/tonne - 43,52Fuel peat, EUR/MWh - 1,59Natural gas, cents/nm3 - 1,82Tall oil, cents/kg 5,68 -* Households belonging to tax class 1, agriculture, services and the public sector** Industries belonging to tax class 2, and professional greenhouse growers
Table 3. Excise and value-added taxes and quasi-taxes as percentages of consumer prices of different energy sources at the endof 199921
Energy source Taxes/quasi-taxes as percentages of the price
Motor petrol, 95 octane lead-free 69,7Diesel oil 56,6Light fuel oil 36,9Heavy fuel oil 40,2Coal 60,4Natural gas 30,0Household electricity 25,4
Table 4. Total amount of energy taxes collected in Finland in 2001 (EUR million)22
Motor petrol 1 337Diesel oil 663Light fuel oil 182Heavy fuel oil 52Coal 61Peat 15Natural gas 11Electricity 397Total 2749
2.2 Tax subsidies and tax refundsWith the taxation of electricity consumption electricity production based on rene-wable energy sources was placed in a weaker position as it could no longer enjoyany tax advantages. A number of tax subsidies that have helped to improve theposition of renewable energy sources have thus been incorporated into the Finnishtax system.
Electricity producers that generate electricity using wind power, wood fuel orpeat in a thermal power plant of less than 40 MVA, recycled fuels, biogases, wood-chips, waste gas resulting from metallurgic processes or reaction heat resulting fromchemical processes, or at a small hydroelectric power plant (less than 1 MVA) are
. . . . . . . . . . . . . . . . . . . . . . . . . . . . . . . . . . . . . . . . . . . . . . . . . . . . . . . . 11The Finnish Environment 676en
entitled to a tax subsidy of 0.42 cents/kWh. For electricity generated with woodchips, the subsidy is 0.69 cents/kWh, and for electricity produced with recycled fuel0.25 cents/kWh.23
A lower electricity-tax class for industry and a partial refund of the energytaxes to energy-intensive industry are two additional measures aimed at ensuringthe competitiveness of Finnish companies. A company in the energy-intensive sec-tor is refunded for electricity and fuel taxes exceeding 3.7% of its value added. Acompany can apply for an 85% refund for the portion exceeding 3.7% but onlysums above EUR 50,000 are paid.24 A total of about EUR 14.3 million is paid in theform of tax refunds every year, and in 1999 12 companies received them.25 Theserefunds accounted for about 8% of all electricity taxes paid by Finnish industry.26
Subsidies related to energy taxation must be approved by the European Com-mission before they can be introduced at national level. The Commission has takenthe view that subsidies and tax exemptions should be on a temporary basis andgradually reduced. Subsidies for energy-intensive companies and the electricitytax class 2 will be in force until the end of the 2011, while other subsidies will expireat the end of 2006.27
2.3 Nuclear waste management fees, strategicstockpile fees and oil protection charges
Producers of nuclear electricity put money aside into the State Nuclear Waste Ma-nagement Fund, which will be used to finance the decommissioning of Finnishnuclear power plants at the end of their useful life and the final disposal of nuclearwaste in bedrock. The Fund is administered by the Ministry of Trade and Industry,and the cost of nuclear waste management has been incorporated into the price ofelectricity generated by nuclear power.28 Most of the estimated funding needs havealready been met.29 In 2002, a total of EUR 48 million was collected into the StateNuclear Waste Management Fund.30
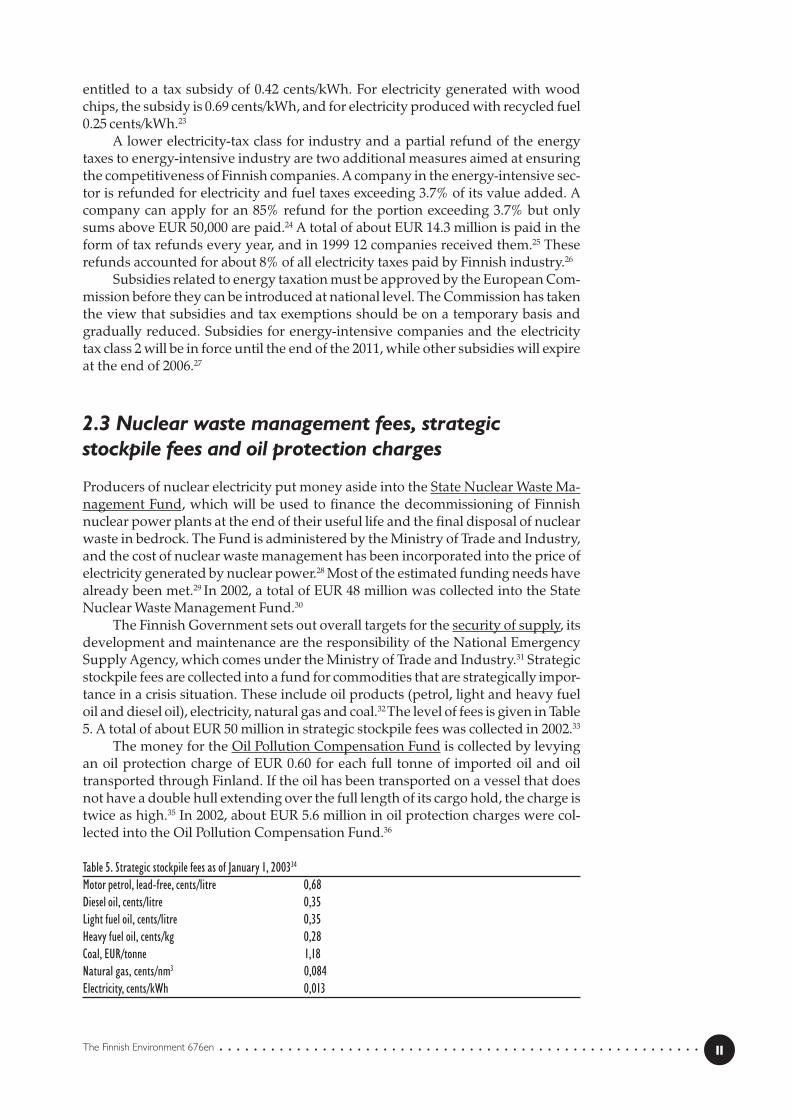
The Finnish Government sets out overall targets for the security of supply, itsdevelopment and maintenance are the responsibility of the National EmergencySupply Agency, which comes under the Ministry of Trade and Industry.31 Strategicstockpile fees are collected into a fund for commodities that are strategically impor-tance in a crisis situation. These include oil products (petrol, light and heavy fueloil and diesel oil), electricity, natural gas and coal.32 The level of fees is given in Table5. A total of about EUR 50 million in strategic stockpile fees was collected in 2002.33
The money for the Oil Pollution Compensation Fund is collected by levyingan oil protection charge of EUR 0.60 for each full tonne of imported oil and oiltransported through Finland. If the oil has been transported on a vessel that doesnot have a double hull extending over the full length of its cargo hold, the charge istwice as high.35 In 2002, about EUR 5.6 million in oil protection charges were col-lected into the Oil Pollution Compensation Fund.36
Table 5. Strategic stockpile fees as of January 1, 200334
Motor petrol, lead-free, cents/litre 0,68Diesel oil, cents/litre 0,35Light fuel oil, cents/litre 0,35Heavy fuel oil, cents/kg 0,28Coal, EUR/tonne 1,18Natural gas, cents/nm3 0,084Electricity, cents/kWh 0,013
. . . . . . . . . . . . . . . . . . . . . . . . . . . . . . . . . . . . . . . . . . . . . . . . . . . . . . . .12 The Finnish Environment 676en
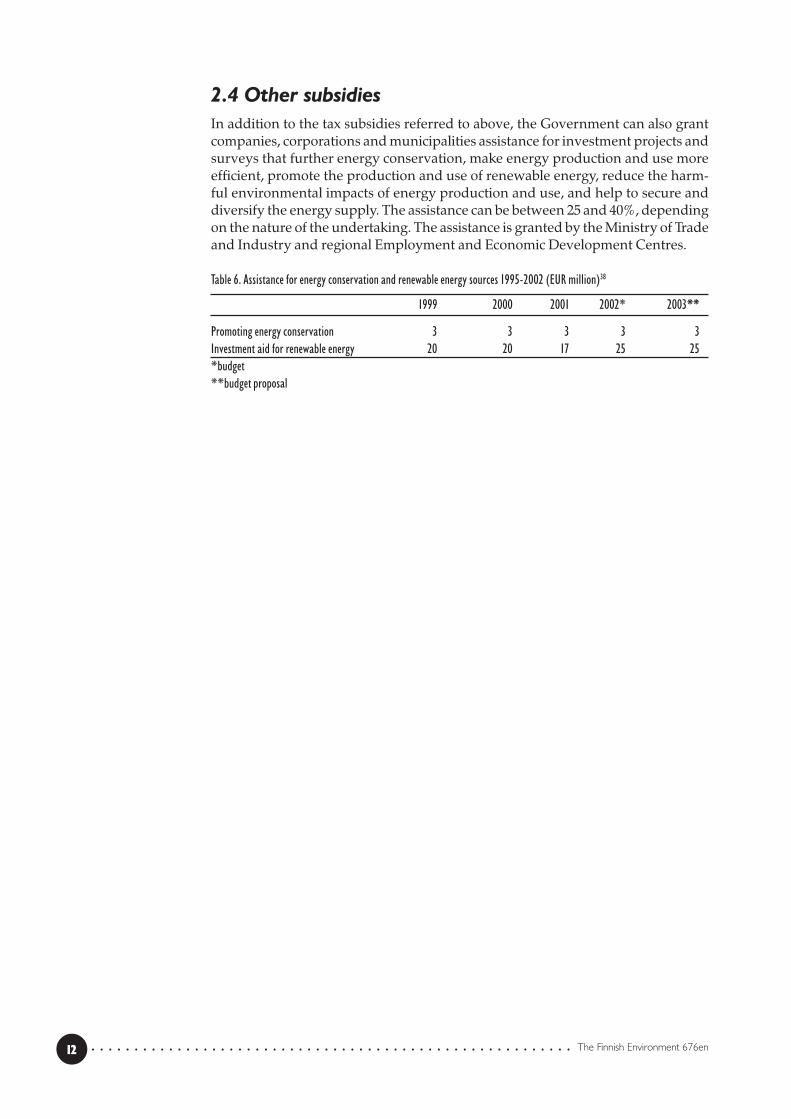
2.4 Other subsidiesIn addition to the tax subsidies referred to above, the Government can also grantcompanies, corporations and municipalities assistance for investment projects andsurveys that further energy conservation, make energy production and use moreefficient, promote the production and use of renewable energy, reduce the harm-ful environmental impacts of energy production and use, and help to secure anddiversify the energy supply. The assistance can be between 25 and 40%, dependingon the nature of the undertaking. The assistance is granted by the Ministry of Tradeand Industry and regional Employment and Economic Development Centres.
Table 6. Assistance for energy conservation and renewable energy sources 1995-2002 (EUR million)38
1999 2000 2001 2002* 2003**
Promoting energy conservation 3 3 3 3 3Investment aid for renewable energy 20 20 17 25 25*budget**budget proposal
. . . . . . . . . . . . . . . . . . . . . . . . . . . . . . . . . . . . . . . . . . . . . . . . . . . . . . . . 13The Finnish Environment 676en
Motor vehicles
3.1 TaxesFinland has three different taxes levied on motor vehicles: a car tax payable on thepurchase of the car, an annual vehicle tax payable by the person owning or posses-sing the vehicle, and an annual motor vehicle tax levied on vehicles other thanthose that are petrol driven (‘diesel tax’).
The car tax is levied on private cars, vans and other cars weighing less than1,875 kg, and motorcycles. The tax is payable before the vehicle is registered ortaken into use in Finland. The tax on a private car is 28 per cent of its taxation valueless EUR 650, if the vehicle is not diesel-driven, and 28 per cent less EUR 450, if thevehicle is diesel-driven. The tax on motorcycles depends on their displacement.For vehicles manufactured before 2003 and taxed as second-hand vehicles the tax isthe tax proportion of the taxation value that was included in the general retail salevalue of similar vehicles when they were new.39 The total car tax revenue in 2002was slightly over EUR 1 billion.40
The vehicle tax, introduced in 1994, is levied annually on private cars andvans and special vehicles with a maximum weight of 3,500 kg. It amounts to 35cents/day, or EUR 127.75/year for vehicles registered after January 1, 1994 and 26cents/day or EUR 94.90/year for vehicles registered before that date.41 The total ve-hicle tax revenue in 2002 was EUR 233 million.42
The motor vehicle tax is levied annually on vehicles other than those that arepetrol driven. Its purpose is to compensate for the fact that petrol has a higherexcise tax than other fuels. The tax is determined on the basis of the vehicle weightso that for private cars it is EUR 25.20/100 kg, and for vans EUR 4.56/100 kg. Forlorries and similar heavy vehicles the tax also depends on the number of axles andthe bogie structure and varies between EUR 4.56 and 10.56/100 kg.43 A total of aboutEUR 218 million in motor vehicle taxes was collected in 2002.44
3.2 Tax exemptionsLorries and buses using liquid or natural gas and meeting the emission require-ments of the best available technology were exempted from the motor vehicle taxfrom the beginning of 1999.45
○ ○ ○ ○ ○ ○ ○ ○ ○ ○ ○ ○ ○ ○ ○ ○ ○ ○ ○ ○ ○ ○ ○ ○ ○ ○ ○ ○ ○ ○ ○ ○ ○ ○ ○ ○ ○ ○ ○ ○ ○ ○ ○ ○ ○ ○ ○ ○ ○ ○ ○ ○ ○ ○3
. . . . . . . . . . . . . . . . . . . . . . . . . . . . . . . . . . . . . . . . . . . . . . . . . . . . . . . .14 The Finnish Environment 676en
Waste and packaging
4.1 Taxes and feesThe waste tax levied by the Finnish Government, which at the moment is EUR 23for one tonne of waste, will be increased to EUR 30 for one tonne of waste as ofJanuary 1, 2005. The tax is levied on waste that has been taken to public landfillsand landfills similar to them. In order to encourage waste recovery, no waste tax islevied on recyclable and compostable waste, and private landfills and landfillsmaintained by industry are also exempt from it.46 The Government collected a totalof about EUR 32 million in waste tax in 2002.47
Municipal waste management fees are user charges that should be determin-ed on the basis of the full-cost principle, taking into account both day-to-day ex-penses and investment costs. Under Finnish law, the fees are obligatory and shouldat least cover the costs arising from the commissioning, use, decommissioning andafter-care of the processing facilities.48 In practice, the full-cost principle has notbecome reality in all municipalities and some landfills are still subsidized with taxrevenue.49
Under Finnish law, municipal waste management fees should not only be ona full-cost basis but also help to reduce the amount and harmfulness of waste andencourage waste recovery.50 Therefore, many municipalities charge less for sortedand recyclable waste than for mixed waste that cannot be recovered. According toa survey, municipal waste fees have helped to increase waste recovery but havefailed to reduce the amount of waste.51
Table 7. Municipal waste fees 2000-2002 (excl. VAT)52
Type of waste 2000 2001 2002Average, EUR/tonne Average, EUR/tonne Average, EUR/tonne
Municipal waste Y1 49 50 57Municipal waste Y2 48 51 59Municipal waste Y3 45 51 60Municipal waste Y4 51 51 59Biowaste 26 28 36Special waste 68 73 88Septic tank sludge 35 37Y1 Municipal waste transported in a refuse collection vehicle with a press or in a waste containerY2 Municipal waste carried in a skip container used as waste collection containerY3 Municipal waste transported in a manner other than Y1 or Y2Y4 Industrial and construction waste considered as municipal waste and transported in a manner other than Y1 or Y2.
In Finland, the price of lubrication oil includes a waste oil charge of 4.2 cents/kg.The money collected in this way is used to cover the costs of waste oil managementand the regional hazardous waste reception centres. As of January 1, 1997, it hasbeen possible to transfer part of the money to the Oil Pollution Compensation Fundand use it for remediating areas polluted by oil.53 In 2002, a total of EUR 3.6 millionwas collected as waste oil charges.54
○ ○ ○ ○ ○ ○ ○ ○ ○ ○ ○ ○ ○ ○ ○ ○ ○ ○ ○ ○ ○ ○ ○ ○ ○ ○ ○ ○ ○ ○ ○ ○ ○ ○ ○ ○ ○ ○ ○ ○ ○ ○ ○ ○ ○ ○ ○ ○ ○ ○ ○ ○ ○ ○4
. . . . . . . . . . . . . . . . . . . . . . . . . . . . . . . . . . . . . . . . . . . . . . . . . . . . . . . . 15The Finnish Environment 676en
A packaging tax is levied on the packaging of alcoholic beverages and softdrinks. The purpose of the tax is to reduce the use of disposable packaging and theamount of waste and to prevent the accumulation of litter. The tax amounts to 67cents/litre. If the producer or importer has a system under which the packaging ofalcoholic beverages and soft drinks can be returned against a deposit and the packa-ging can be refilled, the tax need not be paid. If the packaging can be returnedagainst a deposit and it is used as a raw material, the tax is 16 cents/litre.55 Theindustry is responsible for operating the deposit bottle and can system. In 1998,about 90% of the 1.2 billion glass bottles used in Finland were refillable.56
4.2 Grants, loans and export guaranteesUnder a Government decision of December 2, 1996, grants can be given for projectspromoting environmental protection. In waste management, priority is given toprojects that help to reduce the amount and harmfulness of waste, promote wasterecovery, remediate polluted land areas and old landfills and encourage theconstruction of pilot facilities for recycling and other types of waste management.Grants amount to 30-50% of the costs, depending on the nature of the project.57
Funds allocated to the National Technology Agency of Finland can be used asgrants and loans for promoting new waste management technology and productdevelopment.58 The Finnish Guarantee Board can grant State guarantees as collate-ral for loans granted for fund waste recovery investment. In such guarantees, prio-rity is given to the effectiveness of environmental protection measures (For moreinformation about State guarantees, see chapter 8).59
. . . . . . . . . . . . . . . . . . . . . . . . . . . . . . . . . . . . . . . . . . . . . . . . . . . . . . . .16 The Finnish Environment 676en
Water
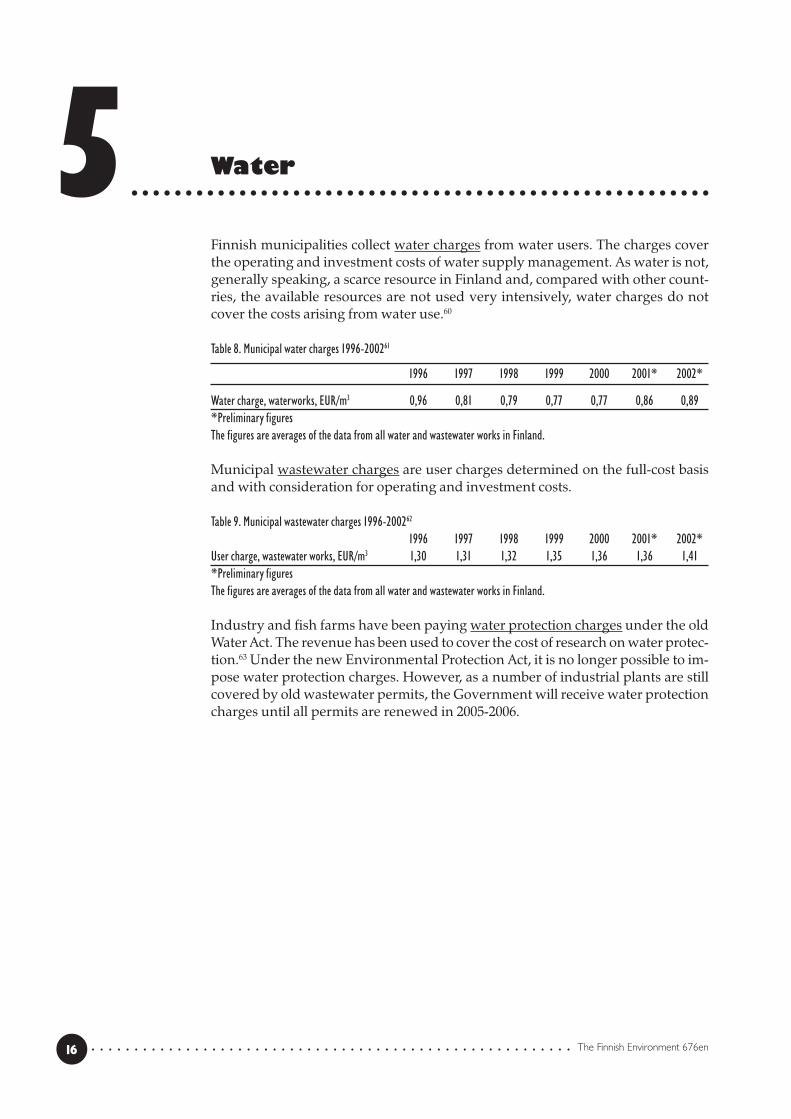
Finnish municipalities collect water charges from water users. The charges coverthe operating and investment costs of water supply management. As water is not,generally speaking, a scarce resource in Finland and, compared with other count-ries, the available resources are not used very intensively, water charges do notcover the costs arising from water use.60
Table 8. Municipal water charges 1996-200261
1996 1997 1998 1999 2000 2001* 2002*
Water charge, waterworks, EUR/m3 0,96 0,81 0,79 0,77 0,77 0,86 0,89*Preliminary figuresThe figures are averages of the data from all water and wastewater works in Finland.
Municipal wastewater charges are user charges determined on the full-cost basisand with consideration for operating and investment costs.
Table 9. Municipal wastewater charges 1996-200262
1996 1997 1998 1999 2000 2001* 2002*User charge, wastewater works, EUR/m3 1,30 1,31 1,32 1,35 1,36 1,36 1,41*Preliminary figuresThe figures are averages of the data from all water and wastewater works in Finland.
Industry and fish farms have been paying water protection charges under the oldWater Act. The revenue has been used to cover the cost of research on water protec-tion.63 Under the new Environmental Protection Act, it is no longer possible to im-pose water protection charges. However, as a number of industrial plants are stillcovered by old wastewater permits, the Government will receive water protectioncharges until all permits are renewed in 2005-2006.
○ ○ ○ ○ ○ ○ ○ ○ ○ ○ ○ ○ ○ ○ ○ ○ ○ ○ ○ ○ ○ ○ ○ ○ ○ ○ ○ ○ ○ ○ ○ ○ ○ ○ ○ ○ ○ ○ ○ ○ ○ ○ ○ ○ ○ ○ ○ ○ ○ ○ ○ ○ ○ ○5
. . . . . . . . . . . . . . . . . . . . . . . . . . . . . . . . . . . . . . . . . . . . . . . . . . . . . . . . 17The Finnish Environment 676en
Fees related to fishing andhunting
Angling and ice fishing are free in Finland but other forms of fishing and crayfis-hing are subject to charges and permits. Anybody catching fish or crayfish mustpay a fishery fee of EUR 15/year to the State. Those fishing with lures must also paya lure-fishing fee of EUR 27 that allows lure fishing in a specific province.64 In 2002,the Government received a total of EUR 4.7 million in the form of fishery fees andEUR 2.1 million in the form of lure-fishing fees.65
Hunters must pay the Government an annual game management fee of EUR24. In addition, a hunting licence fee of EUR 100 is payable on each adult elk killed.Lower fees apply for calves and other deer.66 The revenue is used for developinggame management and hunting.67 In 2002, the Government collected a total of aboutEUR 7 million in the form of game management fees and EUR 6 million in the formof hunting licence fees.68
○ ○ ○ ○ ○ ○ ○ ○ ○ ○ ○ ○ ○ ○ ○ ○ ○ ○ ○ ○ ○ ○ ○ ○ ○ ○ ○ ○ ○ ○ ○ ○ ○ ○ ○ ○ ○ ○ ○ ○ ○ ○ ○ ○ ○ ○ ○ ○ ○ ○ ○ ○ ○ ○6
. . . . . . . . . . . . . . . . . . . . . . . . . . . . . . . . . . . . . . . . . . . . . . . . . . . . . . . .18 The Finnish Environment 676en
Other fees and charges
In Finland, the pesticide charge is of a purely administrative nature, and its purpo-se is to cover the cost of registering new pesticides. The charge amounts to EUR840/substance to be registered. In addition, the company must pay 3.5% of the VAT-free net sales price of the pesticide sold, delivered in another manner or used du-ring the previous calendar year.69
○ ○ ○ ○ ○ ○ ○ ○ ○ ○ ○ ○ ○ ○ ○ ○ ○ ○ ○ ○ ○ ○ ○ ○ ○ ○ ○ ○ ○ ○ ○ ○ ○ ○ ○ ○ ○ ○ ○ ○ ○ ○ ○ ○ ○ ○ ○ ○ ○ ○ ○ ○ ○ ○7
. . . . . . . . . . . . . . . . . . . . . . . . . . . . . . . . . . . . . . . . . . . . . . . . . . . . . . . . 19The Finnish Environment 676en
Other subsidies
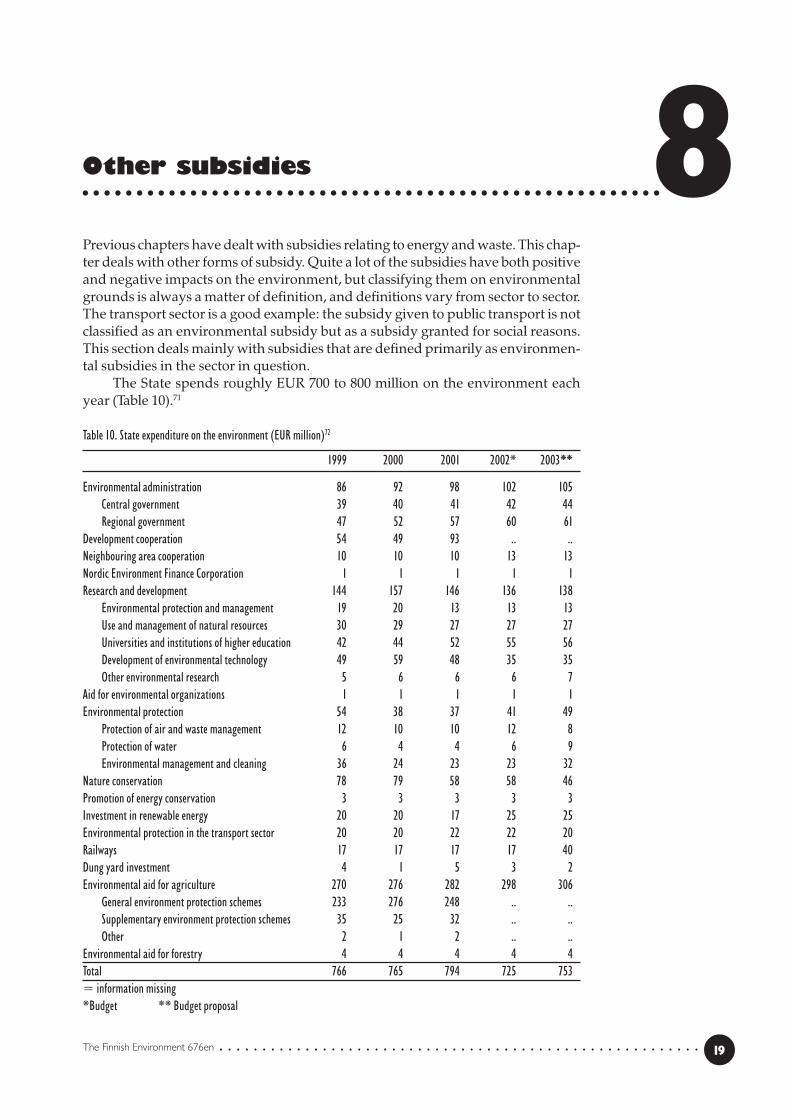
Previous chapters have dealt with subsidies relating to energy and waste. This chap-ter deals with other forms of subsidy. Quite a lot of the subsidies have both positiveand negative impacts on the environment, but classifying them on environmentalgrounds is always a matter of definition, and definitions vary from sector to sector.The transport sector is a good example: the subsidy given to public transport is notclassified as an environmental subsidy but as a subsidy granted for social reasons.This section deals mainly with subsidies that are defined primarily as environmen-tal subsidies in the sector in question.
The State spends roughly EUR 700 to 800 million on the environment eachyear (Table 10).71
Table 10. State expenditure on the environment (EUR million)72
1999 2000 2001 2002* 2003**
Environmental administration 86 92 98 102 105Central government 39 40 41 42 44Regional government 47 52 57 60 61
Development cooperation 54 49 93 .. ..Neighbouring area cooperation 10 10 10 13 13Nordic Environment Finance Corporation 1 1 1 1 1Research and development 144 157 146 136 138
Environmental protection and management 19 20 13 13 13Use and management of natural resources 30 29 27 27 27Universities and institutions of higher education 42 44 52 55 56Development of environmental technology 49 59 48 35 35Other environmental research 5 6 6 6 7
Aid for environmental organizations 1 1 1 1 1Environmental protection 54 38 37 41 49
Protection of air and waste management 12 10 10 12 8Protection of water 6 4 4 6 9Environmental management and cleaning 36 24 23 23 32
Nature conservation 78 79 58 58 46Promotion of energy conservation 3 3 3 3 3Investment in renewable energy 20 20 17 25 25Environmental protection in the transport sector 20 20 22 22 20Railways 17 17 17 17 40Dung yard investment 4 1 5 3 2Environmental aid for agriculture 270 276 282 298 306
General environment protection schemes 233 276 248 .. ..Supplementary environment protection schemes 35 25 32 .. ..Other 2 1 2 .. ..
Environmental aid for forestry 4 4 4 4 4Total 766 765 794 725 753= information missing*Budget ** Budget proposal
○ ○ ○ ○ ○ ○ ○ ○ ○ ○ ○ ○ ○ ○ ○ ○ ○ ○ ○ ○ ○ ○ ○ ○ ○ ○ ○ ○ ○ ○ ○ ○ ○ ○ ○ ○ ○ ○ ○ ○ ○ ○ ○ ○ ○ ○ ○ ○ ○ ○ ○ ○ ○ ○8
. . . . . . . . . . . . . . . . . . . . . . . . . . . . . . . . . . . . . . . . . . . . . . . . . . . . . . . .20 The Finnish Environment 676en
A decision by the Government in 1996 empowers the State to grant aid for thedevelopment and testing of activities that promote environmental protection andfor investment and remediation projects. In addition to the previously mentionedprojects on waste management, recycling, and the remediation of polluted landareas (cf. ‘Waste and packaging’), aid can be used to finance projects that will redu-ce the amount or the detrimental effects of emissions into the air or water, promotethe use of environmentally friendly products, develop new environmental techno-logy, improve the treatment of emissions, or promote prevention of noise, supervi-sion of chemicals or other environmental protection. The maximum amount of aidis 50% for a development or testing project, and 30% for an investment and reme-diation project. Grants are made by the regional environment centres and the Mi-nistry of the Environment.73 Grants of between EUR 4 and 6 million have beenmade annually.74
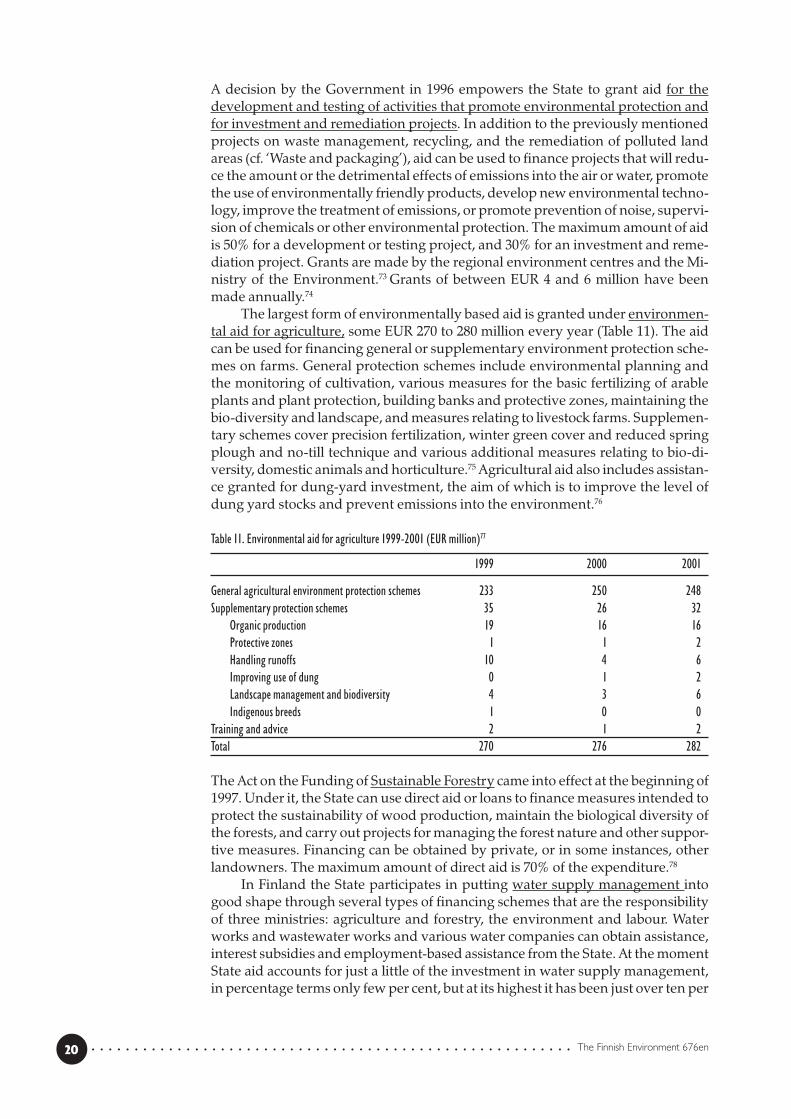
The largest form of environmentally based aid is granted under environmen-tal aid for agriculture, some EUR 270 to 280 million every year (Table 11). The aidcan be used for financing general or supplementary environment protection sche-mes on farms. General protection schemes include environmental planning andthe monitoring of cultivation, various measures for the basic fertilizing of arableplants and plant protection, building banks and protective zones, maintaining thebio-diversity and landscape, and measures relating to livestock farms. Supplemen-tary schemes cover precision fertilization, winter green cover and reduced springplough and no-till technique and various additional measures relating to bio-di-versity, domestic animals and horticulture.75 Agricultural aid also includes assistan-ce granted for dung-yard investment, the aim of which is to improve the level ofdung yard stocks and prevent emissions into the environment.76
Table 11. Environmental aid for agriculture 1999-2001 (EUR million)77
1999 2000 2001
General agricultural environment protection schemes 233 250 248Supplementary protection schemes 35 26 32
Organic production 19 16 16Protective zones 1 1 2Handling runoffs 10 4 6Improving use of dung 0 1 2Landscape management and biodiversity 4 3 6Indigenous breeds 1 0 0
Training and advice 2 1 2Total 270 276 282
The Act on the Funding of Sustainable Forestry came into effect at the beginning of1997. Under it, the State can use direct aid or loans to finance measures intended toprotect the sustainability of wood production, maintain the biological diversity ofthe forests, and carry out projects for managing the forest nature and other suppor-tive measures. Financing can be obtained by private, or in some instances, otherlandowners. The maximum amount of direct aid is 70% of the expenditure.78
In Finland the State participates in putting water supply management intogood shape through several types of financing schemes that are the responsibilityof three ministries: agriculture and forestry, the environment and labour. Waterworks and wastewater works and various water companies can obtain assistance,interest subsidies and employment-based assistance from the State. At the momentState aid accounts for just a little of the investment in water supply management,in percentage terms only few per cent, but at its highest it has been just over ten per
. . . . . . . . . . . . . . . . . . . . . . . . . . . . . . . . . . . . . . . . . . . . . . . . . . . . . . . . 21The Finnish Environment 676en
cent. Since 1990 it has been possible to grant water supply management assistanceto a property used for permanent residence and situated in a sparsely populatedarea. The maximum assistance is 30% of the approved expenditure.79
In the transport sector aid is given to public and light transport, preservingthe landscape and important natural areas when roads are being built, protectinggroundwater areas and the soil, noise prevention, the use of by-products and was-te materials in land and water construction, etc.80
Regional aid granted from EU structural funds may have objectives that sup-port environmental protection even though regional and social policy are theirmain objectives.
The State’s special financing company Finnvera can grant State guarantees ascollateral for credit given for the financing of corporate investment in the protecti-on of water and the atmosphere and in the recovery of waste. State guarantees andexport guarantees can also be granted for financing investment abroad that willbring a considerable improvement to the state of the Finnish environment. A gua-rantee can be used for compulsory and voluntary investment in environmentalprotection. An environmental guarantee can be given to all companies engaged inindustrial or comparable production activity. The lender can be a Finnish or foreignbank, insurance company or other financial institution. A guarantee can be givenfor the whole loan, or Finnvera and the financier can agree to share the risk at-tached to the loan.81
An environmental loan granted by Finnvera is meant for voluntary environ-mental investment by SMEs. The loan is conditional on the project being based onthe best available technology and the outcome being major positive impacts on theenvironment. Finnvera finances projects in which the positive environmental im-pacts are associated with raw materials or other tangible production input, themanufacture and energy consumption of a product, a reduction in emissions, theusage properties of products, the withdrawal of a product from use or an improve-ment in the work environment (e.g. noise, dust and particle emissions). The amountof the loan is 50-75% of the expenditure approved as eligible costs. Environmentalloans are special loans the interest on which is much lower than for Finnvera’snormal investment loans.82 Loans totalling EUR 20 million are granted annually.83
According to Section 36 of the Act on the Taxation of Business Profits, certainprocurements relating to environmental protection can be depreciated for taxationpurposes more quickly than usual. The Act applies to the procurement of structu-res, equipment, machines and other goods to prevent the pollution of waterwaysand the atmosphere. The maximum annual depreciation rate is 25%.84
. . . . . . . . . . . . . . . . . . . . . . . . . . . . . . . . . . . . . . . . . . . . . . . . . . . . . . . .22 The Finnish Environment 676en
Environmental insurance
At the beginning of 1999 the Act on Environmental Damage Insurance came intoeffect.85 On the basis of the Act compensation for environmental damage is grantedin a case where the operator causing the damage is unknown or is found to beinsolvent. The aim of environmental damage insurance is to ensure that compen-sation is awarded for the losses and for the prevention and remediation costs of theparty that has suffered the damage. The compensation system is financed by in-surance premiums. According to the Act, the premiums are obligatory for privatecorporations whose operations involve a material risk of environmental damage orwhose operations cause harm to the environment in general. This includes organi-zations whose activities require an environmental permit or a permit that the Safe-ty Technology Authority grants for handling or storing a dangerous chemical. Allcompensation coming under the Act on Environmental Damage Insurance is hand-led by the Environmental Insurance Centre.86
○ ○ ○ ○ ○ ○ ○ ○ ○ ○ ○ ○ ○ ○ ○ ○ ○ ○ ○ ○ ○ ○ ○ ○ ○ ○ ○ ○ ○ ○ ○ ○ ○ ○ ○ ○ ○ ○ ○ ○ ○ ○ ○ ○ ○ ○ ○ ○ ○ ○ ○ ○ ○ ○9
. . . . . . . . . . . . . . . . . . . . . . . . . . . . . . . . . . . . . . . . . . . . . . . . . . . . . . . . 23The Finnish Environment 676en
Impacts of economic policyinstruments
The aim of environmental and energy taxes is to have an impact on the amount ofa particular environmental hazard so that emissions or the consumption of naturalresources is reduced. Therefore, one of the most important criteria in assessing theimpact of the taxes is their effectiveness in terms of environmental protection i.e.how successful they have been in reducing environmental loading. Environmen-tal taxes affect not only the environment but also prices, employment, innovation,company prices, income distribution and administrative expenses.87 Below are re-search data about the impacts of some of the most important economic policy instru-ments being used in Finland.
The impacts of economic policy instruments have been assessed in Finlandmainly on the basis of theoretical economic models or interviews at companies be-fore the implementation of a certain tax or measure. The assessments have con-centrated principally on energy and climate policy, and the emphasis has been onevaluating the reduction in emissions and the overall economic impacts. However,research on the impacts of economic policy instruments that is based on empiricalresearch data and done after the introduction of a certain instrument is sparse inFinland,88 even though the rapid changes in energy policy in the 1990s would havemade this kind of research possible (e.g. the introduction a carbon dioxide tax andits partial abolition).89 Because of the paucity or lack of Finnish empirical researchdata, the following examines both Finnish and foreign research into the impacts ofeconomic policy instruments.
10.1 Energy taxesEnergy taxes are an important form of taxation both in terms of revenue and theirpossible environmental effects. They also have potential impacts on income distri-bution and macroeconomic factors such as employment. For this reason there is agreat deal of international and some Finnish research data about the effects of energytaxes.
International studies
The impacts of energy taxes on the behaviour of companies and households aremuch more limited in the short term than in the long term, because in the longterm economic players can invest and divert a production structure or form of li-ving towards energy saving. OECD studies have shown that price elasticity in thedemand for aggregate energy has been quite small in the short term, between -0.13and -0.26.90 This means that big changes in the level of taxation do not change thebehaviour of households and companies in the short term. In the long term thedemand for aggregate energy is considered to be slightly more elastic (according toOECD studies between -0.37 and -0.46).91 Several studies show that the demand forelectricity reacts more to price changes than the demand for other forms of ener-gy.92 The price elasticity of traffic fuels is quite small in the short term, some estima-tes putting the figure at between –0.15 and -0.38, whereas in the long term it has
○ ○ ○ ○ ○ ○ ○ ○ ○ ○ ○ ○ ○ ○ ○ ○ ○ ○ ○ ○ ○ ○ ○ ○ ○ ○ ○ ○ ○ ○ ○ ○ ○ ○ ○ ○ ○ ○ ○ ○ ○ ○ ○ ○ ○ ○ ○ ○10
. . . . . . . . . . . . . . . . . . . . . . . . . . . . . . . . . . . . . . . . . . . . . . . . . . . . . . . .24 The Finnish Environment 676en
been estimated to be much greater.93 It has also been seen that consumer demandfor traffic fuels is also closely linked with income level i.e. the income elasticity ofdemand is big for traffic fuels. A higher income level raises the number of cars andtheir size, and thus increases the demand for fuels.
It has been all but impossible to establish the harmful aggregate economic andcompetitive effects of energy taxes in retrospective empirical assessments, eventhough advance assessments of taxes have often shown big influences with regardto these variables. The reason is probably not only the still relatively low level oftaxes but also the fact that in all countries industry, which uses a great deal of ener-gy, has received so many tax deductions and refunds that it has not been possiblefor competitiveness to be affected. Conversely, the effectiveness of economic policyinstruments has been reduced.94
Some of the research data on the income-distribution impacts of energy taxesare contradictory. Some studies show that the income distribution impacts are reg-ressive,95 even if the regressiveness has been quite small in most instances. Resultsof empiric research show that energy taxation has been regressive in countries suchas Denmark and the United Kingdom, whereas in Germany and Italy the effectshave been progressive.96 In practice, the regressiveness of a tax depends to a consi-derable extent not only on the structure of the economy and taxation but also onhow the tax revenue is used. Different forms of energy taxes differ in terms of reg-ressiveness: fuel taxes on transport are often directed less to lower-income groupsin relative terms than, say, energy taxes on dwelling.
The revenue from energy taxes is generally high and some of the taxes arerelatively simple to administer (e.g. fuel taxes), so the administrative expenses arenot usually high in relation to the revenue received. In Denmark it has been esti-mated that the administrative costs of the carbon dioxide tax are 1 to 2% of therevenue received from the companies on whom tax is imposed.97
Finnish studies
A retrospective assessment made by the Economic Council in 2000 showed thatFinland’s CO2 emissions would have been 4 million tonnes i.e. 7% higher in 1998had the energy taxes been kept at the 1990 level. It was estimated that 50 per cent ofthis reduction (2 million tonnes) resulted from changes in the end use of the ener-gy i.e. from the reduced consumption of traffic fuels and restructuring by industryand the associated lowering in demand. The effect of both factors was put at about1 million tonnes. The other 50 per cent of the reduction was estimated to havecome from converting to fuels with less carbon dioxide in the production of electri-city and heating.98
Honkatukia99 has estimated by means of a general equilibrium model in hisadvance assessment that a doubling of the surtax on fuel tax would reduce carbondioxide emissions by 4% by 2010 compared with the baseline scenario. If the surtaxon the electricity tax were to be raised to a level corresponding to the fuel tax, emis-sions would fall by slightly more than 5%. The main negative effects at the indust-rial sector level would be seen in the form of a reduction in exports and productionby energy-intensive sectors. The negative impacts could be alleviated to some ex-tent by refunding the increased tax proceeds through reduced income taxes or so-cial security payments.
Riihelä100 has estimated the price elasticities of certain goods on the basis ofstatistics on consumer behaviour by households 1966-1985. The price elasticity forenergy reached in the study was –0.36. In an earlier study101 the price elasticity forthe energy consumed in dwelling was –0.17.
. . . . . . . . . . . . . . . . . . . . . . . . . . . . . . . . . . . . . . . . . . . . . . . . . . . . . . . . 25The Finnish Environment 676en
Riihelä’s study also assessed the income-distribution effects of increasing thetaxation on energy. The effect was perceived to be regressive.102 Honkatukia’s ad-vance assessment came up with similar results.103 The study showed that increa-sing the carbon dioxide tax by FIM 100 per tonne of carbon dioxide would fall mostheavily in relative terms on low-income households. For the lowest-income classan increase in taxation would raise expenses by about two per cent in relation todisposable income, whereas for the upper income brackets the growth in expenseswould be about one per cent of disposable income. The reason for this is that small-income households spend more of their income on consumption that includes car-bon dioxide. One result of the study was that raising the level of taxation on carbondioxide would increase regional income differences in such a way that sparselypopulated areas would suffer more in relative terms. An advance assessment of theeconomic impacts carried out in conjunction with the preparation of the nationalclimate programme did not give such clear indications about regressive effects; in-come-distribution effects were thought to depend to a considerable extent on thetype of residence of a household, the form of heating and the ownership of a car.104
10.2 Taxation of vehiclesAccording to a study carried out by the EU Commission, the price elasticity in thedemand for private vehicles is –0.1. In the long term, too, the price elasticity inrelation to the number of kilometres driven is quite limited, between –0.1 and -0.4.All in all, the price elasticities in owning and using a car have been found to bequite small.105
In Sweden and Germany, however, reforms to car taxation have had an effecton the proportion of low-emission cars out of the total motor vehicle population.For example, in Sweden making the registration fees for cars dependent on emissi-ons increased the proportion of the two lowest-emission car categories out of thetotal registrations from 16 to 75 per cent. The change is thought to have come prin-cipally from the information effects of the tax and not the changes in the prices ofthe cars.106 On the other hand, some studies have results showing that informationabout the environmental characteristics of cars do not have significant effects onpeople’s buying decisions.107
A study carried out in California in the United States shows that changing carregistration fees from the present system, in which the tax depends on the car’svalue, into one where they are dependent on the car’s emission would have reg-ressive income-distribution effects.108 Studies have shown, however, that the cartax in Denmark is progressive and was originally justified as being a luxury tax.109
Of course, the tax structure has a considerable impact on what its income-distri-bution effects are.
10.3 Waste taxesA survey that evaluated the policy instruments for Finland’s waste policy showedthat the waste tax has helped to increase the recovery of municipal waste, eventhough it has not affected total waste volumes. At the same time the sorting ofconstruction waste has clearly increased since the waste tax was introduced.110 Thewaste tax has also achieved positive results in Denmark: it is thought to have redu-ced the amount of waste taken to municipal landfills by 26% during the period1987-1996 and the amount of waste taken to private landfills by 39% during theperiod 1990-1996. Construction waste is estimated to have fallen by 63%, house-hold waste by 16% and commercial and industrial waste by 8% from 1987 to 1996.
. . . . . . . . . . . . . . . . . . . . . . . . . . . . . . . . . . . . . . . . . . . . . . . . . . . . . . . .26 The Finnish Environment 676en
The authors of the study did point out, however, that other policy instruments inthe waste policy could have had a positive effect as well. The environmental im-pacts of waste taxes area also dependent on their structure. In the United King-dom, for example, the amount of household waste taken to municipal landfills hasincreased in spite of the waste tax, because the tax does not affect households di-rectly, and so there are no incentives for them to reduce the amount of waste.111
10.4 Environmentally based subsidiesA study carried out by Alanen et al.112 shows that the proportion of environmentalsubsidies granted by the State of Finland in relation to industrial subsidies is only 1to 2%, and the grants cannot be looked on as significant factors in guiding produc-tion, product development and consumption.
Allocating environmentally based subsidies so that incentives are created forcost-efficient and effective investment in the environment can be difficult. In orderto be able to allocate subsidies correctly, management information about environ-ment-friendly production methods should be updated constantly. Otherwise the-re is a risk that the subsidies will in fact put a brake on technological development,not further it. Another problem with subsidies is how it will be possible to ensurethe implementation of the ‘polluter pays’ principle and at the same time supportinvestment in the environment by companies.113
Little research has been done in Finland into the incentive effects of subsidiesrelating to environmental protection. Studies on environmental assistance for agri-culture have shown that washing nutrients into the waterways is dropping lessthan expected.114 A report by the State Audit Office has assessed that there havebeen deficiencies and unclear points in the implementation of grants to promoteenvironmental protection, which has increased the risk of decisions about assistan-ce that are inappropriate and contrary to the rules. It has not been possible to assessthe effectiveness of projects, because there has been no national data system that issuited to depicting the results.115
. . . . . . . . . . . . . . . . . . . . . . . . . . . . . . . . . . . . . . . . . . . . . . . . . . . . . . . . 27The Finnish Environment 676en
Discussion
The primary criterion in deciding the level of environmental taxes in the Finnish taxsystem has not generally been the estimated effect of the taxes on activities harmful tothe environment but the certain amount of tax revenue accumulating to the State. Inthis sense environmental taxes in Finland have not been incentive-based in terms ofthe primary objective. This does not mean that the taxes do not have positive effects onthe incentives for companies and consumers in terms of the environment.
Taxes on liquid fuels in Finland are quite high compared with other OECDcountries, which reduces the incentive to purchase and run a car. In the future,however, using tax increases on liquid fuels as an environmental policy instrumentwill be difficult, because the starting level of the tax is high and there will be regio-nal and income-distribution policy problems with the increases. Moreover, issuesrelating to prices of liquid fuels are politically sensitive, as was shown by the de-monstrations over the rise in world market prices for fuels in various parts of Euro-pe in the autumn of 2000.
The incentive effect of energy taxation on Finnish industry is reduced notonly by their low level compared with the rest of western Europe,116 but also by thefact that, once they exceed a certain limit denominated in euro, companies that usea great deal of energy are refunded the energy taxes they have paid. In practice thismeans that if companies’ energy consumption exceeds a certain amount, their in-centives to lower it are reduced, even though it might be possible to find ways ofsaving energy. This so-called ‘tax cutter’ has resulted in a situation where raisingenergy taxes would mainly have an impact on operators other than the most ener-gy-intensive industry, which has exceeded or is very near the tax-refund limit. Thelowest limit is such that tax refunds for energy-intensive industry are applicableonly to the fairly big companies, which can be considered a problem in terms offairness. Industry’s electricity taxation class, which is lower than that of house-holds and services, also reduces the incentive for industry to save energy.
Another problem with the incentive effects of energy taxes is that the electrici-ty tax is not directly dependent on the size of the environmental harm caused bythe activity that is being taxed. Before the tax reform of 1997 energy taxes focuseddirectly on the carbon dioxide in the energy and the energy content, so that a highertax had to be paid for energy produced with sources that contained more carbondioxide. This gave producers and consumers the right price signals. In 1997 thetaxation was changed: now electricity consumption was to be taxed, not producti-on. The present electricity tax is the same for all forms of energy production re-gardless of how much carbon dioxide the energy source contains, except for subsi-dies. Thus at the moment there is little in the taxation of electricity that would en-courage the choosing of forms of energy that contain less carbon dioxide.
The high tax on motor vehicles, especially the car tax but also the annual ve-hicle tax, in itself lowers the incentive to purchase a car, but the taxes involved inpurchasing a car do not include features that lead to better solutions for the envi-ronment. The national climate strategy plans to change the annual vehicle tax sothat it would be dependent on fuel consumption instead of the car’s year of re-gistration. The high car tax has caused the motor vehicle population in Finland tobe old compared with the rest of Europe.
○ ○ ○ ○ ○ ○ ○ ○ ○ ○ ○ ○ ○ ○ ○ ○ ○ ○ ○ ○ ○ ○ ○ ○ ○ ○ ○ ○ ○ ○ ○ ○ ○ ○ ○ ○ ○ ○ ○ ○ ○ ○ ○ ○ ○ ○ ○ ○ 11
. . . . . . . . . . . . . . . . . . . . . . . . . . . . . . . . . . . . . . . . . . . . . . . . . . . . . . . .28 The Finnish Environment 676en
Of the economic policy instruments for waste, the packaging tax in particularhas been effective, since almost all the packaging used for soft drinks in Finland isrecycled. One problem in terms of the incentive effects of the waste tax has been itslow level - it forms such a small part of the expenses of the parties paying it that it hasno marked incentive effect. After the increases that came into effect at the beginningof 2003, the tax level has, however, gone up considerably. Under present legislation,however, waste tax is not levied at all on landfills maintained by industry, so it is notpossible to affect the biggest volumes of waste generated by industry. Furthermore ithas been shown that in its present form the tax distorts the competitive position ofpublic waste management compared with that in the private sector.
In many instances a problem with economic environmental policy instrumentsand more generally with policies that further sustainable development is that theyendeavour to promote many objectives at the same time. Problems arise when theobjectives are contradictory. This is the general situation when the aim is at thesame time to increase the incentive effect of economic policy instruments and, onthe other hand, to show concern for companies’ international competitiveness. Fin-land is a small, open economy in which industry has traditionally been very ener-gy-intensive – even if the situation has changed somewhat with the coming of Nokiaand other information and communications technology companies. Particularlywhen energy taxes have been increased, the competitiveness of Finnish companieshas been considered so important that the tax burden has been directed towardshouseholds and the service industry, while attempts have been made to protectindustry’s competitiveness with different aid schemes and a lower price for electri-city. As a result, the incentives created for industry by energy taxation remain limi-ted, and the economic policy instruments are not effective.
In addition to competitiveness objectives, regional and income-distributiontargets are often in conflict with the effective application of energy and environ-mental taxes. A typical example is the deduction for travelling expenses, under whichexpenses for long journeys to work can be deducted for tax purposes. This right isaccelerating the fragmentation of the urban structure and increasing traffic, whichis adding not only to health hazards but also acidification, the disappearance ofbiodiversity and the greenhouse gas phenomenon. The necessity to treat this rightas a tax deduction, however, is justified on employment and regional policy grounds.
To sum up, there are many economic policy instruments being used in theenvironmental policy in Finland, but their effectiveness is being lessened by thelow level of taxation, weak linkage between the taxes and the environmental ha-zards that are to be reduced, the diverse and often contradictory objectives of sub-sidy and tax policies, and the various exemptions granted for reasons of competiti-veness. The challenge in developing economic policy instruments is to make themmore incentive-based and to increase the precision with which they are allocatedwithout making the system excessively complicated and difficult to implement.
. . . . . . . . . . . . . . . . . . . . . . . . . . . . . . . . . . . . . . . . . . . . . . . . . . . . . . . . 29The Finnish Environment 676en
1 Määttä 1999, p.242 The aim of incentive-based environmental tax is primarily to affect the behaviour of polluters so thatthey reduce the amount of pollution. The level of tax should therefore be set so that environmentalpolicy aims can be met. (Määttä 1999, p.59)3 The primary aim of fiscal environmental taxes is to bring in tax revenue for the Government (Määttä1999, p.111). Fiscal taxes include fuel taxes and vehicle taxes.4 Environmental charges are used to pay for costs caused by certain activities, or to fund environmentalprotection. Environmental charges comprise wastewater charges, waste management fees, waste oilcharges and oil protection charges.5 A deposit is a fee that is included in the price of the product to be bought, which the purchaser getsback on returning the used product or package.6 Statistics Finland, http://www.tilastokeskus.fi/tk/yr/yeympverot.html September 7, 2001. When defi-ning environmental taxes it is assumed that the tax must be aimed at a measured physical variable thatis considered to have a detrimental effect on the environment.7 OECD, http://www.oecd.org/env/tax-database, February 14, 20038 OECD, http://www.oecd.org/env/tax-database, February 14, 20039 Statistics Finland 2002, p.810 Statistics Finland, http://www.tilastokeskus.fi/tk/yr/yeympverot.html, February 14, 200311 Statistics Finland, http://www.tilastokeskus.fi/tk/yr/yeympverot2.html, February 14, 200312 Statistics Finland 200213 Temporary Act Amending the Act on Fuel Tax (1119/1989)14 Government proposal (89/1993)15 Government proposal (237/1994)16 Government proposal (225/1996)17 The Act on Excise Duty of Certain Energy Sources (1473/1994); Act on Excise Duty on Liquid Fuels(1472/1994)18 Government proposal (225/1996). The Act on Excise Duty on Electricity and Certain Fuels (1260/1996)19 Government proposal (130/2002); Act Amending the Act on Excise Duty on Electricity and CertainFuels (1168/2002)20 Act Amending the Act on Excise Duty on Electricity and Certain Fuels (1168/2002); Act Amending theAct on Excise Duty on Liquid Fuels (1169/2002)21 Statistics Finland 2000, p.11922 Statistics Finland 200223 Act on Excise Duty on Electricity and Certain Fuels (1260/1996); Act Amending the Act Excise Duty onElectricity and Certain Fuels (1168/2002)24 Ibid.25 Petri Malinen, Ministry of Finance, written communication October 5, 200126 According to Statistics Finland, the industrial consumption of electricity in 1999 was 42,183 GWh(Statistics Finland 2000, p.81), from which it is possible to calculate the amount of industrial electricitytax as FIM 1,055 million.27 Petri Malinen, Ministry of Finance, written communication August 25, 200328 Decree on the State Nuclear Waste Management Fund (162/1988)29 Economic Council of Finland 2000, p.4530 Report on the state of Government Finances 200231 Security of Supply Act (1390/1992)32 Ministry of Finance, http://www.vn.fi/vm/verotus/tullit/tulliverotus.htm, strategic stockpile fee, July4, 200133 Report on the state of Government Finances 200234 Act Amending the Act on Excise Duty on Electricity and Certain Fuels (1168/2002); Act Amending theAct on Excise Duty on Liquid Fuels (1169/2002)35 Act on the Oil Pollution Compensation Fund (379/1974); Act Temporarily Amending sections 2 and 3of the Act on the Oil Pollution Compensation Fund (1012/2002)
Notes
. . . . . . . . . . . . . . . . . . . . . . . . . . . . . . . . . . . . . . . . . . . . . . . . . . . . . . . .30 The Finnish Environment 676en
36 Report on the state of Government Finances 200237 Government Decree on the General Conditions of Granting Energy Aid (625/2002)38 Statistics Finland 2002, p.1039 Car Tax Act (1482/1994). Act Amending the Car Tax Act (266/2003)40 Report on the state of Government Finances 200241 Act on Vehicle Tax (1111/1996)42 Report on the state of Government Finances 200243 Act on Tax on Specific Motor Vehicles (722/1966)44 Report on the state of Government Finances 200245 Act Amending the Act on Tax on Specific Motor Vehicles (1161/1998)46 Waste Tax Act (495/1996); Act Amending section 4 of the Waste Tax Act (1066/2002)47 Report on the state of Government Finances 200248 Waste Act (1072/1993)49 Kautto et al. 2000, p.4750 Waste Act (1072/1993)51 Kautto et al. 2000, p.5152 The Association of Finnish Local and Regional Authorities, http://www.kuntaliitto.fi/yhdysk/kotijate.htm, August 20, 200353 Act on Waste Oil Charge (894/1986); Act Amending section 4 of the Act on Waste Oil Charge (924/2001)54 Report on the state of Government Finances 200255 Act on Excise Duty on Alcohol and Alcoholic Beverages (1471/1994); Act on Excise Duty on Sweets andSoft Drinks (1474/1994); Act Amending the Act on Excise Duty on Soft Drinks (920/2001). Act Amendingthe Act on Excise Duty on Alcohol and Alcoholic Beverages (921/2001)56 The Association of Finnish Local and Regional Authorities, http://www.kuntaliitto.fi/yhdysk/01ys00.htm, October 20, 200157 Government Decision on the General Terms Applying to Grants For the Promotion of EnvironmentalProtection (894/1996)58 Ministry of the Environment, 1998, p.9659 Act Amending the Act on State Guarantees to the Industry for Investments in Environmental Protec-tion (636/1991)60 Economic Council of Finland 2000, p.4461 Finnish Environment Institute, http://www.ymparisto.fi/default.asp?node 4824&lan=fi (June 30, 2004).62 Finnish Environment Institute, http://www.ymparisto.fi/default.asp?node 4824&lan=fi (June 30, 2004).63 Water Act (264/1961)64 Ministry of Agriculture and Forestry, http://www.mmm.fi/kalastus/luvat/, August 20, 200365 Report on the state of Government Finances 200266 Government Decree on Game Management Fee and Hunting Licence Fee (823/2001)67 Act on Game Management Fee and Hunting Licence Fee (616/1993)68 Report on the state of Government Finances 200269 Act Amending Section 7 of the Pesticides Act (1031/1997)70 Risto Saarinen, Ministry of Transport and Communications, oral communication, July 4, 200171 Economic Council of Finland 2000, p.4672 Statistics Finland 200273 Government Decision on the General Terms Applying to Grants For the Promotion of EnvironmentalProtection (894/1996)74 State Audit Office, 200275 Government Decision on Agri-environmental Aid (760/1995)76 Ministry of Agriculture and Forestry 200077 Statistics Finland 200278 Act on the Funding of Sustainable Forestry (1094/1996)79 Finnish Environment Institute, http://www.ymparisto.fi/default.asp?node=569&lan=fi#a2, (June 30,2004); Act on Assistance for the Community Water Supply Measures (56/1980)80 Ministry of Transport and Communications 199981 Finnvera, http://www.finnvera.fi, July 5, 2001
. . . . . . . . . . . . . . . . . . . . . . . . . . . . . . . . . . . . . . . . . . . . . . . . . . . . . . . . 31The Finnish Environment 676en
82 Finnvera, http://www.finnvera.fi, July 5, 200183 Jari Pirinen, Finnvera oral communication, Finnvera, July 25, 200184 Act on the Taxation of Business Income (846/1980)85 Act on Environmental Damage Insurance (81/1998)86 Environmental Insurance Centre, http://www.vakes.fi/yvk/, July 5, 200187 In this context the fiscal impacts of the taxes are not considered as they have been dealt with earlier.88 Internationally, too, the number of ex post evaluations in environmental policy is insufficient, whichis highlighted, for example, in OECD reports.89 E.g. Andersen et al. 200190 Price elasticity tells how much a rise in the price of a commodity will reduce its demand. For example,price elasticity of -0.13 means that a 1% rise in the price of a commodity would reduce demand of theproduct by 0.13%.91 OECD 2001, p.10092 OECD 2000, p.1293 Ibid., p.1494 E.g. Ecotec 2001; OECD 200195 Regressiveness means that the measure worsens the position of low-paid workers proportionallymore than the position of those on a large salary.96 OECD 2001, p.8797 OECD 2001, p.9298 Economic Council of Finland 200099 Economic Council of Finland 2000, appendix 1100 Riihelä 1996, p.48101 Riihelä & Sullström 1993102 Riihelä 1996, p.50103 Economic Council of Finland 2000, appendix 2104 Kemppi etc. 2001, p.51105 OECD 2001, p.102106 Ibid., p.104107 Helsingin Sanomat, June 5, 2002108 OECD 2001, p.88109 Määttä 1999, p.142110 Yli-Kauppila et al. 2000, pp.78-79111 OECD 2001, pp.107-108112 Alanen et al., 1995, pp.201-203113 OECD 2001, p.45114 Palva etc. 2001, http://www.ymparisto.fi/download.asp?contentid=18807&lan=fi,(June 30, 2004)115 State Audit Office 2002116 Economic Council of Finland 2000, p.7
. . . . . . . . . . . . . . . . . . . . . . . . . . . . . . . . . . . . . . . . . . . . . . . . . . . . . . . .32 The Finnish Environment 676en
Alanen, J. & Marttinen, K. & Saastamoinen, S. 1995. Sisämarkkinat ja ympäristö (Internal markets and the environ-ment, in Finnish). Kauppa- ja teollisuusministeriön tutkimuksia ja raportteja 125/1995.Ministry of Trade andIndustry, Helsinki.
Andersen, M.S. & Dengsoe, N. & Pedersen, A.B. 2001. An Evaluation of the Impact of Green Taxes in the NordicCountries. TemaNord 2001:566. Nordic Council of Ministers, Copenhagen.
Economic Council of Finland 2000. Ympäristö- ja energiaverotuksen käyttö Suomessa. (Use of environmental andenergy taxes in Finland, in Finnish) Työryhmäraportti. Valtioneuvoston kanslian julkaisusarja 2000/3. PrimeMinister ’s Office, Helsinki.
Ecotec. 2001. Study on the Economic and Environmental Implications of the Use of Environmental Taxes and Chargesin the European Union and its Member States. Executive Summary.
Energiaverotuksen tarkistustyöryhmä 2001. Valtiovarainministeriön työryhmämuistioita 16/2001. Ministry of Finance,Helsinki.
Helsingin Sanomat, 5.6.2002. Ympäristöseikoilla ei merkitystä autokaupassa. (Environmental issues do not affect carsales, in Finnish).
Kautto, P. & Melanen, M. & Saarikoski, H. & Ilomäki, M. & Ylikauppila, H. 2000. Suomen jätepolitiikan ohjauskeinot –vaikutukset, vaikuttavuus ja kehittämistarpeet. (Policy instruments of Finnish waste policy, in Finnish) the Fin-nish Environment 430. Finnish Environment Institute, Helsinki.
Kemppi, H. & Perrels, A. & Lehtilä, A. 2001. Suomen kansallisen ilmasto-ohjelman taloudelliset vaikutukset. (The eco-nomic effects of the Finnish climate-programme, in Finnish) VATT-research reports 75. Government Institutefor Economic Research, Helsinki.
Määttä, K. 1999. Taloudellinen ohjaus ympäristönsuojelussa. (Economic environmental policy instruments, in Fin-nish). Helsinki University Press, Helsinki.
Ministry of Agriculture and Forestry 2000. Ympäristötukiopas (Guide to environmental subsidies, in Finnish). Mi-nistry of Agriculture and Forestry, Helsinki.
Ministry of the Environment 1998. Valtakunnallinen jätesuunnitelma vuoteen 2005 (the National waste plan 2005, inFinnish). The Finnish Environment 260. Finnish environment institute, Helsinki.
Ministry of Trade and Industry 2001. Energiakatsaus 4/2000 (Energy review, in Finnish), Helsinki.Ministry of Transport and Communications 1999. Liikenteen toimintalinjat ympäristökysymyksissä. (Environmental
principles of transport, in Finnish). Ministry of Transport and Communications, Helsinki.OECD. 2000. Behavioral Responses to Environmentally-related taxes. Paris, France-OECD. 2001. Environmentally Related Taxes in OECD Countries. Issues and Strategies. Paris, France.Report on the state of Government Finances 2002. The State Treasury. Helsinki.Riihelä, M. 1996. Energiapanosten verotuksen vaikutus kotitalouksien välillisen energian kulutukseen ja hyvinvoin-
tiin. (Effects of energy input taxes on the indirect energy use and welfare of households, in Finnish). VATT-re-search reports 37. Government Institute for Economic Research, Helsinki.
Riihelä, M. & Sullström R. 1993. Kotitalouksien kysyntäkäyttäytyminen Suomessa. Poikki- ja aikasarja-aineistoon pe-rustuva ekonometrinen analyysi. (Demand behaviour of households, in Finnish). Helsingin yliopiston kansan-taloustieteen laitoksen tutkimuksia. University of Helsinki, Department of Economics, Helsinki.
State Audit Office 2002. Ympäristönsuojelun edistämisavustukset. (Environmental subsidies, in Finnish) Tarkastusker-tomus 20/2002. State Audit Office, Helsinki.
Statistics Finland 2000. Energiatilastot 1999 (Energy statistics, in Finnish). Energia 2000:2. Statistics Finland, Helsinki.Statistics Finland 2002. Finland´s natural resouras and the environment 2002. Ympäristö ja luonnonvarat 2002:4. Statis-
tics Finland, Helsinki.Yli-Kauppila, H. & Nevalainen, J. & Kautto, P. & Melanen, M. & Leino, T. & Korhonen, K. 2000. Jätepoliittinen ohjaus ja
jätehuollon alueellinen kehitys 1990-luvulla – tapaustarkasteluina Keski-Suomi ja Pirkanmaa. (Waste policyand the development of regional waste management in the 1990s, in Finnish). Regional Environmental Publi-cations 161. Pirkanmaa and Central Finland Regional Environment Centre, Helsinki.
Oral communications:Malinen, Petri. Ministry of Finance, 5.6.2002Saarinen, Risto. Ministry of transport and communications 4.7.2001
Written communications:
Malinen, Petri. Ministry of Finance, 5.10.2001 and 25.8.2003Pirinen, Jari. Finnvera 25.7.2001Statistics Finland, 8.3.2002
References
Publisher
Author(s)
Title of publication
Parts of publication/other projectpublicationsAbstract
Keywords
Publication seriesand number
Theme of publicationProject name andnumber, if any
Financier/commissioner
Project organization
ISSN ISBN
No. of pages Language
Restrictions Price
For sale at/distributor
Financierof publicationPrinting place and year
Date
33The Finnish Environment 676en ○ ○ ○ ○ ○ ○ ○ ○ ○ ○ ○ ○ ○ ○ ○ ○ ○ ○ ○ ○ ○ ○ ○ ○ ○ ○ ○ ○ ○ ○ ○ ○ ○ ○ ○ ○ ○ ○ ○ ○ ○ ○ ○ ○ ○ ○
1238-7312
35 English
Public
Documentation page
952-11-1728-1 952-11-1729-X (PDF)
Finnish Environment Institute (SYKE) May 2004
Marjukka Hiltunen
The Finnish Environment 676en
Environmental policy
Finnish Environment Institute, P.O.Box 140, FIN-00251 Helsinki, Finland
This publication is also available in the Internetwww.environment.fi/publications
Environmental economics, taxes, charges
The report provides an overview of economic environmental policy instruments in Finland. Theinstruments include incentive based and fiscal environmental taxes, environmental charges anddeposits as well as subsidies and insurances. Systems based on producer responsibilities havenot been examined although their effects are similar to those of economic policy instruments.The overview shows that the use of economic policy instruments in Finland differs to some ex-tent from the average use in OECD countries. For example taxes of fuels and motor vehicles arehigh in comparison, whereas the energy taxes of industries are relatively low. The main challen-ge in developing economic environmental policy instruments is to increase the positive incenti-ves and to improve the environmental focus without making the systems inflexible and costly.
Economic environmental policy instruments in Finland
Ministry of the Environment
Edita Publishig Ltd., P.O. Box 800, FIN-00043 Edita Finland, Phone +358 20 450 00Mail orders: Phone +358 20 450 05, telefax +358 20 450 2380Internet: www.edita.fi/netmarket
Edita Prima Ltd, Helsinki 2004
6 e
34 The Finnish Environment 676en○ ○ ○ ○ ○ ○ ○ ○ ○ ○ ○ ○ ○ ○ ○ ○ ○ ○ ○ ○ ○ ○ ○ ○ ○ ○ ○ ○ ○ ○ ○ ○ ○ ○ ○ ○ ○ ○ ○ ○ ○ ○ ○ ○ ○ ○
JulkaisuaikaJulkaisija
Tekijä(t)
Julkaisun nimi
Julkaisun osat/muut saman projektintuottamat julkaisutTiivistelmä
Asiasanat
Julkaisusarjan nimija numero
Julkaisun teemaProjektihankkeen nimija projektinumero
Rahoittaja/toimeksiantaja
Projektiryhmäänkuuluvat organisaatiot
ISSN ISBN
Sivuja Kieli
Luottamuksellisuus Hinta
Julkaisun myynti/jakaja
Julkaisun kustantajaPainopaikka ja -aika
Ympäristöpolitiikka
1238-7312 952-11-1728-1 952-11-1729-X (PDF)
Englanti
Julkinen
Suomen ympäristökeskus, PL 140, 00251 Helsinki
Kuvailulehti
Suomen ympäristökeskus (SYKE) Toukokuu 2004
Marjukka Hiltunen
Suomen ympäristö 676en
Julkaisu on saatavana myös internetistäwww.environment.fi/publications
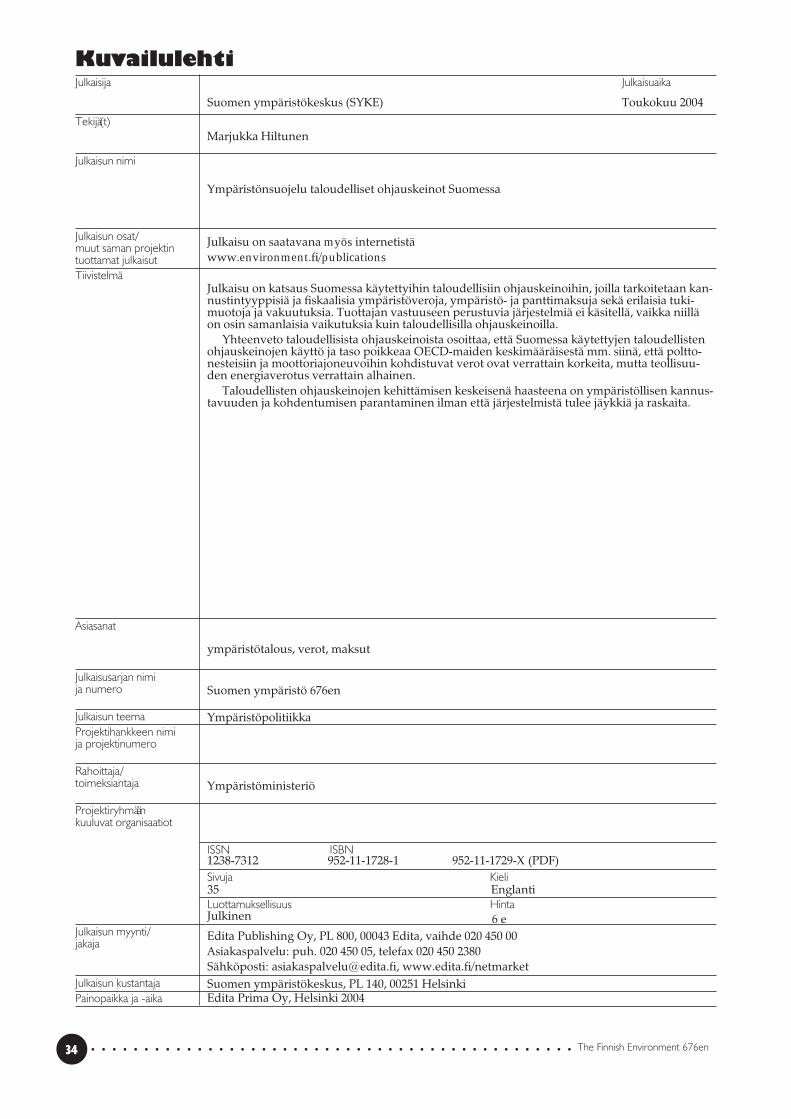
Julkaisu on katsaus Suomessa käytettyihin taloudellisiin ohjauskeinoihin, joilla tarkoitetaan kan-nustintyyppisiä ja fiskaalisia ympäristöveroja, ympäristö- ja panttimaksuja sekä erilaisia tuki-muotoja ja vakuutuksia. Tuottajan vastuuseen perustuvia järjestelmiä ei käsitellä, vaikka niilläon osin samanlaisia vaikutuksia kuin taloudellisilla ohjauskeinoilla.
Yhteenveto taloudellisista ohjauskeinoista osoittaa, että Suomessa käytettyjen taloudellistenohjauskeinojen käyttö ja taso poikkeaa OECD-maiden keskimääräisestä mm. siinä, että poltto-nesteisiin ja moottoriajoneuvoihin kohdistuvat verot ovat verrattain korkeita, mutta teollisuu-den energiaverotus verrattain alhainen.
Taloudellisten ohjauskeinojen kehittämisen keskeisenä haasteena on ympäristöllisen kannus-tavuuden ja kohdentumisen parantaminen ilman että järjestelmistä tulee jäykkiä ja raskaita.
Ympäristönsuojelu taloudelliset ohjauskeinot Suomessa
ympäristötalous, verot, maksut
Ympäristöministeriö
35
Edita Publishing Oy, PL 800, 00043 Edita, vaihde 020 450 00Asiakaspalvelu: puh. 020 450 05, telefax 020 450 2380Sähköposti: [email protected], www.edita.fi/netmarket
Edita Prima Oy, Helsinki 2004
6 e
DatumUtgivare
Författare
Publikationens titel
Publikationens delar/andra publikationerinom samma projektSammandrag
Nyckelord
Publikationsserieoch nummer
Publikationens temaProjektets namnoch nummer
Finansiär/uppdragsgivare
Organisationeri projektgruppen
ISSN ISBN
Sidantal Språk
Offentlighet Pris
Beställningar/districution
FörläggareTryckeri/tryckningsort och -år
35The Finnish Environment 676en ○ ○ ○ ○ ○ ○ ○ ○ ○ ○ ○ ○ ○ ○ ○ ○ ○ ○ ○ ○ ○ ○ ○ ○ ○ ○ ○ ○ ○ ○ ○ ○ ○ ○ ○ ○ ○ ○ ○ ○ ○ ○ ○ ○ ○ ○
Miljöpolitik
1238-7312
35 Engelska
Offentlig
Finlands miljöcentral, PB 140, FIN-00251 Helsingfors, Finland
Presentationsblad
952-11-1728-1 952-11-1729-X (PDF)
Finlands miljöcentral (SYKE) Maj 2004
Marjukka Hiltunen
Miljö i Finland 676en
Publikationen finns tillgänglig också på internetwww.environment.fi/publications
Rapporten ger en översikt av miljöekonomiska styrmedel i Finland. I dessa ingår miljöskattersom motiverats med miljöhänsyn eller införts av fiskala skäl, miljöavgifter och pantavgifter samtstöd och försäkringar. Översikten visar att användningen av ekonomiska styrmedel skiljer sig ivissa avseenden från den genomsnittliga användningen i OECD länderna. Till exempel är bes-kattningen av bilar och bränslen högre, medan industrins energiskatter är lägre än genomsnitteti OECD. Den huvudsakliga utmaningen för utvecklandet av miljöpolitiska ekonomiska styrme-del är att öka de positiva incentiven och förbättra fokuseringen på miljöeffekter utan att görainstrumenten styva och tungrodda.
Miljöpolitiksens ekonomiska styrmedel i Finland
miljöekonomi, skatter, avgifter
Miljöministeriet
Edita Prima Ab, Helsinki 2004
Edita Publishing Ab, PB 800, FIN-00043 Edita, Finland, växel 020 450 00Postförsäljningen: Telefon +358 20 450 05, telefax +358 20 450 2380Internet: www.edita.fi/netmarket
6 e

Economic environmentalpolicy instruments
in Finland
T h e F i n n i s h E n v i r o n m e n t
Marjukka Hiltunen
676en
Economic environmental policy instruments in Finland
Economic environm
ental policy instruments in Finland
FINNISH ENVIRONMENT INSTITUTE P.O. BOX 140, FIN-00251 HELSINKI
ENVIRONMENTALPOLICY
. . . . . . . . . . . . . . . . . . . . . . . . . . . . . . . . . . . . . . . . . . . . . . . . . . . . . .
676en
ENVIRONMENTALPOLICY
F I N N I S H E N V I R O N M E N T I N S T I T U T E
T h e F i n n i s h E n v i r o n m e n t
This publication is also available in the Internet:www.environment.fi/publications
ISBN 952-11-1728-1ISBN 952-11-1729-X (PDF)ISSN 1238-7312
The report provides an overview of economic environmental policy instruments inFinland. The instruments include incentive based and fiscal environmental taxes,environmental charges and deposits as well as subsidies and insurances. Systemsbased on producer responsibilities have not been examined although their effectsare similar to those of economic policy instruments. The overview shows that theuse of economic policy instruments in Finland differs to some extent from theaverage use in OECD countries. For example taxes of fuels and motor vehicles arehigh in comparison, whereas the energy taxes of industries are relatively low. Themain challenge in developing economic environmental policy instruments is toincrease the positive incentives and to improve the environmental focus withoutmaking the systems inflexible and costly.
Edita Publishing Ltd.P.O.Box 800, FIN-00043 EDITA, FinlandPhone +358 20 450 00Mail orders:Phone +358 20 450 05, fax +358 20 450 2380Edita-bookshop in Helsinki:Annankatu 44, phone +358 20 450 2566