mav summary report 18 december 2018.docx · web viewthe total population of greater melbourne...
TRANSCRIPT

Making the Most of our Opportunities
Summary of a Report to the Municipal Association of Victoria, prepared by Dr Peter Brain (National Institute of Economic and Industry Research), Professor John Stanley and Assoc. Professor Janet Stanley (Stanley & Co).
December 2018

Contents
1. Melbourne’s rapid population growth......................................................................................3
2. Growth pattern..........................................................................................................................4
3. Impact on productivity.............................................................................................................5
4. What about social outcomes?...................................................................................................8
5. Infrastructure backlog.............................................................................................................14
6. Regional growth opportunity..................................................................................................15
7. Choices...................................................................................................................................16
References......................................................................................................................................17
2

1. Melbourne’s rapid population growthMelbourne is widely acknowledged as one of the worlds’ most liveable cities, with (for example) its iconic laneways and parks, wide ranging cultural and sporting offerings and vibrant knowledge economy. Partly as a reflection of this liveability, Greater Melbourne’s population is currently growing at around 2.7% p.a. The total population of Greater Melbourne increased by a 24.8% over the 2006-16 decade, averaging 2.3% annually between 2011 and 2016, but inner and outer Melbourne (as defined in section 2 below) were growing at around 3% annually. Overseas migration is by far the largest contributor to this growth, greater than the sum of natural increase and interstate migration over the decade. Population growth rates of some individual municipalities in Melbourne are well above these rates, particularly on the outer urban growth fringe (for example, Melton, Wyndham, Whittlesea and Casey).
Other international cities that are also famed for their liveability are typically showing lower population growth rates than Melbourne. For example, Vienna, which beat Melbourne for The Economist Intelligence Unit’s 2018 title of most liveable city (on the EIU Global Liveability Ranking), had population growth of 12.4% over the decade to end-2016, about half as fast as Melbourne over that period. Melbourne’s other perennial competitor for this title, Greater Vancouver, grew by 16.4% from 2006-16, about one-third slower than Melbourne. Between 2011 and 2016, Greater Vancouver’s population growth rate was 1.3% p.a., one percentage point below Melbourne’s growth rate over the same period. Both Vienna and Vancouver are also much smaller cities than Melbourne in terms of population size, Vancouver having a little over half Melbourne’s population number and Vienna less than half.
Melbourne’s growth rate is also high by comparison with US cities of similar size. For example, while the City of Seattle’s population grew at a high 2.4% p.a., on average, between April 2010 and July 2017, reaching 725 000 in July 2017, the wider Three Counties (King, Snohomish and Pierce), of which the City is a part, with a population of almost 4 million, grew at only 1.6% p.a. over this period. This is high but still well below Melbourne’s growth rate. Metro Atlanta’s population growth rate over this period was 2.2% p.a., broadly similar to Melbourne’s, reaching almost 6 million total population in July 2017. Austin-Round Rock, with just over 2 million people, grew at almost 3% p.a. over the April 2010-July 17 period, one (the only?) major US city that seems to have grown faster than Greater Melbourne over multiple years. In short, Melbourne’s population growth is at the top end of the range in terms of large, low density cities in highly developed countries.
This paper examines some of the implications of Melbourne’s current high population growth rate, to help inform policy consideration of population and settlement futures. Section 2 looks at the broad distribution of population growth, noting how it could be better aligned with the distribution of employment opportunities. Section 3 shows how the fastest growing Local Government Areas (LGA) have all gone backwards, relative to the state as a whole, in their capacity to capture income per working age adult. Section 4 examines how population growth impacts a number of social outcomes. Section 5 sets out a broad estimate of the infrastructure backlog that has accumulated during the period of high population growth in Melbourne and how it might grow in coming years under a business-as-usual set of assumptions. The current infrastructure boom suggests that the future will not be business-as-usual but is this infrastructure boom sufficient to tackle accumulating challenges? Section 6 looks at the constraint which poor
3
non-farm productivity levels pose for regional Victoria playing a bigger role in easing Melbourne’s growth pressures. Section 7 presents the paper’s conclusions.
This work has been undertaken as part of a research project by the authors for the Municipal Association of Victoria. The analysis and conclusions are entirely those of the authors and are not necessarily endorsed by the MAV.
2. Growth patternTo gain a quick overview of the pattern of Melbourne’s population growth, Local Government Areas were aggregated into inner, middle and outer groupings, defined as follows:
■ Inner = Glen Eira, Maribyrnong, Melbourne, Port Phillip, Stonnington, Yarra;
■ Middle = Banyule, Bayside, Boroondara, Brimbank, Darebin, Hobsons Bay, Kingston, Manningham, Monash, Moonee Valley, Moreland, Whitehorse; and
■ Outer = Cardinia, Casey, Frankston, Greater Dandenong, Hume, Knox, Maroondah, Melton, Mornington Peninsula, Nillumbik, Whittlesea, Wyndham, Yarra Ranges.
These groupings are shown in the accompanying map.
Map 1: Greater Melbourne divided into inner, middle and outer urban segments
Defining Melbourne in this way has the advantage that each of the three sectors contained roughly one-third of the city’s total jobs in 2016. Table 1 shows summary population, population growth and jobs data for each of these three sectors.
4

Table 1 Population, population growth and jobs in Melbourne
Area
Census population
in 2016
Share of 2016
population (%)
Population growth
2011-16
Share of population
growth 2011-16 (%)
Share of jobs (%)
Jobs/1,000 resident
populationInner 650524 14.7 95652 20.2 34.8 1229Middle 1707568 38.7 106169 22.4 30.9 424Outer 2057349 46.6 272822 57.5 34.3 389Total 4415441 100.0 474643 100.0 100.0 528
Source: From Australian Bureau of Statistics (n.d.), Quickstats, Available at http://www.abs.gov.au/websitedbs/D3310114.nsf/ Home/2016%20QuickStats.
Inner Melbourne (as defined) had less than 15% of Greater Melbourne’s total resident population in 2016 but accounted for one fifth of population growth over the 2011-16 period, evident in the rapid expansion of inner urban apartment building. However, a much higher proportion of jobs (nearly 35%) are located in this part of Melbourne and the ratio of jobs per 1000 resident population in inner Melbourne, at 1,229, is well over twice the average for the city as a whole (528 in 2016). This high job density of the inner area is a strong argument supporting population growth in this part of the city. However, the gap between jobs and residents means a huge daily tidal flow of workers, with associated road and public transport congestion challenges.
Middle Melbourne is more balanced in terms of population and jobs. It had 38.7% of resident population and 30.9% of jobs in 2016, but could still do with deeper job penetration, as illustrated by a jobs/1000 resident population ratio that is about 100 below the ratio for the city as a whole. One of the purposes of the National Employment and Innovation Clusters in Plan Melbourne 2017-2050 is to help increase relative job penetration in middle Melbourne, needing to be accompanied by improved accessibility opportunities to/from the clusters. This should be planned, among other things, to ensure better access to high income jobs for residents from the fast growing outer urban areas.
Outer Melbourne, as defined, housed 46.6% of Greater Melbourne’s total resident population in 2016 but accounted for an even higher share of population growth between 2011 and 2016, at 57.5%. This indicates that the outer suburbs are becoming increasingly important in relative terms for housing the city’s rapidly growing population. However, only 34.3% of jobs were located in outer Melbourne and the jobs per 1,000 resident ratio was only 389 in 2016, indicating large numbers of outer urban residents need to regularly travel considerable distances for work. Between one in four and one in six residents in the fast growing outer suburban LGAs typically now spend over two hours on their daily commute.
The intention in both Plan Melbourne and Plan Melbourne 2017-2050 was to see Melbourne becoming relatively more compact. Notwithstanding high population growth in inner Melbourne, under the high population growth rate that the city is experiencing, a more compact settlement pattern is clearly not eventuating at present.
3. Impact on productivity It is often argued that a bigger city will increase overall productivity levels and there is evidence to support this argument (see, for example, Rosenthal and Strange 2003, Behrens et al. 2014 and
5

Abel et al. 2012). However, there is also strong evidence from the current study that residents of the fast growing outer suburbs are not sharing in these potential benefits.
The National Institute of Economic and Industry Research (NIEIR), whose research was instrumental in making the economic case for Melbourne’s National Economic and Innovation Clusters, has analysed the extent to which residents of Melbourne’s LGAs are able to capture income from economic activity, comprising:
total wage and salary income received by residents, no matter from what region the work effort takes place
mixed income from businesses distribution from value added in the form of interest and dividends received by residents
irrespective of the jurisdiction that the value added is generated and imputed rental income.
This is measured by the NIEIR estimate of LGA resident Gross Regional Product (GRP) per capita of working age population. Figure 1a shows a striking result: GRP per capita of working age population grew more slowly than for Victoria as a whole in every Greater Melbourne LGA whose working age population increased faster than about 2% annually, on average, over the 1992-2017 period. The six fast growing outer suburbs of Cardinia, Casey, Hume, Melton, Whittlesea and Wyndham are all in this group, whose residents went backwards relative to the state as a whole in terms of capturing income from economic activity. The other LGA in this group is Melbourne, which can be excluded from this analysis because of its high numbers of resident students of working age.
Figure 1a: Metropolitan Melbourne: Growth in resident gross product per capita of working age population, relative to Victoria as a whole, and average annual working age population growth (1992-2017)
6

Figure 1b: Regional Victoria: Growth in resident gross product per capita of working age population, relative to Victoria as a whole, and average annual working age population growth (1992-2017)
Source: NIEIR
This spatial evidence thus suggests that the income generating benefits of fast population growth are not trickling down very well to residents in the fast growing LGAs. The location of the rapid population growth within the Greater Melbourne area, with such a high share of growth being located in areas where productivity levels and local job availability are relatively low, is likely to be holding back productivity growth in the city as a whole. This result also poses the question of whether a 2-3% p.a., or thereabouts, LGA population growth rate might be some kind of limiting upper growth rate, in terms of the opportunity for residents to capture income benefits from such population growth, especially where the public authorities are unwilling to increase the capital stock that would enable the faster population growing regions to integrate into the city economy on the same basis as the middle and inner suburbs. The outcome for the regions in the top right hand quadrant of Figure 1a reflects the degree of relative integration. Inner regions and those middle to outer regions which are well integrated with the central business district would be the ones which have a higher growth in relative per capita resident gross product.
In contrast, Figure 1b suggests that increasing population growth in regional Victorian LGAs is likely to improve the relative income capturing potential of such areas. Those regions in the top right hand quadrant would be those regions that either have scale, good integration with the Melbourne economy or good integration with other regional economies but are constrained in their ability to exploit these advantages by labour force availability. Those regions in the bottom left hand quadrant of Figure 1b would be those regions where population levels are below the threshold required for a functioning economy. That is, the thresholds required for minimum levels of education, health, community, and governance resources.
7

The strong message from the two figures, and associated infrastructure spending, is that the Melbourne region has had too high a population growth rate over the last 25 years, while regional Victoria has had too low a population growth to maximise overall gross state product per capita. Stage 2 of this project will explore the implications of this different experience between metropolitan and non-metropolitan Victoria in more detail.
4. What about social outcomes?Previous work by the authors has developed a model of associations (at 1% statistical significance) that comprise the drivers of good social outcomes, seen as social inclusion and wellbeing (Stanley et al. 2012, Stanley et al. 2017). These drivers can be viewed simply as:
having sufficient income (by implication, education and work) having accessibility (transport) having personal relationships and connections (social capital – networks, trust) feeling good about yourself (such as self-esteem, confidence) and having control over your personal environment (such as capabilities to make choices,
problem solve).
‘Sufficient’ levels of these indicators will improve the social inclusion, wellbeing and health of individuals. This in turn impacts on the ability of individuals to work and be productive. A productive community reduces the need for societal expenses in areas of welfare payments and support, health services and the negative outcomes for society in terms of crimes, anti-social behaviour, substance abuse, family violence and loss of hope and belief in the capacity to change circumstances. This also has considerable implications about the commonly discussed concept of resilience, the ability to recover from an adverse event such as a natural disaster. The lower a person’s resources (personal capacity, community and structural options), the less resilient they will be to recover from set-backs. Also, research by Wilkinson and Pickett (2011) has shown that the greater the inequality present, the greater the adverse impact on all people, both rich and poor. Inequity has the effect of eroding trust and community life, as well as increasing problems in relation to physical and mental health, drug abuse education, crime, obesity, social mobility, violence, teenage pregnancies and child wellbeing.
A range of indicators can be used to suggest how rapid population growth might impact social outcomes. This is illustrated in this paper using indicators of child development vulnerability, youth unemployment, social capital, access to public open space and natural areas, together with data on obesity and heart disease.
The Australian Early Development Census (Australian Government 2016) reports the percentage of children who, on school entry, have reached the developmental milestones of: physical health and wellbeing; social competence; emotional maturity; language and cognitive skills; and communication skills and general knowledge. The Australian average sits at 22.0% of children having one or more developmental delays on reaching school age, the comparable Victorian rate being 19.9% (2015). Figure 2 shows the proportion of children with one or more developmental vulnerabilities in each metropolitan Melbourne LGA. Three significant industrial areas (Greater Dandenong, Brimbank and Hume) have the highest proportions, all exceeding 25%. A number of rapidly growing outer growth areas are close behind: Wyndham, Casey, Melton, Whittlesea and Cardinia, all exceeding the state average, suggesting lags in service provision under growth
8

pressures, probably exacerbated by multiple disadvantages experienced by some residents. Yarra also exceeds 25%, with Melbourne close, at 23.5%. Old inner/middle eastern/southern LGAs typically are at the low end of the scale, with Bayside, Nillumbik and Boroondara having the lowest proportions vulnerable on one or more domains.
Figure 2: Child development vulnerability on one or more domains (%)
Brimban
k
Hume Yar
ra
Casey
Frankst
on
Morelan
d
Hobsons Bay
Mornington Pen
insula
Maroondah
Manningh
am
Knox
Glen Eir
a
Kingston
Whitehorse
Boroondara
Baysid
e 0
5
10
15
20
25
30
35
Source: Australian Government (2016)
Figure 3 shows youth (15 to 19 year old) unemployment rates by LGA. The City of Melbourne has the highest rate, at over 25% (possibly due to the high student population), with 15 LGAs then having rates between around 15-20% and a further 15 being between 10-14.5%. The second group (15-20%) are largely outer urban LGAs and/or older industrial areas (for example, it includes Greater Dandenong, Brimbank, Wyndham, Maribyrnong, Hume, Melton and Casey). Inner suburbs, apart from Melbourne, tend to be at the lower end of the range (for example, Port Phillip, Yarra, Stonnington and Bayside), although Glen Eira is mid-range.
Figure 3 does not include the levels of under-employment, nor disengagement from education and searching for work. In February 2017, the under-employment rate for youth aged 15 to 24 years of age sat at about 18% (Vandenbroek 2017). The signs that early child development is at risk for some children, with the resultant outcome of early school leaving and high levels of youth unemployment on Melbourne’s fringe, offers at least a partial explanation for resultant social problems of crime and poor mental health present, particularly in youth. It would seem that the current trends will be passing many of these social costs onto future generations. The recently announced proposals on three year old pre-school are welcome in this regard. Hopefully those families without a car will be able to access this opportunity, underlining the importance of timely provision of local bus services in growth suburbs.
9

Figure 3: Youth (15-19 year old) unemployment rates by LGA
Melbourn
e
Monash
Wyndham
Hume
Melton
Darebin
Morelan
d
Manningh
am
Banyu
le
Boroondara
Knox
Stonningto
n
Baysid
e Yar
ra
Port Philli
p
Mornington Pen
insula 0.0
5.0
10.0
15.0
20.0
25.0
30.0
Source: https://www2.health.vic.gov.au/about/reporting-planning-data/gis-and-planning-products/geographical-profiles.
Positive social interactions are repeatedly shown in research as being of great importance in establishing wellbeing, health and productivity. For example Holt-Lunstad et al. (2010) show that good social relationships are as important for risk of mortality as many other well-established health risk factors. Recent work has shown that social connectedness also can act as a ‘social cure’ for psychological ill-health (Saeri et al. 2018). While social capital is a multi-faceted concept, it is illustrated here through the measurement of ‘trust’.
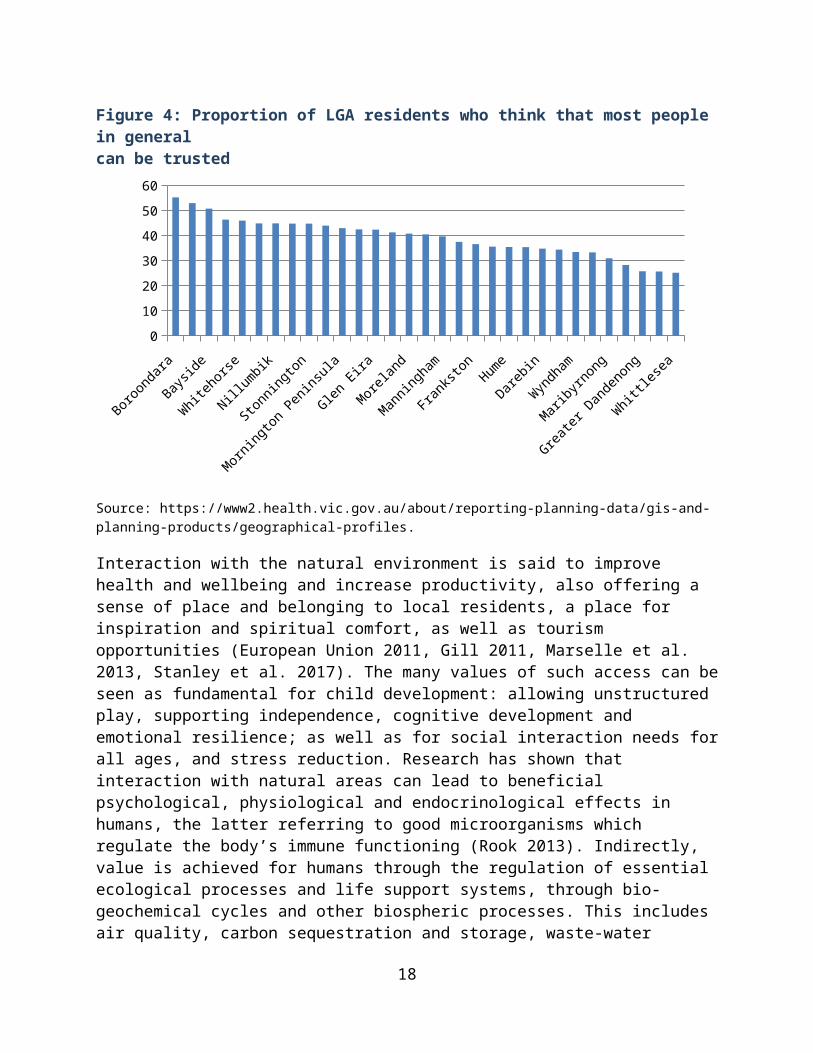
Figure 4 illustrates the proportion of LGA residents who think that most people in general can be trusted. Growth suburbs tend to occupy the lower rankings on this scale, with Whittlesea, Melton, Casey and Wyndham all being among the lowest seven ranking LGAs. Greater Dandenong, Brimbank and Maribyrnong are also at the low end of the scale. A significant correlation was found between trust of others in general at LGA level and the following variables: LGA productivity (r=.544 p=.001)1; the proportion of those aged 15 or more who hold a bachelor’s degree, or higher (r=.633 p=.000); the proportion of LGA jobs that are high tech (r=.360 p=.023); and, with an LGA’s SEIFA Relative Socio-economic Disadvantage index (r=.633; p=.000). Correlation analysis also suggests a significant negative association between trusting others at LGA level and LGA population size (r=-.379; p=.035).
1 ‘r’ is the correlation co-efficient and ‘p’ a measure of its statistical significance. ‘p’ values less than 0.05 are usually sought for significant levels of association between a pair of variables.
10

Figure 4: Proportion of LGA residents who think that most people in generalcan be trusted
Boroondara
Baysid
e
Whitehorse
Nillumbik
Stonningto
n
Mornington Pen
insula
Glen Eir
a
Morelan
d
Manningh
am
Frankst
on
Hume
Darebin
Wyndham
Maribyrn
ong
Greater
Danden
ong
Whittlesea
0
10
20
30
40
50
60
Source: https://www2.health.vic.gov.au/about/reporting-planning-data/gis-and-planning-products/geographical-profiles.
Interaction with the natural environment is said to improve health and wellbeing and increase productivity, also offering a sense of place and belonging to local residents, a place for inspiration and spiritual comfort, as well as tourism opportunities (European Union 2011, Gill 2011, Marselle et al. 2013, Stanley et al. 2017). The many values of such access can be seen as fundamental for child development: allowing unstructured play, supporting independence, cognitive development and emotional resilience; as well as for social interaction needs for all ages, and stress reduction. Research has shown that interaction with natural areas can lead to beneficial psychological, physiological and endocrinological effects in humans, the latter referring to good microorganisms which regulate the body’s immune functioning (Rook 2013). Indirectly, value is achieved for humans through the regulation of essential ecological processes and life support systems, through bio-geochemical cycles and other biospheric processes. This includes air quality, carbon sequestration and storage, waste-water treatment, pollination, the maintenance of biogeochemical cycles in the environment, soil formation, erosion control, nutrient cycling and a moderator of extreme events. The value of natural capital and ecosystem services to humans is globally worth US$33 trillion, higher than the global Gross Domestic Product (GDP), measured at US$30 trillion (Constanza et al. 2007). Thus opportunities to preserve and facilitate such services within an urban area should be taken-up.
Public open space availability has traditionally been considered in terms of standards, commonly described in terms of availability per 1,000 population, or availability as a percentage of area or of catchment. Veal (2013) shows the lack of a scientific basis for such standards but recognises their persistent application. Open space planning standards per 1,000 population have been common in Australia and we use that measure herein. Veal (2013) notes the long-standing British (National Playing Fields Association, now Fields in Trust) standard of 2.43ha/1,000
11

population and US (National Recreation Association, now National Recreation and Parks Association) figure of 4ha/1,000 population, with the Australian ‘standard’ being 2.83ha/1,000 population. Demand/need based standards are now commonly argued to be a preferred approach to standards but the preceding standards can usually be argued to be loosely derived on interpretations of need, albeit that these may sometimes have been set in another time.
Figure 5: Hectares of other public open space, including parks and gardens,sports fields and organised recreation space, per 1,000 residents
YARRA RANGES
NILLUMBIK
HOBSONS B
AY
MORNINGTON
FRANKST
ON
WYNDHAM
MANNINGHAM
BANYULE
KNOX
KINGSTON
GREATER
DANDENONG
MARIBYRNONG
MONASH
MORELAND
BAYSIDE
STONNINGTO
N0123456789
10
Source: Authors, from data provided by the Victorian Planning Authority.
Figure 5 shows that Yarra Ranges has the highest level of availability of public open space per 1,000 residents (excluding natural, semi-natural and conservation areas), at 9.2ha/1,000, almost three times the average availability level of 3.3ha/1,000 across Greater Melbourne. Cardinia (7.4ha/1,000), Nillumbik (5.6ha/1000), Casey (4.8ha/1,000), Brimbank (4.2ha/1,000) and Mornington (3.9ha/1,000) are all solidly above the average availability level and all are above the UK and Australian standard figures, most also being above the US standard.
As part of a strategy of urban densification, LGAs with lower levels of open space need to recognise the importance of adding to public open space availability. Open space is in relatively short supply per 1,000 residents in Stonnington and Glen Eira (both around 1.1ha/1,000), Bayside (1.6ha/1,000), Moreland and Whitehorse, both at 1.8ha/1,000 residents and Boroondara (2.0ha/1,000). Some 15 inner/middle urban LGAs, out of a total of 31 in Greater Melbourne, are below the indicated 2.83ha/1,000 standard or benchmark, these LGAs having a total population of 2.1 million in 2016, before considering any future population increase. Property acquisition costs to meet the 2.83ha/1,000 population for every metropolitan LGA, plus a UK standard on access to natural, semi-natural and conservation areas (details not shown in this paper), by 2031 are an estimated $50b, showing the indicative scale of challenge confronting urban densification.
Cardiovascular disease refers to all diseases and conditions involving the heart and blood vessels. The main types of cardiovascular disease in Australia are coronary heart disease, stroke and heart failure/cardiomyopathy. Cardiovascular disease accounted for nearly 28% of all deaths in Australian in 2016, also accounting for 490,000 hospitalisations in 2014/15. In 2012/13 the
12

associated cost amounted to $5 billion, or 11.1% of total health expenditure related to hospital admissions – the largest share of health expenditure of any disease group (AIHW 2017). There is thus a heavy cost burden for this disease, which also accounted for 17% of the total burden of disease in 2017, the largest single contributor (Alston et al. 2017). Higher rates of hospitalisation and death for this disease occur for people in lower socio-economic groups, Aboriginal and Torres Strait Islander peoples, and those living in regional and remote areas (ABS 2016).
Figure 6: People reporting heart disease, by LGA (%)
Casey
Greater
Danden
ong
Moonee Vall
ey
Frankst
on
Stonningto
n
Nillumbik
Mornington Pen
insula
Cardinia
Morelan
d
Darebin
Knox
Brimban
k
Monash
Port Philli
p
Melton
Maribyrn
ong 0
2
4
6
8
10
12
Source: https://www2.health.vic.gov.au/about/reporting-planning-data/gis-and-planning-products/geographical-profiles).
Figure 6 shows that the three highest reporting rates for cardio matters in Melbourne are found in outer suburbs (Casey, Whittlesea and Greater Dandenong) but Melton and Wyndham are towards the bottom of the range. This may suggest that location is not a factor in this indicator but the correlation between reporting of heart disease and travel time from central Melbourne is significant at the 10% level (r=.326; p=.073), suggesting outer suburban residents are somewhat more likely to be higher reporters than their inner urban counterparts. The correlation between reporting of heart disease and car use for the journey to work is positive and also significant at the 10% level (r=.302; p=.099), whereas that between reporting heart disease and public transport use for the journey to work is negative and also significant at the 10% level (r=-.310; p=.090), perhaps suggesting that the incidental exercise associated with using public transport is beneficial for health but that car use is not. The data on both obesity and heart disease reporting are both suggestive that high rates of growth in outer urban areas will tend to increase reporting of obesity and heart problems.
A number of the variables for which data was assembled at LGA level show quite strong spatial associations, particularly with respect to differences in travel time to (central) Melbourne (which is highly correlated with distance to Melbourne). For example, at a 10% level of significance or better, as travel times from an LGA to central Melbourne increase, population densities (r=-.827;
13

p=.000) and job densities decrease (r=-.565; p=.001), median house prices decline (r=-.635; p=.000) and open space per resident increases (r=.536; p=.002) but:
■ capital stock per person declines (r=-.376; p=.037), the proportion of higher educated people declines (r=-.873; p=.000), the proportion of jobs that are high-tech declines (r=-.648; p=.000) and LGA productivity declines (r=-.399; p=.026)
■ trust in others declines (r=-.351; p=.053)
■ the proportion of people living near public transport declines (r=-.802; p=.000) and public transport use for the journey to work also declines (r=-.893; p=.000)
■ car use increases for the journey to work (r=.807; p=.000) and the proportion of commutes that are longer than 2 hours increases (r=.586; p=.001) and
■ reports of heart disease increase (r=.326; p=.073) and so do reports of obesity (r=.668; p=.000).
These associations suggest that cheaper housing and better access to open space, which may attract people to outer suburban living, comes at a price, commonly associated with the lower population and job densities at greater distances from central Melbourne. With such a high proportion of population growth still happening on the fringe, these associations should sound warning bells. They are one reason why the Ministerial Advisory Committee on Plan Melbourne Refresh, of which one of the current authors was a member, recommended minimum densities of 25 dwellings per hectare for new fringe development, well above current density levels but in line with new greenfield standards in Toronto (for example), as one important component of planning strategies to improve outer urban outcomes.
5. Infrastructure backlog Productivity growth and associated social inclusion and wellbeing can only be achieved if adequate resources are provided for the increased population. The old industrial LGAs also need improvements in social wellbeing, however this issue is not accounted for, below. What level of additional resource input might have enabled the six fast growing outer suburbs to achieve growth in GRP/working age population in line with the state average? Analysis by NIEIR concludes that there was accumulated underinvestment of around $125 billion as at 2015-16, accumulating at an annual rate of approximately $5 billion over the 25 year period from 1992 to 2017. This under-investment was in:
■ transport infrastructure capital stock
■ commercial capital stock
■ community capital stock (such as hospitals and schools)
■ industrial development
■ skills development and
■ knowledge creation investment.
This shortfall is reflected in economic, social and environmental costs. Increased congestion levels on roads and public transport are examples of such costs, reflecting the extent of
14

underinvestment in transport since 1980. By 2031, if the same trends in population growth and infrastructure spending were to prevail as over the last two to three decades, the additional shortage of investment expenditure will be an extra $140 billion by 2031.
NIEIR also estimates that citywide, a further approximately $160 billion transport infrastructure spending, above business as usual, would be needed to 2031 to overcome the effects of increasing congestion on lowering Melbourne’s productivity levels. Adding all these elements together and allowing for some double counting, it is arguable that the infrastructure spending shortfall by 2031 might be around $375 billion by 2031, under business-as-usual. Over the 1992-2031 period, this suggests an average shortfall of perhaps $9 billion annually, against business-as-usual.
Recent increases in the rate of capital spending in Victoria, including many major transport projects, represents a good, albeit belated, start to reducing this infrastructure spending shortfall, although with risk of further accentuating urban sprawl, unless more integrated land use transport planning is evident. The 2018 State Budget Papers point out, for example, that the annual average level of Victorian infrastructure spending over the 4 years since 2014 has been $10.1 billion, compared to $4.9 billion over the preceding period. This increase is around the level of increased spending that was needed over the entire 1992-2017 period to avoid the infrastructure shortfall of $125 billion estimated as at 2017. Going forward, even greater levels of infrastructure spending will be needed to remove the accumulating shortfall, as estimated above.
6. Regional growth opportunitySome people are arguing that population growth should be diverted from Melbourne to regional Victoria, to ease growth pressures in Melbourne. This idea has much to commend it, provided urban sprawl on the fringe of Melbourne is not simply shifted to urban sprawl on the outskirts of regional Victorian cities. A key challenge for a successful contribution from regional Victoria will be reversing the poor productivity performance of non-farm Gross Domestic Product of regional Victoria.
Figure 7: Non-farm GRP per hour worked $CVM
19921994
19961998
20002002
20042006
20082010
20122014
201640.0
45.0
50.0
55.0
60.0
65.0
70.0
75.0
Melbourne Metro Regional Victoria
Source: NIEIR
15

As Figure 7 from NIEIR shows, regional non-farm productivity performance was about 20% better than that of Melbourne in 1992 but 20% poorer by 2016. Loss of regional manufacturing employment has played an important role here, as has growth in knowledge-based jobs in Melbourne. Regional development strategy must reverse this regional productivity trend if an accelerated rate of regional population growth is to be sustainable long term. Part of the explanation for the outcome in Figure 8 will also involve the population redistribution from Victorian provincial regions to the metropolitan regions which has undermined the ability of the country regions to maintain a reasonable productivity growth rate and in many cases maintain levels of productivity.
7. ChoicesIn general, the further the distance from central Melbourne, the longer the distances that are needed to travel to work, the greater the absence of public transport to make this trip, the further you will live from available public transport options, the lower the urban density and job density and the lower the productivity levels. A similar pattern can be found in social indicators that tend to deteriorate with distance from central Melbourne, with increasing concerns around health (for example, relatively higher levels of obesity), relatively poorer levels of child development on entering schools, fewer people with higher qualifications, relatively higher levels of youth unemployment and proportionately lower levels of social capital.
Melbourne’s current high rate of population growth in under-resourced outer urban LGAs seems to be compounding existing personal socio-economic costs of residents and society more broadly, issues not given sufficient consideration, while detracting from overall urban productivity performance. The range of socio-economic challenges identified associated with rapid fringe area population growth demands more integrated approaches to both planning urban growth and funding the infrastructure and services on which this depends, to deal with both current and emerging issues.
Our analysis suggests that Melbourne ’s population growth needs to be more compatible with the level of resources the nation is willing to provide to support such growth and better located with respect to urban opportunities. The Plan Melbourne 2017-2050 focus on delivering a more compact city needs to be taken much more seriously. A community conversation is needed to more clearly define the key choices, with a focus on the scale of future population growth, its location and policies to best support achievement of desired outcomes. Part of the solution may be an increase in regional population growth, which means a requirement to tackle the non-farm productivity deficit currently facing regional Victoria. Major infrastructure expenditure will still be needed.
This short discussion does not take account of many other impacts of high population growth, such as on the natural environment. This would include issues such as the rapid biodiversity loss currently occurring, resultant loss of ecosystem services, the loss of food growing land through urban sprawl, increasing freshwater scarcity and the growing risk of bushfire with increasing urban penetration into forested and grassland areas. Also, continued high population growth will make it very difficult for the transport sector, our third largest source of greenhouse gas emissions, to make a proportionate contribution to the national 2030 GHG emissions reduction target of 26-28% below 2005 levels, a target we expect to increase substantially in coming years. A range of complementary measures will be needed, such as more vigorously pursuing the Plan
16

Melbourne 2017-2050 intent to achieve a compact city, including delivery of 20 minute neighbourhoods, slowing urban growth on the fringe, measures to increase the public transport mode share to over 20% and significant improvement in active travel opportunities. Such initiatives have multiple co-benefits in terms of productivity, health and wellbeing.
ReferencesAbel, J, Dey, I. and Gabe T. (2012), ‘Productivity and the density of human capital’, Journal of the Regional Science Association 52, 4, pp.562-586.
Alston, L., Allender, S., Peterson, K., Jacobs, J., and Nichols, M. (2017), ‘Rural inequalities in the Australian burden of ischaemic heart disease: A systematic review’, Heart, Lung and Circulation, 26, 2, pp.122–133.
Australian Bureau of Statistics (2016), ‘National Health Survey: First results, 2014-15’, ABS cat. no. 4364.0.55.001, March.
Australian Government (2016), Australian Early Development Census 2015, https://www.aedc.gov.au/. Viewed 1 May 2018.
(AIHW) Australian Institute of Health and Welfare (2016), Australian Burden of Disease Study: Impact and causes of illness and death in Australian 2011, Australian Burden of disease Study series no. 3, BOD 4, Canberra.
Behrens, K, Duranton, G and Robert-Nicoud, F (2014), ‘Productive cities: Sorting, selection, and agglomeration’, Journal of Political Economy 122, 3, pp.507-553.
Constanza, R., R. d’Arge, R. de Groot et al. (2007), ‘The value of the world’s ecosystem services and natural capital’, Nature, 387, 6630, pp.253–260.
European Union (2011), Cities of Tomorrow: Challenges, Visions, Ways Forward, Brussels: author.
Gill, T. (2011), Children and Nature: A Quasi-systematic Review of the Empirical Evidence, London: London Sustainable Development Commission, Greater London Authority.
Holt-Lunstad J., Smith T. and Layton J. (2010), ‘Social Relationships and Mortality Risk: A Meta-analytic Review’, PLoS Med 7, 7, e1000316. doi:10.1371/ journal.pmed.1000316
Marselle, M., and Warber, S. (2013), ‘Walking for well-being: Are group walks in certain types of natural environments better for well-being than group walks in urban environments?’ International Journal of Environmental Research and Public Health, 10, 11, pp.5603–5628.
Rook, G. (2013), ‘Regulation of the immune system by biodiversity from the natural environment: An ecosystem service essential to health’, Proceedings of the National Academy of Science, 110, 46, pp.18360–18367.
Rosenthal, S. and Strange, W. (2003), ‘Evidence on the nature and sources of agglomeration economies’, in V. Henderson and J. Thisse (eds.) Handbook of Urban and Regional Economics, 4, Amsterdam: North Holland, pp.2119-2171.
Saeri, A., Cruwys, T., Barlow, F., Stronge, S. and Sibley, C. (2018), ‘Social connectedness improves public mental health: Investigating bidirectional relationships in the New Zealand
17
attitudes and values survey’, Australian and New Zealand Journal of Psychiatry, 52, 4. pp.365–374.
Stanley, J.K., Stanley, J.R., and Hensher, D. (2012), ‘Mobility, social capital and sense of community: What value?’ Urban Studies 49, pp.3595-3609.
Stanley, J., Stanley, J. and Hansen, R. (2017), How great cities happen, Cheltenham UK: Edward Elgar Publishing.
Vandenbroek (2017), Underemployment Statistics: A Quick Guide: Research Paper Series 2016-2017, Parliamentary Library, Parliament of Australia.
Wilkinson, R. and Pickett, K. (2011), The Spirit Level: Why Greater Equality Makes Societies Stronger, New York: Bloomsbury Press.
18