mcpc enrollment study 2018 update - lmsd.org · would start tapering down near the end of that...
TRANSCRIPT

Lower Merion School District Enrollment Projections
2018-19 Update
December 17, 2018
Prepared by the Montgomery County Planning Commission

This page intentionally left blank

Lower Merion School District Enrollment Projections
2018-19 Update
Prepared By The Montgomery County Planning Commission
December 17, 2018
This report is the third complete update to the original Enrollment Study prepared in April, 2015. It represents a supplement to the original study, but incorporates new data where available and recalibrates the projec on model to best reflect the most recent trends and expected demographic ac vity affec ng future enrollments

Board of School Directors
Dr. Melissa Gilbert - President Subha Robinson -Vice President
Laurie Actman Diane DiBonaventuro
Ben Driscoll David Federman
Debra Finger Virginia Pollard
Dr. Robin Vann Lynch
Superintendent Robert L. Copeland

Table of Contents
Introduction ........................................................................................................................................................................1
School District Characteristics Population ............................................................................................................................................................3
Age Cohorts........................................................................................................................................................4
Birth Patterns ......................................................................................................................................................5
Enrollment History ............................................................................................................................................6
Private School Enrollment................................................................................................................................8
Housing Activity Impacts of Housing ........................................................................................................................................ 11
Housing Units Built ......................................................................................................................................... 16
Housing Units Proposed................................................................................................................................ 18
Housing Sales.................................................................................................................................................... 21
District Enrollment Projections Progression Rates............................................................................................................................................ 23
Birth-First Grade Rate Method ................................................................................................................... 24
Projection Scenario......................................................................................................................................... 25
Projection Results ........................................................................................................................................... 26
Conclusion ........................................................................................................................................................................... 29
Appendix—Building Projections ............................................................................................................. 30

Lower Merion School District Enrollment Projec ons, 2018-19 Update
Introduc on
The Lower Merion School District has grown rapidly since 2008, gaining 1,848 students. In the Spring of 2015, MCPC conducted its original enrollment study and projected con nued growth of 1,248 students over ten years from 2014 to 2024. The original study iden fied several factors driving the historical and future growth. These included a decline in the numbers of families choosing private school over public school, an increase in the number of students coming from exis ng mul family apartment developments, and a rebound in housing sales ac vity that was resul ng in more students from household turnover. These factors also speak to the overall reality that Lower Merion and Narberth, with their na onally recognized school district, are high profile des na ons for young families that may be moving from Philadelphia or other parts of the country.
Formal updates to the original study were made in 2016 and 2017. Enrollment has con nued to climb since the original study, although the rate of growth has fluctuated each year and overall growth occurring at a slower rate during the last three years. Last year’s updated projec ons concluded that the District was s ll expected to grow at a high rate and gain another 918 students over ten years, but that it would start tapering down near the end of that period.
A er four years from the original study, the results are respectable. The original projec on has outpaced actual enrollment by 2.7% thus far. While that’s an acceptable margin, hindsight reveals that some of the new construc on projects have taken longer than an cipated. Also, exis ng mul family student popula on grew but did not increase at a faster rate than previous years. Regarding the 2017 update, we find that last year’s projec on was within 0.96% of the actual enrollment in 2018.
MCPC has now prepared another complete update u lizing the most recent enrollment data (2018-19 tenth day) and updated data for all research factors. We have also learned from our earlier observa ons and have recalibrated the model to reflect our most expected outcome. A slightly more complex method of projec ng kindergarten and first grade classes is applied again this year, as it was last year, in order to temper less predictable rela onships between births and kindergarten classes. Please note that this document corresponds with the original study in terms of its organiza on and content.
1

PART 1—SCHOOL DISTRICT
CHARACTERISTICS

Lower Merion School District Enrollment Projec ons, 2018-19 Update
1A. School District Characteris cs—Popula on
FIGURE 1: Population of Lower Merion School District, 1980-2020 Popula on in the LMSD has fluctuated in recent decades,
64,500 but not to a great degree. Generally, new construc on and 64,000 redevelopment has been
63,500 balanced by reduc ons in average household size.
63,000 The forecast for 2020 indicates
62,500 that the overall popula on is growing again from 2010.
62,000 Recent es mates (63,442 in 2017) support this idea and
61,500 expected construc on should drive popula on growth to 61,000 poten ally exceed the forecast.
However, total popula on does not necessarily correlate with school-age popula on and public enrollment.
FIGURE 2: Population Totals, 1990-2020
1980 1990 2000 2010 2020 (projected)
Source: U.S. Census Bureau, except 2020 Projections (DVRPC and MCPC 2045 Forecasts)
1990 2000 2010 2020 (Forecasted) 1980-1990 1980-1990 1990-2000 1990-2000 2000-2010 2000-2010 2010-2020 2010-2020
Total Change Percent Total Change Percent Total Change Percent Total Change Percent Lower Merion SD 62,281 -1,844 -2.9% 62,973 692 1.1% 62,107 -866 -1.4% 64,054 1,947 3.1% Montgomery County 678,111 34,740 5.4% 748,987 70,876 10.5% 799,874 50,887 6.8% 840,934 41,060 5.1%
3

1B. School District Characteris cs—Age Cohorts
FIGURE 3: Age Cohorts, Lower Merion School District, 1990-2010
Age Cohort
1990 2000 2010 2016
Total 1980-1990
Change Total 1990-2000
Change Total 2000-2010
Change Es mate (2012-16)
0-4 3,496 893 3,207 -289 3,251 44 3,269 5-17 8,871 -2,543 10,737 1,866 10,709 -28 10,599 18-24 6,385 -1,480 5,491 -894 5,933 442 5,767 25-34 7,448 -678 6,639 -809 5,360 -1,279 5,720 35-44 9.892 2,351 8,599 -1,293 7,448 -1,151 7,174 45-54 7,834 453 10,028 2,194 9,195 -833 8,731 55-64 6,546 -1,356 6,692 146 8,899 2,207 8,911 65-74 6,189 -355 5,282 -907 5,391 109 6,672 75 and over 5,620 849 6,298 678 5.921 -377 5,682 Source: U.S. Census Bureau
The school-age popula on (ages 5-17 when using the Census) remained steady from 2000 to 2010, while public school enrollment grew during that me period.
The largest adult cohorts are the 45-54 and 55-64 year olds, which s ll contain a good por on of the baby boom genera on. Parents from this group may s ll be raising school-age children or they are empty nesters. Some may consider moving or downsizing with this change, which can open up more opportunity for younger families to move into the district.
The 25-34 year old cohort has the highest fer lity rates and represents the group most likely to give birth. This group declined over the last three decades, but is now swinging up as part of the millennial genera on.
Lower Merion School District Enrollment Projec ons, 2018-19 Update
PRE-SCHOOL AGES SCHOOL AGES
HIGHEST FERTILITY AGES
2016 es mates, which are averages from 2012 to 2016, show no growth since 2010 in the number of school-age children, which contrasts with the drama c growth seen in public school students. Note that from 2000 to 2010 the school-age popula on was also stable while LMSD enrollment grew by close to 800 during that me.
The 25-34 cohort and adults aged 55-74 show where most of the popula on growth has occurred since 2010. The 65-74 cohort shows the most growth as baby boomers have started to move into this range.
4
Lower Merion School District Enrollment Projec ons, 2018-19 Update
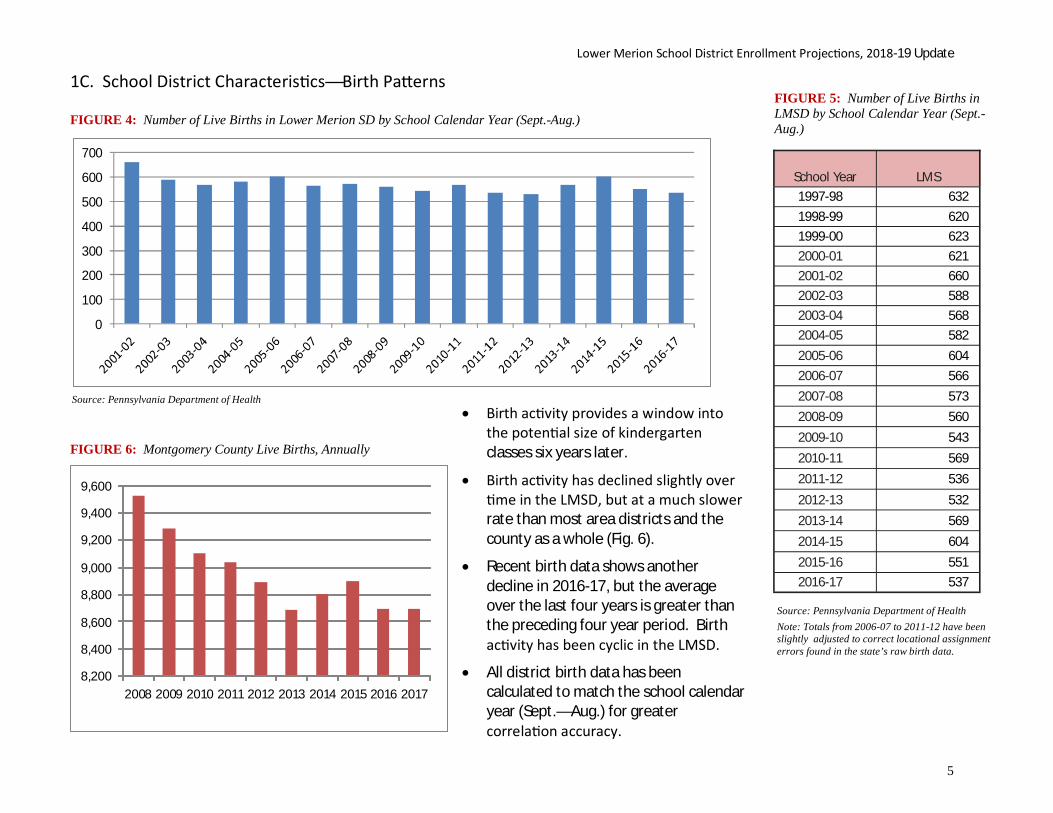
1C. School District Characteris cs—Birth Pa erns FIGURE 5: Number of Live Births in LMSD by School Calendar Year (Sept.-FIGURE 4: Number of Live Births in Lower Merion SD by School Calendar Year (Sept.-Aug.) Aug.)
700
600
500
400
300
200
100
0
Source: Pennsylvania Department of Health
FIGURE 6: Montgomery County Live Births, Annually
9,600
9,400
9,200
9,000
8,800
8,600
8,400
8,200 2008 2009 2010 2011 2012 2013 2014 2015 2016 2017
Birth ac vity provides a window into the poten al size of kindergarten classes six years later.
Birth ac vity has declined slightly over me in the LMSD, but at a much slower
rate than most area districts and the county as a whole (Fig. 6).
Recent birth data shows another decline in 2016-17, but the average over the last four years is greater than the preceding four year period. Birth ac vity has been cyclic in the LMSD.
All district birth data has been calculated to match the school calendar year (Sept.—Aug.) for greater correla on accuracy.
School Year LMS 1997-98 632 1998-99 620 1999-00 623 2000-01 621 2001-02 660 2002-03 588 2003-04 568 2004-05 582 2005-06 604 2006-07 566 2007-08 573 2008-09 560 2009-10 543 2010-11 569 2011-12 536 2012-13 532 2013-14 569 2014-15 604 2015-16 551 2016-17 537
Source: Pennsylvania Department of Health
Note: Totals from 2006-07 to 2011-12 have been slightly adjusted to correct locational assignment errors found in the state’s raw birth data.
5

0
Lower Merion School District Enrollment Projec ons, 2018-19 Update
1D. School District Characteris cs—Enrollment History The last ten years of enrollment in the LMSD reflect a FIGURE 7: School District Enrollment by Grade Divisions, 2009-2018 high period of growth, adding 1,708 students with a
24.6% increase. 10,000
9,000
8,000
7,000 K-5 6,000
5,000 6-8
4,000 9-12
3,000
2,000 Total K-12 1,000
2009- 2010-2011- 2012- 2013-2014- 2015- 2016-2017- 2018-10 11 12 13 14 15 16 17 18 19
Source: Lower Merion School District (enrollment as of the 10th day of each school year)
FIGURE 8: District Enrollment by Division, 2009-2018
The largest absolute increase is s ll at the elementary school level, but we are now at the point where the percent gains in middle and high school levels are larger than the elementary level. The last three years have seen growth in elementary schools subside, while the middle school level has accelerated. The consistent and robust growth of the youngest grades have now moved into middle school grades and will be following into high school.
At a certain point, con nued growth at a grade division o en begins to stabilize as all grade levels approach high figures. The ability to con nue growing becomes more difficult since the entry grades must keep ge ng larger and larger for this to happen. Note the KG and 1st grade class sizes in Figure 9 on the following page.
Year Total K-12
Number Change from Previous Year
Percent Change from Previous Year
2009-10 6,952 140 2.1% 2010-11 7,142 190 2.7% 2011-12 7,360 218 3.1% 2012-13 7,682 322 4.4% 2013-14 7,859 177 2.3% 2014-15 8,053 194 2.5% 2015-16 8,341 288 3.6% 2016-17 8,382 41 0.5% 2017-18 8,590 208 2.5% 2018-19 8,660 70 0.8%
Grade K-5 Grade 6-8 Grade 9-12 3,039 1,614 2,299 3,140 1,660 2,342 3,286 1,728 2,346 3,399 1,808 2,475 3,508 1,866 2,485 3,659 1,874 2,520 3,830 1,843 2,668 3,779 1,933 2,670 3,839 2,061 2,690 3,804 2,132 2,724
Source: Lower Merion School District (enrollment as of the 10th day of each school year)
6

Lower Merion School District Enrollment Projec ons, 2018-19 Update
1D. School District Characteris cs—Enrollment History Con nued
FIGURE 9: School District Enrollment by Grade, 2009-2018
Year K 1 2 3 4 5 6 7 8 9 10 11 12 2009-10 391 518 521 551 533 525 562 514 538 602 528 563 606 2010-11 411 528 539 544 571 547 549 584 527 584 620 547 591 2011-12 413 585 556 564 568 600 564 564 600 573 589 635 549 2012-13 438 602 614 572 580 593 630 593 585 656 579 601 639 2013-14 449 630 616 640 585 588 603 662 601 614 677 587 607 2014-15 454 621 658 660 660 606 610 604 660 642 610 671 597 2015-16 465 672 647 678 681 687 620 611 612 711 648 628 681 2016-17 402 661 687 659 680 690 693 626 614 661 725 645 639 2017-18 437 622 693 704 667 716 703 718 640 647 677 707 659 2018-19 440 643 646 693 715 667 715 705 712 664 668 683 709
Source: Lower Merion School District (enrollment as of the 10th day of each school year)
7

Lower Merion School District Enrollment Projec ons, 2018-19 Update
1E. School District Characteris cs—Private School Enrollments
FIGURE 10: Private School Enrollment According to U.S. Census Bureau
Year Private School
Students Percent in Private
School Dataset
2000 4,174 38.7% Census 2000,
Summary File 3
2010* 3,762 37.6% ACS, 5 Year Es mates,
2006-2010
2016* 2,932 27.3% ACS, 5 Year Es mates,
2012-2016 * 5 Year Estimates from the ACS are an average of 3 years worth of sampling data
FIGURE 11: Private School Enrollment According to LMSD Bus Records
Private School School Year Students 2008-2009 3,240 2009-2010 3,078 2010-2011 2,914
2011-2012 2,854
2012-2013 2,758
2013-2014 2,674
2014-2015 2,719
2015-2016 2,604
2016-2017 2,591
2017-2018 2,516 2018-2019 2,440
Source: Lower Merion School District Bus Records * Only recognizes private school students that opt for LMSD bus transportation.
Private school enrollment con nues to decline and this has been a major factor in the growth of public school enrollment in the LMSD. Two data sources confirm the decline in private school students living in the district— both the U.S. Census and LMSD bus records show substan al declines, although neither data source is perfect. The most recent District data confirms that private school enrollment con nues to diminish while public enrollment grows.
The growth in public school students combined with diminishing private school students is not largely associated with children switching from private to public due to the economy or other factors. However, Figure 12 shows that the number of new student transfers from local private schools has gradually increased since the post-recession years.
We s ll maintain that people are moving into Lower Merion with the inten on of enrolling in public school as opposed to private school at a greater ra o than they have in the past.
FIGURE 12: New Transfers into LMSD Coming From Private Schools
Year
New Grade 2-12 Students from Private Schools
Percent of Total New Transfer
Students 2013-14 94 27.6%
2014-15 82 18.0% 2015-16 120 29.6% 2016-17 92 21.4% 2017-18 116 24.5% 2018-19 117 25.2%
Source: Lower Merion School District
8

This page intentionally left blank

PART 2—HOUSING ACTIVITY

Lower Merion School District Enrollment Projec ons, 2018-19 Update
2A. Housing Ac vity—Impacts of Housing—School Age Children by Type, 2010 Census Analysis
Figure 13 shows the results of a 2010 countywide study on the characteris cs of households based on housing types. The numbers indicate the average number of school-age children based on single family detached, a ached (townhomes and twins), and mul family (apartment or condo stacked units). For the purposes of the study, new units comprised development that took place between 2000 and 2010, while exis ng units were those built any me before 2000.
Detached homes typically contain the most children per unit, while mul family units contain far fewer children than many people expect. New detached units are more likely to have greater numbers of children than exis ng units, but the opposite is true for a ached and mul family homes.
Figures from the study were isolated for just the LMSD. The results for exis ng units in the District were consistent with countywide exis ng homes in terms of the hierarchy of housing types having fewer children. However, detached homes had more children than the county’s rate, while a ached and mul family homes had fewer. Data for new units in the LMSD was not available due to a lack of new homogenous development during the decade.
FIGURE 13: Average Number of School Aged Children by Housing Unit Type in 2010
Montgomery County Single Family Detached Single Family A ached Mul family
School Age Children per Household in Exis ng Units 0.55 0.41 0.18 School Age Children per Household in New Units 0.93 0.21 0.06
Lower Merion School District Single Family Detached Single Family A ached Mul family
School Age Children per Household in Exis ng Units 0.64 0.31 0.06** School Age Children per Household in New Units * NA NA NA
The study does not look at every home, only census blocks that have a single housing type are able to be characterized.
Figures 14-17 on the following pages show more detailed informa on for mul family homes in the district.
* There were no Census Blocks with new homogenous development in the LMSD from 2000-2010, so data is not available for new units. ** The 0.06 factor for school-age children is based on 2010 data and presented here as a comparison to the countywide factors. However, that factor has increased since 2010. The analysis on page 12 shows that the rate is now around 0.1 as more students are coming from older multifamily developments.
Source: Montgomery County Planning Commission
11

Lower Merion School District Enrollment Projec ons, 2018-19 Update
2B. Housing Ac vity—Impacts of Housing—Mul family Housing
MCPC analyzed student records matching the addresses of all mul family proper es in the district with 20 or more units.
The results in Figure 14 confirm the rela vely low student numbers per units as shown in the countywide study, but they have gone up and essen ally doubled since 2010. However, recent counts show that the growth in mul family students has stabilized around a rate of 0.09 to 0.1 students per unit. Student are more than twice as likely to be found in rental apartments compared to condos. (Fig. 15)
We also looked at smaller mul family buildings with only 10 to 19 total units (Fig. 16). While these buildings account for only 531 units, they typically have a higher rate of children than the overall average for mul family buildings.
FIGURE 14: Actual LMSD Data for All Existing Multifamily Develop-ments with 20 Units or More
Year LMSD Students Units Student / Unit 2006-07 249 5,464 0.046 2010-11 304 5,492 0.055 2014-15 451 5,492 0.082 2015-16 569 5,602 0.102 2016-17 586 5,956 0.098 2017-18 614 5,956 0.103 2018-19 582 6,236 0.093
Note: Only includes public students and ratio is based on units, not households
FIGURE 15: Students in Multifamily Units by Tenure in 2017-18 School Year
Tenure LMSD Students Units Student / Unit Rental 425 3,287 0.129 Condo 157 2,949 0.053
FIGURE 16: Actual LMSD Data for All Existing Multifamily Developments with 10-19 Units
Year LMSD Students Units Student / Unit 2010-11 45 531 0.085 2017-18 71 531 0.134 2018-19 77 531 0.145
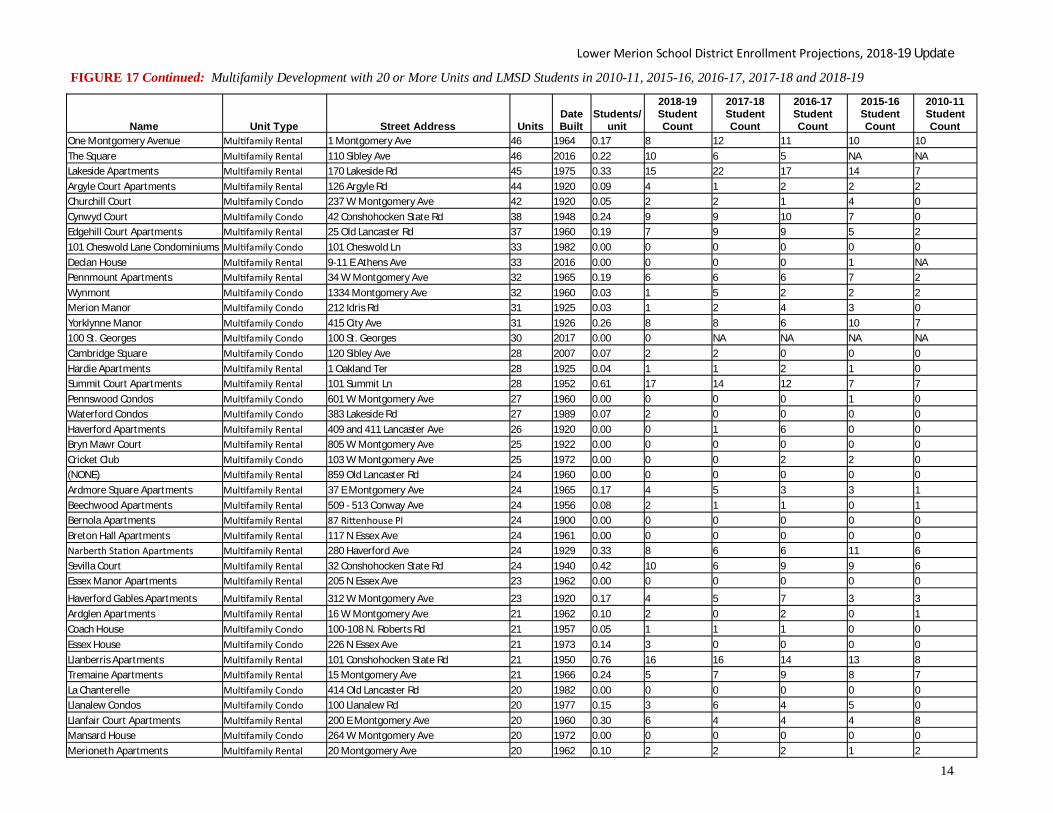
Figure 17 on the following pages itemizes the public school student totals for each mul family development with 20 or more units.
This data shows that developments vary widely in terms of student/unit ra o. Older developments with more of a garden style apartment design tend to have more students, while developments with higher density that are closer to the employment centers in the District o en have fewer children. This data helps to provide a more accurate es mate of the impact from future housing proposals based on the type of units being proposed.
Concerning the most recent developments, the Royal Athena and Palmer apartments showed reduced student counts a er both had strong opening years, with a ra o of 0.11 and 0.13 students per unit, respec vely, in 2018. The Maybrook Apartments opened this year and held 30 students across 250 units for 2018, a ra o of 0.12 students per unit. Denser buildings with higher rents and a lack of family ameni es are generally expected to have fewer students, and new developments of this type in other municipali es have upheld this assump on. The expected impact from future mul family projects have been considered in each case to iden fy those that might house more students in Lower Merion.
12

Lower Merion School District Enrollment Projec ons, 2018-19 Update
FIGURE 17: Multifamily Development with 20 or More Units and LMSD Students in 2010-11, 2015-16, 2016-17, 2017-18 and 2018-19
Name Unit Type Street Address Units Date Built
Students/ unit
2018-19 Student Count
2017-18 Student Count
2016-17 Student Count
2015-16 Student Count
2010-11 Student Count
Oak Hill/Tower at Oak Hill Mul family Condo Oakwood Dr, Oakwood Terr, Hagys Ford Rd 753 1969 0.07 53 62 60 54 21 Green Hill Mul family Condo 1001 City Avenue 543 1960 0.07 39 30 32 31 13 Royal Athena Mul family Rental 600 Righters Ferry Rd 275 2016 0.11 29 42 8 NA NA Maybrook Mul family Rental 325 Penn Rd 250 2017 0.12 30 NA NA NA NA 191 Condominium Mul family Condo 191 Presiden al Blvd 228 1963 0.01 3 4 7 8 3 Wynnewood Park Apartments Mul family Rental 150 E Wynnewood Rd 224 1945 0.21 46 44 45 56 44 Thomas Wynne Apartments Mul family Rental 200 N Wynnewood Ave 215 1950 0.14 31 39 46 47 17 Su on Terrace Mul family Condo 50 Belmont Ave 172 1974 0.01 1 1 1 2 0 Brynwood Apartments Mul family Rental 250 E Wynnewood Rd 150 1950 0.25 37 49 46 43 29 Palmer Seminary Mul family Rental 18 E Lancaster Ave 110 2015 0.13 14 22 18 14 NA Corinthian Mul family Condo 190 Presiden al Blvd 108 2006 0.02 2 1 2 5 6 Fairmont Mul family Condo 41 Conshohocken State Rd 100 1976 0.00 0 0 0 0 0 Twelve Nineteen Condominium Mul family Condo 1219 W Wynnewood Rd 96 1976 0.00 0 0 0 1 2 Suburban Court Apartments Mul family Rental 113 Cricket Ave 95 1926 0.02 2 3 4 6 0 Whitehall Apartments Mul family Rental 410 Lancaster Ave 88 1926 0.01 1 2 1 1 1 Wynnewood House Mul family Rental 300 E Lancaster Ave 88 1956 0.00 0 3 4 3 3 Oakwynne House Apartments Mul family Rental 1209 W Wynnewood Rd 84 1961 0.05 4 4 3 4 1 Wynnewood Plaza Condominium Mul family Condo 346 E Lancaster Ave 83 1945 0.01 1 1 5 7 3 Latch's Lane Condominiums Mul family Condo 40 Old Lancaster Rd 81 1948 0.04 3 4 5 7 6 Conwyn Arms Mul family Rental 830 W Montgomery Ave 80 1954 0.19 15 17 15 18 11 Montgomery Court Mul family Rental 214 Price Ave 73 1940 0.19 14 16 19 20 13 Trianon Apartments Mul family Rental 20 Conshohocken State Rd 73 1976 0.00 0 1 0 1 0 Tedwyn Apartments Mul family Rental 840 W Montgomery Ave 72 1959 0.00 0 0 0 0 0 Benson House Mul family Condo 930 W Montgomery Ave 67 1977 0.12 8 5 6 5 0 429 Apartments Mul family Rental 429 Montgomery Ave 66 1940 0.17 11 13 13 4 8 The Mermont Mul family Rental 906 W Montgomery Ave 66 1940 0.00 0 0 0 0 0 Wyndon Apartments Mul family Rental 625 E Lancaster Ave 65 1948 0.17 11 12 17 13 5 Montgomery Plaza Mul family Rental 120 E Montgomery Ave 64 1964 0.09 6 13 15 13 4 101 Apartments Mul family Rental 101 Mill Creek Rd 62 1963 0.08 5 7 9 9 8 Mayflower Square Mul family Condo 922 W Montgomery Ave 62 1952 0.10 6 4 3 4 0 Narberth Hall Apartments Mul family Rental 300 N Essex Ave 60 1929 0.05 3 4 5 7 3 Saint George's Apartments Mul family Rental 119 Mill Creek Rd 60 1930 0.08 5 3 4 11 1 Hampshires at Haverford Condos Mul family Condo 104 Woodside Rd 59 1939 0.05 3 2 1 2 1 Llanfair House Apartments Mul family Rental 17 Llanfair Rd 58 1966 0.03 2 2 3 3 1 Mermont Plaza Mul family Rental 901 Montgomery Ave 55 0.16 9 9 11 10 3 Grays Lane House Mul family Condo 100 Grays Lane & Montgomery Avenue 52 1975 0.02 1 2 1 1 0 Dunfern Apartments Mul family Rental 10 Montgomery Ave 50 1924 0.10 5 7 4 6 2 The Greenhouse Mul family Condo 19 Rock Hill Rd 50 1976 0.08 4 5 2 3 1 Hunter House Mul family Condo 449 W Montgomery Ave 49 1967 0.02 1 0 0 1 3 Merion Court Apartments Mul family Rental 118 Montgomery Ave 49 1954 0.37 18 22 14 16 9 Bryn Mawr Gables Mul family Rental 806 W Montgomery Ave 48 1930 0.00 0 0 0 0 0
13
Lower Merion School District Enrollment Projec ons, 2018-19 Update
FIGURE 17 Continued: Multifamily Development with 20 or More Units and LMSD Students in 2010-11, 2015-16, 2016-17, 2017-18 and 2018-19
Name Unit Type Street Address Units Date Built
Students/ unit
2018-19 Student Count
2017-18 Student Count
2016-17 Student Count
2015-16 Student Count
2010-11 Student Count
One Montgomery Avenue Mul family Rental 1 Montgomery Ave 46 1964 0.17 8 12 11 10 10 The Square Mul family Rental 110 Sibley Ave 46 2016 0.22 10 6 5 NA NA Lakeside Apartments Mul family Rental 170 Lakeside Rd 45 1975 0.33 15 22 17 14 7 Argyle Court Apartments Mul family Rental 126 Argyle Rd 44 1920 0.09 4 1 2 2 2 Churchill Court Mul family Condo 237 W Montgomery Ave 42 1920 0.05 2 2 1 4 0 Cynwyd Court Mul family Condo 42 Conshohocken State Rd 38 1948 0.24 9 9 10 7 0 Edgehill Court Apartments Mul family Rental 25 Old Lancaster Rd 37 1960 0.19 7 9 9 5 2 101 Cheswold Lane Condominiums Mul family Condo 101 Cheswold Ln 33 1982 0.00 0 0 0 0 0 Declan House Mul family Rental 9-11 E Athens Ave 33 2016 0.00 0 0 0 1 NA Pennmount Apartments Mul family Rental 34 W Montgomery Ave 32 1965 0.19 6 6 6 7 2 Wynmont Mul family Condo 1334 Montgomery Ave 32 1960 0.03 1 5 2 2 2 Merion Manor Mul family Condo 212 Idris Rd 31 1925 0.03 1 2 4 3 0 Yorklynne Manor Mul family Condo 415 City Ave 31 1926 0.26 8 8 6 10 7 100 St. Georges Mul family Condo 100 St. Georges 30 2017 0.00 0 NA NA NA NA Cambridge Square Mul family Condo 120 Sibley Ave 28 2007 0.07 2 2 0 0 0 Hardie Apartments Mul family Rental 1 Oakland Ter 28 1925 0.04 1 1 2 1 0 Summit Court Apartments Mul family Rental 101 Summit Ln 28 1952 0.61 17 14 12 7 7 Pennswood Condos Mul family Condo 601 W Montgomery Ave 27 1960 0.00 0 0 0 1 0 Waterford Condos Mul family Condo 383 Lakeside Rd 27 1989 0.07 2 0 0 0 0 Haverford Apartments Mul family Rental 409 and 411 Lancaster Ave 26 1920 0.00 0 1 6 0 0 Bryn Mawr Court Mul family Rental 805 W Montgomery Ave 25 1922 0.00 0 0 0 0 0 Cricket Club Mul family Condo 103 W Montgomery Ave 25 1972 0.00 0 0 2 2 0 (NONE) Mul family Rental 859 Old Lancaster Rd 24 1960 0.00 0 0 0 0 0 Ardmore Square Apartments Mul family Rental 37 E Montgomery Ave 24 1965 0.17 4 5 3 3 1 Beechwood Apartments Mul family Rental 509 - 513 Conway Ave 24 1956 0.08 2 1 1 0 1 Bernola Apartments Mul family Rental 87 Ri enhouse Pl 24 1900 0.00 0 0 0 0 0 Breton Hall Apartments Mul family Rental 117 N Essex Ave 24 1961 0.00 0 0 0 0 0 Narberth Sta on Apartments Mul family Rental 280 Haverford Ave 24 1929 0.33 8 6 6 11 6 Sevilla Court Mul family Rental 32 Conshohocken State Rd 24 1940 0.42 10 6 9 9 6 Essex Manor Apartments Mul family Rental 205 N Essex Ave 23 1962 0.00 0 0 0 0 0
Haverford Gables Apartments Mul family Rental 312 W Montgomery Ave 23 1920 0.17 4 5 7 3 3 Ardglen Apartments Mul family Rental 16 W Montgomery Ave 21 1962 0.10 2 0 2 0 1 Coach House Mul family Condo 100-108 N. Roberts Rd 21 1957 0.05 1 1 1 0 0 Essex House Mul family Condo 226 N Essex Ave 21 1973 0.14 3 0 0 0 0 Llanberris Apartments Mul family Rental 101 Conshohocken State Rd 21 1950 0.76 16 16 14 13 8 Tremaine Apartments Mul family Rental 15 Montgomery Ave 21 1966 0.24 5 7 9 8 7 La Chanterelle Mul family Condo 414 Old Lancaster Rd 20 1982 0.00 0 0 0 0 0 Llanalew Condos Mul family Condo 100 Llanalew Rd 20 1977 0.15 3 6 4 5 0 Llanfair Court Apartments Mul family Rental 200 E Montgomery Ave 20 1960 0.30 6 4 4 4 8 Mansard House Mul family Condo 264 W Montgomery Ave 20 1972 0.00 0 0 0 0 0 Merioneth Apartments Mul family Rental 20 Montgomery Ave 20 1962 0.10 2 2 2 1 2
14

Lower Merion School District Enrollment Projec ons, 2018-19 Update
2C. Housing Ac vity—Impacts of Housing—Migra on
FIGURE 18: Impact of Housing Units Sold on Enrollment
Year of Housing Units Sold 2009 2013 2014 2015 2016 2017 Number of Units Sold 658 976 901 886 948 1053 Incoming Students at Address of Units Sold 165 303 320 324 315 347 Outgoing Students at Address of Units Sold 125 222 314 350 183 293 Net Change in Students from Sales Ac vity + 40 + 81 + 6 - 26 + 132 +54
Note: While units sold include condos, no student activity, incoming or outgoing, was registered in this data
MCPC compared detailed sales transac ons with student address records to iden fy the actual number of students leaving a home as compared to those who entered a er the same home was sold.
In five of the six years observed, the net gain in children increased with sales ac vity.
The number of students coming in from sales transac ons has remained steadily high over the last five years, but the number of students leaving as a result of sales ac vity has varied quite a bit.
The overall trend supports the no on that sales ac vity is con nuing to bring in more public school children, although the amount can fluctuate from year to year.
15

Lower Merion School District Enrollment Projec ons, 2018-19 Update
2D. Housing Ac vity—Housing Units Built
FIGURE 19: Housing Units Built in the LMSD by Housing Type, 2008-2017
400
350
300
250
200
150
100
50
0 2008 2009 2010 2011 2012 2013 2014 2015 2016 2017
Single Family Detached Single Family Attached Multifamily
Source: Montgomery County Planning Commission
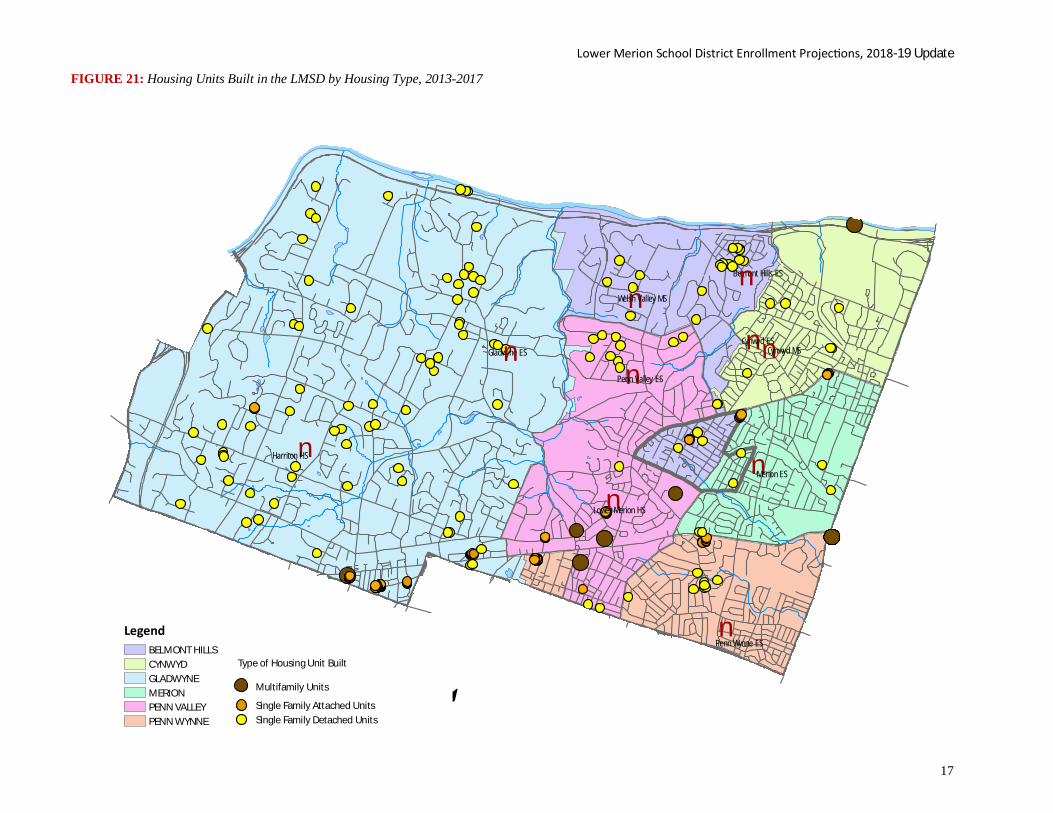
FIGURE 20: Housing Units Built by Elementary School Boundary Areas, 2013-2017
The past ten years of housing construc on in the district shows an average of about 115 units per year. This rate was driven up by a few mul family developments in the last three years, the Palmer Seminary reuse, the Royal Athena apartments, and The Maybrook. Most other development has been smaller townhome clusters as infill or the subdivision of a larger estate lot into three or four single family lots. Townhomes have been a bit more ac ve the last few years with about twenty units per year at its peak.
The map on the following page iden fies all units built from 2013 to 2017.
ES School Boundary 2013 2014 2015 2016 2017 Total 13-17
Belmont Hills 4 5 5 10 6 30
Cynwyd 1 0 2 276 2 281
Gladwyne 27 10 34 28 22 121
Merion 0 2 7 3 0 12
Penn Valley 1 40 5 49 288 383
Penn Wynne 13 9 112 2 2 138
Total 46 66 165 368 320
Source: Montgomery County Planning Commission
16
´
Lower Merion School District Enrollment Projec ons, 2018-19 Update
FIGURE 21: Housing Units Built in the LMSD by Housing Type, 2013-2017
Belmont Hills ESn nWelsh Valley MS
nCynwyd ES
n nPenn Valley ES
Cynwyd MS Gladwyne ES n
HarritonnHS
nMerion ES
nLower Merion HS
Legend n Penn Wynne ES
BELMONT HILLS CYNWYD Type of Housing Unit Built GLADWYNE
Multifamily Units MERION PENN VALLEY Single Family Attached Units PENN WYNNE Single Family Detached Units
17

Lower Merion School District Enrollment Projec ons, 2018-19 Update
2E. Housing Ac vity—Housing Units Proposed
FIGURE 22: Housing Units Proposed in the LMSD, 2008-2017
0
100
200
300
400
500
600
700
800
2008 2009 2010 2011 2012 2013 2014 2015 2016 2017
Single Family Detached Single Family Attached Multifamily
Source: Montgomery County Planning Commission
Figure 22 shows the official count of new submissions received by the Montgomery County Planning Commission over the last ten years. Not all of these units will get built and some will s ll be revised before ge ng final approval.
The district is in the midst of a construc on boom, although it has taken several years to see projects finally going into the ground. A couple of developments have already been built and some are currently under construc on, but it’s important to understand that most of the enrollment growth of the last ten years has been independent of large scale construc on projects. That growth was driven by school choices, household turnover, exis ng mul family developments, and consistent single family home infill development.
18

2E. Housing Ac vity—Housing Units Proposed FIGURE 23: Timeline of Proposed Projects by Units
Development ES
Area Total Units
2018 (built) 2019 2020 2021 2022
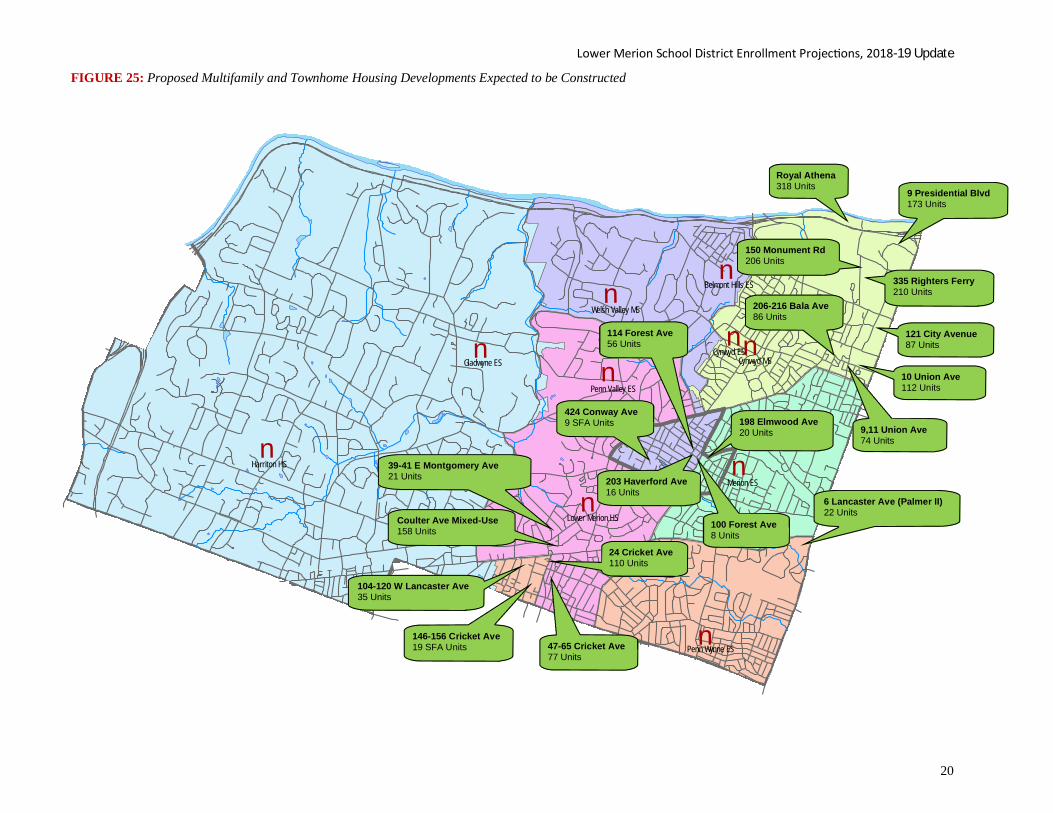
Royal Athena*** CW 318 159 159 335 Righters Ferry** CW 210 210 150 Monument Rd** CW 206 206 10 Union Ave*** CW 112 112 9,11 Union Ave, 3-9 Cynwyd Rd* CW 74 74 121 City Avenue* CW 87 87 206-216 Bala Ave, 5-9 N Highland Ave* CW 86 86 9 Presiden al Blvd (Luxor)* CW 173 87 86 198 Elmwood*** ME 20 10 10 47-65 Cricket Ave* PV 77 77 39-41 E Montgomery Ave* PV 21 21 Coulter Ave Mixed-Use* PV 158 79 79 104-120 W Lancaster Ave* PW 35 35 24 Cricket Avenue* PW 110 110 6 Lancaster Ave (Palmer 2)*** PW 22 22 146-156 Cricket Ave (THs & twins)***** PW 19 8 11 424 Conway Ave (THs)**** BH 9 9 114 Forest Ave* BH 56 56 203 Haverford Ave* BH 16 16 100 Forest Ave* BH 8 8
FIGURE 24: Public School Children Impact Factors and Calculations
Varied Factors
* = 0.06 children / unit ** = 0.10 children / unit *** = 0.13 children / unit ****= 0.21 children / unit ***** = 0.31 children / unit
Total Public School Children Subtract Mul family / A ached Trend Development Impact
NET Public School Children Added to Projec ons
Lower Merion School District Enrollment Projec ons, 2018-19 Update
Figure 23, and the map on the following page (Figure 25), show the current proposals that have a strong likelihood of making it to construc on over the next 4-5 years. Timelines are es mates on our part.
Figure 24 represents the factors used to es mate the actual number of public school children that will result from these projects. A combina on of countywide and local observa ons are used to determine the factor assigned to each development. Future development projects are expected to bring in 162 students.
Some new mul family and townhome development has already occurred in recent years. A por on of impacts from future housing is already recognized in the progression rates that are used in the projec on model. Therefore, a trend of recent impacts from only mul family and a ached housing projects is subtracted from the future housing impact. The final net adjustment to the model is 72 students a er accoun ng for trends.
Page 43 has an expanded breakdown of schoolchildren added by developments.
2019 2020 2021 2022 Total
6.6 16.9 25.9 4.7 54.06 20.6 21.0 0 0 41.60 17.4 1.3 22.0 20.7 61.36
1.9 0 0 0 1.89 3.4 0 0 0 3.41
49.92 39.16 47.83 25.41 162.32 22.59 22.59 22.59 22.59 90.36 27.33 16.57 25.24 2.82 71.96
19
Lower Merion School District Enrollment Projec ons, 2018-19 Update
FIGURE 25: Proposed Multifamily and Townhome Housing Developments Expected to be Constructed
Royal Athena 318 Units
9 Presidential Blvd 173 Units
150 Monument Rd 206 Units
n 335 Righters Ferry Belmont Hills ES 210 Units n
206-216 Bala Ave Welsh Valley MS 86 Units
114 Forest Ave 121 City Avenue 56 Units n 87 Units n Cynwyd ESn
Gladwyne ES Cynwyd MS
n 10 Union Ave Penn Valley ES 112 Units
424 Conway Ave 9 SFA Units 198 Elmwood Ave
20 Units 9,11 Union Ave 74 Units
n Harriton HS 39-41 E Montgomery Ave n21 Units 203 Haverford Ave Merion ES
16 Units
n 6 Lancaster Ave (Palmer II) 22 Units
Lower Merion HS Coulter Ave Mixed-Use 100 Forest Ave 158 Units 8 Units
24 Cricket Ave 110 Units
104-120 W Lancaster Ave 35 Units
146-156 Cricket Ave n19 SFA Units 47-65 Cricket Ave Penn Wynne ES
77 Units
20

Lower Merion School District Enrollment Projec ons, 2018-19 Update
2F. Housing Ac vity—Housing Sales Ac vity
FIGURE 26: Total Housing Units Sold (New & Existing) at Market Rate in the LMSD, 2008-2017
1200
1000
800
600
400
200
0
Housing sales rebounded since the historic lows of 2008-2011. With some fluctua on, it has averaged around 985 units per year since 2013. While 2017 was the strongest year since the Recession, we expect exis ng sales to come back down moderately as interest rates rise and poten al economic vola lity presents itself .
Sales have also been analyzed at the elementary school level as shown in Figure 27. Cynwyd and Penn Wynne areas have shown a higher percentage of sales ac vity related to overall units indica ng higher household turnover and 2008 2009 2010 2011 2012 2013 2014 2015 2016 2017 poten al school-age children growth as a
Source: Montgomery County Planning Commission result.
FIGURE 27: Existing Housing Units Sold by Elementary School Boundary Areas, 2013-2017
ES School Boundary
Total Housing Units— 2010
Market Rate Unit Sales—Exis ng Units Only Sales as a Percent of Total Housing
Units 2013 2014 2015 2016 2017 Total 13-17
Belmont Hills 3,829 139 119 131 149 145 683 17.5%
Cynwyd 3,113 152 121 115 141 134 663 20.6%
Gladwyne 6,738 259 216 213 247 255 1,190 17.5%
Merion 3,296 96 128 112 120 145 601 16.7%
Penn Valley 5,021 167 163 152 136 187 805 14.9%
Penn Wynne 4,017 163 155 164 157 184 823 19.7%
Total 26,014 976 902 887 950 1,050 4,765 18.3%
Source: Montgomery County Planning Commission
21

PART 3—DISTRICT ENROLLMENT PROJECTIONS
Lower Merion School District Enrollment Projec ons, 2018-19 Update
3A. Projec ons—Progression Rates with the Birth-1st Grade Method Cohort Progression Model
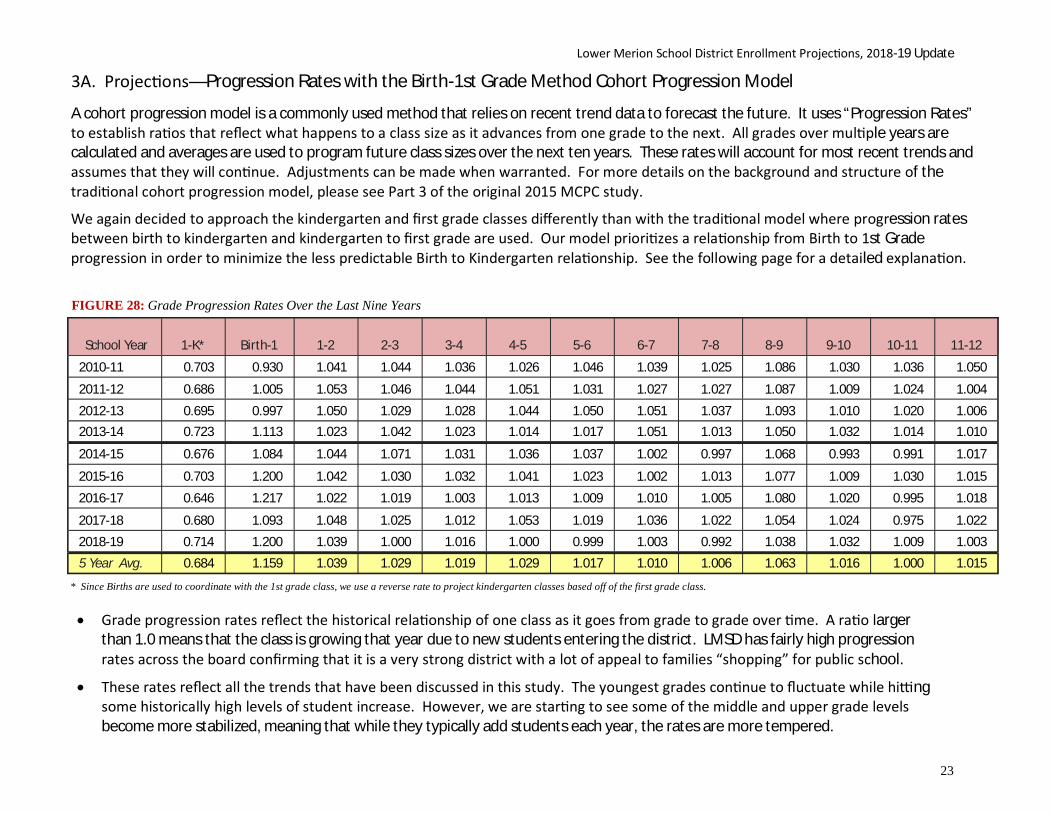
A cohort progression model is a commonly used method that relies on recent trend data to forecast the future. It uses “Progression Rates” to establish ra os that reflect what happens to a class size as it advances from one grade to the next. All grades over mul ple years are calculated and averages are used to program future class sizes over the next ten years. These rates will account for most recent trends and assumes that they will con nue. Adjustments can be made when warranted. For more details on the background and structure of the tradi onal cohort progression model, please see Part 3 of the original 2015 MCPC study.
We again decided to approach the kindergarten and first grade classes differently than with the tradi onal model where progression rates between birth to kindergarten and kindergarten to first grade are used. Our model priori zes a rela onship from Birth to 1st Grade progression in order to minimize the less predictable Birth to Kindergarten rela onship. See the following page for a detailed explana on.
FIGURE 28: Grade Progression Rates Over the Last Nine Years
School Year 1-K* Birth-1 1-2 2-3 3-4 4-5 5-6 6-7 7-8 8-9 9-10 10-11 11-12
2010-11 0.703 0.930 1.041 1.044 1.036 1.026 1.046 1.039 1.025 1.086 1.030 1.036 1.050
2011-12 0.686 1.005 1.053 1.046 1.044 1.051 1.031 1.027 1.027 1.087 1.009 1.024 1.004
2012-13 0.695 0.997 1.050 1.029 1.028 1.044 1.050 1.051 1.037 1.093 1.010 1.020 1.006 2013-14 0.723 1.113 1.023 1.042 1.023 1.014 1.017 1.051 1.013 1.050 1.032 1.014 1.010
2014-15 0.676 1.084 1.044 1.071 1.031 1.036 1.037 1.002 0.997 1.068 0.993 0.991 1.017
2015-16 0.703 1.200 1.042 1.030 1.032 1.041 1.023 1.002 1.013 1.077 1.009 1.030 1.015
2016-17 0.646 1.217 1.022 1.019 1.003 1.013 1.009 1.010 1.005 1.080 1.020 0.995 1.018
2017-18 0.680 1.093 1.048 1.025 1.012 1.053 1.019 1.036 1.022 1.054 1.024 0.975 1.022
2018-19 0.714 1.200 1.039 1.000 1.016 1.000 0.999 1.003 0.992 1.038 1.032 1.009 1.003
5 Year Avg. 0.684 1.159 1.039 1.029 1.019 1.029 1.017 1.010 1.006 1.063 1.016 1.000 1.015
* Since Births are used to coordinate with the 1st grade class, we use a reverse rate to project kindergarten classes based off of the first grade class.
Grade progression rates reflect the historical rela onship of one class as it goes from grade to grade over me. A ra o larger than 1.0 means that the class is growing that year due to new students entering the district. LMSD has fairly high progression rates across the board confirming that it is a very strong district with a lot of appeal to families “shopping” for public school.
These rates reflect all the trends that have been discussed in this study. The youngest grades con nue to fluctuate while hi ng some historically high levels of student increase. However, we are star ng to see some of the middle and upper grade levels become more stabilized, meaning that while they typically add students each year, the rates are more tempered.
23
Lower Merion School District Enrollment Projec ons, 2018-19 Update
3B. Projec ons—Birth-First Grade Rate Method
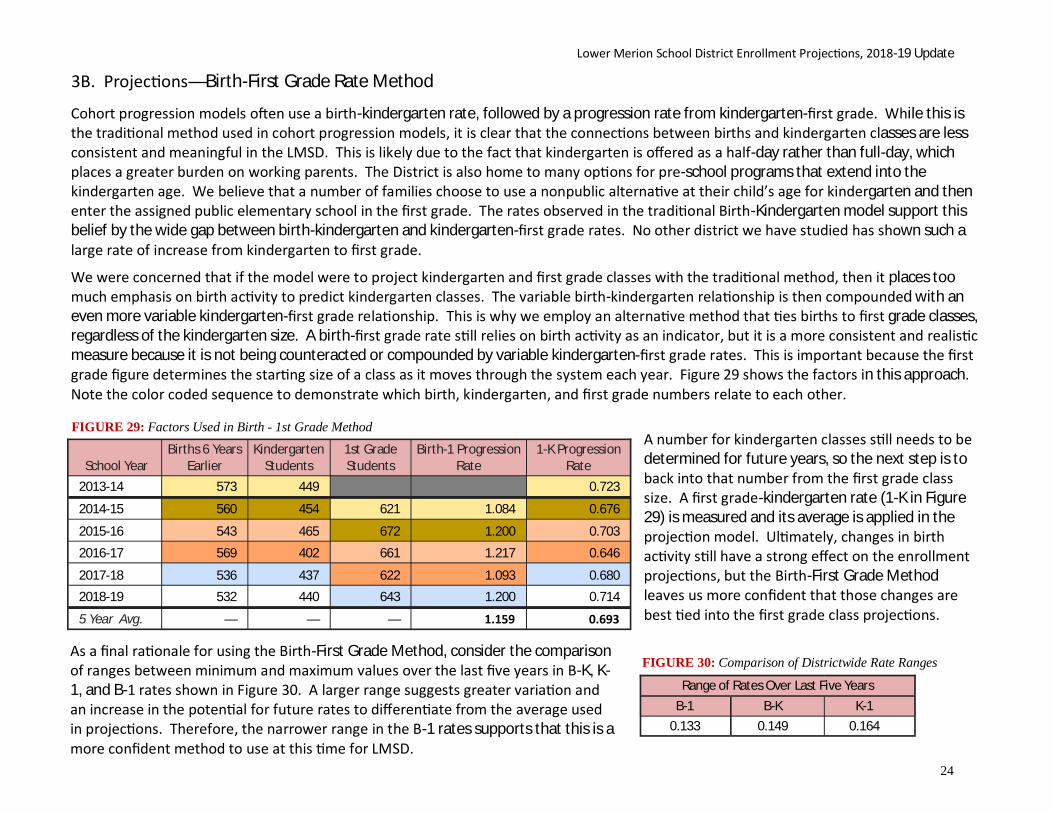
Cohort progression models o en use a birth-kindergarten rate, followed by a progression rate from kindergarten-first grade. While this is the tradi onal method used in cohort progression models, it is clear that the connec ons between births and kindergarten classes are less consistent and meaningful in the LMSD. This is likely due to the fact that kindergarten is offered as a half-day rather than full-day, which places a greater burden on working parents. The District is also home to many op ons for pre-school programs that extend into the kindergarten age. We believe that a number of families choose to use a nonpublic alterna ve at their child’s age for kindergarten and then enter the assigned public elementary school in the first grade. The rates observed in the tradi onal Birth-Kindergarten model support this belief by the wide gap between birth-kindergarten and kindergarten-first grade rates. No other district we have studied has shown such a large rate of increase from kindergarten to first grade.
We were concerned that if the model were to project kindergarten and first grade classes with the tradi onal method, then it places too much emphasis on birth ac vity to predict kindergarten classes. The variable birth-kindergarten rela onship is then compounded with an even more variable kindergarten-first grade rela onship. This is why we employ an alterna ve method that es births to first grade classes, regardless of the kindergarten size. A birth-first grade rate s ll relies on birth ac vity as an indicator, but it is a more consistent and realis c measure because it is not being counteracted or compounded by variable kindergarten-first grade rates. This is important because the first grade figure determines the star ng size of a class as it moves through the system each year. Figure 29 shows the factors in this approach. Note the color coded sequence to demonstrate which birth, kindergarten, and first grade numbers relate to each other.
FIGURE 29: Factors Used in Birth - 1st Grade Method
School Year Births 6 Years
Earlier Kindergarten
Students 1st Grade Students
Birth-1 Progression Rate
1-K Progression Rate
2013-14 573 449 0.723
2014-15 560 454 621 1.084 0.676
2015-16 543 465 672 1.200 0.703
2016-17 569 402 661 1.217 0.646
2017-18 536 437 622 1.093 0.680
2018-19 532 440 643 1.200 0.714
5 Year Avg. — — — 1.159 0.693
A number for kindergarten classes s ll needs to be determined for future years, so the next step is to back into that number from the first grade class size. A first grade-kindergarten rate (1-K in Figure 29) is measured and its average is applied in the projec on model. Ul mately, changes in birth ac vity s ll have a strong effect on the enrollment projec ons, but the Birth-First Grade Method leaves us more confident that those changes are best ed into the first grade class projec ons.
As a final ra onale for using the Birth-First Grade Method, consider the comparison FIGURE 30: Comparison of Districtwide Rate Ranges of ranges between minimum and maximum values over the last five years in B-K, K-
1, and B-1 rates shown in Figure 30. A larger range suggests greater varia on and an increase in the poten al for future rates to differen ate from the average used in projec ons. Therefore, the narrower range in the B-1 rates supports that this is a
Range of Rates Over Last Five Years B-1 B-K K-1
0.133 0.149 0.164
more confident method to use at this me for LMSD. 24

Lower Merion School District Enrollment Projec ons, 2018-19 Update
3C. Projec on Scenario
A single recommended scenario has been developed for this study update
The recommended scenario features:
5 year progression rate average
An alterna ve Birth-1st Grade rate and a 1st Grade-Kindergarten reverse rate
Es mated future births calculated as an average of the last 6 years
An adjustment for future residen al development projects using modified school-children factors and balanced by the trend development that has already occurred in recent years.
The model represents our best es mate as to how the progression model should reflect school enrollments over the next ten years. If we were to use the tradi onal Birth-Kindergarten and Kindergarten-1st Grade method, overall growth for the district would be slightly higher than this model projects with 86 more students a er ten years. However, there would be more dis nct differences in some of the individual elementary schools.
Building projec ons for elementary schools naturally present less confident projec ons due to the smaller popula ons and greater variability that can occur. We found that some schools s ll produced greater confidence in the tradi onal B-K method, while others did not. Figure 31 shows the range comparisons that lead to the model type that is used for each building. Final building projec ons were also calibrated to fit within the established districtwide projec ons for the K-5 grade levels.
FIGURE 31: Comparison of Elementary School Rate Ranges
ES School
Range of Rates Over Last Five Years Method Used B-1 B-K K-1
Belmont Hills ES 0.337 0.229 0.291 B-K Cynwyd ES 0.305 0.444 0.621 B-1 Gladwyne ES 0.123 0.157 0.187 B-1 Merion ES 0.262 0.216 0.138 B-K Penn Valley ES 0.294 0.287 0.526 B-1 Penn Wynne ES 0.303 0.143 0.145 B-K
* An additional modification was used to determine the Gladwyne ES model. See Gladwyne ES in the Appendix for details.
25

Lower Merion School District Enrollment Projec ons, 2018-19 Update
3D. Projec on Results —All Grades FIGURE 32: Projected Enrollments by Grade, 2019-2028
School Year Births 6
Years Ago* K 1 2 3 4 5 6 7 8 9 10 11 12 TOTAL 2018-19 (Actual) 532 440 643 646 693 715 667 715 705 712 664 668 683 709 8,660 2019-20 569 453 619 670 667 708 738 681 725 711 759 677 670 695 8,772 2020-21 604 482 663 644 691 681 730 752 689 730 757 772 678 681 8,949 2021-22 551 442 705 690 664 706 702 744 761 695 778 771 774 690 9,124 2022-23 537 431 644 733 711 677 726 714 752 766 739 790 772 786 9,240 2023-24 555 445 628 669 754 724 696 739 722 756 814 750 790 783 9,270
2024-25 555 445 649 652 688 768 744 708 746 726 804 827 750 802 9,310 2025-26 555 445 649 674 671 701 790 757 716 750 771 817 827 761 9,329 2026-27 555 445 649 674 693 683 721 803 765 720 798 783 817 839 9,390 2027-28 555 445 649 674 693 706 703 733 812 769 765 810 783 829 9,371 2028-29 555 445 649 674 693 706 726 715 741 816 818 777 810 795 9,365
* The birth figure for each row does not pertain to births during that year, but rather the births that occurred six years prior to the projected year and would be a kindergarten student in the year identified. Births affecting 2023-2028 are estimates based on an average of the last six years.
FIGURE 33: Districtwide Enrollment Projection Summary
Year Total
Students Annual Change
2018-19 (Actual) 8,660
2019-20 8,772 112 2020-21 8,949 177 2021-22 9,124 175 2022-23 9,240 116 2023-24 9,270 30
2024-25 9,310 40 2025-26 9,329 19 2026-27 9,390 61 2027-28 9,371 -19 2028-29 9,365 -6 Total Change 2018-2028 705
26

Lower Merion School District Enrollment Projec ons, 2018-19 Update
3D. Projec on Results —School Level Summaries
FIGURE 34: Grades K-5 Elementary School Enroll- FIGURE 35: Grades 6-8 Middle School Enrollment FIGURE 36: Grades 9-12 High School Enrollment ment Projections Projections Projections
Year Total
Students Annual Change
2018-19 (Actual) 3,804 2019-20 3,854 50 2020-21 3,890 36 2021-22 3,910 20 2022-23 3,921 11 2023-24 3,916 -5
2024-25 3,947 31 2025-26 3,929 -18 2026-27 3,865 -64 2027-28 3,870 5 2028-29 3,893 23 Total Change 2018-2028 89
Year Total
Students Annual Change
2018-19 (Actual) 2,132 2019-20 2,116 -16 2020-21 2,171 55 2021-22 2,200 29 2022-23 2,232 32 2023-24 2,216 -16
2024-25 2,180 -36 2025-26 2,223 43 2026-27 2,288 65 2027-28 2,314 26 2028-29 2,272 -42 Total Change 2018-2028 140
Year Total
Students Annual Change
2018-19 (Actual) 2,724
2019-20 2,801 77 2020-21 2,889 88 2021-22 3,014 125 2022-23 3,087 73 2023-24 3,138 51
2024-25 3,183 45 2025-26 3,176 -7 2026-27 3,237 61 2027-28 3,187 -50 2028-29 3,200 13 Total Change 2018-2028 476
27

Lower Merion School District Enrollment Projec ons, 2018-19 Update
3D. Projec on Results —Building Summaries Projec ons at the individual building FIGURE 37: Summary for Elementary School Buildings (Peak years in red) level are aided by specific birth data
Year Belmont
Hills Cynwyd Gladwyne Merion Penn Valley
Penn Wynne
2018-19 (Actual) 497 557 722 583 685 760
2019-20 502 566 740 610 653 782 2020-21 501 559 731 633 689 776 2021-22 499 582 734 631 696 768 2022-23 487 592 727 651 699 765 2023-24 487 586 736 659 686 761
2024-25 487 578 728 688 701 765 2025-26 478 594 731 659 708 759 2026-27 477 584 717 653 678 756 2027-28 474 584 716 656 683 756 2028-29 474 587 719 663 690 760 Total Change 2018-2028 -23 30 -3 80 5 0
FIGURE 38: Summary for Middle and High School Buildings (Peak years in red)
Year Bala Cynwyd
MS Welsh Valley
MS Harriton
HS Lower Merion
HS 2018-19 (Actual) 1,063 1,069 1,211 1,513 2019-20 1,063 1,054 1,217 1,584 2020-21 1,113 1,057 1,232 1,657 2021-22 1,130 1,071 1,276 1,738 2022-23 1,142 1,090 1,314 1,773 2023-24 1,124 1,092 1,307 1,831
2024-25 1,100 1,080 1,316 1,867 2025-26 1,153 1,070 1,334 1,842 2026-27 1,175 1,113 1,343 1,893 2027-28 1,196 1,118 1,341 1,846 2028-29 1,163 1,109 1,333 1,867
Total Change 2018-2028 100 40 122 354
applied to each catchment area along with geographically specific housing data. Housing adjustments have been customized to each building based upon the trend and future public school children impacts appropriate for each catchment area.
Individual building projec ons should invoke less confidence than the districtwide figures due to the reduced numbers of students. Final projected numbers have been calibrated to fit the overall district projec ons at each grade level.
See the Appendix for more details on building projec ons such as grades, births, past enrollment, and progression rates.
The High School Building projec ons in Figure 38 account for the high school choice zone that has been in place for the last 5 years. However, these numbers assume that students in the choice zone make their selec on according to the average rate since 2014, which is a 54% HHS—46% LMHS split. If more students choose LMHS, as occurred this past year and may con nue, then LMHS will experience more growth and HHS less. See Appendix for scenario projec ons.
28
Lower Merion School District Enrollment Projec ons, 2018-19 Update
Conclusion Our original study recognized some major factors driving growth in the District’s student enrollment—reduced private school a endance, more students coming out of exis ng mul family developments, and more students resul ng from the churning of households, i.e. housing sales ac vity. Four school year periods later, all of these factors are s ll part of the trend in the LMSD. The observed decline of private school as a choice made by families in the District con nues to go down. People can live anywhere and a end a fine private school in the area, but they must live in Lower Merion or Narberth to a end its public schools. Those families seeking high-quality schooling and high-quality lifestyle ameni es con nue to grow in number and become a greater percentage of households in the district.
Enrollment figures over the last four school years combined with other new data has informed our percep on of what is happening in the LMSD. The rapid growth over the last ten years is difficult to sustain for much longer than it has lasted. At some point all of the grade levels reach a high level and growth becomes less likely to achieve even if large class sizes are sustained. However, we also do not expect growth to stop altogether in the next five years. Some of the higher grade levels are s ll in line to receive growth bubbles that originated in a kindergarten or first grade class 6-10 years ago.
We have taken every effort to fine-tune the projec on model and account for recent trends, new development, and exis ng development. The nature of birth ac vity in the LMSD and how families choose to spend kindergarten and first grade lead us to revise the method for projec ng these grade levels so that they are not en rely based on the ra o of births to kindergarten and kindergarten to births. In a District like Lower Merion, this method provides a more realis c base for how first grade classes progress through the system.
These updated projec ons uphold a significant growth scenario, but it is one that does taper off within the next ten years. The District is now looking at expected growth of 705 students in the next ten years, and the peak of that growth actually comes before the end of the ten year period. All but one of the elementary schools will s ll grow within the next five years, but only three are expected to be at a higher enrollment a er ten years—Cynwyd, Merion and Penn Valley. The middle and high schools are headed toward the highest growth as the cumula ve years of elementary school increases con nue to impact upper grades. However, a greater dis nc on is now being seen between growth in Bala Cynwyd Middle School and Lower Merion High School as compared to Welsh Valley Middle School and Harriton High School.
29

Lower Merion School District Enrollment Projec ons, 2018-19 Update
APPENDIX—BUILDING PROJECTIONS
30
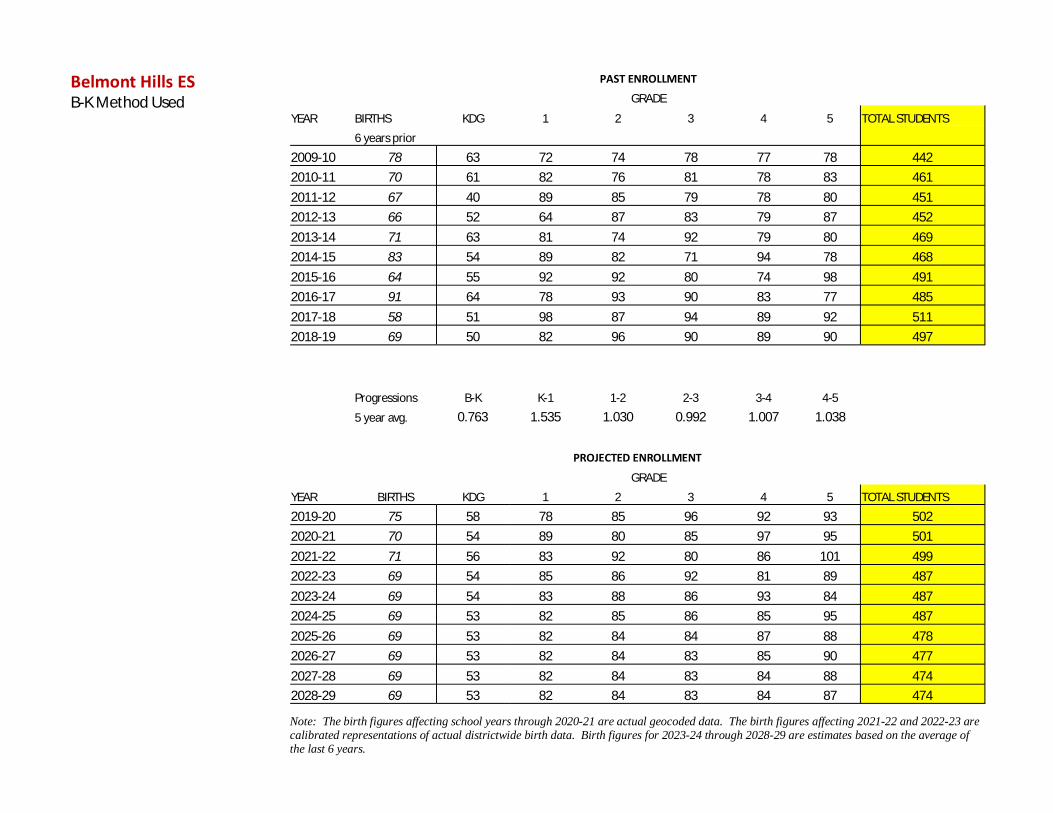
PAST ENROLLMENT Belmont Hills ES GRADE B-K Method Used
YEAR BIRTHS KDG 1 2 3 4 5 TOTAL STUDENTS
6 years prior
2009-10 78 63 72 74 78 77 78 442 2010-11 70 61 82 76 81 78 83 461 2011-12 67 40 89 85 79 78 80 451 2012-13 66 52 64 87 83 79 87 452 2013-14 71 63 81 74 92 79 80 469 2014-15 83 54 89 82 71 94 78 468 2015-16 64 55 92 92 80 74 98 491 2016-17 91 64 78 93 90 83 77 485 2017-18 58 51 98 87 94 89 92 511 2018-19 69 50 82 96 90 89 90 497
Progressions
5 year avg.
B-K
0.763 K-1
1.535 1-2
1.030 2-3
0.992 3-4
1.007 4-5
1.038
PROJECTED ENROLLMENT
GRADE
YEAR BIRTHS KDG 1 2 3 4 5 TOTAL STUDENTS
2019-20 75 58 78 85 96 92 93 502 2020-21 70 54 89 80 85 97 95 501 2021-22 71 56 83 92 80 86 101 499 2022-23 69 54 85 86 92 81 89 487 2023-24 69 54 83 88 86 93 84 487 2024-25 69 53 82 85 86 85 95 487 2025-26 69 53 82 84 84 87 88 478 2026-27 69 53 82 84 83 85 90 477 2027-28 69 53 82 84 83 84 88 474 2028-29 69 53 82 84 83 84 87 474
Note: The birth figures affecting school years through 2020-21 are actual geocoded data. The birth figures affecting 2021-22 and 2022-23 are calibrated representations of actual districtwide birth data. Birth figures for 2023-24 through 2028-29 are estimates based on the average of the last 6 years.

Cynwyd ES PAST ENROLLMENT
B-1 Method Used GRADE
YEAR BIRTHS KDG 1 2 3 4 5 TOTAL STUDENTS
6 years prior
2009-10 100 55 80 78 89 94 83 479 2010-11 88 57 82 83 84 98 98 502 2011-12 116 70 86 90 84 86 96 512 2012-13 87 66 98 86 93 85 88 516 2013-14 85 56 92 96 85 93 86 508 2014-15 82 71 86 102 104 85 95 543 2015-16 72 60 107 88 107 109 88 559 2016-17 83 39 92 108 87 113 108 547 2017-18 84 50 83 90 118 88 119 548 2018-19 81 74 96 88 93 120 86 557
Progressions
5 year avg.
1-K
0.621 B-1
1.147 1-2
1.036 2-3
1.049 3-4
1.027 4-5
1.016
PROJECTED ENROLLMENT
GRADE
YEAR BIRTHS KDG 1 2 3 4 5 TOTAL STUDENTS
2019-20 66 49 96 102 95 98 125 566 2020-21 87 66 80 101 109 100 102 559 2021-22 79 63 107 85 108 115 104 582 2022-23 77 62 98 112 90 112 117 592 2023-24 79 64 96 102 117 93 114 586 2024-25 79 63 98 99 106 119 93 578 2025-26 79 63 98 101 103 108 120 594 2026-27 79 63 98 101 106 106 110 584 2027-28 79 63 98 101 106 109 107 584 2028-29 79 63 98 101 106 109 110 587
Note: The birth figures affecting school years through 2020-21 are actual geocoded data. The birth figures affecting 2021-22 and 2022-23 are calibrated representations of actual districtwide birth data. Birth figures for 2023-24 through 2028-29 are estimates based on the average of the last 6 years.

Gladwyne ES PAST ENROLLMENT
B-1 Method Used GRADE
YEAR BIRTHS KDG 1 2 3 4 5 TOTAL STUDENTS
6 years prior
2009-10 118 80 95 89 107 83 105 559 2010-11 99 86 109 105 97 109 94 600 2011-12 116 90 107 119 107 101 109 633 2012-13 123 66 131 120 129 120 109 675 2013-14 90 71 110 132 128 140 120 701 2014-15 112 90 103 112 145 137 151 738 2015-16 104 86 129 117 121 142 146 741 2016-17 110 82 130 137 118 116 148 731 2017-18 92 83 124 140 143 116 127 733 2018-19 100 90 110 130 130 146 116 722
Progressions
5 year avg.
1-K
0.708 B-1
1.174 1-2
1.068 2-3
1.032 3-4
1.002 4-5
1.056
PROJECTED ENROLLMENT
GRADE
YEAR BIRTHS KDG 1 2 3 4 5 TOTAL STUDENTS
2019-20 97 81 118 118 135 131 155 740 2020-21 110 92 115 127 123 136 139 731 2021-22 100 84 130 123 131 123 144 734 2022-23 97 82 118 139 127 131 130 727 2023-24 99 83 116 127 144 128 139 736 2024-25 99 83 117 122 130 143 133 728 2025-26 99 83 117 125 126 130 151 731 2026-27 99 83 117 125 129 127 137 717 2027-28 99 83 117 125 129 129 134 716 2028-29 99 83 117 125 129 129 137 719
Note: The birth figures affecting school years through 2020-21 are actual geocoded data. The birth figures affecting 2021-22 and 2022-23 are calibrated representations of actual districtwide birth data. Birth figures for 2023-24 through 2028-29 are estimates based on the average of the last 6 years.

Merion ES PAST ENROLLMENT
B-K Method Used GRADE
YEAR BIRTHS KDG 1 2 3 4 5 TOTAL STUDENTS
6 years prior
2009-10 91 53 86 87 94 88 82 490 2010-11 117 68 69 88 90 90 90 495 2011-12 102 68 97 75 95 95 100 530 2012-13 101 82 97 107 81 89 93 549 2013-14 106 73 100 102 105 80 89 549 2014-15 97 75 94 103 114 102 80 568 2015-16 100 77 105 97 109 118 108 614 2016-17 100 65 107 105 106 111 117 611 2017-18 103 77 82 111 105 108 120 603 2018-19 104 58 99 90 118 108 110 583
Progressions
5 year avg.
B-K
0.700 K-1
1.325 1-2
1.039 2-3
1.066 3-4
1.014 4-5
1.030
PROJECTED ENROLLMENT
GRADE
YEAR BIRTHS KDG 1 2 3 4 5 TOTAL STUDENTS
2019-20 140 99 78 104 97 121 112 610 2020-21 121 86 131 81 111 99 125 633 2021-22 111 79 114 137 87 113 102 631 2022-23 108 77 105 118 146 88 117 651 2023-24 115 82 103 109 126 149 91 659 2024-25 115 81 107 106 115 127 152 688 2025-26 115 81 107 111 112 117 130 659 2026-27 115 81 107 111 119 114 121 653 2027-28 115 81 107 111 119 120 118 656 2028-29 115 81 107 111 119 120 124 663
Note: The birth figures affecting school years through 2020-21 are actual geocoded data. The birth figures affecting 2021-22 and 2022-23 are calibrated representations of actual districtwide birth data. Birth figures for 2023-24 through 2028-29 are estimates based on the average of the last 6 years.

Penn Valley ES PAST ENROLLMENT
B-1 Method Used GRADE
YEAR BIRTHS KDG 1 2 3 4 5 TOTAL STUDENTS
6 years prior
2009-10 76 63 96 89 84 95 84 511 2010-11 94 68 89 97 93 89 88 524 2011-12 97 69 104 94 108 109 100 584 2012-13 101 85 107 108 89 111 114 614 2013-14 106 91 125 97 113 95 115 636 2014-15 80 63 133 131 112 125 96 660 2015-16 97 80 101 140 133 122 129 705 2016-17 73 55 115 108 138 132 119 667 2017-18 95 76 108 126 104 138 129 681 2018-19 74 77 124 114 124 108 138 685
Progressions
5 year avg.
1-K
0.649 B-1
1.297 1-2
1.064 2-3
1.021 3-4
1.045 4-5
0.999
PROJECTED ENROLLMENT
GRADE
YEAR BIRTHS KDG 1 2 3 4 5 TOTAL STUDENTS
2019-20 82 69 96 133 117 130 108 653 2020-21 109 92 107 103 136 122 130 689 2021-22 85 71 142 114 105 142 122 696 2022-23 83 70 111 151 116 110 142 699 2023-24 88 74 108 118 155 122 110 686 2024-25 88 73 114 114 119 160 121 701 2025-26 88 73 114 121 116 125 160 708 2026-27 88 73 114 121 124 122 125 678 2027-28 88 73 114 121 124 129 121 683 2028-29 88 73 114 121 124 129 129 690
Note: The birth figures affecting school years through 2020-21 are actual geocoded data. The birth figures affecting 2021-22 and 2022-23 are calibrated representations of actual districtwide birth data. Birth figures for 2023-24 through 2028-29 are estimates based on the average of the last 6 years.

Penn Wynne ES PAST ENROLLMENT
B-K Method Used GRADE
YEAR BIRTHS KDG 1 2 3 4 5 TOTAL STUDENTS
6 years prior
2009-10 105 77 89 104 99 96 93 558 2010-11 114 71 97 90 99 107 94 558 2011-12 106 76 102 93 91 99 115 576 2012-13 88 87 105 106 97 96 102 593 2013-14 115 95 122 115 117 98 98 645 2014-15 106 101 116 128 114 117 106 682 2015-16 106 107 138 113 128 116 118 720 2016-17 112 97 139 136 120 125 121 738 2017-18 104 100 127 139 140 128 129 763 2018-19 104 91 132 128 138 144 127 760
Progressions
5 year avg.
B-K
0.933 K-1
1.303 1-2
1.003 2-3
1.015 3-4
1.018 4-5
1.031
PROJECTED ENROLLMENT
GRADE
YEAR BIRTHS KDG 1 2 3 4 5 TOTAL STUDENTS
2019-20 109 103 120 134 132 142 150 782 2020-21 109 103 134 121 136 134 147 776 2021-22 105 100 134 135 122 139 138 768 2022-23 103 97 130 134 137 124 143 765 2023-24 106 100 127 130 136 139 129 761 2024-25 106 99 129 126 131 138 142 765 2025-26 106 99 129 129 128 133 142 759 2026-27 106 99 129 129 131 130 138 756 2027-28 106 99 129 129 131 134 134 756 2028-29 106 99 129 129 131 134 138 760
Note: The birth figures affecting school years through 2020-21 are actual geocoded data. The birth figures affecting 2021-22 and 2022-23 are calibrated representations of actual districtwide birth data. Birth figures for 2023-24 through 2028-29 are estimates based on the average of the last 6 years.

Bala Cynwyd MS PAST ENROLLMENT
GRADE
YEAR 5th Grade* 6 7 8 TOTAL STUDENTS
Year Designated
2009-10 258 283 265 267 815 2010-11 282 268 295 268 831 2011-12 311 284 274 307 865 2012-13 283 318 292 283 893 2013-14 273 290 332 300 922 2014-15 281 280 299 322 901 2015-16 314 288 280 298 866 2016-17 346 339 298 278 915 2017-18 368 353 354 305 1,012 2018-19 323 365 353 345 1,063
Progressions 5-6 6-7 7-8
5 year avg. 1.028 1.022 0.991
PROJECTED ENROLLMENT
GRADE
YEAR 5th Grade* 6 7 8 TOTAL STUDENTS
2019-20 388 335 376 353 1,063 2020-21 374 399 342 373 1,113 2021-22 344 383 407 340 1,130 2022-23 377 349 390 403 1,142 2023-24 333 382 356 386 1,124 2024-25 387 344 397 360 1,100 2025-26 393 403 354 397 1,153 2026-27 368 410 413 352 1,175 2027-28 359 379 413 404 1,196 2028-29 372 368 386 408 1,163
* Unlike the births column on ES models, the 5th grade pertains to the year designated. For example, the 368 5th graders in 2017-18 became the 365 6th graders in 2018-19.
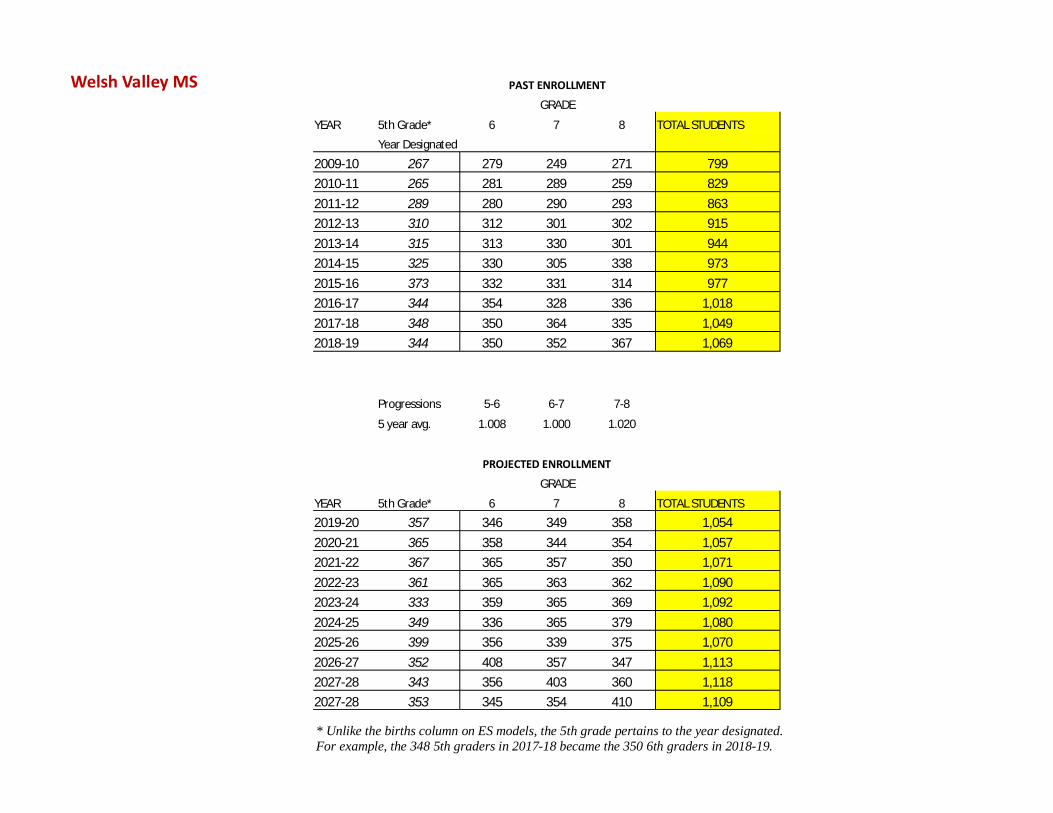
Welsh Valley MS PAST ENROLLMENT
GRADE
YEAR 5th Grade* 6 7 8 TOTAL STUDENTS
Year Designated
2009-10 267 279 249 271 799 2010-11 265 281 289 259 829 2011-12 289 280 290 293 863 2012-13 310 312 301 302 915 2013-14 315 313 330 301 944 2014-15 325 330 305 338 973 2015-16 373 332 331 314 977 2016-17 344 354 328 336 1,018 2017-18 348 350 364 335 1,049 2018-19 344 350 352 367 1,069
Progressions 5-6 6-7 7-8
5 year avg. 1.008 1.000 1.020
PROJECTED ENROLLMENT
GRADE
YEAR 5th Grade* 6 7 8 TOTAL STUDENTS
2019-20 357 346 349 358 1,054 2020-21 365 358 344 354 1,057 2021-22 367 365 357 350 1,071 2022-23 361 365 363 362 1,090 2023-24 333 359 365 369 1,092 2024-25 349 336 365 379 1,080 2025-26 399 356 339 375 1,070 2026-27 352 408 357 347 1,113 2027-28 343 356 403 360 1,118 2027-28 353 345 354 410 1,109
* Unlike the births column on ES models, the 5th grade pertains to the year designated. For example, the 348 5th graders in 2017-18 became the 350 6th graders in 2018-19.

PAST ENROLLMENT Harriton HS GRADE
High School Building projec ons recognize the historical pa ern of 8th graders within the expanded high school choice zone beginning with 8th graders in January of 2014.
The historical trend as of 2018 is a split of 54% choosing Harriton and 46% choosing Lower Merion.
The next page shows an alterna ve scenario where school choice flipped so that 45% choose Harriton and 55% choose Lower Merion.
YEAR 8th Grade* 9 10 11 12 TOTAL STUDENTS
Welsh V MS
2009-10 271 292 200 199 205 896 2010-11 259 277 307 214 213 1,011 2011-12 293 280 283 312 211 1,086 2012-13 302 299 282 296 311 1,188 2013-14 301 294 308 289 294 1,185 2014-15 338 295 283 300 292 1,170 2015-16 314 341 287 289 308 1,225 2016-17 336 294 350 287 299 1,230 2017-18 335 277 304 338 288 1,207 2018-19 367 285 282 312 332 1,211
8-9 9-10 10-11 11-12
5 year avg. 0.920 1.003 0.997 1.011
PROJECTED ENROLLMENT
GRADE
YEAR 8th Grade* 9 10 11 12 TOTAL STUDENTS
2019-20 358 337 285 280 315 1,217 2020-21 354 328 337 283 283 1,232 2021-22 350 325 329 336 286 1,276 2022-23 362 320 326 328 339 1,314 2023-24 369 331 320 324 331 1,307 2024-25 379 337 332 319 328 1,316 2025-26 375 345 337 330 322 1,334 2026-27 347 338 342 333 330 1,343 2027-28 360 315 342 344 339 1,341 2027-28 410 327 316 341 348 1,333
* Unlike the births column on ES models, the 8th grade pertains to the year designated. For example, the 335 8th graders in 2017-18 became the 285 9th graders in 2018-19.

Harriton HS Alterna ve Scenario 45/55 Choice Zone
High School Building projec ons account for the influence made by an expansion of the high school choice zone beginning with 8th graders in January of 2014.
This model assumes a scenario where 8th graders in the future choose to a end Harriton at a rate of 45% and Lower Merion at a rate of 55%.
PAST ENROLLMENT
GRADE
YEAR 8th Grade* 9 10 11 12 TOTAL STUDENTS
Welsh V MS
2009-10 271 292 200 199 205 896 2010-11 259 277 307 214 213 1,011 2011-12 293 280 283 312 211 1,086 2012-13 302 299 282 296 311 1,188 2013-14 301 294 308 289 294 1,185 2014-15 338 295 283 300 292 1,170 2015-16 314 341 287 289 308 1,225 2016-17 336 294 350 287 299 1,230 2017-18 335 277 304 338 288 1,207 2018-19 367 285 282 312 332 1,211
8-9 9-10 10-11 11-12
5 year avg. 0.883 1.003 0.997 1.011
PROJECTED ENROLLMENT
GRADE
YEAR 8th Grade* 9 10 11 12 TOTAL STUDENTS
2019-20 358 323 285 280 315 1,203 2020-21 354 315 323 283 283 1,205 2021-22 350 311 315 322 286 1,235 2022-23 362 307 312 315 325 1,259 2023-24 369 317 307 311 317 1,252 2024-25 379 323 318 306 314 1,261 2025-26 375 330 323 316 309 1,278 2026-27 347 324 328 319 316 1,287 2027-28 360 302 328 330 325 1,285 2027-28 410 313 303 327 333 1,277
* Unlike the births column on ES models, the 8th grade pertains to the year designated. For example, the 335 8th graders in 2017-18 became the 285 9th graders in 2018-19.

PAST ENROLLMENT Lower Merion HS GRADE
High School Building projec ons recognize the historical pa ern of 8th graders within the expanded high school choice zone beginning with 8th graders in January of 2014.
The historical trend as of 2018 is a split of 54% choosing Harriton and 46% choosing Lower Merion.
The next page shows an alterna ve scenario where school choice flipped so that 45% choose Harriton and 55% choose Lower Merion.
YEAR 8th Grade* 9 10 11 12 TOTAL STUDENTS
Bala Cynwyd MS
2009-10 267 310 328 364 401 1,403 2010-11 268 307 313 333 378 1,331 2011-12 307 293 306 323 338 1,260 2012-13 283 357 297 305 328 1,287 2013-14 300 320 369 298 313 1,300 2014-15 322 347 327 371 305 1,350 2015-16 298 370 361 339 373 1,443 2016-17 278 367 375 358 340 1,440 2017-18 305 370 373 369 371 1,483 2018-19 345 379 386 371 377 1,513
8-9 9-10 10-11 11-12
5 year avg. 1.222 1.027 1.002 1.018
PROJECTED ENROLLMENT
GRADE
YEAR 8th Grade* 9 10 11 12 TOTAL STUDENTS
2019-20 353 424 391 389 380 1,584 2020-21 373 431 436 393 397 1,657 2021-22 340 454 443 438 402 1,738 2022-23 403 413 467 446 447 1,773 2023-24 386 488 423 468 452 1,831 2024-25 360 467 501 424 475 1,867 2025-26 397 434 478 500 430 1,842 2026-27 352 474 441 475 504 1,893 2027-28 404 424 490 445 487 1,846 2027-28 408 487 436 492 453 1,867
* Unlike the births column on ES models, the 8th grade pertains to the year designated. For example, the 305 8th graders in 2017-18 became the 379 9th graders in 2018-19.

Lower Merion HS Alterna ve Scenario 45/55 Choice Zone
High School Building projec ons account for the influence made by an expansion of the high school choice zone beginning with 8th graders in January of 2014.
This model assumes a scenario where 8th graders in the future choose to a end Harriton at a rate of 45% and Lower Merion at a rate of 55%.
PAST ENROLLMENT
GRADE
YEAR 8th Grade* 9 10 11 12 TOTAL STUDENTS
Bala Cynwyd MS
2009-10 267 310 328 364 401 1,403 2010-11 268 307 313 333 378 1,331 2011-12 307 293 306 323 338 1,260 2012-13 283 357 297 305 328 1,287 2013-14 300 320 369 298 313 1,300 2014-15 322 347 327 371 305 1,350 2015-16 298 370 361 339 373 1,443 2016-17 278 367 375 358 340 1,440 2017-18 305 370 373 369 371 1,483 2018-19 345 379 386 371 377 1,513
8-9 9-10 10-11 11-12
5 year avg. 1.261 1.027 1.002 1.018
PROJECTED ENROLLMENT
GRADE
YEAR 8th Grade* 9 10 11 12 TOTAL STUDENTS
2019-20 353 437 392 389 380 1,598 2020-21 373 444 450 393 397 1,685 2021-22 340 468 457 452 401 1,779 2022-23 403 426 482 459 461 1,828 2023-24 386 503 436 482 466 1,886 2024-25 360 481 516 436 490 1,923 2025-26 397 447 493 515 443 1,898 2026-27 352 488 454 489 519 1,950 2027-28 404 437 505 459 502 1,902 2027-28 408 501 449 506 467 1,923
* Unlike the births column on ES models, the 8th grade pertains to the year designated. For example, the 305 8th graders in 2017-18 became the 379 9th graders in 2018-19.

Lower Merion School District Enrollment Projec ons, 2018-19 Update
Expanded Housing Adjustment Matrix This matrix shows the developments that accounted for the adjustment in the final model (See Page 19 for details on the adjustment). Each development lists the number of units and schoolchildren resul ng from that development in each of the next four years.
Development ES
Area Total Units
Units / Student Impact Total Student
Impact 2018 (Built) 2019 2020 2021 2022
Royal Athena*** CW 318 159/20.7 159/20.7 41.3 335 Righters Ferry** CW 210 210/21.0 21.0 150 Monument Rd** CW 206 206/20.6 20.6 10 Union Ave*** CW 112 112/14.6 14.6 9,11 Union Ave, 3-9 Cynwyd Rd* CW 74 74/4.4 4.4 121 City Avenue* CW 87 87/5.2 5.2 206-216 Bala Ave, 5-9 N Highland Ave* CW 86 86/5.2 5.2 9 Presiden al Blvd (Luxor)* CW 173 87/5.2 86/5.2 10.4 198 Elmwood*** ME 20 10/1.3 10/1.3 2.6 47-65 Cricket Ave* PV 77 77/4.6 4.6 39-41 E Montgomery Ave* PV 21 21/1.3 1.3 Coulter Ave Mixed-Use* PV 158 79/4.7 79/4.7 9.5 104-120 W Lancaster Ave* PW 35 35/2.1 2.1 24 Cricket Avenue* PW 110 110/6.6 6.6 6 Lancaster Ave (Palmer 2)*** PW 22 22/2.9 2.9 146-156 Cricket Ave (THs & twins)***** PW 19 8 11/3.4 3.4 424 Conway Ave (THs)**** BH 9 9/1.9 1.9 114 Forest Ave* BH 56 56/3.4 3.4 203 Haverford Ave* BH 16 16/1.0 1.0 100 Forest Ave* BH 8 8/0.5 0.5
Totals 1,817 8 470/49.9 501/39.2 600/47.8 238/25.4 162.3
Children / Unit Factors * = 0.06 children / unit ** = 0.10 children / unit *** = 0.13 children / unit ****= 0.21 children / unit ***** = 0.31 children / unit
43