measurement of progress with the implementation of the
TRANSCRIPT

Measurement of progress with the
implementation of the National
Development Plan (NDP): a six-year
analysisReport of the National Planning Commission
OCTOBER 19, 2018

M E A S U R E M E N T O F P R O G R E S S W I T H T H E I M P L E M E N T A T I O N O F T H E N A T I O N A L D E V E L O P M E N T P L A N ( N D P ) : A S I X - Y E A R A N A L Y S I S2
M E A S U R E M E N T O F P R O G R E S S W I T H T H E I M P L E M E N T A T I O N O F T H E N A T I O N A L D E V E L O P M E N T P L A N ( N D P ) : A S I X - Y E A R A N A L Y S I S 3
Executive summary
(conclusions and recommendations)
1 62 73
4
5
The NPC has reflected and examined why the radical improvement en-
visioned by the NDP has not been
realised six years after the NDP was
adopted.
The NPC has concluded that the
Medium Term Strategic Framework
(MTSF) does not measure the imple-
mentation of the NDP adequately. “The measurement of the one (the MTSF) does not result in the measure-ment of the other (the NDP).”
The NPC also concluded that in mea-suring implementation of the NDP, a
distinction must be drawn between
inputs (activity, or “what-we-are-busy-with”) and impact (outputs). Failure to distinguish between these often result in wrong, or at best, inadequate measurement. “If you cannot count what is important, you make what you count important.”
The NPC recommends that:
• The implementation of the NDP be measured using a simple structure of 3 Apex Priorities, 54 priorities
drawn from NDP chapters, and
159 indicators;
• This sharper, more focussed
approach be introduced for the
sixth administration that will run from 2019 – 2024.
The NPC appreciates that not all 159 indicators are currently capable of being measured and many will have to be improved over time. Therefore, the NPC recommends that the research
and academic capacity of our country
be activated, and resources be mo-
bilised and aligned through execu-
tive decision to source the data to
measure indicators, and over time, improve these.
The NPC recommends that over time the priorities and indicators must be adapted so that wherever possible we track the impact of progress with the priorities on youth, women and people with disabilities. This lens needs to be strengthened.
The NPC recommends that this document serves as a basis to engage
with the various sectors of society
and agree on a more visible and com-
mitted role for all sectors to support
the implementation of the NDP. This is to ensure that all South Africa – and not just the government – gets fully behind the implementation and mea-surement of progress with the NDP.
M E A S U R E M E N T O F P R O G R E S S W I T H T H E I M P L E M E N T A T I O N O F T H E N A T I O N A L D E V E L O P M E N T P L A N ( N D P ) : A S I X - Y E A R A N A L Y S I S4
Measurement & implementation of the NDP
It is all about impact
In August 2012, South Africa adopted the National Development Plan, Vision 2030, which set out a long-term vision and a plan to get us to a future that is vastly different to the one we inherited. The National Development Plan (NDP) is clear – South Africa can realise these goals by drawing on the energies of all its people, growing an inclusive economy and building capabilities. The NDP envisions a country where everyone feels free, yet are bound to others; where everyone embraces their full potential in pursuit of their dreams; a country where opportunity is determined not by birth, but by education and hard work. It is about promoting an active citizenry, leadership and partnerships throughout society.
To realise such a society, we need to transform the domestic economy, focus on efforts to enhance the capabilities of both the people and our country and build a more capable state. To eliminate poverty and reduce inequality, there should be an acceleration of growth in the economy; growth that benefits all South Africans. The NDP serves as a catalytic plan for securing the future of all South Africans.
All major political parties in Parliament, government and social partners adopted the
NDP in 2012. Yet six years later, we have not delivered on this covenant about our ideal future. Progress has been marginal, at best.
This document constitutes an independent effort to elevate, promote and advance the importance of NDP implementation. It also offers a view on how to achieve more progress through better implementation of the NDP, using a sharper lens and offers a novel and innovative approach for measuring and tracking progress, over time.
While much effort have been taken to align government actions with the NDP, in practice, different departments, spheres and entities continue to develop priorities and plans that are not in line with the NDP. Consequently, it had become urgent to distil a select number of critical game - changing priorities, stated and articulated in the NDP, focus on their implemen-tation and measure progress.
It was for this reason that the National Planning Commission (NPC) developed and proposed 54 NDP Priorities. The NPC held various meetings and workshops where inter alia it agreed:
• To take stock as regards what works and what did not work with NDP implementation;
• To do an assessment of progress with regard to the implementation of the NDP;
• To identify 54 NDP priorities;
• To develop indicators best suited to measure the 54 NDP Priorities; and
• Ensure better measurement of NDP imple-mentation through effective and relevant indicators, which could dovetail with planning in government for the 2019-2024 Administration.
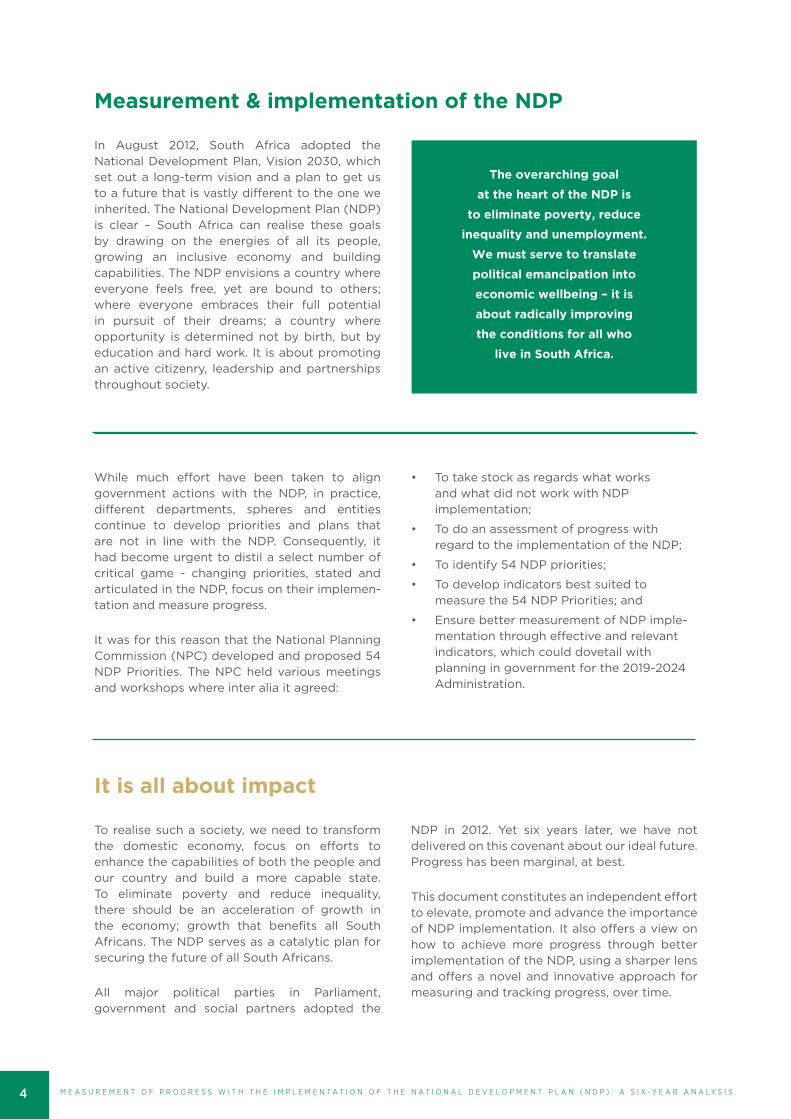
The overarching goal
at the heart of the NDP is
to eliminate poverty, reduce
inequality and unemployment.
We must serve to translate
political emancipation into
economic wellbeing – it is
about radically improving
the conditions for all who
live in South Africa.

M E A S U R E M E N T O F P R O G R E S S W I T H T H E I M P L E M E N T A T I O N O F T H E N A T I O N A L D E V E L O P M E N T P L A N ( N D P ) : A S I X - Y E A R A N A L Y S I S 5
Why has there been such limited impact?
What should be measured?
The NPC assessed the lack of radically improved progress with the alleviation of poverty, inequality and unemployment; and concluded that the objectives and actions in the NDP are fairly clear, but implementation and measurement is inadequate. South Africa has a plethora of policies, frameworks and plans, but it is in the implementation of these that we battle.
The NPC concluded that the NDP is inadequately measured through the Medium Term Strategic Framework (the MTSF). The MTSF is an important tool of government, but it is not a sharp enough
measurement tool for tracking the implemen-tation of NDP priorities. For example, the MTSF measures progress with process-related targets with insufficient concomitant impacts. The tool used for measuring the implementation of the NDP must change and this must happen rather urgently. The NPC wants to be held accountable on its mandate to ensure the improvement of NDP implementation. To do so, it would require a step-change in how we measure the NDP priorities. What one cannot measure properly, one cannot manage properly.
If we want radically improved results, we must measure impact, not inputs. A critical distinction must therefore be drawn between “input” (activities or “what-we-are-busy-with”) on the one hand, and “output” or “impact” on the other. The NPC considers this transition in emphasis a critical necessity. Shifting the focus to deliverables that will yield impact is a better pathway to success.
Another critical observation was that the NDP underlines the principle of government, across the spheres, working together reinforcing a col-laborative, integrated and cooperative manner. In practise, however, we have seen evidence of a silo-approach that must be guarded against. It is also prudent to focus on a few important priorities and measure them accurately. If we try to make everything a priority, we end up doing very little. This is in line with international best practice. Countries that implemented national development plans successfully, like Botswana,
Malaysia and China, identified a small number of key priorities, typically between 3 and 10. These were then tracked and rigorously measured to monitor implementation. We recommend a similar approach for South Africa: prioritise, focus, and measure.
The NDP is 484 pages long. Chapters 1 and 2 are introductory. The remaining 13 chapters detail the changes we need to radically transform South Africa and to deal decisively with our overarching objectives of eliminating poverty, and reducing inequality and unemployment. The NPC used the chapters of the NDP as units of analysis. Through rigorous discussion, we identified a limited number of key, game-chang-ing priorities. In our assessment, these priorities, if measured properly, will produce radically different results.
The second NPC, appointed in September 2015, has, as a critical part of its mandate, the respon-sibility to advise government independently, without fear or favour, on how it is progressing with the implementation of the NDP. This report provides an informed analysis on how we are progressing with implementation of the NDP. It must be noted too that the NDP was not only a
plan for government; it was a plan for all South Africa. The NPC recommends that a strategy be developed to more deliberately and purposefully loop in the rest of society i.e. business, labour and civil society, into a new compact for NDP implementation; and that this document can be used for engagement with all these sectors of society.
M E A S U R E M E N T O F P R O G R E S S W I T H T H E I M P L E M E N T A T I O N O F T H E N A T I O N A L D E V E L O P M E N T P L A N ( N D P ) : A S I X - Y E A R A N A L Y S I S6
The NPC therefore recommends:
1. Focus on a limited number of priorities
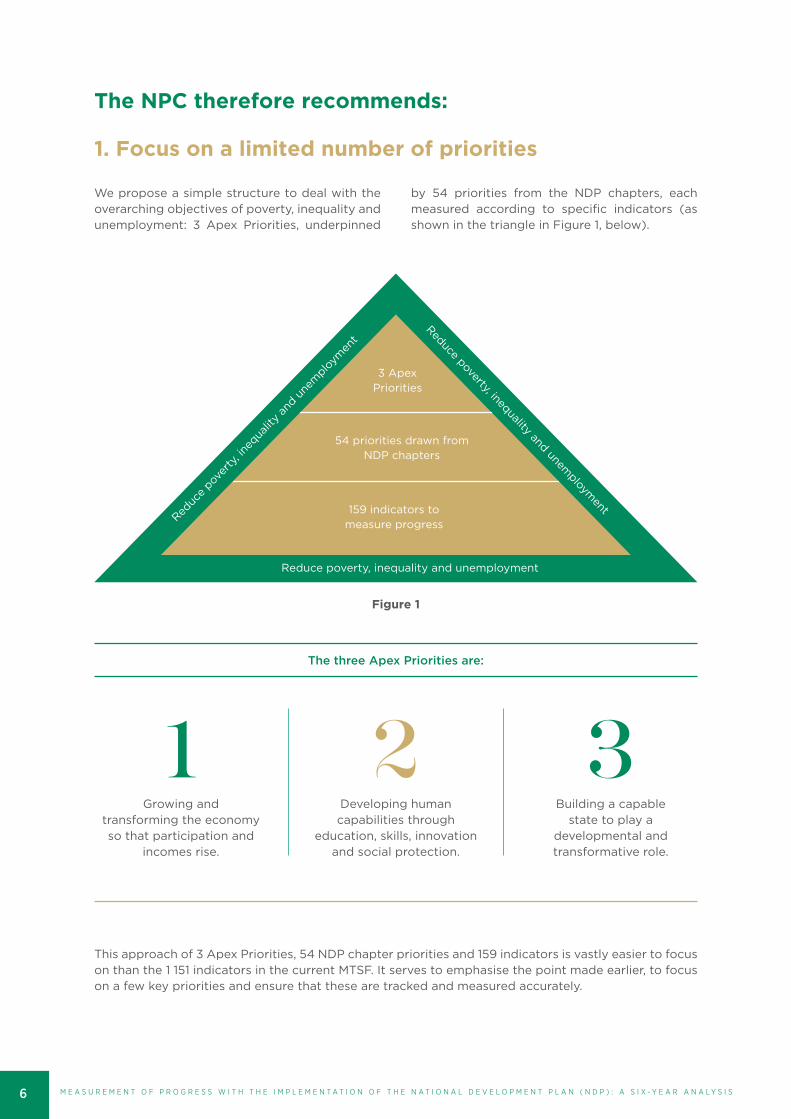
We propose a simple structure to deal with the overarching objectives of poverty, inequality and unemployment: 3 Apex Priorities, underpinned
by 54 priorities from the NDP chapters, each measured according to specific indicators (as shown in the triangle in Figure 1, below).
This approach of 3 Apex Priorities, 54 NDP chapter priorities and 159 indicators is vastly easier to focus on than the 1 151 indicators in the current MTSF. It serves to emphasise the point made earlier, to focus on a few key priorities and ensure that these are tracked and measured accurately.
The three Apex Priorities are:
Growing and transforming the economy so that participation and
incomes rise.
Building a capable state to play a
developmental and transformative role.
Developing human capabilities through
education, skills, innovation and social protection.
3 Apex Priorities
54 priorities drawn from NDP chapters
159 indicators to measure progress
Reduce poverty, inequality and unemployment
Reduc
e pov
erty
, ineq
ualit
y an
d une
mplo
ymen
t
Reduce poverty, inequality and unemploym
ent
Figure 1
1 2 3
M E A S U R E M E N T O F P R O G R E S S W I T H T H E I M P L E M E N T A T I O N O F T H E N A T I O N A L D E V E L O P M E N T P L A N ( N D P ) : A S I X - Y E A R A N A L Y S I S 7
Why these priorities?
2. Measurement
The three Apex Priorities correspond closely with what is proposed in the NDP (refer to page 17 of the NDP Executive Summary), but also seeks to emphasise the importance of social protection.
The three Apex Priorities were selected for their causal and direct linkages to efforts to reduce poverty, inequality and unemployment. Everyone can relate to the fact that we need a faster growing economy that includes more people; that we need to develop human capabilities more aggressively while also providing citizens with some form of protection. It is implicit that none of this is possible without a more capable state.
The 54 priorities from the chapters are the result of a rigorous process of focussing on those actions, which, in the NPC”s assessment, will have the biggest impact in the time available. These must be of a high-level strategic nature. Importantly, progress must lead to noticeable impact. The NPC also took the approach that less is more; if we focus on everything, we will focus on nothing. These priorities can be changed by future administrations as progress is made, conditions change and new iterations of the NDP are written. For now, the NPC”s assessment is that these priorities will help to implement the NDP faster and better.
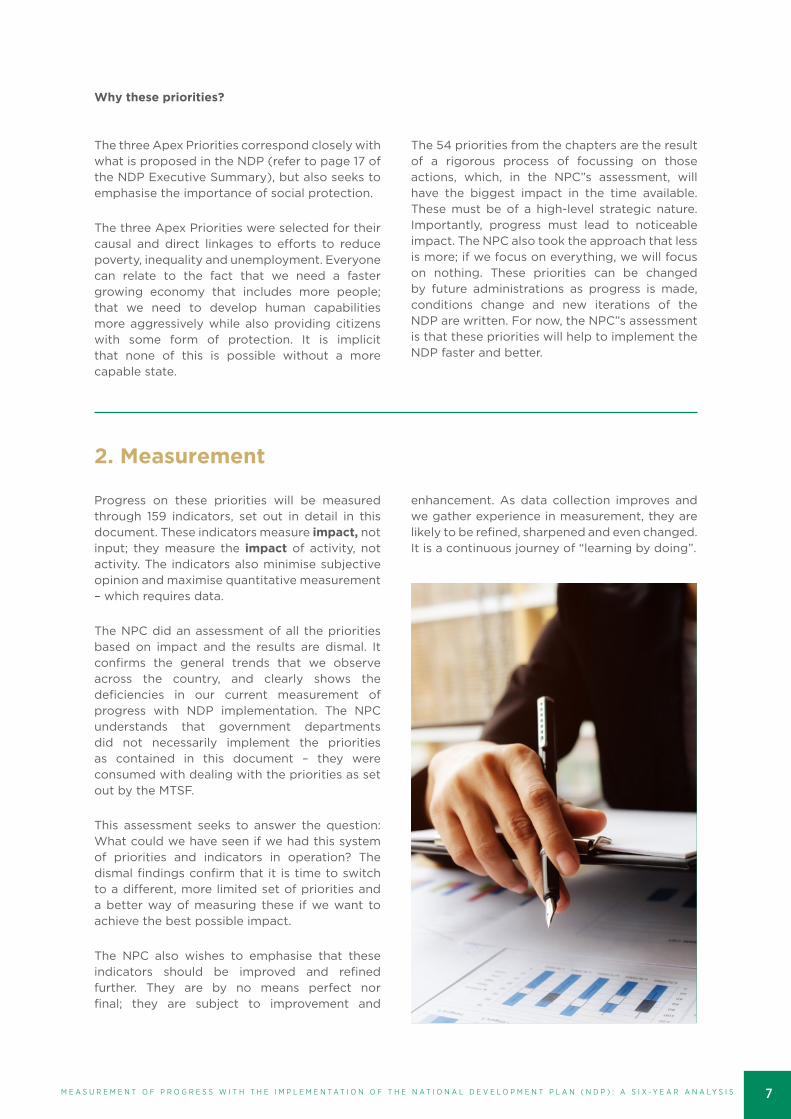
Progress on these priorities will be measured through 159 indicators, set out in detail in this document. These indicators measure impact, not input; they measure the impact of activity, not activity. The indicators also minimise subjective opinion and maximise quantitative measurement – which requires data.
The NPC did an assessment of all the priorities based on impact and the results are dismal. It confirms the general trends that we observe across the country, and clearly shows the deficiencies in our current measurement of progress with NDP implementation. The NPC understands that government departments did not necessarily implement the priorities as contained in this document – they were consumed with dealing with the priorities as set out by the MTSF.
This assessment seeks to answer the question: What could we have seen if we had this system of priorities and indicators in operation? The dismal findings confirm that it is time to switch to a different, more limited set of priorities and a better way of measuring these if we want to achieve the best possible impact.
The NPC also wishes to emphasise that these indicators should be improved and refined further. They are by no means perfect nor final; they are subject to improvement and
enhancement. As data collection improves and we gather experience in measurement, they are likely to be refined, sharpened and even changed. It is a continuous journey of “learning by doing”.

M E A S U R E M E N T O F P R O G R E S S W I T H T H E I M P L E M E N T A T I O N O F T H E N A T I O N A L D E V E L O P M E N T P L A N ( N D P ) : A S I X - Y E A R A N A L Y S I S8
3. Sourcing missing data
4. Measuring progress in the areas of youth, gender and persons with disabilities
How the 3 Apex Priorities and 54 NDP chapter priorities fit together
The proposed indicators require reliable data and loads of it. Data availability limits the scope for subjective assessments and forces the attention to where there are performance gaps.
However, this assessment shows that such data exists abundantly in some areas (e.g. the economy) but are scarce in others (e.g. environ-mental sustainability). Even where the data does exist, it has not necessarily been collected in a format that enables the measurement of these new indicators. Data has not been captured for nearly half the indicators proposed herein.
We therefore recommend, and indeed build on an idea in the NPC Green Paper, that the research and academic capacity of our country be activated, and resources made available through executive decision, for the data collation, development, and improvement to enable better NDP measurement. It is specifically proposed that strong partnerships be agreed with universities, the Human Science Research Council and the CSIR to help with this area.
We recommend that over time, the priorities and indicators must be adapted so that in every priority area, where possible, we track progress on how the priorities advance and
impact the cause of youth, women and persons with disabilities. Thus, we recommend that we strengthen the lens of gender, youth and persons with disabilities.
The 3 Apex Priorities cover the entire NDP and are transversal, interdependent and transforma-tional.
For example, education falls under Apex 2, but it is also a vital contributor to the economy, Apex 1 and building a capable state in Apex 3. Building a capable state falls under Apex 3, but it really cuts across all the other chapters.
Likewise, within the Apex Priorities there are cross-cutting themes. Social protection is specifically discussed in Chapter 11, but the NPC also identified a social protection floor as an element of social cohesion, discussed in Chapter 15. Both these elements are part of Apex 2 – developing human capability.
Therefore, when we allocate each of the 13 NDP chapters to the Apex Priority it most closely corresponds with (Figure 2), we do so purely for the sake of clarity and ease of reference. The reality is that they are all integrated.
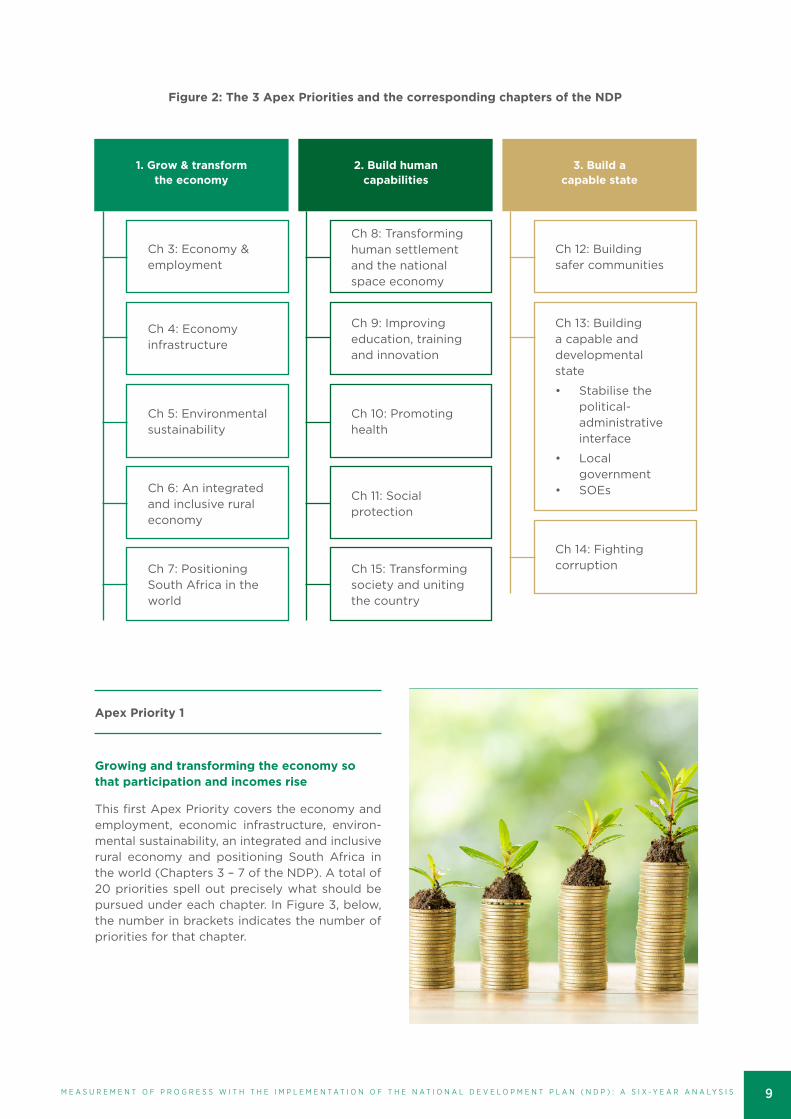
M E A S U R E M E N T O F P R O G R E S S W I T H T H E I M P L E M E N T A T I O N O F T H E N A T I O N A L D E V E L O P M E N T P L A N ( N D P ) : A S I X - Y E A R A N A L Y S I S 9
Apex Priority 1
Growing and transforming the economy so that participation and incomes rise
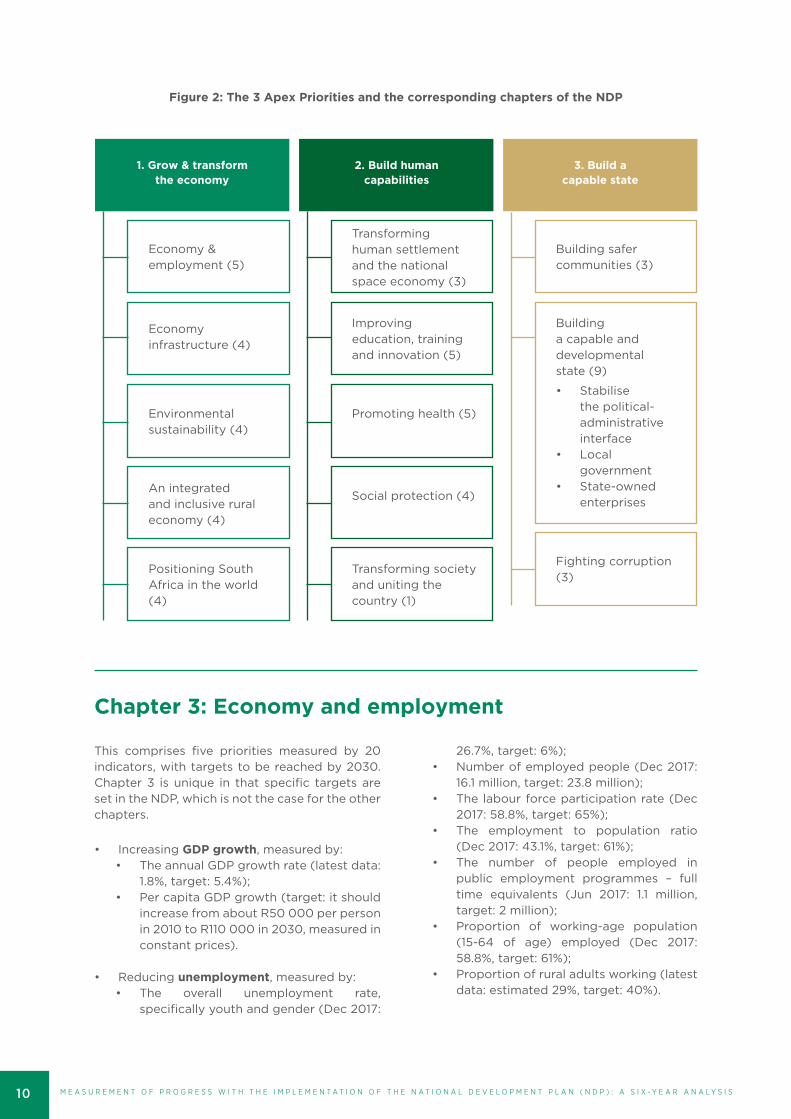
This first Apex Priority covers the economy and employment, economic infrastructure, environ-mental sustainability, an integrated and inclusive rural economy and positioning South Africa in the world (Chapters 3 – 7 of the NDP). A total of 20 priorities spell out precisely what should be pursued under each chapter. In Figure 3, below, the number in brackets indicates the number of priorities for that chapter.
Figure 2: The 3 Apex Priorities and the corresponding chapters of the NDP
1. Grow & transform the economy
2. Build human capabilities
3. Build a capable state
Ch 3: Economy & employment
Ch 8: Transforming human settlement and the national space economy
Ch 12: Building safer communities
Ch 4: Economy infrastructure
Ch 9: Improving education, training and innovation
Ch 13: Building a capable and developmental state
• Stabilise the political-administrative interface
• Local government
• SOEs
Ch 5: Environmental sustainability
Ch 10: Promoting health
Ch 6: An integrated and inclusive rural economy
Ch 11: Social protection
Ch 7: Positioning South Africa in the world
Ch 15: Transforming society and uniting the country
Ch 14: Fighting corruption
M E A S U R E M E N T O F P R O G R E S S W I T H T H E I M P L E M E N T A T I O N O F T H E N A T I O N A L D E V E L O P M E N T P L A N ( N D P ) : A S I X - Y E A R A N A L Y S I S10
Chapter 3: Economy and employment
This comprises five priorities measured by 20 indicators, with targets to be reached by 2030. Chapter 3 is unique in that specific targets are set in the NDP, which is not the case for the other chapters.
• Increasing GDP growth, measured by:• The annual GDP growth rate (latest data:
1.8%, target: 5.4%); • Per capita GDP growth (target: it should
increase from about R50 000 per person in 2010 to R110 000 in 2030, measured in constant prices).
• Reducing unemployment, measured by:• The overall unemployment rate,
specifically youth and gender (Dec 2017:
26.7%, target: 6%);• Number of employed people (Dec 2017:
16.1 million, target: 23.8 million);• The labour force participation rate (Dec
2017: 58.8%, target: 65%);• The employment to population ratio
(Dec 2017: 43.1%, target: 61%); • The number of people employed in
public employment programmes – full time equivalents (Jun 2017: 1.1 million, target: 2 million);
• Proportion of working-age population (15-64 of age) employed (Dec 2017: 58.8%, target: 61%);
• Proportion of rural adults working (latest data: estimated 29%, target: 40%).
Figure 2: The 3 Apex Priorities and the corresponding chapters of the NDP
1. Grow & transform the economy
2. Build human capabilities
3. Build a capable state
Economy & employment (5)
Transforming human settlement and the national space economy (3)
Building safer communities (3)
Economy infrastructure (4)
Improving education, training and innovation (5)
Building a capable and developmental state (9)
• Stabilise the political-administrative interface
• Local government
• State-owned enterprises
Environmental sustainability (4)
Promoting health (5)
An integrated and inclusive rural economy (4)
Social protection (4)
Positioning South Africa in the world (4)
Transforming society and uniting the country (1)
Fighting corruption (3)

M E A S U R E M E N T O F P R O G R E S S W I T H T H E I M P L E M E N T A T I O N O F T H E N A T I O N A L D E V E L O P M E N T P L A N ( N D P ) : A S I X - Y E A R A N A L Y S I S 11
Assessing progress:
Figure 41
1 “Indicator achieved” means an indicator has been fulfilled; “partly achieved” indicates progress has been made to achieve the indicator, but it has not been fulfilled yet; “not achieved” means the indicator has not been met and no significant progress has been made to fulfilled it; and “no data” means sufficient information is not available.
The indicators show that none of the targets for GDP growth, employment and investment have been reached. Progress was made with poverty reduction, but it was reversed, and the target will not be met. The “proportion of the population living below R418 per month in 2009 prices” has declined from 51% to 36% by 2011 but has since then risen again to 40% currently (against a target of 0%). The priority of improving equity
will likewise not be met, although one indicator reflects improvement: “the share of income going to the bottom 40%” improved from 6% to 8.3% in 2015. The NDP target is 10%.
It is clear from the results of the indicators is that the 5 priorities on the economy and employment have not been met.
• Increasing investment by government and the private sector, measured by:• Gross fixed capital formation (2017: 18.7%
of GDP, target: 30% of GDP);• Public sector contribution (2016: 7.6% of
GDP, target: 10% of GDP);• Private sector contribution (latest data:
11.9% of GDP, target: 20% of GDP);• National savings (latest data: 16% of GDP,
target: 25% of GDP).
• Poverty reduction as measured by:• Average dependency ratio (latest data:
4.1 people per breadwinner, target: 2.5); • Dependency ratio in low-income
households (latest data: 5 – 6, target: 4 - 5);
• Proportion of population below poverty line of R418 per month in 2009 prices (latest data: 39%, target: 0%).
• Improving equity as measured by:• Declining income inequality, measured
by Gini co-efficient (latest data: 0.7, target: 0.6);
• Proportion of national income earned by bottom 40% (latest data: 6%, target: 10%);
• Proportion of population with access to transactional financial services and savings facilities (latest data: 63%, target: 90%);
• Improved ownership of assets and security of tenure.
Ch Title Number of indicators
Indicators achieved
Partly achieved
Not achieved
No data
Conclusion: priorities achieved
3 Economy & employment (5 priorities)
20 1 1 17 1 0

M E A S U R E M E N T O F P R O G R E S S W I T H T H E I M P L E M E N T A T I O N O F T H E N A T I O N A L D E V E L O P M E N T P L A N ( N D P ) : A S I X - Y E A R A N A L Y S I S12
Chapter 4: Economic infrastructure
Assessing progress:
This comprises four priorities measured by 19 indicators.
• The energy priority2 covers an improved and efficient regulatory authority; certainty in the energy mix and pricing path; improved access and competition to reduce cost and improved maintenance of distribution capacity of municipalities, measured by:• Expanded access to energy ensuring
universal on-grid or off-grid access at affordable tariffs and through targeted sustainable subsidies, where needed;
• Increased electricity capacity by at least 20 000 MW from renewable sources;
• Adequate investment in energy infra-structure;
• Increased investment in natural gas infra-structure;
• Reduced pollution and mitigating the effects of climate change by supporting sustainable green energy initiatives;
• Increased energy efficiency and greater use of hybrid or electric vehicles for public and private transport;
• Improved collaboration between key stakeholders in the energy sector including, amongst others, government, SOEs, industry, organised labour and civil society;
• Increased efficiency and reduced emissions for existing coal extraction, transportation, conversion and end-use through innovation and technology.
• Improved access, efficiency and cost of transport, measured by:• Access to cheaper and competitive rail
cost that lowers cost of transport;• A shift from road to rail through cost and
efficiency;• Proportion of population using public
transport;• Number of containers handled at port of
entries (latest data: 25 moves per hour; target: 35);
• Investment in rail infrastructure for coal.
• Improved management of water resources and water usage, measured by:• Enhance, protect and maintain water
resources through improved water resource management;
• Develop a long-term financing framework for water infrastructure that will be sustainable;
• Promote better water use and water intelligence.
• Improved access to telecommunications infrastructure, at affordable prices, measured by:• Broadband coverage (target: available to
all households by 2020);• Lower data cost;• Proportion of population with access to
low-cost, high-speed internet.
On “expanded access to energy”, access to electricity specifically is nearing 90%. The target of universal access by 2030 is likely to be met with continual investments in existing and/or new energy access programmes.
On “increased electricity capacity by at least 20 000 MW from renewable sources”, 4 000 MW of renewable energy capacity has been awarded of which 3 260 MW is currently operational. Additional procurement is needed. If not, this target will probably not be met. Thus, we
conclude this target may be considered as partially achieved.
About “adequate investment in energy in-frastructure”, it is not being achieved. As an example, currently R35 billion is budgeted relative to needs of R100 billion to ensure network adequacy. The DoE will be asked to develop adequacy indicators across the supply chain for liquid fuels, electricity and heating/cooling infrastructure. Thus, at this stage, this target has not been met.
2 For a more thorough discussion on the descriptive narrative, please refer to the Energy Discussion Paper produced by the National Planning Commission.

M E A S U R E M E N T O F P R O G R E S S W I T H T H E I M P L E M E N T A T I O N O F T H E N A T I O N A L D E V E L O P M E N T P L A N ( N D P ) : A S I X - Y E A R A N A L Y S I S 13
With regards to “Increased investment in natural gas infrastructure”, this has not yet been achieved. Bulk natural gas infrastructure investments have not been made and development has been slow.
On “reducing pollution and mitigating the effects of climate change by supporting sustainable green energy initiatives”: there is no data available. The DoE will be asked to provide the same.
For the “promote increased energy efficiency and greater use of hybrid or electric vehicles for public and private transport” indicator, the NPC has some of the information necessary but a better data set and starting point is required. At this stage, minimal progress has been made on this target and it is unlikely to be met without significant changes.
The indicator “improved collaboration between key stakeholders in the energy sector including, amongst others, government, SOEs, industry, organised labour and civil society” has not been achieved. A clear example of this is the out-of-date integrated energy-planning framework, which has resulted in a lack of the necessary policy certainty and direction.
With regards to “increased efficiency and reduced emissions as part of existing coal extraction, transportation, conversion and end-use through innovation and technology”, this is a new indicator and data will need to be obtained from responsible entities including, amongst others the DoE, DST and DMR.
On the transport priority, recent data has been provided on four of the five indicators. Data from 2014 exists, but the NPC recommends that new surveys be done by the Department of
Transport to update the data. On the indicator, “the number of containers handled at ports of entries”, currently 25 moves per hour are being achieved against a target of 35. Overall, the transport priority has not been achieved.
On the water priority, available data shows that the first indicator “enhancement, protection and improvement of water resources through improved water resource management” has not been met. Exposure to degradation and loss is very high, threatening South Africa’s water ecosystem. South Africa’s water bodies, both surface and underground, have shown a deteri-oration in water quality. Approximately 83% of national monitoring sites reflected water quality challenges (2018), meaning that less than 20% of water bodies in South Africa has acceptable levels of water quality. On the second indicator, “a long-term financing framework for water infrastructure” has not been developed and sub-optimal decisions are being taken. The third indicator, “better use of water and water intelligence” was achieved because of the recent droughts. There is currently insufficient data on other changes in water efficiency. Based on progress with these indicators, the conclusion is that the water priority has not been met.
On telecommunications, “broadband coverage” has expanded with 3G available for 99% of the population, 4G is available for 77% of the population, mobile broadband subscription is at 88 per 100 people, and fixed line at 2.8 per 100 people in 2016. The target of all households being covered with broadband by 2020 should be met. However, “data costs” are still very high. The target of access to low-cost, high-speed internet has not been achieved. With two indicators not achieved, the overall priority has not been met.
Figure 5
Ch Title Number of indicators
Indicators achieved
Partly achieved
Not achieved
No data
Conclusion: priorities achieved
4 Economy in-frastructure (4 priorities)
19 0 3 9 7 0

M E A S U R E M E N T O F P R O G R E S S W I T H T H E I M P L E M E N T A T I O N O F T H E N A T I O N A L D E V E L O P M E N T P L A N ( N D P ) : A S I X - Y E A R A N A L Y S I S14
Chapter 5: Environmental sustainability
This comprises four priorities measured by 13 indicators.
• A reduction of total greenhouse gas emissions, measured by:• A reduction in total greenhouse gas
emissions per year
• Financial institutions to reflect climate, en-vironmental and social risks, measured by:• Number of financial institutions and asset
management companies (public and private) adopting climate, environmen-tal and social risk criteria in investment decisions;
• Number of financial institutions setting up new accounting systems that internalises externality costs;
• Real economic and social value of natural resources reflected in GDP measurement on the ecological system;
• The extent to which economic policies and decision making, financial investments and business decisions are affected.
• Building human capacity and resilience in dealing with climate change, measured by:• Rate of investment in climate-resilient
and environmentally sensitive social and economic infrastructure
• Number of green jobs created per annum;
• Number of educational institutions introducing curricula in sustainable and climate change fields;
• Increased investment in new agricultural technologies, research and development;
• Rand value of investment in research and development for climate change adaptation strategies.
• Addressing ecosystem vulnerability and resilience, measured by:• Number of protected and maintained
ecological infrastructure systems;• Number of improved ecosystem services
(quality of water, air, land and food security, waste management);
• Reduced rate of ecosystem loss (water, agriculture, biodiversity, human) due to climate impact is reduced.
Assessing progress:
On the priority of a reduction in greenhouse gas emissions, available data shows emissions have increased across most sectors of the economy, by 18.4% since 2000. The waste sector shows the biggest jump, but the energy sector remains the highest emitter in South Africa. Data is collected by the Department of Environmental Affairs and
is available until 2012. Data up to and until 2015 will be released later this year.
On the remaining three priorities, with their 12 indicators, no data is currently available. The relevant stakeholders will have to be engaged to collate the requisite data.
Figure 6
Ch Title Number of indicators
Indicators achieved
Partly achieved
Not achieved
No data
Conclusion: priorities achieved
5 Environmental sustainability (4 priorities)
13 0 0 1 12 0
M E A S U R E M E N T O F P R O G R E S S W I T H T H E I M P L E M E N T A T I O N O F T H E N A T I O N A L D E V E L O P M E N T P L A N ( N D P ) : A S I X - Y E A R A N A L Y S I S 15
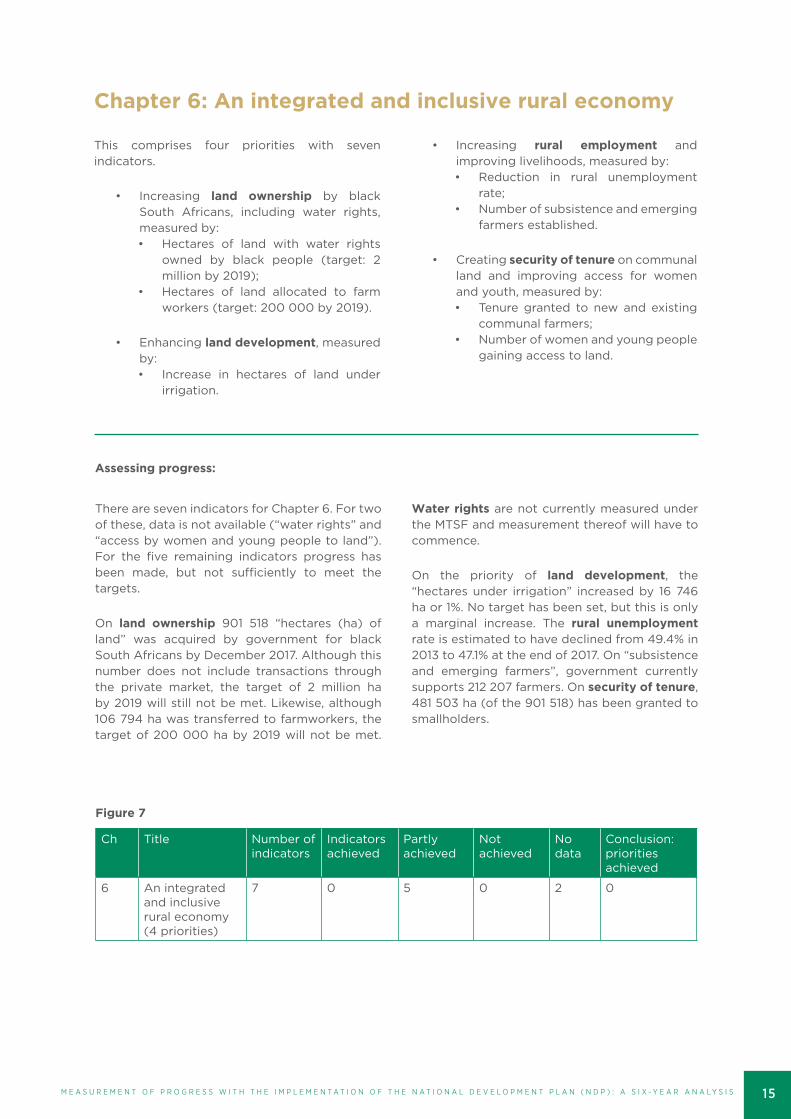
Chapter 6: An integrated and inclusive rural economy
This comprises four priorities with seven indicators.
• Increasing land ownership by black South Africans, including water rights, measured by:• Hectares of land with water rights
owned by black people (target: 2 million by 2019);
• Hectares of land allocated to farm workers (target: 200 000 by 2019).
• Enhancing land development, measured by:• Increase in hectares of land under
irrigation.
• Increasing rural employment and improving livelihoods, measured by:• Reduction in rural unemployment
rate;• Number of subsistence and emerging
farmers established.
• Creating security of tenure on communal land and improving access for women and youth, measured by:• Tenure granted to new and existing
communal farmers;• Number of women and young people
gaining access to land.
Assessing progress:
There are seven indicators for Chapter 6. For two of these, data is not available (“water rights” and “access by women and young people to land”). For the five remaining indicators progress has been made, but not sufficiently to meet the targets.
On land ownership 901 518 “hectares (ha) of land” was acquired by government for black South Africans by December 2017. Although this number does not include transactions through the private market, the target of 2 million ha by 2019 will still not be met. Likewise, although 106 794 ha was transferred to farmworkers, the target of 200 000 ha by 2019 will not be met.
Water rights are not currently measured under the MTSF and measurement thereof will have to commence.
On the priority of land development, the “hectares under irrigation” increased by 16 746 ha or 1%. No target has been set, but this is only a marginal increase. The rural unemployment rate is estimated to have declined from 49.4% in 2013 to 47.1% at the end of 2017. On “subsistence and emerging farmers”, government currently supports 212 207 farmers. On security of tenure, 481 503 ha (of the 901 518) has been granted to smallholders.
Figure 7
Ch Title Number of indicators
Indicators achieved
Partly achieved
Not achieved
No data
Conclusion: priorities achieved
6 An integrated and inclusive rural economy (4 priorities)
7 0 5 0 2 0
M E A S U R E M E N T O F P R O G R E S S W I T H T H E I M P L E M E N T A T I O N O F T H E N A T I O N A L D E V E L O P M E N T P L A N ( N D P ) : A S I X - Y E A R A N A L Y S I S16
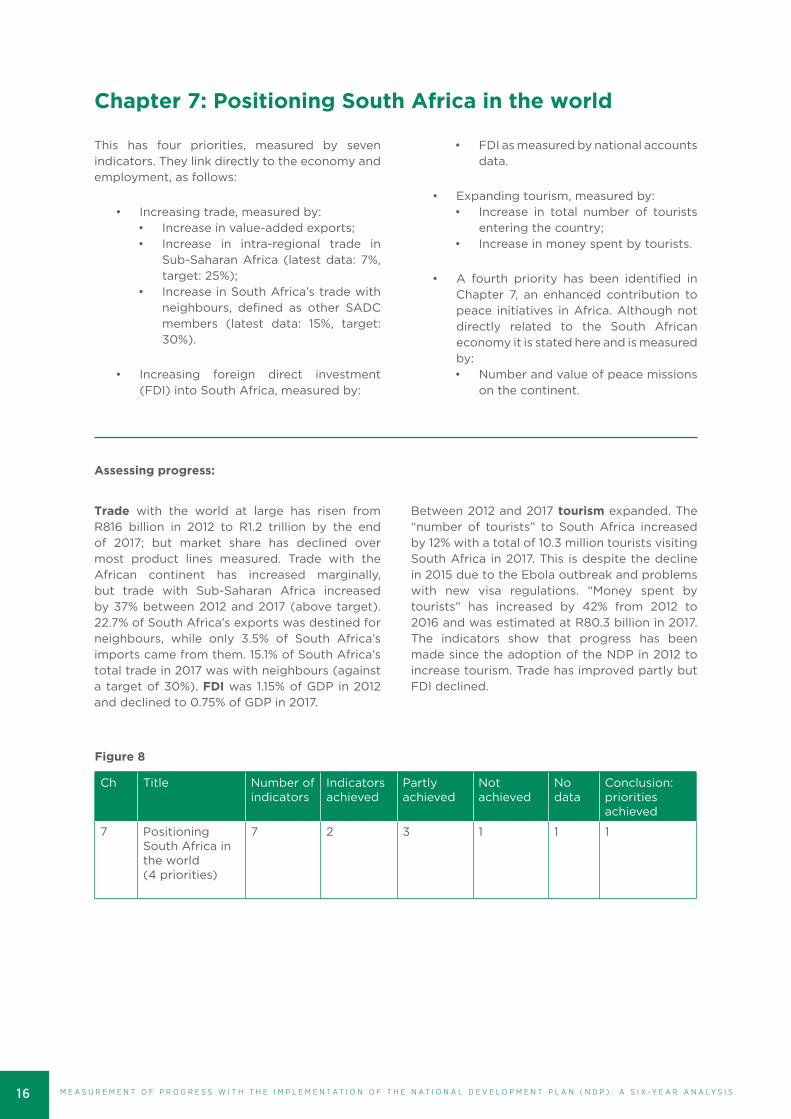
Chapter 7: Positioning South Africa in the world
This has four priorities, measured by seven indicators. They link directly to the economy and employment, as follows:
• Increasing trade, measured by:• Increase in value-added exports;• Increase in intra-regional trade in
Sub-Saharan Africa (latest data: 7%, target: 25%);
• Increase in South Africa’s trade with neighbours, defined as other SADC members (latest data: 15%, target: 30%).
• Increasing foreign direct investment (FDI) into South Africa, measured by:
• FDI as measured by national accounts data.
• Expanding tourism, measured by:• Increase in total number of tourists
entering the country; • Increase in money spent by tourists.
• A fourth priority has been identified in Chapter 7, an enhanced contribution to peace initiatives in Africa. Although not directly related to the South African economy it is stated here and is measured by:• Number and value of peace missions
on the continent.
Assessing progress:
Trade with the world at large has risen from R816 billion in 2012 to R1.2 trillion by the end of 2017; but market share has declined over most product lines measured. Trade with the African continent has increased marginally, but trade with Sub-Saharan Africa increased by 37% between 2012 and 2017 (above target). 22.7% of South Africa’s exports was destined for neighbours, while only 3.5% of South Africa’s imports came from them. 15.1% of South Africa’s total trade in 2017 was with neighbours (against a target of 30%). FDI was 1.15% of GDP in 2012 and declined to 0.75% of GDP in 2017.
Between 2012 and 2017 tourism expanded. The “number of tourists” to South Africa increased by 12% with a total of 10.3 million tourists visiting South Africa in 2017. This is despite the decline in 2015 due to the Ebola outbreak and problems with new visa regulations. “Money spent by tourists” has increased by 42% from 2012 to 2016 and was estimated at R80.3 billion in 2017. The indicators show that progress has been made since the adoption of the NDP in 2012 to increase tourism. Trade has improved partly but FDI declined.
Figure 8
Ch Title Number of indicators
Indicators achieved
Partly achieved
Not achieved
No data
Conclusion: priorities achieved
7 Positioning South Africa in the world(4 priorities)
7 2 3 1 1 1
M E A S U R E M E N T O F P R O G R E S S W I T H T H E I M P L E M E N T A T I O N O F T H E N A T I O N A L D E V E L O P M E N T P L A N ( N D P ) : A S I X - Y E A R A N A L Y S I S 17
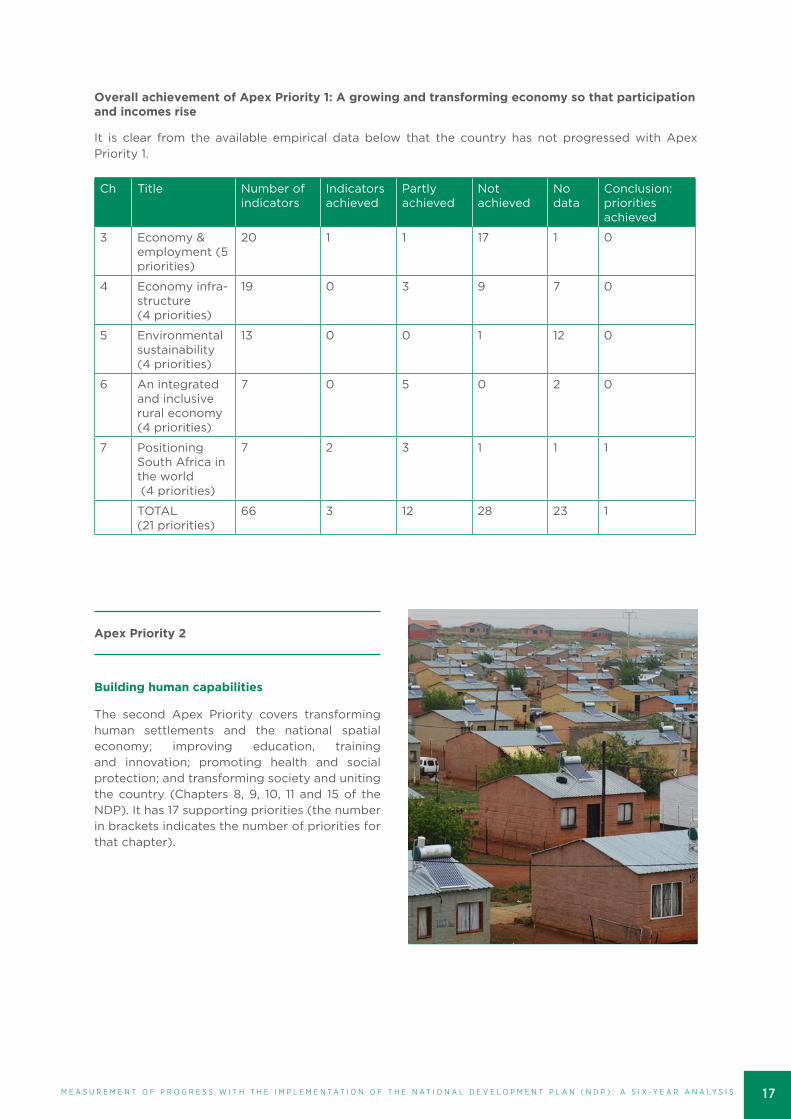
Overall achievement of Apex Priority 1: A growing and transforming economy so that participation and incomes rise
It is clear from the available empirical data below that the country has not progressed with Apex Priority 1.
Ch Title Number of indicators
Indicators achieved
Partly achieved
Not achieved
No data
Conclusion: priorities achieved
3 Economy & employment (5 priorities)
20 1 1 17 1 0
4 Economy infra-structure(4 priorities)
19 0 3 9 7 0
5 Environmental sustainability (4 priorities)
13 0 0 1 12 0
6 An integrated and inclusive rural economy (4 priorities)
7 0 5 0 2 0
7 Positioning South Africa in the world (4 priorities)
7 2 3 1 1 1
TOTAL(21 priorities)
66 3 12 28 23 1
Apex Priority 2
Building human capabilities
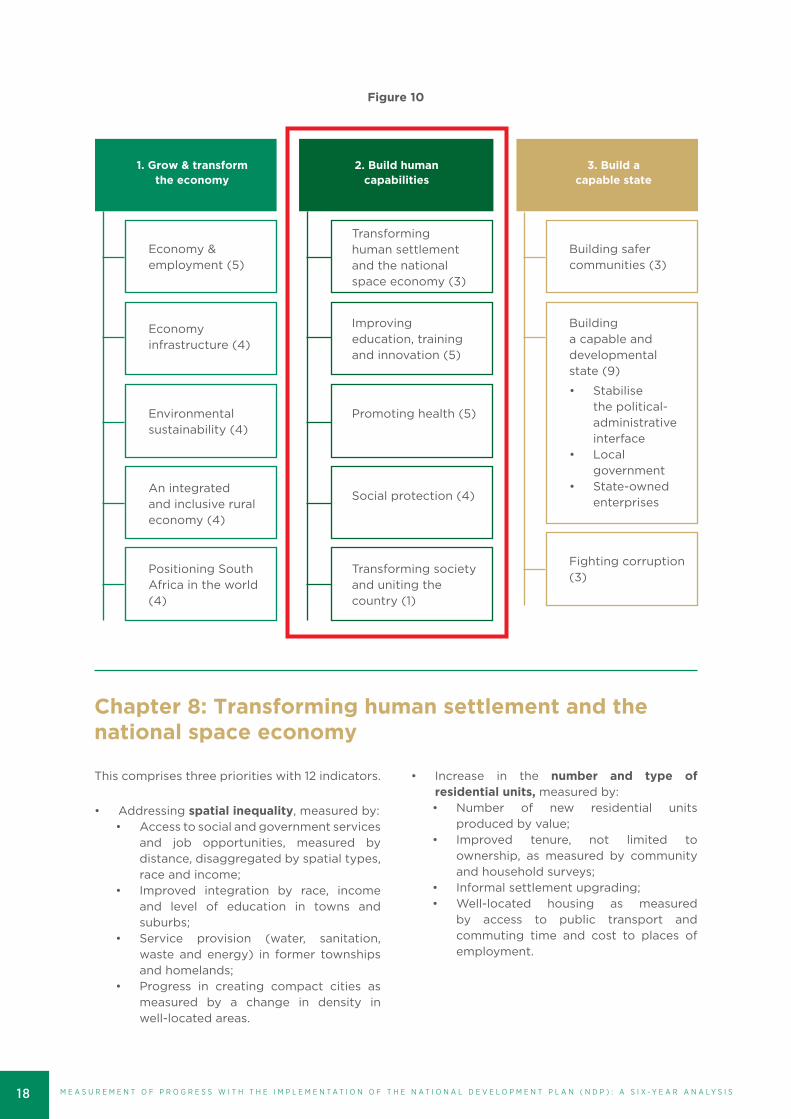
The second Apex Priority covers transforming human settlements and the national spatial economy; improving education, training and innovation; promoting health and social protection; and transforming society and uniting the country (Chapters 8, 9, 10, 11 and 15 of the NDP). It has 17 supporting priorities (the number in brackets indicates the number of priorities for that chapter).
M E A S U R E M E N T O F P R O G R E S S W I T H T H E I M P L E M E N T A T I O N O F T H E N A T I O N A L D E V E L O P M E N T P L A N ( N D P ) : A S I X - Y E A R A N A L Y S I S18
Chapter 8: Transforming human settlement and the national space economy
This comprises three priorities with 12 indicators.
• Addressing spatial inequality, measured by:• Access to social and government services
and job opportunities, measured by distance, disaggregated by spatial types, race and income;
• Improved integration by race, income and level of education in towns and suburbs;
• Service provision (water, sanitation, waste and energy) in former townships and homelands;
• Progress in creating compact cities as measured by a change in density in well-located areas.
• Increase in the number and type of residential units, measured by:• Number of new residential units
produced by value;• Improved tenure, not limited to
ownership, as measured by community and household surveys;
• Informal settlement upgrading;• Well-located housing as measured
by access to public transport and commuting time and cost to places of employment.
Figure 10
1. Grow & transform the economy
2. Build human capabilities
3. Build a capable state
Economy & employment (5)
Transforming human settlement and the national space economy (3)
Building safer communities (3)
Economy infrastructure (4)
Improving education, training and innovation (5)
Building a capable and developmental state (9)
• Stabilise the political-administrative interface
• Local government
• State-owned enterprises
Environmental sustainability (4)
Promoting health (5)
An integrated and inclusive rural economy (4)
Social protection (4)
Positioning South Africa in the world (4)
Transforming society and uniting the country (1)
Fighting corruption (3)
M E A S U R E M E N T O F P R O G R E S S W I T H T H E I M P L E M E N T A T I O N O F T H E N A T I O N A L D E V E L O P M E N T P L A N ( N D P ) : A S I X - Y E A R A N A L Y S I S 19
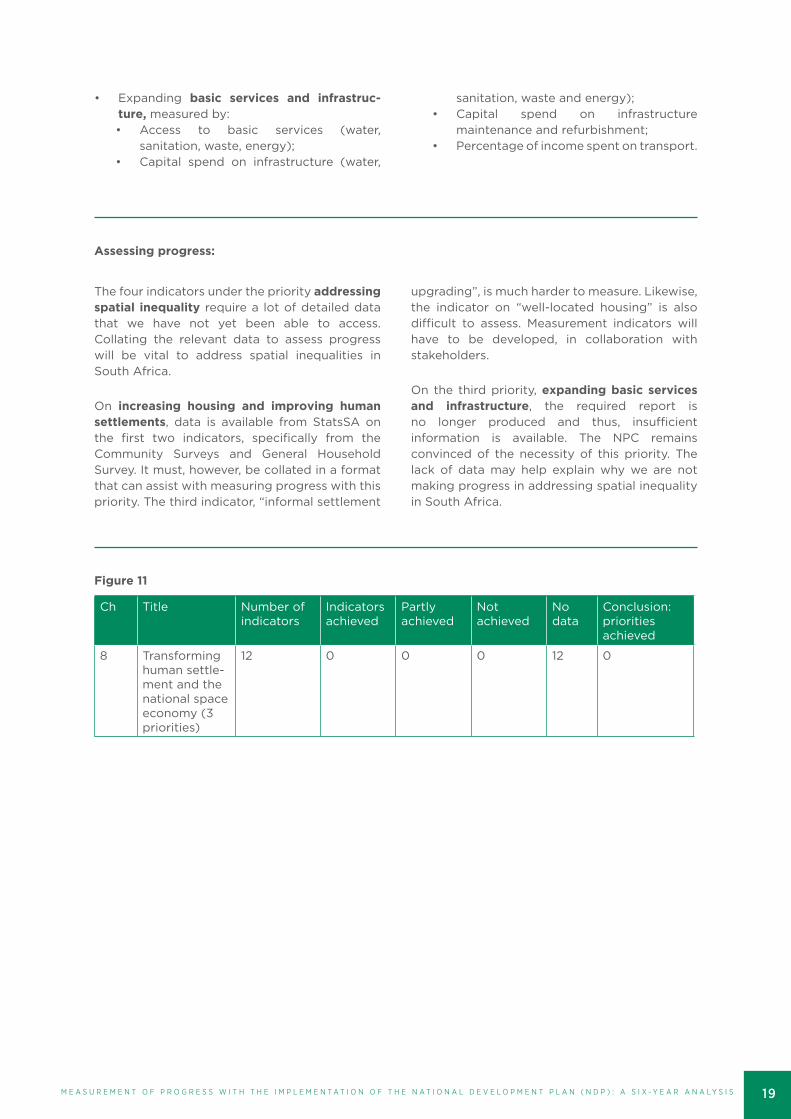
Assessing progress:
Figure 11
The four indicators under the priority addressing spatial inequality require a lot of detailed data that we have not yet been able to access. Collating the relevant data to assess progress will be vital to address spatial inequalities in South Africa.
On increasing housing and improving human settlements, data is available from StatsSA on the first two indicators, specifically from the Community Surveys and General Household Survey. It must, however, be collated in a format that can assist with measuring progress with this priority. The third indicator, “informal settlement
upgrading”, is much harder to measure. Likewise, the indicator on “well-located housing” is also difficult to assess. Measurement indicators will have to be developed, in collaboration with stakeholders.
On the third priority, expanding basic services and infrastructure, the required report is no longer produced and thus, insufficient information is available. The NPC remains convinced of the necessity of this priority. The lack of data may help explain why we are not making progress in addressing spatial inequality in South Africa.
• Expanding basic services and infrastruc-ture, measured by:• Access to basic services (water,
sanitation, waste, energy);• Capital spend on infrastructure (water,
sanitation, waste and energy);• Capital spend on infrastructure
maintenance and refurbishment;• Percentage of income spent on transport.
Ch Title Number of indicators
Indicators achieved
Partly achieved
Not achieved
No data
Conclusion: priorities achieved
8 Transforming human settle-ment and the national space economy (3 priorities)
12 0 0 0 12 0
M E A S U R E M E N T O F P R O G R E S S W I T H T H E I M P L E M E N T A T I O N O F T H E N A T I O N A L D E V E L O P M E N T P L A N ( N D P ) : A S I X - Y E A R A N A L Y S I S20
Chapter 9: Improving education, training and innovation
This comprises five priorities with 19 indicators.
• Strengthening the capability of learners entering the education system, measured by:• Percentage of learners entering quality
pre-school education (target: two years of compulsory schooling for all 4- and 5-year olds by 2030).
• Higher quality delivery in the classroom, measured by:• (Certain minimum requirements to be
met in various grades if a new national assessment strategy is introduced);
• Number of teachers suitably qualified for the subjects they teach;
• Availability of good materials, • Time spent teaching; • Improved teacher: student ratio;• Percentage of schools meeting
minimum standards for infrastructure (sanitation, water, electricity, libraries, and laboratories) (target: all schools to qualify by 2030).
• Building effective leadership at schools and district levels, measured by:• Percentage of principals suitably
qualified and officially appointed by DBE;• Percentage of principals with signed
performance agreements;• Percentage of schools with school
governing bodies;
• Improving the quality of teaching at TVET colleges and aligning it with the needs of industry, measured by:• Percentage of TVET lecturers who are
qualified pedagogically and profession-ally;
• TVET and artisan programme throughput rates;
• TVET graduate employment;• Percentage of students with access to
work-based learning;• Percentage of TVET colleges audited
by the Auditor-General for governance compliance.
• Improving the research and innovation capacity of South Africa, measured by:• Number of entry-level academic staff
provided with teaching and research opportunities from the teaching and research development grant;
• Percentage of university academic staff with PhDs;
• Number of post-graduate students per 100 000;
• Number of ISI-accredited articles and patents registered.
Assessing progress:
On the priority of pre-school education, progress has been made, but the target of two years of pre-school has not been met.
On the second priority, delivery in the class room, data is currently not collected on four indicators – “teachers’ qualifications”, “teacher absenteeism”, “time spent teaching” and “availability of materials”. On the teacher: student ratio, 31% of children are in classes bigger than 45 learners to one teacher. Data is not up to date on “school infrastructure” and new ways of collecting data on this crucial priority will have to be developed.
On building effective leadership in schools, the indicator “principals suitably qualified” has not been met, as the competency tests for principals have not yet been implemented; and no data is available on principals with signed performance contracts. 96% of schools have “school governing bodies”. However, an indicator to measure the effectiveness of these governing bodies must still be developed.
On TVET colleges, data is not currently available on lecturers who are “pedagogically and profes-sionally qualified”, “artisan throughput rates”, “graduate employment” and “percentage of students with access to work-based learning”. On assessment by the Auditor-General for

M E A S U R E M E N T O F P R O G R E S S W I T H T H E I M P L E M E N T A T I O N O F T H E N A T I O N A L D E V E L O P M E N T P L A N ( N D P ) : A S I X - Y E A R A N A L Y S I S 21
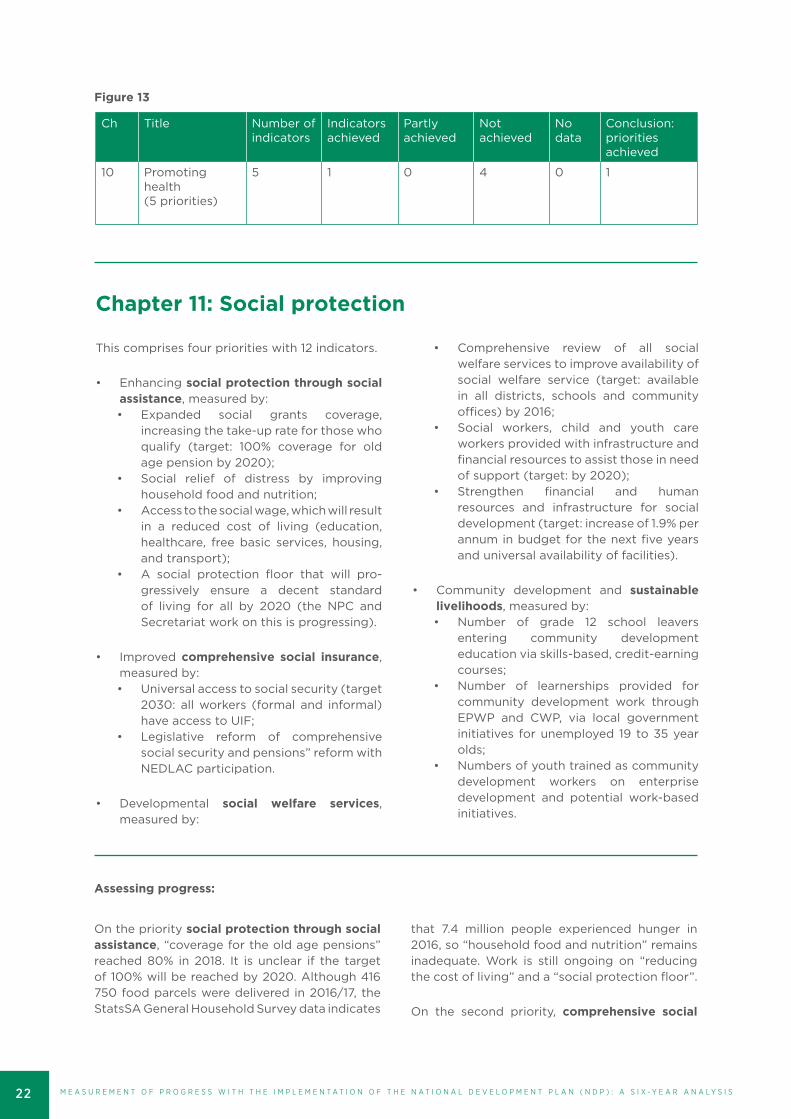
Chapter 10: Promoting health
This comprises five priorities with five indicators.
• Improving life expectancy:• 2015: 65 years, target by 2030: 70 years.
• Reducing the under-5 child mortality rate:• 2017: 42.4 deaths per 1 000 births, target
by 2030: fewer than 30.
• Reducing the infant mortality rate:• 2017: 32.8 per 1 000 births, target by
2030: fewer than 20.
• Reducing maternal mortality:• 2015: 138 deaths per 100 000 live births,
target by 2030: fewer than 100.
• Improving the quality of primary healthcare at clinics, measured by:• Number of ideal clinics established (2018:
1 507, target by 2019: 2 823).
Figure 12
Ch Title Number of indicators
Indicators achieved
Partly achieved
Not achieved
No data
Conclusion: priorities achieved
9 Improving education, training and innovation(5 priorities)
19 0 5 2 12 0
“governance compliance”, the process has started, but the results are not available yet.
On research, development and innovation 262 academic staff have been provided with
“research grants”; “45% of university lecturers have PhDs”; the total head count at university is at 1.1 million and 10 500 students are at post-graduate level. No data is available yet on “accredited articles and patents registered”.
Assessing progress:
Life expectancy is universally accepted as a basic and general indicator of wellbeing. It has increased from 56.1 years in 2012 to an estimated 67 years in 2017. Thus, this priority has been met and the 2030 target is most likely to be achieved. The priority of under-5 child mortality is unlikely to be reached; likewise, the target for maternal mortality is unlikely to be met, although infant mortality has improved. The priority on ideal clinics is really about infrastructure, an essential building block for the National Health Insurance system. To be classified as an “ideal clinic”, a clinic must meet 182 criteria. The target was for 2 823 such clinics to be established by 2019; 37% of that target was met by 2018. It is thus unlikely that this priority will be achieved. In short, four of the five priorities are unlikely to be met.
M E A S U R E M E N T O F P R O G R E S S W I T H T H E I M P L E M E N T A T I O N O F T H E N A T I O N A L D E V E L O P M E N T P L A N ( N D P ) : A S I X - Y E A R A N A L Y S I S22
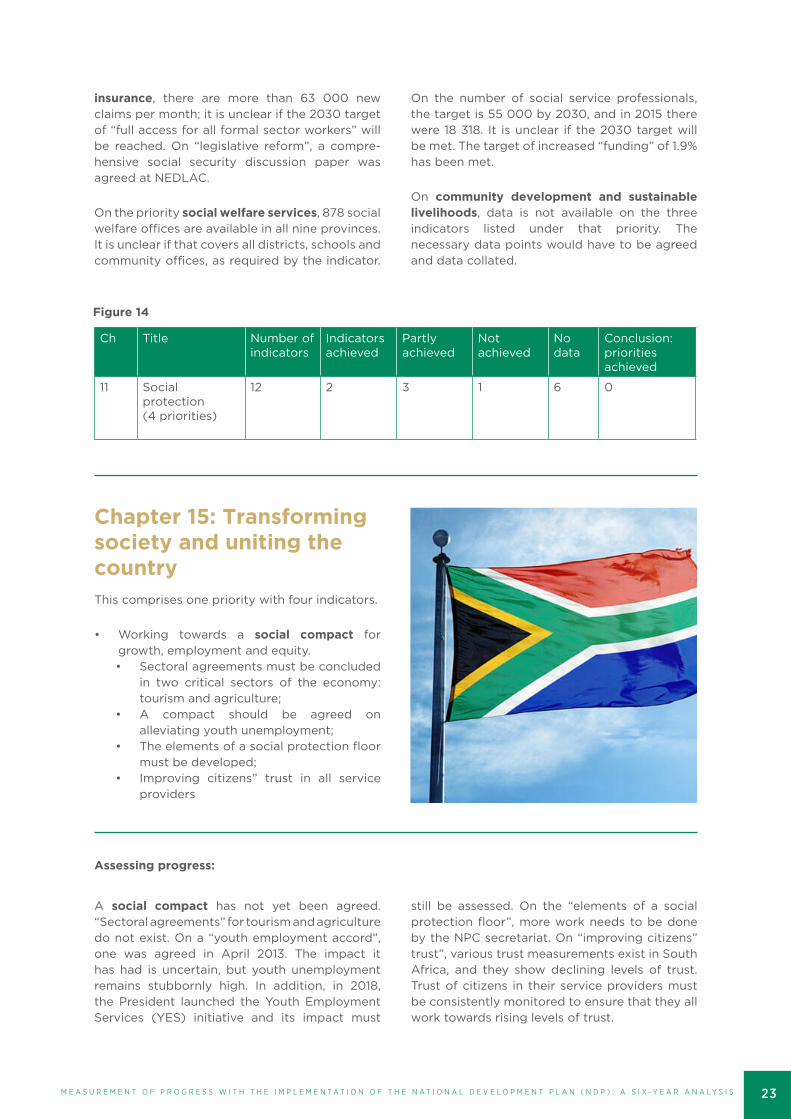
Chapter 11: Social protection
This comprises four priorities with 12 indicators.
• Enhancing social protection through social assistance, measured by:• Expanded social grants coverage,
increasing the take-up rate for those who qualify (target: 100% coverage for old age pension by 2020);
• Social relief of distress by improving household food and nutrition;
• Access to the social wage, which will result in a reduced cost of living (education, healthcare, free basic services, housing, and transport);
• A social protection floor that will pro-gressively ensure a decent standard of living for all by 2020 (the NPC and Secretariat work on this is progressing).
• Improved comprehensive social insurance, measured by:• Universal access to social security (target
2030: all workers (formal and informal) have access to UIF;
• Legislative reform of comprehensive social security and pensions” reform with NEDLAC participation.
• Developmental social welfare services, measured by:
• Comprehensive review of all social welfare services to improve availability of social welfare service (target: available in all districts, schools and community offices) by 2016;
• Social workers, child and youth care workers provided with infrastructure and financial resources to assist those in need of support (target: by 2020);
• Strengthen financial and human resources and infrastructure for social development (target: increase of 1.9% per annum in budget for the next five years and universal availability of facilities).
• Community development and sustainable livelihoods, measured by:• Number of grade 12 school leavers
entering community development education via skills-based, credit-earning courses;
• Number of learnerships provided for community development work through EPWP and CWP, via local government initiatives for unemployed 19 to 35 year olds;
• Numbers of youth trained as community development workers on enterprise development and potential work-based initiatives.
Figure 13
Ch Title Number of indicators
Indicators achieved
Partly achieved
Not achieved
No data
Conclusion: priorities achieved
10 Promoting health(5 priorities)
5 1 0 4 0 1
Assessing progress:
On the priority social protection through social assistance, “coverage for the old age pensions” reached 80% in 2018. It is unclear if the target of 100% will be reached by 2020. Although 416 750 food parcels were delivered in 2016/17, the StatsSA General Household Survey data indicates
that 7.4 million people experienced hunger in 2016, so “household food and nutrition” remains inadequate. Work is still ongoing on “reducing the cost of living” and a “social protection floor”.
On the second priority, comprehensive social
M E A S U R E M E N T O F P R O G R E S S W I T H T H E I M P L E M E N T A T I O N O F T H E N A T I O N A L D E V E L O P M E N T P L A N ( N D P ) : A S I X - Y E A R A N A L Y S I S 23
Chapter 15: Transforming society and uniting the countryThis comprises one priority with four indicators.
• Working towards a social compact for growth, employment and equity. • Sectoral agreements must be concluded
in two critical sectors of the economy: tourism and agriculture;
• A compact should be agreed on alleviating youth unemployment;
• The elements of a social protection floor must be developed;
• Improving citizens” trust in all service providers
Figure 14
Ch Title Number of indicators
Indicators achieved
Partly achieved
Not achieved
No data
Conclusion: priorities achieved
11 Social protection(4 priorities)
12 2 3 1 6 0
Assessing progress:
A social compact has not yet been agreed. “Sectoral agreements” for tourism and agriculture do not exist. On a “youth employment accord”, one was agreed in April 2013. The impact it has had is uncertain, but youth unemployment remains stubbornly high. In addition, in 2018, the President launched the Youth Employment Services (YES) initiative and its impact must
still be assessed. On the “elements of a social protection floor”, more work needs to be done by the NPC secretariat. On “improving citizens” trust”, various trust measurements exist in South Africa, and they show declining levels of trust. Trust of citizens in their service providers must be consistently monitored to ensure that they all work towards rising levels of trust.
insurance, there are more than 63 000 new claims per month; it is unclear if the 2030 target of “full access for all formal sector workers” will be reached. On “legislative reform”, a compre-hensive social security discussion paper was agreed at NEDLAC.
On the priority social welfare services, 878 social welfare offices are available in all nine provinces. It is unclear if that covers all districts, schools and community offices, as required by the indicator.
On the number of social service professionals, the target is 55 000 by 2030, and in 2015 there were 18 318. It is unclear if the 2030 target will be met. The target of increased “funding” of 1.9% has been met.
On community development and sustainable livelihoods, data is not available on the three indicators listed under that priority. The necessary data points would have to be agreed and data collated.
M E A S U R E M E N T O F P R O G R E S S W I T H T H E I M P L E M E N T A T I O N O F T H E N A T I O N A L D E V E L O P M E N T P L A N ( N D P ) : A S I X - Y E A R A N A L Y S I S24
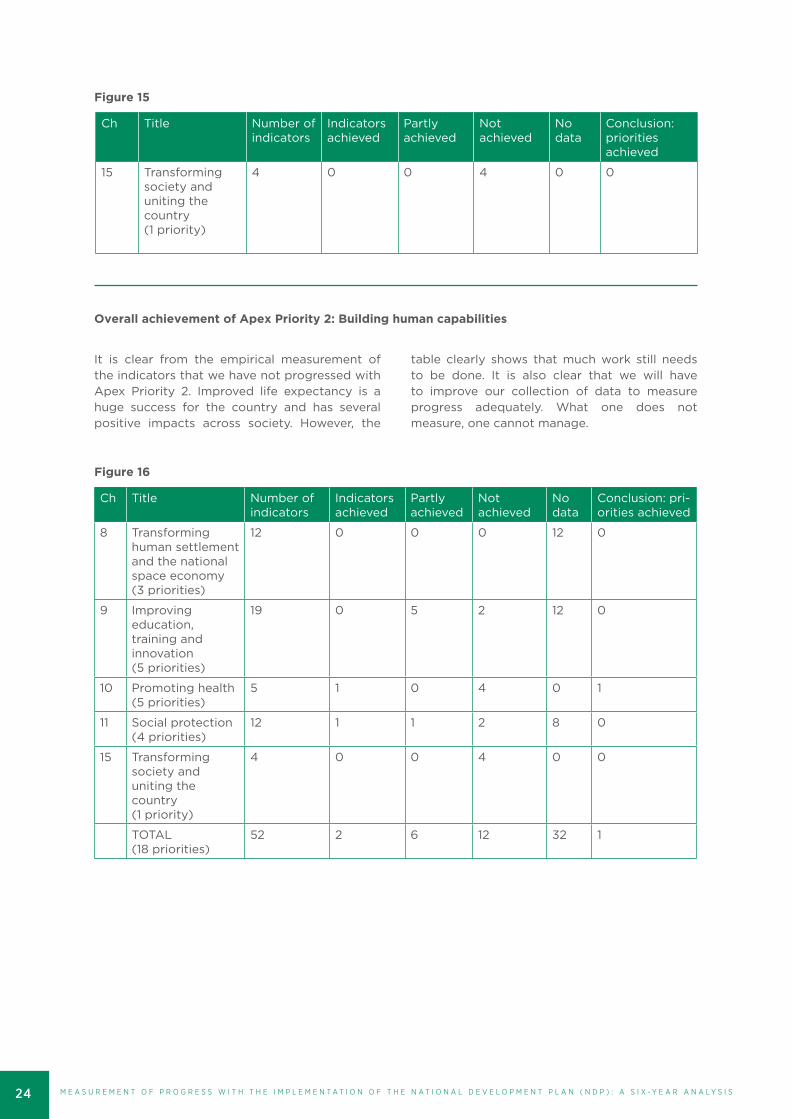
Figure 15
Figure 16
Ch Title Number of indicators
Indicators achieved
Partly achieved
Not achieved
No data
Conclusion: priorities achieved
15 Transforming society and uniting the country (1 priority)
4 0 0 4 0 0
Overall achievement of Apex Priority 2: Building human capabilities
It is clear from the empirical measurement of the indicators that we have not progressed with Apex Priority 2. Improved life expectancy is a huge success for the country and has several positive impacts across society. However, the
table clearly shows that much work still needs to be done. It is also clear that we will have to improve our collection of data to measure progress adequately. What one does not measure, one cannot manage.
Ch Title Number of indicators
Indicatorsachieved
Partly achieved
Not achieved
No data
Conclusion: pri-orities achieved
8 Transforming human settlement and the national space economy (3 priorities)
12 0 0 0 12 0
9 Improving education, training and innovation(5 priorities)
19 0 5 2 12 0
10 Promoting health(5 priorities)
5 1 0 4 0 1
11 Social protection(4 priorities)
12 1 1 2 8 0
15 Transforming society and uniting the country (1 priority)
4 0 0 4 0 0
TOTAL(18 priorities)
52 2 6 12 32 1

M E A S U R E M E N T O F P R O G R E S S W I T H T H E I M P L E M E N T A T I O N O F T H E N A T I O N A L D E V E L O P M E N T P L A N ( N D P ) : A S I X - Y E A R A N A L Y S I S 25
Apex Priority 3
Building a capable state to play a developmental and transformative role
This third Apex Priority is about building safer communities, building a capable and develop-mental state and fighting corruption (Chapters 12 – 14), yielding 15 supporting priorities (the number in brackets indicates the number of priorities per chapter).
Figure 17
1. Grow & transform the economy
2. Build human capabilities
3. Build a capable state
Economy & employment (5)
Transforming human settlement and the national space economy (3)
Building safer communities (3)
Economy infrastructure (4)
Improving education, training and innovation (5)
Building a capable and developmental state (9)
• Stabilise the political-administrative interface
• Local government
• State-owned enterprises
Environmental sustainability (4)
Promoting health (5)
An integrated and inclusive rural economy (4)
Social protection (4)
Positioning South Africa in the world (4)
Transforming society and uniting the country (1)
Fighting corruption (3)
M E A S U R E M E N T O F P R O G R E S S W I T H T H E I M P L E M E N T A T I O N O F T H E N A T I O N A L D E V E L O P M E N T P L A N ( N D P ) : A S I X - Y E A R A N A L Y S I S26
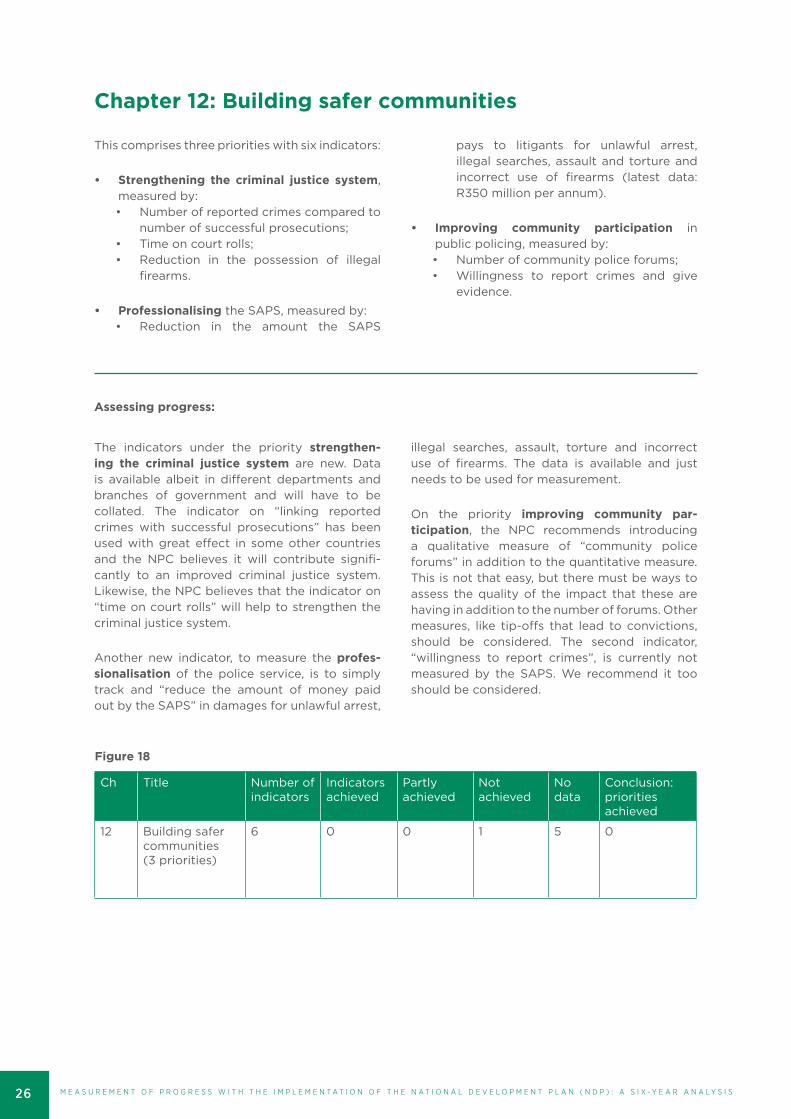
Chapter 12: Building safer communities
This comprises three priorities with six indicators:
• Strengthening the criminal justice system, measured by:• Number of reported crimes compared to
number of successful prosecutions;• Time on court rolls;• Reduction in the possession of illegal
firearms.
• Professionalising the SAPS, measured by:• Reduction in the amount the SAPS
pays to litigants for unlawful arrest, illegal searches, assault and torture and incorrect use of firearms (latest data: R350 million per annum).
• Improving community participation in public policing, measured by: • Number of community police forums;• Willingness to report crimes and give
evidence.
Figure 18
Ch Title Number of indicators
Indicators achieved
Partly achieved
Not achieved
No data
Conclusion: priorities achieved
12 Building safer communities (3 priorities)
6 0 0 1 5 0
Assessing progress:
The indicators under the priority strengthen-ing the criminal justice system are new. Data is available albeit in different departments and branches of government and will have to be collated. The indicator on “linking reported crimes with successful prosecutions” has been used with great effect in some other countries and the NPC believes it will contribute signifi-cantly to an improved criminal justice system. Likewise, the NPC believes that the indicator on “time on court rolls” will help to strengthen the criminal justice system.
Another new indicator, to measure the profes-sionalisation of the police service, is to simply track and “reduce the amount of money paid out by the SAPS” in damages for unlawful arrest,
illegal searches, assault, torture and incorrect use of firearms. The data is available and just needs to be used for measurement.
On the priority improving community par-ticipation, the NPC recommends introducing a qualitative measure of “community police forums” in addition to the quantitative measure. This is not that easy, but there must be ways to assess the quality of the impact that these are having in addition to the number of forums. Other measures, like tip-offs that lead to convictions, should be considered. The second indicator, “willingness to report crimes”, is currently not measured by the SAPS. We recommend it too should be considered.
M E A S U R E M E N T O F P R O G R E S S W I T H T H E I M P L E M E N T A T I O N O F T H E N A T I O N A L D E V E L O P M E N T P L A N ( N D P ) : A S I X - Y E A R A N A L Y S I S 27
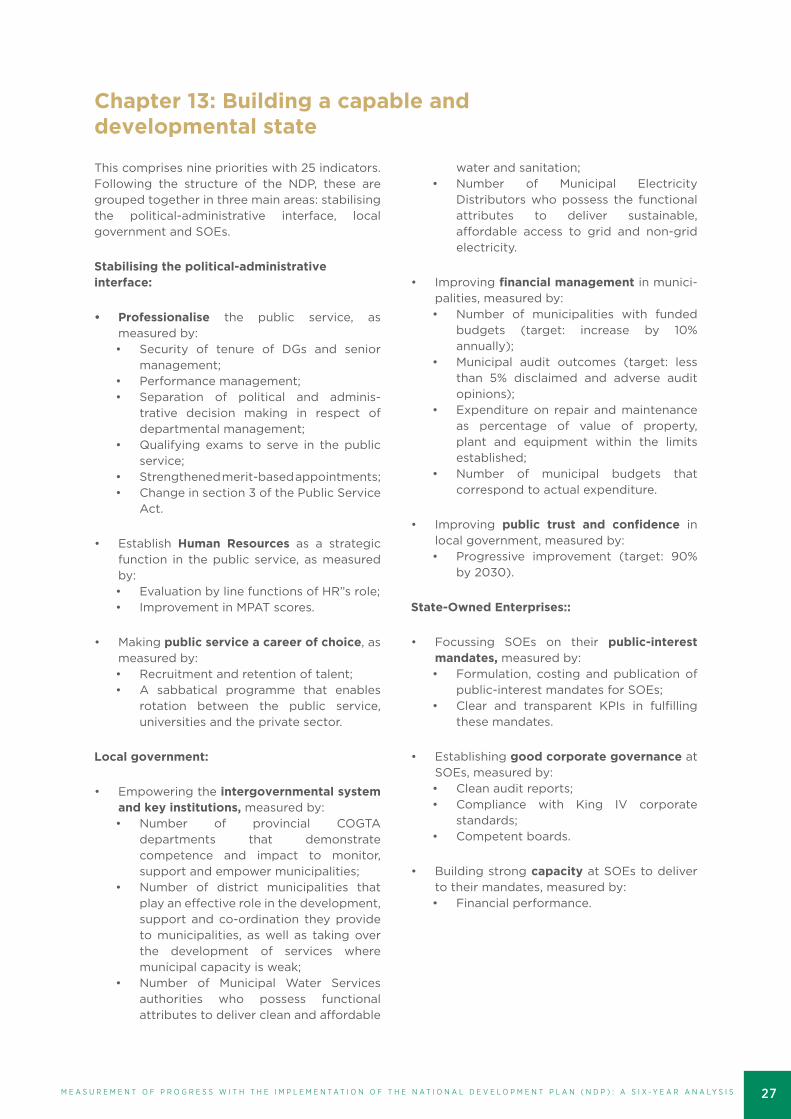
Chapter 13: Building a capable and developmental state
This comprises nine priorities with 25 indicators. Following the structure of the NDP, these are grouped together in three main areas: stabilising the political-administrative interface, local government and SOEs.
Stabilising the political-administrative interface:
• Professionalise the public service, as measured by:• Security of tenure of DGs and senior
management;• Performance management;• Separation of political and adminis-
trative decision making in respect of departmental management;
• Qualifying exams to serve in the public service;
• Strengthened merit-based appointments;• Change in section 3 of the Public Service
Act.
• Establish Human Resources as a strategic function in the public service, as measured by:• Evaluation by line functions of HR”s role;• Improvement in MPAT scores.
• Making public service a career of choice, as measured by:• Recruitment and retention of talent;• A sabbatical programme that enables
rotation between the public service, universities and the private sector.
Local government:
• Empowering the intergovernmental system and key institutions, measured by:• Number of provincial COGTA
departments that demonstrate competence and impact to monitor, support and empower municipalities;
• Number of district municipalities that play an effective role in the development, support and co-ordination they provide to municipalities, as well as taking over the development of services where municipal capacity is weak;
• Number of Municipal Water Services authorities who possess functional attributes to deliver clean and affordable
water and sanitation;• Number of Municipal Electricity
Distributors who possess the functional attributes to deliver sustainable, affordable access to grid and non-grid electricity.
• Improving financial management in munici-palities, measured by:• Number of municipalities with funded
budgets (target: increase by 10% annually);
• Municipal audit outcomes (target: less than 5% disclaimed and adverse audit opinions);
• Expenditure on repair and maintenance as percentage of value of property, plant and equipment within the limits established;
• Number of municipal budgets that correspond to actual expenditure.
• Improving public trust and confidence in local government, measured by:• Progressive improvement (target: 90%
by 2030).
State-Owned Enterprises::
• Focussing SOEs on their public-interest mandates, measured by:• Formulation, costing and publication of
public-interest mandates for SOEs;• Clear and transparent KPIs in fulfilling
these mandates.
• Establishing good corporate governance at SOEs, measured by: • Clean audit reports; • Compliance with King IV corporate
standards;• Competent boards.
• Building strong capacity at SOEs to deliver to their mandates, measured by:• Financial performance.
M E A S U R E M E N T O F P R O G R E S S W I T H T H E I M P L E M E N T A T I O N O F T H E N A T I O N A L D E V E L O P M E N T P L A N ( N D P ) : A S I X - Y E A R A N A L Y S I S28
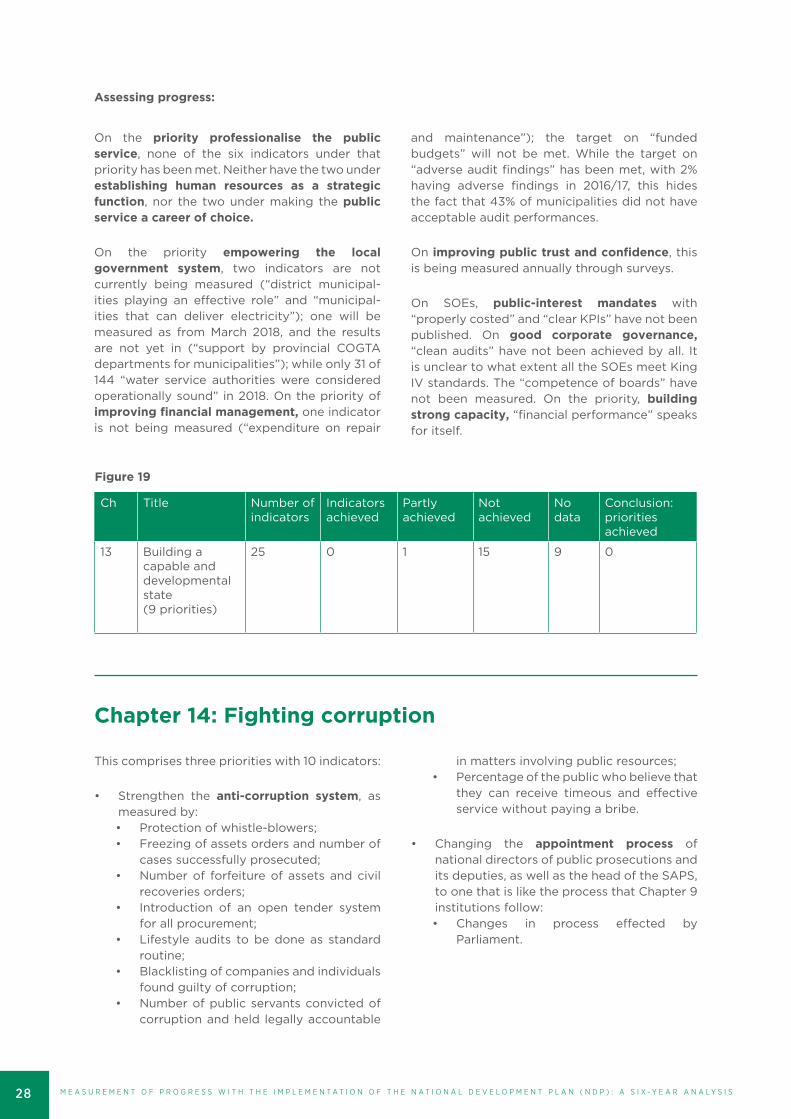
Figure 19
Ch Title Number of indicators
Indicators achieved
Partly achieved
Not achieved
No data
Conclusion: priorities achieved
13 Building a capable and developmental state(9 priorities)
25 0 1 15 9 0
Assessing progress:
On the priority professionalise the public service, none of the six indicators under that priority has been met. Neither have the two under establishing human resources as a strategic function, nor the two under making the public service a career of choice.
On the priority empowering the local government system, two indicators are not currently being measured (“district municipal-ities playing an effective role” and “municipal-ities that can deliver electricity”); one will be measured as from March 2018, and the results are not yet in (“support by provincial COGTA departments for municipalities”); while only 31 of 144 “water service authorities were considered operationally sound” in 2018. On the priority of improving financial management, one indicator is not being measured (“expenditure on repair
and maintenance”); the target on “funded budgets” will not be met. While the target on “adverse audit findings” has been met, with 2% having adverse findings in 2016/17, this hides the fact that 43% of municipalities did not have acceptable audit performances.
On improving public trust and confidence, this is being measured annually through surveys.
On SOEs, public-interest mandates with “properly costed” and “clear KPIs” have not been published. On good corporate governance, “clean audits” have not been achieved by all. It is unclear to what extent all the SOEs meet King IV standards. The “competence of boards” have not been measured. On the priority, building strong capacity, “financial performance” speaks for itself.
Chapter 14: Fighting corruption
This comprises three priorities with 10 indicators:
• Strengthen the anti-corruption system, as measured by:• Protection of whistle-blowers;• Freezing of assets orders and number of
cases successfully prosecuted; • Number of forfeiture of assets and civil
recoveries orders;• Introduction of an open tender system
for all procurement; • Lifestyle audits to be done as standard
routine;• Blacklisting of companies and individuals
found guilty of corruption;• Number of public servants convicted of
corruption and held legally accountable
in matters involving public resources;• Percentage of the public who believe that
they can receive timeous and effective service without paying a bribe.
• Changing the appointment process of national directors of public prosecutions and its deputies, as well as the head of the SAPS, to one that is like the process that Chapter 9 institutions follow:• Changes in process effected by
Parliament.
M E A S U R E M E N T O F P R O G R E S S W I T H T H E I M P L E M E N T A T I O N O F T H E N A T I O N A L D E V E L O P M E N T P L A N ( N D P ) : A S I X - Y E A R A N A L Y S I S 29
• Reviving the National Anti-Corruption Forum, measured by: • The relaunch of the National Anti-Cor-
ruption Forum (NACF) and tracking
commitments made by all sectors and measuring these.
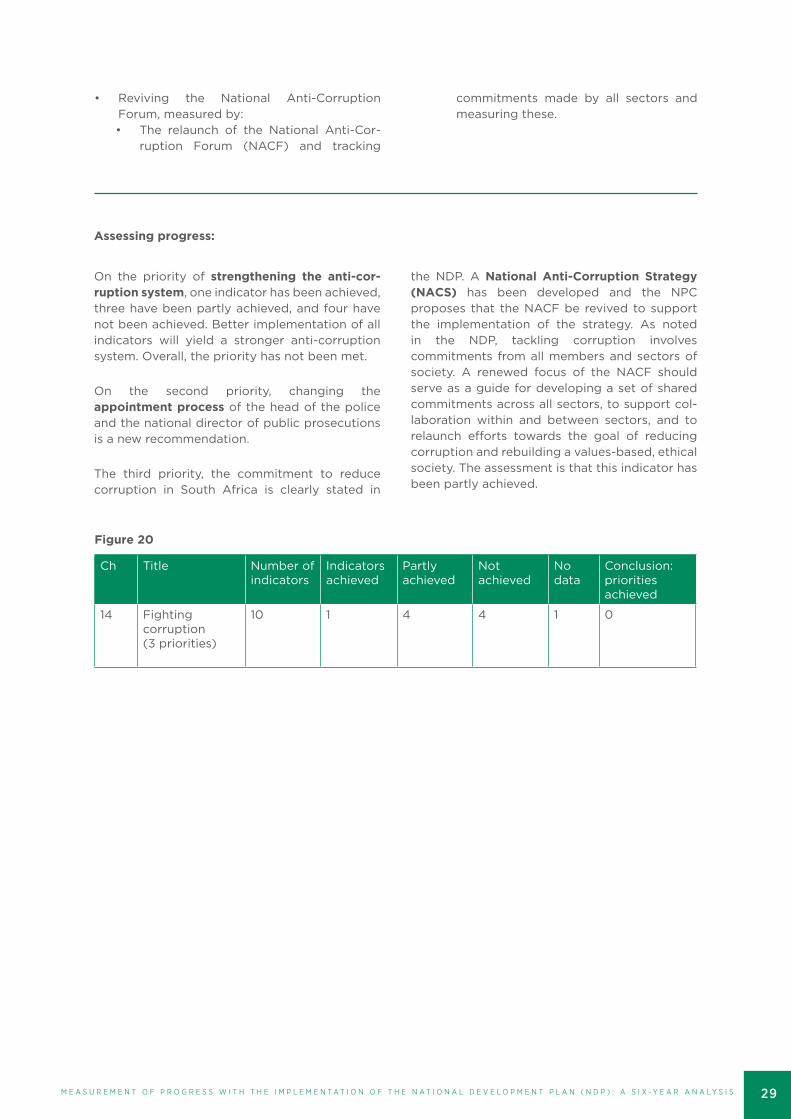
Figure 20
Ch Title Number of indicators
Indicators achieved
Partly achieved
Not achieved
No data
Conclusion: priorities achieved
14 Fighting corruption(3 priorities)
10 1 4 4 1 0
Assessing progress:
On the priority of strengthening the anti-cor-ruption system, one indicator has been achieved, three have been partly achieved, and four have not been achieved. Better implementation of all indicators will yield a stronger anti-corruption system. Overall, the priority has not been met.
On the second priority, changing the appointment process of the head of the police and the national director of public prosecutions is a new recommendation.
The third priority, the commitment to reduce corruption in South Africa is clearly stated in
the NDP. A National Anti-Corruption Strategy (NACS) has been developed and the NPC proposes that the NACF be revived to support the implementation of the strategy. As noted in the NDP, tackling corruption involves commitments from all members and sectors of society. A renewed focus of the NACF should serve as a guide for developing a set of shared commitments across all sectors, to support col-laboration within and between sectors, and to relaunch efforts towards the goal of reducing corruption and rebuilding a values-based, ethical society. The assessment is that this indicator has been partly achieved.

M E A S U R E M E N T O F P R O G R E S S W I T H T H E I M P L E M E N T A T I O N O F T H E N A T I O N A L D E V E L O P M E N T P L A N ( N D P ) : A S I X - Y E A R A N A L Y S I S30
Figure 21
Figure 21
Overall achievement of Apex Priority 3: Building a capable state
Overall achievement of all 3 Apex Priorities:
The data merely confirms what we already know. We need to build a more capable state.
Across the three Apex Priorities, the data confirms that there is a huge performance gap (6 indicators achieved out of 159), but there is also a data gap (70 indicators have no data). Without the data, performance cannot be managed. The data gap underlines the NPC’s recommen-
dation in paragraph 3 on page 5, “Sourcing missing data”. We suggest that the research and academic capacity of our country be activated, and resources made available through executive decision for data collection.
Ch Title Number of indicators
Indicators achieved
Partly achieved
Not achieved
No data
Con-clusion: priorities achieved
Allchapters
54 NDP PRIORITIES
159 6 23 60 70 2
Ch Title Number of indicators
Indicators achieved
Partly achieved
Not achieved
No data
Conclusion: priorities achieved
12 Building safer communities(3 priorities)
6 0 0 1 5 0
13 Building a capa-ble and develop-mental state(9 priorities)
25 0 1 15 9 0
14 Fighting corrup-tion(3 priorities)
10 1 4 4 1 0
TOTAL(15 priorities)
41 1 4 20 16 0

M E A S U R E M E N T O F P R O G R E S S W I T H T H E I M P L E M E N T A T I O N O F T H E N A T I O N A L D E V E L O P M E N T P L A N ( N D P ) : A S I X - Y E A R A N A L Y S I S 31
NATIONAL PLANNING COMMISSION
1 Government Avenue, Union Buildings, Pretoria, 0001