measuring and improving the return (an example)€¦ · measuring and improving the return . ......
TRANSCRIPT
Marketing Accountability Standards Board of the Marketing Accountability Foundation
MASBMASB
Marketing Accountability Standards
Measuring and Improving the Return
from TV Advertising (An Example)
April 2008 & May 2012
Draft VII Approved by
MASB Board for Posting & Industry
Feedback (w/feedback
updates 2012)

MASBMASB 2 Copyright 2012 MASB
The mission of the Marketing Accountability Standards Board (MASB) is to “establish (issue, improve and promote) marketing measurement and accountability standards across industry and
domain for continuous improvement in financial performance and for the guidance and education of business decision makers and users
of performance and financial information”.
Measurement standards are essential for the efficient and effective functioning of a marketing driven business, because decisions
about the allocation of resources and assessment of results rely heavily on credible, valid, transparent and understandable
information.
The role of MASB is in setting the standards and processes necessary for evaluating marketing measures in a manner that insures credibility, validity, transparency and understanding.
Preface: MASB Mission
MASBMASB 3 Copyright 2012 MASB
The purpose of this TV Project is to serve as an example of how to evaluate marketing metrics according to the Marketing Metrics Audit
Protocol (MMAP), the learning that can come from using an “ideal” metric over time and conditions, and how to improve return from the
activity by applying the metric and learning to better marketing practice (process management).
The TV Project was selected, conducted and reviewed by members of The Boardroom Project (10/06-7/07), reviewed by the MASB Board
(8/07 – 3/08), and updated based on feedback (5/12)*.
Areas of potential improvement in the overall MMAP process as well as questions regarding the content of this particular project
were, and will continue to be addressed.
Preface: Purpose of TV Project
* Feedback: Would be more useful if measure and provider were named; The metrics piece is confusing – identify the metric; Time to name the measure for clarity and context. Updates are indicated in blue throughout this deck.

MASBMASB 4 Copyright 2012 MASB
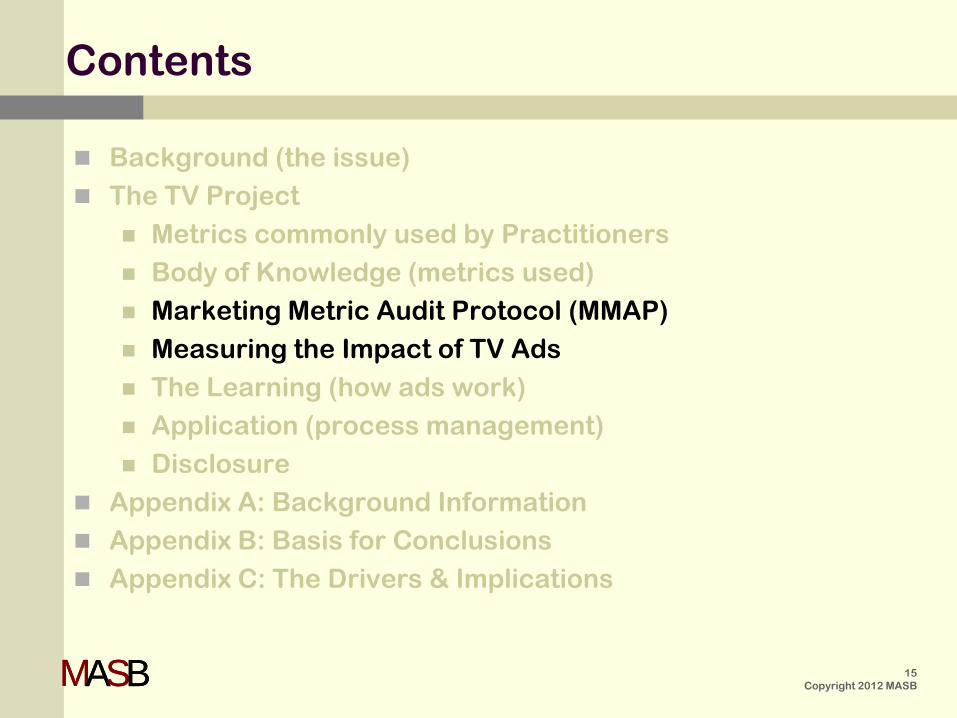
Contents
Background (the issue) The TV Project
Metrics commonly used by Practitioners Body of Knowledge (metrics used) Marketing Metric Audit Protocol (MMAP) Measuring the Impact of TV Ads The Learning (how ads work) Application (process management) Disclosure
Appendix A: Background Information Appendix B: Basis for Conclusions Appendix C: The Drivers & Implications
MASBMASB 5 Copyright 2012 MASB
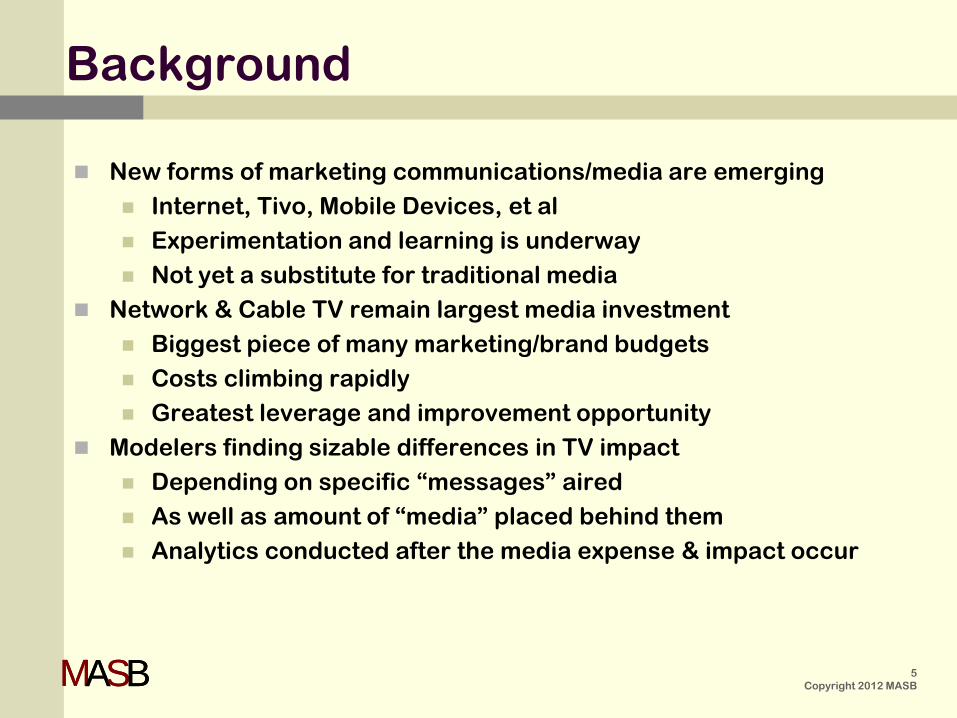
Background
New forms of marketing communications/media are emerging Internet, Tivo, Mobile Devices, et al Experimentation and learning is underway Not yet a substitute for traditional media
Network & Cable TV remain largest media investment Biggest piece of many marketing/brand budgets Costs climbing rapidly Greatest leverage and improvement opportunity
Modelers finding sizable differences in TV impact Depending on specific “messages” aired As well as amount of “media” placed behind them Analytics conducted after the media expense & impact occur
MASBMASB 6 Copyright 2012 MASB
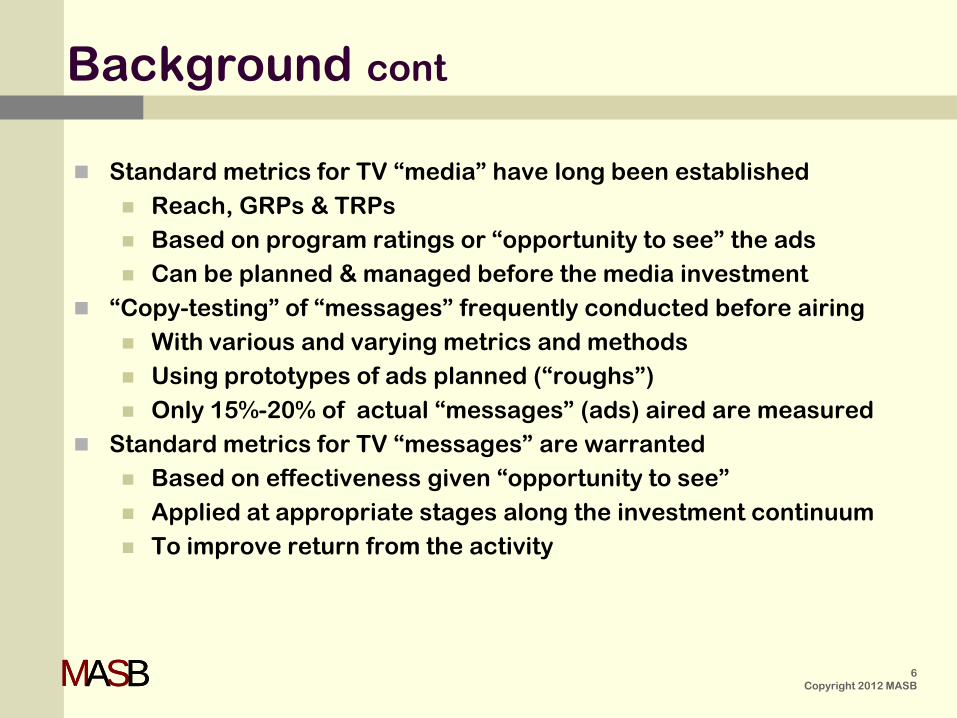
Background cont
Standard metrics for TV “media” have long been established Reach, GRPs & TRPs Based on program ratings or “opportunity to see” the ads Can be planned & managed before the media investment
“Copy-testing” of “messages” frequently conducted before airing With various and varying metrics and methods Using prototypes of ads planned (“roughs”) Only 15%-20% of actual “messages” (ads) aired are measured
Standard metrics for TV “messages” are warranted Based on effectiveness given “opportunity to see” Applied at appropriate stages along the investment continuum To improve return from the activity
MASBMASB 7 Copyright 2012 MASB
The TV Project Among the various pre-market methods and metrics commonly used by
practitioners to assess TV Messages (ads):
Which ones meet the Marketing Metric Audit Protocol (MMAP)?
Is there one (or more) worthy of serving as a “standard”?
If so, how might it be applied for improved return?
How much improvement might be realized?
MASBMASB 8 Copyright 2012 MASB
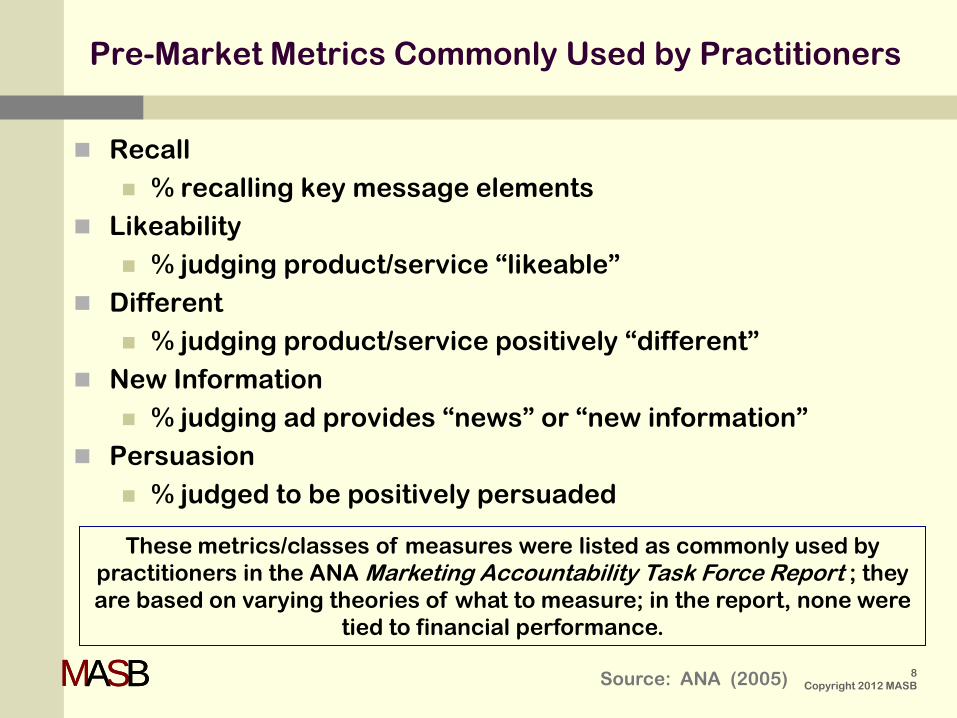
Recall % recalling key message elements
Likeability % judging product/service “likeable”
Different % judging product/service positively “different”
New Information % judging ad provides “news” or “new information”
Persuasion % judged to be positively persuaded
Source: ANA (2005)
These metrics/classes of measures were listed as commonly used by practitioners in the ANA Marketing Accountability Task Force Report ; they are based on varying theories of what to measure; in the report, none were
tied to financial performance.
Pre-Market Metrics Commonly Used by Practitioners
MASBMASB
While marketing does not lack measures, it lacks standard metrics explicitly linked to financial performance in
predictable ways.
The following section reviews the body of knowledge about the measures commonly used by ANA practitioners and
their links to financial performance.
9 Copyright 2012 MASB
MASBMASB 10 Copyright 2012 MASB
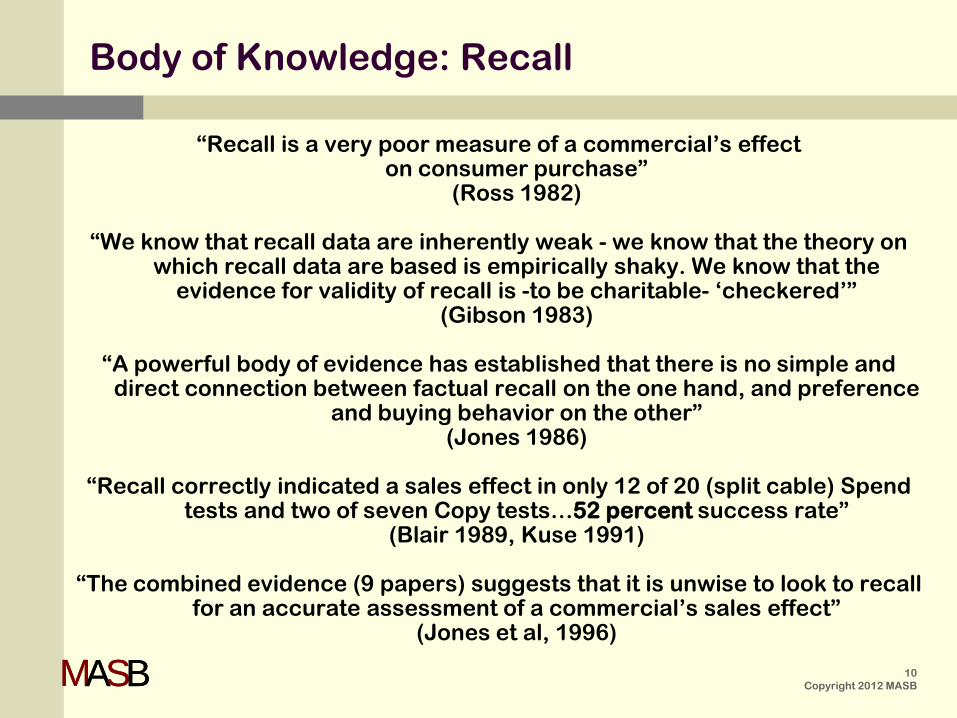
Body of Knowledge: Recall
“Recall is a very poor measure of a commercial’s effect on consumer purchase”
(Ross 1982)
“We know that recall data are inherently weak - we know that the theory on which recall data are based is empirically shaky. We know that the
evidence for validity of recall is -to be charitable- ‘checkered’” (Gibson 1983)
“A powerful body of evidence has established that there is no simple and
direct connection between factual recall on the one hand, and preference and buying behavior on the other”
(Jones 1986)
“Recall correctly indicated a sales effect in only 12 of 20 (split cable) Spend tests and two of seven Copy tests…52 percent success rate”
(Blair 1989, Kuse 1991)
“The combined evidence (9 papers) suggests that it is unwise to look to recall for an accurate assessment of a commercial’s sales effect”
(Jones et al, 1996)
MASBMASB 11 Copyright 2012 MASB
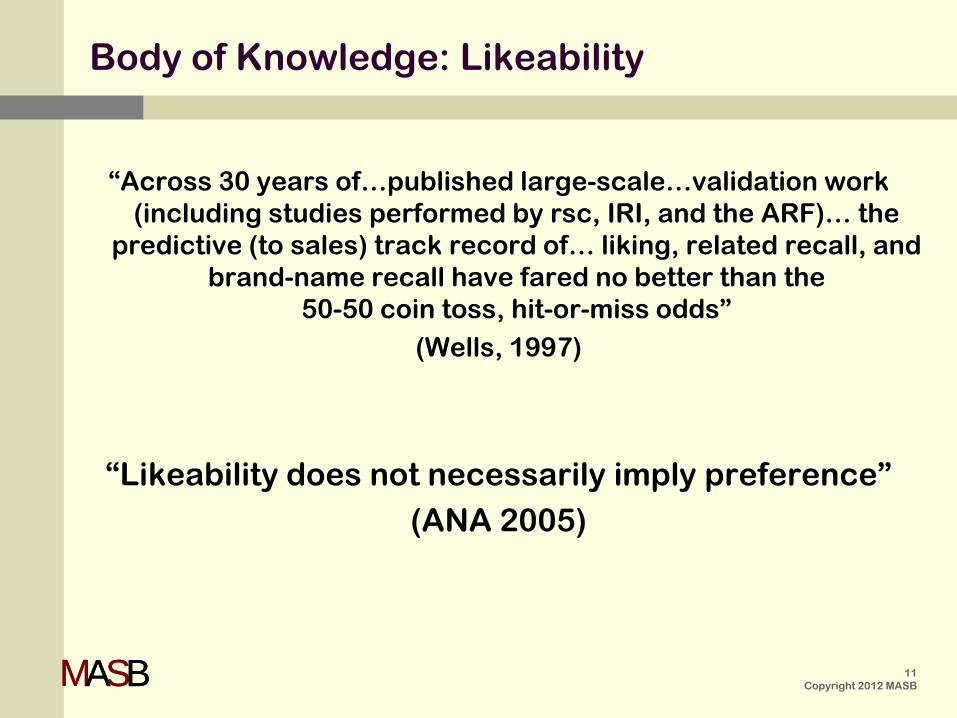
Body of Knowledge: Likeability
“Across 30 years of…published large-scale…validation work (including studies performed by rsc, IRI, and the ARF)… the
predictive (to sales) track record of… liking, related recall, and brand-name recall have fared no better than the
50-50 coin toss, hit-or-miss odds” (Wells, 1997)
“Likeability does not necessarily imply preference”
(ANA 2005)

MASBMASB 12 Copyright 2012 MASB
Body of Knowledge: “Different” & “New Information”
No published studies regarding the relationship between these measures (or classes of
measures) and purchase behavior could be found.
“News itself not necessarily persuasive” (ANA 2005)
MASBMASB 13 Copyright 2012 MASB
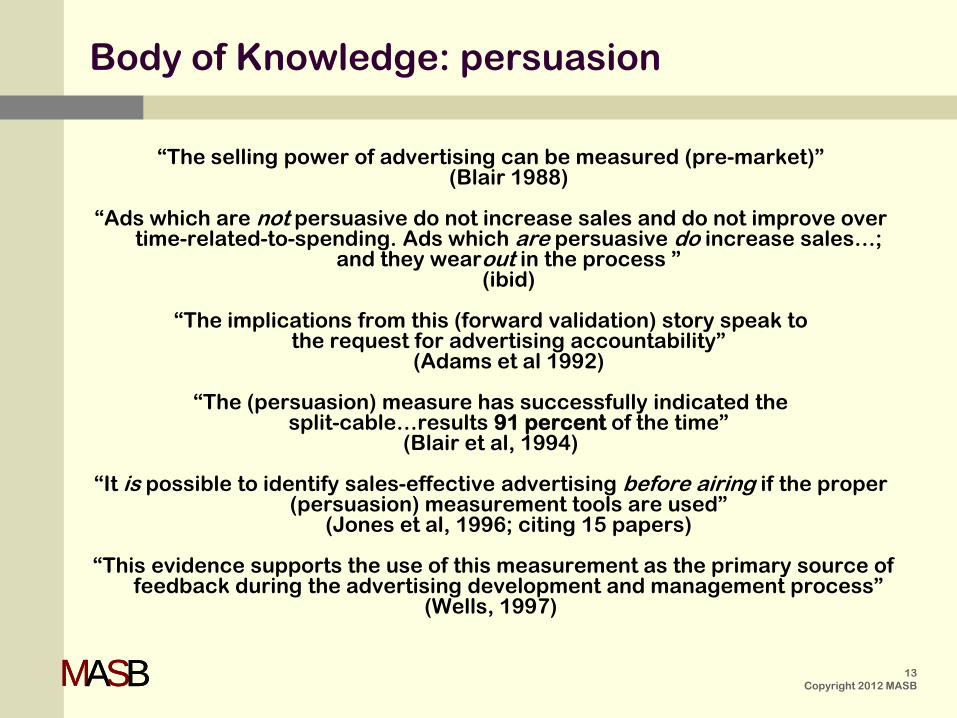
Body of Knowledge: persuasion
“The selling power of advertising can be measured (pre-market)” (Blair 1988)
“Ads which are not persuasive do not increase sales and do not improve over
time-related-to-spending. Ads which are persuasive do increase sales…; and they wearout in the process ”
(ibid)
“The implications from this (forward validation) story speak to the request for advertising accountability”
(Adams et al 1992)
“The (persuasion) measure has successfully indicated the split-cable…results 91 percent of the time”
(Blair et al, 1994)
“It is possible to identify sales-effective advertising before airing if the proper (persuasion) measurement tools are used”
(Jones et al, 1996; citing 15 papers)
“This evidence supports the use of this measurement as the primary source of feedback during the advertising development and management process”
(Wells, 1997)
MASBMASB 14 Copyright 2012 MASB
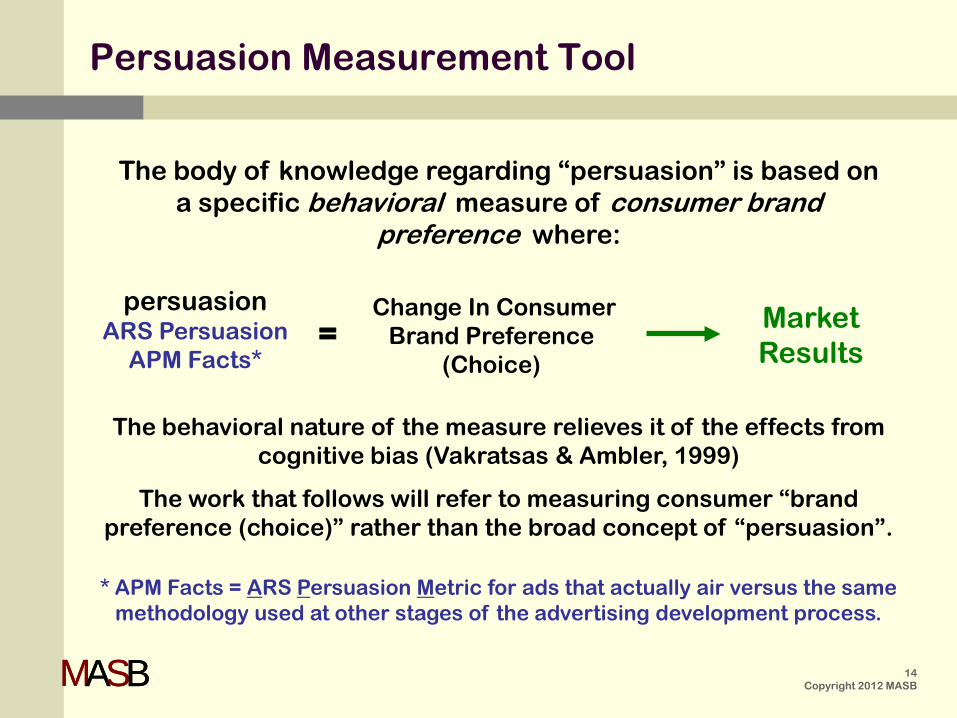
Market Results
Change In Consumer Brand Preference
(Choice) =
The body of knowledge regarding “persuasion” is based on a specific behavioral measure of consumer brand
preference where:
The behavioral nature of the measure relieves it of the effects from cognitive bias (Vakratsas & Ambler, 1999)
The work that follows will refer to measuring consumer “brand preference (choice)” rather than the broad concept of “persuasion”.
Persuasion Measurement Tool
persuasion ARS Persuasion
APM Facts*
* APM Facts = ARS Persuasion Metric for ads that actually air versus the same methodology used at other stages of the advertising development process.
MASBMASB 15 Copyright 2012 MASB
Contents
Background (the issue) The TV Project
Metrics commonly used by Practitioners Body of Knowledge (metrics used) Marketing Metric Audit Protocol (MMAP) Measuring the Impact of TV Ads The Learning (how ads work) Application (process management) Disclosure
Appendix A: Background Information Appendix B: Basis for Conclusions Appendix C: The Drivers & Implications
MASBMASB
MMAP
The Marketing Metric Audit Protocol (MMAP) is a formal process for connecting marketing activities to the financial performance of
the firm.
The process includes the conceptual linking of marketing activities to intermediate marketing outcome metrics to cash flow drivers of
the business, as well as the validation and causality characteristics of an ideal metric.
Cash flow both short-term and over time is the ultimate metric to which all activities of a business enterprise, including marketing, should be causally linked through the validation of intermediate
marketing metrics.
The process of validating the intermediate outcome metrics against short-term and/or long-term cash flow drivers is necessary to
facilitate forecasting and improvement in return.
16 Copyright 2012 MASB
MASBMASB 17 Copyright 2012 MASB
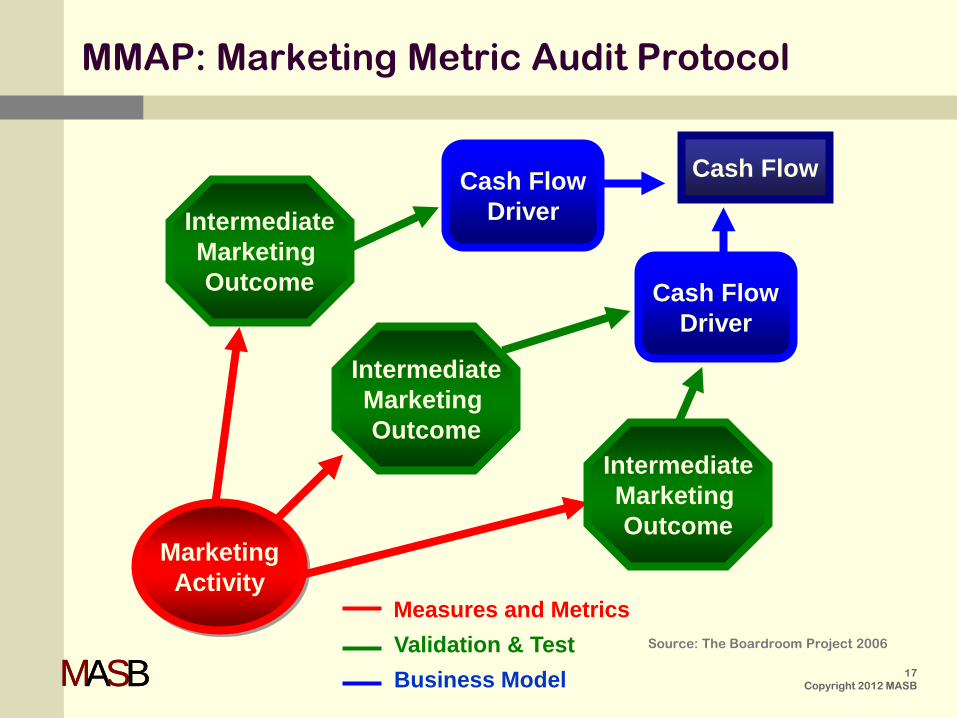
Marketing Activity
Cash Flow Cash Flow Driver Intermediate
Marketing Outcome
Measures and Metrics Validation & Test Business Model
Intermediate Marketing Outcome
Intermediate Marketing Outcome
Cash Flow Driver
MMAP: Marketing Metric Audit Protocol
Source: The Boardroom Project 2006

MASBMASB
MMAP: Marketing Metric Audit Protocol
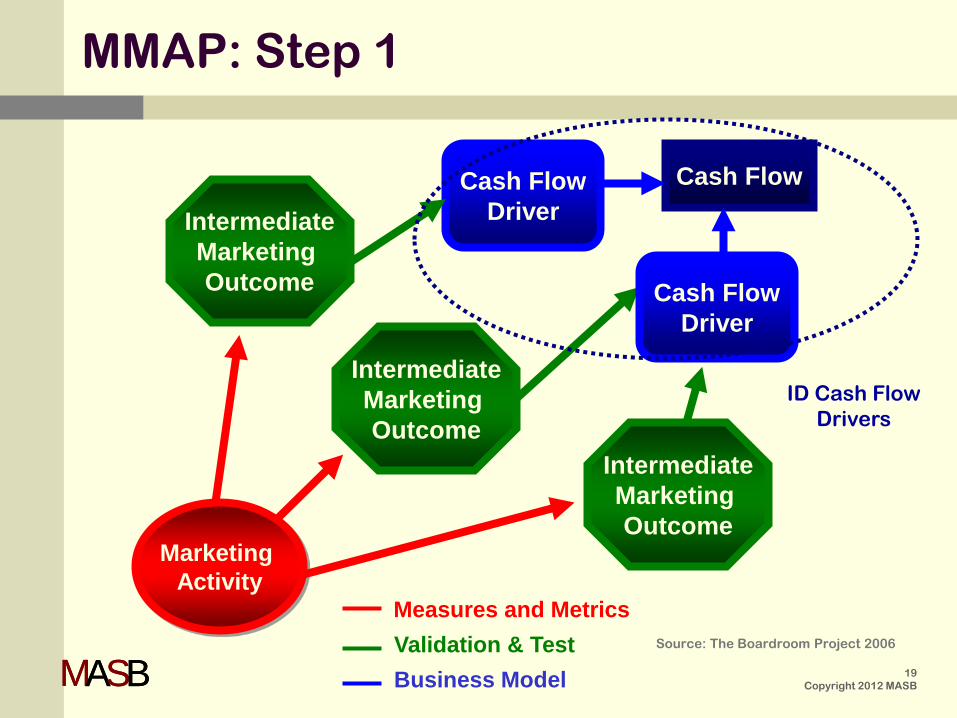
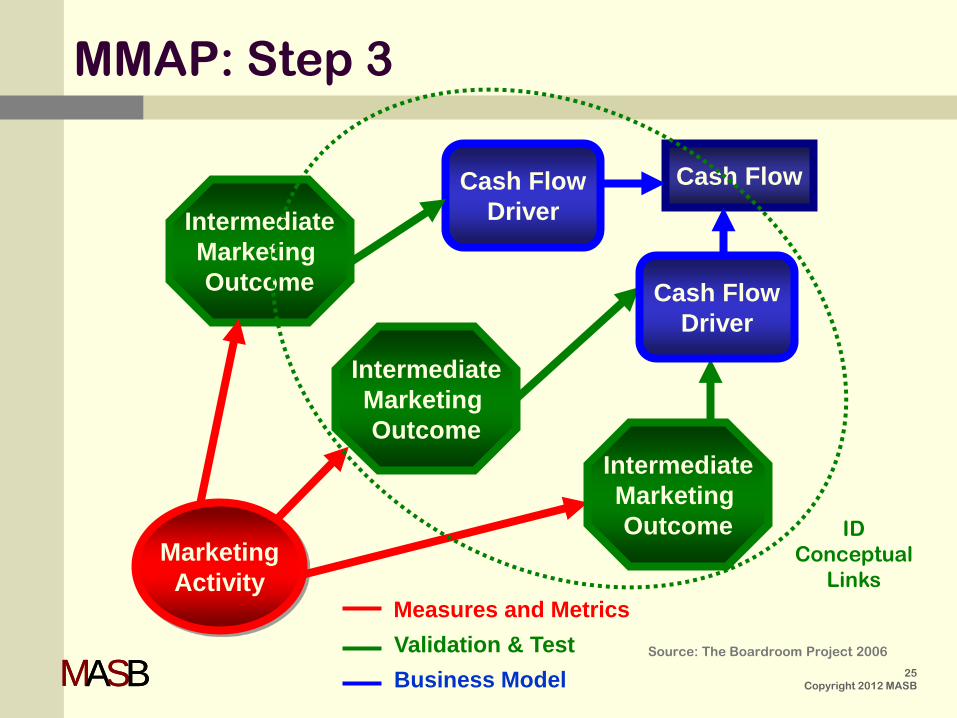
Step 1: Identify Cash Flow Drivers There will be at least one source of cash and one business model. In many businesses there is a dominant source and a dominant model. Step 2: Identify Intermediate Measures of Marketing Outcomes Distinguish between measures of efficiency, like CPM and cost per lead, and measures of effectiveness, like redemption rate for coupons and market share. Focus first on measures of effectiveness. Step 3: Identify the Conceptual Links Every marketing action should have an identified outcome metric. If there is no logical link between a marketing outcome and a cash flow driver, you might question the need for the associated marketing activity. Step 4: Identify the Causal Links When there is uncertainty about the causal link between a marketing outcome and one or more cash flow drivers, validation or test is appropriate—especially if the costs of the marketing activity are high (validity and causality audit).
Source: The Boardroom Project 2006
18 Copyright 2012 MASB
MASBMASB 19 Copyright 2012 MASB
Marketing
Activity
Cash Flow Cash Flow Driver Intermediate
Marketing Outcome
Measures and Metrics Validation & Test Business Model
Intermediate Marketing Outcome
Intermediate Marketing Outcome
Cash Flow Driver
ID Cash Flow Drivers
MMAP: Step 1
Source: The Boardroom Project 2006
MASBMASB 20 Copyright 2012 MASB
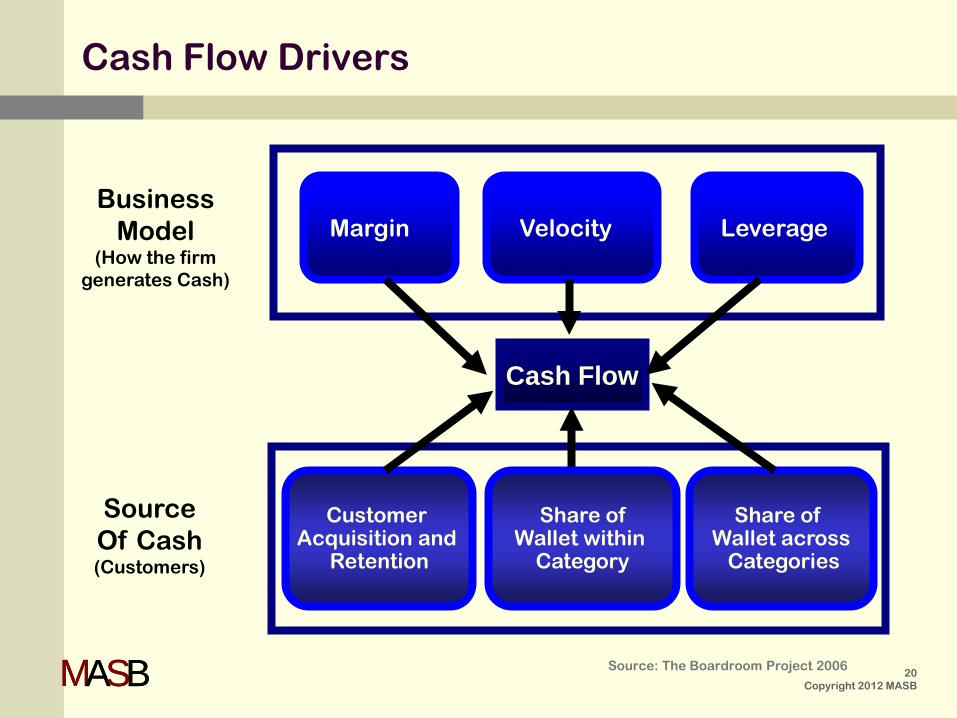
Cash Flow
Customer Acquisition and
Retention
Leverage Velocity Margin
Share of Wallet across Categories
Business Model
(How the firm generates Cash)
Source Of Cash (Customers)
Cash Flow Drivers
Share of Wallet within
Category
Source: The Boardroom Project 2006
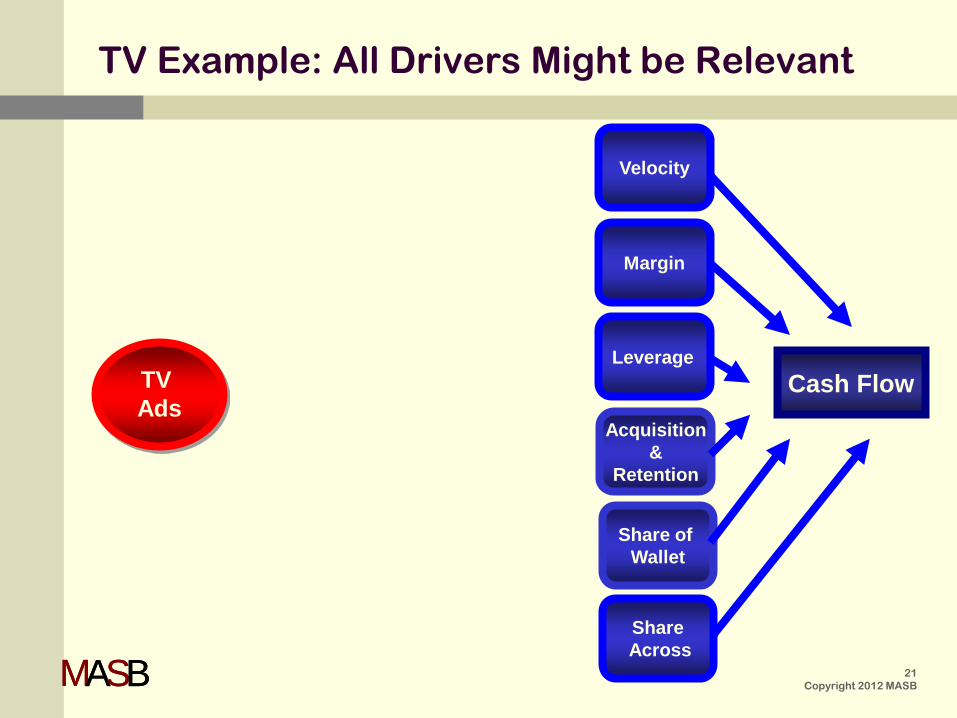
MASBMASB 21 Copyright 2012 MASB
TV Example: All Drivers Might be Relevant
Cash Flow
Margin
Velocity
TV Ads
Share of Wallet
Acquisition &
Retention
Leverage
Share Across
MASBMASB 22 Copyright 2012 MASB
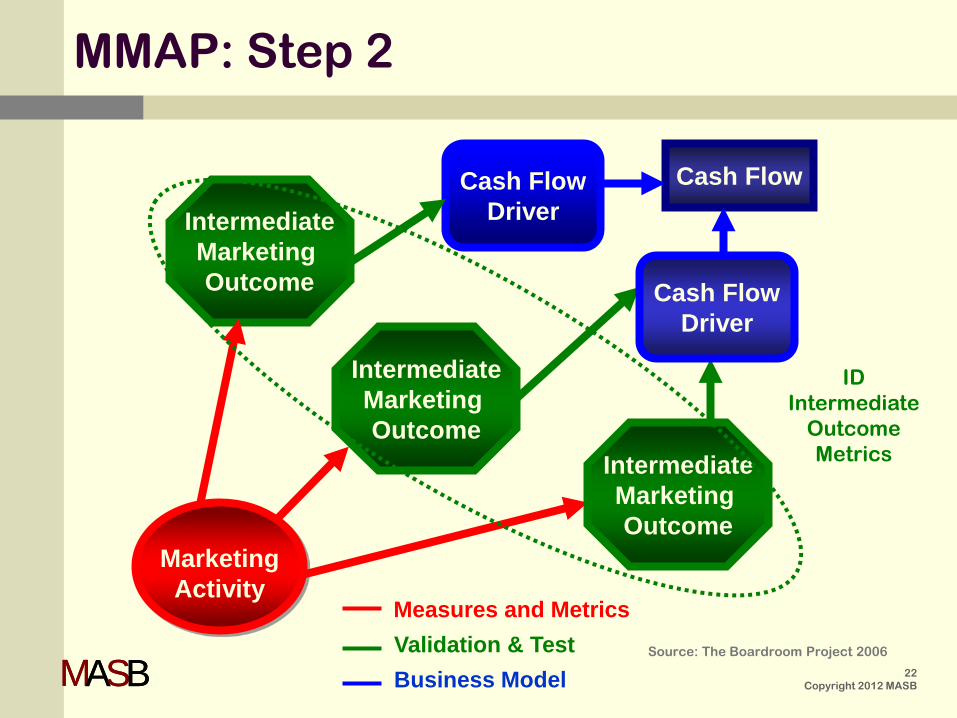
Marketing
Activity
Cash Flow Cash Flow Driver Intermediate
Marketing Outcome
Measures and Metrics Validation & Test Business Model
Intermediate Marketing Outcome
Intermediate Marketing Outcome
Cash Flow Driver
ID Intermediate
Outcome Metrics
MMAP: Step 2
Source: The Boardroom Project 2006

MASBMASB 23 Copyright 2012 MASB
For TV Example: Widely Used Post-Market Intermediate Outcome Metrics (Effectiveness)
Cash Flow
Baseline Sales
Sales Volume
Impacted Margin
Velocity
Market Share
Price Premium
TV Ads
Share of Wallet
Acquisition &
Retention
Leverage
Share Across
MASBMASB 24 Copyright 2012 MASB
In the MASB world, each of the Intermediate post-market outcome metrics would be reviewed by specific
metric/methodology…and in doing so, would be improved.
Importantly, the MMAP process will take us beyond the audits currently conducted in today’s world of efficiency and controls (reliability, objectivity, costs) to the world of
effectiveness and improvement in financial performance (relevancy, prediction, calibration, causality).
About the Post-Market Intermediate Outcome Metrics
MASBMASB 25 Copyright 2012 MASB
Marketing
Activity
Cash Flow Cash Flow Driver Intermediate
Marketing Outcome
Measures and Metrics Validation & Test Business Model
Intermediate Marketing Outcome
Intermediate Marketing Outcome
Cash Flow Driver
ID Conceptual
Links
MMAP: Step 3
Source: The Boardroom Project 2006

MASBMASB 26 Copyright 2012 MASB
TV Example: Post-Market Metrics and Links
Cash Flow
Baseline Sales
Sales Volume
Impacted Margin
Velocity
Market Share
Price Premium
TV Ads
Share of Wallet
Acquisition &
Retention
Leverage
Share Across

MASBMASB 27 Copyright 2012 MASB
TV Ads
ARS Brand Preference
(Choice)
TV Example: Pre-Market Metric of Intermediate Outcomes
MASBMASB 28 Copyright 2012 MASB
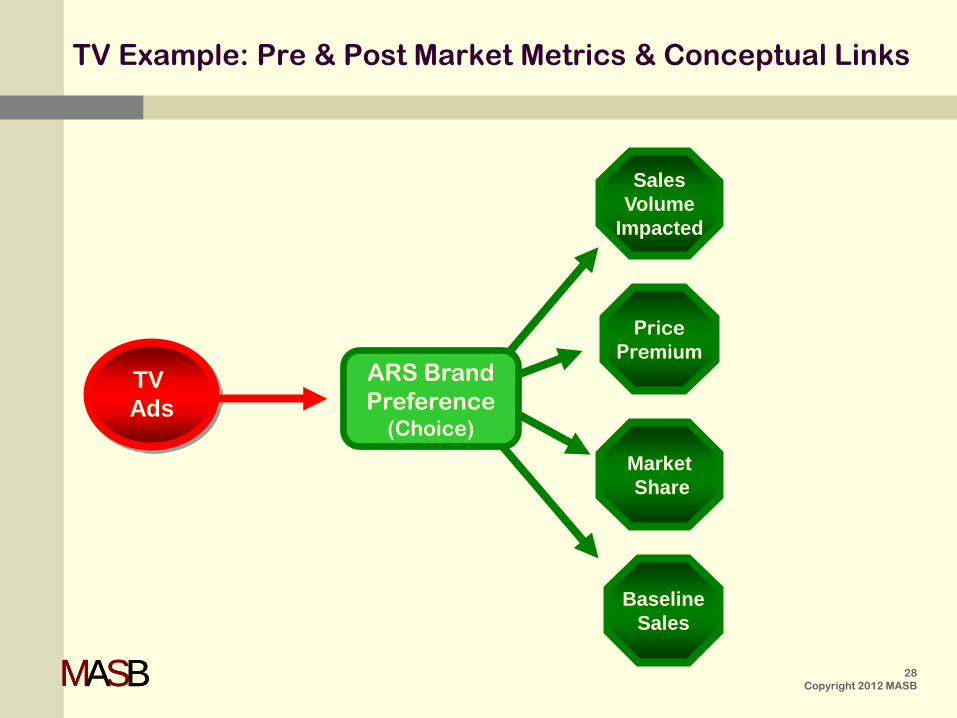
TV Example: Pre & Post Market Metrics & Conceptual Links
Baseline Sales
Sales Volume
Impacted
Market Share
Price Premium
TV Ads
ARS Brand Preference
(Choice)
MASBMASB
MMAP: Step 4
Validation & Causality Audit
Every Intermediate Marketing Outcome Metric Should Be Validated Against Short-term and/or Long-Term Cash Flow Drivers and Ultimately Cash Flow (or to the Drivers of the
Cash Flow Drivers).
Source: The Boardroom Project 2006
29 Copyright 2012 MASB

MASBMASB 30 Copyright 2012 MASB
MMAP: 10 Characteristics of an Ideal Metric
1. Relevant…addresses specific pending action
2. Predictive…accurately predicts outcome of pending action
3. Objective…not subject to personal interpretation
4. Calibrated…means the same across conditions & cultures
5. Reliable…dependable & stable over time
6. Sensitive…identifies meaningful differences in outcomes
7. Simple…uncomplicated meaning & implications clear
8. Causal…course of action leads to improvement
9. Transparent…subject to independent audit
10. Quality Assured…formal/on-going process to assure 1-9
Source: The Boardroom Project, 2006
MASBMASB 31 Copyright 2012 MASB
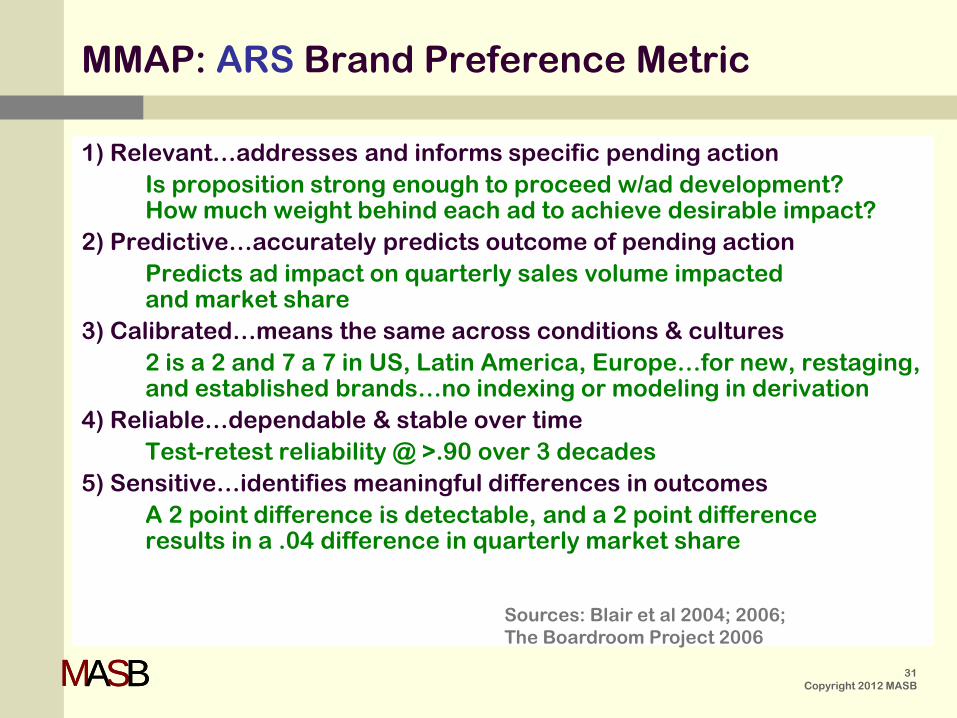
1) Relevant…addresses and informs specific pending action Is proposition strong enough to proceed w/ad development?
How much weight behind each ad to achieve desirable impact? 2) Predictive…accurately predicts outcome of pending action Predicts ad impact on quarterly sales volume impacted
and market share 3) Calibrated…means the same across conditions & cultures 2 is a 2 and 7 a 7 in US, Latin America, Europe…for new, restaging,
and established brands…no indexing or modeling in derivation 4) Reliable…dependable & stable over time Test-retest reliability @ >.90 over 3 decades 5) Sensitive…identifies meaningful differences in outcomes A 2 point difference is detectable, and a 2 point difference
results in a .04 difference in quarterly market share
MMAP: ARS Brand Preference Metric
Sources: Blair et al 2004; 2006; The Boardroom Project 2006
MASBMASB 32 Copyright 2012 MASB
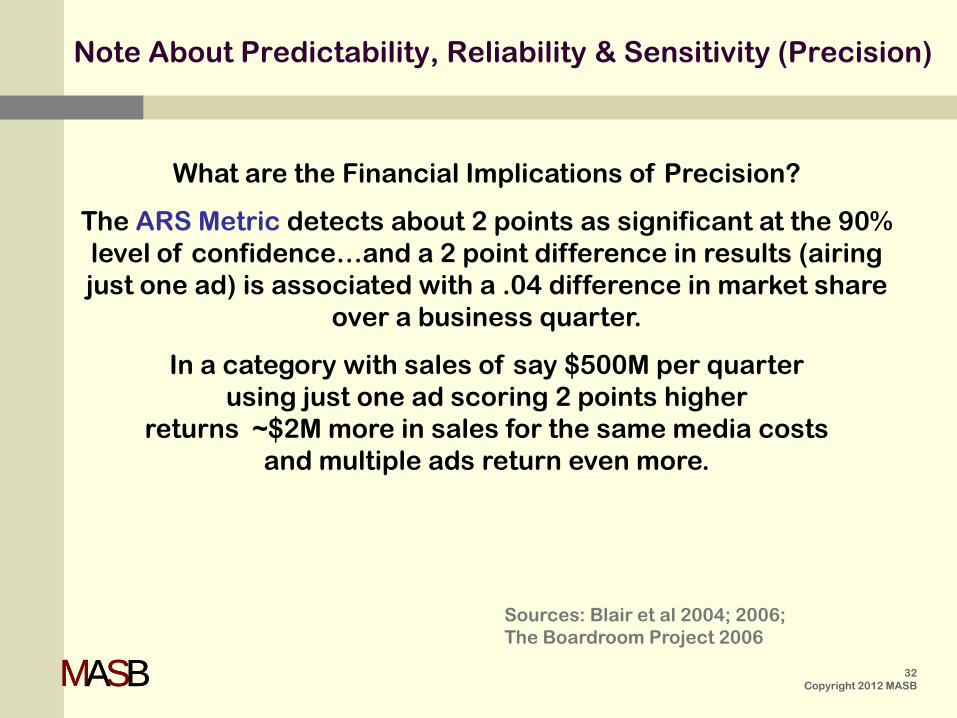
What are the Financial Implications of Precision?
The ARS Metric detects about 2 points as significant at the 90% level of confidence…and a 2 point difference in results (airing just one ad) is associated with a .04 difference in market share
over a business quarter.
In a category with sales of say $500M per quarter using just one ad scoring 2 points higher
returns ~$2M more in sales for the same media costs and multiple ads return even more.
Note About Predictability, Reliability & Sensitivity (Precision)
Sources: Blair et al 2004; 2006; The Boardroom Project 2006
MASBMASB 33 Copyright 2012 MASB
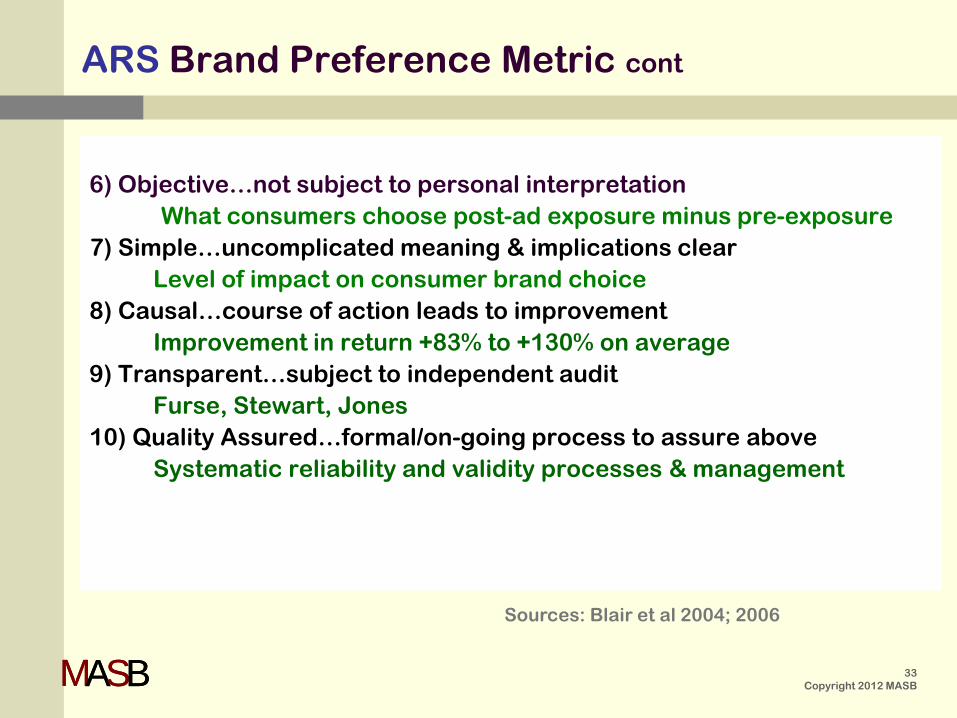
6) Objective…not subject to personal interpretation What consumers choose post-ad exposure minus pre-exposure 7) Simple…uncomplicated meaning & implications clear Level of impact on consumer brand choice 8) Causal…course of action leads to improvement Improvement in return +83% to +130% on average 9) Transparent…subject to independent audit Furse, Stewart, Jones 10) Quality Assured…formal/on-going process to assure above Systematic reliability and validity processes & management
ARS Brand Preference Metric cont
Sources: Blair et al 2004; 2006

MASBMASB 34 Copyright 2012 MASB
TV Example: Pre & Post Market Metrics & Validated Links
Baseline Sales
Sales Volume
Impacted
Market Share
Price Premium
TV Ads
ARS Brand Preference
(Choice)
Note: There is also evidence suggesting the metric would predict
longer term success and price elasticity (see Appendix B)
The ARS consumer Brand Preference Metric has met the Marketing Metrics
Audit Protocol for validation and causality to Sales Volume and Market
Share Impacted by TV Ads.
MASBMASB 35 Copyright 2012 MASB
Measuring and Improving the Return from TV Ads
The ARS consumer Brand Preference Metric has met the MASB Marketing Metric Audit Protocol (MMAP).
Its characteristics would deem it “ideal” for serving as a standard for measuring and forecasting the impact of TV advertising and for managing and improving the return.
MASBMASB 36 Copyright 2012 MASB
Contents
Background (the issue) The TV Project
Metrics commonly used by Practitioners Body of Knowledge (metrics used) Marketing Metric Audit Protocol (MMAP) Measuring the Impact of TV Ads The Learning (how ads work) Application (process management) Disclosure
Appendix A: Background Information Appendix B: Basis for Conclusions Appendix C: The Drivers & Implications
MASBMASB 37 Copyright 2012 MASB
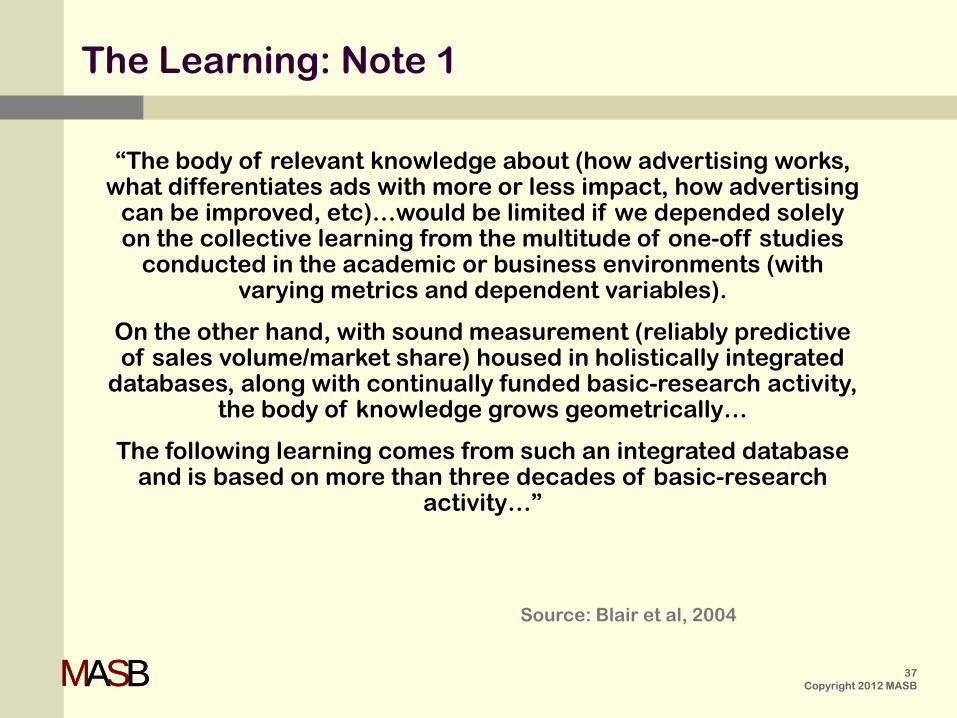
The Learning: Note 1
“The body of relevant knowledge about (how advertising works, what differentiates ads with more or less impact, how advertising
can be improved, etc)…would be limited if we depended solely on the collective learning from the multitude of one-off studies
conducted in the academic or business environments (with varying metrics and dependent variables).
On the other hand, with sound measurement (reliably predictive of sales volume/market share) housed in holistically integrated
databases, along with continually funded basic-research activity, the body of knowledge grows geometrically…
The following learning comes from such an integrated database and is based on more than three decades of basic-research
activity…”
Source: Blair et al, 2004

MASBMASB 38 Copyright 2012 MASB
The Learning: Note 2
Much of the basic research activities have focused on identifying the “drivers” of stronger versus weaker ads, exploring market structure,
strategic approach, content and timing elements of the execution, and consumer feedback measures of recall, liking, emotion, etc.”
“The several hundred conditions and elements explored…explain
85% of the total variation in…outcomes.” (See Appendix C)
The following learning relates to “specific knowledge about the television medium which provides insights into better advertising
practices that when adopted, leads to more consistent and desirable contribution to the business enterprise ”
Sources: Blair et al 2004; 2005
MASBMASB 39 Copyright 2012 MASB
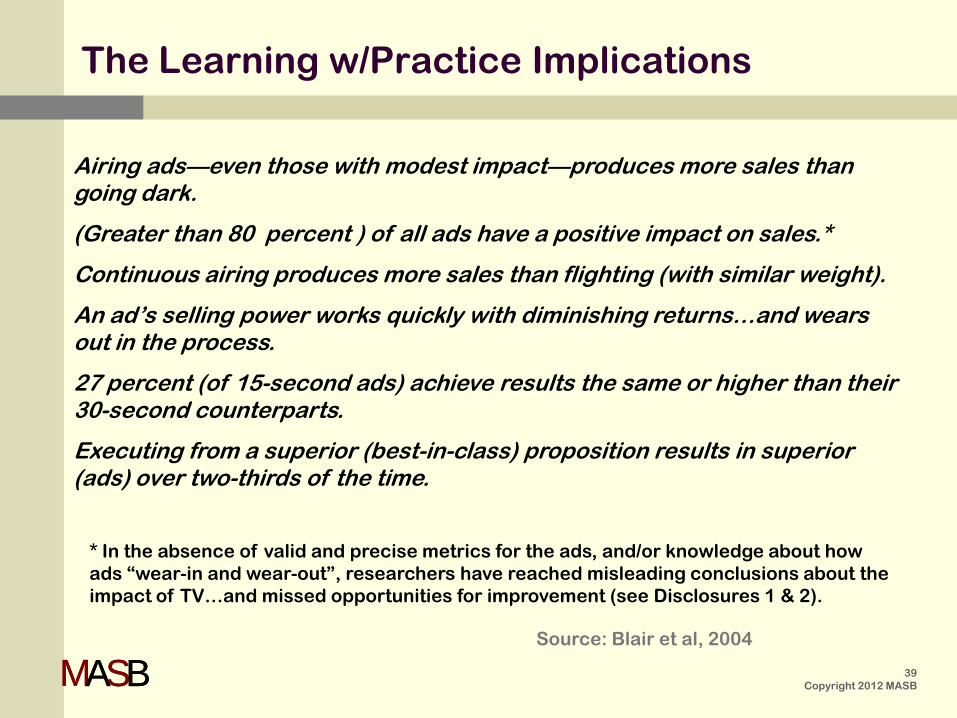
Airing ads—even those with modest impact—produces more sales than going dark.
(Greater than 80 percent ) of all ads have a positive impact on sales.*
Continuous airing produces more sales than flighting (with similar weight).
An ad’s selling power works quickly with diminishing returns…and wears out in the process.
27 percent (of 15-second ads) achieve results the same or higher than their 30-second counterparts.
Executing from a superior (best-in-class) proposition results in superior (ads) over two-thirds of the time.
Source: Blair et al, 2004
The Learning w/Practice Implications
* In the absence of valid and precise metrics for the ads, and/or knowledge about how ads “wear-in and wear-out”, researchers have reached misleading conclusions about the impact of TV…and missed opportunities for improvement (see Disclosures 1 & 2).
MASBMASB 40 Copyright 2012 MASB
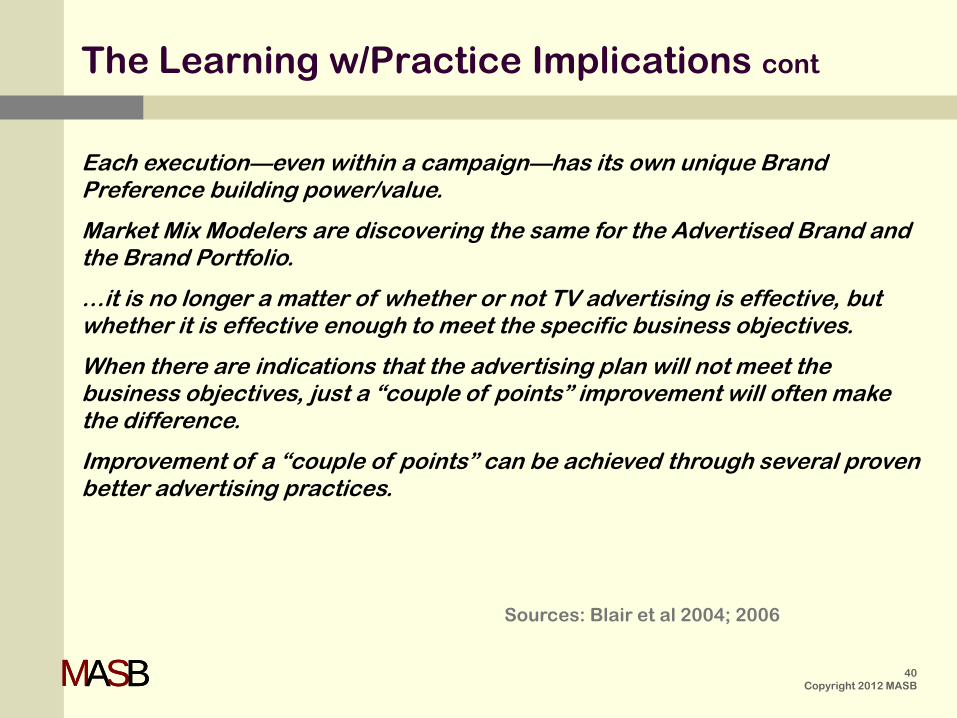
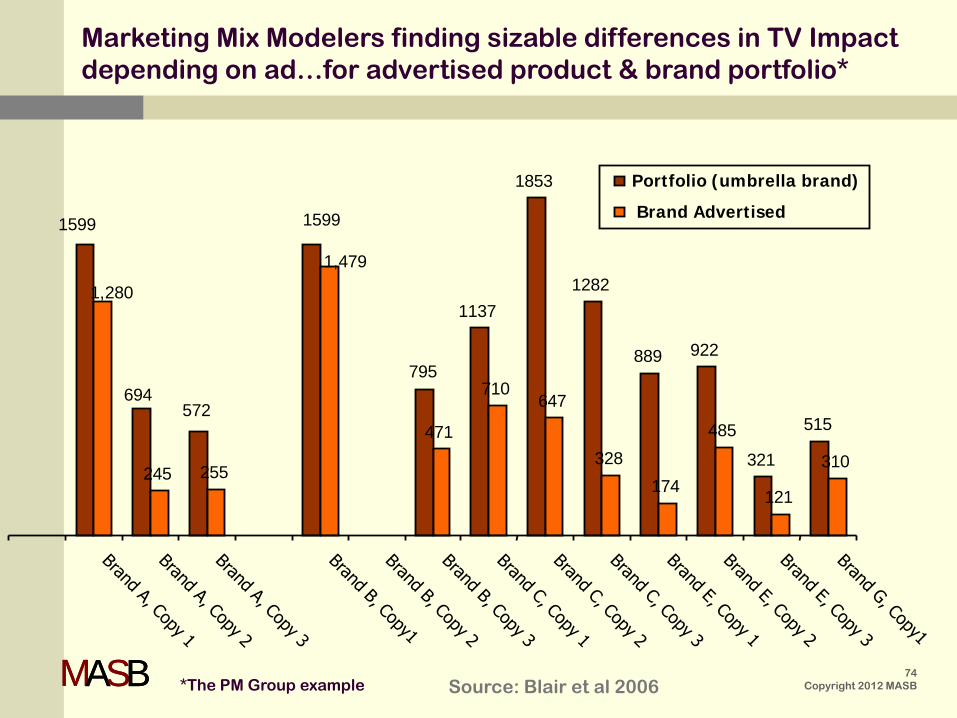
Each execution—even within a campaign—has its own unique Brand Preference building power/value.
Market Mix Modelers are discovering the same for the Advertised Brand and the Brand Portfolio.
…it is no longer a matter of whether or not TV advertising is effective, but whether it is effective enough to meet the specific business objectives.
When there are indications that the advertising plan will not meet the business objectives, just a “couple of points” improvement will often make the difference.
Improvement of a “couple of points” can be achieved through several proven better advertising practices.
Sources: Blair et al 2004; 2006
The Learning w/Practice Implications cont
MASBMASB 41 Copyright 2012 MASB
Current Pre-Market “Copy-Testing” Practices
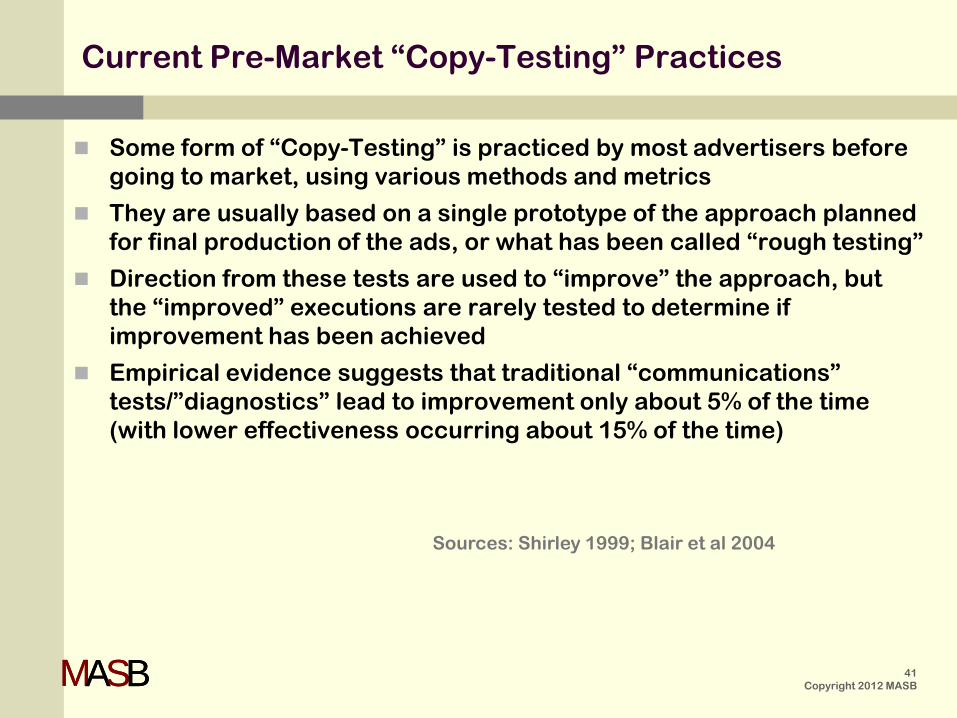
Some form of “Copy-Testing” is practiced by most advertisers before going to market, using various methods and metrics
They are usually based on a single prototype of the approach planned for final production of the ads, or what has been called “rough testing”
Direction from these tests are used to “improve” the approach, but the “improved” executions are rarely tested to determine if improvement has been achieved
Empirical evidence suggests that traditional “communications” tests/”diagnostics” lead to improvement only about 5% of the time (with lower effectiveness occurring about 15% of the time)
Sources: Shirley 1999; Blair et al 2004
MASBMASB 42 Copyright 2012 MASB
Current Pre-Market “Copy-Testing” Practices cont.
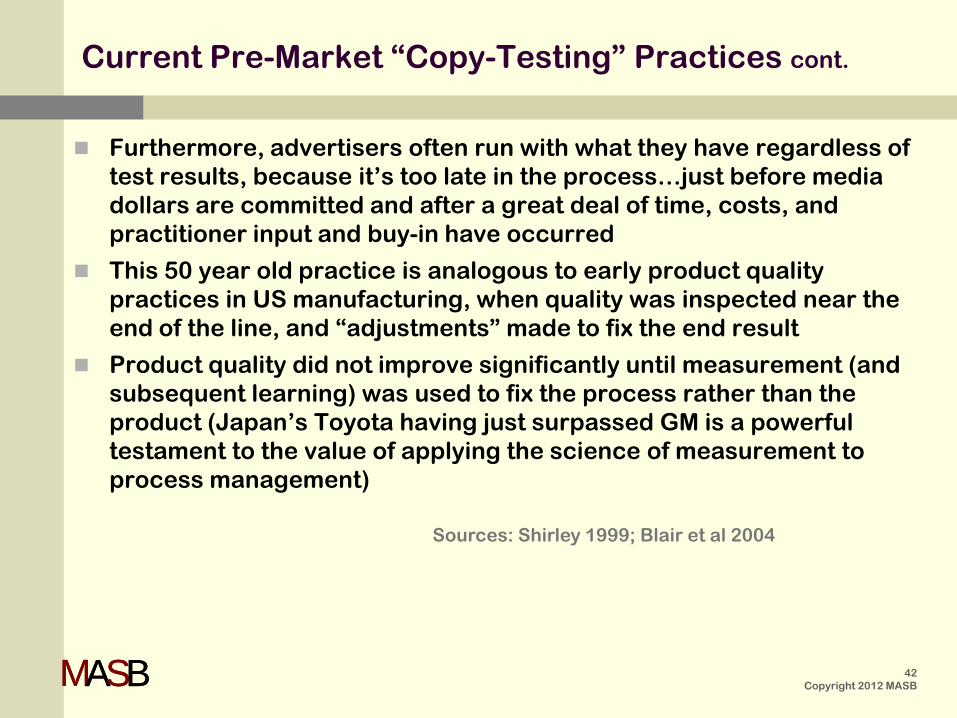
Furthermore, advertisers often run with what they have regardless of test results, because it’s too late in the process…just before media dollars are committed and after a great deal of time, costs, and practitioner input and buy-in have occurred
This 50 year old practice is analogous to early product quality practices in US manufacturing, when quality was inspected near the end of the line, and “adjustments” made to fix the end result
Product quality did not improve significantly until measurement (and subsequent learning) was used to fix the process rather than the product (Japan’s Toyota having just surpassed GM is a powerful testament to the value of applying the science of measurement to process management)
Sources: Shirley 1999; Blair et al 2004

MASBMASB
* Also referred to as best-in-class.
Strength of Value Proposition Determines Overall Level of Subsequent Ads
While differences in creative execution generate ads with a range of effectiveness, they tend toward a “level” similar to that of their underlying
value proposition (reason to buy)…
Bare Bones
Resulting Ad Executions Value Proposition Below At Above*
Below (Normal) 67% 33% 0%
(Normal) 22% 68% 11%
Above (Normal)* 0% 31% 69%
(ARS Persuasion Results)
Source: Blair et al 2004 43
Copyright 2012 MASB
MASBMASB
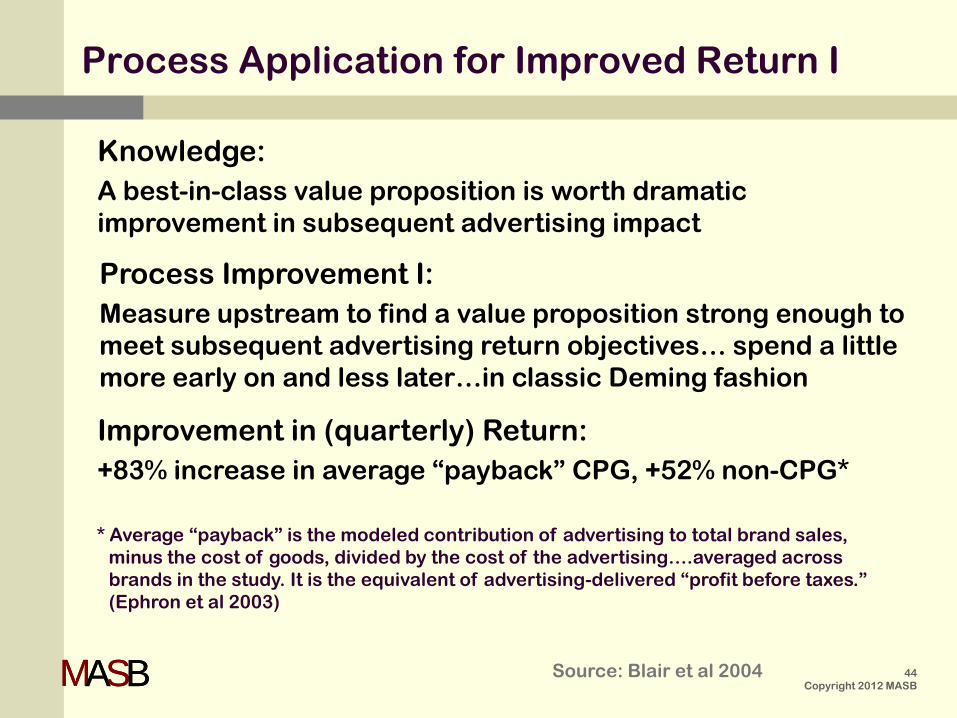
Knowledge: A best-in-class value proposition is worth dramatic improvement in subsequent advertising impact
Process Application for Improved Return I
Process Improvement I: Measure upstream to find a value proposition strong enough to meet subsequent advertising return objectives… spend a little more early on and less later…in classic Deming fashion
Improvement in (quarterly) Return: +83% increase in average “payback” CPG, +52% non-CPG*
Source: Blair et al 2004
* Average “payback” is the modeled contribution of advertising to total brand sales, minus the cost of goods, divided by the cost of the advertising….averaged across brands in the study. It is the equivalent of advertising-delivered “profit before taxes.” (Ephron et al 2003)
44 Copyright 2012 MASB
MASBMASB
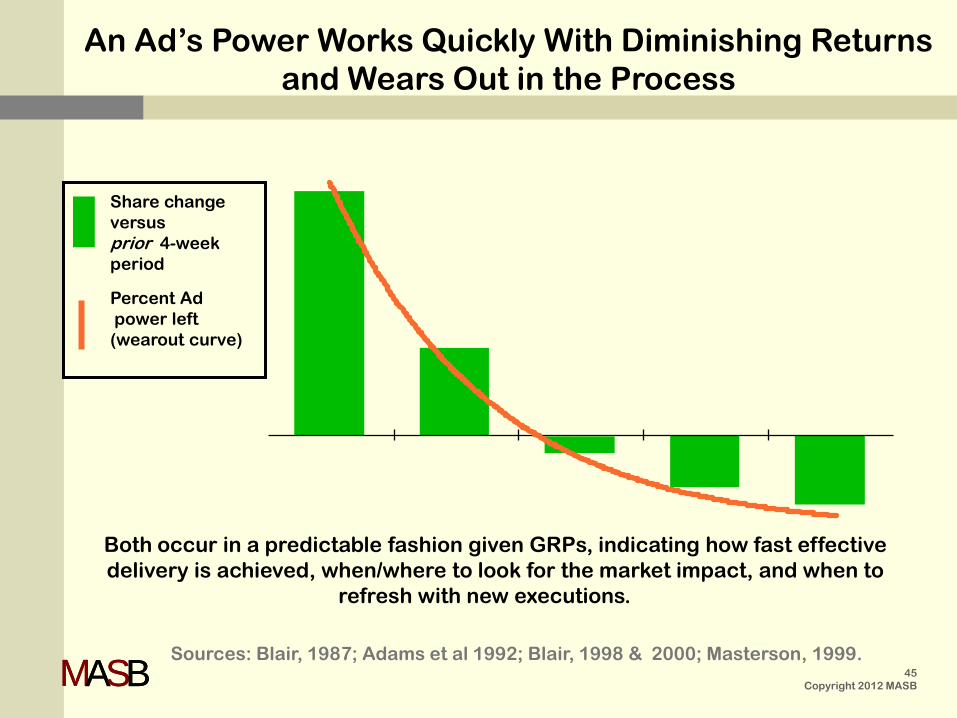
Percent Ad power left (wearout curve)
An Ad’s Power Works Quickly With Diminishing Returns and Wears Out in the Process
Share change versus prior 4-week period
Sources: Blair, 1987; Adams et al 1992; Blair, 1998 & 2000; Masterson, 1999.
Both occur in a predictable fashion given GRPs, indicating how fast effective delivery is achieved, when/where to look for the market impact, and when to
refresh with new executions.
45 Copyright 2012 MASB
MASBMASB
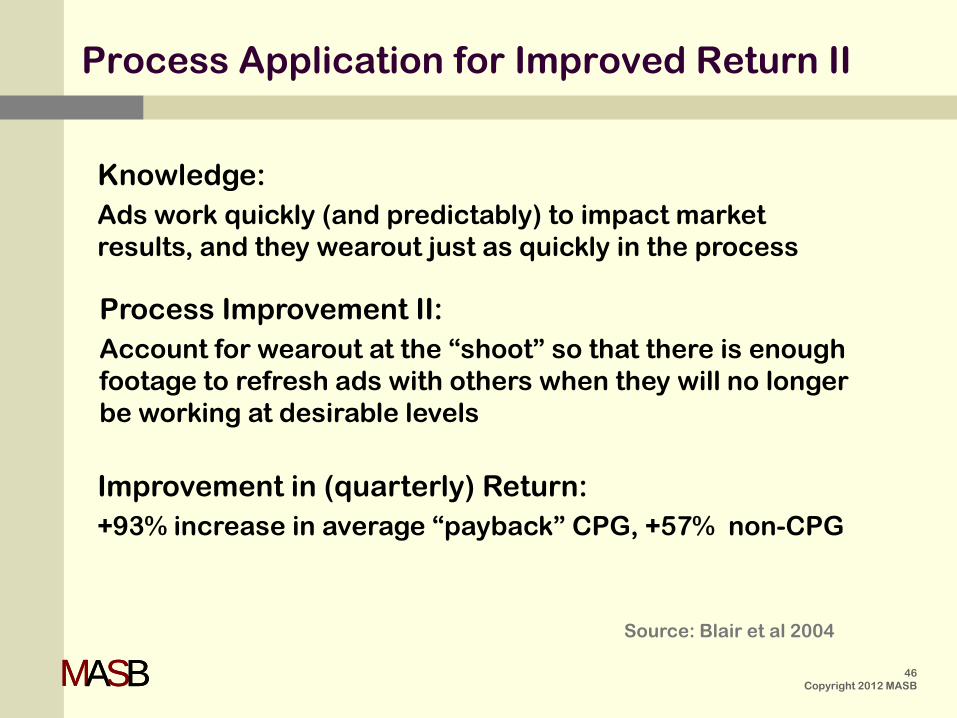
Knowledge: Ads work quickly (and predictably) to impact market results, and they wearout just as quickly in the process
Process Application for Improved Return II
Process Improvement II: Account for wearout at the “shoot” so that there is enough footage to refresh ads with others when they will no longer be working at desirable levels
Improvement in (quarterly) Return: +93% increase in average “payback” CPG, +57% non-CPG
Source: Blair et al 2004
46 Copyright 2012 MASB
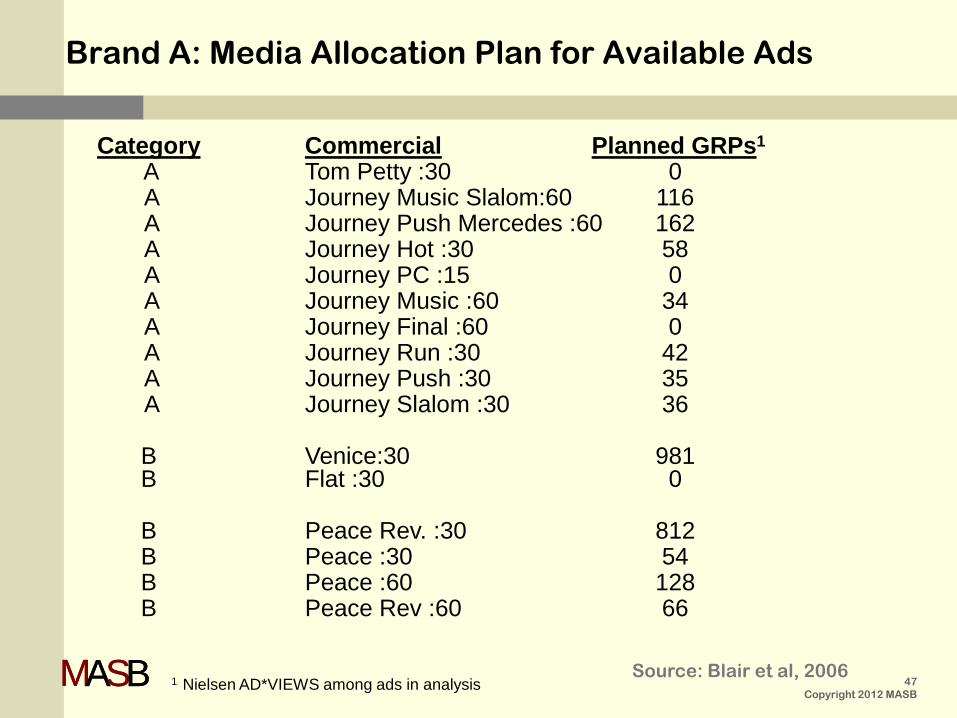
MASBMASB 1 Nielsen AD*VIEWS among ads in analysis
Category Commercial Planned GRPs1 A Tom Petty :30 0 A Journey Music Slalom:60 116 A Journey Push Mercedes :60 162 A Journey Hot :30 58 A Journey PC :15 0 A Journey Music :60 34 A Journey Final :60 0 A Journey Run :30 42 A Journey Push :30 35 A Journey Slalom :30 36 B Venice:30 981 B Flat :30 0 B Peace Rev. :30 812 B Peace :30 54 B Peace :60 128 B Peace Rev :60 66
Brand A: Media Allocation Plan for Available Ads
Source: Blair et al, 2006 47
Copyright 2012 MASB
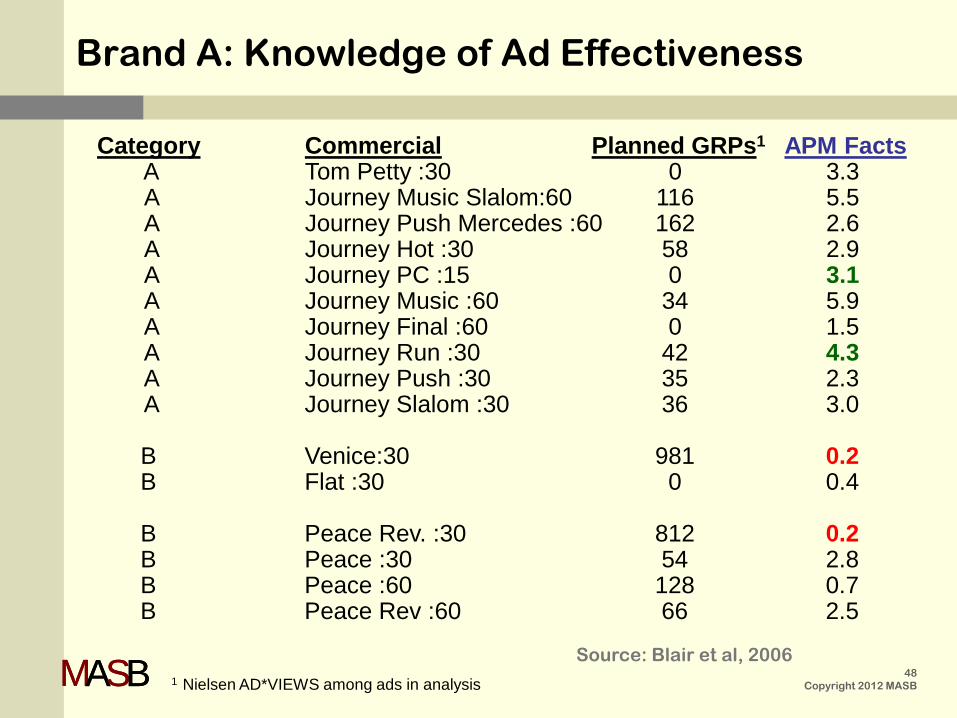
MASBMASB 1 Nielsen AD*VIEWS among ads in analysis
Category Commercial Planned GRPs1 APM Facts
A Tom Petty :30 0 3.3 A Journey Music Slalom:60 116 5.5 A Journey Push Mercedes :60 162 2.6 A Journey Hot :30 58 2.9 A Journey PC :15 0 3.1 A Journey Music :60 34 5.9 A Journey Final :60 0 1.5 A Journey Run :30 42 4.3 A Journey Push :30 35 2.3 A Journey Slalom :30 36 3.0 B Venice:30 981 0.2 B Flat :30 0 0.4 B Peace Rev. :30 812 0.2 B Peace :30 54 2.8 B Peace :60 128 0.7 B Peace Rev :60 66 2.5
Brand A: Knowledge of Ad Effectiveness
Source: Blair et al, 2006 48
Copyright 2012 MASB
MASBMASB
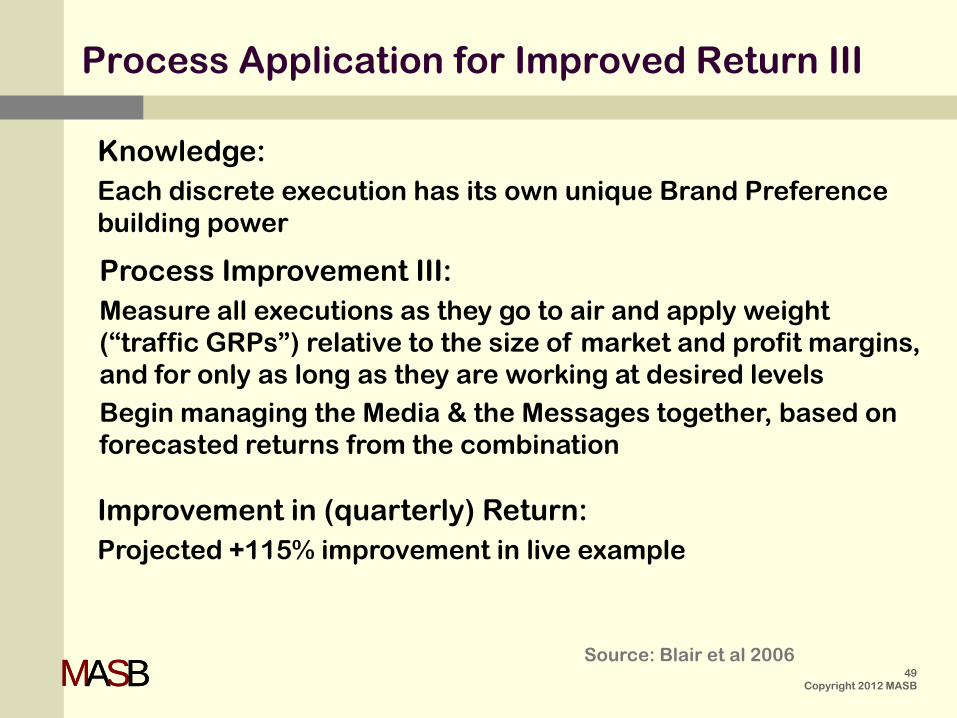
Knowledge: Each discrete execution has its own unique Brand Preference building power
Process Application for Improved Return III
Process Improvement III: Measure all executions as they go to air and apply weight (“traffic GRPs”) relative to the size of market and profit margins, and for only as long as they are working at desired levels Begin managing the Media & the Messages together, based on forecasted returns from the combination
Improvement in (quarterly) Return: Projected +115% improvement in live example
Source: Blair et al 2006 49
Copyright 2012 MASB
MASBMASB
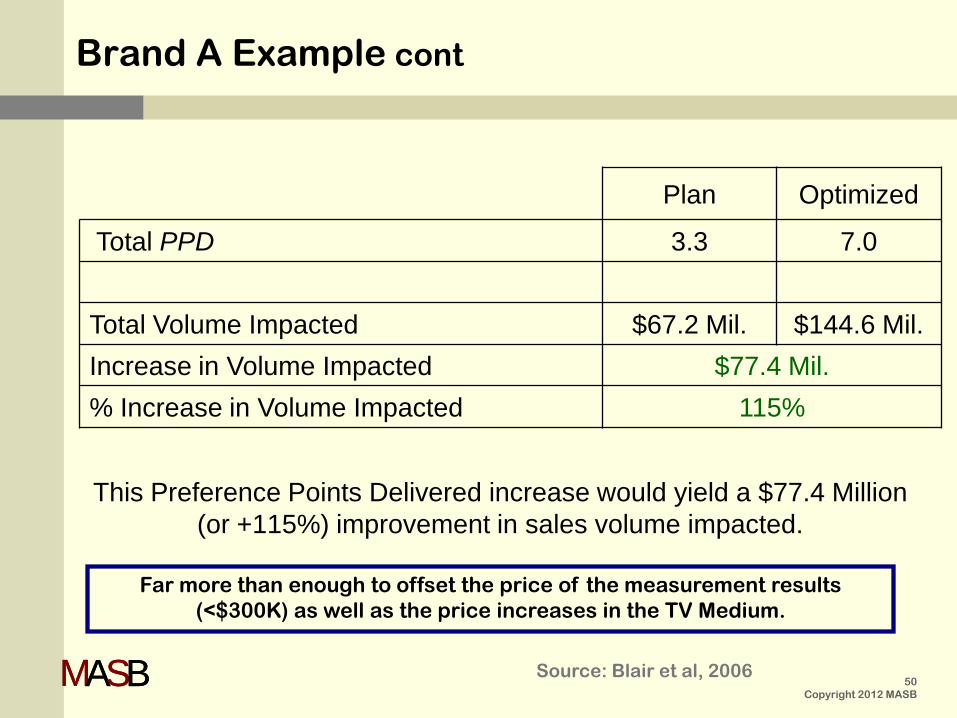
This Preference Points Delivered increase would yield a $77.4 Million (or +115%) improvement in sales volume impacted.
Plan Optimized
Total PPD 3.3 7.0
Total Volume Impacted $67.2 Mil. $144.6 Mil. Increase in Volume Impacted $77.4 Mil. % Increase in Volume Impacted 115%
Far more than enough to offset the price of the measurement results (<$300K) as well as the price increases in the TV Medium.
Brand A Example cont
Source: Blair et al, 2006 50
Copyright 2012 MASB
MASBMASB
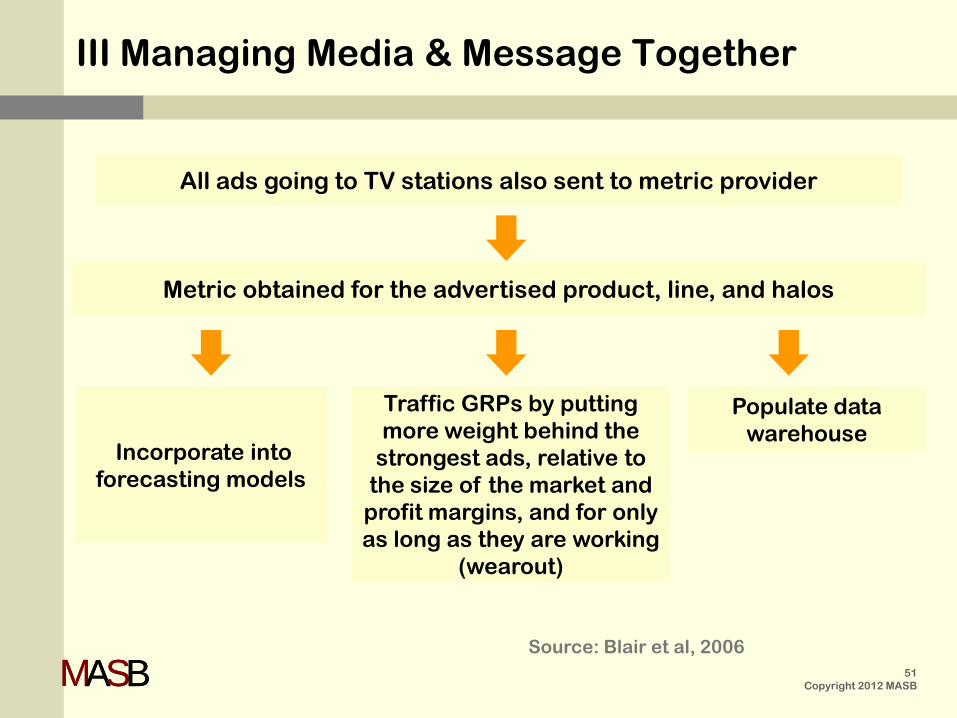
Incorporate into forecasting models
All ads going to TV stations also sent to metric provider
Metric obtained for the advertised product, line, and halos
Populate data warehouse
Traffic GRPs by putting more weight behind the
strongest ads, relative to the size of the market and
profit margins, and for only as long as they are working
(wearout)
III Managing Media & Message Together
Source: Blair et al, 2006 51
Copyright 2012 MASB
MASBMASB
• While agency creative teams have resolved that the practice of “copy-testing” stifles the art of advertising, the right measurements taken at the right time need not be at odds with the creative process.
• The practices of big Hollywood movie houses can serve as an analogy.
• While the Hollywood houses have review committees at the start of the process, they generally don’t stifle creativity once the decision to move forward with production has been made. They understand that they’ll be producing a few winners, a few losers, and most ranging in the middle.
• They do, however, manage their marketing and distribution expenditures wisely, once the movie and assessment of its appeal are in hand.
• The winners get advertised and promoted heavily for optimal return from the box office through the end of the chain; the losers go to the end of the distribution channel very quickly (video stores, etc.); and the ones in the middle get varying amounts of marketing support and enter the chain of distribution based on their appeal levels.
• Application III for TV advertising parallels this practice of measuring when finished and applying media dollars/weight based on forecasted return.
III Hollywood Analogy
52 Copyright 2012 MASB
MASBMASB
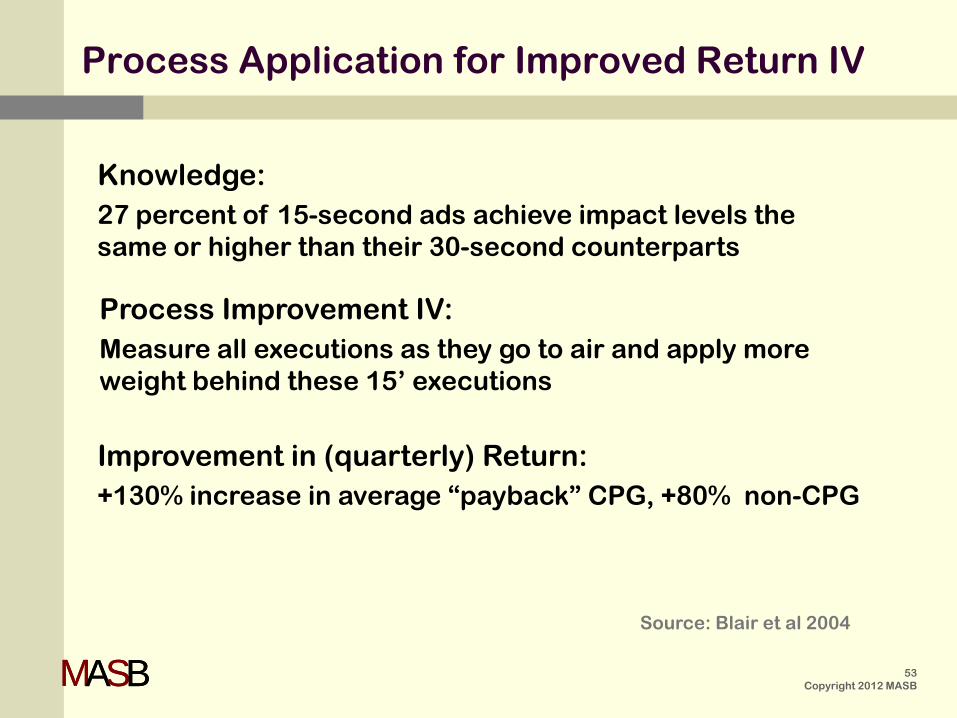
Knowledge: 27 percent of 15-second ads achieve impact levels the same or higher than their 30-second counterparts
Process Application for Improved Return IV
Process Improvement IV: Measure all executions as they go to air and apply more weight behind these 15’ executions
Improvement in (quarterly) Return: +130% increase in average “payback” CPG, +80% non-CPG
Source: Blair et al 2004
53 Copyright 2012 MASB
MASBMASB
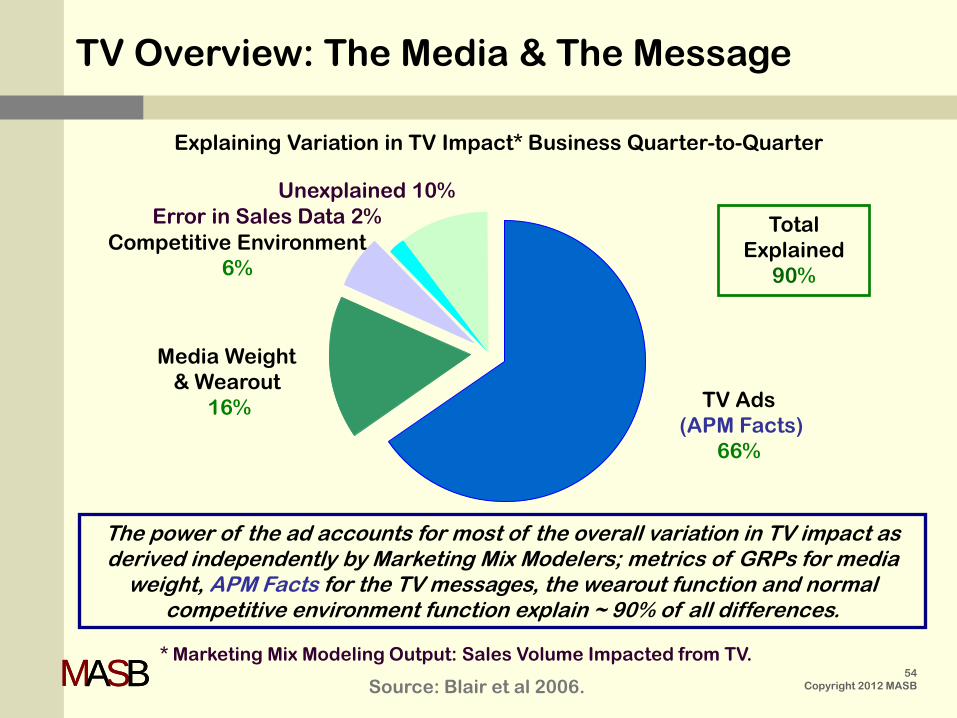
The power of the ad accounts for most of the overall variation in TV impact as derived independently by Marketing Mix Modelers; metrics of GRPs for media
weight, APM Facts for the TV messages, the wearout function and normal competitive environment function explain ~ 90% of all differences.
* Marketing Mix Modeling Output: Sales Volume Impacted from TV.
Source: Blair et al 2006.
Media Weight & Wearout
16%
Unexplained 10%
Competitive Environment 6%
Error in Sales Data 2%
TV Ads
(APM Facts) 66%
Total Explained
90%
Explaining Variation in TV Impact* Business Quarter-to-Quarter
TV Overview: The Media & The Message
54 Copyright 2012 MASB

MASBMASB 55 Copyright 2012 MASB
Summary & Conclusions
The ARS consumer Brand Preference Metric has met the MASB Marketing Metric Audit Protocol (MMAP).
Its characteristics would deem it “ideal” for serving as a standard for measuring and forecasting the impact of TV advertising and for managing and improving the return.
Application of the metric during the advertising development and management processes has enabled
improvement in return greater than that needed to offset the rises in TV Media costs.
Note: While various metrics may be called the same and even look alike in many ways, specific methodologies within classes and types of metrics often yield very different levels of reliability and validity (see Appendix B)
MASBMASB 56 Copyright 2012 MASB
Contents
Background (the issue) The TV Project
Metrics commonly used by Practitioners Body of Knowledge (metrics used) Marketing Metric Audit Protocol (MMAP) Measuring the Impact of TV Ads (exemplar) The Learning (how ads work) Application (process management) Disclosure
Appendix A: Background Information Appendix B: Basis for Conclusions Appendix C: The Drivers & Implications
MASBMASB 57 Copyright 2012 MASB
Disclosure (1): One study could not replicate
An IRI split-cable “How T.V. Advertising Works” study based on 17 observations could not replicate the body of Knowledge regarding the predictive validity of the Exemplar (Lodish et al, JMR 1995, 32)
It was later learned and then confirmed by IRI that at least 11 of the 17 cases used in the study were measurement results for “rough” commercials, not scores for the ads that actually aired in the split-cable tests (Blair et al, JAR 1994, 34; Lodish et al, JMR 1995, 32)
“Scores can only be used reliably to forecast marketplace results if they measure the persuasive power of the actual finished commercials that will be used on air. To use data from rough commercials is like forecasting the sales of a new brand from hypothetical data on price, distribution, promotional spending et al.” (Jones, JAR, 1998)
MASBMASB 58 Copyright 2012 MASB
Disclosure (2): Same Study Found Less Discrimination
The same IRI split-cable “How T.V. Advertising Works” study found “measurable” sales or market share effects for only about 50% of the T.V. ads run with differing media weight, and similar findings for pairs in which one cell had no advertising. This measurable impact finding (or lack of finding) is much lower than that reported by Blair using APM Facts (Lodish et al, JMR 1995, 32; Blair et al, JAR 2004).
Several factors may explain this difference in discrimination: First, some of the ads used in the split-cable experiments may have
been “worn-out” at the start of the test; for instance, ads included in the split-cable studies were pre-tested as long as two years before the split-cable study commenced (Lodish 1995).
Second, the split-cable tests were generally read at the end of one year, when in the heavy-up cells the ads delivered their selling power faster than in the lighter cells and wore down to the level of effectiveness in the lower weight cells (or even lower) by the end of the test (Blair, 2006 and 2006B).
And finally, 50% discrimination in the split-cable experiments reflects in part the lack of precision, or sensitivity, of the split-cable methodology. Finding “no significant impact” in the other 50% of the cases merely means that a true impact on sales or market share may have been smaller than the experiments were designed to detect.
MASBMASB 59 Copyright 2012 MASB
-5
-4
-3
-2
-1
0
1
2
3
3/15/1982 4/12/1982 5/10/1982 6/7/1982 7/5/1982 8/2/1982 8/30/1982 9/27/1982
Four Week Period Ending
Ounc
e M
arke
t Sha
re D
iffer
ence
0.0
0.2
0.4
0.6
0.8
1.0
1.2
1.4
1.6
1.8
Cum
ulat
ive
Diffe
renc
e in
PPD
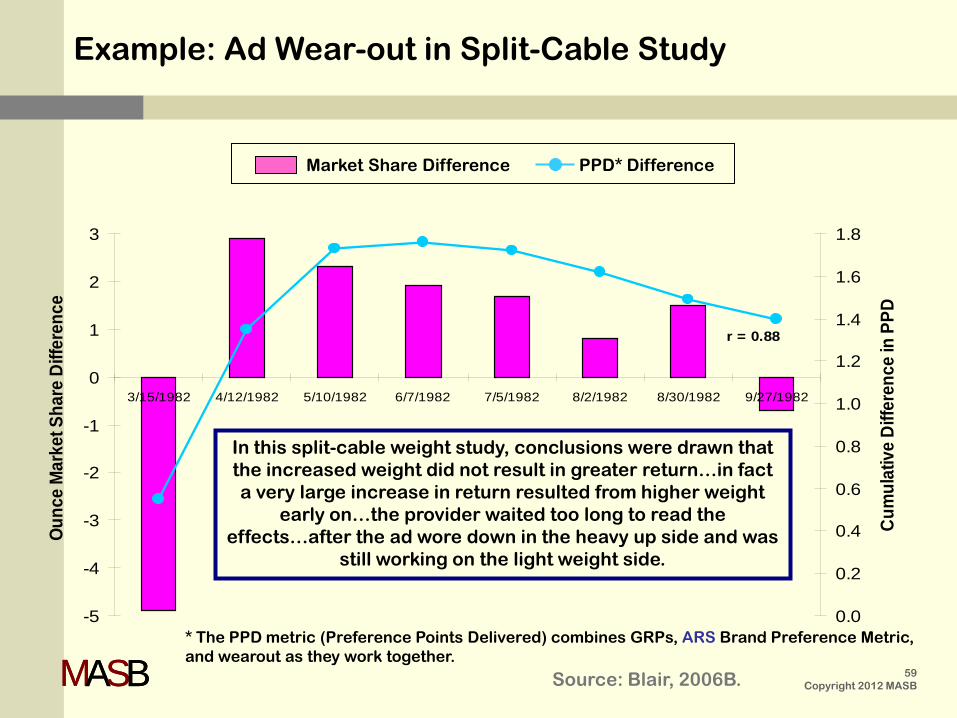
r = 0.88
Source: Blair, 2006B.
Market Share Difference PPD* Difference
In this split-cable weight study, conclusions were drawn that the increased weight did not result in greater return…in fact a very large increase in return resulted from higher weight
early on…the provider waited too long to read the effects…after the ad wore down in the heavy up side and was
still working on the light weight side.
Example: Ad Wear-out in Split-Cable Study
* The PPD metric (Preference Points Delivered) combines GRPs, ARS Brand Preference Metric, and wearout as they work together.
MASBMASB 60 Copyright 2012 MASB
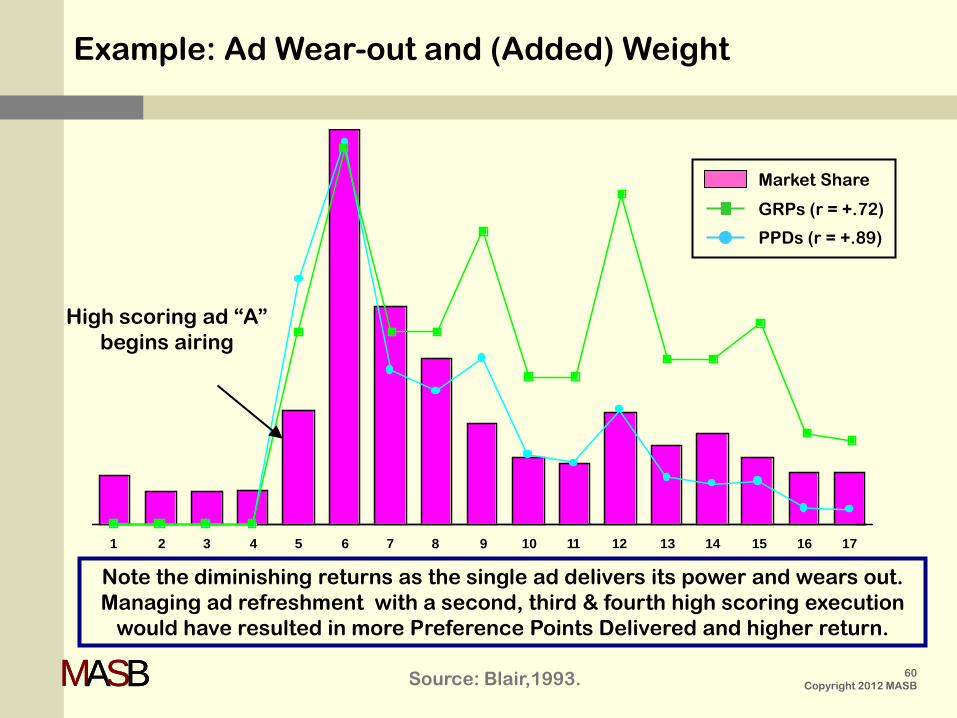
1 2 3 4 5 6 7 8 9 10 11 12 13 14 15 16 17
Four-Week Period
Market Share
GRPs (r = +.72)
PPDs (r = +.89)
High scoring ad “A” begins airing
Note the diminishing returns as the single ad delivers its power and wears out. Managing ad refreshment with a second, third & fourth high scoring execution
would have resulted in more Preference Points Delivered and higher return.
Source: Blair,1993.
Example: Ad Wear-out and (Added) Weight
MASBMASB 61 Copyright 2012 MASB
Disclosures 1 & 2: Comment
“Modeling the results of advertising by focusing on spending or GRPs without consideration of the message is rather like doing
dosage research when you have not identified the drug.
No matter how rigorous the methodology or review process such research is fundamentally flawed. The academic literature in particular reports a lot of this type of “dosage” research because
academics can get access to the data on spending.
But, this is really misleading research and does an injustice to marketing activities.
Because such research does not recognize qualitative differences in marketing activities (qualitative differences that influence
effectiveness), it underestimates the power of “effective” marketing and also underestimates the return on investment in creating more
effective marketing activities.
It also fails to recognize the value of the ‘creative’ product.”
Stewart 3/8/08 During MASB Review VI
MASBMASB 62 Copyright 2012 MASB
Disclosure (3): GAPS
Verticals sparse or missing from provider’s data base B2B Other Services Technology Ads
MASB would encourage provider and advertisers to conduct
validation research for these verticals
MASBMASB 63 Copyright 2012 MASB
Disclosure (4): Extension Opportunities
MASB would also encourage
Calibration to Baseline Sales for predicting longer term effects and balance sheet implications
Calibration to Price elasticity for pricing/margin implications
Application for other advertising channels (where costs warrant)
Application for other touch points (product, shelf, etc)
Application as dependent variable/top-line Intermediate Outcome in Brand Tracking
MASBMASB 64 Copyright 2012 MASB
Disclosure (5): Company Changes
This Statement is based on validation and causality audit results regarding the ARS Brand Preference Metric as of February 2006, with updates provided to MASB in February 2008.
The company (ARS Group) was bought by comScore in 2010. According to MMAP, the Ideal Measures are transparent, subject to
Independent Audit (#9), And managed with formal on-going processes to assure the
reliability, validity and causality features over time (#10). In light of company changes, MASB recommends an “intermittent
audit” in order to ensure transparency and continuity in provider’s quality assurance programs.
This statement can be considered an historical example of how to evaluate a marketing metric according to MMAP, the learning that can come from using an Ideal Metric over time and conditions, and how to improve return from the activity by applying the metric and learning to better marketing practice (process management).
MASBMASB 65 Copyright 2012 MASB
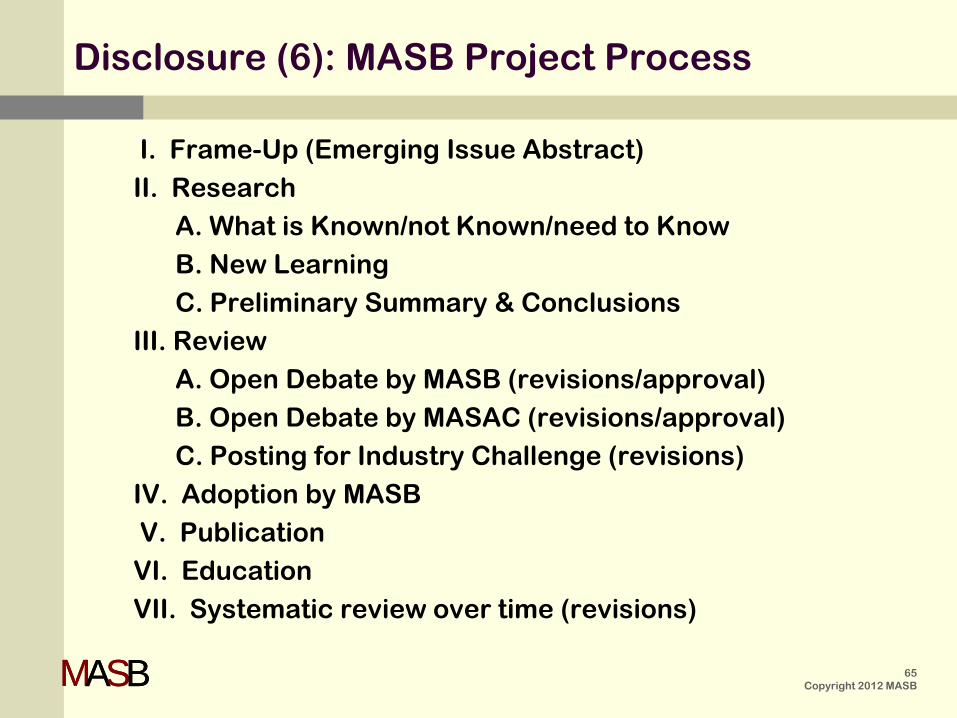
I. Frame-Up (Emerging Issue Abstract) II. Research
A. What is Known/not Known/need to Know B. New Learning C. Preliminary Summary & Conclusions
III. Review A. Open Debate by MASB (revisions/approval) B. Open Debate by MASAC (revisions/approval) C. Posting for Industry Challenge (revisions)
IV. Adoption by MASB V. Publication VI. Education VII. Systematic review over time (revisions)
Disclosure (6): MASB Project Process
MASBMASB 66 Copyright 2012 MASB
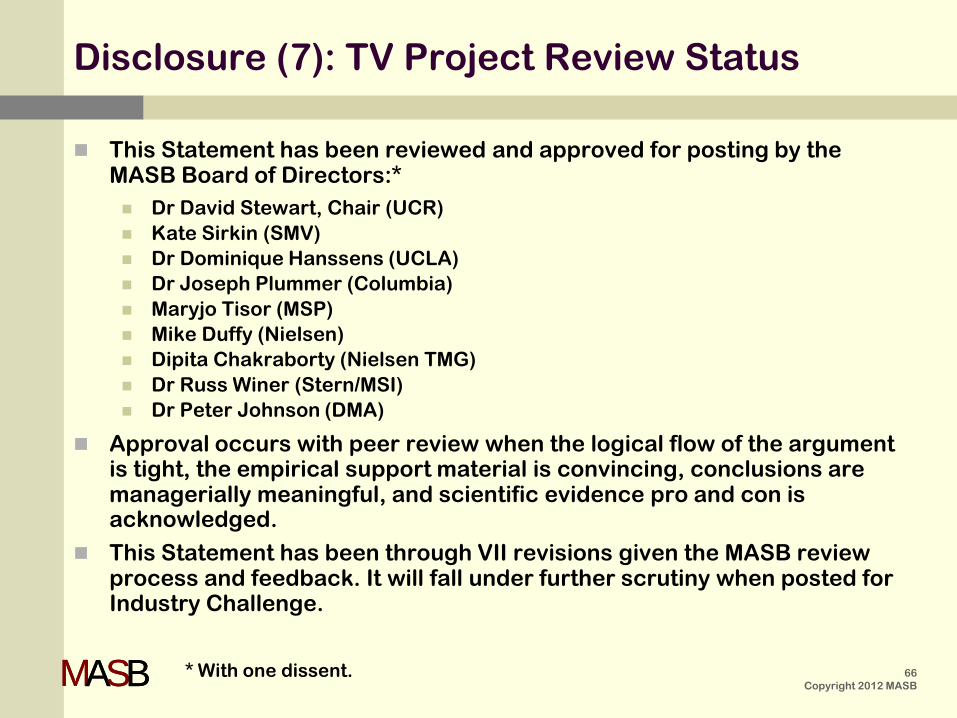
Disclosure (7): TV Project Review Status
This Statement has been reviewed and approved for posting by the MASB Board of Directors:* Dr David Stewart, Chair (UCR) Kate Sirkin (SMV) Dr Dominique Hanssens (UCLA) Dr Joseph Plummer (Columbia) Maryjo Tisor (MSP) Mike Duffy (Nielsen) Dipita Chakraborty (Nielsen TMG) Dr Russ Winer (Stern/MSI) Dr Peter Johnson (DMA)
Approval occurs with peer review when the logical flow of the argument is tight, the empirical support material is convincing, conclusions are managerially meaningful, and scientific evidence pro and con is acknowledged.
This Statement has been through VII revisions given the MASB review process and feedback. It will fall under further scrutiny when posted for Industry Challenge.
* With one dissent.
MASBMASB 67 Copyright 2012 MASB
Adams, A.J. and M.H. Blair (April 1992). “Persuasive Advertising and Sales Accountability: Past Experience and Forward Validation.” Journal of Advertising Research 32 (2)
ANA (October 2005). Marketing Accountability Task Force Findings
Blair M.H. (December 1987/January 1988). “An Empirical Investigation of Advertising Wearin and Wearout.” Journal of Advertising Research, 27 (6)
_______ (November 1989). “Getting Your Money’s Worth: Measuring and Managing the Impact and Effectiveness of Your Advertising Campaign.” Speech presented at the Cost-Effective Advertising Techniques Conference, Toronto
_______ (December 1993). “Moving Beyond GRPs to PRPs: Another Major Challenge for the 21st Century.” Presented at the ARF Twelfth Annual Electronic Media Workshop, New York
_______ and K.E. Rosenberg (June 1994). “Convergent Findings Increase our Understanding of How Advertising Works.” Journal of Advertising Research, 34
_______ and M.J. Rabuck (October 1998). “Advertising Wearin and Wearout: Ten Years Later; More Empirical Evidence and Successful Practice." Journal of Advertising Research, 38 (5)
_______ (December 2000). “An Empirical Investigation of Advertising Wearin and Wearout.” Journal of Advertising Research, Special Classics Issue, 40 (6)
_______ and A.R. Kuse (March 2004). “Better Practices in Advertising Can Change a Cost of Doing Business to Wise Investments in the Business”. Journal of Advertising Research, 44 (1)
_______ (November 2004B). “ROMI Changes Everything.” Presented at ARF’s Week of Workshops, New York, NY
References (1)
MASBMASB 68 Copyright 2012 MASB
Blair, M.H. (May 2005). “W. Edwards Deming Went to Japan, We Stayed Here, Now ROMI Changes Everything for All of Us.” Presented at Academy of Marketing Sciences Annual Convention upon acceptance of Marketing Practitioner of the Year Award, Tampa, FL
_______ and F.L. Findley (February 2006). “ROMI Branding Future: Integrated Measurement Systems for Market Mix Forecasting, Portfolio Management, and Improving Return from Marketing Communications Activities.” Presented at the 9th Annual ROMI Conference, Institute for International Research, Ft Meyers, FL
_______ (February 2006B).“When in ROMI, Use PPD.” Media Post’s Media Proof 48-49.
_______ (February 2006C). “Improving the Top and Bottom Lines Through ROI Measurement Systems and Process Management.” Corporate Finance Review, January/February 2006).
Gibson, L.D. (1983). “Not Recall.” Journal of Advertising Research, 23 (1)
Jones, J.P. (1986). What’s in a Name? Advertising and the Concept of Brands. New York, NY: Lexington Books.
_______ (1998). “Point of view: STAS and BehaviorScan - Yet Another View”. Journal of Advertising Research, 38 (2).
_______ and M.H. Blair (December 1996). “Examining ‘Conventional Wisdom’ About Advertising Effects with Evidence from Independent Sources." Journal of Advertising Research, 36 (6)
Ephron, Erwin and Gerry Pollak (June 2003). “Finding the Other Half.” Presented at the ARF/ESOMAR Conference, Los Angeles, CA.
References (2)
MASBMASB 69 Copyright 2012 MASB
rsc (2005 & 2008). “Summary of the ARS Group’s Global Validation & Business Implications”
rsc (2005 & 2007). “Summary of Factors Affecting ARS Persuasion Scores”
Kuse, A.R. (1991). “Measurement TOOLS FOR Ads that Sell.” In Transcript Proceedings of the ARF Eighth Annual Copy Research Workshop, Advertising Research Foundation, New York, NY.
Lodish, L.M., M. Abraham, S. Kalmensos, J. Livelsberger, B. Lubetkin, B. Richardson, and M. Stevens (1995). “How T.V. Advertising Works: A Meta-Analysis of 389 Real World Split Cable T.V. Advertising Experiments”, Journal of Marketing Research, 135
Masterson, P. (1999). “The Wearout Phenomenon”. Marketing Research 11 (3)
Plummer, J. (February 2007). “Why So Many Metrics”, The Boardroom Project Winter Meeting
Ross, H.L., Jr (1982). “ Recall versus Persuasion: An Answer.” Journal of Advertising , 22 (1)
Shirley, D. (April/May1999). “Measuring the Effectiveness of Advertising”. ANA The Advertiser.
Stewart, D. W.; D.H. Furse; and R. Kozak. (1983) “A Guide to Commercial Copy-testing Services.” Current Issues and Research in Advertising 6, 1:1-44.
_______ and David H. Furse. (1986). Effective Television Advertising. D.C. Heath and Company/Lexington, MA/Toronto: Lexington Books.
_______ and Scott Koslow (1989). “Executional Factors and Advertising Effectiveness: A Replication.” Journal of Advertising 8 (3)
________ (2008). “How Marketing Contributes to the Bottom Line”. Journal of Advertising Research 48, 1: 94-105.
References (3)

MASBMASB 70 Copyright 2012 MASB
The Boardroom Project (2006). The Boardroom Project Overview
Wells, W.D. (1997). Measuring Advertising Effectiveness. Lawrence Erlbaum Associates, Publishers Mahwah, New Jersey. London
Vakratsas, Demetrios, and Tim Ambler (1999). “How Advertising Works: What Do We Really Know?” Journal of Marketing, 63 (26-43).
Young, R.A, A.M. Weiss, D.W. Stewart (2006). Marketing Champions, Practical Strategies for Improving Marketing’s Power, Influence, and Business Impact. Hoboken, NJ: Wiley & Sons.
References (4)
MASBMASB 71 Copyright 2012 MASB
Contents
Background (the issue) The TV Project
Metrics commonly used by Practitioners Body of Knowledge (metrics used) Marketing Metric Audit Protocol (MMAP) Measuring the Impact of TV Ads (exemplar) The Learning (how ads work) Application (process management) Disclosure
Appendix A: Background Information Appendix B: Basis for Conclusions Appendix C: The Drivers & Implications
MASBMASB
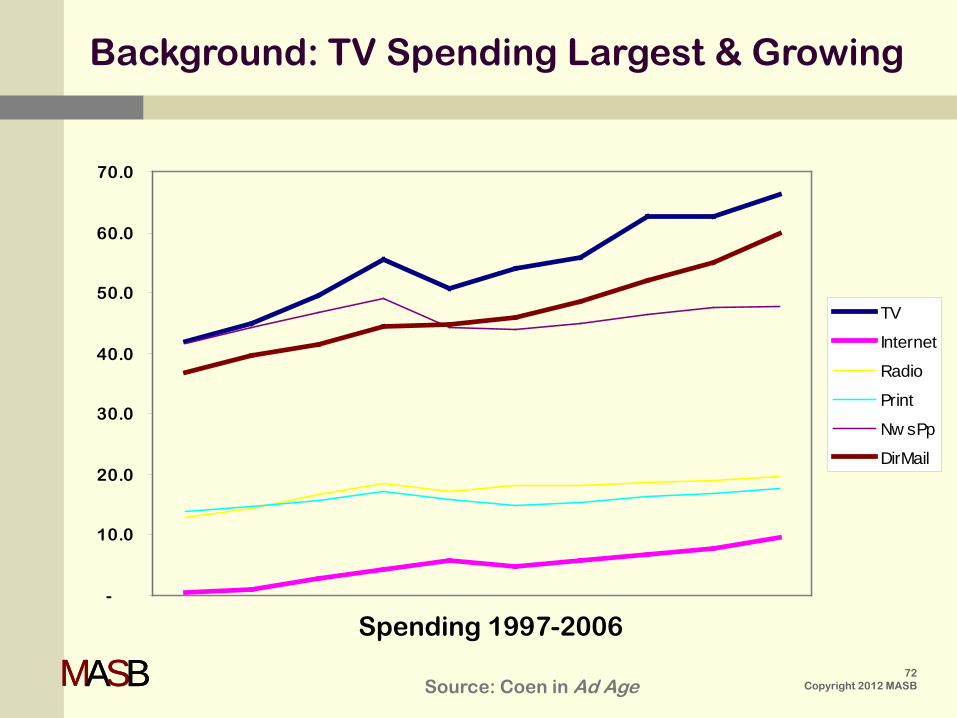
Background: TV Spending Largest & Growing
Source: Coen in Ad Age
Spending 1997-2006 -
10.0
20.0
30.0
40.0
50.0
60.0
70.0
TV
Internet
Radio
Nw sPp
DirMail
72 Copyright 2012 MASB
MASBMASB
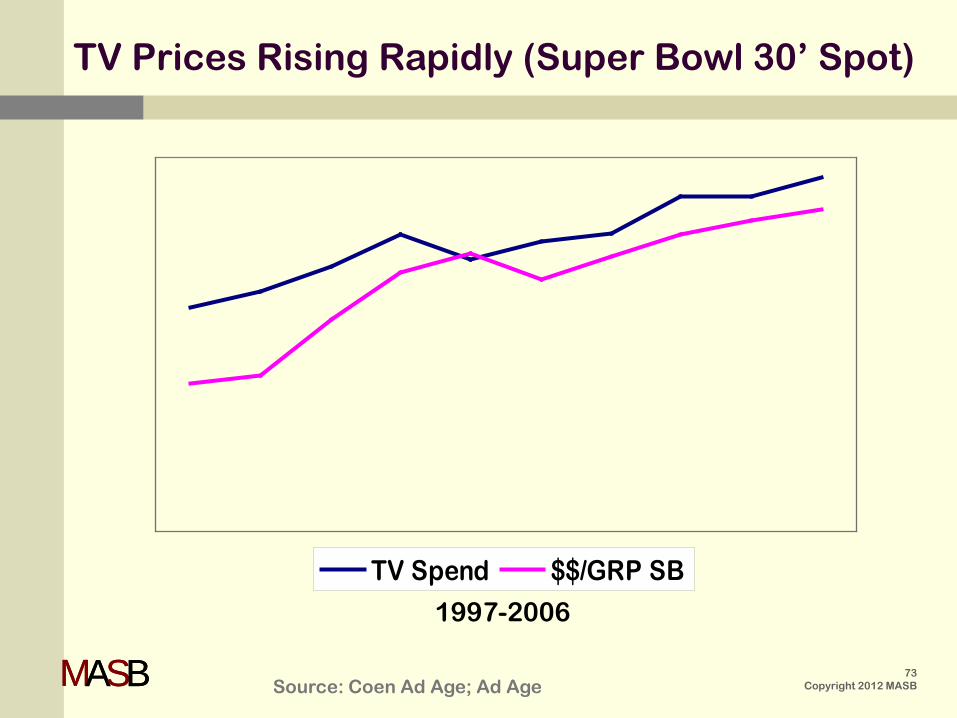
TV Prices Rising Rapidly (Super Bowl 30’ Spot)
Source: Coen Ad Age; Ad Age
TV Spend $$/GRP SB
1997-2006
73 Copyright 2012 MASB
MASBMASB *The PM Group example
Marketing Mix Modelers finding sizable differences in TV Impact depending on ad…for advertised product & brand portfolio*
1137
1853
1282
889 922
321
515
245 255
471
710 647
328 174
485
121
310
1599
694 572
1599
795
1,479
1,280
Portfolio (umbrella brand)
Brand Advertised
Source: Blair et al 2006 74
Copyright 2012 MASB

MASBMASB
Explaining Differences/Variation in Quarterly Market Share Changes
Across ~179 brands, TV activity explains 65% of the total variation in Market Share changes, quarter-to-quarter
Indicates TV has the most leverage of all elements in the mix (other channels combined would account for <28% in today’s environment)
(Bias in database: contains only brands that do TV)
Source: Blair et al, 2006; Summary of…Global Validation…2008 Update.
TV The Most Leverage/Improvement Opportunity
TV in Total 65%
TV Media Weight & Wearout 8%
Unexplained 28%
Continuity of Airing 5%
Normal Competitive Environment 2%
Product Price & Distribution2 3%
Error in Sales Data 2%
Total Explained
72%
TV Ads (APM Facts)
52%
75 Copyright 2012 MASB
MASBMASB 76 Copyright 2012 MASB
Contents
Background (the issue) The TV Project
Metrics commonly used by Practitioners Body of Knowledge (metrics used) Marketing Metric Audit Protocol (MMAP) Measuring the Impact of TV Ads (exemplar) The Learning (how ads work) Application (process management) Disclosure
Appendix A: Background Information Appendix B: Basis for Conclusions Appendix C: The Drivers & Implications
MASBMASB 77 Copyright 2012 MASB
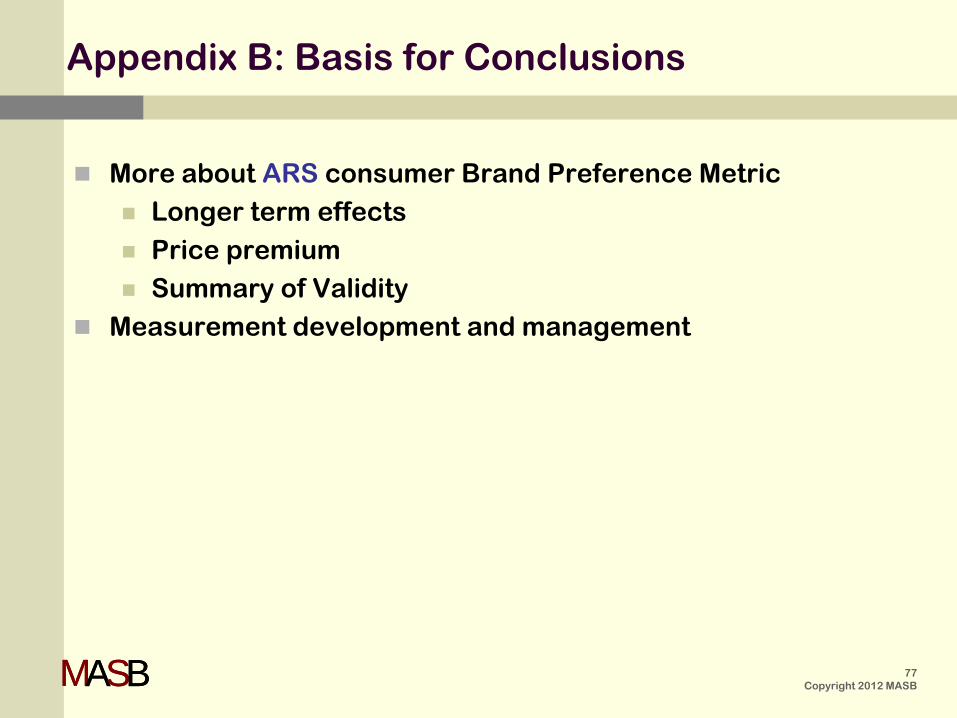
Appendix B: Basis for Conclusions
More about ARS consumer Brand Preference Metric Longer term effects Price premium Summary of Validity
Measurement development and management
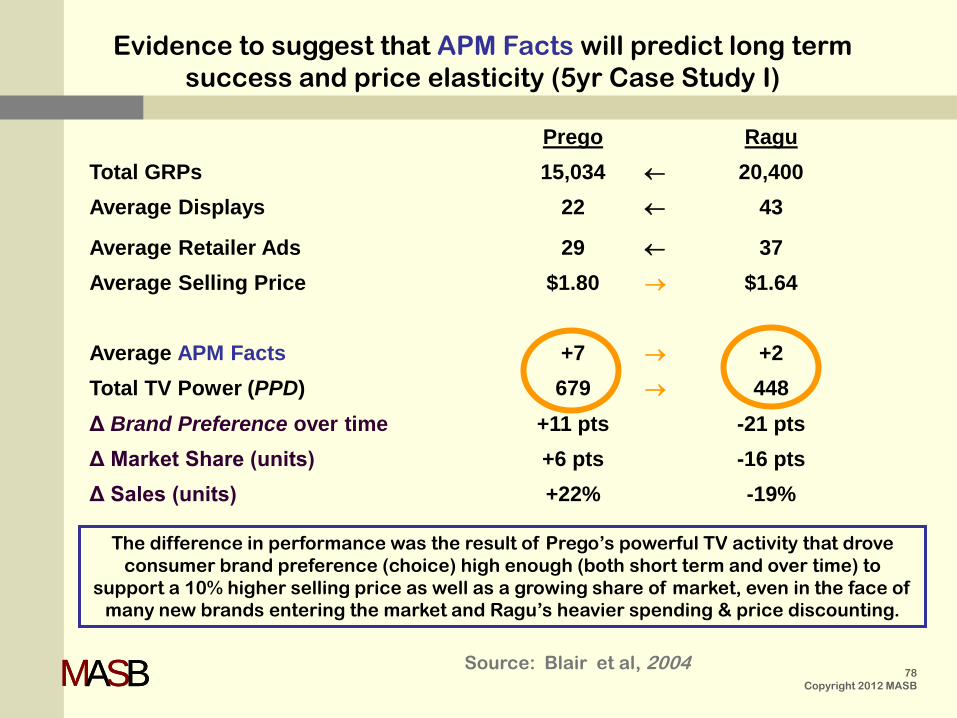
MASBMASB Source: Blair et al, 2004
Prego Ragu Total GRPs 15,034 ← 20,400 Average Displays 22 ← 43
Average Retailer Ads 29 ← 37 Average Selling Price $1.80 → $1.64
Average APM Facts +7 → +2 Total TV Power (PPD) 679 → 448 Δ Brand Preference over time +11 pts -21 pts Δ Market Share (units) +6 pts -16 pts Δ Sales (units) +22% -19%
Evidence to suggest that APM Facts will predict long term success and price elasticity (5yr Case Study I)
The difference in performance was the result of Prego’s powerful TV activity that drove consumer brand preference (choice) high enough (both short term and over time) to
support a 10% higher selling price as well as a growing share of market, even in the face of many new brands entering the market and Ragu’s heavier spending & price discounting.
78 Copyright 2012 MASB
MASBMASB
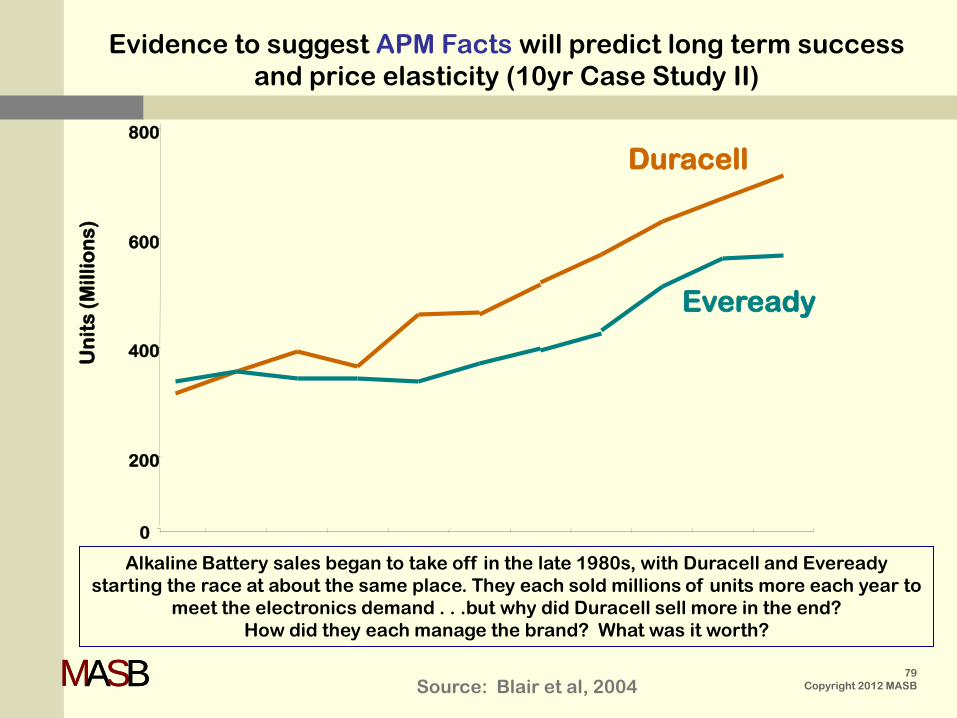
Alkaline Battery sales began to take off in the late 1980s, with Duracell and Eveready starting the race at about the same place. They each sold millions of units more each year to
meet the electronics demand . . .but why did Duracell sell more in the end? How did they each manage the brand? What was it worth?
Un
its
(Mill
ion
s)
0
200
400
600
800
Duracell
Eveready
Evidence to suggest APM Facts will predict long term success and price elasticity (10yr Case Study II)
Source: Blair et al, 2004 79
Copyright 2012 MASB
MASBMASB
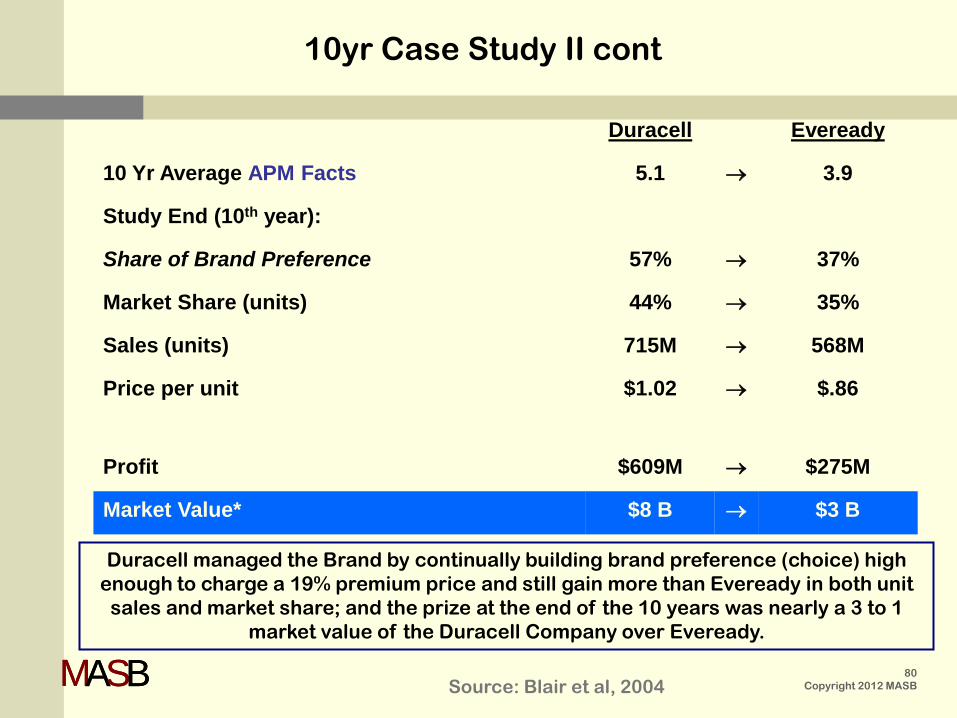
Duracell managed the Brand by continually building brand preference (choice) high enough to charge a 19% premium price and still gain more than Eveready in both unit
sales and market share; and the prize at the end of the 10 years was nearly a 3 to 1 market value of the Duracell Company over Eveready.
Duracell Eveready
10 Yr Average APM Facts 5.1 → 3.9
Study End (10th year):
Share of Brand Preference 57% → 37%
Market Share (units) 44% → 35%
Sales (units) 715M → 568M
Price per unit $1.02 → $.86
Profit $609M → $275M
Market Value* $8 B → $3 B
10yr Case Study II cont
Source: Blair et al, 2004 80
Copyright 2012 MASB
MASBMASB
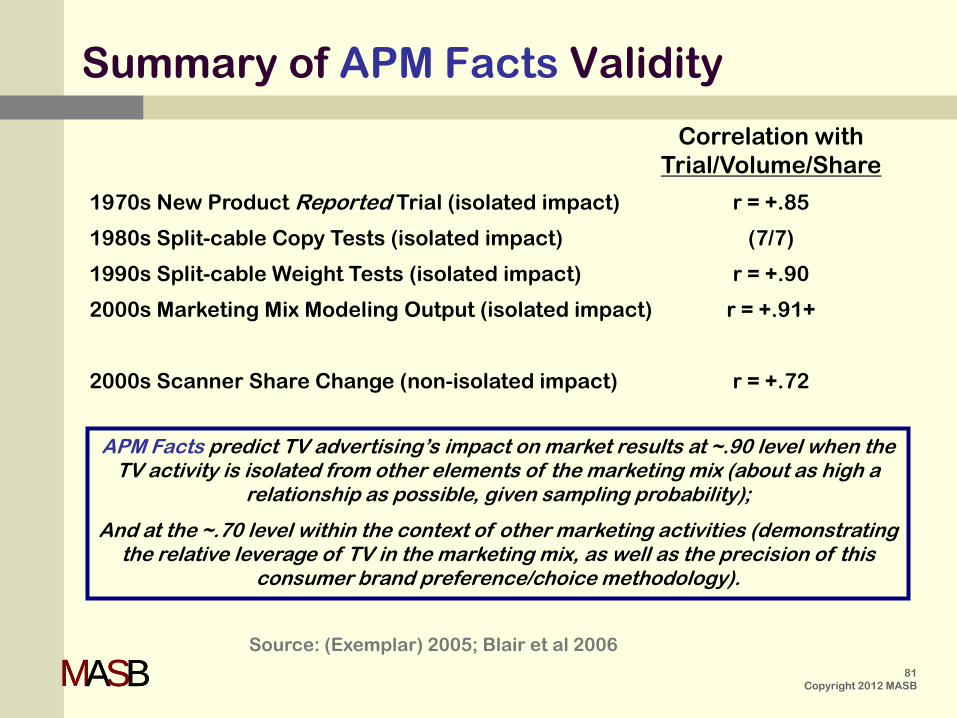
Correlation with Trial/Volume/Share
1970s New Product Reported Trial (isolated impact) r = +.85
1980s Split-cable Copy Tests (isolated impact) (7/7)
1990s Split-cable Weight Tests (isolated impact) r = +.90
2000s Marketing Mix Modeling Output (isolated impact) r = +.91+
2000s Scanner Share Change (non-isolated impact) r = +.72
APM Facts predict TV advertising’s impact on market results at ~.90 level when the TV activity is isolated from other elements of the marketing mix (about as high a
relationship as possible, given sampling probability);
And at the ~.70 level within the context of other marketing activities (demonstrating the relative leverage of TV in the marketing mix, as well as the precision of this
consumer brand preference/choice methodology).
Summary of APM Facts Validity
Source: (Exemplar) 2005; Blair et al 2006 81
Copyright 2012 MASB
MASBMASB
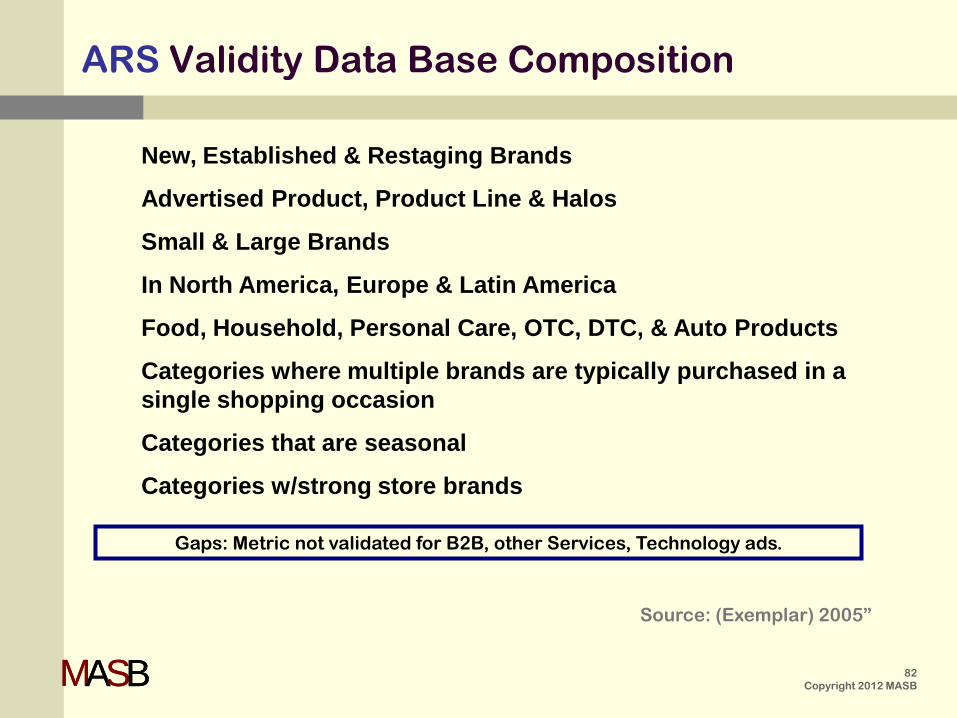
New, Established & Restaging Brands
Advertised Product, Product Line & Halos
Small & Large Brands
In North America, Europe & Latin America
Food, Household, Personal Care, OTC, DTC, & Auto Products
Categories where multiple brands are typically purchased in a single shopping occasion
Categories that are seasonal
Categories w/strong store brands
Gaps: Metric not validated for B2B, other Services, Technology ads.
ARS Validity Data Base Composition
Source: (Exemplar) 2005”
82 Copyright 2012 MASB
MASBMASB 83 Copyright 2012 MASB
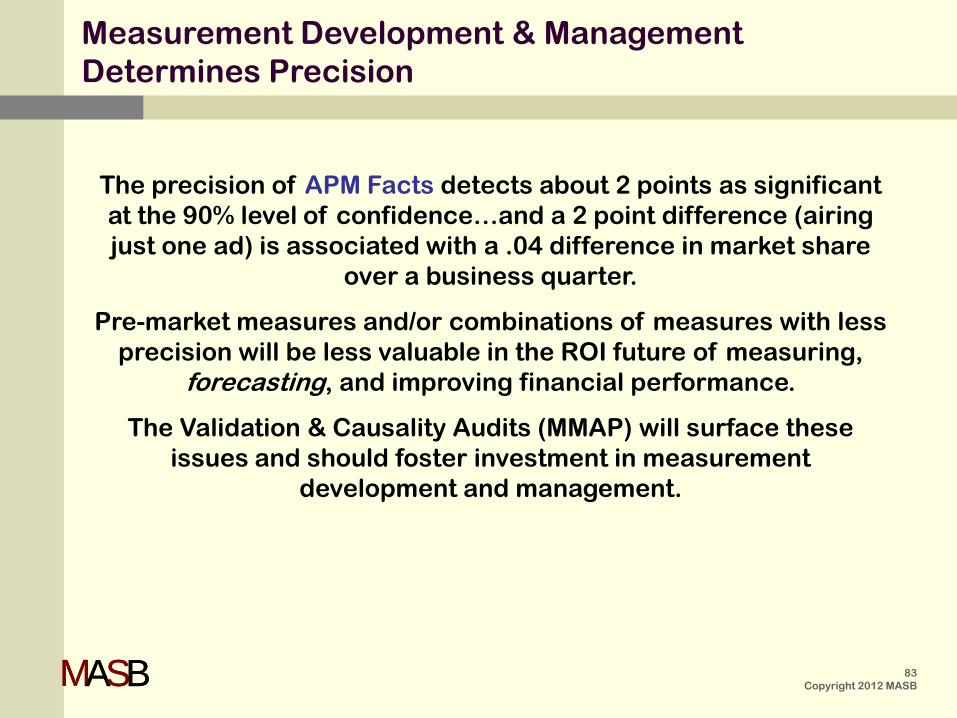
The precision of APM Facts detects about 2 points as significant at the 90% level of confidence…and a 2 point difference (airing just one ad) is associated with a .04 difference in market share
over a business quarter.
Pre-market measures and/or combinations of measures with less precision will be less valuable in the ROI future of measuring,
forecasting, and improving financial performance.
The Validation & Causality Audits (MMAP) will surface these issues and should foster investment in measurement
development and management.
Measurement Development & Management Determines Precision
MASBMASB 84 Copyright 2012 MASB
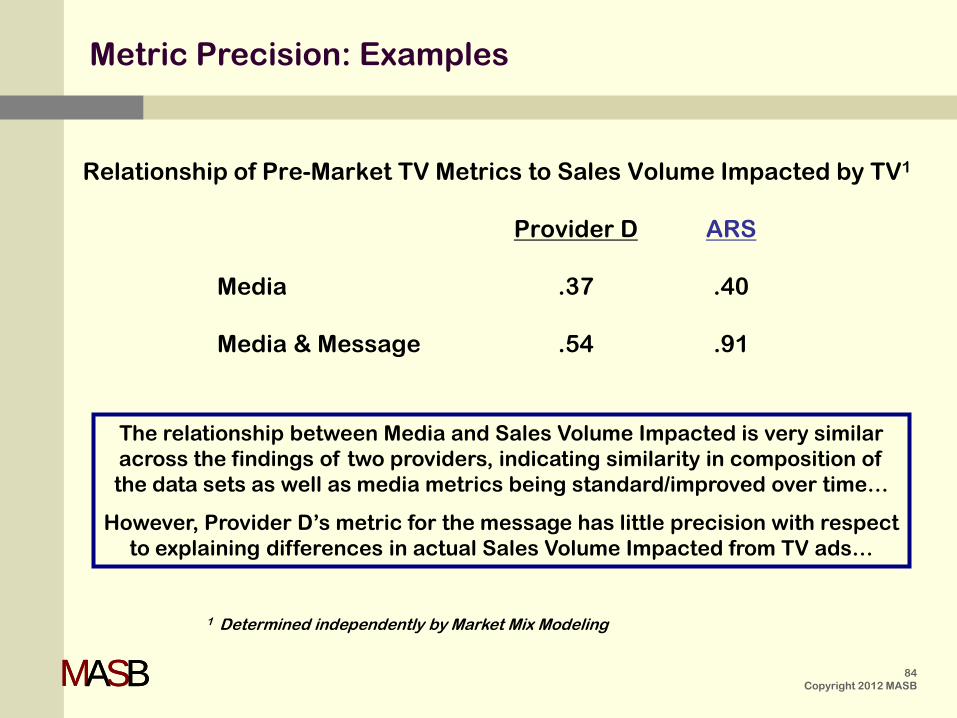
Relationship of Pre-Market TV Metrics to Sales Volume Impacted by TV1
Provider D ARS
Media .37 .40 Media & Message .54 .91
The relationship between Media and Sales Volume Impacted is very similar across the findings of two providers, indicating similarity in composition of the data sets as well as media metrics being standard/improved over time…
However, Provider D’s metric for the message has little precision with respect to explaining differences in actual Sales Volume Impacted from TV ads…
1 Determined independently by Market Mix Modeling
Metric Precision: Examples
MASBMASB
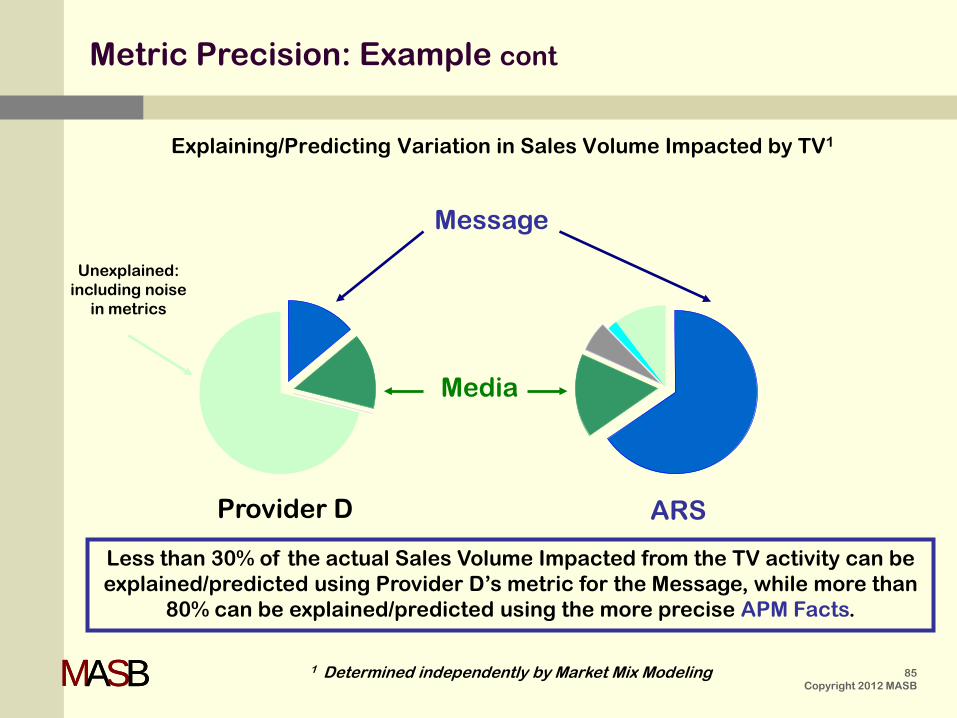
Explaining/Predicting Variation in Sales Volume Impacted by TV1
1 Determined independently by Market Mix Modeling
Provider D ARS
Media
Message
Unexplained: including noise
in metrics
Less than 30% of the actual Sales Volume Impacted from the TV activity can be explained/predicted using Provider D’s metric for the Message, while more than
80% can be explained/predicted using the more precise APM Facts.
Metric Precision: Example cont
85 Copyright 2012 MASB
MASBMASB 86 Copyright 2012 MASB
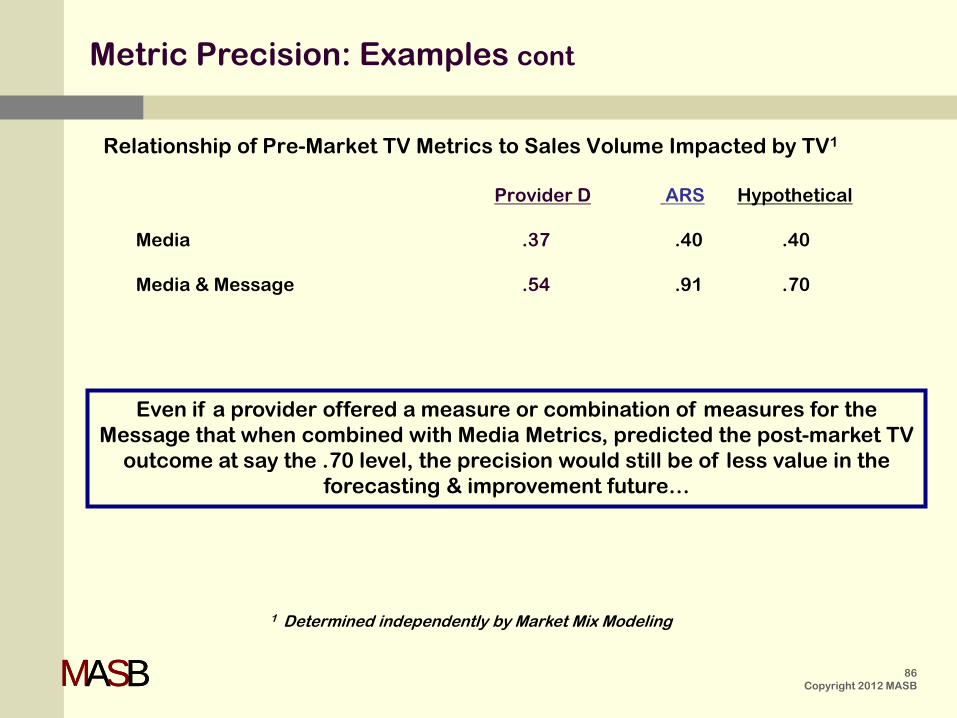
Relationship of Pre-Market TV Metrics to Sales Volume Impacted by TV1
Provider D ARS Hypothetical
Media .37 .40 .40 Media & Message .54 .91 .70
Even if a provider offered a measure or combination of measures for the Message that when combined with Media Metrics, predicted the post-market TV
outcome at say the .70 level, the precision would still be of less value in the forecasting & improvement future…
1 Determined independently by Market Mix Modeling
Metric Precision: Examples cont
MASBMASB
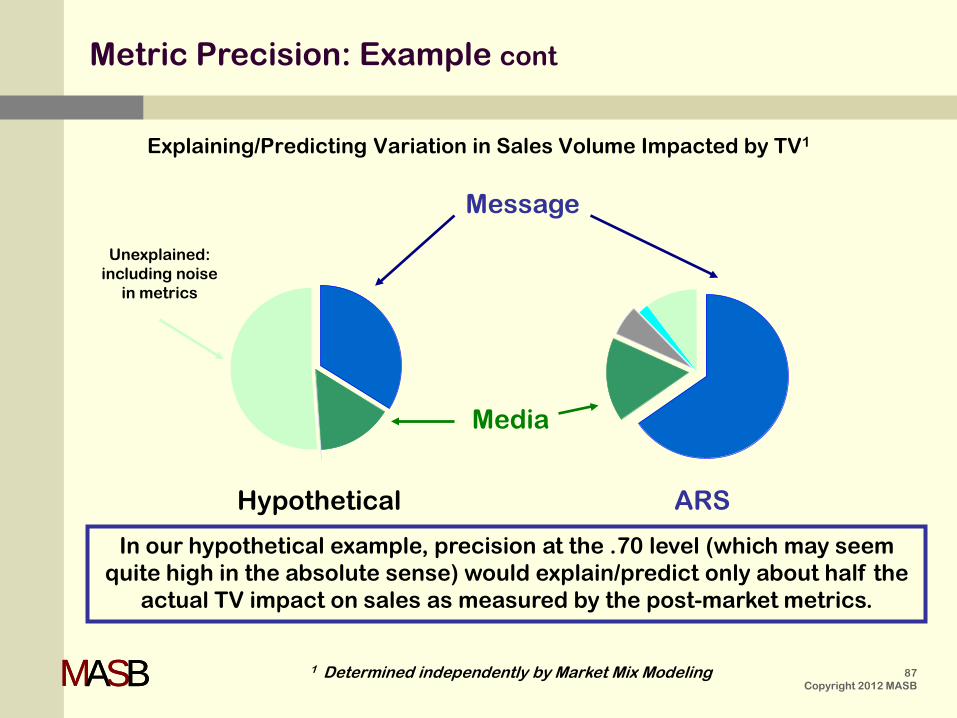
Explaining/Predicting Variation in Sales Volume Impacted by TV1
1 Determined independently by Market Mix Modeling
Hypothetical ARS
Media
Message
Unexplained:
including noise in metrics
In our hypothetical example, precision at the .70 level (which may seem quite high in the absolute sense) would explain/predict only about half the
actual TV impact on sales as measured by the post-market metrics.
Metric Precision: Example cont
87 Copyright 2012 MASB
MASBMASB 88 Copyright 2012 MASB
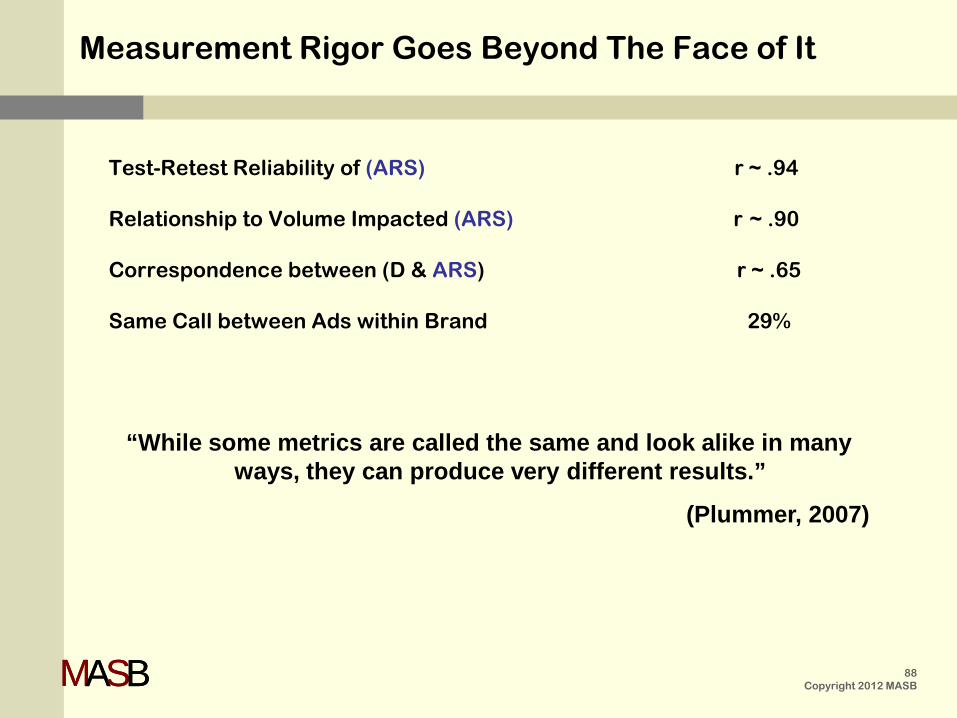
Measurement Rigor Goes Beyond The Face of It
Test-Retest Reliability of (ARS) r ~ .94 Relationship to Volume Impacted (ARS) r ~ .90 Correspondence between (D & ARS) r ~ .65 Same Call between Ads within Brand 29%
“While some metrics are called the same and look alike in many ways, they can produce very different results.”
(Plummer, 2007)
MASBMASB 89 Copyright 2012 MASB
Contents
Background (the issue) The TV Project
Metrics commonly used by Practitioners Body of Knowledge (metrics used) Marketing Metric Audit Protocol (MMAP) Measuring the Impact of TV Ads The Learning (how ads work) Application (process management) Disclosure
Appendix A: Background Information Appendix B: Basis for Conclusions Appendix C: The Drivers & Implications

MASBMASB
The several hundred conditions and elements explored over 3 decades explain 85 percent of the total variation in ARS outcomes. . .
Market
Structure 51%
Value Proposition 19%
Unexplained 15%
Content & Communication Drivers
8%
Sampling Error 7%
Total Explained
85%
What Has Been Learned About TV Ads (Factors Explaining Effectiveness of TV Ads)
Source: Blair 2005 90
Copyright 2012 MASB
MASBMASB 91 Copyright 2012 MASB
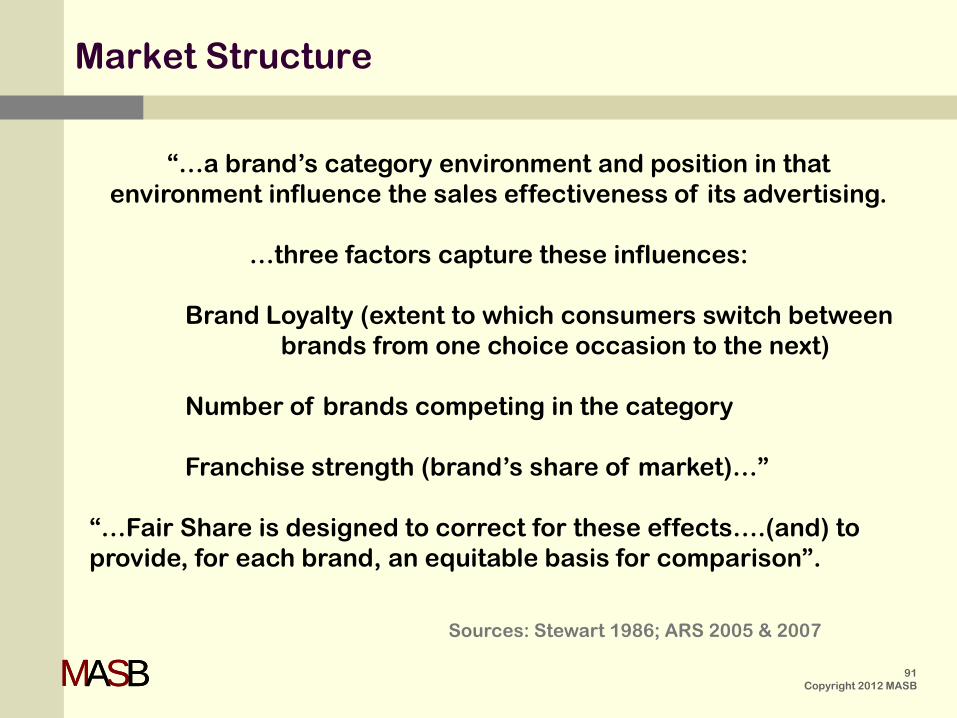
Market Structure
“…a brand’s category environment and position in that environment influence the sales effectiveness of its advertising.
…three factors capture these influences:
Brand Loyalty (extent to which consumers switch between brands from one choice occasion to the next) Number of brands competing in the category Franchise strength (brand’s share of market)…” “…Fair Share is designed to correct for these effects….(and) to provide, for each brand, an equitable basis for comparison”.
Sources: Stewart 1986; ARS 2005 & 2007
MASBMASB 92 Copyright 2012 MASB
Value Proposition
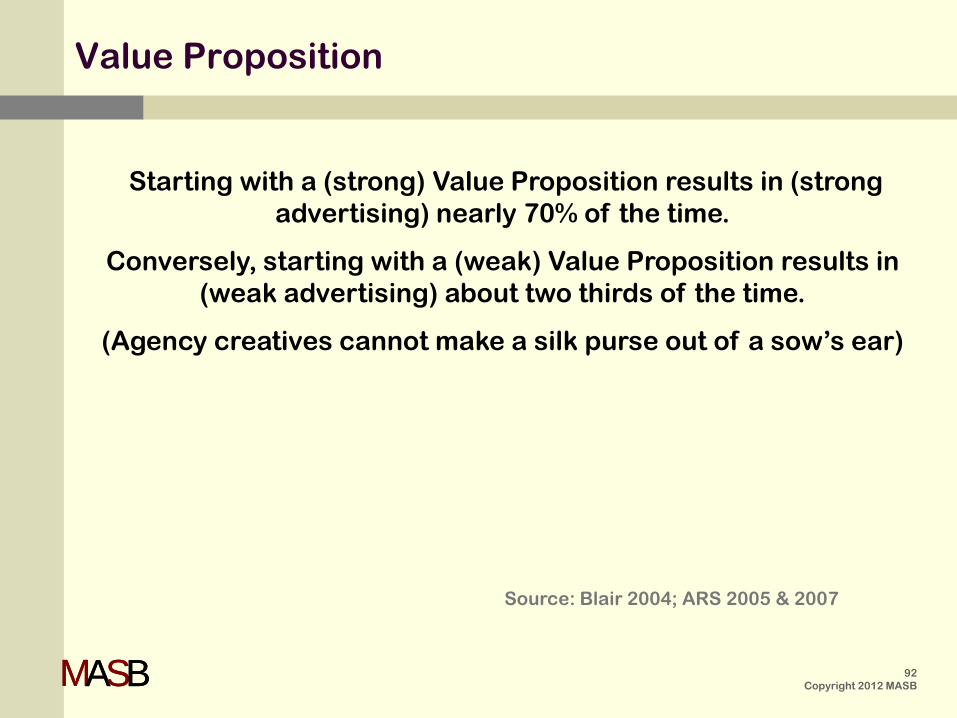
Starting with a (strong) Value Proposition results in (strong advertising) nearly 70% of the time.
Conversely, starting with a (weak) Value Proposition results in (weak advertising) about two thirds of the time.
(Agency creatives cannot make a silk purse out of a sow’s ear)
Source: Blair 2004; ARS 2005 & 2007
MASBMASB 93 Copyright 2012 MASB
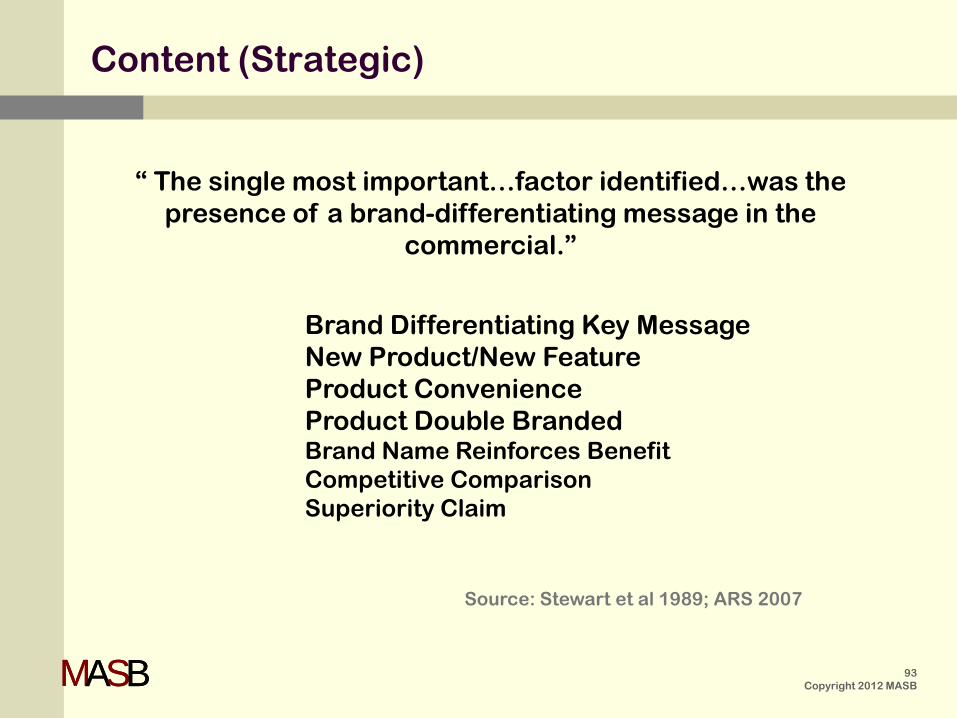
“ The single most important…factor identified…was the presence of a brand-differentiating message in the
commercial.”
Brand Differentiating Key Message New Product/New Feature Product Convenience Product Double Branded Brand Name Reinforces Benefit Competitive Comparison Superiority Claim
Content (Strategic)
Source: Stewart et al 1989; ARS 2007
MASBMASB 94 Copyright 2012 MASB
Content (Executional)
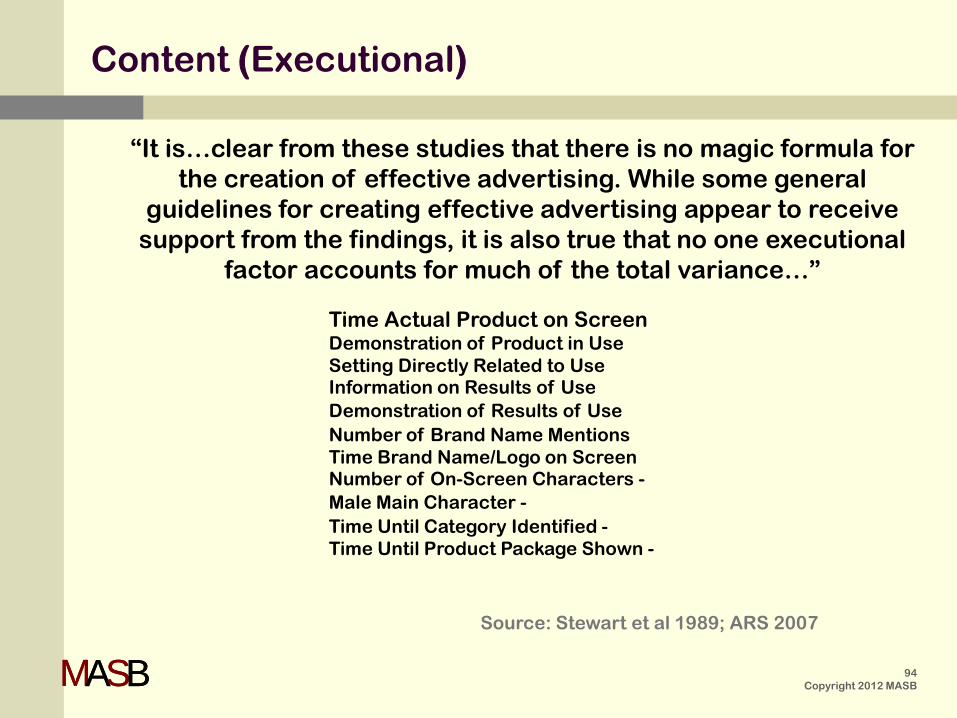
“It is…clear from these studies that there is no magic formula for the creation of effective advertising. While some general
guidelines for creating effective advertising appear to receive support from the findings, it is also true that no one executional
factor accounts for much of the total variance…”
Source: Stewart et al 1989; ARS 2007
Time Actual Product on Screen Demonstration of Product in Use Setting Directly Related to Use Information on Results of Use Demonstration of Results of Use Number of Brand Name Mentions Time Brand Name/Logo on Screen Number of On-Screen Characters - Male Main Character - Time Until Category Identified - Time Until Product Package Shown -
MASBMASB 95 Copyright 2012 MASB
Communication
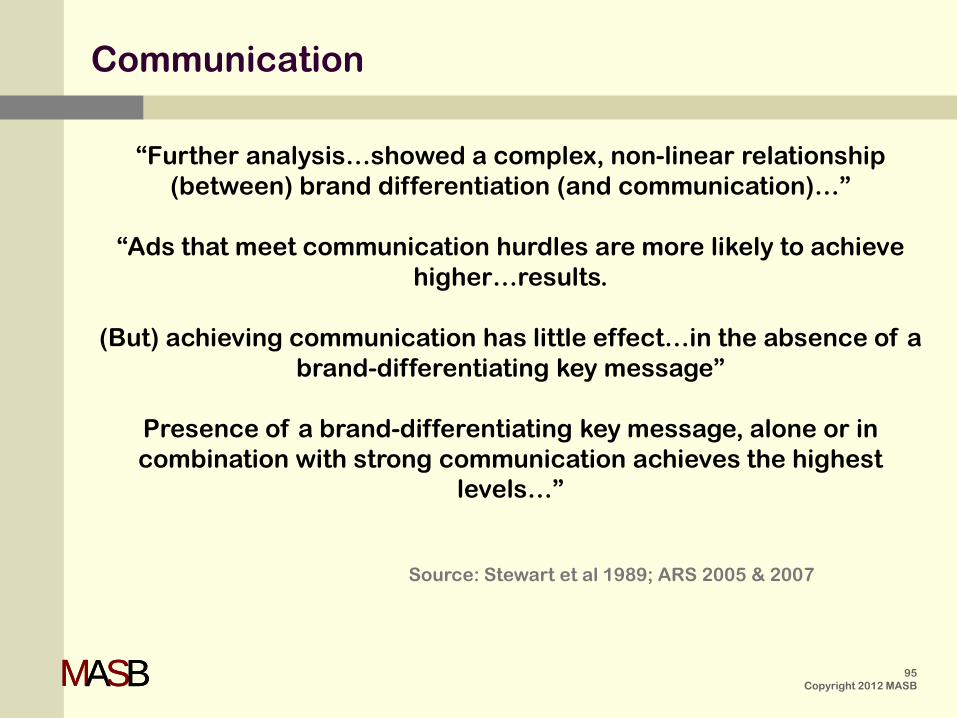
“Further analysis…showed a complex, non-linear relationship (between) brand differentiation (and communication)…”
“Ads that meet communication hurdles are more likely to achieve
higher…results.
(But) achieving communication has little effect…in the absence of a brand-differentiating key message”
Presence of a brand-differentiating key message, alone or in combination with strong communication achieves the highest
levels…”
Source: Stewart et al 1989; ARS 2005 & 2007

MASBMASB
What’s It Worth in a Business Quarter?
Validated Driver
ARS Persuasion Difference
Market Share Impact1
(Calibration of ARS Persuasion) (2.0 points) (0.4 points)
New Product/Feature (R&D)
3.3 points2 0.7 points
Brand-Differentiating Product Message (R&D)
2.0 points2 0.4 points
Strong Value Proposition (Brand)
2.4 points2 0.5 points
B-D Message Communicated (Agency)
4.0 points2 0.9 points
1 Times Quarterly Category Volume Times Incremental Margin = Return 2 On Average Across All Observations
This learning has major implications for Better Practices on the Advertising Development side of the ROI equation…
(for R&D, Brand, and Ad Agency).
Source: Blair 2005 96 Copyright 2012 MASB
MASBMASB 97 Copyright 2012 MASB
Theoretical Framework
“…we have classified and reviewed prior research of intermediate and behavioral effects of advertising using a
taxonomy of models…
Although such models have been actively employed for 100 years, we find them flawed…the concept of hierarchy (temporal
sequence) on which they are based cannot be empirically supported…
We also suggest that behavioral (brand choice, market share)…measures be compiled in…databases to enable
researchers…to test the interaction of content, intermediate effects, and long-and short-term behavior. In this effort, we also
must relieve measures from cognitive bias.”
Source: Vakratsas and Ambler 1999.

MASBMASB 98 Copyright 2012 MASB
Theoretical Framework cont
“…research efforts would be more insightful if the focus were on measures of…behavioral change, rather than exclusively on cognitive measures such
as recall (awareness) or attitude change.
The present study is among the very few to use (a behavioral brand choice measure) of demonstrated reliability and validity.
The single most important…factor related to the persuasiveness of the commercial is the presence of a brand-differentiating message.
Stewart and Haley (1983) have suggested that the primary function of marketing communication should be to suggest a basis for consumer choice.
Choice rules tell the prospective buyer how to choose a particular brand.
A brand-differentiating claim must introduce meaningful variation among alternatives, but it need not be directly related to product performance.
When products are perceived to be very similar, any basis for differentiation …may represent the basis for choice”.
Source: Stewart et al 1986.
MASBMASB 99 Copyright 2012 MASB
Theoretical Framework cont
The learning from over 3 decades of basic research activities employing the ARS Brand Preference (choice) metric has not fully supported any
single and/or simple theory of hierarchy of effects.
It has, however, provided important insight as to how to improve return by applying reliable and valid measurement in the context of better
practices (process management).
For instance, in most advertising processes, decisions about “what to say” are made long before investment in the creative execution
of “how to say it”.
Process implications of the “brand-differentiating” findings pointed clearly to applying the metric at this early stage of advertising
development in order to assess, predict and improve (if necessary), the strength of the underlying proposition (or strategy) before moving to
creative execution.
“As Deming pointed out, it’s the process that requires change…in order to improve performance and ROI.”
Source: Blair 2006C.

MASBMASB
The Branding Activities
The Consumer
The Market & Financial Results
Key to the ROI Branding Future is having integrated consumer measurement systems with a
ROI (valid) framework.
$$ Television
Print Net
Product et al.
Source: Blair 2006 100 Copyright 2012 MASB
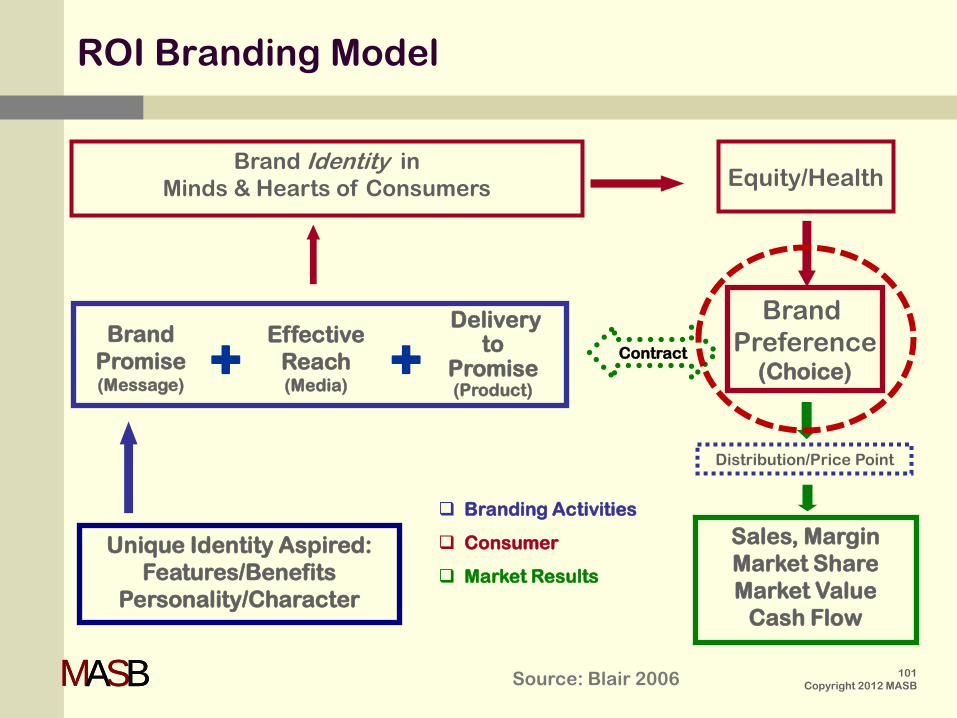
MASBMASB
Brand Promise (Message)
Unique Identity Aspired: Features/Benefits
Personality/Character
Delivery to
Promise (Product)
+ +
Sales, Margin Market Share Market Value
Cash Flow
Brand Preference
(Choice)
Equity/Health Brand Identity in
Minds & Hearts of Consumers
Contract Effective
Reach (Media)
Branding Activities
Consumer
Market Results
ROI Branding Model
Distribution/Price Point
Source: Blair 2006 101 Copyright 2012 MASB
MASBMASB
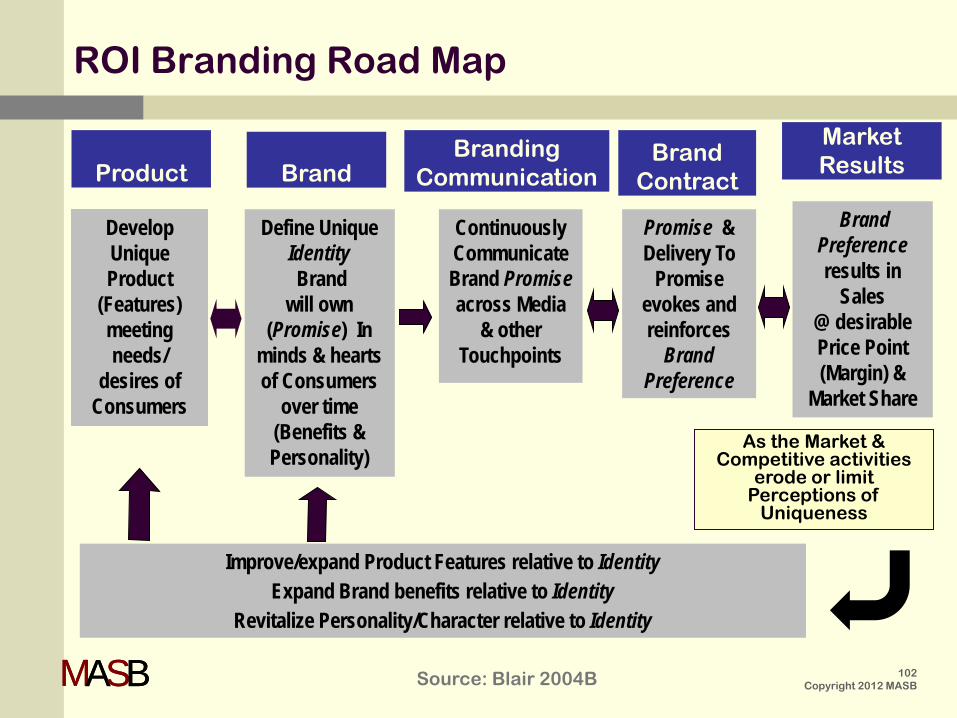
Product
Brand Branding
Communication Brand
Contract
Develop Unique Product
(Features) meeting needs/
desires of Consumers
Define Unique Identity Brand
will own (Promise) In
minds & hearts of Consumers
over time (Benefits & Personality)
Continuously Communicate Brand Promise across Media
& other Touchpoints
Market Results
Promise & Delivery To
Promise evokes and reinforces
Brand Preference
Brand Preference results in
Sales @ desirable Price Point (Margin) &
Market Share
Improve/expand Product Features relative to Identity Expand Brand benefits relative to Identity
Revitalize Personality/Character relative to Identity
As the Market & Competitive activities
erode or limit Perceptions of
Uniqueness
ROI Branding Road Map
Source: Blair 2004B 102 Copyright 2012 MASB