measuring regulatory performance - oecd.org - … 2011 25 1 p measuring regulatory performance a...
TRANSCRIPT

Measuring Regulatory PerformanceA PRACTITIONER’S GUIDE TO PERCEPTION SURVEYS
Please cite this publication as:
OECD (2012), Measuring Regulatory Performance: A Practitioner’s Guide to Perception Surveys, OECD Publishing.http://dx.doi.org/10.1787/9789264167179-en
This work is published on the OECD iLibrary, which gathers all OECD books, periodicals and statistical databases. Visit www.oecd-ilibrary.org, and do not hesitate to contact us for more information.
-:HSTCQE=V[\VY]:ISBN 978-92-64-16714-842 2011 25 1 P
Measuring Regulatory PerformanceA PRACTITIONER’S GUIDE TO PERCEPTION SURVEYS
This guide helps offi cials use perception surveys to evaluate and communicate the results of reform processes. While the guide draws on examples from the regulatory fi eld, it is also useful for other policy areas. In non-technical language, the guide clearly explains the challenges involved in the design and use of business and citizen perception surveys – and ways to overcome them. It also helps offi cials get the most out of survey results, whether conducted internally or by external experts.
Contents
Chapter 1. How OECD countries use perception surveys in the regulatory policy cycle
Chapter 2. Understanding pitfalls in the design of surveys
Chapter 3. Good practices in survey design step-by-step
Chapter 4. Understanding the drivers of perception to improve the use of survey results
Chapter 5. Policy lessons for the use of perception surveys for evaluation, diagnosis and communication
Related reading
Indicators of Regulatory Management Systems, 2009 Report (2009)
Regulatory Management Indicators Country Notes: Brazil, Chile, Estonia, Israel, Russia, Slovenia, South Africa (2011)
Measu
ring R
egu
latory P
erform
ance A P
RA
CT
ITIO
NE
R’S
GU
IDE
TO
PE
RC
EP
TIO
N S
UR
VE
YS
422011251Cov.indd 1 10-Jan-2012 1:58:16 PM


Measuring Regulatory Performance
A PRACTITIONER'S GUIDETO PERCEPTION SURVEYS

This work is published on the responsibility of the Secretary-General of the OECD.The opinions expressed and arguments employed herein do not necessarily reflectthe official views of the Organisation or of the governments of its member countries.
This document and any map included herein are without prejudice to the status ofor sovereignty over any territory, to the delimitation of international frontiers andboundaries and to the name of any territory, city or area.
ISBN 978-92-64-16714-8 (print)ISBN 978-92-64-16717-9 (PDF)
The statistical data for Israel are supplied by and under the responsibility of the relevantIsraeli authorities. The use of such data by the OECD is without prejudice to the status of theGolan Heights, East Jerusalem and Israeli settlements in the West Bank under the terms ofinternational law.
Photo credits: Cover © Shutterstock/Anita Milivojevic.
Corrigenda to OECD publications may be found on line at: www.oecd.org/publishing/corrigenda.
© OECD 2012
You can copy, download or print OECD content for your own use, and you can include excerpts from OECDpublications, databases and multimedia products in your own documents, presentations, blogs, websites andteaching materials, provided that suitable acknowledgement of OECD as source and copyright owner is given.All requests for public or commercial use and translation rights should be submitted to [email protected] for permission to photocopy portions of this material for public or commercial use shall be addresseddirectly to the Copyright Clearance Center (CCC) at [email protected] or the Centre français d’exploitation dudroit de copie (CFC) at [email protected].
Please cite this publication as:OECD (2012), Measuring Regulatory Performance: A Practitioner's Guide to Perception Surveys,OECD Publishing.http://dx.doi.org/10.1787/9789264167179-en

FOREWORD – 3
MEASURING REGULATORY PERFORMANCE © OECD 2012
Foreword
This guide helps officials use perception surveys to evaluate and communicate the results of reform processes. While the guide draws on examples from the regulatory field, it is also useful for other policy areas. In non-technical language, the guide clearly explains the challenges involved in the design and use of business and citizen perception surveys – and ways to overcome them. It also helps officials get the most out of survey results, whether conducted internally or by external experts.
This guide is based on OECD research and discussions on perception surveys that were conducted in a two-day workshop in Istanbul, Turkey. The workshop was hosted by the Office of the Prime Minister of the Turkish Government, on 21-22 June 2010. Forty delegates to the Regulatory Policy Committee and experts from 15 countries met to share experiences on the topic of “Measuring progress in regulatory reform through the use of perception surveys.” The meeting was chaired by Mr. Jeroen Nijland, Director, Regulatory Reform Group, Ministry of Economic Affairs, Agriculture and Innovation, the Netherlands. Discussions were conducted under Chatham House Rules. Citations are therefore limited to published material. Publicly available background reports and presentations at the workshop are available on the website: www.oecd.org/regreform/perceptions. This guide also draws on factual information relating to perception surveys in OECD countries that was provided by delegates to the OECD Regulatory Policy Committee in 2010. Overview tables on the use of regulatory perception surveys in OECD countries are available in the Annex.
The workshop and subsequent research are part of the programme on Measuring Regulatory Performance. It aims to assist OECD countries in the design and use of indicators for communicating progress, for diagnosing successes and failures, and for improving regulatory policies, programmes and tools. Further information on the programme can be obtained from www.oecd.org/regreform/measuringperformance.

4 – FOREWORD
MEASURING REGULATORY PERFORMANCE © OECD 2012
The OECD Secretariat thanks the members of the informal advisory group for their invaluable advice on the project on perception surveys: Rachel Atkinson, Paul Bland, Rogier Boer, Dominique de Vos, Brian Huijts, Wim Jansen, Esben Larsen, Daphne Lureman-van der Zwet, Hazel Russo and Rebecca Ward. This project was financed by voluntary contributions from Belgium, Denmark, the Netherlands and the United Kingdom which are gratefully acknowledged by the OECD. The OECD Secretariat is very thankful to the Turkish government for hosting the workshop. Finally, the Secretariat would like to thank all countries which provided information for the overview tables on perception surveys in OECD countries.
The guide was prepared by Christiane Arndt, Gregory Bounds, Trent Kim, Engin Kucet, and Helge Schröder, Regulatory Policy Division, OECD Public Governance and Territorial Development Directorate. Miriam Allam, Philipp Beiter, Stéphane Jacobzone, Zsuzsanna Lonti, Maria Varinia Michalun and Daniel Trnka provided valuable comments. Jennifer Stein was responsible for the text layout and the editing.
The OECD Regulatory Policy Committee
The mandate of the Regulatory Policy Committee is to assist members and non-members in building and strengthening capacity for regulatory quality and regulatory reform. The Regulatory Policy Committee is supported by staff within the Regulatory Policy Division of the Public Governance and Territorial Development Directorate. For more information please visit www.oecd.org/regreform.
The OECD Public Governance and Territorial Development Directorate’s unique emphasis on institutional design and policy implementation supports mutual learning and diffusion of best practice in different societal and market conditions. The goal is to help countries build better government systems and implement policies at both national and regional level that lead to sustainable economic and social development.
We would welcome your feedback on this guide. Please visit www.oecd.org/regreform/measuringperformance to fill out a short online questionnaire.

TABLE OF CONTENTS – 5
MEASURING REGULATORY PERFORMANCE © OECD 2012
Table of Contents
Policy Conclusions ................................................................................................... 7
Introduction ..................................................................................................... 11
Chapter 1. How OECD Countries Use Perception Surveys in the Regulatory Policy Cycle ........................................................... 15
Characteristics of questionnaires ......................................................................... 18Conclusion ..................................................................................................... 22
Chapter 2. Understanding Pitfalls in the Design of Surveys .............................. 23
Pitfalls in survey design ....................................................................................... 24Conclusion ..................................................................................................... 30
Chapter 3. Good Practices in Survey Design Step-by-Step ................................ 31
Six steps to better survey design .......................................................................... 32Conclusion ..................................................................................................... 43
Chapter 4. Understanding the Drivers of Perception to Improve the Use of Survey Results .................................................................... 45
The fundamental drivers of perceptions .............................................................. 46How to identify the drivers of perception ............................................................ 51Conclusion ..................................................................................................... 55
Chapter 5. Policy Lessons for the Use of Perception Surveys for Evaluation, Diagnosis and Communication ................................ 57
Using perception surveys in regulatory policy evaluation and design ................. 58Using perception surveys for communication with stakeholders ........................ 60Conclusion ..................................................................................................... 65
Bibliography ..................................................................................................... 67
Glossary ..................................................................................................... 73
Annex: Overview Table on Perception Surveys .................................................. 75

6 – TABLE OF CONTENTS
MEASURING REGULATORY PERFORMANCE © OECD 2012
Tables
Table 3.1. Advantages and disadvantages of data collection methods .............. 39Table 5.1. Results of the regulation barometer and the SCM measurement in Sweden ............................................. 59Table A.1. Overview of perception surveys in OECD countries ....................... 76
Figures
Figure 0.1. Regulatory reform policy cycle ........................................................ 11Figure 4.1. Profiling and segmentation of user groups
and types in the Belgian Kafka Model ............................................. 54
Boxes
Box 1.1. The Regulation Barometer: Evaluating the Better Regulation Programme in Sweden ...................................................... 16Box 1.2. The benefits of regulation: Perception of smoke-free environments ............................................. 17Box 2.1. Question priming and citizen satisfaction ........................................... 25Box 2.2. Conceptual differences across nations ................................................ 27Box 3.1. Checklist for drafting good questions ................................................. 35Box 3.2. Literature hints for designing an effective survey .............................. 42Box 4.1. Drivers of (negative) perceptions: Insights from the Danish Burden-Hunter Project ............................... 52Box 4.2. Literature hints for qualitative research methods: Focus groups, interviews and case studies .......................................... 53Box 5.1. Lessons for communicating regulatory reform from Denmark, the Netherlands and the United Kingdom ........................................... 62Box 5.2. A two-way communication strategy: Involving businesses ................ 63

POLICY CONCLUSIONS – 7
MEASURING REGULATORY PERFORMANCE © OECD 2012
Policy Conclusions
Perception surveys are an increasingly integral component of a business- and citizen-centred approach to regulatory reform, as a means to assist governments with better results in an open, democratic system. This guide helps officials planning perception surveys or engaging external expertise to use perception surveys for evaluating and communicating progress in regulatory reform. It explains the challenges involved in the design and use of business and citizen perception surveys – and ways to overcome them. It will also help officials responsible for writing and evaluating tenders for surveys judge the quality of consultants’ work and get the most out of survey results. The guide is written in non-technical language for a broad audience, drawing on examples from the regulatory field.
The following ten key policy messages are presented in this guide:
1. Understanding and improving the perception of the regulatory environment matters to performance. Positive perceptions of regulations can influence investment decisions and promote respect for and compliance with regulations. (Introduction)
2. Perception surveys are increasingly used in OECD countriesto evaluate the performance of regulatory reform programmes, in particular in the area of reducing administrative burdens. Perception surveys are further used to obtain information on the level of awareness and confidence in regulatory reform programmes among businesses and citizens, and as a diagnostic tool to identify areas of concern to business and citizens in order to inform future regulatory reforms. (Chapter 1)

8 – POLICY CONCLUSIONS
MEASURING REGULATORY PERFORMANCE © OECD 2012
3. If pitfalls in survey design are ignored, survey results become unusable for policy makers. There are a surprising number of pitfalls in designing surveys. For example, even the order and phrasing of questions can affect responses and the quality of survey results. (Chapter 2)
4. Using good practice methodologies will improve the quality of results considerably and help to avoid pitfalls. For example, it is advisable to run pilot surveys to identify questions that respondents have difficulty understanding and then adjust questions accordingly. (Chapter 3)
5. Perceptions and hence survey results are shaped by many factors; the actual quality of regulations is only one of them.For example, perceptions of the quality of regulations can be influenced by trust in government, the current economic situation, experience with front-line service, prior expectations and the content of government (and general media) communication. (Chapter 4)
6. It is necessary to look beneath survey results. The same survey results may be driven by very different underlying factors. In-depth questions and selected qualitative research techniques can prove very valuable in bringing to light the reasons for the results and drawing concrete policy conclusions from survey results. (Chapter 4 and 5)
7. Irritation from experiences with regulation and frontline service can account for a significant degree of business and citizens’ dissatisfaction with regulation. This experience is often more negative than might be suggested by the measurable costs of administrative burdens. (Chapter 4 and 5)
8. Perception surveys also have their limitations. Experience suggests the likelihood of a disparity between the perceived quality of regulations as reported by business and citizens and the measurable results of regulations. For example, in many countries surveys have tended to reveal negative perceptions of the quality of regulations while more fact-based measurements have shown an improvement. This appears to apply particularly to programmes targeted at reducing administrative burdens. (Chapter 5)

POLICY CONCLUSIONS – 9
MEASURING REGULATORY PERFORMANCE © OECD 2012
9. A comprehensive evaluation system should include different types of indicators, each revealing different information for policy evaluation. Discrepancies in results can highlight the need for deeper analysis to evaluate and inform policies. (Chapter 5)
10. Perception surveys are an integral part of a two-way communication strategy with stakeholders. They can serve as a means to communicate stakeholder views to the government, and discussion of the results can lead to fruitful exchanges between government and stakeholders in the case of regulatory reform. Survey results can also help to evaluate the success of the government’s communication strategy by assessing stakeholders’ level of awareness of recent initiatives. (Chapter 5)


INTRODUCTION – 11
MEASURING REGULATORY PERFORMANCE © OECD 2012
“Men are disturbed not by things, but by the view which they take of them.”
– Epictetus, Enchiridion, 5
Introduction
Evaluation and communication in the regulatory reform cycle
As OECD countries continuously strive to improve the quality of their regulations, significant resources have been invested in regulatory policies and reform. In line with the rise in resources allocated, there is increasing pressure for greater accountability and the use of performance information to demonstrate the effectiveness of regulatory programmes.
OECD principles promote the evaluation of the effectiveness of regulatory reform programmes. Figure 0.1 represents the idealised regulatory reform policy cycle showing the links between programme design, programme implementation, communication and evaluation. In this diagram, the aims of reforms are communicated to stakeholders. The quality and results of regulatory programmes are then evaluated and the results of the evaluation should feed back into the subsequent design and implementation of regulatory programmes and communication strategies.
Figure 0.1. Regulatory reform policy cycle
Design of regulatory
programmes
Perception surveys Evaluation Communication
Programmeimplementation

12 – INTRODUCTION
MEASURING REGULATORY PERFORMANCE © OECD 2012
The role of perception surveys in evaluation and communication
Governments want to know how those most affected by regulations – businesses and citizens – perceive the regulatory environment and whether they see the benefits of regulatory reforms. Positive perceptions and stakeholder support are crucial for the success of regulatory reform initiatives, in great part because perceptions of the quality of regulation can influence the investment decisions of firms, and their compliance with regulatory requirements. For example, a household survey of entrepreneurship in the United Kingdom found that individuals’ perceptions of business regulations influenced business start-up decisions (Kitching, 2006). Moreover, the Bloomberg-Schumer Report of 2007, which compared perceptions of regulation in the United States and the United Kingdom, reported that financial firms made investment decisions between the United States and the United Kingdom based, in part, on perceptions of three factors associated with regulatory quality: regulatory structure, regulatory approach, and regulatory enforcement (McKinsey & Company, 2007).
Perception surveys can serve three major purposes:
• to evaluate the success of a regulatory reform programme from a user’s perspective;
• as a diagnostic and communication tool to identify areas of concern to citizens and businesses, and thus inform future regulatory reforms; and
• to obtain information on citizens’ and businesses’ level of awareness, confidence, interest, and recognition of regulatory obligations, regulatory reform programmes and regulatory bodies. In some countries, this information serves to evaluate and inform communication strategies.
Structure of the guide
Countries face a number of important interrelated challenges in the design, interpretation and use of perception survey findings. This guide’s five chapters explain these challenges and ways to address them. All chapters are written for a broad audience in non-technical language, drawing on examples from the regulatory field.

INTRODUCTION – 13
MEASURING REGULATORY PERFORMANCE © OECD 2012
Chapter 1 provides an overview on the ways OECD countries use regulatory perception surveys. Chapter 2 discusses the pitfalls in designing surveys and Chapter 3 provides step-by-step guidance for designing sound methodological surveys. Chapter 4 analyses the drivers of perceptions that may explain the “perception gap” that arises between the perceived and actual quality of regulations. It also provides guidance on tools to bridge the gap. The last chapter discusses the strategies used by OECD countries to get the most benefit from stakeholder surveys for evaluative and diagnostic purposes and for the communication of reform.


1. HOW OECD COUNTRIES USE PERCEPTION SURVEYS IN THE REGULATORY POLICY CYCLE – 15
MEASURING REGULATORY PERFORMANCE © OECD 2012
Chapter 1How OECD Countries Use Perception Surveys
in the Regulatory Policy Cycle
Perception surveys are a powerful tool that can be used for a variety of purposes. This chapter provides an overview of the ways OECD countries use perception surveys in the regulatory policy cycle. This chapter also presents how perception surveys used by OECD countries differ in terms of survey design and how they are conducted.

16 – 1. HOW OECD COUNTRIES USE PERCEPTION SURVEYS IN THE REGULATORY POLICY CYCLE
MEASURING REGULATORY PERFORMANCE © OECD 2012
OECD countries commonly use perception surveys to measure the performance of regulatory reform programmes, in particular in the area of administrative burden reduction. Two main categories of surveys can be identified:1
• Surveys on regulatory reform programmes: Such surveys focus on the evaluation of particular regulatory reform programmes. For example, the Regulation Barometer in Sweden, conducted by the Board of Swedish Industry and Commerce for Better Regulation, evaluates the government’s administrative burden reduction programme (see Box 1.1). Another example is the Belgian tax-on-web survey which looks at how satisfied users are with the possibility to complete their tax declarations online as part of the simplification programme.
Box 1.1. The Regulation Barometer: Evaluating the Better Regulation Programme in Sweden
The “Regulation Barometer”, conducted by the Board of Swedish Industry and Commerce for Better Regulation in May 2009, asked 600 proportionately selected entrepreneurs and business leaders over the telephone to comment on the government’s Better Regulation Programme, to specify the impact of regulation on their company and to indicate their expectations for the near future.
In order to improve the accuracy and homogeneity of the responses, a definition of relevant terms preceded the actual questions, where appropriate. For example, one question asked: “By regulations we intend all laws and rules that you as an entrepreneur and your company have to comply with. Do you think it is important for the Government to simplify regulations that affect business?”
The results of the survey indicated that most of the businesses were aware of the government’s reform, indicating that the communication strategy was successful. However, 75% of respondents thought that the burden of regulation had remained almost the same over the last 12 months and still 58% said that administrative burdens would be more or less the same in the following year – despite the government’s plans.
According to the Board of Swedish Industry and Commerce, the survey fulfilled two purposes. It was designed to present businesses’ perception of regulation and also to put pressure on the government to start evaluating the results of its Better Regulation Programme.
Source: www.nnr.se/assets/files/publikationer/NNR_Regulation_Indicator_2009.pdf. See also Table A.1 in the Annex and Table A.2 (available online at www.oecd.org/regreform/measuringperformance).

1. HOW OECD COUNTRIES USE PERCEPTION SURVEYS IN THE REGULATORY POLICY CYCLE – 17
MEASURING REGULATORY PERFORMANCE © OECD 2012
Box 1.2. The benefits of regulation: Perception of smoke-free environments
The UK Better Regulation Executive commissioned a survey which looked at citizens’ perception of regulation in general and in specific areas of direct concern to citizens: Health and safety at work, Environmental standards, Food hygiene regulations and Smoke free environments.
The study, conducted by FreshMinds, consisted of more than 1 000 personal interviews with private individuals carried out proportionately across the country. For each of the specific areas, respondents were asked to answer to five statements, using a 5-point scale from “strongly agree” to “strongly disagree”.
In the case of Smoke free environments (see figure below), “broad support for regulation tended to exist”. Interestingly, support for smoking regulation differed considerably across regions (65% in the North-West compared to 89% in the North-East), age groups (individuals aged 55+ more in favour than younger age groups) and social grades (affluent members of society more in favour than semi or unskilled workers or people on benefits).
The survey’s results will “inform future work, in areas such as Impact Assessments”.
Response to all tested statements on smoke-free environments
7872
82
33
79
0102030405060708090
100%
Proportionagreeing that
‘’regulation is a suitable way to
address this problem’’
Proportionagreeing that ‘’me and my family have personnally
benefitted from this regulation’’
Proportionagreeing that ‘’this
regulation has important benefits for wider society’’
Proportionagreeing that ‘’overall I think
the benefits outweigh the
burdens for this regulation’’
Proportionagreeing that
‘’this regulation puts a
substantialburden on society’’
Source: See both the main report and the research report at www.bis.gov.uk/policies/better-regulation/benefits/better-benefits; see also Overview Table A.1 in the Annex and Table A.2 at www.oecd.org/regreform/measuringperformance.

18 – 1. HOW OECD COUNTRIES USE PERCEPTION SURVEYS IN THE REGULATORY POLICY CYCLE
MEASURING REGULATORY PERFORMANCE © OECD 2012
• Surveys on individual regulations and agencies: In contrast to surveys on regulatory reform programmes, little information has been found on surveys which look at the performance of individual regulations and agencies. For example, the UK survey “The Benefits of Regulation: A public and business perception survey” included questions about individual regulations such as the smoking ban, maternity and paternity leave regulation, food hygiene, alcohol licensing and discrimination regulation (see Box 1.2 above). The results of the survey will inform the assessment of future regulatory initiatives.
Characteristics of questionnaires
Within these two categories – surveys on regulatory reform programmes and surveys on individual regulations and agencies – questionnaires are designed to fulfill one or more of the following three functions:
• Evaluation: Questions can be designed to evaluate specific regulations, or the success of regulatory reform programmes. For example, the Regulation Barometer conducted in Sweden asked whether respondents thought that it had become easier or more burdensome for them and their company to comply with government regulation over the previous 12 months;
• Information on awareness level: Some surveys contain questions about business and citizens’ level of awareness of regulations, regulatory reform programmes and regulatory bodies. For example, the Canadian Survey of Regulatory Compliance Cost asked small and medium-sized businesses: “Are you aware that over the last three years, the federal, provincial, and municipal governments have been implementing initiatives to reduce the cost of regulatory compliance for small businesses?”;
• Diagnosis to inform future reform: Perceptions surveys can also be designed for use as a diagnostic tool in order to identify areas of concern to the general public or to stakeholders, thus facilitating future regulatory reforms. The Irish Business Regulation Survey, for instance, included the following

1. HOW OECD COUNTRIES USE PERCEPTION SURVEYS IN THE REGULATORY POLICY CYCLE – 19
MEASURING REGULATORY PERFORMANCE © OECD 2012
question: “Which area of regulation do you think that the Government should tackle as a priority? Please think specifically of the regulations affecting each of these areas rather than other issues such as investment in the areas.”
In addition to those categories and functions, surveys differ with respect to a number of other characteristics.
• Target population:
− Most surveys, for which the OECD has information, targeted businesses. Surveys differed with regard to the size of businesses sampled. The Finnish SME Barometer, for example, focused exclusively on small-medium enterprises while the Dutch Macro Business Sentiment Monitor sampled businesses of varying size, sector, and life cycle.
− Some surveys were directed towards the general public regardless of the respondents’ involvement or knowledge of the subject in question. Others targeted explicitly citizens or businesses directly concerned by specific regulations or administrative burdens, or users of particular services. For example, the Belgian ‘Tax-on-web satisfaction survey’ and the Turkish ‘Customer Satisfaction Survey’ aimed to measure the performance of on-line services which were designed to simplify administrative procedures, and therefore only addressed users having already had experience with those services.
• Number of respondents: The number of respondents in the surveys ranged from 15 to more than 10 000. For example, surveys of business leaders usually had a small sample size: The survey “Regulation Barometer”, a survey of entrepreneurs and business leaders in Sweden, sampled 600 respondents. In contrast, the Canadian Federation of Independent Business (CFIB) Survey interviewed 10 566 small- and medium-sized business owners.
• Repetition of surveys: Some surveys were conducted only once, while others are repeated, most of them annually or biannually. The Survey on Administrative Burdens in Belgium, for example, has been conducted on a biennial basis since 2000.

20 – 1. HOW OECD COUNTRIES USE PERCEPTION SURVEYS IN THE REGULATORY POLICY CYCLE
MEASURING REGULATORY PERFORMANCE © OECD 2012
• Type of questions: Some questions are very specific, while others are more general. The Belgian Citizen Satisfaction Survey, for example, asked very specifically: “How do food chain operators feel about controls and the services provided by the Federal Agency for Food Chain Security?” An example for a more general question can be found in the Korean Regulatory Reform Satisfaction Survey which asked respondents: “How satisfied are you with the regulatory reform process in general?” Furthermore, some questions ask about respondents’ direct experience with regulations or regulatory reform as opposed to their general opinion. For example, the Dutch Perception Monitor Regulatory Burden asked: “If you look at the regulatory burden of the government that affects your business, has this increased, decreased, or remained more or less equal compared to the situation one year ago?”
• Answer choices: Another aspect of question design concerns the answer choices given to respondents. Many surveys (e.g. surveys conducted in Australia, Korea, the Netherlands, New Zealand, the United Kingdom) employed questions using a scaleto measure perceptions of compliance burden. For example, the Dutch Perception Monitor Regulatory Burden inquired: “Can you indicate by giving a mark ranging from 1 to 7 to what extent the regulatory burden impacts your business operations? Figure 1 means ‘not at all’ and 7 ‘severely’.” Other questions, especially those dealing with awareness, used a simple yes-or-no format.
• Data collection method: Common methods to collect data are phone or personal interviews, and paper or online questionnaires. For example, interviews for the Australian Business Perception Survey were conducted via telephone, partly with computer assistance. ‘The Benefits of Regulation: A public and business perceptions study’, conducted in the United Kingdom, consisted of more than 1 000 personal interviews. In some cases, different data collection methods were combined: The Irish “Better Regulation Survey” combined its postal survey with intensive telephone follow-up. In addition, 32 of the more than 800 respondents to the postal survey were selected for an additional qualitative interview via telephone.

1. HOW OECD COUNTRIES USE PERCEPTION SURVEYS IN THE REGULATORY POLICY CYCLE – 21
MEASURING REGULATORY PERFORMANCE © OECD 2012
• Source: Many surveys were initiated by government ministries (the Norwegian Ministry of Trade and Industry, for example), others by business organisations (Board of Swedish Industry and Commerce for Better Regulation, among others). Consultancy firms and research institutes were frequently entrusted with conducting the surveys. For example, the survey “Perception Monitor Regulatory Burden” was commissioned by the Dutch Regulatory Reform Group (Ministries of Finance and Economic Affairs) and was conducted by the market research company Stratus. Finally, some private research companies such as Gallup routinely provide data on perceptions of regulations.
Table A.2 (available online at www.oecd.org/regreform/ measuringperformance) provides information on the key findings of surveys. While it is difficult to compare the findings of surveys that differ significantly with respect to their focus and design, some patterns in the results can be identified:
• The results of a number of surveys indicate that businesses are often aware of government programs and intentions to reduce administrative burdens (e.g., in the Netherlands, New Zealand, Sweden and the United Kingdom), but many doubt that governments can or are successfully realising their targets;
• Despite large investments in regulatory reform programmes, among the surveys for which the OECD has information, few indicate that stakeholders perceive improvement.2 More frequently, no improvement is reported. The Canadian, Swedish and British surveys, for example, inquired whether or not administrative burdens and/or compliance costs have decreased over the recent past. Stakeholders indicate no or, at best, very limited improvements – despite the considerable emphasis placed on administrative simplification in these countries and more fact based analysis supporting reduction in administrative burdens.
Do these findings mean that the regulatory reform programmes were a failure? Not necessarily. Negative survey responses can also stem from the design of the survey (see Chapters 2 and 3), the current economic situation, government and media communication, experience with front-line service and prior expectations (see Chapter 4) The explanation for the negative findings is likely to be different for different countries and

22 – 1. HOW OECD COUNTRIES USE PERCEPTION SURVEYS IN THE REGULATORY POLICY CYCLE
MEASURING REGULATORY PERFORMANCE © OECD 2012
surveys. Understanding and interpreting the reasons underlying these responses is therefore very important to identify the best policy responses (see Chapter 5).
Conclusion
Perception surveys are increasingly used in OECD countries to evaluate the performance of regulatory reform programmes, in particular in the area of reducing administrative burdens. Perception surveys are also used to obtain information on citizen and business levels of awareness and confidence in regulatory reform programmes, and as a diagnostic tool to identify areas of concern to business and citizens as a means to inform future regulatory reforms. Results of a number of surveys in OECD countries indicate that most often it seems that businesses do not feel any improvement in the regulatory environment. These findings do not necessarily indicate a failure of regulatory programs, as survey responses are influenced by many other factors. The aim of this guide is to assist officials to understand the reasons for positive or negative survey results and maximise the benefits from stakeholder surveys for evaluating, communicating and improving regulatory policy.
Notes
1. This chapter draws on information provided by OECD member officials in 2010 on perception surveys in their countries. Please see Tables A.1 and A.2. Table A.1 in the Annex summarises information on the focus, purpose, target population and methodology used for each survey. Table A.2 (available online at www.oecd.org/regreform/measuringperformance)provides more detailed information including survey questions, key findings and some information on the policy use of the results.
2. One of the few surveys that report an improvement is the “Administrative Burdens in Belgium” survey. Results indicate that businesses estimate the costs of administrative burdens to be lower in 2008 than in 2000 (see Tables A.1 and A.2).

2. UNDERSTANDING PITFALLS IN THE DESIGN OF SURVEYS – 23
MEASURING REGULATORY PERFORMANCE © OECD 2012
Chapter 2Understanding Pitfalls in the Design of Surveys
There are a surprising number of potential pitfalls in survey design and, if ignored, survey results can become unusable for policy makers. This chapter provides an analysis of the most common pitfalls, as well as signposts to where information can be found to address them, both within this guide and from external sources.

24 – 2. UNDERSTANDING PITFALLS IN THE DESIGN OF SURVEYS
MEASURING REGULATORY PERFORMANCE © OECD 2012
There are a surprising number of potential pitfalls in survey design and, if ignored, survey results can become unusable for policy makers. Officials who design surveys, write tender proposals to commission surveys, judge the quality of consultant’s work or are consumers of survey results are therefore well advised to be aware of the pitfalls.
Pitfalls in survey design
Survey design and methodological choices are often made unconsciously, without awareness of their impact on survey results. The following list points out the most common pitfalls and directs the reader to potential solutions:
• Questions suggesting answers: The phrasing of questions and the distribution of answer choices may suggest answers to respondents. For instance, survey respondents are more likely to agree to the question “Should the government increase social spending for people with low income?” than to the question “Should the government increase social spending for people on welfare?” (Rasinski, 1989).
Suggestion: follow Steps 2 and 3 in Chapter 3; see also Fowler 1995, pp. 73-75, and Iarossi 2006, pp. 32-37.
• Question priming: Previous questions may suggest answers; respondents answer questions differently based on the information provided by previous questions. The effects of “question priming” are detailed in Box 2.1. Many perception surveys focus on costs and burdens associated with regulations. If businesses first need to respond to a number of questions related to costs and burdens, they may be more inclined to answer negatively to questions about regulatory quality in general than if they were asked questions about the positive effects of regulations beforehand.
Suggestion: follow Steps 2 and 3 in Chapter 3; see also Iarossi 2006, pp. 74-78, and Van de Walle / Van Ryzin, 2011.

2. UNDERSTANDING PITFALLS IN THE DESIGN OF SURVEYS – 25
MEASURING REGULATORY PERFORMANCE © OECD 2012
Box 2.1. Question priming and citizen satisfaction
Changing the order of the same questions in a survey can have a significant impact on the survey results and interpretations. In the citizen satisfaction survey modelled below, questioners switched the question order of specific public services versus general satisfaction with public services. The results of Version A and B were significantly different, even though the services clearly did not change.
Under Version B, overall satisfaction was significantly lower when people thought about their satisfaction after rating individual public services. Version A yielded higher overall satisfaction when asked about satisfaction before rating individual services.
Rating of a city and its political
leaders (4 questions)
Rating of a city and its political
leaders (4 questions)
General satisfaction with public services (3 questions)
General satisfaction with public services (3 questions)
Rating of specific public services(11 questions)
Rating of specific public services(11 questions)
Version A Version B
This example was taken from Van de Walle, Steven and Gregg G. Van Ryzin (2011), “The order of questions in a survey on citizen satisfaction with public services: lessons from a split-ballot experiment”, in Public Administration.
26 – 2. UNDERSTANDING PITFALLS IN THE DESIGN OF SURVEYS
MEASURING REGULATORY PERFORMANCE © OECD 2012
• Complexity: Respondents easily get confused by technical jargon and complex answer options. Using many words to define a single concept within one question can also be difficult to understand. For example, the following question introduced in the UK Better Regulation Survey did not work, because the question introduced the parallel concepts of ‘regulation’ and ‘protection’ in the same question, confusing respondents (Russo, 2010):
− How far do you agree with each of the following two statements?
− There is too much regulation.
− There is not enough protection.
Suggestion: follow Steps 2 and 3 in Chapter 3; see also Fowler 2009, pp. 93-95; p. 110, and Iarossi 2006, pp. 37-43.
• Scale type: Choice of scale influences survey results. For example, the results in one survey question using a scale from 1-7 were reported to be significantly different from the results using a scale from 1-5. This can happen because respondents may show arbitrary tendencies to answer at the median (3) more often in a 1-5 scale than in a 1-7 scale (Kwon and Kim, 2010). Furthermore, answers to the same scale may differ across country/cultural context. For example, on a scale from 0 to 10, a score of 5 does not necessarily mean a “pass” in all countries. In the Netherlands, students pass with a 5.5, in Brazil with a 6 and in Albania with a 4. In some other countries 0-10 scales are not commonly used. For instance, 2-6 is the standard scale in Bulgaria and -3-12 is the standard scale in Denmark (Van de Walle, 2010).
Suggestion: follow Steps 2 and 3 in Chapter 3; see also Fowler 2009, pp. 101-103; pp. 110-111, and Iarossi 2006, pp. 59-65.

2. UNDERSTANDING PITFALLS IN THE DESIGN OF SURVEYS – 27
MEASURING REGULATORY PERFORMANCE © OECD 2012
• Questions mean different things in different countries: Simple concepts have different meanings in different countries, and ideas can be lost in translation. Even if two countries share the same language, concepts may differ (see Box 2.2).
Suggestion: follow Steps 2 and 3 in Chapter 3; see also Iarossi 2006, pp. 85-86, and Harkness et al., 2010.
Box 2.2. Conceptual differences across nations
When asking questions about confidence in the civil service, the World Value Survey incorporated different translations to represent the same concept in different nations (here, the concept was “the civil service”). The translation in Mexico, la burocracia pública, has much stronger negative connotations than the Argentinean translation, los funcionarios. This difference in phrasing may create a negativity bias with respect to the results in Mexico when compared with those in Argentina.
Example: World Value Survey ‘Confidence in the civil service’
Argentina (Los Funcionarios)
Chile (La Administración Pública)
Mexico (La Burocracia Pública)
Venezuela (La Administración Pública)
Peru (Los Funcionarios Públicos)
Puerto Rico (Los Funcionarios De Gobierno)
Spain (La Administración Pública: Los Funcionarios)
Venezuela (La Administración Pública)
Source: Van de Walle, Steven (2010), “Measuring citizens’ perception of the public sector”, presented at the OECD Workshop on Measuring Progress in Regulatory Reform: Perception Surveys, 21-22 June, Slide 14.
• Definitions: The way regulation is defined in a survey, if at all, has several implications for survey results and interpretation:
− First, the word “regulation” has multiple meanings for many respondents. If regulation is only defined broadly (or not at all), survey results are difficult to analyse and compare. The reason is that survey participants may be responding with different ideas of “regulation” in mind or may not understand at all what regulation means. The UK Better Regulation

28 – 2. UNDERSTANDING PITFALLS IN THE DESIGN OF SURVEYS
MEASURING REGULATORY PERFORMANCE © OECD 2012
Study documented that participants’ ideas of regulations differed between primary laws, agency rulemaking, self-regulation by businesses or obligations on citizens like speed limits.
− Second, when regulation is not defined, answers to general questions about regulation may be formed more by the negative connotations of the word ‘regulation’ than by perceptions of actual regulation (negativity bias). The reason is that the word ‘regulation’ has an inherent negative association in several cultural contexts. For example, Goddard (2003) identifies a strong negative connotation of the word ‘regulation’ in the US across sectors. And Cosh and Wood (1998) find that although businesses in the United Kingdom did not have serious concerns with the measures that make up regulation – legislation, legal rulemaking, norms, and taxation – they had significant concerns about the word “regulation” in general.
Suggestion: follow Steps 2 and 3 in Chapter 3; see also Fowler 1995, pp. 13-20, and Iarossi 2006, pp. 37-38.
• Focus of survey and balance of questions: Most perception surveys focus on costs and burdens, and few ask about the benefits of regulations. This may bias results towards negative perceptions.
Suggestion: follow Steps 2 and 3 in Chapter 3; see also questions suggesting answers and question priming.
• Strategic responses and social desirability: People often lie in surveys, either in order to promote their interests or to look socially desirable. For example, businesses may report higher regulatory burdens than they actually perceive, in order to motivate additional action by governments. Survey respondents may also answer based on what they think is socially desirable, especially in face-to-face situations.
Suggestion: follow Steps 2, 3 and 4 in Chapter 3; see also Fowler 2009, pp. 108-110, Marsden/Wright 2010, pp. 285-287, and Fowler 1995, pp. 28-45.
2. UNDERSTANDING PITFALLS IN THE DESIGN OF SURVEYS – 29
MEASURING REGULATORY PERFORMANCE © OECD 2012
• Uninformed respondents: Policy makers can choose to survey business and citizens in general, or target those with direct experience with particular regulations and agencies. Studies find that responses vary according to the level of knowledge and personal experience with regulations. A study conducted in the United Kingdom for instance identified that people having significant experience with regulations exhibited a more balanced view of regulation, acknowledging costs and benefits. Meanwhile those with less experience had less understanding and more polarised opinions. This might be explained by the fact that low awareness of regulation is linked to “an emotional rather than rational response to regulation” (FreshMinds, 2009, p. 27). The study further finds that “more informed citizens are usually more positive about regulation, though this seems less strongly the case for business” (UK Department for Business Innovation and Skills, 2009, p. 69).
Suggestion: follow Steps 1, 2 and 3 in chapter 3; see Fowler 2009, pp. 106-108, and Iarossi 2006, pp. 27-28.
• Non-respondents: Many people who receive a survey do not answer it. If those who ignored the survey would have answered differently than respondents, survey results are biased. For example, many questionnaires ask businesses whether they feel an improvement with respect to regulatory burdens. If businesses that feel the improvement do not bother to answer, and only those who still feel high burdens answer, the results will be more negative than the views of all businesses. Or, if burdens differ for big companies and for small companies, and only big companies fill in the survey, the answers will not be representative of all businesses.
Suggestion: follow Steps 4, 5 and 6; see Fowler 2009, Chapter 4, and Lohr 2010, Chapter 8; pp. 533-535.

30 – 2. UNDERSTANDING PITFALLS IN THE DESIGN OF SURVEYS
MEASURING REGULATORY PERFORMANCE © OECD 2012
Conclusion
Common pitfalls in survey design include overly complex questions, missing definitions and question priming, i.e. respondents are inclined to answer based on the information provided by previous questions. Furthermore, many perception surveys focus on costs and burdens, and few ask about benefits of regulations. This may bias results towards negative perceptions. If these pitfalls are ignored, the results become unusable for policy makers. It is therefore important to keep pitfalls in mind when designing surveys or judging the quality of consultant’s work. The next chapter will offer step-by-step guidance to design methodologically sound surveys that avoid pitfalls or mitigate their effects.

3. GOOD PRACTICES IN SURVEY DESIGN STEP-BY-STEP – 31
MEASURING REGULATORY PERFORMANCE © OECD 2012
Chapter 3Good Practices in Survey Design Step-by-Step
Good practice methodologies considerably improve the quality of results and help avoid pitfalls. This chapter explains good practice through sequential, step-by-step guidance that can be used to design a perception survey. It provides advice on how to define survey objectives and the target group, draft survey questions, pilot and re-adjust a questionnaire, select respondents and data collection methods, run the survey, and analyse the results.

32 – 3. GOOD PRACTICES IN SURVEY DESIGN STEP-BY-STEP
MEASURING REGULATORY PERFORMANCE © OECD 2012
Good practice methodologies considerably improve the quality of results and help avoid pitfalls. This chapter explains good practice through sequential, step-by-step guidance that can be used to design a perception survey. The sequential order is important: a step skipped at the outset cannot be returned to later in the process. For example, if survey questions are not carefully designed, even the best methods to collect, analyse and display the data at later stages cannot make up for the bad design. The consequence is that the results can be useless for policy makers.
Six steps to better survey design
Step 1. Define survey objectives, use of results and target population
First, when developing a survey it is important that objectives be clearly defined, i.e. what insights should be gained from the survey and what should be learned. Policy makers also need to decide whether they want to compare survey results over time. In this case, the survey should be repeated over time and the questions have to be very carefully drafted to allow for comparisons over time. Furthermore, as changing the questions at the next round compromises the comparability over time, it is advisable to invest in extremely good question design and testing for the baseline survey.
Second, it is timely to consider the question as to whether a perception survey is the right tool to use to achieve the objective and what its limitations are in achieving the objective. For example, to evaluate the success of administrative burden reduction programmes, it is misleading to rely solely on perception surveys, as perceptions and hence survey results are shaped by many factors and the actual quality of regulations is only one of them (see next chapter).
It is therefore advisable to collect other available data that will contribute to achieving the objective and will complement the information obtained from the perception surveys. For example, data based on the Standard Cost Model and on perception surveys provide information on reductions in administrative burdens from different angles.

3. GOOD PRACTICES IN SURVEY DESIGN STEP-BY-STEP – 33
MEASURING REGULATORY PERFORMANCE © OECD 2012
Checklist to commission, design and run a perception survey
Step 1. Define survey objectives and target group
• Define the objectives • Define the final use of the results• Ensure a perception survey is the adequate tool• Define target group(s)
Step 2. Draft survey questions
• Set up discussions with members of a target group to identify key issues• Translate those into questions and answer categories• Draft simple and clear questions• Keep the questionnaire short to maximise response rate and concentration• Ensure respondents have the opportunity to report problems
• Test the survey on a smaller-scale target group to identify weaknesses in the survey design
• Possibly ask volunteers to think aloud while answering questions and analyse what motivated their answers
• Adjust questionnaire if needed
Step 3. Pilot and re-adjusting the questionnaire
Step 4. Select respondents and the data collection method
• Select a sample either by random sampling or other methods• Ensure that the sample size allows to draw valid conclusions from the results• Choose the data collection method: personal interviews, telephone interviews,
Internet surveys, email surveys, etc.• Maximise response rate through appropriate data collection method
Step 5. Run the survey
• Ensure high response-rate through follow-up emails otherwise conclusions to the survey could be biased
• Use trained interviewers to avoid unintentional influence on responses
Step 6. Analyse the results
• Interpret results as perceptions rather than facts• Take into account the response rate. A low rate means that no general
conclusions can be drawn• Take into consideration the number and the way respondents have been selected
in the result analysis• Understand how results were reached is essential to draw policy conclusions • Attach documentation regarding Steps 1-6 to results and interpret results in
combination with other data sources

34 – 3. GOOD PRACTICES IN SURVEY DESIGN STEP-BY-STEP
MEASURING REGULATORY PERFORMANCE © OECD 2012
Third, this is the right moment to think about how the final results will be used. The reason for doing this early in the process is that the desired use of the results determines the questions and the target population. For example, the objective of one survey might be to measure the level of awareness of businesses of recent regulatory reforms. If the results of the survey should then be used to adjust the communication strategy, questions that help understand how respondents inform themselves about reforms and how to best reach them could be added.
Fourth, the target population to be surveyed (also referred to as the target group) needs to be identified, including sub-groups. For example, if the target population is businesses, a comparison of the answers of SMEs to those of larger companies could be useful. This decision will have implications for steps later in the process, such as deciding on the number of respondents and the way they are selected. At this stage, deciding to target only those with direct experience with the survey topic could be a possibility, for example those directly affected by administrative burden reduction programmes or those with regular contact with a regulatory agency. Targeting groups with direct contact may lead to more meaningful and informed responses. At the same time, such targeted surveys are not informative about the perceptions and the awareness level of citizens and businesses in general. It is also possible to measure and to distinguish between uninformed and informed respondents. For example, the practice of introducing screening questions to determine if the respondent is qualified to answer questions of interest is used in Canada (Turcotte, 2010).
Step 2. Draft survey questions
Much of what can go wrong in survey design happens at the drafting stage of the questionnaire (see previous section on pitfalls). A number of good practices can help produce a sound questionnaire.
Respondents can get easily frustrated when a survey does not include any questions on the most bothersome problems. This can occur because the person who designed the survey was not aware of these problems or did not realise their importance to respondents. Thus, before beginning the process of drafting questions, it is advisable to conduct focused discussions with individuals of the target population about the issues to be tackled. For example, if the objective of the survey is to identify what irritates business the most when dealing with regulation, a focus group

3. GOOD PRACTICES IN SURVEY DESIGN STEP-BY-STEP – 35
MEASURING REGULATORY PERFORMANCE © OECD 2012
with business representatives can help identify key issues that can then be transformed into questions, and answer choices. This ensures that survey respondents identify with the questions and answer choices.
Box 3.1. Checklist for drafting good questions
1. Do the answers to the questions help meet the objectives of the survey?
2. Do the questions address the most bothering issues of the target population?
3. Is the language simple and devoid of technical jargon?
4. Are key terms such as “regulation” clearly defined?
5. Do you avoid asking two questions in one, i.e. do all questions only ask one question at a time?
6. Are questions clear and precise enough that they will be consistently understood in the same way by all respondents?
7. Are the formulation of questions and answer choices and their order as neutral as possible, i.e. do they avoid suggesting answers?
8. Are the answer choices and scales clearly defined and consistently understood across respondents? Have both been chosen carefully?
9. Does the target population have the capacity and knowledge to answer all questions?
10. Have screening questions been included, that is, has the same question been asked in different ways to identify consistent respondents and meaningful responses?
11. Have tricky questions been included towards the end of the survey when respondents feel more comfortable answering them?
12. Is the questionnaire short enough to ensure that respondents will concentrate until the end?
For a more detailed checklist, see also Fowler, Floyd J., Jr. and Carol Cosenza (2008), “Writing effective survey questions”, in: De Leeuw, Edith D., Joop J. Hox and Don A. Dillman (eds.), The international handbook of survey methodology, Mahwah, NJ: Lawrence Erlbaum, p. 159.

36 – 3. GOOD PRACTICES IN SURVEY DESIGN STEP-BY-STEP
MEASURING REGULATORY PERFORMANCE © OECD 2012
Once key issues have been identified, simple and clear questions can be drafted. Ensuring that respondents have a shared understanding of the meaning of the question and that they know the answer to the question is important. If not, the answers given by respondents are not comparable and policy makers cannot draw any meaningful conclusions from the results. Box 3.1 above highlights key recommendations for drafting good questions in a checklist format. Once drafted, using the online tool “Question Understanding Aid” from the University of Memphis for further checking may be helpful (see http://mnemosyne.csl.psyc.memphis.edu/QUAID/quaidindex.html). It analyses questions and points to problems with the questions such as unfamiliar technical terms, vague or imprecise terms or complicated syntax.
At this stage, a letter of invitation to participate in the survey can be drafted. It should indicate the purpose of the survey, clearly define the participants’ role and explain how anonymity will be guaranteed. The survey’s cover letter is extremely important, as a good letter helps maximise the response rate. Low response rates present the risk that no statistically valid conclusions can be drawn from the survey results.
Step 3. Pilot and re-adjust questionnaire
It is essential to test surveys to identify weaknesses in the survey design. This involves running the survey on a smaller-scale group of people beforehand to learn how respondents are likely to interpret and react to the questionnaire. Piloting surveys allows researchers to discover problems in the survey design such as poorly-phrased questions and to adjust the survey design accordingly. This relatively small investment before running the actual survey can significantly improve the quality of results. In addition, the analysis of responses to the pilot survey enables policy makers to subsequently better interpret answers to the survey questions. It can enable policy makers to identify the key drivers of perceptions, as well as test respondents’ associations with and understanding of regulation (Russo, 2010; UK Department for Business Innovation and Skills, 2009).
Pilots usually draw on qualitative research methods such as “cognitive laboratory interviews” where interviewers work with volunteers to find out whether:
• Questions are consistently understood across respondents;
• Answers accurately describe what respondents have to say;

3. GOOD PRACTICES IN SURVEY DESIGN STEP-BY-STEP – 37
MEASURING REGULATORY PERFORMANCE © OECD 2012
• Answers provide valid measures of what the question is designed to measure;
• Respondents have the information needed to answer the questions (Fowler, 2009).
Typically, volunteers from the target population respond to the questionnaire and are asked by interviewers to “think aloud” while they are preparing their answers. They may also be asked some follow-up questions to understand the way in which they interpreted and answered each question. Standard follow-up questions ask respondents to i) say in their own words what they think the question is asking and ii) to explain how they chose a particular answer over others. Interviewers need to be knowledgeable about the objectives of each question, so that they can detect issues arising from the way that respondents understand questions (Fowler, 2009). They also need to be trained not to influence respondents in their answers. Detailed information on how to conduct such interviews can be found in DeMaio & Rothgeb, 1996 (see Box 3.2). Following the interview results, phrasing and question order can be adjusted.
Lessons learned in Canada show that pilot surveys should include open-ended questions. This allows policy makers to subsequently build well thought-out and clearly-stated choices to closed-ended quantitative questions (Turcotte, 2010). The UK Better Regulation Executive (BRE) piloted questions with qualitative research methods to “better understand how individuals intuitively think about regulation” (FreshMinds, 2009, p. 108) and to adjust the wording of questions in the quantitative survey. In response to concerns in the pilot survey over question complexity, the final quantitative survey used simple language, avoiding the word “proportionate” in particular. The BRE further used its insights from the qualitative phase to design questions in the quantitative survey so that “they [the respondents] were not forced into answers that limited the range of their responses” (FreshMinds, 2009, p. 114). Whereas open-ended questions are very valuable for pilot surveys, experience from Belgium suggests that using them in the final surveys risks diminishing the response rate.
It can be useful to not only test the questions, but also the cover letter: Is the purpose of the survey clear to respondents and do they feel the letter motivates them to participate?

38 – 3. GOOD PRACTICES IN SURVEY DESIGN STEP-BY-STEP
MEASURING REGULATORY PERFORMANCE © OECD 2012
Step 4. Select respondents and the data collection method
This stage confirms the number of respondents and the way they are selected. If done correctly, general conclusions can be drawn about the views of the target population based on a small number of respondents. For example, when properly selected, a survey of 1 000 citizens can allow a researcher to draw conclusions about the views of all citizens in a country. If, on the contrary, there are mistakes in the selection of respondents, the results of the survey can be biased to the point of being useless.
The method used to select the people who receive the survey (i.e. the sample) is called sampling methodology in statistics. One common method used is random sampling. Random sampling is a process that randomly selects respondents from the target population. For example, if the target population is “companies in a country”, all companies should have the same chance of being selected, and only once. This is easy if all companies in the country are listed. In this case, a random number generator can simply be used to select respondents. Additional sophisticated methods exist that help reduce survey costs or ensure that there is a sufficient sample size for each sub-group of interest (e.g. SMEs versus large companies). For example, stratified sampling is a process that generates random samples for a number of sub-groups. For further detailed advice on choosing survey respondents, see for example Lohr, 2010.
Selecting the right sample size is quite complex. Contrary to common belief, it does not depend on the size of the target population. For example, whether a country has 300 000 or 80 million inhabitants, the sample size is constant. The right sample size depends on other factors such as the method used to select respondents, the number of sub-groups compared and measurement and sampling error. Relying on a statistician to choose the right sample size and methodology is advisable (see Box 3.2). Note that tables that indicate the right sample size often assume a 100% response rate. If a response rate is suspected to be lower, the sample size needs to be adjusted upwards.
A high response rate is important for drawing valid result conclusions. This is particularly the case if those who ignored the survey would have answered differently than respondents. For example, in customer satisfaction surveys, those who are unhappy with the service may answer the survey to channel their anger and to ask for change, while those who liked the service may not bother responding. In this case, survey results are biased and the bias will be more important if the

3. GOOD PRACTICES IN SURVEY DESIGN STEP-BY-STEP – 39
MEASURING REGULATORY PERFORMANCE © OECD 2012
response rate is low. It is often difficult to find out whether non-respondents would have answered differently (see Step 6). Ideally a data collection method therefore maximises the response rate, while ensuring the anonymity of respondents and making them feel comfortable to respond honestly. Table 1 lists advantages and disadvantages of common data collection methods. One can choose between self-administered data collection methods (e.g., Internet surveys) versus interviewer-administered data collections (e.g., personal interviews). Self-administered surveys are usually less expensive than interviewer-administered data collections and respondents are more likely to honestly respond to sensitive questions if no one sees how they answer. However, interviewer-administered data collections are often most effective for getting a high response rate and for exercising quality control with respect to answering all questions, meeting question objectives, or the quality of answers provided (Fowler, 2009). At this stage, it is timely to design ways to follow-up with non-respondents to maximise response rates.
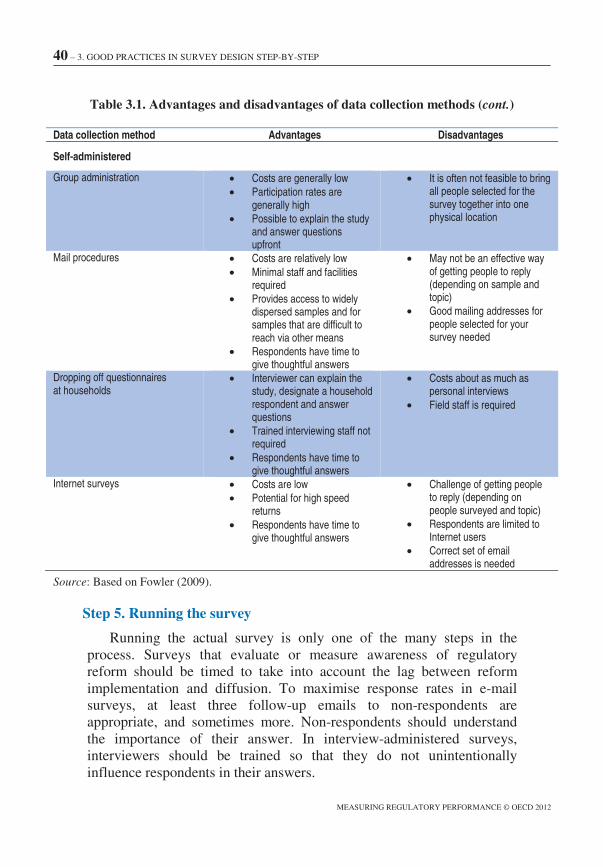
Table 3.1. Advantages and disadvantages of data collection methods
Data collection method Advantages Disadvantages
Interviewer-administered
Personal interviewing • Effective way of getting people to participate
• Rapport and confidence building possible
• More time-consuming surveys are possible than by any other method
• Best for some sample designs (e.g. area probability samples)
• Likely to be costly (trained interviewers needed on site)
• Data collection period likely to be longer than telephone procedures
• It might be difficult to reach every person in your sample
Telephone interviewing • Costs are usually lower than for personal interviews
• Response rate is likely to be higher than from a mail sample
• Provides better access to certain populations, especially compared to personal interviews
• Data collection periods are usually short
• Possibly sampling limitations (omits those without a landline or whose phone number cannot be found)
• Possibly less appropriate for personal or sensitive questions
40 – 3. GOOD PRACTICES IN SURVEY DESIGN STEP-BY-STEP
MEASURING REGULATORY PERFORMANCE © OECD 2012
Table 3.1. Advantages and disadvantages of data collection methods (cont.)
Data collection method Advantages Disadvantages
Self-administered
Group administration • Costs are generally low • Participation rates are
generally high • Possible to explain the study
and answer questions upfront
• It is often not feasible to bring all people selected for the survey together into one physical location
Mail procedures • Costs are relatively low • Minimal staff and facilities
required • Provides access to widely
dispersed samples and for samples that are difficult to reach via other means
• Respondents have time to give thoughtful answers
• May not be an effective way of getting people to reply (depending on sample and topic)
• Good mailing addresses for people selected for your survey needed
Dropping off questionnaires at households
• Interviewer can explain the study, designate a household respondent and answer questions
• Trained interviewing staff not required
• Respondents have time to give thoughtful answers
• Costs about as much as personal interviews
• Field staff is required
Internet surveys • Costs are low • Potential for high speed
returns • Respondents have time to
give thoughtful answers
• Challenge of getting people to reply (depending on people surveyed and topic)
• Respondents are limited to Internet users
• Correct set of email addresses is needed
Source: Based on Fowler (2009).
Step 5. Running the survey
Running the actual survey is only one of the many steps in the process. Surveys that evaluate or measure awareness of regulatory reform should be timed to take into account the lag between reform implementation and diffusion. To maximise response rates in e-mail surveys, at least three follow-up emails to non-respondents are appropriate, and sometimes more. Non-respondents should understand the importance of their answer. In interview-administered surveys, interviewers should be trained so that they do not unintentionally influence respondents in their answers.

3. GOOD PRACTICES IN SURVEY DESIGN STEP-BY-STEP – 41
MEASURING REGULATORY PERFORMANCE © OECD 2012
Step 6. Analysing the results
In this step, all survey responses are summarised and analysed. The results can be presented in graphs and tables and explain what conclusions can be drawn from the data. It is advisable to:
• Interpret survey data not as facts, but as perceptions.
• Interpret results together with other data sources.
• Understand what is behind the results to draw policy conclusions (The next chapter explains the fundamental drivers of perceptions and ways to bring them to light.).
• Take into account the number and the way respondents were selected in the interpretation of the results. For example, if random samples were drawn from more than one group, general conclusions about the full group may require some adjustments (Lohr, 2010).
• Take into account the response rate in the interpretation of the results. If the response rate is too low, no generalisations about the views of the targeted population group can be drawn. Groves et al. (2001) and Lohr (2010), for example, explain how to deal with non-respondents (see Box 3.2). This may include analysing whether non-respondents would have replied differently than respondents, which would introduce bias into the survey results.
• Document Steps 1 to 6 well and report transparently how the survey was conducted to assist users to interpret the results.

42 – 3. GOOD PRACTICES IN SURVEY DESIGN STEP-BY-STEP
MEASURING REGULATORY PERFORMANCE © OECD 2012
Box 3.2. Literature hints for designing an effective survey
General (all steps)
For general guidance on survey design written in a non-technical way: Fowler, Floyd J., Jr. (2009), Survey Research Methods, 4th Edition, Thousand Oaks, CA: Sage.
For more technical guidance: De Leeuw, Edith D., Joop J. Hox and Don A. Dillman (eds.) (2008), The international handbook of survey methodology, Mahwah, NJ: Lawrence Erlbaum.
Designing and testing questions
Fowler, Floyd J., Jr. (1995), Improving Survey Questions: Design and Evaluation,Thousand Oaks, CA: Sage.
Fowler, Floyd J., Jr. and Carol Cosenza (2008). “Writing effective survey questions”, in: De Leeuw, Edith D., Joop J. Hox and Don A. Dillman (eds.), The international handbook of survey methodology, Mahwah, NJ: Lawrence Erlbaum, pp. 136-160.
DeMaio, Theresa J. and Jennifer M. Rothgeb (1995), “Cognitive interviewing techniques-in the lab and in the field”, in: Norbert Schwarz and Seymour Sudman (eds.), Answering questions, San Francisco: Jossey-Bass, pp.177-196.
For a more comprehensive and technical guide to the psychological roots of survey data, how survey responses are formulated, and how seemingly unimportant features of surveys can affect the answers obtained, see Tourangeau, Roger, Lance J. Rips and Kenneth Rasinski (2000), The Psychology of Survey Response, Cambridge University Press, Cambridge.
Selecting your survey respondents and dealing with non-responses
For advice on sampling design (how to choose your respondents) and analysis: Lohr, Sharon (2010), Sampling: Design and Analysis, 2nd edition, Boston, MA: Brooks/Cole.
For advice on dealing with low response rates: Groves, Robert M. et al. (2001), Survey Nonresponse (Wiley Series in Survey Methodology), Chichester, England: John Wiley and Sons, Ltd.
Analysing and presenting data
For a basic step-by-step guide on presenting data effectively: Wallgren, Anders et al.(1996), Graphing Statistics & Data, Thousand Oaks, CA: Sage.
For a more comprehensive guide on analyzing and presenting data: Pearson, Robert W. (2010), Statistical Persuasion: How to Collect, Analyze, and Present Data…Accurately, Honestly, and Persuasively, Thousand Oaks, CA: Sage.
3. GOOD PRACTICES IN SURVEY DESIGN STEP-BY-STEP – 43
MEASURING REGULATORY PERFORMANCE © OECD 2012
Conclusion
Use of good practice methodologies will improve the quality of results considerably and help to avoid pitfalls. First, the objectives and the target population are defined. This is followed by drafting the survey questions, running a pilot and re-adjusting the questionnaire, selecting respondents and the data collection method, running the survey, and analysing the results. The sequential order is important: a step skipped at the outset cannot simply be inserted later. For example, if survey questions are not carefully designed, even the best methods to collect, analyse and display the data at later stages cannot make up for the bad design. The consequence is that the results can be useless for policy makers. While officials may outsource most of the steps to consultants, they should be aware of the key issues in each of the steps in order to judge the quality of consultant’s work and understand survey results.


4. UNDERSTANDING THE DRIVERS OF PERCEPTION TO IMPROVE THE USE OF SURVEY RESULTS – 45
MEASURING REGULATORY PERFORMANCE © OECD 2012
Chapter 4Understanding the Drivers of Perception to Improve
the Use of Survey Results
This chapter explains what factors drive perceptions of the quality of regulatory reform programmes (Section 1) and provides guidance to highlight these factors for a specific survey (Section 2). Policy makers will gain an understanding of the factors that drive survey results to maximise the survey’s policy utility and use. This chapter draws on research on perceptions as well as on country experiences and applies those to the field of regulatory policy.

46 – 4. UNDERSTANDING THE DRIVERS OF PERCEPTION TO IMPROVE THE USE OF SURVEY RESULTS
MEASURING REGULATORY PERFORMANCE © OECD 2012
Beyond survey design and methodology, a number of factors such as trust in government, experience with front-line services or prior expectations shape responses to perception surveys at a more fundamental level. This means that the same survey results may nonetheless be driven by very different underlying factors and that without knowing what factors drive the results, policy makers cannot define appropriate policy conclusions.
The fundamental drivers of perceptions
Some drivers of perceptions that underlie survey results are directly linked to regulatory reform, implementation and communication, and hence are shaped by regulatory policies and their implementation. Others are linked to characteristics and attitudes of individuals such as general trust in government. These are less likely to change as a function of regulatory policies and communication.
Drivers of perceptions linked to regulatory reform, implementation and communication
• “Irritation” could have a greater influence than actual costs:An individual’s sense of hassle or irritation may have a larger impact on their overall perception of regulation than its measurable costs. For example, according to the 2009 Action Programme for Reducing Administrative Burdens in the EU, “the degree to which businesses consider an information obligation to be irritating (irritation factor) is very often uncorrelated to the administrative burdens imposed” (European Commission, 2009, p. 5; see also OECD, 2010). Irritating experiences are often more memorable than those linked to benefits (UK Department for Business Innovation and Skills, 2009), especially for businesses (Russo, 2010).
• Service quality: Citizen and business perceptions of regulations are shaped by their experience with the front-desk staff responsible for implementing regulation. Factors of service quality include “professionalism, timeliness, staff attitude, and information” (Skinner, 2010, Slide 31). For example, participants in the Canadian CFIB Survey identified customer service issues such as being put on hold by a regulator, rude or poorly-informed agency staff, and getting more than one answer

4. UNDERSTANDING THE DRIVERS OF PERCEPTION TO IMPROVE THE USE OF SURVEY RESULTS – 47
MEASURING REGULATORY PERFORMANCE © OECD 2012
to the same question, as a large part of the “regulatory headache” (Canadian Federation of Independent Business, 2010, p. 12).
• Regulatory language: Regulatory texts are usually written in very legalistic and administrative language which is difficult for citizens and businesses to understand. This may shape their perceptions of regulation towards the negative.
• Compliance costs: The distinction between administrative burdens and substantive costs of complying with regulations is not always clear or relevant to businesses. Administrative burden reductions may therefore not influence survey results positively, if the substantive compliance costs remain high. For instance, reducing administrative burdens by minimising information obligations of environmental regulations may not lead to more positive survey results if those regulations still require costly investments in machinery.
• Frequency of reform: By changing institutionalised practices, reform per se may create significant irritation costs, especially for businesses. Reform can make businesses uncertain of compliance requirements (KPMG LLP, 2010); the Danish Burden-Hunter Project cited government uncertainty and unpredictability as drivers of negative perception (Wissing Jensen, 2010).
• Lack of awareness of benefits: Businesses and citizens are unaware of the full impact of regulations in terms of costs and benefits for society. Benefits are often diffuse, whereas costs affect individual businesses and citizens more directly
• Issue salience and visibility: The UK Better Regulation Executive (BRE) linked contact with and understanding of regulations to a more balanced view of their costs and benefits; the BRE identified that well-informed individuals were usually more positive about regulation, “show[ing] a grasp of both benefits and costs, which can be quite sophisticated, and often with personal experience of the issues involved” (UK Department for Business Innovation and Skills, 2009, p. 69). However, bad regulation may be more visible than good regulation (FreshMinds, 2009). The majority of news stories [about regulation] was found to be negative (FreshMinds, 2009),

48 – 4. UNDERSTANDING THE DRIVERS OF PERCEPTION TO IMPROVE THE USE OF SURVEY RESULTS
MEASURING REGULATORY PERFORMANCE © OECD 2012
and may serve to mythologise regulatory burdens. Furthermore, stories of regulatory burdens are more likely to remain in the public consciousness than stories of regulatory successes. The UK Better Regulation Executive reports that “regulation seen as good appeals to common sense […] and in many instances quickly renders itself invisible as it comes to be taken for granted. Conversely, regulation seen as bad remains highly visible as it grates against what the public perceives to be fair and sensible” (FreshMinds, 2009, p. 20).
• Government and media communications: According to a recent study conducted in the United Kingdom, the media has the potential to influence an individual’s opinion about regulations, especially if the individual does not have personal experience to draw on (UK Department for Business Innovation and Skills, 2009). The same study revealed that media reporting about regulations is mostly negative. Memorable stories of regulatory success communicated by the government can improve perceptions of regulation and emphasise that “compliance is standard” (Russo, 2010, Slide 18).
• Involvement: Respondents, especially business respondents, highlighted the desire for consultation at the early stages of the policy development process in several country surveys. Discussions echoed this emphasis on consultation from a governmental perspective and posited that stakeholder involvement might constitute an element of perception formation. Experience in Denmark showed that businesses responded very positively to participating in the Burden Hunters project, which aimed at “allowing business to set the agenda and be heard”. It was emphasised though that continued support depends on the solutions actually developed (Wissing Jensen, 2010, Slide 4).
• Timing: Survey respondents may be unaware of regulatory reforms because of the time lag between reform implementation and diffusion, or because of the low visibility of reforms. Surveys need to be conducted once survey respondents are aware of reforms and can feel their effect.

4. UNDERSTANDING THE DRIVERS OF PERCEPTION TO IMPROVE THE USE OF SURVEY RESULTS – 49
MEASURING REGULATORY PERFORMANCE © OECD 2012
Drivers of perceptions linked to respondents’ characteristics and attitudes
• Area/demographic factors: Areas with lower average income may report more negative perceptions of regulation in general than better-off areas. For example, persons from deprived areas in the United Kingdom reported significantly lower overall satisfaction levels with their local area than their wealthier counterparts in a survey conducted by Ipsos Mori (Skinner, 2010).
• Businesses have different perceptions from the public: Business perceptions of regulation may be more negative than those of the general public. This may be due to the increased focus by businesses on the costs of regulation rather than on the benefits. By contrast, citizens often think of the benefits of regulation more than the cost. Furthermore, businesses have an incentive to project negative perceptions of regulatory quality in order to motivate more drastic deregulation. However, business responses are complex: business respondents balance roles as both citizen and business-person (Russo, 2010) and of course not all businesses are the same.
• Perceptions among businesses vary: Business perceptions often differ based on size and sector (Atkinson and Van der Zwet, 2010), as well as other factors such as number of years in business, competitive conditions, and business strategy (Carter et al., 2009). One reason might be that compliance costs are proportionally higher for some sectors and for smaller businesses. For example, the Business New Zealand/KPMG 2008 survey (KPMG LLP, 2008) identified a regressive effect from compliance costs; that is, smaller businesses incur higher compliance costs per employee than larger businesses. In line with this finding, the Board of Swedish Industry and Commerce for Better Regulation (NNR) states that “developments regarding burdensome and costly regulations are also of greater concern for SMEs than for larger companies” (Board of Swedish Industry and Commerce for Better Regulation, 2010, p. 19).
• Businesses may not be sensitive to regulatory changes: The way businesses conceptualise regulation may remain static, despite government interventions. Deregulation and administrative

50 – 4. UNDERSTANDING THE DRIVERS OF PERCEPTION TO IMPROVE THE USE OF SURVEY RESULTS
MEASURING REGULATORY PERFORMANCE © OECD 2012
burden reduction do not create competitive advantages for individual firms. Rather, the benefits are diffuse, creating gains for every firm, and thus for the overall economy. Because firms cannot gain efficiency advantages over their domestic competitors through deregulation, it may have little effect on perceptions. It may also be that because “rules and regulation are always negative, relieving it is a non-event (like the inconspicuousness of a relieved pain)” (Schippers, 2010, Slide 17).
• Attitudes and interests: Perceptions of regulation are sometimes irreversibly tied to fundamental attitudes and interests, such as general trust in government. Steyaert termed these ‘psychographic’ characteristics (Steyaert, 2010, Slide 7). For example, questions about regulation could trigger inherent beliefs about government, so that a general sense of dislike of government is automatically tied to a sense of low regulatory quality. Van de Walle (2003) writes that citizens’ trust in government influences their evaluation of government performance (Van de Walle and Bouckaert, 2003).
• Cultural differences: Attitudes such as trust in government often have very different characteristics across nations. In the United Kingdom, for example, “the power and prevalence of what might be termed ‘anti-regulation’ discourses in the wider society” might serve to explain part of UK “business owners’ general perceptions of employment rights, [which] often differ from their concrete experiences” (Kitching, 2006, p. 16). Business owners may see employments rights in general as a burden, and simultaneously claim positive effects on their own firm. The results of perception surveys in countries with generally negative attitudes towards the state might therefore be artificially lower compared to other countries, regardless of actual regulatory performance, due to the commonality of such sentiments as “Public services are intrinsically inefficient” (IPSOS MORI Social Research Institute, 2003, p. 30).
• Expectations: As expectations rise, perceptions may be lower, whether or not actual quality has changed. Expectations form a critical part of the way end-users perceive the quality of regulatory policy; Van de Walle and Bouckaert (2003, p. 2)

4. UNDERSTANDING THE DRIVERS OF PERCEPTION TO IMPROVE THE USE OF SURVEY RESULTS – 51
MEASURING REGULATORY PERFORMANCE © OECD 2012
write that the performance of public administrations and satisfaction of its users are “not necessarily related because of the subtle interplay of reality, perception and expectations”. An increase in expectations may thus stem from changes in a number of factors unrelated to actual regulatory improvement, such as consumer demand or systemic feelings about government.
• Political changes: Because fundamental political attitudes about government have a significant impact on perceptions, political change can bring a shift in perceptions of regulatory performance, independent of any actual changes.
How to identify the drivers of perception
Most perception surveys are informative about general trends in business and citizens’ perceptions of the quality of regulations, of regulatory costs and burdens and of the level of awareness of particular regulatory reform programs. However, most survey questions are too general to provide information about the drivers of those perceptions. In order to correctly interpret survey results and to decide on appropriate policy responses, it is necessary to understand the underlying drivers of perceptions. The reasons is that the same survey result can be caused by different factors, and hence require different policy responses.
OECD countries have tested a number of both qualitative and quantitative tools to identify the drivers of perceptions underlying their survey results.
Qualitative tools
Qualitative research methods may include focus groups, open-ended survey questions, interviews and case studies. In the UK’s “better regulation, better benefits survey”, a qualitative research phase preceded the quantitative perception survey. Twenty-five business owners and 25 citizens from different areas were selected, following as broad a representative sample of the UK population as possible. In-depth interviews provided important insight on question formation, perception drivers, and individual experiences. For example, the study revealed that very few respondents could give a confident definition of what regulation was and that few respondents were able to tie specific

52 – 4. UNDERSTANDING THE DRIVERS OF PERCEPTION TO IMPROVE THE USE OF SURVEY RESULTS
MEASURING REGULATORY PERFORMANCE © OECD 2012
regulation back to the governing regulatory body. It also became clear that perceptions of regulation do not only vary from one individual to the next but that individuals also do not hold uniform views. For example, one respondent may perceive the smoking ban recently introduced in the United Kingdom as positive, while also perceiving health and safety regulation in general as negative (Russo, 2010).
Other countries conduct perception surveys independently from quantitative surveys. For example, in Denmark, the Burden Hunter technique relies on observations of everyday business practices, interviews, and data analysis to shed light on the day-to-day routines of the end-users of regulation. While it was developed as a stand-alone measure, it can also be used to complement and contextualise data from perception surveys and the Standard Cost Model (SCM) (see Box 4.1).
Box 4.1. Drivers of (negative) perceptions: Insights from the Danish Burden-Hunter Project
The Danish Burden Hunter Technique aims to get a better understanding of what is driving business perceptions of government and regulations, and to develop solutions to cut red tape that businesses experience as the most irritating. Consultants visited businesses in Denmark to collect quotes, audio, and video data on businesses’ day-to-day experience with regulations including interaction with public authorities responsible for regulatory matters. The following drivers of negative perceptions were identified:
1. Inflexibility
2. Lack of mutual obligation
3. Unfairness
4. Uncertainty and unpredictability
5. Pointlessness
6. Lack of respect from the public authorities for the fact that "this is my enterprise and these are my enterprise's day to day activities”
7. Lack of confidence in "my good intentions and acknowledgement of my knowledge and experience in operating a company today”
8. Complexity
9. Powerlessness and lack of clarity in authorities’ roles
Source: Wissing Jensen, Jørgen (2010), “The Burden-Hunter technique: A user-centric approach to cutting red tape”, presented at the OECD Workshop on Measuring Progress in Regulatory Reform: Perception Surveys, 21-22 June, Slide 11, available at www.oecd.org/dataoecd/56/58/45641644.pdf. For further information, please see www.mind-lab.dk/en/cases/byrdejagt-i-danske-virksomheder.

4. UNDERSTANDING THE DRIVERS OF PERCEPTION TO IMPROVE THE USE OF SURVEY RESULTS – 53
MEASURING REGULATORY PERFORMANCE © OECD 2012
Box 4.2 provides references to methodological advice for conducting good practice focus groups, interviews and case studies.
Box 4.2. Literature hints for qualitative research methods: Focus groups, interviews and case studies
Focus groups
For a brief introduction to focus groups that explains when to use focus groups and why: Morgan, David L. (1998), The Focus Group Guidebook, Thousand Oaks, CA: Sage.
For more advanced guidance that develops a conceptual framework for focus groups: Fern, Edward F. (2001), Advanced Focus Group Research, Thousand Oaks, CA: Sage.
For combining surveys and focus groups: Morgan, David L. (1993), Successful Focus Groups: Advancing the State of the Art, Newbury Park, CA: Sage.
Interviews
For an introductory guide to interviews: Rubin, Herbert J. and Irene S. Rubin (2005), Qualitative Interviewing: The Art of Hearing Data, 2nd edition, Thousand Oaks, CA: Sage.
For a detailed description of how to conduct survey interviews: Weiss, Robert S. (1994), Learning from Strangers. The Art and Method of Qualitative Interview Studies, New York, NY: Free Press.
For tips to reduce interviewer-related errors: Fowler, Floyd J., Jr. and Thomas W. Mangione (1990), Standardized survey interviewing. Minimizing interviewer-related error, Newbury Park, CA: Sage.
Case studies
For a step-by-step guidance on case studies: Yin, Robert K. (2009), Case Study Research. Design and Methods, London: Sage.
Further literature hints for qualitative research can be taken from the syllabi database of the “Consortium on Qualitative Research Methods”, Syracuse University: www.maxwell.syr.edu/moynihan/cqrm/Syllabi_Database.
Quantitative analysis
Countries can choose to collect additional survey data on respondents’ characteristics to control for their effect on survey results. This may include information on income, direct experience with regulation and general trust in government. It is then possible to use quantitative methods to analyse to what extent answers to regulatory questions depend on these characteristics.
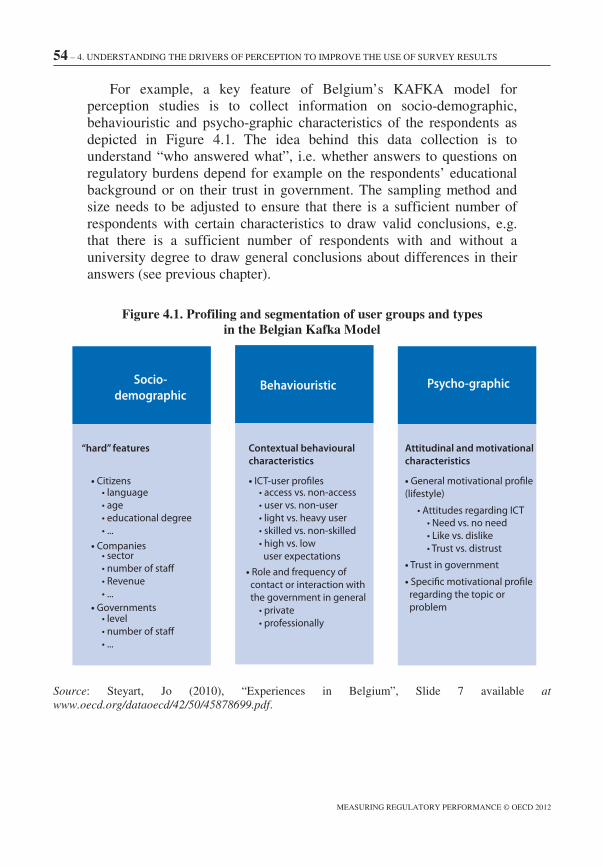
54 – 4. UNDERSTANDING THE DRIVERS OF PERCEPTION TO IMPROVE THE USE OF SURVEY RESULTS
MEASURING REGULATORY PERFORMANCE © OECD 2012
For example, a key feature of Belgium’s KAFKA model for perception studies is to collect information on socio-demographic, behaviouristic and psycho-graphic characteristics of the respondents as depicted in Figure 4.1. The idea behind this data collection is to understand “who answered what”, i.e. whether answers to questions on regulatory burdens depend for example on the respondents’ educational background or on their trust in government. The sampling method and size needs to be adjusted to ensure that there is a sufficient number of respondents with certain characteristics to draw valid conclusions, e.g. that there is a sufficient number of respondents with and without a university degree to draw general conclusions about differences in their answers (see previous chapter).
Figure 4.1. Profiling and segmentation of user groups and types in the Belgian Kafka Model
Socio-demographic
Behaviouristic Psycho-graphic
“hard” features Contextual behavioural characteristics
Attitudinal and motivationalcharacteristics
• Citizens• language• age• educational degree• ...
• Companies• sector• number of staff• Revenue• ...
• Governments• level• number of staff• ...
• ICT-user profiles
• Role and frequency of contact or interaction with the government in general
• access vs. non-access• user vs. non-user• light vs. heavy user• skilled vs. non-skilled• high vs. low user expectations
• private• professionally
• General motivational profile (lifestyle)
• Attitudes regarding ICT• Need vs. no need• Like vs. dislike• Trust vs. distrust
• Trust in government
• Specific motivational profile regarding the topic or problem
Source: Steyart, Jo (2010), “Experiences in Belgium”, Slide 7 available atwww.oecd.org/dataoecd/42/50/45878699.pdf.

4. UNDERSTANDING THE DRIVERS OF PERCEPTION TO IMPROVE THE USE OF SURVEY RESULTS – 55
MEASURING REGULATORY PERFORMANCE © OECD 2012
Conclusion
Perceptions, and hence survey results, are shaped by many factors, of which the actual quality of regulations is only one. For example, perceptions of the quality of regulations can be influenced by trust in government, the current economic situation, experience with front-line service, prior expectations and the content of government (and general media) communication. It is therefore necessary to look beneath survey results. In-depth questions and selected qualitative research techniques such as focus groups, case studies and in-depth interviews can prove very valuable in bringing to light the reasons for the results and drawing concrete policy conclusions from survey results.


5. POLICY LESSONS FOR THE USE OF PERCEPTION SURVEYS – 57
MEASURING REGULATORY PERFORMANCE © OECD 2012
Chapter 5Policy Lessons for the Use of Perception Surveys for Evaluation, Diagnosis and Communication
This chapter discusses the strategies used by OECD countries in order to benefit the most from stakeholder surveys for evaluative and diagnostic purposes (Section 1) and to better communicate reforms (Section 2). It provides policy makers with policy lessons to address the complexity of perceptions and the risks entailed in the interpretation, use andcommunication of survey results.

58 – 5. POLICY LESSONS FOR THE USE OF PERCEPTION SURVEYS
MEASURING REGULATORY PERFORMANCE © OECD 2012
Using perception surveys in regulatory policy evaluation and design
Many OECD countries run perception surveys to evaluate or inform the design of regulatory policies. In Canada, for example, the results of the survey on regulatory compliance costs are intended to help determine whether efficiency measures introduced by government are helping business save time and money and have made it easier to deal with administrative forms. In the Netherlands, the micro and macro perception surveys serve to find the answer to the question: “Are we doing the right things, and are we doing the things right?” (Atkinson and Van der Zwet, 2010, Slide 8).
However, governments cannot rely exclusively on survey results to benchmark the performance of their regulatory policy. The reason is the complexity of perceptions discussed in the last chapter: many factors can cause changes over time that are independent of changes in regulatory reform policies. In line with this, most countries involved in the OECD’s work on perception surveys did not report a clearly defined standard process of using the results. Commonly, results were reported to be circulated as part of high-level reports for discussion, but it was not clear to what extent the results influence policy actions compared with other information available to government.
While there is no systematic evidence on the actual use and impact of the results of perception surveys, three policy lessons for the use of such surveys are particularly worth emphasizing. These are based on the experiences and insights of OECD officials and academic experts as reported at the 2010 OECD workshop on perception surveys in Istanbul:
Policy lesson 1: It is necessary to look beneath survey results.
Perceptions and hence survey results are shaped by many factors. Thus, before drawing any concrete policy conclusions, it is necessary to look beneath a survey’s results in order to understand what factors are driving them. For example, two countries may run an identical survey and findings may indicate in both countries that businesses perceive an increase in administrative burdens. The identical survey results in both countries do not necessarily mean that the reasons for this perceived increase in burdens are identical. For example, in one country the negative survey results might be due to negative experiences with front-line service staff and public authorities in charge of regulatory matters, while in the other country a degradation of the economic climate led people to answer negatively. In-depth questions and qualitative research

5. POLICY LESSONS FOR THE USE OF PERCEPTION SURVEYS – 59
MEASURING REGULATORY PERFORMANCE © OECD 2012
methods prove very valuable in bringing to light the reasons for the results and drawing concrete policy conclusions.
Policy lesson 2: A comprehensive evaluation system will include different types of indicators, each revealing different information for policy evaluation.
A combination of different evaluation tools brings different pieces to the performance puzzle, as every evaluation tool has its strengths and limitations. Discrepancies in results can show the need for deeper analysis to evaluate and inform policies. For example, in many countries surveys have tended to reveal negative perceptions of the quality of regulations while in contrast more facts-based measurements have shown an improvement. As discussed in Chapter 1, this appears to apply, particularly with respect to programmes targeted at reducing administrative burdens. Table 2 illustrates this gap with an example from Sweden where the areas identified as most burdensome by the Standard Cost Model (SCM) were different from those identified as burdensome by businesses in a perception survey.
Table 5.1. Results of the regulation barometer and the SCM measurement in Sweden
Most costly areas according to SCM measurements
Most burdensome areas according to NNR Members
1. Company Law 1. Environmental Law2. Accountancy 2. Health and Safety Legislation3. Food Safety 3. Labour Law4. Planning Law 4. Statutory Audits5. Tax regulations 5. Tax regulations6. Labour law 6. VAT7. Consumer and Product Safety 7. Statutory action plans for
equality8. Environmental Law 8. Statistics and providing
information to government
Source: Hedström, Jens (2010), “Measuring Progress in Regulatory Reform”, presented at the OECD Workshop on Measuring Progress in Regulatory Reform: Perception Surveys, 21-22 June, Slide 4, available at www.oecd.org/dataoecd/13/53/45604673.pdf.

60 – 5. POLICY LESSONS FOR THE USE OF PERCEPTION SURVEYS
MEASURING REGULATORY PERFORMANCE © OECD 2012
Along with qualitative research methods, stakeholder consultation can help to understand the discrepancies between the results on different evaluative tools and to inform reforms accordingly. For example, it might be worth testing different explanations for the gap between the SCM and the perception measurement, such as the relatively small role administrative burdens play in compliance costs or the persistence of irritation costs.
Policy lesson 3: Irritation costs and negative front-line service experiences seem to explain a significant degree of business and citizen’s dissatisfaction with regulation.
Lessons learned from perception studies conducted in a number of OECD countries participating in the workshop in Istanbul 2010 seemed to suggest that irritation costs and negative front-line service experience explain a significant degree of business and citizen’s dissatisfaction. Often, this can be to a greater extent than is suggested by the measurable costs of administrative burdens. Some OECD countries therefore focus on policy actions that reduce irritation costs. Of course the reasons for the same survey results can differ significantly across countries, and irritation costs may not be responsible for bad survey results in all OECD countries. Governments are therefore well advised to first understand the reasons for the results before designing appropriate policy responses (see Chapters 2, 3 and 4).
Using perception surveys for communication with stakeholders
Perception surveys can be an integral part of a two-way communication strategy with stakeholders. First, they can help to evaluate the success of the government’s communication strategy by assessing the level of awareness of recent initiatives among stakeholders. Second, perception surveys can serve as a means to communicate stakeholder views on regulatory reform to the government and a discussion of the results can lead to fruitful exchanges between government and stakeholders on the case for regulatory reform.

5. POLICY LESSONS FOR THE USE OF PERCEPTION SURVEYS – 61
MEASURING REGULATORY PERFORMANCE © OECD 2012
Communicating regulatory reform to stakeholders
Perception surveys can provide information about stakeholders’ awareness of regulatory reform programmes, of their awareness of changes in particular regulations and of their awareness of costs and benefits of regulations. This means that they provide important information about the effectiveness of the government’s communication strategy. For example, the Dutch Macro Business Sentiment Monitor asks: “Are you familiar with the government’s intention to reduce the number of laws and regulations and the resulting obligations?” and the Swedish Regulation Barometer asks: “Are you aware of the Government’s better regulation programme?”
Stakeholder awareness is crucial for regulatory reform to succeed: limited awareness of changes in regulation may lead to low levels of compliance with the new regulations. Similarly, a low level of awareness of a government’s regulatory reform programme may lead to limited support for it. If stakeholders are only aware of the costs of regulations to them and not of the costs and benefits for the society as a whole, they may not support a growth and welfare enhancing regulatory policy.
Box 5.1 lists a number of lessons learned in Denmark, the Netherlands and the United Kingdom to successfully communicate regulatory reform to businesses, and hence to raise awareness of government initiatives and to improve perceptions of regulatory reform through better communication.
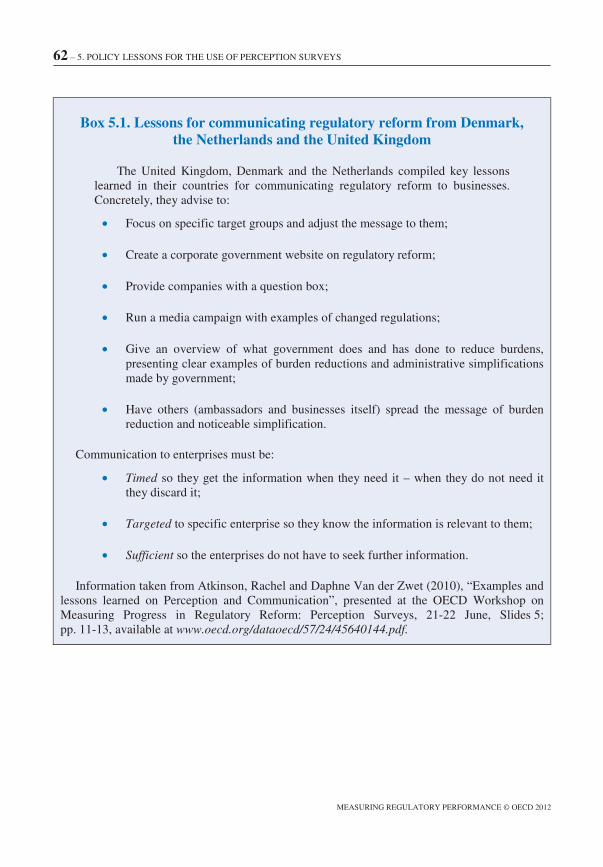
62 – 5. POLICY LESSONS FOR THE USE OF PERCEPTION SURVEYS
MEASURING REGULATORY PERFORMANCE © OECD 2012
Box 5.1. Lessons for communicating regulatory reform from Denmark, the Netherlands and the United Kingdom
The United Kingdom, Denmark and the Netherlands compiled key lessons learned in their countries for communicating regulatory reform to businesses. Concretely, they advise to:
• Focus on specific target groups and adjust the message to them;
• Create a corporate government website on regulatory reform;
• Provide companies with a question box;
• Run a media campaign with examples of changed regulations;
• Give an overview of what government does and has done to reduce burdens, presenting clear examples of burden reductions and administrative simplifications made by government;
• Have others (ambassadors and businesses itself) spread the message of burden reduction and noticeable simplification.
Communication to enterprises must be:
• Timed so they get the information when they need it – when they do not need it they discard it;
• Targeted to specific enterprise so they know the information is relevant to them;
• Sufficient so the enterprises do not have to seek further information.
Information taken from Atkinson, Rachel and Daphne Van der Zwet (2010), “Examples and lessons learned on Perception and Communication”, presented at the OECD Workshop on Measuring Progress in Regulatory Reform: Perception Surveys, 21-22 June, Slides 5; pp. 11-13, available at www.oecd.org/dataoecd/57/24/45640144.pdf.

5. POLICY LESSONS FOR THE USE OF PERCEPTION SURVEYS – 63
MEASURING REGULATORY PERFORMANCE © OECD 2012
Engaging in a dialogue and learning from business and citizens
A good communications strategy is not limited to a public relation strategy. Stakeholders are not just passive receivers of government communication. Rather, their knowledge and support is crucial to a successful regulatory reform design and implementation. A good comprehensive communication strategy is a two-way strategy, involving stakeholders at every step of the regulatory reform cycle (see Box 5.2). This can include the use of perception surveys to systematically gather stakeholder feedback. Governments can also discuss the results of perception surveys with business and consumer representatives to understand what is behind the results, to identify what really bothers stakeholders, and to define priority areas for future reforms. For example, the government in Belgium discusses the results of the biannual survey on administrative burdens with businesses involved in the project.
Box 5.2. A two-way communication strategy: Involving businesses
The United Kingdom, Denmark and the Netherlands identified concrete actions that foster co-operation with business and help gather information and feedback from business on the case of regulatory reform:
• Involve stakeholders in an early stage of regulatory reform, for example by organising working panels to identify key issues for businesses;
• Listen to their stories and give feedback on what has been done to solve their problems;
• Have a complaint website; use one sender. For example, in the Netherlands, businesses are referred to the website answersforbusiness.nl;
• Work together with branch organisations like the Federation of Small and Medium-sized enterprises;
• Measure perceptions of businesses.
Information taken from Atkinson, Rachel and Daphne Van der Zwet (2010), “Examples and lessons learned on Perception and Communication”, presented at the OECD Workshop on Measuring Progress in Regulatory Reform: Perception Surveys, 21-22 June, Slides 11-13, available at www.oecd.org/dataoecd/57/24/45640144.pdf.

64 – 5. POLICY LESSONS FOR THE USE OF PERCEPTION SURVEYS
MEASURING REGULATORY PERFORMANCE © OECD 2012
Communicating results to stakeholders usually implies making results publicly available. Many countries do publish the results (see Table A.1 in the Annex). Some use results only for internal discussions and other governments publish them widely when they are positive.
Publishing results has the advantage of enhancing transparency and accountability, and to make a public debate possible. Some risks associated with publication are that results might be easily misinterpreted and that media may report results without taking into account the complexity of the perceptions driving those results. Survey results might be used by governments, the opposition and civil society to demonstrate the effectiveness of certain policies, criticise the government or to lobby for reforms, depending on the political agenda of those interested in the surveys. Systematic evidence on the use of perception data by different groups across a number of OECD countries is not available.
Lessons learned in some OECD countries to address these risks suggest that:
• Governments should publish the results of perception surveys along with the insights gained from qualitative studies on the factors underlying the results, the methodology used and data from other sources and indicators on the same topic.
• The design of the survey should be neutral, i.e. surveys should not be designed to support electoral voting intentions, political party preferences or ratings of the performance of a political party or its leaders (Turcotte, 2010).

5. POLICY LESSONS FOR THE USE OF PERCEPTION SURVEYS – 65
MEASURING REGULATORY PERFORMANCE © OECD 2012
Conclusion
Perception surveys are used for i) regulatory policy evaluation and design and for ii) communication. First, they evaluate the success of regulatory reform programmes from a user’s perspective and serve as a diagnostic tool, to identify areas of concern to business and citizens to inform future regulatory reforms. Perception surveys, while useful, have their limitations. Experience suggests that there is likely to be a disparity between the perceived quality of regulations as reported by business and citizens and the measurable results of regulations. For example, in many countries surveys have tended to reveal negative perceptions of the quality of regulations while in contrast more fact-based measurements have shown an improvement. This appears to apply in particular with programmes targeted at reducing administrative burdens. A comprehensive evaluation system will therefore include different types of indicators, each revealing different information for policy evaluation. Discrepancies in results can highlight the need for deeper analysis to evaluate and inform policies.
Perception surveys are also an integral part of a two-way communication strategy with stakeholders. They can serve as a means to communicate stakeholder views to the government, and as a basis for discussion that can lead to fruitful exchanges between government and stakeholders on the case for regulatory reform. Survey results can also help to evaluate the success of the government’s communication strategy by assessing stakeholders’ level of awareness of recent initiatives.


BIBLIOGRAPHY – 67
MEASURING REGULATORY PERFORMANCE © OECD 2012
Bibliography
Board of Swedish Industry and Commerce for Better Regulation (2010), “Regulation Indicator 2009: A Business View of the Swedish Government’s Better Regulation Programme”, available at www.nnr.se/assets/files/publikationer/NNR_Regulation_Indicator_2009.pdf.
Canadian Federation of Independent Business (2010), “Prosperity restricted by red tape”, Toronto.
Cosh, Andy and Eric Wood (1998), “Innovation: Scale, Objectives and Constraints”, in: Andy Cosh and Alan Hughes (eds.), Enterprise Britain. Growth, Innovation and Public Policy in the Small and Medium-sized Enterprise Sector, 1994-1997, Cambridge: University of Cambridge.
De Leeuw, Edith D., Joop J. Hox and Don A. Dillman (eds.) (2008), The international handbook of survey methodology, Mahwah, NJ, Lawrence Erlbaum.
DeMaio, Theresa J. and Jennifer M. Rothgeb (1995), “Cognitive interviewing techniques-in the lab and in the field”, in: Norbert Schwarz and Seymour Sudman (eds.), Answering questions, San Francisco, CA: Jossey-Bass, pp. 177-196.
European Commission (2009), “Action Programme for Reducing Administrative Burdens in the EU”, Communication from the Commission to the Council and the European Parliament, COM (2009), 544 final, European Commission, Brussels.
Fern, Edward F. (2001), Advanced Focus Group Research, Thousand Oaks, CA: Sage.
Fowler, Floyd J., Jr. (2009), Survey Research Methods, 4th Edition, Thousand Oaks, CA: Sage.
Fowler, Floyd J., Jr. (1995), Improving Survey Questions: Design and Evaluation. Thousand Oaks, CA: Sage.

68 – BIBLIOGRAPHY
MEASURING REGULATORY PERFORMANCE © OECD 2012
Fowler, Floyd J., Jr. and Carol Cosenza (2008), “Writing effective survey questions”, in: Edith D. De Leeuw, Joop J. Hox and Don A. Dillman (eds.) (2008), The international handbook of survey methodology,Mahwah, NJ: Lawrence Erlbaum, pp. 136-160.
Fowler, Floyd J., Jr. and Thomas W. Mangione (1990), Standardized surveyinterviewing. Minimizing interviewer-related error, Newbury Park, CA: Sage.
FreshMinds (2009), “The Benefits of Regulation: a public and business perceptions study”, commissioned by the Better Regulation Executive, the Environment Agency, the Food Standards Agency, and the Health and Safety Executive, London.
Goddard, Maria (2003), “Regulation of Health Care Markets”, Journal of Health Services Research and Policy, Vol. 8, No. 4, pp. 194-196.
Groves, Robert M. et al. (2001), Survey Nonresponse (Wiley Series in Survey Methodology), Chichester, England: John Wiley and Sons, Ltd.
Harkness, Janet A., Michael Braun, Brad Edwards, Timothy P. Johnson, Lars E. Lyberg, Peter Ph. Mohler, Beth-Ellen Pennell, and Tom W. Smith (eds.) (2010), Survey Methods in Multicultural, Multinational, and Multiregional Contexts, Hoboken, NJ: John Wiley & Sons.
Iarossi, Giuseppe (2006), The Power of Survey Design: A User's Guide for Managing Surveys, Interpreting Results, and Influencing Respondents,Washington, D.C., World Bank Publications.
International Statistical Institute (2003), The Oxford Dictionary of Statistical Terms, edited by Yadolah Dodge, New York, NY: Oxford University Press.
IPSOS Eureka Social Research Institute, “Business Perceptions Survey”, wave 15, available at www.ato.gov.au/content/ downloads/cor00217335BPSwave15.pdf.
IPSOS MORI Social Research Institute (2003), “Trust in Public Institutions Survey”, available at www.ipsos-mori.com/DownloadPublication/ 1180_sri_trust_in_public_institutions_2003.pdf.
Kitching, John (2006), “A burden on business? Reviewing the evidence base on regulation and small-business performance”, Kingston University Research Repository.

BIBLIOGRAPHY – 69
MEASURING REGULATORY PERFORMANCE © OECD 2012
KPMG LLP (2008), “Summary Tables and Graphs of the Business New Zealand – KPMG Compliance Cost Survey”, available at www.businessnz.org.nz/file/1639/Compliance%20Cost%20Summary%20Tables%20and%20Graphs%202008.pdf.
Lohr, Sharon (2010), Sampling: Design and Analysis, 2nd edition, Boston, MA: Brooks/Cole.
Marsden, Peter and James Wright (2010), Handbook of Survey Research, 2nd
edition, Bingley: Emerald.
McKinsey & Company (2007), “Sustaining New York’s and the US’ Global Financial Services Leadership”, commissioned by NY Mayor Michael Bloomberg and US Senator Charles Schumer, available at www.nyc.gov/html/om/pdf/ny_report_final.pdf.
MindLab (2007), “The Burden-Hunter technique: A user-centric approach to cutting red tape”, available at www.mind-lab.dk/assets/344/The_burden-hunting_technique.pdf.
Morgan, David L. (1998), The Focus Group Guidebook, Thousand Oaks, CA: Sage.
Morgan, David L. (1993), Successful Focus Groups: Advancing the State of the Art, Newbury Park, CA: Sage.
OECD (2010), Why is Administrative Simplification so Complicated: Looking Beyond 2010, OECD, Paris.
Office of the Deputy Prime Minister, UK Cabinet (2002), “Meta-Evaluation of the Local Government Modernisation Agenda: Progress Report on Public Confidence in Local Government”, available at www.communities.gov.uk/documents/localgovernment/pdf/142919.pdf.
Pearson, Robert W. (2010), Statistical Persuasion: How to Collect, Analyze, and Present Data… Accurately, Honestly, and Persuasively, Thousand Oaks, CA: Sage.
Rasinski, Kenneth A. (1989), “The Effect of Question Wording on Public Support for Government Spending”, Public Opinion Quarterly, Vol. 53, No. 3, pp. 388-394.
Rubin, Herbert J. and Irene S. Rubin (2005), Qualitative Interviewing: The Art of Hearing Data, 2nd edition, Thousand Oaks, CA: Sage.
Tourangeau, Roger, Lance J. Rips and Kenneth Rasinski (2000), The Psychology of Survey Response, New York, NY: Cambridge University Press.

70 – BIBLIOGRAPHY
MEASURING REGULATORY PERFORMANCE © OECD 2012
UK Department for Business Innovation & Skills (2009), “Better Regulation, Better Benefits: Getting the Balance Right: Main Report”, commissioned by the Better Regulation Executive, London, available at www.bis.gov.uk/policies/better-regulation/benefits/better-benefits.
Van de Walle, Steven and G. Bouckaert (2003), “Public service performance and trust in government: the problem of causality”, International Journal of Public Administration, Vol. 29 (8 & 9), pp. 891-913.
Van de Walle, Steven and Gregg G. Van Ryzin (2011), “The order of questions in a survey on citizen satisfaction with public services: lessons from a split-ballot experiment”, in Public Administration.
Wallgren, Anders, Britt Wallgren, Rolf Persson, Ulf Jorner, Jan-Aage Haaland (1996), Graphing Statistics & Data, Thousand Oaks, CA: Sage.
Weiss, Robert S. (1994), Learning from Strangers. The Art and Method of Qualitative Interview Studies, New York, NY: Free Press.
Yin, Robert K. (2009), Case Study Research. Design and Methods,London: Sage.
OECD workshop (Istanbul 2010) presentations
Atkinson, Rachel and Daphne Van der Zwet (2010), “Examples and lessons learned on Perception and Communication”, presented at the OECD Workshop on Measuring Progress in Regulatory Reform: Perception Surveys, 21-22 June, available at www.oecd.org/dataoecd/57/24/45640144.pdf.
Hedström, Jens (2010), “Measuring Progress in Regulatory Reform”, presented at the OECD Workshop on Measuring Progress in Regulatory Reform: Perception Surveys, 21-22 June, available at www.oecd.org/dataoecd/13/53/45604673.pdf.
Kwon, Young Sang and Shin Kim (2010), “Regulatory Reform Satisfaction Survey: Method and Result”, presented at the OECD Workshop on Measuring Progress in Regulatory Reform: Perception Surveys, 21-22 June.
Russo, Hazel (2010), “The Benefits of Regulation: A public and business perceptions survey”, presented at the OECD Workshop on Measuring Progress in Regulatory Reform: Perception Surveys, 21-22 June, available at www.oecd.org/dataoecd/13/52/45604735.pdf.

BIBLIOGRAPHY – 71
MEASURING REGULATORY PERFORMANCE © OECD 2012
Schippers, Herman (2010), “Perception of regulation reduction: Interpretation of survey results”, presented at the OECD Workshop on Measuring Progress in Regulatory Reform: Perception Surveys, 21-22 June, available at www.oecd.org/dataoecd/13/55/45604565.pdf.
Skinner, Gideon (2010), “Measuring Public Opinion: Perceptions, Pitfalls, and Reality”, presented at the OECD Workshop on Measuring Progress in Regulatory Reform: Perception Surveys, 21-22 June, available at www.oecd.org/dataoecd/13/51/45604777.pdf.
Steyaert, Jo (2010), “Session 1: Experiences in Belgium”, presented at the OECD Workshop on Measuring Progress in Regulatory Reform: Perception Surveys, 21-22 June, available at www.oecd.org/dataoecd/42/50/45878699.pdf.
Thomsen, Carlo (2010), “Regulatory performance indicators”, presented at the OECD Workshop on Measuring Progress in Regulatory Reform: Perception Surveys, 21-22 June, available at www.oecd.org/dataoecd/57/47/45640153.pdf.
Turcotte, Benoit (2010), “Opinion Surveys and Regulatory Initiatives”, presented at the OECD Workshop on Measuring Progress in Regulatory Reform: Perception Surveys, 21-22 June, available at www.oecd.org/dataoecd/8/39/45625939.pdf.
Turcotte, Benoit (2010), “Regulatory Performance indicators”, presented at the OECD Workshop on Measuring Progress in Regulatory Reform: Perception Surveys, 21-22 June, Slide 4, available at www.oecd.org/dataoecd/7/63/45625965.pdf.
Van de Walle, Steven (2010), “Measuring citizens’ perception of the public sector”, presented at the OECD Workshop on Measuring Progress in Regulatory Reform: Perception Surveys, 21-22 June, available at www.oecd.org/dataoecd/13/51/45800862.pdf.
Wissing Jensen, Jørgen (2010), “The Burden-Hunter technique: A user-centric approach to cutting red tape”, presented at the OECD Workshop on Measuring Progress in Regulatory Reform: Perception Surveys, 21-22 June, available at www.oecd.org/dataoecd/56/58/45641644.pdf.


GLOSSARY – 73
MEASURING REGULATORY PERFORMANCE © OECD 2012
Glossary
Administrative burdens/costs
The costs involved in obtaining, reading and understanding regulations, developing compliance strategies and meeting mandated reporting requirements, including data collection, processing, reporting and storage, but not including the capital costs of measures taken to comply with the regulations (see compliance costs), the general economic costs, or the costs to the public sector of administering the regulations.
Compliance costs
“All the costs of complying with regulation, with the exception of direct financial costs [e.g. administrative charges or taxes] and long-term structural consequences” (Standard Cost Model Network, 2005, p. 6). Compliance costs can be divided into “substantive compliance costs” (e.g. the costs of new machinery that has been bought to comply with new environmental standards) and “administrative costs” (e.g. the costs for reporting the installation of this new machinery to the administration).
Focus group
An interviewing technique whereby respondents are interviewed in a group setting.
Irritation (costs)
An individual’s sense of hassle or irritation.
Non-respondents
All individuals or businesses from a sample that do not provide responses to a survey.

74 – GLOSSARY
MEASURING REGULATORY PERFORMANCE © OECD 2012
Question priming
“Priming occurs when prior items (primes) in a questionnaire affect subsequent items” (Van de Walle / Van Ryzin, 2011, p. 2). This means that previous questions affect responses to subsequent questions. For a concrete example, see Box 2.1.
Regulatory reform
Changes in the capacity of institutions and systems for regulatory management that improve regulatory quality, that is, enhance the performance, cost-effectiveness, or legal quality of regulation and formalities.
The term is also associated with measures targeted at a specific sector with a view to improve economic performance.
Sample
“A subset of a [target] population” (Lohr 2010, p. 3). Here synonymous with the people receiving the survey.
Sample size
“The number of sampling units which are to be included in the sample” (International Statistical Institute, 2003, p. 358). Here synonymous with the number of people receiving the survey.
Sampling error
“The error that results from taking one sample instead of examining the whole [target] population” (Lohr, 2010, p. 16).
Screening question
Questions asked in different ways in order to identify consistent respondents and meaningful responses.
Target population
“The complete collection of observations we want to study” (Lohr, 2010, p. 3). Here synonymous with the group(s) of people or businesses we would like to know more about.

ANNEX: OVERVIEW TABLE ON PERCEPTION SURVEYS– 75
MEASURING REGULATORY PERFORMANCE © OECD 2012
AnnexOverview Table on Perception Surveys
Table A.1 provides an overview of the focus, purpose, target population and methodology used in 21 perception surveys in the regulatory field conducted in 14 OECD countries. It draws on information provided by OECD member country officials in 2010 on perception surveys in their countries. Table A.2 (available online at www.oecd.org/regreform/measuringperformance) provides more detailed information including survey questions, key findings and some information on the policy use of the results.
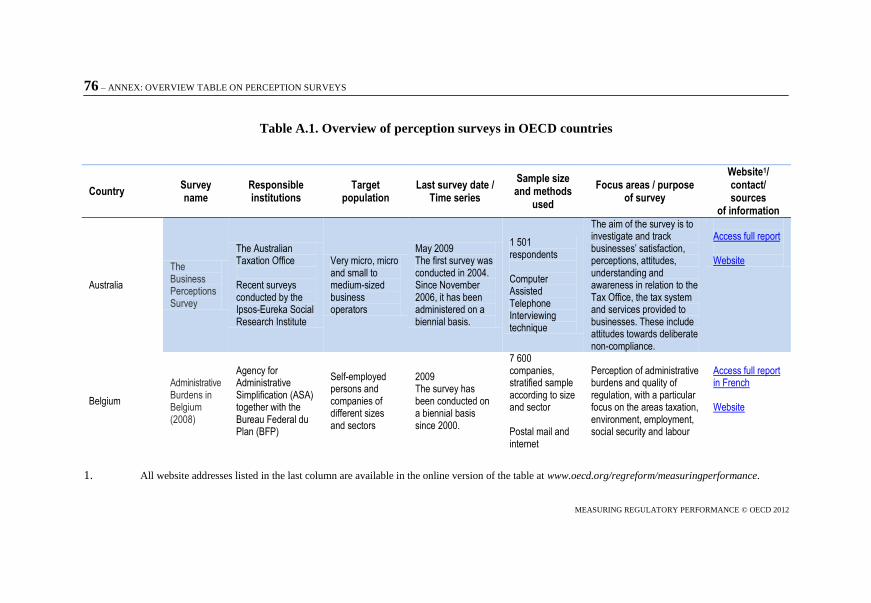
76 – ANNEX: OVERVIEW TABLE ON PERCEPTION SURVEYS
MEASURING REGULATORY PERFORMANCE © OECD 2012
Table A.1. Overview of perception surveys in OECD countries
Country Survey name
Responsible institutions
Target population
Last survey date / Time series
Sample size and methods
used
Focus areas / purpose of survey
Website1/ contact/ sources
of information
Australia
The Business Perceptions Survey
The Australian Taxation Office Recent surveys conducted by the Ipsos-Eureka Social Research Institute
Very micro, micro and small to medium-sized business operators
May 2009 The first survey was conducted in 2004. Since November 2006, it has been administered on a biennial basis.
1 501 respondents Computer Assisted Telephone Interviewing technique
The aim of the survey is to investigate and track businesses‟ satisfaction, perceptions, attitudes, understanding and awareness in relation to the Tax Office, the tax system and services provided to businesses. These include attitudes towards deliberate non-compliance.
Access full report Website
Belgium
Administrative Burdens in Belgium (2008)
Agency for Administrative Simplification (ASA) together with the Bureau Federal du Plan (BFP)
Self-employed persons and companies of different sizes and sectors
2009 The survey has been conducted on a biennial basis since 2000.
7 600 companies, stratified sample according to size and sector Postal mail and internet
Perception of administrative burdens and quality of regulation, with a particular focus on the areas taxation, environment, employment, social security and labour
Access full report in French Website
1. All website addresses listed in the last column are available in the online version of the table at www.oecd.org/regreform/measuringperformance.

ANNEX: OVERVIEW TABLE ON PERCEPTION SURVEYS – 77
MEASURING REGULATORY PERFORMANCE © OECD 2012
Country Survey name
Responsible institutions
Target population
Last survey date / Time series
Sample size and methods
used
Focus areas / purpose of survey
Website1/contact/ sources
of information
Tax-on-web satisfaction survey
Ministry of Finance and Administrative Simplification Agency (ASA)
Citizens 2008-09 This is the first survey.
1 779 respondents, representative sample of the Belgian Internet users
Online questionnaire
The survey measures the impact of reforms to the income tax administration (Tax-on-web) to see whether or not the implementation of an online option to fill in personal taxes online had a positive influence on the administrative burden.
Information updated by the Belgian Delegation
Customer Satisfaction Survey
Federal Public Service (SPF), Ministry of Employment and Labor
Citizens, private companies, actual users (not potential users) having experienced the service recently
First survey run in 2009. Every three years
1 134 respondents
Online questionnaire and e-mail
The aim of the survey is to investigate and track satisfaction and perceptions of customers in relation to social law as well as of social regulations and services provided to mainly employers and employees by the ministry.
Information updated by the Belgian Delegation
Citizen Satisfaction Survey (AFSCA 2009)
Federal Public Service (SPF), Federal Public Planning Service (SPP), with SPF Personnel and Organisation (PO)
Citizens May 2010 This is the first survey.
6 821 respondents
Online questionnaire to a panel of citizen
Satisfaction and image
Information updated by the Belgian Delegation

78 – ANNEX: OVERVIEW TABLE ON PERCEPTION SURVEYS
MEASURING REGULATORY PERFORMANCE © OECD 2012
Country Survey name
Responsible institutions
Target population
Last survey date / Time series
Sample size and methods
used
Focus areas / purpose of survey
Website1/contact/ sources
of information
Canada
A section of supplementary perception questions included in the “Survey of Regulatory Compliance Cost”
Statistics Canada together with Industry Canada (Department of Canadian Government)
SMEs with fewer than 500 employees and gross revenues of more than CAN 30 thousand and less than CAN 50 million
2008Perception questions were included for the first time in 2008 in the regulatory compliance cost survey which is repeated every three years. The same perception questions will be asked again in the next round (2011-12)
Sample size: 32 736; 29% survey response rate 9 493 respondents
Paper mail-out and mail-back survey
Businesses’ awareness of government initiatives to reduce the cost of regulatory compliance for small businesses, whether initiatives helped save businesses time and/or money, the relative level of difficulty of administrative claims/forms compared with three years ago, and where there are areas for reform.
Access full report(Perception questions range from C1 to C5)
Cutting Red Tape, II Project (CRTP) Responses
Canadian Federation of Independent Business (CFIB) Survey
Canadian Federation of Independent Business
Businesses, particularly smaller firms
Survey conducted between November 2008 and February 2009 No time series.
10 566 respondents
The aim of the survey is to get feedback from small and medium size businesses about their perceptions of the level of administrative burdens, and the impact of burden reduction programs undertaken by the government.
Access full report

ANNEX: OVERVIEW TABLE ON PERCEPTION SURVEYS – 79
MEASURING REGULATORY PERFORMANCE © OECD 2012
Country Survey name
Responsible institutions
Target population
Last survey date / Time series
Sample size and methods
used
Focus areas / purpose of survey
Website1/contact/ sources
of information
Finland
Part of SME Barometer / Survey on the most burdensome legislative areas
Ministry of Employment and Economy in cooperation with the Federation for Finnish Enterprises and Finnvera. The survey was connected to a study conducted by the Government Institute for Economic Research.
SMEs 2008 No time series.
2 935 respondents
Internet questionnaire
Perception of the most burdensome legislative areas
CRTP Responses
Access full report in Finnish
Information updated by the Finnish Delegation
France Simplifying together
Survey commissioned by the Directorate General for State Modernization (DGME) of the Ministry for the Budget, Public Accounts, the Civil Service and State Reform
Citizens and businesses
2010 Surveys are conducted biennially. The first survey was conducted in 2008.
3 000 individuals and 1 000 enterprises
Telephone interviews
Evaluating the awareness and approval of the main measures taken by the Ministry for Budget, Public Accounts, Civil Service and State Reform, including on administrative simplification
CRTP Responses
Information updated by the French Delegation

80 – ANNEX: OVERVIEW TABLE ON PERCEPTION SURVEYS
MEASURING REGULATORY PERFORMANCE © OECD 2012
Country Survey name
Responsible institutions
Target population
Last survey date / Time series
Sample size and methods
used
Focus areas / purpose of survey
Website1/contact/ sources
of information
n.a. n.a.
Politicians, press and media leaders, and top business leaders
November 2008 408 respondents
The survey asks politicians, press and business leaders to assess the progress of administrative simplifications during the last three years
CRTP Responses
Ireland
Business Regulation Survey
The Better Regulation Unit at the Department of the Taoiseach.
The survey was conducted by the Economic and Social Research Institute
Business representatives and SMEs of various size in a range of sectors
March 2007 The previous survey was carried out in 2002.
823 respondents
Postal mail and telephone interviews
Businesses are asked about their views of regulation and which areas of regulation pose problems in terms of compliance costs, including administrative burdens.
Access full report
CRTP Responses

ANNEX: OVERVIEW TABLE ON PERCEPTION SURVEYS – 81
MEASURING REGULATORY PERFORMANCE © OECD 2012
Country Survey name
Responsible institutions
Target population
Last survey date / Time series
Sample size and methods
used
Focus areas / purpose of survey
Website1/contact/ sources
of information
Korea
Regulatory Reform Satisfaction Survey
Prime Minister’s Office
In 2009, the survey was conducted by the market research company “Research & Research”.
1.Public (Stakeholders such as Businesses and Associations, Regulatory Reform Committee (RRC) Homepage users, citizens) 2. Experts (private members of RRC, experts from related fields) 3. Internal Customer (related public officials in local gvts)
2009 Surveys have been conducted since 2005 on a yearly basis.
2 708 respondents for 2009
Interviews, mail, telephone, fax and e-mail
The aim of the survey is to measure the satisfaction level of the public and regulation experts and evaluate government agencies and implementation of regulatory reform
CRTP Responses
Presentation at London Workshop, April 3, 2009
Information updated by the Korean Delegation

82 – ANNEX: OVERVIEW TABLE ON PERCEPTION SURVEYS
MEASURING REGULATORY PERFORMANCE © OECD 2012
Country Survey name
Responsible institutions
Target population
Last survey date / Time series
Sample size and methods
used
Focus areas / purpose of survey
Website1/contact/ sources
of information
Netherlands
Perception Monitor Regulatory Burden
(Macro Business Sentiment Monitor)
Regulatory Reform Group (Ministries of Finance and Economic Affairs). The survey was conducted by the market research company ‘Stratus’.
Businesses of different size, sectors and life cycle
2010 Surveys have been conducted on an annual basis since 2008.
Responses from 1 214 businesses and an additional random sample of 210 start-up businesses. (As the results of start-ups were similar to those of free lancers, start-up companies are no longer a specific target group since 2009.)
Telephone interviews
The aim of the survey is to obtain information on whether companies notice the efforts of the burden reduction programme as well as progress made in the Regulatory Reform Group's program.
CRTP Responses
Access the full report in Dutch
Webpage
Presentation at London Workshop, April 3, 2009
Information updated by the Dutch Delegation

ANNEX: OVERVIEW TABLE ON PERCEPTION SURVEYS – 83
MEASURING REGULATORY PERFORMANCE © OECD 2012
Country Survey name
Responsible institutions
Target population
Last survey date / Time series
Sample size and methods
used
Focus areas / purpose of survey
Website1/contact/ sources
of information
Micro Business Sentiment Monitor
Regulatory Reform Group (Ministries of Finance and Economic Affairs)
The survey was conducted by the market research company ‘Deloitte’.
Businesses of different size and sectors
2010 Surveys have been conducted on an annual basis since 2009.
15 respondents
Telephone interviews and face to face interviews
The aim of the survey is to obtain information on how businesses experience relevant measures of the regulatory reform programme.
Access the full report in Dutch
Webpage
Information updated by the Dutch Delegation
New Zealand Compliance Cost Survey
Business New Zealand and KPMG (NGO)
Businesses of different size, regions and sectors
October2008 After 2009, the survey will be conducted on a biennial basis.
906 respondents
Web-based survey, with a paper copy sent upon request
The purpose of the survey is to measure compliance cost perceptions and trends over time.
Access summary report
CRTP Responses
Norway (Part of SCM survey)
The Ministry of Trade and Industry
Businesses 2009 1 000 businesses were interviewed
Precise information on how administrative burdens are perceived by businesses
CRTP Responses

84 – ANNEX: OVERVIEW TABLE ON PERCEPTION SURVEYS
MEASURING REGULATORY PERFORMANCE © OECD 2012
Country Survey name
Responsible institutions
Target population
Last survey date / Time series
Sample size and methods
used
Focus areas / purpose of survey
Website1/contact/ sources
of information
Spain Entrepreneurs Confidence Indicator
Higher Chamber of Commerce within the framework of the cooperation agreement with the Spanish Ministry of Presidency
Businesses of different sizes, from different regions and from a wide range of sectors (industry, construction, commerce, tourism and catering trade and other services)
April 2010 Surveys have been conducted since 2003 on a quarterly basis.
More than 5 000 enterprises with at least one employee, with enterprises from all parts of the country
The main aim of the survey is to measure entrepreneurs’ opinion about the recent and future evolution of the following group of factors that affect their businesses: weakness of the demand, financial difficulties, increase of competition, administrative burdens, lack of qualified staff, shortage of capacity or other factors.
Each factor is analysed by its impact in each sector mentioned above and the size of business considering their number of employees.
Access full report
Webpage
Information updated by the Spanish Delegation

ANNEX: OVERVIEW TABLE ON PERCEPTION SURVEYS – 85
MEASURING REGULATORY PERFORMANCE © OECD 2012
Country Survey name
Responsible institutions
Target population
Last survey date / Time series
Sample size and methods
used
Focus areas / purpose of survey
Website1/contact/ sources
of information
Sweden Regulation Barometer
Board of Swedish Industry and Commerce for Better Regulation (NNR)
Business leaders -proportionate to the profile of Swedish businesses in terms of size and sector.
May 2009 It was carried out for the first time in 2009. It will be conducted again in autumn 2010.
600 entrepreneurs and business leaders
Telephone interviews
The purpose is two-fold. The survey gives a picture of businesses’ perception of the Government’s better regulation programme and implemented simplification initiatives. NNR designed this survey primarily to put pressure on the Government to start evaluating the results of the better regulation programme.
Access full report
Turkey Customer Satisfaction Survey
General Directorate for Publication and Development of Legislation (GDPDL) – Prime Minister’s Office
All users of e-Legislation and the e-Official Gazette
June 2007No time series.
1 258 respondents
The purpose of the survey is to explore the satisfaction level and awareness of the two electronic systems.
Information updated by the Turkish Delegation

86 – ANNEX: OVERVIEW TABLE ON PERCEPTION SURVEYS
MEASURING REGULATORY PERFORMANCE © OECD 2012
Country Survey name
Responsible institutions
Target population
Last survey date / Time series
Sample size and methods
used
Focus areas / purpose of survey
Website1/contact/ sources
of information
United Kingdom
Business Perceptions Survey
National Audit Office (NAO)
Businesses of differing size and across a range of industry sectors
2009 The survey has been conducted on an annual basis since 2007.
2 037 respondents
Interviews by telephone
The aim of the survey is to measure perceptions of the government’s approach to regulating, what businesses find burdensome about complying with regulation as well as what is delivering a meaningful impact. Respondents were asked about one of five areas of regulation: planning, tax, health and safety, employment or company law.
Access full report
CRTP Responses
The Benefits of Regulation: A public and business perceptions study
The research was commissioned by the Better Regulation Executive, the Environment Agency, the Food Standards Agency and the Health and Safety Executive. FreshMinds conducted the survey.
Citizens and business people
October 2009 No time series.
A nationally representative sample of 1 018 respondents
Face-to-face interviews
The aim of the survey is to better understand how people experience regulation through their work and personal lives. The survey focuses on the regulation of health and safety, environmental standards, food hygiene and smoke free environments.
Access full report
1. All website addresses listed in the last column are available in the online version of the table at www.oecd.org/regreform/measuringperformance.


ORGANISATION FOR ECONOMIC CO-OPERATION AND DEVELOPMENT
The OECD is a unique forum where governments work together to address theeconomic, social and environmental challenges of globalisation. The OECD is also at theforefront of efforts to understand and to help governments respond to new developmentsand concerns, such as corporate governance, the information economy and the challenges ofan ageing population. The Organisation provides a setting where governments can comparepolicy experiences, seek answers to common problems, identify good practice and work toco-ordinate domestic and international policies.
The OECD member countries are: Australia, Austria, Belgium, Canada, Chile, theCzech Republic, Denmark, Estonia, Finland, France, Germany, Greece, Hungary, Iceland, Ireland,Israel, Italy, Japan, Korea, Luxembourg, Mexico, the Netherlands, New Zealand, Norway, Poland,Portugal, the Slovak Republic, Slovenia, Spain, Sweden, Switzerland, Turkey, the United Kingdomand the United States. The European Union takes part in the work of the OECD.
OECD Publishing disseminates widely the results of the Organisation’s statistics gatheringand research on economic, social and environmental issues, as well as the conventions,guidelines and standards agreed by its members.
OECD PUBLISHING, 2, rue André-Pascal, 75775 PARIS CEDEX 16
(42 2011 25 1 P) ISBN 978-92-64-16714-8 – No. 59761 2012

Measuring Regulatory PerformanceA PRACTITIONER’S GUIDE TO PERCEPTION SURVEYS
Please cite this publication as:
OECD (2012), Measuring Regulatory Performance: A Practitioner’s Guide to Perception Surveys, OECD Publishing.http://dx.doi.org/10.1787/9789264167179-en
This work is published on the OECD iLibrary, which gathers all OECD books, periodicals and statistical databases. Visit www.oecd-ilibrary.org, and do not hesitate to contact us for more information.
-:HSTCQE=V[\VY]:ISBN 978-92-64-16714-842 2011 25 1 P
Measuring Regulatory PerformanceA PRACTITIONER’S GUIDE TO PERCEPTION SURVEYS
This guide helps offi cials use perception surveys to evaluate and communicate the results of reform processes. While the guide draws on examples from the regulatory fi eld, it is also useful for other policy areas. In non-technical language, the guide clearly explains the challenges involved in the design and use of business and citizen perception surveys – and ways to overcome them. It also helps offi cials get the most out of survey results, whether conducted internally or by external experts.
Contents
Chapter 1. How OECD countries use perception surveys in the regulatory policy cycle
Chapter 2. Understanding pitfalls in the design of surveys
Chapter 3. Good practices in survey design step-by-step
Chapter 4. Understanding the drivers of perception to improve the use of survey results
Chapter 5. Policy lessons for the use of perception surveys for evaluation, diagnosis and communication
Related reading
Indicators of Regulatory Management Systems, 2009 Report (2009)
Regulatory Management Indicators Country Notes: Brazil, Chile, Estonia, Israel, Russia, Slovenia, South Africa (2011)
Measu
ring R
egu
latory P
erform
ance A P
RA
CT
ITIO
NE
R’S
GU
IDE
TO
PE
RC
EP
TIO
N S
UR
VE
YS
422011251Cov.indd 1 10-Jan-2012 1:58:16 PM