metalworking fluids and lubricants offer effective protection for ...08)/q0608121135.pdf ·...
TRANSCRIPT

American Journal of Engineering Research (AJER) 2017
American Journal of Engineering Research (AJER)
e-ISSN: 2320-0847 p-ISSN : 2320-0936
Volume-6, Issue-8, pp-121-135
www.ajer.org Research Paper Open Access
w w w . a j e r . o r g
Page 121
Metalworking Fluids and Lubricants Offer Effective Protection
for Processing and Shipment of Metal Based Products
Y.J.Aghazada, A.D.Quliyev, E.A.Samedov, S.E.Abdullayev, E.K.Hasanov Institute of Petrochemical Processes named after acad. Yu.G. Mamedaliyev, Azerbaijan National Academy of
Sciences, AZ1025, Azerbaijan, Baku,. Khojali ave., 30
Corresponding Author: Y.J.Aghazada
ABSTRACT: In this proceeding, the compositions of the T-30 turbine oil with oxidized liquid rubber, Co, Ni,
Zn, Mg and Ba salts of the natural petroleum acids (NPA) boiling in the range 220 – 340°C and nitro
compounds which are produced on the basis of C14H28 α-olefins have been investigated in different ratio and
contents as metalworking fluids (MWF). The physical and chemical properties of the produced compositions
have been studied, and the morphology of inhibited carbon steel surface was analyzed and characterized by
using Fourier transformer infrared (FTIR) and scanning electron microscopy (SEM) techniques. Effect of
temperature on inhibition efficiency and thermodynamic parameters have also been reported. Thermal analyzer
was used for the thermogravimetric analysis (TG/DTA) of the prepared MWF. The experiments have been
operated with different concentrations of inhibitor on the steel plates in condensation and environment phases
in the experiment chamber.
Keywords: metalworking fluids and lubricants, corrosion, oxidized liquid rubber, natural petroleum acids
----------------------------------------------------------------------------------------------------------------------------- ----------
Date of Submission: 13-07-2017 Date of acceptance: 10-08-2017
----------------------------------------------------------------------------------------------------------------------------- ----------
I. INTRODUCTION Corrosion is defined as the deterioration of a material due to reaction with its environment. Regardless
of their operation conditions, metal constructions show thermodynamically unstable state as they react with the
aggressive part of the environment and corrode. This harmful attack can cause defect in the mechanical,
physical and chemical properties of metal [1-3]. Therefore, protection methods should be developed to reduce
the damage effects of the metal. Inhibitors have very wide application in a variety of industrial applications such
as cooling systems, refinery units, pipelines, chemicals, oil and gas production units, boilers and water
processing, paints, pigments, lubricants, etc. [4-8]. Organic inhibitors are very effective way for the reducing of
corrosion of metals and alloys due to generate a thin film that controls and prevents access of corrosive agents to
the metal surface. The inhibitory effect of an organic inhibitor is reinforced by the presence of hetero adsorption
active centre such as sulphur (S), nitrogen (N) and oxygen (O) atoms in its molecule [9-11]. In addition to the
molecular electronic structure with a number of these active centres, the molecular size, the mode of adsorption,
the formation of metallic complexes, and the projected area of the inhibitor on the metallic surface also effect
the efficiency of inhibition [12-14].
In recent years, some experimental studies have been done to describe the corrosion and
electrochemical behavior of stainless steel in concrete environment [15-18]. The widespread investigation of the
inhibitors in the metalworking fluids is based on its economic efficiency and simple structure of application
technology. The addition of a small amount of an inhibiting substance to the aggressive system is enough for
protecting the metal without any changes to the current technical system [19-21]. In various manufacturing
processes, metalworking fluids (MWF) are applied to ensure workpiece quality, to reduce tool wear, and to
improve process productivity. The specific chemical composition of an applied MWF should be strongly
dependent on the scope of application. Even small changes of the MWF-composition can influence the
performance of MWF in manufacturing processes considerably. Besides defined variations of the composition,
the MWF-chemistry furthermore changes over the service life of the fluid.
The purpose of the work is to synthesize multifunctional nitrogen containing corrosion inhibitors with
different molecular masses on the basis of local feedstocks with enough reserves and to prepare high –
performance MWF by using them as additives.
American Journal of Engineering Research (AJER) 2017
w w w . a j e r . o r g
Page 122
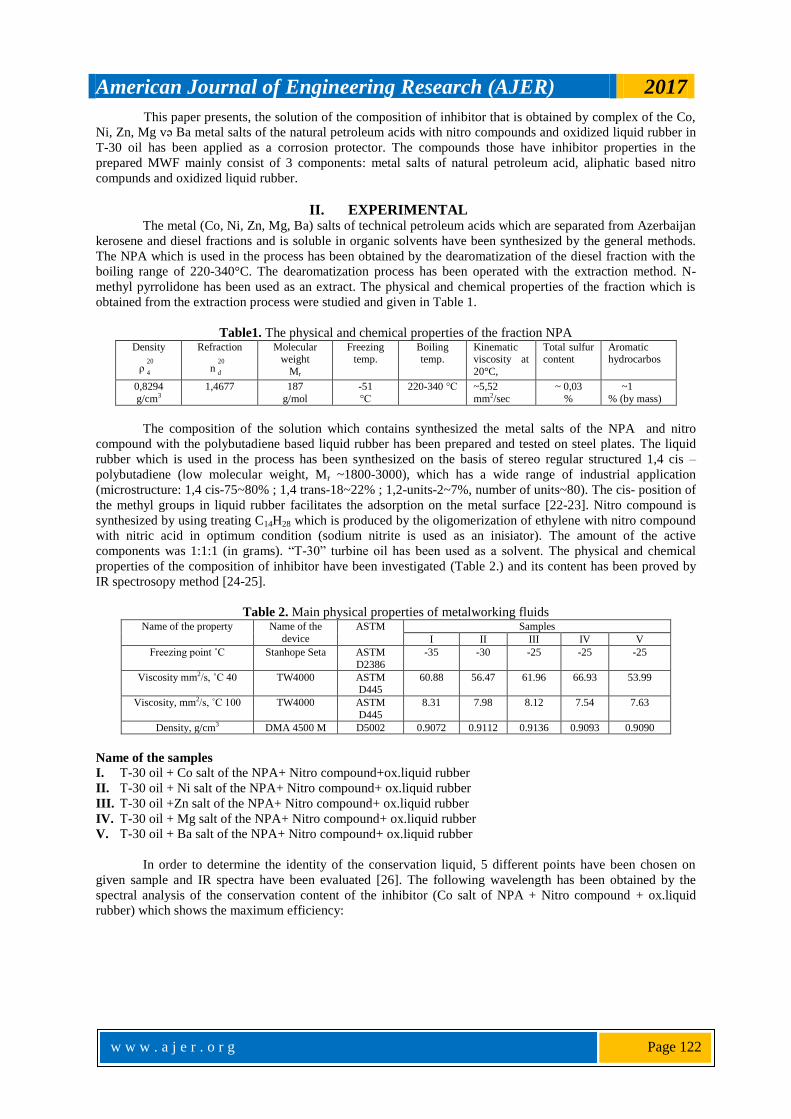
This paper presents, the solution of the composition of inhibitor that is obtained by complex of the Co,
Ni, Zn, Mg və Ba metal salts of the natural petroleum acids with nitro compounds and oxidized liquid rubber in
T-30 oil has been applied as a corrosion protector. The compounds those have inhibitor properties in the
prepared MWF mainly consist of 3 components: metal salts of natural petroleum acid, aliphatic based nitro
compunds and oxidized liquid rubber.
II. EXPERIMENTAL The metal (Co, Ni, Zn, Mg, Ba) salts of technical petroleum acids which are separated from Azerbaijan
kerosene and diesel fractions and is soluble in organic solvents have been synthesized by the general methods. The NPA which is used in the process has been obtained by the dearomatization of the diesel fraction with the
boiling range of 220-340°C. The dearomatization process has been operated with the extraction method. N-
methyl pyrrolidone has been used as an extract. The physical and chemical properties of the fraction which is
obtained from the extraction process were studied and given in Table 1.
Table1. The physical and chemical properties of the fraction NPA Density
ρ20
4
Refraction
n20
d
Molecular weight
Mr
Freezing temp.
Boiling temp.
Kinematic viscosity at
20°C,
Total sulfur content
Aromatic hydrocarbos
0,8294
g/cm3
1,4677 187
g/mol
-51
°С
220-340 °С ~5,52
mm2/sec
~ 0,03
%
~1
% (by mass)
The composition of the solution which contains synthesized the metal salts of the NPA and nitro
compound with the polybutadiene based liquid rubber has been prepared and tested on steel plates. The liquid
rubber which is used in the process has been synthesized on the basis of stereo regular structured 1,4 cis –
polybutadiene (low molecular weight, Mr ~1800-3000), which has a wide range of industrial application
(microstructure: 1,4 cis-75~80% ; 1,4 trans-18~22% ; 1,2-units-2~7%, number of units~80). The cis- position of
the methyl groups in liquid rubber facilitates the adsorption on the metal surface [22-23]. Nitro compound is
synthesized by using treating C14H28 which is produced by the oligomerization of ethylene with nitro compound
with nitric acid in optimum condition (sodium nitrite is used as an inisiator). The amount of the active
components was 1:1:1 (in grams). “T-30” turbine oil has been used as a solvent. The physical and chemical
properties of the composition of inhibitor have been investigated (Table 2.) and its content has been proved by
IR spectrosopy method [24-25].
Table 2. Main physical properties of metalworking fluids Name of the property Name of the
device
ASTM Samples
I II III IV V
Freezing point ˚C Stanhope Seta ASTM
D2386
-35 -30 -25 -25 -25
Viscosity mm2/s, ˚C 40 TW4000 ASTM D445
60.88 56.47 61.96 66.93 53.99
Viscosity, mm2/s, ˚C 100 TW4000 ASTM
D445
8.31 7.98 8.12 7.54 7.63
Density, g/cm3 DMA 4500 M D5002 0.9072 0.9112 0.9136 0.9093 0.9090
Name of the samples
I. Т-30 oil + Co salt of the NPA+ Nitro compound+ox.liquid rubber
II. Т-30 oil + Ni salt of the NPA+ Nitro compound+ ox.liquid rubber
III. Т-30 oil +Zn salt of the NPA+ Nitro compound+ ox.liquid rubber
IV. Т-30 oil + Mg salt of the NPA+ Nitro compound+ ox.liquid rubber
V. Т-30 oil + Ba salt of the NPA+ Nitro compound+ ox.liquid rubber
In order to determine the identity of the conservation liquid, 5 different points have been chosen on
given sample and IR spectra have been evaluated [26]. The following wavelength has been obtained by the
spectral analysis of the conservation content of the inhibitor (Co salt of NPA + Nitro compound + ox.liquid
rubber) which shows the maximum efficiency:

American Journal of Engineering Research (AJER) 2017
w w w . a j e r . o r g
Page 123
Fig.1.1.The microscopic view of 5 selected points in sample. Fig. 1.2 IR spectra of the 1st
point
Figure 1.3 IR spectra of the 2nd
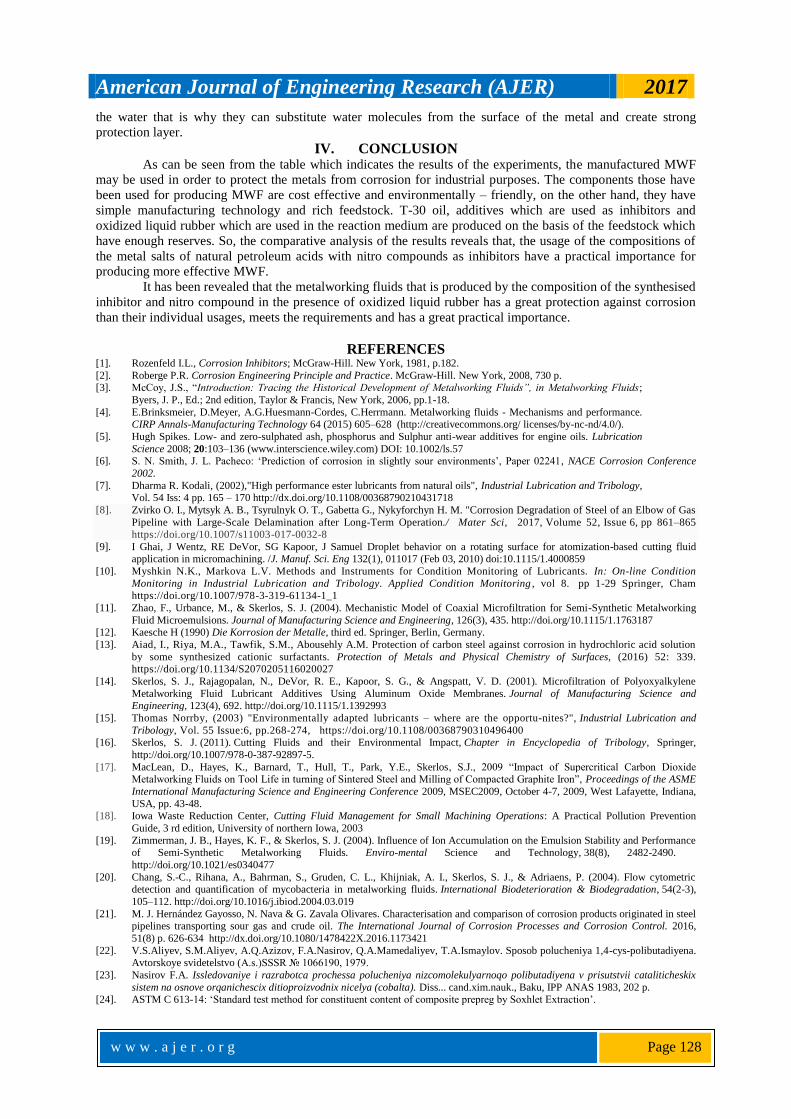
point Figure 1.4 IR spectra of the 3rd
point
Figure 1.5 IR spectra of the 4th
point. Figure 1.6 IR spectra of the 5 th
point
The content of the composition has been tested by IR-Furye LUMOS (BRUKER) microscope in the
range of 600-4000 cm-1
wavelength. The deformation (1376, 1457 cm-1
) and valence (2921, 2950 cm-1
)
oscilations of structure groups (CH3 and CH2) which belong to NPA are observed in the spectrum of the
approved sample. At the same time, the resonance signals for C – H bond and valence oscillations for C – NO2
group are seen at 723 cm-1
and 1558 cm-1
wavelength, respectively. The comparison of the IR spectrum of all 5
points on the sample shows that they are practically the same which proves that the conservation materials are
distributed on the metal surface homogeneously.
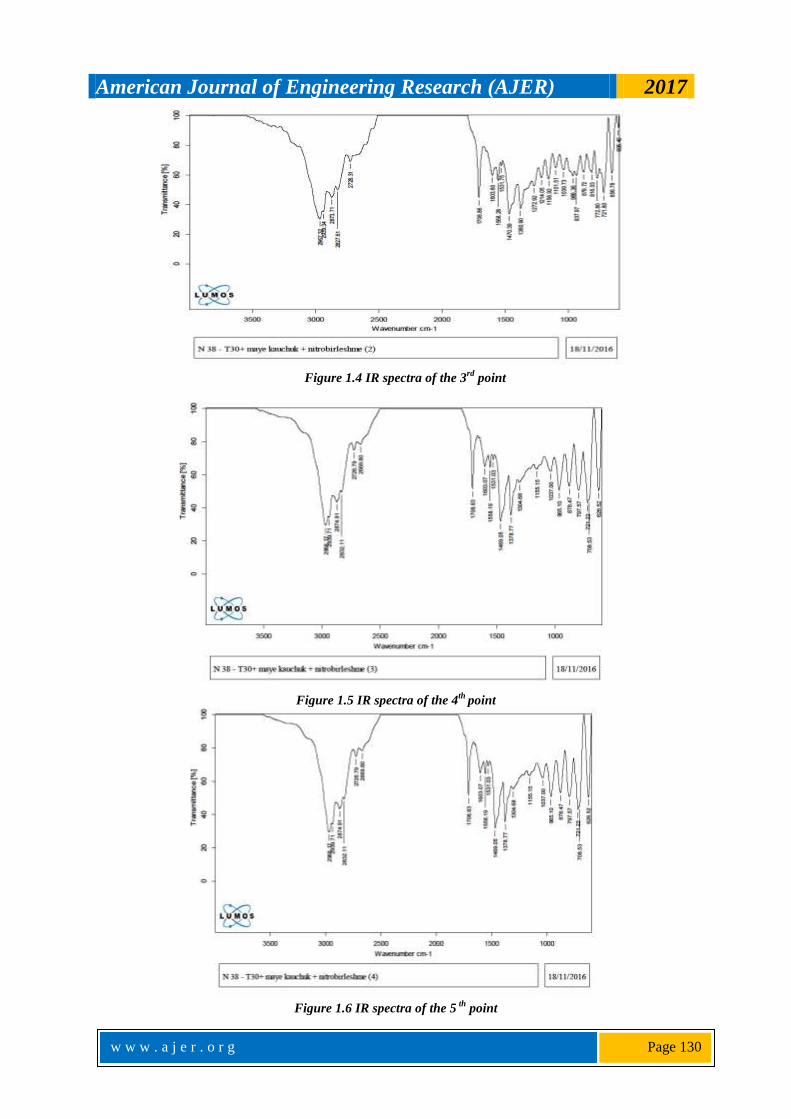
STA-449 F3, NETZSCH thermal analyzer was used for the thermogravimetric analysis (TG/DTA –
change in mass depending on the temperature and differential thermal analysis) of the prepared conservative
liquids. The processes has been operated by using nitrogen gas flow and by increasing the temperature by 20°C
per minute. The evaluation of thermal analysis of the Sample 5 (table 1) shows that there is no chemical change
in the STA (Simultaneous Thermal Analysis) curve, the peak at 360°С coincides with the complete
disintegration of the compozition. The curve for the mass loss is observed in the TG (Thermogravimetry) curve
which proves the homogeneity of the composition. The component that has less thermal stability in the studied
MWF is nitro compound. Hence, nitro compounds are decomposed at temperatures above 600°C, then amido
American Journal of Engineering Research (AJER) 2017
w w w . a j e r . o r g
Page 124
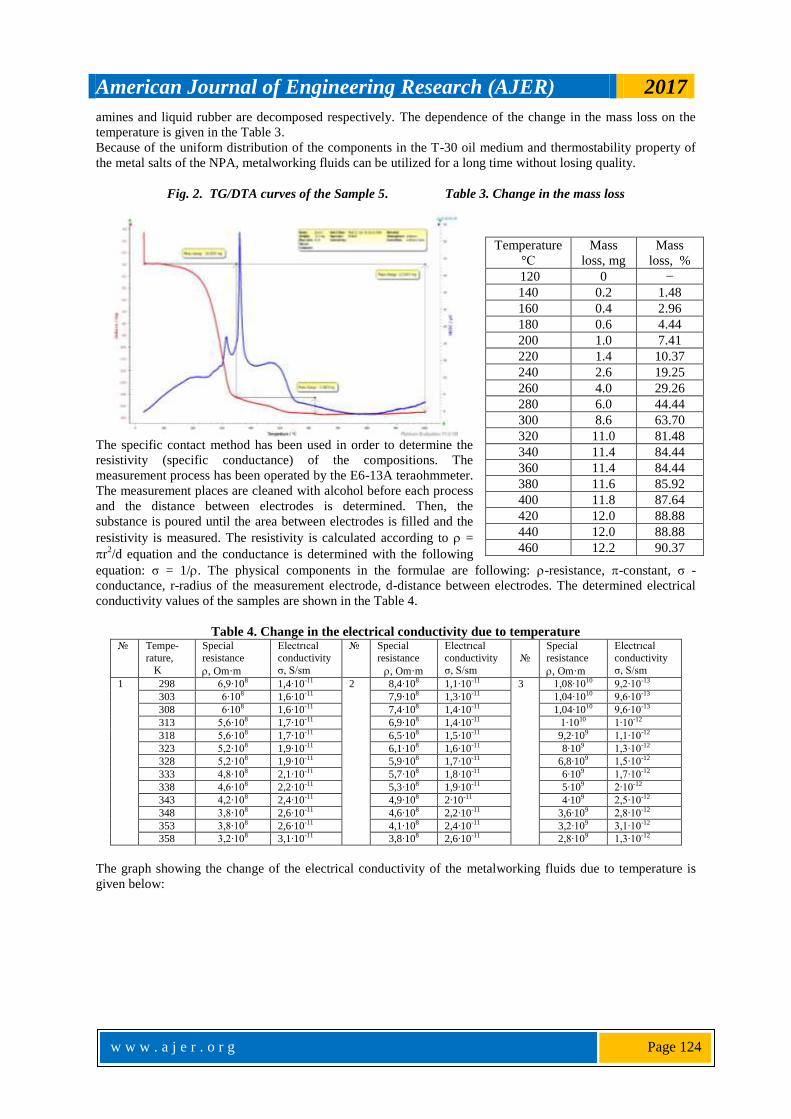
amines and liquid rubber are decomposed respectively. The dependence of the change in the mass loss on the
temperature is given in the Table 3.
Because of the uniform distribution of the components in the T-30 oil medium and thermostability property of
the metal salts of the NPA, metalworking fluids can be utilized for a long time without losing quality.
Fig. 2. TG/DTA curves of the Sample 5. Table 3. Change in the mass loss
The specific contact method has been used in order to determine the
resistivity (specific conductance) of the compositions. The
measurement process has been operated by the E6-13A teraohmmeter.
The measurement places are cleaned with alcohol before each process
and the distance between electrodes is determined. Then, the
substance is poured until the area between electrodes is filled and the
resistivity is measured. The resistivity is calculated according to =
r2/d equation and the conductance is determined with the following
equation: σ = 1/. The physical components in the formulae are following: -resistance, -constant, σ -
conductance, r-radius of the measurement electrode, d-distance between electrodes. The determined electrical
conductivity values of the samples are shown in the Table 4.
Table 4. Change in the electrical conductivity due to temperature № Tempe-
rature,
K
Special
resistance
, Om·m
Electrıcal
conductivity
σ, S/sm
№ Special
resistance
, Om·m
Electrıcal
conductivity
σ, S/sm
№
Special
resistance
, Om·m
Electrıcal
conductivity
σ, S/sm
1 298 6,9∙108 1,4∙10-11 2 8,4∙108 1,1∙10-11 3 1,08∙1010 9,2∙10-13
303 6∙108 1,6∙10-11 7,9∙108 1,3∙10-11 1,04∙1010 9,6∙10-13
308 6∙108 1,6∙10-11 7,4∙108 1,4∙10-11 1,04∙1010 9,6∙10-13
313 5,6∙108 1,7∙10-11 6,9∙108 1,4∙10-11 1∙1010 1∙10-12
318 5,6∙108 1,7∙10-11 6,5∙108 1,5∙10-11 9,2∙109 1,1∙10-12
323 5,2∙108 1,9∙10-11 6,1∙108 1,6∙10-11 8∙109 1,3∙10-12
328 5,2∙108 1,9∙10-11 5,9∙108 1,7∙10-11 6,8∙109 1,5∙10-12
333 4,8∙108 2,1∙10-11 5,7∙108 1,8∙10-11 6∙109 1,7∙10-12
338 4,6∙108 2,2∙10-11 5,3∙108 1,9∙10-11 5∙109 2∙10-12
343 4,2∙108 2,4∙10-11 4,9∙108 2∙10-11 4∙109 2,5∙10-12
348 3,8∙108 2,6∙10-11 4,6∙108 2,2∙10-11 3,6∙109 2,8∙10-12
353 3,8∙108 2,6∙10-11 4,1∙108 2,4∙10-11 3,2∙109 3,1∙10-12
358 3,2∙108 3,1∙10-11 3,8∙108 2,6∙10-11 2,8∙109 1,3∙10-12
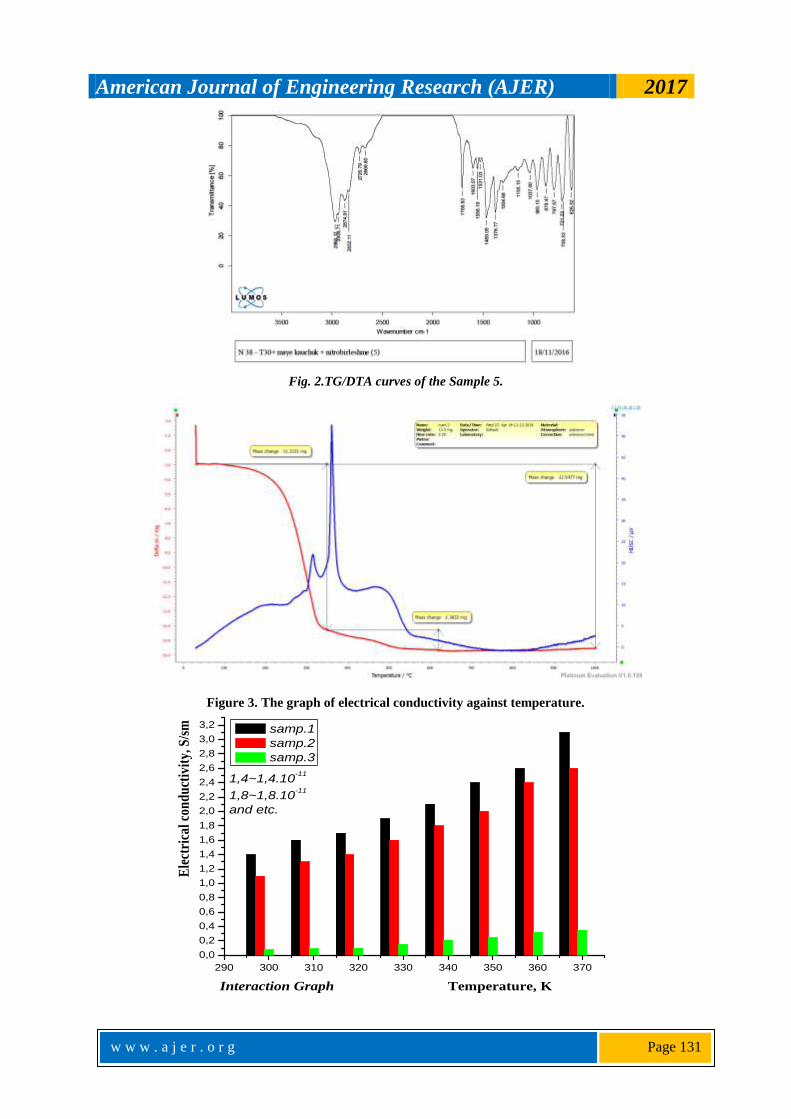
The graph showing the change of the electrical conductivity of the metalworking fluids due to temperature is
given below:
Temperature
°С
Mass
loss, mg
Mass
loss, %
120 0 −
140 0.2 1.48
160 0.4 2.96
180 0.6 4.44
200 1.0 7.41
220 1.4 10.37
240 2.6 19.25
260 4.0 29.26
280 6.0 44.44
300 8.6 63.70
320 11.0 81.48
340 11.4 84.44
360 11.4 84.44
380 11.6 85.92
400 11.8 87.64
420 12.0 88.88
440 12.0 88.88
460 12.2 90.37
American Journal of Engineering Research (AJER) 2017
w w w . a j e r . o r g
Page 125
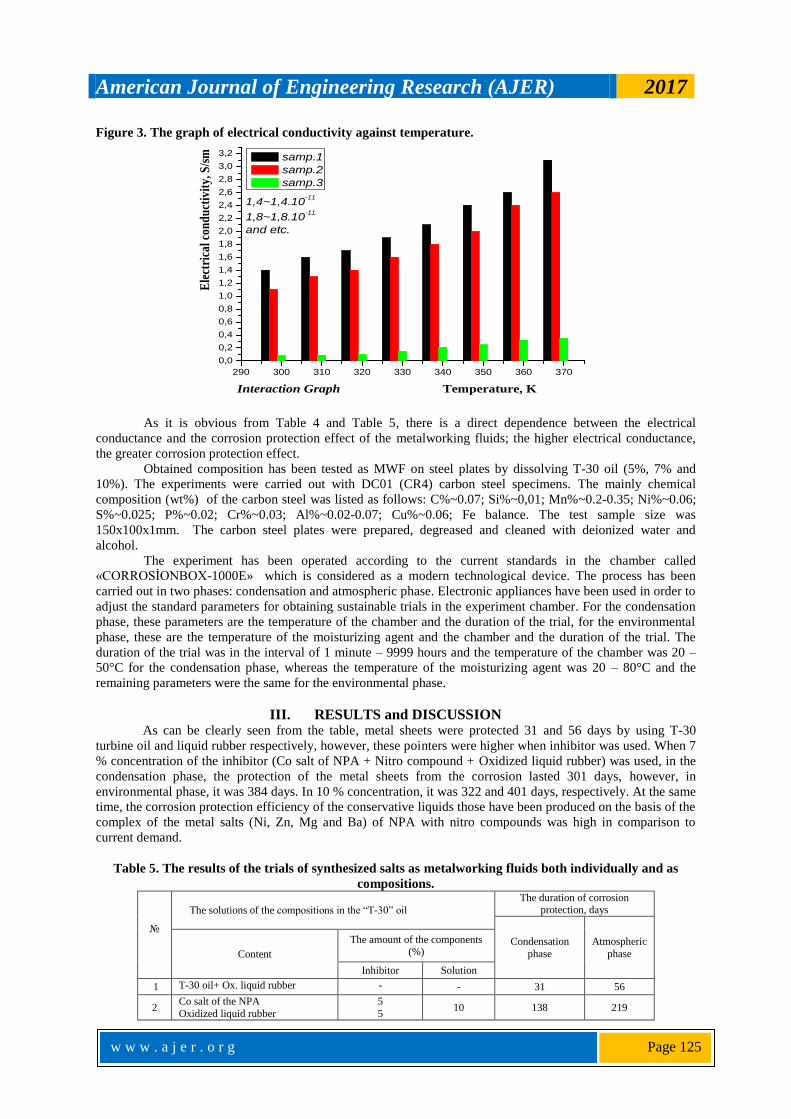
Figure 3. The graph of electrical conductivity against temperature.
As it is obvious from Table 4 and Table 5, there is a direct dependence between the electrical
conductance and the corrosion protection effect of the metalworking fluids; the higher electrical conductance,
the greater corrosion protection effect.
Obtained composition has been tested as MWF on steel plates by dissolving T-30 oil (5%, 7% and
10%). The experiments were carried out with DC01 (CR4) carbon steel specimens. The mainly chemical
composition (wt%) of the carbon steel was listed as follows: C%~0.07; Si%~0,01; Mn%~0.2-0.35; Ni%~0.06;
S%~0.025; P%~0.02; Cr%~0.03; Al%~0.02-0.07; Cu%~0.06; Fe balance. The test sample size was
150x100x1mm. The carbon steel plates were prepared, degreased and cleaned with deionized water and
alcohol.
The experiment has been operated according to the current standards in the chamber called
«CORROSİONBOX-1000E» which is considered as a modern technological device. The process has been
carried out in two phases: condensation and atmospheric phase. Electronic appliances have been used in order to
adjust the standard parameters for obtaining sustainable trials in the experiment chamber. For the condensation
phase, these parameters are the temperature of the chamber and the duration of the trial, for the environmental
phase, these are the temperature of the moisturizing agent and the chamber and the duration of the trial. The
duration of the trial was in the interval of 1 minute – 9999 hours and the temperature of the chamber was 20 –
50°C for the condensation phase, whereas the temperature of the moisturizing agent was 20 – 80°C and the
remaining parameters were the same for the environmental phase.
III. RESULTS and DISCUSSION As can be clearly seen from the table, metal sheets were protected 31 and 56 days by using T-30
turbine oil and liquid rubber respectively, however, these pointers were higher when inhibitor was used. When 7
% concentration of the inhibitor (Co salt of NPA + Nitro compound + Oxidized liquid rubber) was used, in the
condensation phase, the protection of the metal sheets from the corrosion lasted 301 days, however, in
environmental phase, it was 384 days. In 10 % concentration, it was 322 and 401 days, respectively. At the same
time, the corrosion protection efficiency of the conservative liquids those have been produced on the basis of the
complex of the metal salts (Ni, Zn, Mg and Ba) of NPA with nitro compounds was high in comparison to
current demand.
Table 5. The results of the trials of synthesized salts as metalworking fluids both individually and as
compositions.
№
The solutions of the compositions in the “T-30” oil
The duration of corrosion protection, days
Condensation
phase
Atmospheric
phase Content
The amount of the components (%)
Inhibitor Solution
1 T-30 oil+ Ox. liquid rubber - - 31 56
2 Co salt of the NPA
Oxidized liquid rubber
5
5 10 138 219
290 300 310 320 330 340 350 360 370
0,0
0,2
0,4
0,6
0,8
1,0
1,2
1,4
1,6
1,8
2,0
2,2
2,4
2,6
2,8
3,0
3,2
Ele
ctri
cal
con
du
ctiv
ity,
S/s
m
Interaction Graph Temperature, K
samp.1
samp.2
samp.3
1,4~1,4.10-11
1,8~1,8.10-11
and etc.
American Journal of Engineering Research (AJER) 2017
w w w . a j e r . o r g
Page 126
3 Co salt of the NPA Nitro compound
Oxidized liquid rubber
1,66 1,66
1,66
5 228 317
4
Co salt of the NPA
Nitro compound Oxidized liquid rubber
2,33
2,33 2,34
7 301 384
5
Co salt of the NPA
Nitro compound Oxidized liquid rubber
3,33
3,33 3,34
10 322 401
6 Ni salt of the NPA Oxidized liquid rubber
5 5
10 95 197
7 Ni salt of the NPA Nitro compound
Oxidized liquid rubber
2,33 2,33
2,34
7 267 311
8 Ni salt of the NPA Nitro compound
Oxidized liquid rubber
3,33 3,33
3,34
10 291 350
9
Zn salt of the NPA
Nitro compound
Oxidized liquid rubber
3,3,3
3,3,3
3,3,4
10 263 326
10 Mg salt of the NPA Nitro compound
Oxidized liquid rubber
3,33 3,33
3,34
10 297 353
11
Ba salt of the NPA
Nitro compound Oxidized liquid rubber
3,33
3,33 3,34
10 289 346
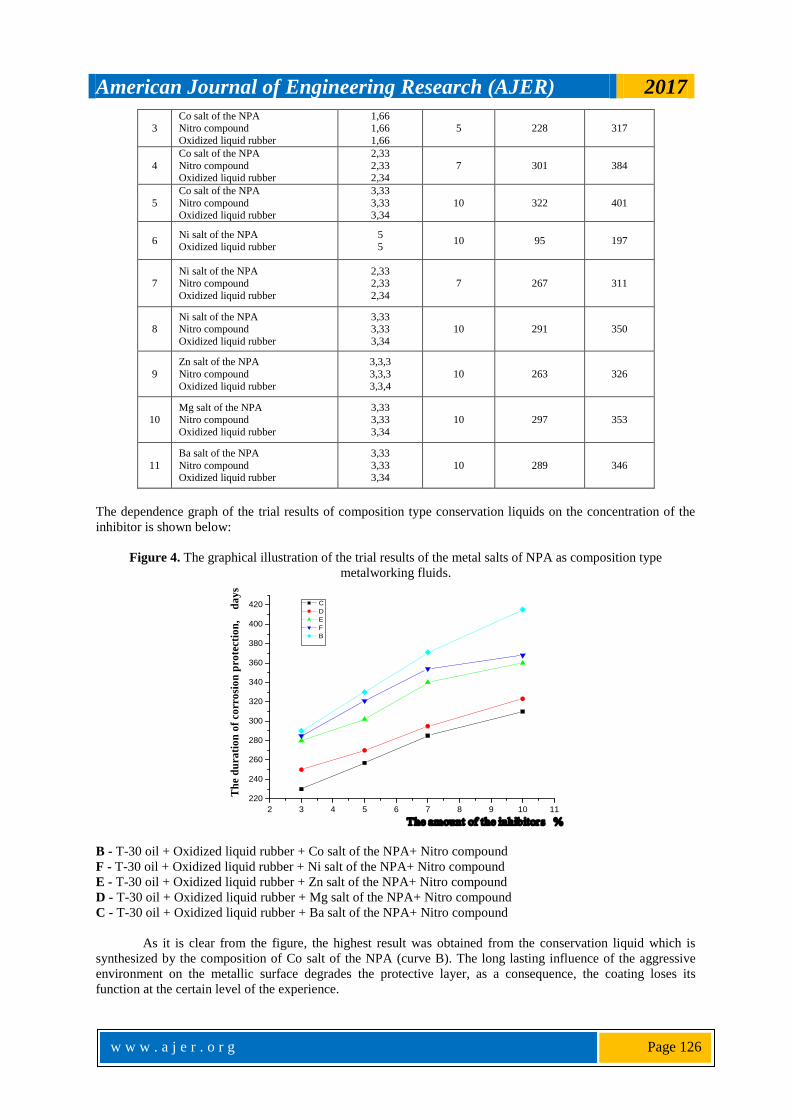
The dependence graph of the trial results of composition type conservation liquids on the concentration of the
inhibitor is shown below:
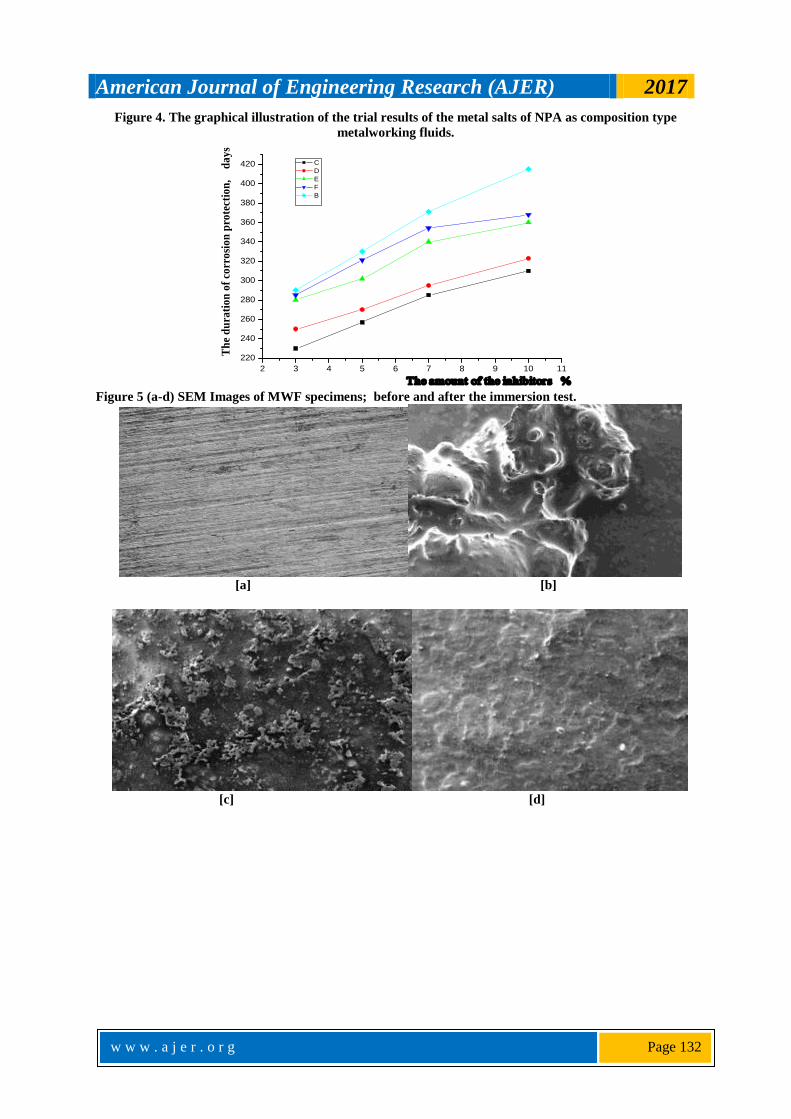
Figure 4. The graphical illustration of the trial results of the metal salts of NPA as composition type
metalworking fluids.
B - T-30 oil + Oxidized liquid rubber + Co salt of the NPA+ Nitro compound
F - T-30 oil + Oxidized liquid rubber + Ni salt of the NPA+ Nitro compound
E - T-30 oil + Oxidized liquid rubber + Zn salt of the NPA+ Nitro compound
D - T-30 oil + Oxidized liquid rubber + Mg salt of the NPA+ Nitro compound
C - T-30 oil + Oxidized liquid rubber + Ba salt of the NPA+ Nitro compound
As it is clear from the figure, the highest result was obtained from the conservation liquid which is
synthesized by the composition of Co salt of the NPA (curve B). The long lasting influence of the aggressive
environment on the metallic surface degrades the protective layer, as a consequence, the coating loses its
function at the certain level of the experience.
2 3 4 5 6 7 8 9 10 11
220
240
260
280
300
320
340
360
380
400
420 C
D
E
F
B
The amount of the inhibitors %
Th
e d
ura
tio
n o
f co
rro
sio
n p
rote
ctio
n,
d
ay
s
American Journal of Engineering Research (AJER) 2017
w w w . a j e r . o r g
Page 127
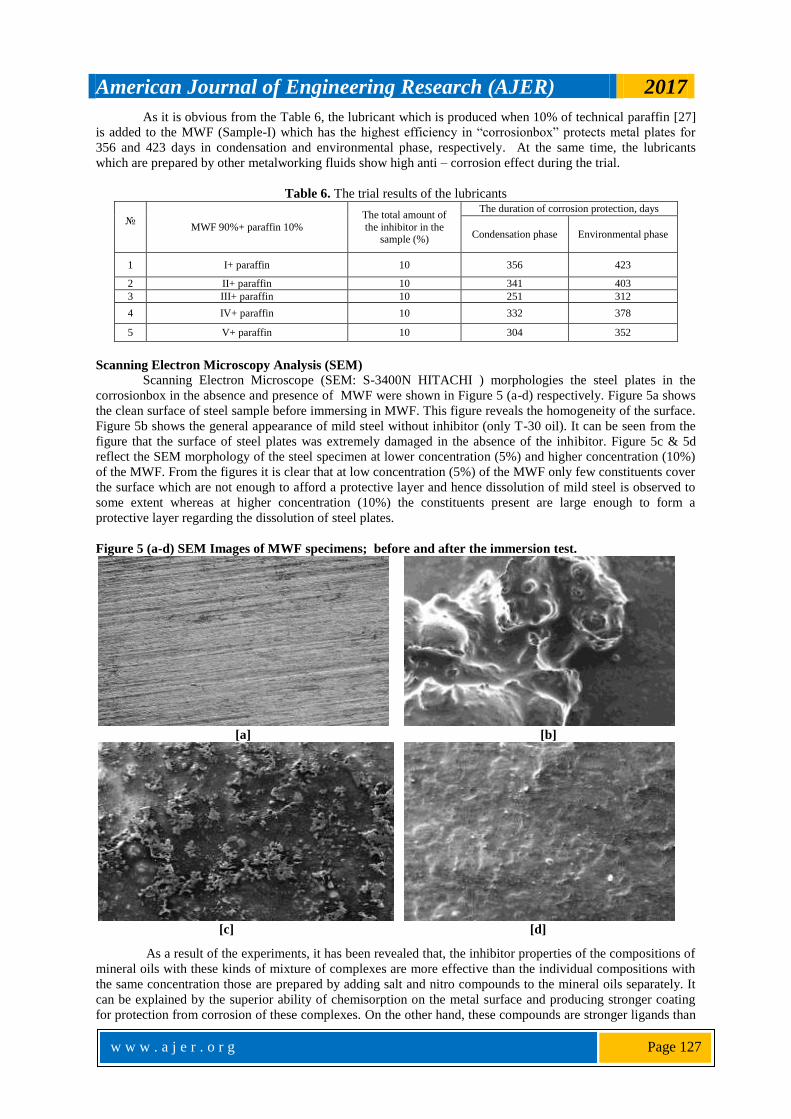
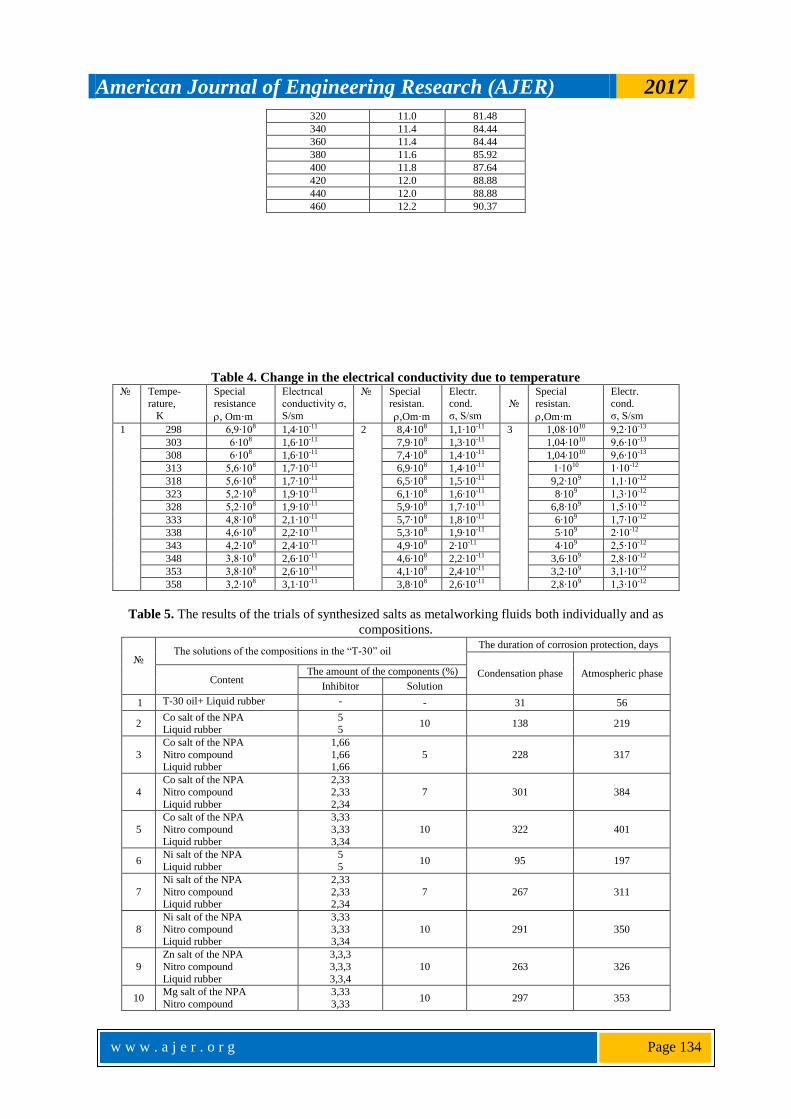
As it is obvious from the Table 6, the lubricant which is produced when 10% of technical paraffin [27]
is added to the MWF (Sample-I) which has the highest efficiency in “corrosionbox” protects metal plates for
356 and 423 days in condensation and environmental phase, respectively. At the same time, the lubricants
which are prepared by other metalworking fluids show high anti – corrosion effect during the trial.
Table 6. The trial results of the lubricants
№
MWF 90%+ paraffin 10%
The total amount of
the inhibitor in the sample (%)
The duration of corrosion protection, days
Condensation phase Environmental phase
1 I+ paraffin 10 356 423
2 II+ paraffin 10 341 403
3 III+ paraffin 10 251 312
4 IV+ paraffin 10 332 378
5 V+ paraffin 10 304 352
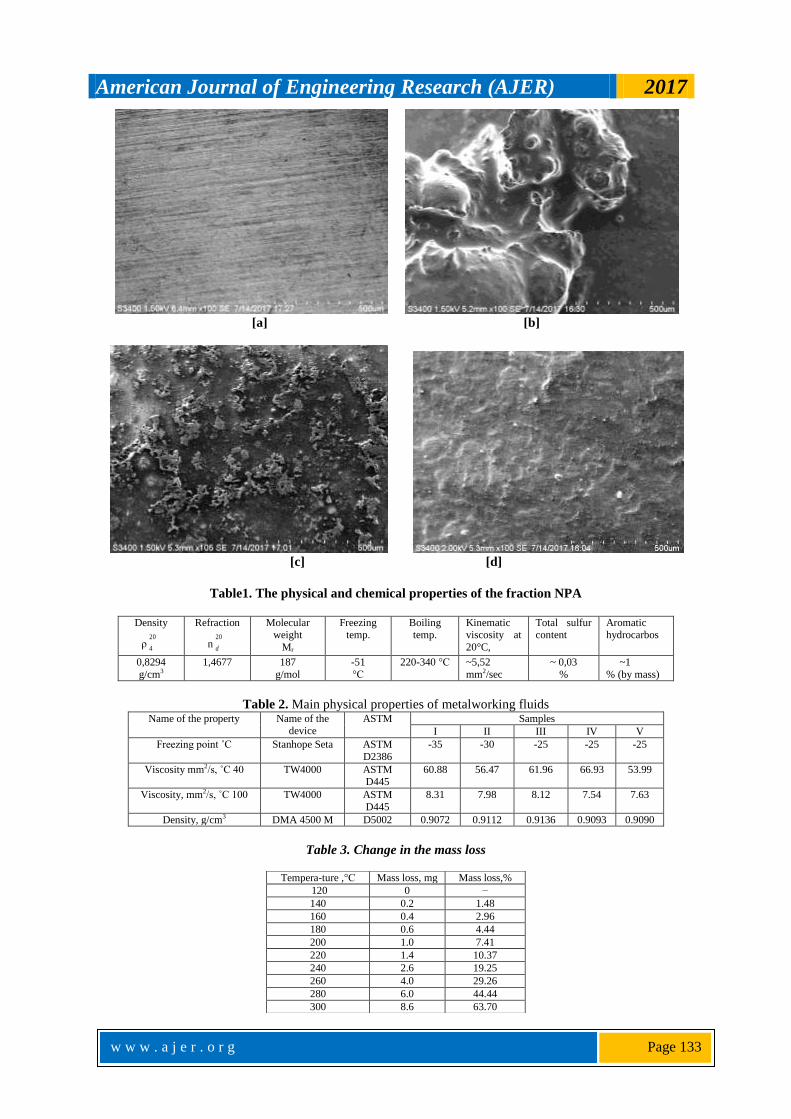
Scanning Electron Microscopy Analysis (SEM)
Scanning Electron Microscope (SEM: S-3400N HITACHI ) morphologies the steel plates in the
corrosionbox in the absence and presence of MWF were shown in Figure 5 (a-d) respectively. Figure 5a shows
the clean surface of steel sample before immersing in MWF. This figure reveals the homogeneity of the surface.
Figure 5b shows the general appearance of mild steel without inhibitor (only T-30 oil). It can be seen from the
figure that the surface of steel plates was extremely damaged in the absence of the inhibitor. Figure 5c & 5d
reflect the SEM morphology of the steel specimen at lower concentration (5%) and higher concentration (10%)
of the MWF. From the figures it is clear that at low concentration (5%) of the MWF only few constituents cover
the surface which are not enough to afford a protective layer and hence dissolution of mild steel is observed to
some extent whereas at higher concentration (10%) the constituents present are large enough to form a
protective layer regarding the dissolution of steel plates.
Figure 5 (a-d) SEM Images of MWF specimens; before and after the immersion test.
[a] [b]
[c] [d]
As a result of the experiments, it has been revealed that, the inhibitor properties of the compositions of
mineral oils with these kinds of mixture of complexes are more effective than the individual compositions with
the same concentration those are prepared by adding salt and nitro compounds to the mineral oils separately. It
can be explained by the superior ability of chemisorption on the metal surface and producing stronger coating
for protection from corrosion of these complexes. On the other hand, these compounds are stronger ligands than
American Journal of Engineering Research (AJER) 2017
w w w . a j e r . o r g
Page 128
the water that is why they can substitute water molecules from the surface of the metal and create strong
protection layer.
IV. CONCLUSION As can be seen from the table which indicates the results of the experiments, the manufactured MWF
may be used in order to protect the metals from corrosion for industrial purposes. The components those have
been used for producing MWF are cost effective and environmentally – friendly, on the other hand, they have
simple manufacturing technology and rich feedstock. T-30 oil, additives which are used as inhibitors and
oxidized liquid rubber which are used in the reaction medium are produced on the basis of the feedstock which
have enough reserves. So, the comparative analysis of the results reveals that, the usage of the compositions of
the metal salts of natural petroleum acids with nitro compounds as inhibitors have a practical importance for
producing more effective MWF.
It has been revealed that the metalworking fluids that is produced by the composition of the synthesised
inhibitor and nitro compound in the presence of oxidized liquid rubber has a great protection against corrosion
than their individual usages, meets the requirements and has a great practical importance.
REFERENCES [1]. Rozenfeld I.L., Corrosion Inhibitors; McGraw-Hill. New York, 1981, p.182.
[2]. Roberge P.R. Corrosion Engineering Principle and Practice. McGraw-Hill. New York, 2008, 730 p. [3]. McCoy, J.S., “Introduction: Tracing the Historical Development of Metalworking Fluids”, in Metalworking Fluids;
Byers, J. P., Ed.; 2nd edition, Taylor & Francis, New York, 2006, pp.1-18.
[4]. E.Brinksmeier, D.Meyer, A.G.Huesmann-Cordes, C.Herrmann. Metalworking fluids - Mechanisms and performance. CIRP Annals-Manufacturing Technology 64 (2015) 605–628 (http://creativecommons.org/ licenses/by-nc-nd/4.0/).
[5]. Hugh Spikes. Low- and zero-sulphated ash, phosphorus and Sulphur anti-wear additives for engine oils. Lubrication
Science 2008; 20:103–136 (www.interscience.wiley.com) DOI: 10.1002/ls.57 [6]. S. N. Smith, J. L. Pacheco: „Prediction of corrosion in slightly sour environments‟, Paper 02241, NACE Corrosion Conference
2002.
[7]. Dharma R. Kodali, (2002),"High performance ester lubricants from natural oils", Industrial Lubrication and Tribology, Vol. 54 Iss: 4 pp. 165 – 170 http://dx.doi.org/10.1108/00368790210431718
[8]. Zvirko O. I., Mytsyk A. B., Tsyrulnyk O. T., Gabetta G., Nykyforchyn H. M. "Corrosion Degradation of Steel of an Elbow of Gas
Pipeline with Large-Scale Delamination after Long-Term Operation./ Mater Sci, 2017, Volume 52, Issue 6, pp 861–865 https://doi.org/10.1007/s11003-017-0032-8
[9]. I Ghai, J Wentz, RE DeVor, SG Kapoor, J Samuel Droplet behavior on a rotating surface for atomization-based cutting fluid application in micromachining. /J. Manuf. Sci. Eng 132(1), 011017 (Feb 03, 2010) doi:10.1115/1.4000859
[10]. Myshkin N.K., Markova L.V. Methods and Instruments for Condition Monitoring of Lubricants. In: On-line Condition
Monitoring in Industrial Lubrication and Tribology. Applied Condition Monitoring , vol 8. pp 1-29 Springer, Cham https://doi.org/10.1007/978-3-319-61134-1_1
[11]. Zhao, F., Urbance, M., & Skerlos, S. J. (2004). Mechanistic Model of Coaxial Microfiltration for Semi-Synthetic Metalworking
Fluid Microemulsions. Journal of Manufacturing Science and Engineering, 126(3), 435. http://doi.org/10.1115/1.1763187 [12]. Kaesche H (1990) Die Korrosion der Metalle, third ed. Springer, Berlin, Germany.
[13]. Aiad, I., Riya, M.A., Tawfik, S.M., Abousehly A.M. Protection of carbon steel against corrosion in hydrochloric acid solution
by some synthesized cationic surfactants. Protection of Metals and Physical Chemistry of Surfaces, (2016) 52: 339. https://doi.org/10.1134/S2070205116020027
[14]. Skerlos, S. J., Rajagopalan, N., DeVor, R. E., Kapoor, S. G., & Angspatt, V. D. (2001). Microfiltration of Polyoxyalkylene
Metalworking Fluid Lubricant Additives Using Aluminum Oxide Membranes. Journal of Manufacturing Science and Engineering, 123(4), 692. http://doi.org/10.1115/1.1392993
[15]. Thomas Norrby, (2003) "Environmentally adapted lubricants – where are the opportu-nites?", Industrial Lubrication and
Tribology, Vol. 55 Issue:6, pp.268-274, https://doi.org/10.1108/00368790310496400 [16]. Skerlos, S. J. (2011). Cutting Fluids and their Environmental Impact, Chapter in Encyclopedia of Tribology, Springer,
http://doi.org/10.1007/978-0-387-92897-5.
[17]. MacLean, D., Hayes, K., Barnard, T., Hull, T., Park, Y.E., Skerlos, S.J., 2009 “Impact of Supercritical Carbon Dioxide Metalworking Fluids on Tool Life in turning of Sintered Steel and Milling of Compacted Graphite Iron”, Proceedings of the ASME
International Manufacturing Science and Engineering Conference 2009, MSEC2009, October 4-7, 2009, West Lafayette, Indiana,
USA, pp. 43-48. [18]. Iowa Waste Reduction Center, Cutting Fluid Management for Small Machining Operations: A Practical Pollution Prevention
Guide, 3 rd edition, University of northern Iowa, 2003
[19]. Zimmerman, J. B., Hayes, K. F., & Skerlos, S. J. (2004). Influence of Ion Accumulation on the Emulsion Stability and Performance of Semi-Synthetic Metalworking Fluids. Enviro-mental Science and Technology, 38(8), 2482-2490.
http://doi.org/10.1021/es0340477
[20]. Chang, S.-C., Rihana, A., Bahrman, S., Gruden, C. L., Khijniak, A. I., Skerlos, S. J., & Adriaens, P. (2004). Flow cytometric detection and quantification of mycobacteria in metalworking fluids. International Biodeterioration & Biodegradation, 54(2-3),
105–112. http://doi.org/10.1016/j.ibiod.2004.03.019
[21]. M. J. Hernández Gayosso, N. Nava & G. Zavala Olivares. Characterisation and comparison of corrosion products originated in steel pipelines transporting sour gas and crude oil. The International Journal of Corrosion Processes and Corrosion Control. 2016,
51(8) p. 626-634 http://dx.doi.org/10.1080/1478422X.2016.1173421
[22]. V.S.Aliyev, S.M.Aliyev, A.Q.Azizov, F.A.Nasirov, Q.A.Mamedaliyev, T.A.Ismaylov. Sposob polucheniya 1,4-cys-polibutadiyena. Avtorskoye svidetelstvo (A.s.)SSSR № 1066190, 1979.
[23]. Nasirov F.A. Issledovaniye i razrabotca prochessa polucheniya nizcomolekulyarnoqo polibutadiyena v prisutstvii cataliticheskix
sistem na osnove orqanichescix ditioproizvodnix nicelya (cobalta). Diss... cand.xim.nauk., Baku, IPP ANAS 1983, 202 p. [24]. ASTM C 613-14: „Standard test method for constituent content of composite prepreg by Soxhlet Extraction‟.

American Journal of Engineering Research (AJER) 2017
w w w . a j e r . o r g
Page 129
[25]. F.R. van de Voort, J. Sedman, D. Pinchuk, An overview of progress and new developments in FTIR lubricant condition monitoring methodology. J ASTM Int. 8(5) (2011). ID: JAI103344Google Scholar
[26]. J. Chastain, in: R.C. King Jr. (Ed.), Handbook of X-ray Photoelectron Spectroscopy, Physical Electronics, Inc., 1995.
[27]. Parafini neftyanie tverdie. QOST 23683-89.
Fig.1.1.The microscopic view of 5 selected points in sample
Fig. 1.2 IR spectra of the 1st
point
Figure 1.3 IR spectra of the 2nd
point
American Journal of Engineering Research (AJER) 2017
w w w . a j e r . o r g
Page 130
Figure 1.4 IR spectra of the 3
rd point
Figure 1.5 IR spectra of the 4
th point
Figure 1.6 IR spectra of the 5
th point
American Journal of Engineering Research (AJER) 2017
w w w . a j e r . o r g
Page 131
Fig. 2.TG/DTA curves of the Sample 5.
Figure 3. The graph of electrical conductivity against temperature.
290 300 310 320 330 340 350 360 370
0,0
0,2
0,4
0,6
0,8
1,0
1,2
1,4
1,6
1,8
2,0
2,2
2,4
2,6
2,8
3,0
3,2
Ele
ctri
cal
con
du
ctiv
ity,
S/s
m
Interaction Graph Temperature, K
samp.1
samp.2
samp.3
1,4~1,4.10-11
1,8~1,8.10-11
and etc.
American Journal of Engineering Research (AJER) 2017
w w w . a j e r . o r g
Page 132
Figure 4. The graphical illustration of the trial results of the metal salts of NPA as composition type
metalworking fluids.
Figure 5 (a-d) SEM Images of MWF specimens; before and after the immersion test.
[a] [b]
[c] [d]
2 3 4 5 6 7 8 9 10 11
220
240
260
280
300
320
340
360
380
400
420 C
D
E
F
B
The amount of the inhibitors %
Th
e d
ura
tio
n o
f co
rro
sio
n p
rote
ctio
n,
d
ay
s
American Journal of Engineering Research (AJER) 2017
w w w . a j e r . o r g
Page 133
[a] [b]
[c] [d]
Table1. The physical and chemical properties of the fraction NPA
Density
ρ20
4
Refraction
n20
d
Molecular weight
Mr
Freezing temp.
Boiling temp.
Kinematic viscosity at
20°C,
Total sulfur content
Aromatic hydrocarbos
0,8294
g/cm3
1,4677 187
g/mol
-51
°С
220-340 °С ~5,52
mm2/sec
~ 0,03
%
~1
% (by mass)
Table 2. Main physical properties of metalworking fluids Name of the property Name of the
device
ASTM Samples
I II III IV V
Freezing point ˚C Stanhope Seta ASTM
D2386
-35 -30 -25 -25 -25
Viscosity mm2/s, ˚C 40 TW4000 ASTM D445
60.88 56.47 61.96 66.93 53.99
Viscosity, mm2/s, ˚C 100 TW4000 ASTM
D445
8.31 7.98 8.12 7.54 7.63
Density, g/cm3 DMA 4500 M D5002 0.9072 0.9112 0.9136 0.9093 0.9090
Table 3. Change in the mass loss
Tempera-ture ,°С Mass loss, mg Mass loss,% 120 0 −
140 0.2 1.48
160 0.4 2.96
180 0.6 4.44
200 1.0 7.41
220 1.4 10.37
240 2.6 19.25
260 4.0 29.26
280 6.0 44.44
300 8.6 63.70
American Journal of Engineering Research (AJER) 2017
w w w . a j e r . o r g
Page 134
Table 4. Change in the electrical conductivity due to temperature № Tempe-
rature,
K
Special resistance
, Om·m
Electrıcal conductivity σ,
S/sm
№ Special resistan.
,Om·m
Electr. cond.
σ, S/sm
№
Special resistan.
,Om·m
Electr. cond.
σ, S/sm
1 298 6,9∙108 1,4∙10-11 2 8,4∙108 1,1∙10-11 3 1,08∙1010 9,2∙10-13
303 6∙108 1,6∙10-11 7,9∙108 1,3∙10-11 1,04∙1010 9,6∙10-13
308 6∙108 1,6∙10-11 7,4∙108 1,4∙10-11 1,04∙1010 9,6∙10-13
313 5,6∙108 1,7∙10-11 6,9∙108 1,4∙10-11 1∙1010 1∙10-12
318 5,6∙108 1,7∙10-11 6,5∙108 1,5∙10-11 9,2∙109 1,1∙10-12
323 5,2∙108 1,9∙10-11 6,1∙108 1,6∙10-11 8∙109 1,3∙10-12
328 5,2∙108 1,9∙10-11 5,9∙108 1,7∙10-11 6,8∙109 1,5∙10-12
333 4,8∙108 2,1∙10-11 5,7∙108 1,8∙10-11 6∙109 1,7∙10-12
338 4,6∙108 2,2∙10-11 5,3∙108 1,9∙10-11 5∙109 2∙10-12
343 4,2∙108 2,4∙10-11 4,9∙108 2∙10-11 4∙109 2,5∙10-12
348 3,8∙108 2,6∙10-11 4,6∙108 2,2∙10-11 3,6∙109 2,8∙10-12
353 3,8∙108 2,6∙10-11 4,1∙108 2,4∙10-11 3,2∙109 3,1∙10-12
358 3,2∙108 3,1∙10-11 3,8∙108 2,6∙10-11 2,8∙109 1,3∙10-12
Table 5. The results of the trials of synthesized salts as metalworking fluids both individually and as
compositions.
№
The solutions of the compositions in the “T-30” oil The duration of corrosion protection, days
Condensation phase Atmospheric phase Content
The amount of the components (%)
Inhibitor Solution
1 T-30 oil+ Liquid rubber - - 31 56
2 Co salt of the NPA
Liquid rubber
5
5 10 138 219
3
Co salt of the NPA
Nitro compound Liquid rubber
1,66
1,66 1,66
5 228 317
4
Co salt of the NPA
Nitro compound
Liquid rubber
2,33
2,33
2,34
7 301 384
5
Co salt of the NPA
Nitro compound
Liquid rubber
3,33
3,33
3,34
10 322 401
6 Ni salt of the NPA
Liquid rubber
5
5 10 95 197
7
Ni salt of the NPA
Nitro compound Liquid rubber
2,33
2,33 2,34
7 267 311
8
Ni salt of the NPA
Nitro compound
Liquid rubber
3,33
3,33
3,34
10 291 350
9
Zn salt of the NPA
Nitro compound
Liquid rubber
3,3,3
3,3,3
3,3,4
10 263 326
10 Mg salt of the NPA
Nitro compound
3,33
3,33 10 297 353
320 11.0 81.48
340 11.4 84.44
360 11.4 84.44
380 11.6 85.92
400 11.8 87.64
420 12.0 88.88
440 12.0 88.88
460 12.2 90.37

American Journal of Engineering Research (AJER) 2017
w w w . a j e r . o r g
Page 135
Liquid rubber 3,34
11 Ba salt of the NPA Nitro compound
Liquid rubber
3,33 3,33
3,34
10 289 346
Table 6. The trial results of the lubricants
№
MWF 90%+ paraffin 10%
The total amount of the inhibitor in the
sample (%)
The duration of corrosion protection, days
Condensation phase Environmental phase
1 I+ paraffin 10 356 423
2 II+ paraffin 10 341 403
3 III+ paraffin 10 251 312
4 IV+ paraffin 10 332 378
5 V+ paraffin 10 304 352
Y.J.Aghazada " Metalworking Fluids and Lubricants Offer Effective Protection for Processing
and Shipment of Metal Based Products." American Journal of Engineering Research (AJER)
6.8 (2017): 121-135