michael curri: bridging the small business digital divide through utilization (gigabit city summit)
TRANSCRIPT

© S
trat
egic
Net
wo
rks
Gro
up
, In
c. 2
014
Bridging the Small Business Digital Divide Through Utilization
Gigabit City SummitKansas City, Missouri
January 14, 2015

© S
trat
egic
Net
wo
rks
Gro
up
, In
c. 2
014
2
Revenues from network subscriptions
- Investment, operations & maintenance costs
= PROFIT
Operators
Local Economy
Increased productivity and competitiveness,
increased revenues, new jobs,
better quality of life, etc.
- Investment, utilization programs and support
= BENEFITS FOR THE COMMUNITY
Why We Build Broadband Networks
“Off-
balance-sheet”

© S
trat
egic
Net
wo
rks
Gro
up
, In
c. 2
014
3
Broadband Means Jobs
Broadband is responsible for 42.8% of all new jobs since 2013
Percent of New Jobs Related to InternetBy Size of Employer Group
Small businesses create 8x more Internet jobs
relative to large firms
Source: SNG Digital Economy Database, n = 2,536 (Commercial businesses in IL, KY, NC, NE, GA; 2012 to present)
60.4%
47.4%
40.0%37.4%
41.9% 42.8%
0.0%
10.0%
20.0%
30.0%
40.0%
50.0%
60.0%
70.0%
0 - 19 20 - 49 50 - 99 100 - 499 500 ormore
Total

© S
trat
egic
Net
wo
rks
Gro
up
, In
c. 2
014
4
Economic ROI from Public Investments in Broadband
Contribution to GDP 10 x the initial public investment
Number of Jobs created and saved Variable
Fiscal revenues increase 3 to 4 x the initial public investment
4
… as well as ROI For Our Communities
SNG projects have revealed common return on investment (ROI) multipliers from broadband investments
Average multipliers identified from economic impact studies conducted by SNG.
© S
trat
egic
Net
wo
rks
Gro
up
, In
c. 2
014
5
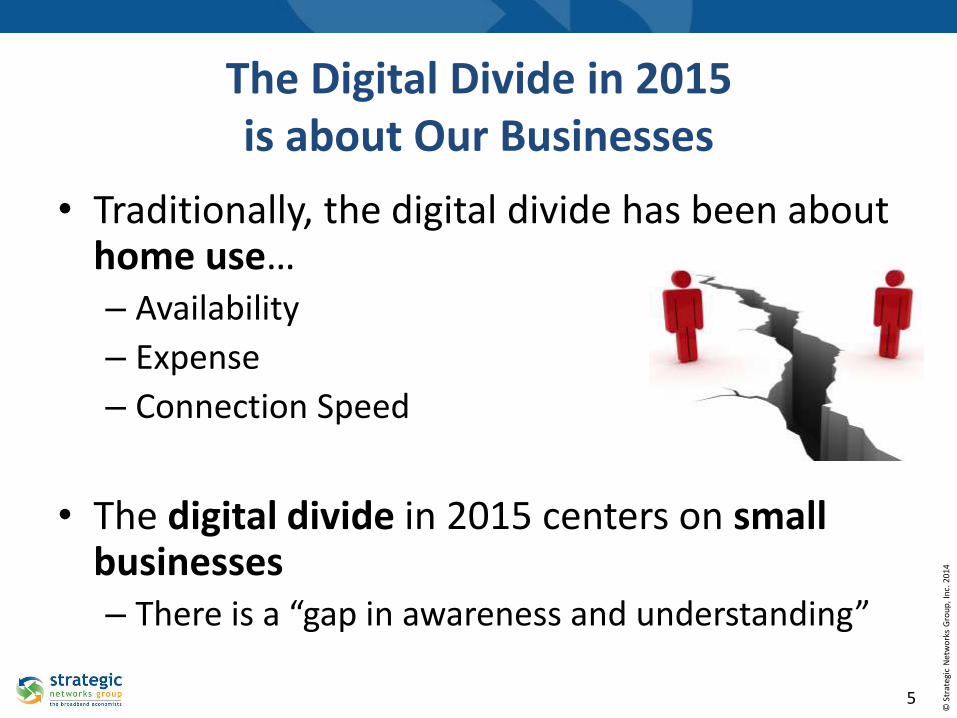
The Digital Divide in 2015 is about Our Businesses
• Traditionally, the digital divide has been about home use… – Availability
– Expense
– Connection Speed
• The digital divide in 2015 centers on small businesses– There is a “gap in awareness and understanding”

© S
trat
egic
Net
wo
rks
Gro
up
, In
c. 2
014
6
The Smaller the Organization, The Lower the Internet Utilization
6.22
6.79
7.087.20
7.63
5.00
6.00
7.00
8.00
1 - 4 5 - 9 10 - 19 20 - 49 50 or more
Number of Employees
Average DEi Score
8,431 commercial enterprises (2012-14)

© S
trat
egic
Net
wo
rks
Gro
up
, In
c. 2
014
7
Availability Adoption Utilization
This is Problematic Because…
Utilization Growth
BUT Availability is Our Primary Industry Focus …

© S
trat
egic
Net
wo
rks
Gro
up
, In
c. 2
014
8Source: SNG Digital Economy Database, n=3,341 (Businesses in CA, CT, MD, NC, NE, OH, SC, VA; 2012 to Present)
Faster does not solve other, more significant barriers
Internet Speed Is NOT the Utilization Barrier
20.1%
17.4%
15.9%
30.0%
41.0%
18.2%
0.0% 10.0% 20.0% 30.0% 40.0% 50.0%
Loss of personal contact with clients
High cost of development/maintenance
Lack of internal expertise and knowledge
Privacy concerns
Security concerns
Available Internet is too slow
© S
trat
egic
Net
wo
rks
Gro
up
, In
c. 2
014
9
Also Contributing to the Digital Divide? Ultra-Fast (Gigabit) Broadband is…
• Not universally understood
• Not universally accepted as a platform for innovation that requires maximum bandwidth
• Not seen as a utility – Ultra fast networks are different than
traditional broadband… benefits need to be understood to drive adoption and utilization

© S
trat
egic
Net
wo
rks
Gro
up
, In
c. 2
014
10
Gap in Understanding Starts with Marketing a Feature… Not a Benefit

© S
trat
egic
Net
wo
rks
Gro
up
, In
c. 2
014
11
Marketing just ‘Speed’ Leaves Small Businesses in the Dark
Target Market Demand Drivers Feature Benefit Result
HouseholdsNetflix, Gaming, Multiplehousehold users, and Devices
SpeedEnhanced lifestyle
Uptake
LargeBusinesses
Collaboration, Security and Backups, Cloud Applications
SpeedCompetitiveness Collaboration
Uptake
SMEsEmail, websites, basic online tools, all accomplished with “basic” service
SpeedHow does fast Internet impact my bottom line?
Limited Uptake

© S
trat
egic
Net
wo
rks
Gro
up
, In
c. 2
014
12
In the Broadband equation, the quality of each input affects the outcome
Utilization AverageLagging
Technology
Technology Low Utilization Poor
UtilizationTechnology BENEFITS
Cannot Only Focus on Technology

© S
trat
egic
Net
wo
rks
Gro
up
, In
c. 2
014
13
Increased Utilization Grows Revenue
Businesses underutilizing the Internet miss significant revenue opportunities
0%
5%
10%
15%
20%
25%
30%
35%
40%
45%
4 up to 5 5 up to 6 6 up to 7 7 up to 8 8 up to 9 9 up to 10
21% 22%26%
32%35%
43%
% o
f R
eve
nu
es
attr
ibu
ted
fro
m In
tern
et u
sage
Level of Broadband Utilization (DEi score)
Contribution of Internet to Revenues by Level of Utilization
Source: Strategic Networks Group, Inc. 2014. N = 2,606

© S
trat
egic
Net
wo
rks
Gro
up
, In
c. 2
014
14
Why Drive Utilization?
For an individual business or organization, increasing utilization by 10% means:
Increasing revenues by 24%
Decreasing costs by 7%
For a Community or Region, it means :
Allowing businesses to be more competitive
Creating a demand for high-skilled workers
Adding fiscal revenues
Average multipliers identified by SNG from over 12,000 data records collected in 2009-10.
© S
trat
egic
Net
wo
rks
Gro
up
, In
c. 2
014
15
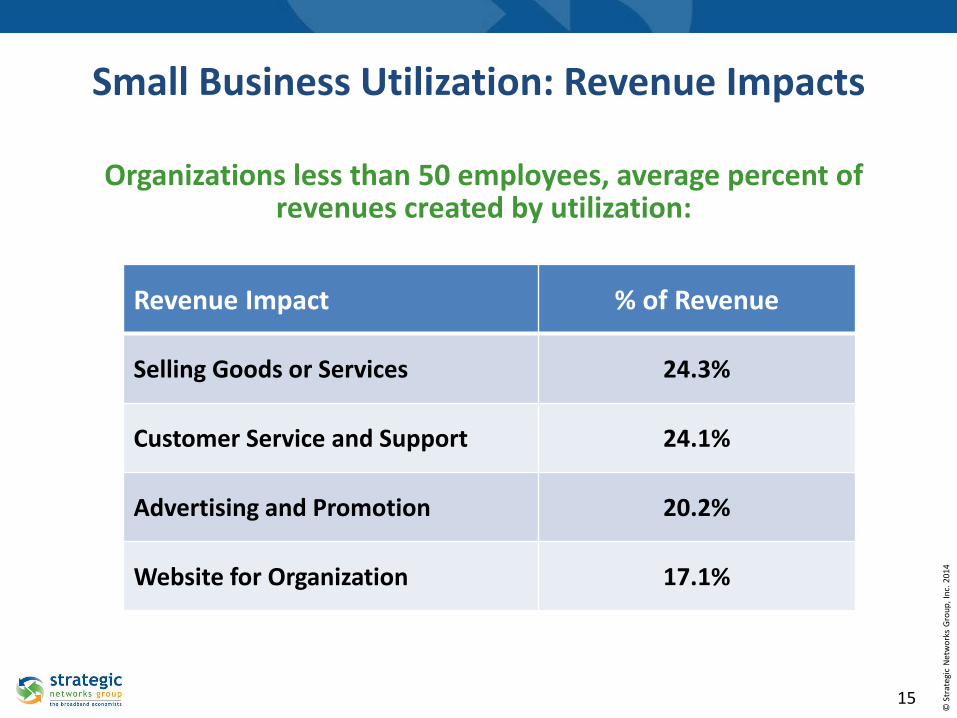
Small Business Utilization: Revenue Impacts
Revenue Impact % of Revenue
Selling Goods or Services 24.3%
Customer Service and Support 24.1%
Advertising and Promotion 20.2%
Website for Organization 17.1%
Organizations less than 50 employees, average percent of revenues created by utilization:
© S
trat
egic
Net
wo
rks
Gro
up
, In
c. 2
014
16
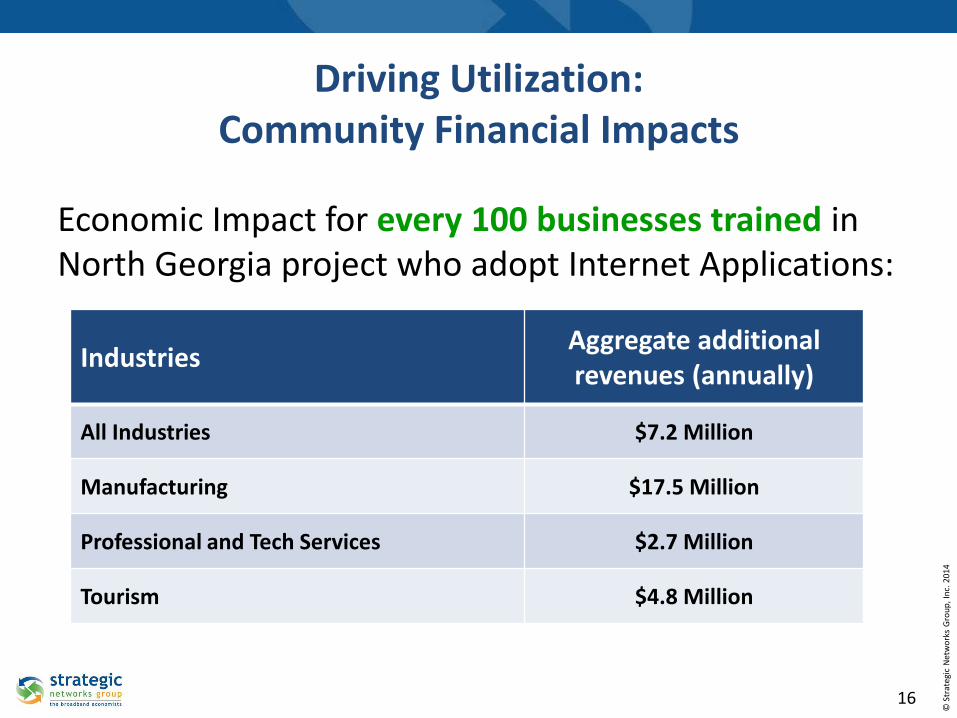
Driving Utilization: Community Financial Impacts
Economic Impact for every 100 businesses trained in North Georgia project who adopt Internet Applications:
IndustriesAggregate additional revenues (annually)
All Industries $7.2 Million
Manufacturing $17.5 Million
Professional and Tech Services $2.7 Million
Tourism $4.8 Million

© S
trat
egic
Net
wo
rks
Gro
up
, In
c. 2
014
17
The Takeaway: Make a Compelling Case For Broadband Benefits
Support training of Internet applications
Help businesses understand benefits of gigabit broadband (not just speed)
Develop a “business case” for businesses to take action
© S
trat
egic
Net
wo
rks
Gro
up
, In
c. 2
014
18
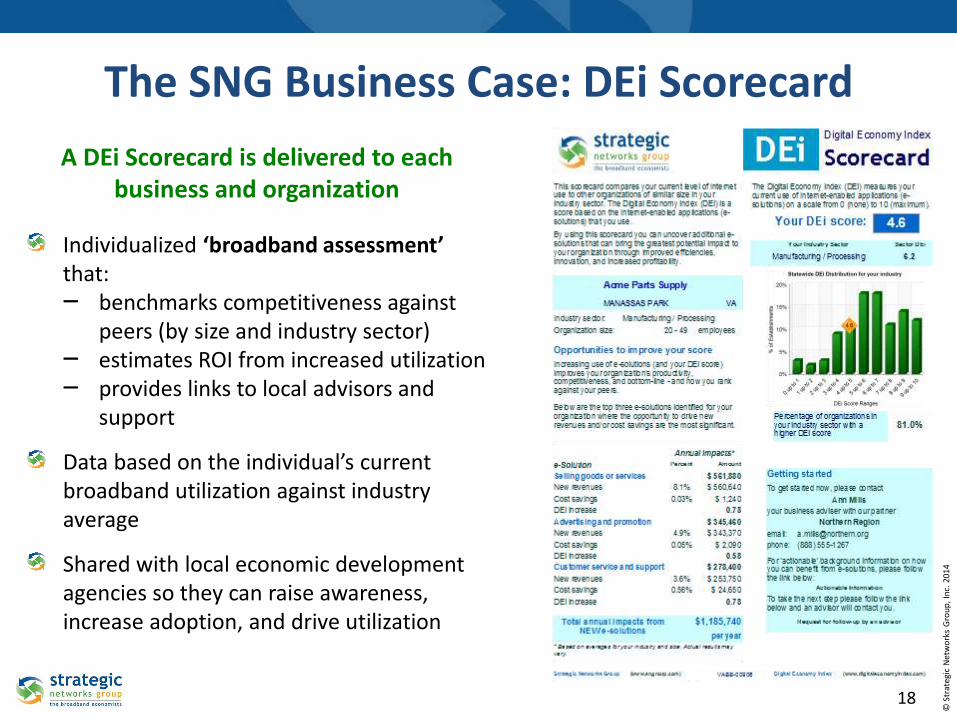
A DEi Scorecard is delivered to each business and organization
Individualized ‘broadband assessment’ that:‒ benchmarks competitiveness against
peers (by size and industry sector)‒ estimates ROI from increased utilization‒ provides links to local advisors and
support
Data based on the individual’s current broadband utilization against industry average
Shared with local economic development agencies so they can raise awareness, increase adoption, and drive utilization
The SNG Business Case: DEi Scorecard

© S
trat
egic
Net
wo
rks
Gro
up
, In
c. 2
014
19
Michael Curri, PresidentStrategic Networks Group, Inc.
Let’s connect !
www.sngroup.com
Thank You