michael p. kilgard sensory experience and cortical plasticity university of texas at dallas
TRANSCRIPT

Michael P. Kilgard
Sensory Experience and Cortical Plasticity
University of Texas at Dallas

Cortical plasticity depends upon:
• Sensory experience
• Behavioral relevance

The Cholinergic Basal Forebrain Provides a Diffuse Neuromodulatory Input to the Cortex
Nucleus Basalis

Exploring the Principles of Cortical Plasticity using:• Systematic Variation of Sensory Experience
• Nucleus Basalis Stimulation to
Gate Cortical Plasticity
Experienceor Instinct
Connectivity & Dynamics
Plasticity
Neural Representation
Importance
External world
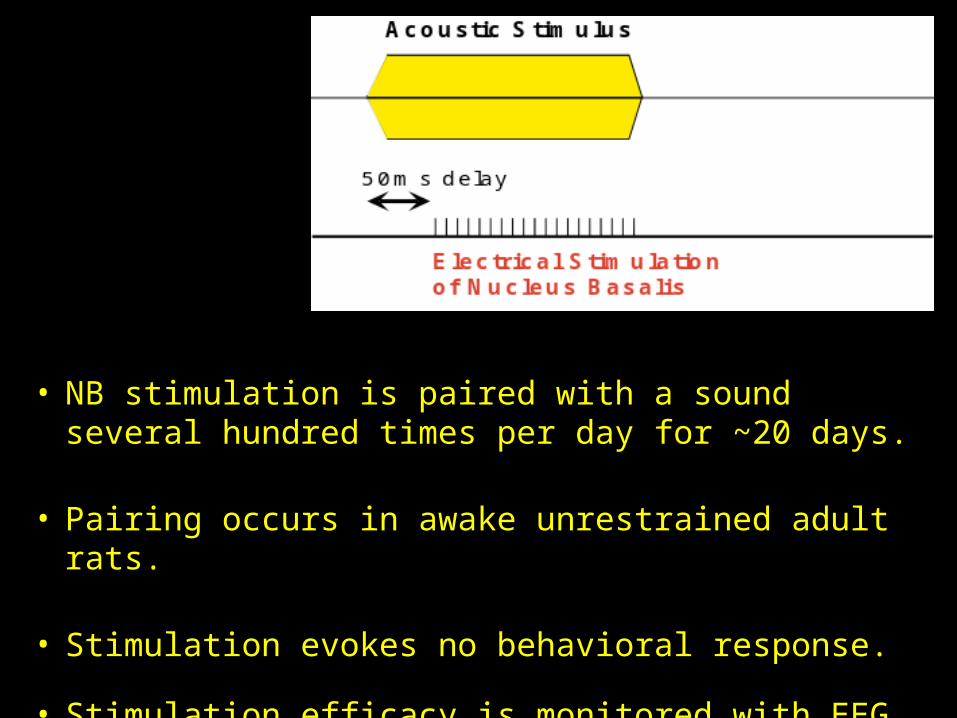
• NB stimulation is paired with a sound several hundred times per day for ~20 days.
• Pairing occurs in awake unrestrained adult rats.
• Stimulation evokes no behavioral response.
• Stimulation efficacy is monitored with EEG.

Extracellular Recordings
Detailed Reconstruction of the Distributed Cortical Response
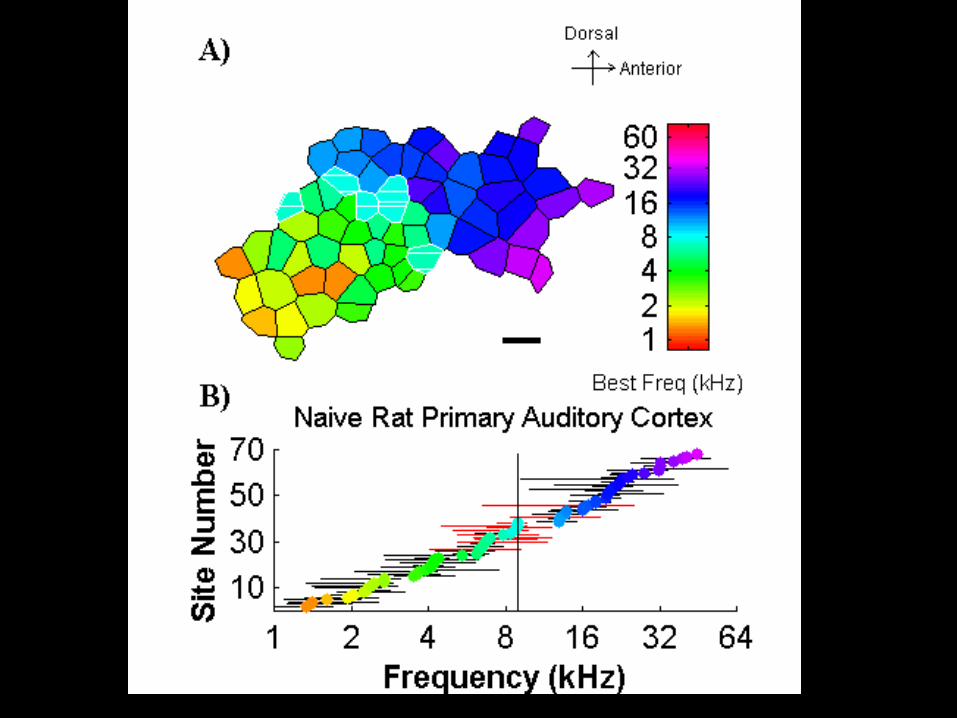

Best Frequency
Science, 1998

Tone Frequency - kHz
Nucleus Basalis Stimulation Generates Map Plasticity that is Specific to the Paired Tone
N = 20 rats; 1,060 A1 sites

Nature Neuroscience, 1998
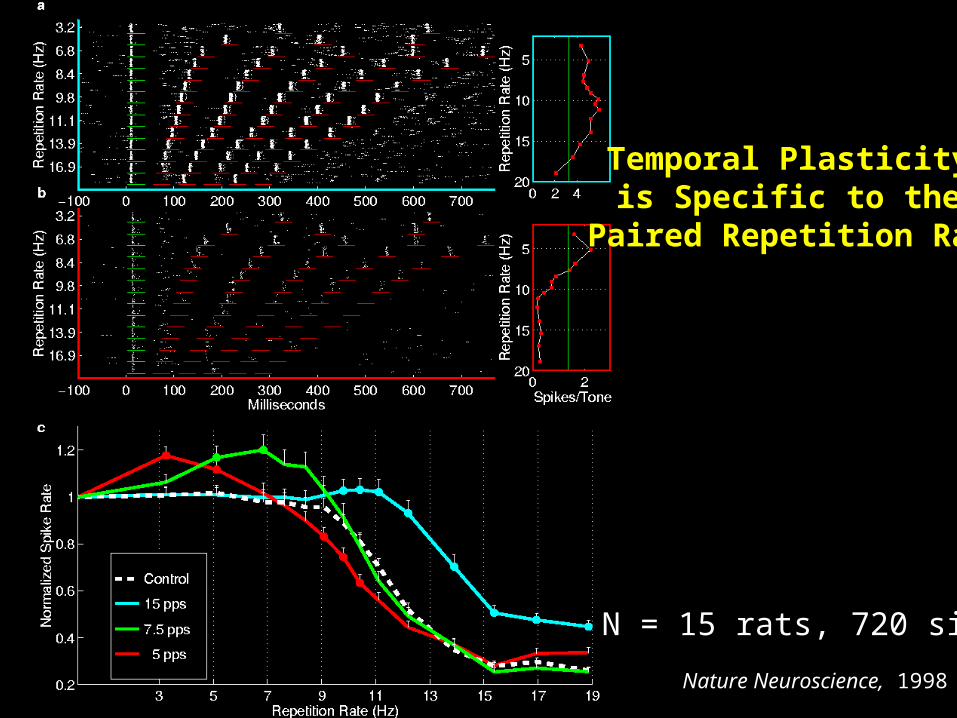
Temporal Plasticity is Specific to the
Paired Repetition Rate
N = 15 rats, 720 sites

2 4 6 8 10 12 14 16 18 200
0.2
0.4
0.6
0.8
1
1.2
Repetition Rate (pulses/second)
Nor
mal
ized
Spi
ke R
ate
Control 15pps 9 kHz 15pps Seven Carriers
0 5 10 15 200
20
40
60
80
100
Best Repetition Rate(pulses/second)
Per
cent
of S
ites
A.
B.
Journal of Neurophysiology, 2001
Carrier frequency variability prevented map expansion and allowed temporal plasticity.
N = 13 rats, 687 sites

Stimulus Paired with NB Activation Determines
Degree and Direction of Receptive Field Plasticity
Frequency Bandwidth Plasticity N = 52 rats; 2,616 sites

Frequency Bandwidth is Shaped by Spatial and Temporal Stimulus Features
Modulation Rate (pps)0 5 10 15
Ton
e P
rob
abil
ity
15%
50 %
10
0%
Journal of Neurophysiology, 2001

Neuron 1
Inputs to Neuron A
Neuron 2
Receptive Field Overlap
Neuron A Neuron B
Inputs to Neuron B
Spike synchronization and RF overlap are correlated.
Brosch and Schreiner, 1999

After Map Expansion: ~85% shared inputs
After Sharper Frequency Tuning: ~25% shared inputs
What is the effect of cortical plasticity on spike synchonization?
Before plasticity: ~50% shared inputsBefore Plasticity: ~50% shared inputs
-50 -40 -30 -20 -10 0 10 20 30 40 500
200
400
600
800
1000
1200N
um
ber
of
Inte
rval
s
Interval (msec)
Cross-correlation: TC 025C1.MAT x TC025C2.MAT
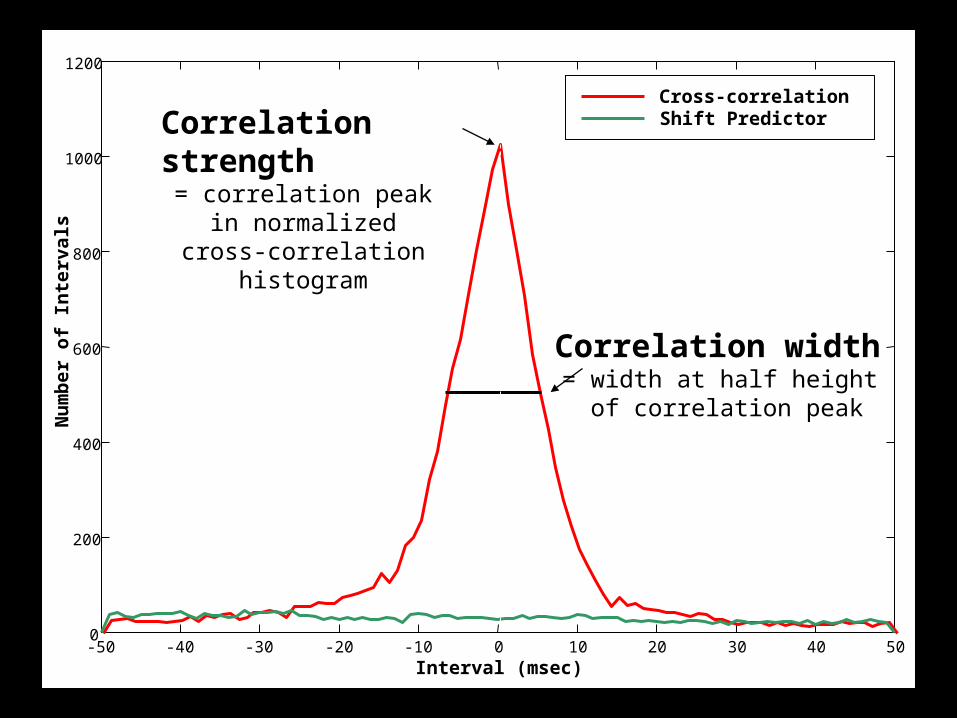
Cross-correlationShift PredictorCorrelation strength
= correlation peak in normalized cross-correlation
histogram
Correlation width = width at half height
of correlation peak

Experience-Dependent Changes in Cortical Synchronization
• Map expansion sharpened synchronization– 15pps 9kHz tone trains
50% increase in cross-correlation height (p<0.0001)
17% decrease in cross-correlation width (p<0.01)
• Bandwidth narrowing smeared synchronization– Two different tone frequencies
50% decrease in cross-correlation height (p<0.0001)
22% increase in cross-correlation width (p<0.001)
• Intermediate stimuli caused no change in synchronization– 15pps tone trains with several different carrier frequencies
No change in cross-correlation height or width
N = 23 rats; 1,129 sites; 404 pairs

Experience-Dependent Changes in Cortical Synchronization (con’t)
• Broadband ripple stimulus sharpened synchronization– Sinusoidal power spectrum (one cycle / 6kHz )
54% increase in cross-correlation height (p<0.0001)
27% decrease in cross-correlation width (p<0.01)
N = 9 rats; 310 sites; 147 pairs

Pairing NB stimulation with aspectrotemporal sequence sharpens
response discharge coherence.

0 10 20 100 110 120 200 210 220 230
-10
0
10
20
30
0
10
20
30
0
10
20
30
40
0
10
20
30
40P
erce
nt o
f Site
s
Time (ms)
CF < 3.2 kHz
CF 3.2-7.75 kHz
CF 7.75-18.6 kHz
CF >18.6 kHz
Sharpened Cortical Response to High-Low-Noise Sequence
// //
// //
Naive After HLN Difference
5 10 15 20 25 300
10
20
30
40
Time to Peak Response (ms)
Per
cent
of S
ites
A)
B)
0 10 20 100 110 120 200 210 220 230-10
0
10
20
30
0
10
20
30
0
10
20
30
40
0
10
20
30
40P
erce
nt o
f Site
s
Time (ms)
CF < 3.2 kHz
CF 3.2-7.75 kHz
CF 7.75-18.6 kHz
CF >18.6 kHz
Sharpened Cortical Response to High-Low-Noise Sequence
// //
// //
Naive After HLN Difference
5 10 15 20 25 300
10
20
30
40
Time to Peak Response (ms)
Per
cent
of S
ites
A)
B)
Peak Latency: 15.2 vs. 18.2 ms (p< 0.00001)
Difference
NaiveAfter HLN
N = 13 rats, 450 sites
Time to Peak Response (ms)
Time (ms)
Spi
kes
per
Sec
ond
Sharpened Cortical Response to High-Low-Noise Sequence

0 10 20 100 110 120 200 210 220 230-10
0
10
20
30
0
10
20
30
0
10
20
30
40
0
10
20
30
40
Spi
kes
per
seco
nd
Time (ms)
CF < 3.2 kHz
CF 3.2-7.75 kHz
CF 7.75-18.6 kHz
CF >18.6 kHz
Sharpened Cortical Response to High-Low-Noise Sequence
// //
// //Naive After HLN Difference
5 10 15 20 25 300
20
40
60
Minimum Latency (ms)
Per
cent
of
Si te
s
5 10 15 20 25 300
20
40
60
Time to Peak Response (ms)
Per
cent
of
Si te
s
A) B)
C)
Increased Population Discharge Coherence

1.1 0.1 2.2+42%
1 0 1.2
1 0.6 1.7
1.5 0.1 0.8
0.3 0.7 2
0.2 1.7
1.3 1.6
Spikes per Element
Stretched
Compressed
Tones Reversed
Degraded
Degraded
Paired w/ BF
Sequence Reversed
High Tone Low Tone Noise Burst
0.1 0.7 2.5+67%
0.2 0.4 2.1
0.1 0.6 2.8+87%
1.3 0.4 0.3
0.5 0.1 2.7+80%
0.6 2.3+53%
0.2 1.5
Spikes per Element
Stretched
Compressed
Tones Reversed
Degraded
Degraded
Paired w/ BF
Sequence Reversed
0 100 200 300 400
1.2 1.4+195%
2.1+35%
1.1 0-100%
1.6
1 1.3+174%
2.6+67%
1.6 1+111%
1
0.4 0.9 2.4+54%
0.5 1.6
1.2 2.1+35%
Spikes per Element
Time (ms)
Stretched
Compressed
Tones Reversed
Degraded
Degraded
Paired w/ BF
Sequence Reversed
A)
B)
C)
Context-Dependent Facilitation

• 5% of sites in naïve animals respond with more spikes to the 5 kHz tone when preceded by the 12 kHz tone, compared to 25% after sequence pairing. (p< 0.005)
• 35% of sites in naïve animals respond with more spikes to the noise when preceded by the high and low tones, compared to 58% after sequence pairing. (p< 0.01)
• 13% of sites in naïve animals respond with more spikes to the 12 kHz tone when preceded by the 5 kHz tone, compared to 10% after sequence pairing.
Context-Dependent Facilitation - Group Data
N = 13 rats, 261 sites
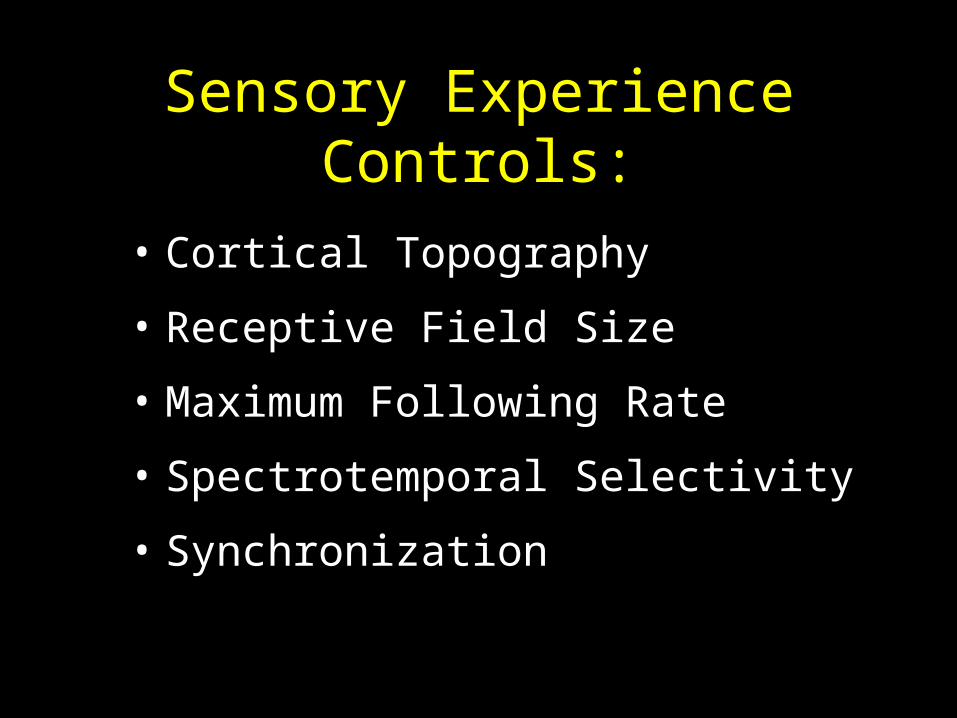
Sensory Experience Controls:
• Cortical Topography
• Receptive Field Size
• Maximum Following Rate
• Spectrotemporal Selectivity
• Synchronization

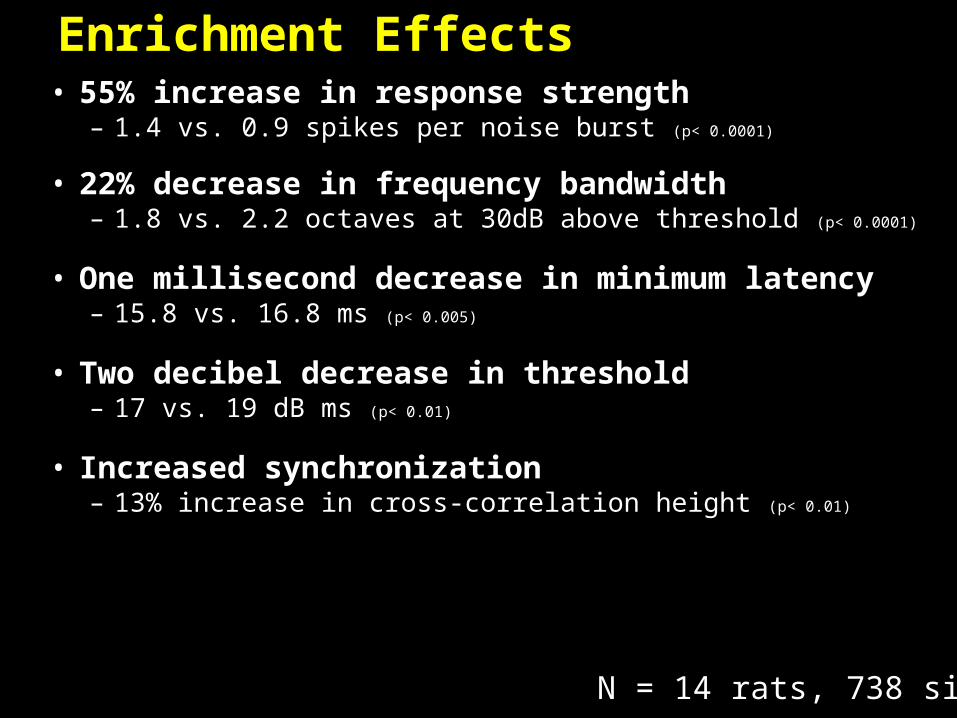
• 55% increase in response strength– 1.4 vs. 0.9 spikes per noise burst (p< 0.0001)
• 22% decrease in frequency bandwidth– 1.8 vs. 2.2 octaves at 30dB above threshold (p< 0.0001)
• One millisecond decrease in minimum latency– 15.8 vs. 16.8 ms (p< 0.005)
• Two decibel decrease in threshold– 17 vs. 19 dB ms (p< 0.01)
• Increased synchronization– 13% increase in cross-correlation height (p< 0.01)
Enrichment Effects
N = 14 rats, 738 sites

Experienceor Instinct
Connectivity & Dynamics
Plasticity
Neural Representation
Importance
External world
Rules of Cortical Plasticity

Experienceor Instinct
Connectivity & Dynamics
Plasticity
Neural Representation
Importance
External world

Experienceor Instinct
Connectivity & Dynamics
Plasticity
Behavioral Change
Neural Representation
Importance
External world


Map BW LatencyEnd of
ResponseSpontaneous
ActivityTone
ResponseRipple
Response
One Frequency 0 0 0 0
Two Frequencies 0 0 0
MultipleFrequencies
0 0 0
Spectral Ripple 0
Spectral Stimuli

Map BW LatencyEnd of
ResponseSpontaneous
ActivityTone
Response
MaximumFollowing
Rate
CombinationSensitivity
15 pps Tone Trains - 9kHz Carrier 0 0 0 0
15 pps Tone Trains - Multiple Carrier Frequencies
0 0 0 0 0
5 pps Tone Trains - Multiple Carrier Frequencies
0 0 0
High-Low-NoiseSequence
0 0
Temporal Stimuli
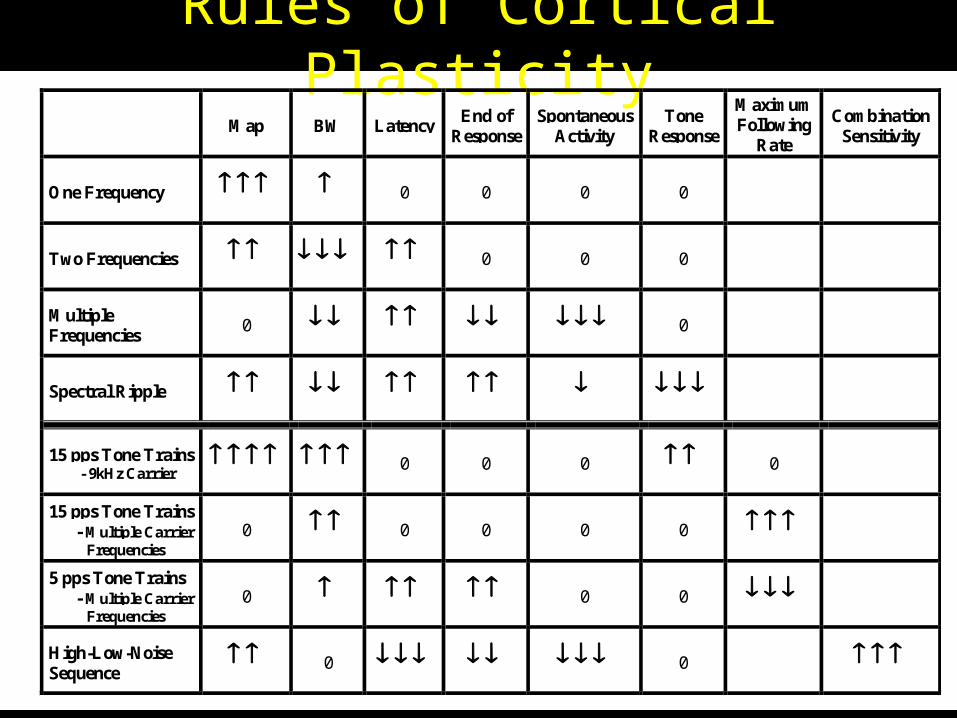
Rules of Cortical PlasticityMap BW Latency
End ofResponse
SpontaneousActivity
ToneResponse
MaximumFollowing
Rate
CombinationSensitivity
One Frequency 0 0 0 0
Two Frequencies 0 0 0
MultipleFrequencies
0 0
Spectral Ripple
15 pps Tone Trains - 9kHz Carrier
0 0 0 0
15 pps Tone Trains - Multiple Carrier Frequencies
0 0 0 0 0
5 pps Tone Trains - Multiple Carrier Frequencies
0 0 0
High-Low-NoiseSequence
0 0
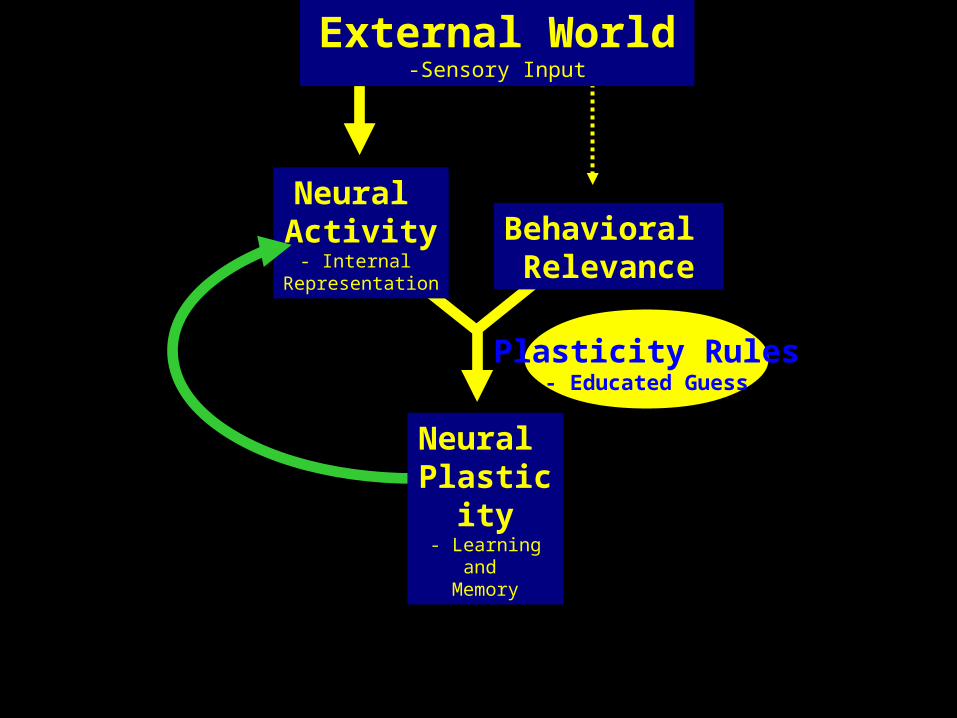
Behavioral Relevance
Neural Activity
- Internal Representation
External World-Sensory Input
Neural Plasticity- Learning and
Memory
Plasticity Rules- Educated Guess

RF Increase Increased Synchrony
Temporal Task: BF Pairing 15 pps, 9 kHz Tone
Width

RF Decrease Decreased Synchrony
Spectral Task: BF Pairing 2 Frequencies Randomly Interleaved
Width
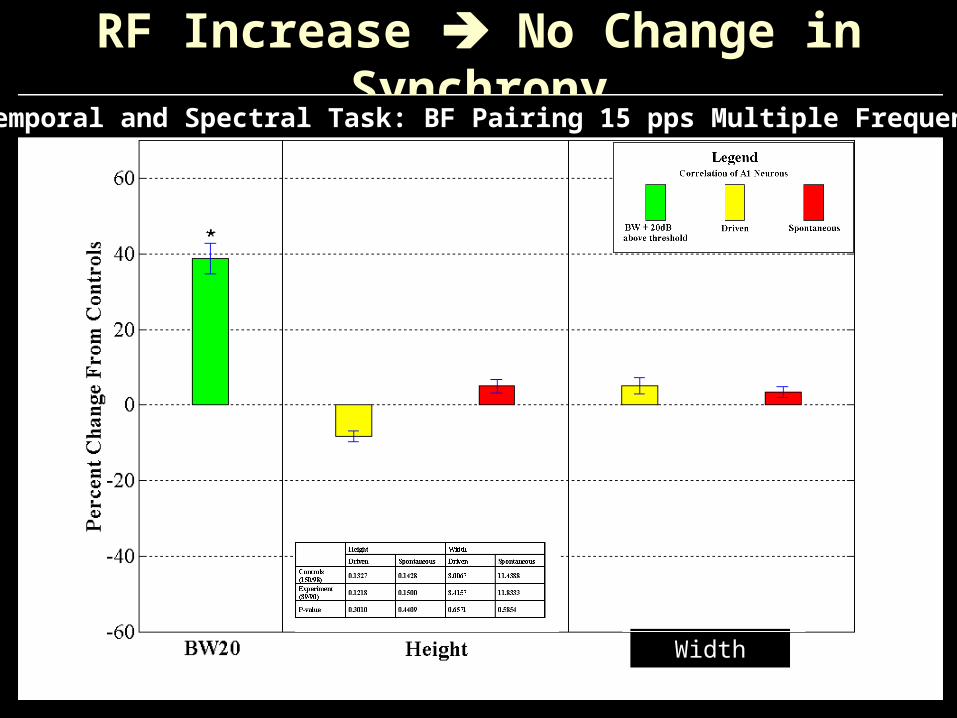
RF Increase No Change in Synchrony
Temporal and Spectral Task: BF Pairing 15 pps Multiple Frequencies
Width

No Change in RF Increased Synchrony
Spectral-temporal Task: BF Pairing Moving Stimuli (FM’s)
Width

RF Decrease Increased Synchrony
Complex Spectral Task: BF Pairing Steady State High Density Ripple
Width
