migration security map of ukraine
TRANSCRIPT

1
MIGRATION SECURITY MAP OF UKRAINE
Contents Introduction ..................................................................................................................................................... 2
1. Asylum seekers from Ukraine into the EU ........................................................................................... 2
2. Internally displaced persons in Ukraine ............................................................................................ 11
3. Ukrainian labour migrants ................................................................................................................... 13
4. Irregular migration from Ukraine to the EU ..................................................................................... 17
5. Readmission agreement ........................................................................................................................ 19
6. Assistance projects to help Internally displaced persons in Ukraine implemented by
international organizations …………………………………………………………………………………………… 21
2
Introduction
Nowadays, Ukraine is on its way to complete Visa Liberalisation Action Plan (VLAP). The
European Mission, which assessed Ukraine's progress in realizing VLAP, has noted with
satisfaction the substantial progress in tasks – fulfilment. On official data, successful VLAP
implementation confirmed by the European Mission will allow the Ukrainian citizens for
visa-free trips to the EU. But there is another factor that can influence on the decision of
the EU Member States; it is a level of migration risks from Ukraine.
Resent events in Ukraine related with annexation of Crimea, armed conflict in Donetsk
and Luhansk regions, devaluation of hryvna and economic crisis caused deep concern of
European politicians around number of asylum seekers and refugees from Ukraine. Among
the articles about Donbas people in the EU, the most interesting article of the influential
European publishing outfit Euarctiv, quotes Robert Visser's words, the director of the
European Office of Asylum Support. He has enrolled Ukraine to the "top six" of countries
sending refugees to the EU. Surely this statement is wrong as well as exaggerated attention
to the Ukrainians in the EU. This document aimed to substantiate why Ukrainian
migration to the EU remains legal and under control of responsible migration services.
1. Asylum seekers from Ukraine into the EU
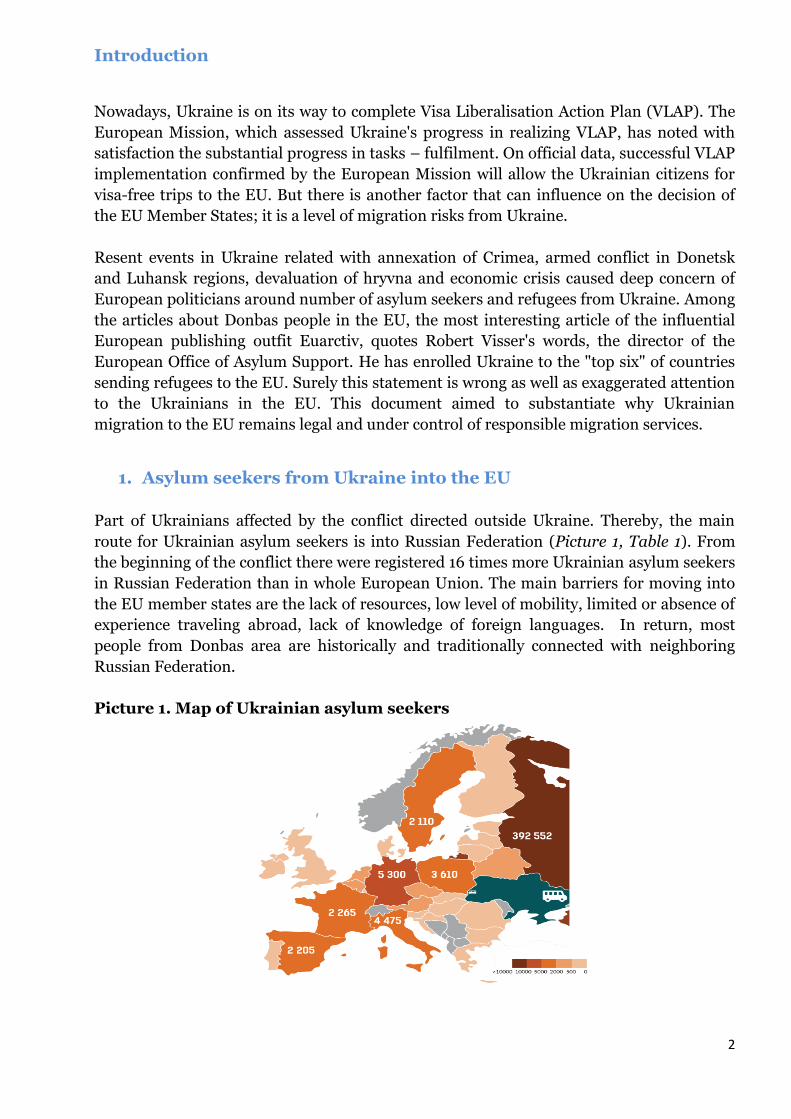
Part of Ukrainians affected by the conflict directed outside Ukraine. Thereby, the main
route for Ukrainian asylum seekers is into Russian Federation (Picture 1, Table 1). From
the beginning of the conflict there were registered 16 times more Ukrainian asylum seekers
in Russian Federation than in whole European Union. The main barriers for moving into
the EU member states are the lack of resources, low level of mobility, limited or absence of
experience traveling abroad, lack of knowledge of foreign languages. In return, most
people from Donbas area are historically and traditionally connected with neighboring
Russian Federation.
Picture 1. Map of Ukrainian asylum seekers

3
Table 1. Number of Ukrainian asylum seekers in 2014-2015*
Destination country Number of Ukrainian asylum seekers
Russian Federation 392552*
Germany 5 300
Italy 4 475
Poland 3 610
France 2 265
Spain 2 205
Sweden 2 110
Czech Republic 900
Belgium 820
Austria 775
Belarus 663**
Netherlands 555
United Kingdom 420
Portugal 400
Finland 335
Greece 245
Denmark 170
Cyprus 135
Estonia 115
Latvia 105
Lithuania 90
Bulgaria 85
Ireland 80
Malta 65
Romania 65
Hungary 50
Luxembourg 40
Slovakia 35
Slovenia 25
Croatia 10
*Data from EU member-states is for 2014 and Q1-Q2 2015, Eurostat1;
Data from Russian Federation is for 2014-23.09.15, Federal Migration Service;
Data from Belarus is for 2014.
In 2014 the number of Ukrainians seeking an asylum in the EU-28 increased 13 times
compared with 2013 year. Even so, Ukraine is not in the top ten countries of origin of
asylum seekers in the EU.
1 http://ec.europa.eu/eurostat/web/asylum-and-managed-migration/data/database
4
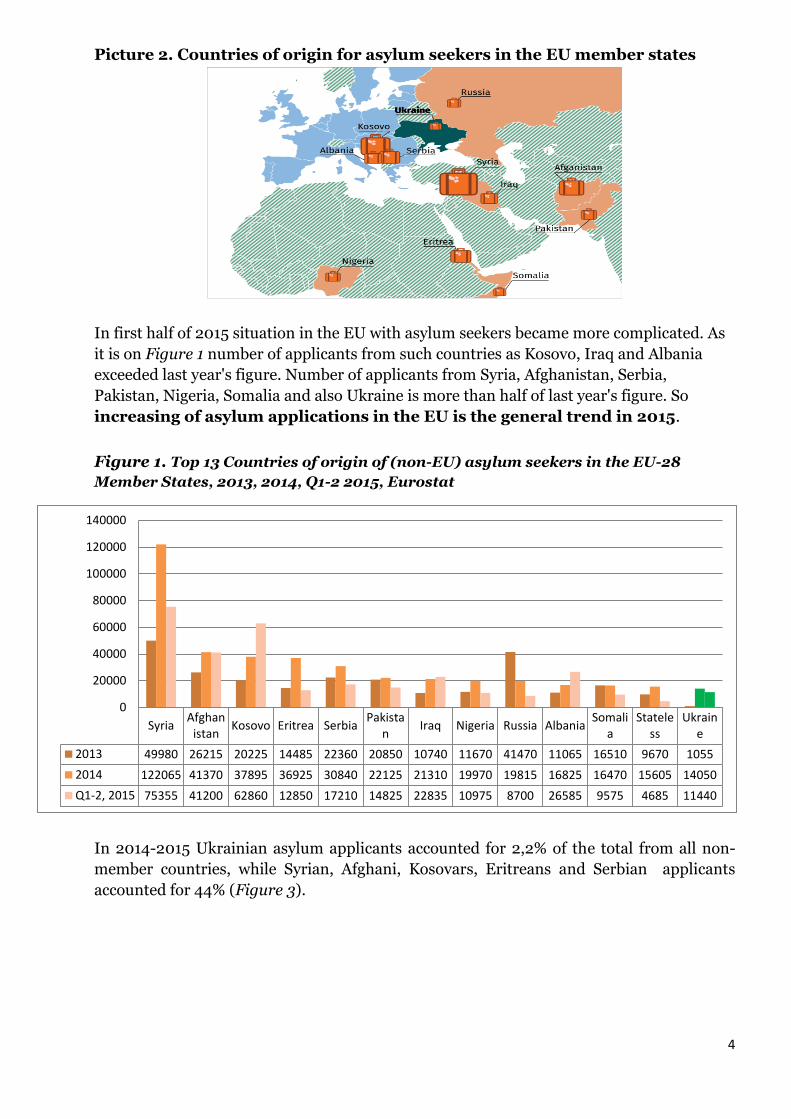
Picture 2. Countries of origin for asylum seekers in the EU member states
In first half of 2015 situation in the EU with asylum seekers became more complicated. As
it is on Figure 1 number of applicants from such countries as Kosovo, Iraq and Albania
exceeded last year's figure. Number of applicants from Syria, Afghanistan, Serbia,
Pakistan, Nigeria, Somalia and also Ukraine is more than half of last year's figure. So
increasing of asylum applications in the EU is the general trend in 2015.
Figure 1. Top 13 Countries of origin of (non-EU) asylum seekers in the EU-28
Member States, 2013, 2014, Q1-2 2015, Eurostat
In 2014-2015 Ukrainian asylum applicants accounted for 2,2% of the total from all non-
member countries, while Syrian, Afghani, Kosovars, Eritreans and Serbian applicants
accounted for 44% (Figure 3).
SyriaAfghan
istanKosovo Eritrea Serbia
Pakistan
Iraq Nigeria Russia AlbaniaSomali
aStatele
ssUkrain
e
2013 49980 26215 20225 14485 22360 20850 10740 11670 41470 11065 16510 9670 1055
2014 122065 41370 37895 36925 30840 22125 21310 19970 19815 16825 16470 15605 14050
Q1-2, 2015 75355 41200 62860 12850 17210 14825 22835 10975 8700 26585 9575 4685 11440
0
20000
40000
60000
80000
100000
120000
140000
5
Figure 2. Share in total number asylum seekers in the EU-28 Member States,
2014, Q1-2 2015, %, Eurostat
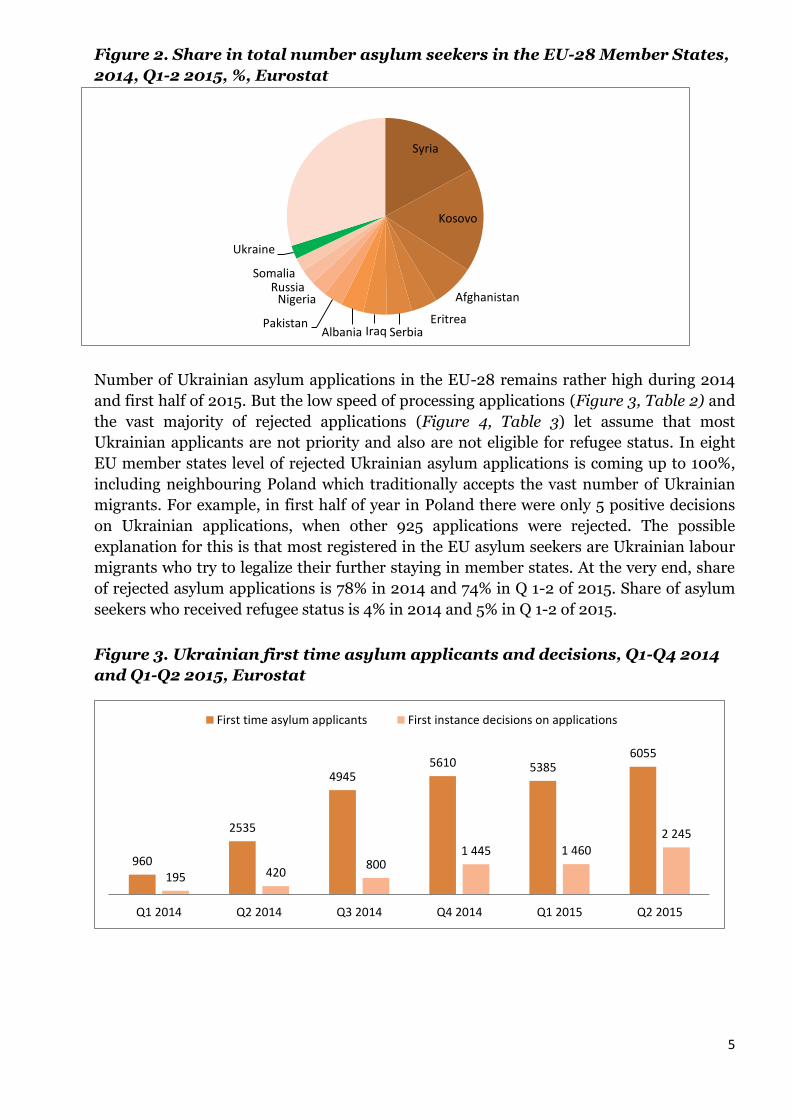
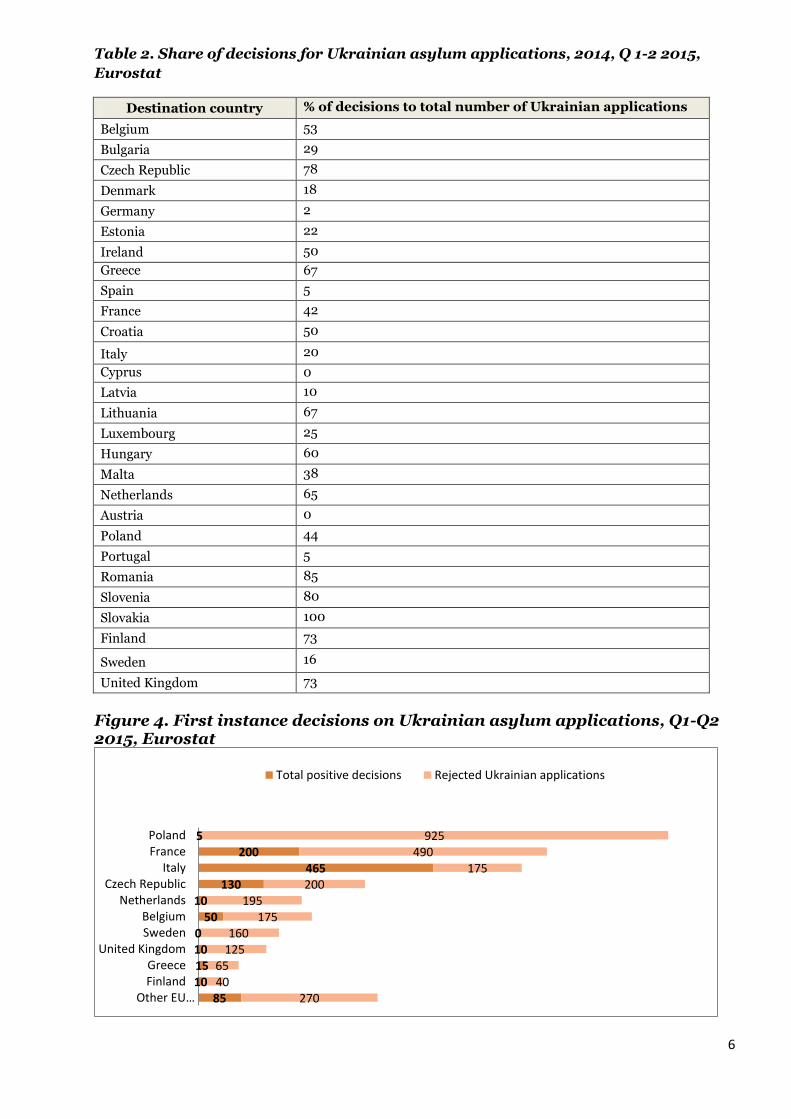
Number of Ukrainian asylum applications in the EU-28 remains rather high during 2014
and first half of 2015. But the low speed of processing applications (Figure 3, Table 2) and
the vast majority of rejected applications (Figure 4, Table 3) let assume that most
Ukrainian applicants are not priority and also are not eligible for refugee status. In eight
EU member states level of rejected Ukrainian asylum applications is coming up to 100%,
including neighbouring Poland which traditionally accepts the vast number of Ukrainian
migrants. For example, in first half of year in Poland there were only 5 positive decisions
on Ukrainian applications, when other 925 applications were rejected. The possible
explanation for this is that most registered in the EU asylum seekers are Ukrainian labour
migrants who try to legalize their further staying in member states. At the very end, share
of rejected asylum applications is 78% in 2014 and 74% in Q 1-2 of 2015. Share of asylum
seekers who received refugee status is 4% in 2014 and 5% in Q 1-2 of 2015.
Figure 3. Ukrainian first time asylum applicants and decisions, Q1-Q4 2014
and Q1-Q2 2015, Eurostat
Syria
Kosovo
Afghanistan
Eritrea Serbia Iraq Albania
Pakistan
Nigeria Russia
Somalia
Ukraine
960
2535
4945 5610 5385
6055
195 420 800
1 445 1 460
2 245
Q1 2014 Q2 2014 Q3 2014 Q4 2014 Q1 2015 Q2 2015
First time asylum applicants First instance decisions on applications
6
Table 2. Share of decisions for Ukrainian asylum applications, 2014, Q 1-2 2015,
Eurostat
Destination country % of decisions to total number of Ukrainian applications
Belgium 53
Bulgaria 29
Czech Republic 78
Denmark 18
Germany 2
Estonia 22
Ireland 50
Greece 67
Spain 5
France 42
Croatia 50
Italy 20
Cyprus 0
Latvia 10
Lithuania 67
Luxembourg 25
Hungary 60
Malta 38
Netherlands 65
Austria 0
Poland 44
Portugal 5
Romania 85
Slovenia 80
Slovakia 100
Finland 73
Sweden 16
United Kingdom 73
Figure 4. First instance decisions on Ukrainian asylum applications, Q1-Q2 2015, Eurostat
85
10 15 10 0
50 10
130 465
200 5
270 40 65
125 160
175 195
200 175
490 925
Other EU…FinlandGreece
United KingdomSwedenBelgium
NetherlandsCzech Republic
ItalyFrancePoland
Total positive decisions Rejected Ukrainian applications
7
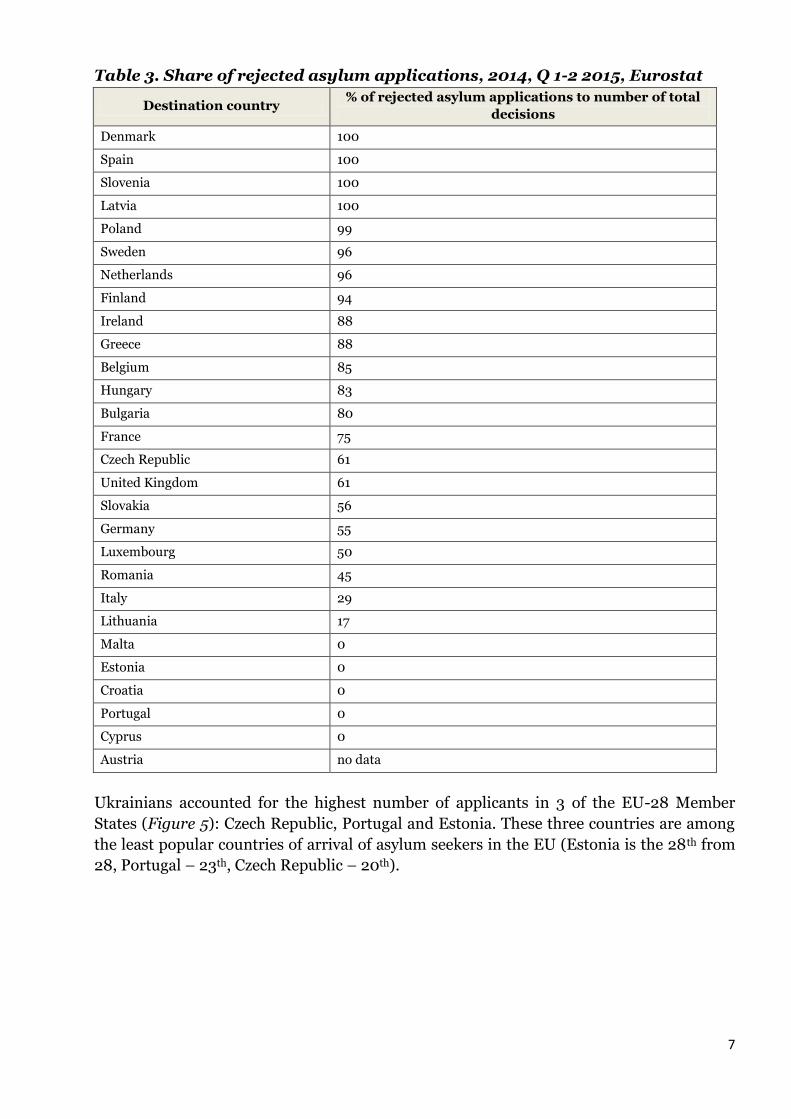
Table 3. Share of rejected asylum applications, 2014, Q 1-2 2015, Eurostat
Destination country % of rejected asylum applications to number of total
decisions
Denmark 100
Spain 100
Slovenia 100
Latvia 100
Poland 99
Sweden 96
Netherlands 96
Finland 94
Ireland 88
Greece 88
Belgium 85
Hungary 83
Bulgaria 80
France 75
Czech Republic 61
United Kingdom 61
Slovakia 56
Germany 55
Luxembourg 50
Romania 45
Italy 29
Lithuania 17
Malta 0
Estonia 0
Croatia 0
Portugal 0
Cyprus 0
Austria no data
Ukrainians accounted for the highest number of applicants in 3 of the EU-28 Member
States (Figure 5): Czech Republic, Portugal and Estonia. These three countries are among
the least popular countries of arrival of asylum seekers in the EU (Estonia is the 28th from
28, Portugal – 23th, Czech Republic – 20th).

8
Figure 5. Five main citizenships of (non-EU) asylum applicants in Czech
Republic, Portugal and Estonia (number, rounded figures), 2014, Eurostat2
Czech Republic # Portugal # Estonia #
Ukraine 515 Ukraine 155 Ukraine 60
Syria 110 Pakistan 25 Sudan 20
Vietnam 65 Marocco 25 Russia 20
Russia 40 Sierra Leone 25 Egypt 10
Cuba 40 Mali 20 Syria 5
Other 375 Other 190 Other 40
Ukrainians accounted for the second highest number of applicants in 4 countries of the EU
Member States (Figure 6): Poland, Spain, Cyprus and Latvia. The highest numbers of
applicants in these countries are from Georgia, Syria and Russia with 1.5 times more than
Ukrainian applicants.
Figure 6. Five main citizenships of (non-EU) asylum applicants in Latvia,
Cyprus, Spain and Poland (number, rounded figures), 2014, Eurostat
Latvia # Cyprus # Spain # Poland #
Georgia 175 Syria 955 Syria 1510 Russia 4000
Ukraine 75 Ukraine 95 Ukraine 895 Ukraine 2275
Syria 35 Egypt 85 Mali 595 Georgia 720
Iraq 20 India 80 Algeria 305 Armenia 135
Afghanistan 15 Vietnam 80 Palestine 200 Kyrgyzstan 120
Other 55 Other 410 Other 2110 Other 770
Ukrainians accounted for the third highest number of applicants in 3 countries of the EU
Member States (Figure 7): Finland, Lithuania, Slovakia. The highest numbers of applicants
in these countries are from Iraq, Somalia, Georgia, Afghanistan and Syria with 1.5 times
more than Ukrainian applicants.
Figure 7. Five main citizenships of (non-EU) asylum applicants in Slovakia,
Lithuania and Finland (number, rounded figures), 2014, Eurostat
Slovakia # Lithuania # Finland #
Afghanistan 95 Georgia 115 Iraq 820
Syria 40 Afghanistan 85 Somalia 410
Ukraine 25 Ukraine 70 Ukraine 300
Vietnam 25 Russia 55 Afghanistan 205
Somalia 20 Vietnam 30 Russia 200
Other 125 Other 85 Other 1685
Considering top ten countries of the EU with the highest number of asylum applicants
(Figure 8), number of Ukrainian applicants is mainly much smaller than from Syria or
2 http://ec.europa.eu/eurostat/statistics-explained/index.php/Asylum_statistics

9
neighbouring Russia. For instance, percentage of Ukrainian applicants does not exceed 8%
among these countries.
Figure 8. Top ten countries of the EU with the highest number of asylum
applicants, 2014, Eurostat
Among countries of the EU with the medium level of asylum applicants (Figure 9), number of
Ukrainian applicants exceeds both Syrian and Russian only in Finland and Ireland. However,
in Ireland number of Ukrainian applicants is 4%, in Finland – 10%. Rather high percentage of
Ukrainian applicants is in Poland (28%) and Spain (16%). But number of Russian applicants in
Poland (50%) and Syrian applicants in Spain (27%) are still higher.
Figure 9. Countries of the EU with the medium level of asylum applicants,
2014, Eurostat
0% 10% 20% 30% 40% 50% 60% 70% 80% 90% 100%
Greece
Netherlands
Belgium
Austria
United Kingdom
Hungary
Sweden
France
Italy
Germany
Asylum applicants from other countries Syrian applicants Russian applicants Ukrainian applicants
0% 10% 20% 30% 40% 50% 60% 70% 80% 90% 100%
Cyprus
Romania
Malta
Luxembourg
Ireland
Finland
Spain
Poland
Bulgaria
Denmark
Asylum applicants from other countries Syrian applicants Russian applicants Ukrainian applicants

10
Among countries of the EU with the lowest level of asylum applicants (Figure 10),
percentage of Ukrainian applicants is rather high, especially in Czech Republic (44%),
Estonia (38%) and Portugal (35%).
Figure 10. Countries with the lowest level of asylum applications
To sum up, number of Ukrainians who sought asylum in the EU-28 in 2014 increased 13
times compared to 2013 year. Even so, Ukraine is not among top ten countries of origin of
asylum seekers in the EU. Number of Ukrainian asylum seekers in the EU countries with
the highest level of asylum applicants (Germany, Italy, France and Sweden) is not
significant. For example, percentage of Ukrainian applicants does not exceed 4% among
these countries of destination. Instead, Ukrainians accounted for the highest number of
applicants in the least popular countries of arrival of asylum seekers like Czech Republic,
Portugal and Estonia. Most likely it happens because of steadily low inflow of asylum
seekers in these countries. Finally, the majority of Ukrainian asylum applications were
rejected (78% in 2014, 74% in Q 1-2 in 2015). The most likely reason of high level of
rejection is the relocation of Ukrainians for economic reasons to the more prosperous
European countries.
0% 10% 20% 30% 40% 50% 60% 70% 80% 90% 100%
Estonia
Latvia
Slovakia
Portugal
Slovenia
Lithuania
Croatia
Czech Republic
Asylum applicants from other countries Syrian applicants Russian applicants Ukrainian applicants

11
2. Internally displaced persons in Ukraine
The emergence of internally displaced people in Ukraine is the result of annexation of
Crimea and armed conflict in the Eastern Ukraine (Donetsk and Lugansk regions). Despite
the bilateral ceasefire started from 15 February 2015, the concentrated fighting remains
along the frontline. The most unstable situation is near Donetsk city, Lugansk city and
Mariupol. Totally, territories occupied by pro-Russian separatists are no more than 5 % of
Ukraine.
In accordance with Ministry of Social Policy, on 2 November 2015 there were registered
1,563,530 IDP‟s3. There are several reasons why this statistic is not accurate:
Still there are difficulties with the registration of newly arrived IDP‟s and re-
registration of IDPs with expiring certificates.
Many pensioners have registered as IDP‟s to be able to receive pension payments
from Government of Ukraine, and then moved back home to the occupied
territories or to the neighbouring countries (Russian Federation, Belarus). That‟s
why the percentage of pensioners among IDP‟s in government-controlled areas of
Donetsk and Lugansk regions and Kharkov and Zaporozhe regions are much higher
than working age adults (Figure 1).
Although according to Ukrainian legislation inhabitants of the occupied territories
cannot be mobilized to the army, so men in the age of conscription often do not
registered as IDP‟s not to be sent to the army.
Some IDP‟s returned to the conflict zones after registration, as the devaluation of
the national currency has limited their ability to afford basic living expenses,
including rent and food4.
State Emergency Service reported about 999,422 IDPs who were replaced from the
beginning of the conflict till 20 November 2015. So, various sources of information
provide different data about IDPs5.
3 http://www.mlsp.gov.ua/labour/control/uk/publish/article?art_id=183027&cat_id=107177
4 http://www.brookings.edu/~/media/research/files/reports/2015/05/ukraine-internal-displacement/ukrainian-govt-
responses-to-internal-displacement-may-2015.pdf 5 http://www.mns.gov.ua/news/34232.html

12
Figure 1. IDPs in Ukraine, July 2015
The last comprehensive research of Kyiv International Institute of Sociology about the
IDPs shows that 54% of respondents consider their situation as temporary, and would like
to return home. 26% intend to return home during this period, and others are undecided.
So the results of research shows that most Ukrainian IDPs have intentions to return home
and do not consider to stay in their temporary homes or move outside Ukraine.
According to Internal Displacement Monitoring Centre67, Ukraine is in a top nine countries
with the highest number of IDP‟s after the conflict. However, share of Ukrainian IDP‟s is
3,5% of the total population and it is much lower than in other countries (Figure 2).
Figure 2. Countries with the highest number of IDP's after the conflict
6 http://www.internal-displacement.org/europe-the-caucasus-and-central-asia/ukraine/
7 http://www.internal-displacement.org/global-figures
59% 24%
13% 4%
Pensioners
Working age
Children
Disabled

13
Since March 2015, special law establishes guarantees of the rights, freedoms and legitimate
interests of internally displaced persons. In October 2014, Resolution 509 established a
unified registration system for IDPs, administered by the Ministry of Social Policy. This
resolution provided for legal recognition of IDPs, allowing them to access state support
and entitlement to government assistance, pensions and free housing for a period of up to
six months, with the possibility of extension. Special informational resource for IDP‟s was
created by the Ministry of Regional Development, Construction, Housing and Communal
Services of Ukraine. This website included information about contact centres for IDPs, free
housing, guidelines for finding work, and suggestions for dealing with other issues.
To sum up, due to annexation of Crimea and conflict between pro-Russian separatist forces and Ukraine in Donetsk and Lugansk regions, 1,5 million internally displaced people appeared in Ukraine. Territories occupied by pro-Russian separatists are no more than 5 % of Ukrainian total area. These territories are far from the Ukrainian borders with the EU states. So the main routes for people affected during the conflict directed to border regions of Ukraine and Russian Federation. Number of registered IDP‟s, especially pensioners is not accurate. Mostly, IDPs are going to return home.
3. Ukrainian labour migrants
According to the last Labour Migration Survey8 2012, 1.2 million, or 5.7% of the Ukrainian
population aged 15-70 were identified as labour migrants, who have been working from
January 2010 until June 2012. Almost half of these (48.5%) were short-term labour
migrants (circular migration). The Russian Federation was the main focus of Ukrainian
migration in 2012 followed by Poland according to the survey.
Number of labour migrants from Ukraine in 2015 increased because of socio-economic
reasons. Devaluation of national currency, reducing of number of business entities and the
emergence of internally displaced persons affected the unemployment rate. In addition,
increased inflation caused the reduction of real wage in Ukraine. There was rapid price
increase of utilities, transport fares, medicines and food.
8 http://www.ilo.org/wcmsp5/groups/public/---europe/---ro-geneva/---sro-
budapest/documents/publication/wcms_244693.pdf
43636470
10068200
176961018
183300000
66542600
35700000
30800000
42855800
14400000
1563530
1631800
1538982
1800000
2857400
3100000
4000000
6044200
7600000
Ukraine (November, 2015)
South Sudan (September, 2015)
Nigeria (April, 2015)
Pakistan (July, 2015)
Democratic republic of the Congo (March, 2015)
Sudan (January, 2015)
Iraq (June, 2015)
Colombia (December, 2014)
Syria (July, 2015)
Rest of the population Number of IDPs

14
Picture 1. Destination countries of Ukrainian migrants (%), 2010-2012
However, even before the beginning of conflict situation in Donetsk and Lugansk regions
in 2013 Ukrainians were the top non-EU citizens granted first residence permit in the EU
(Picture 2)9. Most of Ukrainians received an employment related permit and the principal
destination country was Poland.
Figure 1
9 http://ec.europa.eu/eurostat/statistics-explained/index.php/Residence_permits_statistics
8% 7%
64%
21%
Ukrainians granted a first residence permit in the EU-28, distribution by reason,
in 2013
Family Education Employment Other
24851
7453
13996
18622
171769
8954
435
8581
9324
124419
Other EU-28
Denmark
Italy
Czech Republic
Poland
Ukrainians granted a first residence permit in the
EU-28, in 2013
First permits issued for employment
Total first permits
15
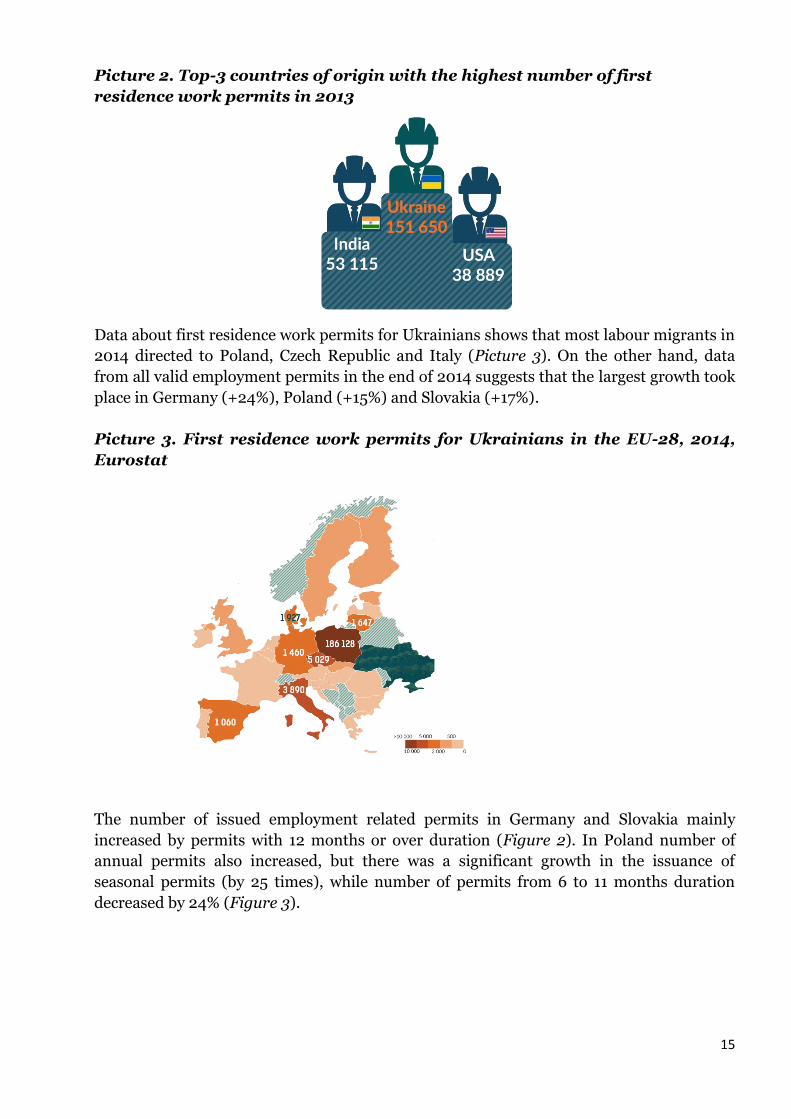
Picture 2. Top-3 countries of origin with the highest number of first
residence work permits in 2013
Data about first residence work permits for Ukrainians shows that most labour migrants in
2014 directed to Poland, Czech Republic and Italy (Picture 3). On the other hand, data
from all valid employment permits in the end of 2014 suggests that the largest growth took
place in Germany (+24%), Poland (+15%) and Slovakia (+17%).
Picture 3. First residence work permits for Ukrainians in the EU-28, 2014,
Eurostat
The number of issued employment related permits in Germany and Slovakia mainly
increased by permits with 12 months or over duration (Figure 2). In Poland number of
annual permits also increased, but there was a significant growth in the issuance of
seasonal permits (by 25 times), while number of permits from 6 to 11 months duration
decreased by 24% (Figure 3).

16
Figure 2
Figure 3
Thus, current number of labour migrants from Ukraine probably is higher than 1.2 million
people because of socio-economic causes. One of the possible ways to track the actual
number of Ukrainian labour migrants in the EU is to explore residence permit statistics.
However, it is necessary to consider that not all labour migrants are working with work
permits. Many of them are working without official status, with temporary registration or
even having a tourist visa.
According to Eurostat, in 2013 before the beginning of conflict situation in Donetsk and
Lugansk regions Ukrainians were the top non-EU citizens granted first residence permit in
the EU. In 2013 most of Ukrainians received work permit in Poland. Much more
Ukrainians left for work in Poland for a sort-term period (from 3 to 5 months) and in
Germany, Slovakia for more than 12 months.
73
83
1017
1120
2486
3232
2013
2014
Number of issued employment related permits for Ukrainians in Germany
From 3 to 5 months From 6 to 11 months 12 months or over
2
0
254
254
1494
1795
Slovakia 2013
Slovakia 2014
Number of issued employment related permits for Ukrainians in Slovakia
From 3 to 5 months From 6 to 11 months 12 months or over
1585
38922
102246
77929
4140
7587
2013
2014
Number of issued employment related permits for Ukrainians in Poland
From 3 to 5 months From 6 to 11 months 12 months or over
17
4. Irregular migration from Ukraine to the EU
According to European Migration Network, irregular migration is a Movement of persons
to a new place of residence or transit that takes place outside the regulatory norms of the
sending, transit and receiving countries.
In the opinion of Migration Policy Centre, in 2013 Ukraine became one of the major transit
countries for irregular migrants from former USSR states (Russia, Uzbekistan, Azerbaijan,
Georgia and Armenia) to Western Europe. Recent annexation of Crimea and armed
conflict in the Eastern Ukraine are important factors affecting population movements.
However,these events has not resulted in marked changes in irregular migration
movements towards the EU (Frontex).
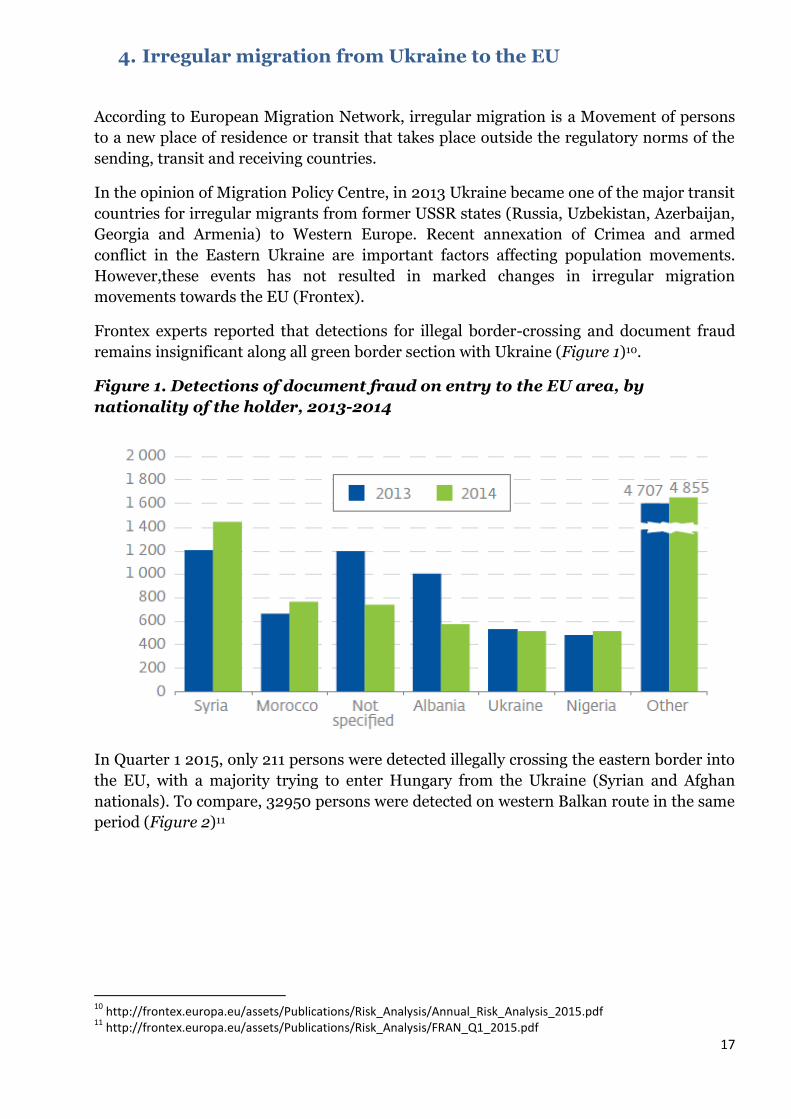
Frontex experts reported that detections for illegal border-crossing and document fraud
remains insignificant along all green border section with Ukraine (Figure 1)10.
Figure 1. Detections of document fraud on entry to the EU area, by
nationality of the holder, 2013-2014
In Quarter 1 2015, only 211 persons were detected illegally crossing the eastern border into
the EU, with a majority trying to enter Hungary from the Ukraine (Syrian and Afghan
nationals). To compare, 32950 persons were detected on western Balkan route in the same
period (Figure 2)11
10
http://frontex.europa.eu/assets/Publications/Risk_Analysis/Annual_Risk_Analysis_2015.pdf 11
http://frontex.europa.eu/assets/Publications/Risk_Analysis/FRAN_Q1_2015.pdf

18
Figure 2
Since 2009 (with the exception of 2013 when Russians of Chechen origins ranked first),
most of the persons refused entry at EU borders were Ukrainians. The number of refusals
of entry for Ukrainians in 2014 remained comparable to previous years (Figure 3). The
same main reasons for refusals of entry were the lack of a valid visa (30%) and the lack of
appropriate documentation justifying the purpose of stay (21%).
Figure 3
In 2014 more Ukrainians were detected staying illegal in EU countries and then were
effectively returned. Frontex experts believe that Ukrainian illegal stayers had entered the
EU legally and overstayed or entered the EU through the abuse of legal means, such as
fraudulently obtained work or business visas12. According to Eurostat information on 13
EU Member States, Ukrainians mostly have voluntary returned to Ukraine from Belgium,
Slovakia, Latvia, France, Sweden, Estonia and Romania. Much smaller number of
12
http://frontex.europa.eu/assets/Publications/Risk_Analysis/EB_ARA_2015.pdf
15811
18108
16380 16809
14000
16000
18000
20000
2011 2012 2013 2014
Refusals of entry at the external borders for Ukrainians

19
Ukrainians has perforce returned to Ukraine from other countries in Figure 4, except
Hungary.
Figure 4. Ukrainians who have left the EU by type of return, 2014, Eurostat
5. Readmission agreements
The Agreement between Ukraine and the European Communities (European Union) on
the readmission of persons, which is in force since 2008, allows the authorities of EU
Member States to directly readmit third country nationals who have entered the Union
illegally from Ukraine. At the end of 2013, Ukraine has signed implementing protocols of
the Agreement with Czech Republic, Austria, and Estonia. It also prepared and processed
draft implementing protocols with Cyprus, Poland, Portugal and Italy. The negotiations on
concluding the readmission agreement with Swiss Confederation, Spain and Serbia were
on their final stage.
According to State Migration Service of Ukraine, number of total received readmission
requests in 2014 increased by 67 % (Figure 5). Besides, readmission was concurred for
10% fewer individuals.
Figure 5. Number of received readmission requests in Ukraine (2013-2014),
Eurostat
5 5 5 10 15 25 35 35
95 130
220 355
430
5 195
5 10
35 80
40 15 25
25 115
5 100
95
5 Slovenia
Hungary
Croatia
Portugal
Italy
Estonia
France
Slovakia
Voluntary return Enforced return Other
50
114
161
228
2013
2014
Number of declined readmission requests Number of individuals with concurred readmission

20
Specific data for Ukrainians and other third country nationals who have left EU Member
States to Ukraine by type of readmission agreement procedure is available on Eurostat
only for six countries. As it is on Figure 5, in 2014 only from Hungary there were returned
to Ukraine under EU readmission agreement 190 nationals, from Slovakia – 5 nationals.
From Croatia there were returned under other readmission agreement 5 nationals.
Probably, data on concurred readmission from State Migration Service of Ukraine is
inaccurate and underestimated.
Figure 6. Third-country nationals who have left EU Member States to
Ukraine by type of agreement procedure
To sum up, irregular migration from Ukraine to the EU remains comparable to previous
years. Primary problem in this sphere is the increased number of Ukrainians staying illegal
in EU countries.
6. Assistance projects to help Internally displaced persons in Ukraine
implemented by international organizations
United Nation High Commissionaire on Refugees UNHCR continues to support government and civic society in their response to the
displacement, as well as provides aid directly to the most vulnerable.
Technical Assistance to the Government
On October 22, UNHCR, Ministry of Social Policy (MSP) of Ukraine and Georgian
Innovation and Development Foundation signed Memorandum of Understanding which
envisions technical assistance to MSP in order to develop registration system for
IDPs. (total value of 2,5 mln. UAH/160,000 USD).
On November 10, UNHCR signed a Memorandum of Understanding with the State
Emergency Service of Ukraine. Within the frameworks of Memorandum, the Agencies
agreed to join their efforts to address problems of IDPs. (value of 58,000 USD).
Since March, UNHCR has provided more than 500,000 UAH of technical assistance to
local authorities in Kyiv, Luhansk, Kherson, Lviv and Dnipropetrovsk region in mounting a
response to internal displacement.
0
190
5
5
5
45
445
Slovenia
Bulgaria
Croatia
Hungary
Portugal
Slovakia
Returned under EU Readmission Agreement
Returned under other readmission agreement
Returned without existing of readmission agreement

21
Support to Civil Society
- 250,000 USD are allocated to establish of a network of legal counselors in Kyiv, Odesa,
Dnipropetrovsk, Kharkiv, Lviv, Mariupol, Zaporizhzhia and Zakarpattia through the
partner NGO Right to Protect to strengthen the provision of free legal aid to IDPs;
- 176,000 USD for provision of social assistance to IDPs through its partner Crimean
Development Fund (Crimea SOS) in Lviv, Kherson and Kyiv regions;
- 1,300,00 UAH / 87,000 USD for strengthening capacity of local NGOs assisting IDPs
Dnipropetrovsk, Zaporizhzhia and Vinnytsia;
UNHCR has signed a memorandum with Ukrainian National Society of Red Cross to
supply NFIs and supplementary food to 5,000 IDPs in different locations around Ukraine.
First 625 packages were already distributed in Kharkiv region as a pilot project in July -
August 2014, reaching nearly 1,700 beneficiaries.
Non Food Items
As of 20 January, UNHCR has dispatched over 24,700 blankets, 25,000 bed linens, 7,000
towels, 6,800 clothing sets, 2,200 kitchen sets and 8,200 food packages assisting more
than 50,000 persons.
In 2015, UNHCR has also established its presence in Donetsk city, and has so far assisted
over 8,500 vulnerable individuals affected by the conflict in non-GVT controlled areas
(NFI and emergency shelter repairs). In addition, UNHCR delivered NFIs and shelter
assistance (incl. construction material, heating, furniture) to 6,000 vulnerable IDPs and
others affected by the conflict in northern Donetsk, Kharkiv, Luhask and Kyiv, including
new arrivals from Debaltseve, Avdiyivka and Vuhlehirsk. UNHCR provided 120 beds in
two earlier refurbished centers in Artemivsk to accommodate evacuees from Central
Donetsk region. Between 25 and 26 January UNHCR also helped with NFIs and plastic
sheeting to some 2,900 people whose homes were damaged or destroyed in Mariupol after
the shelling.
Distributions, both direct and through partners, took place in conflict affected areas of
Donetsk and Luhansk regions, first-line reception regions – Kharkiv, Dnipropetrovsk,
Zaporizhzhia and Kyiv.
Shelter
UNHCR with our partner People in Need plan to repair and make ready for the winter a
further 12 collective centres in northern Donetsk and Kharkiv region. This brings the total
number of premises under different stages of refurbishment to 47.
The rehabilitation of collective centres in Kharkiv, Luhansk, Donetsk, Dnipropetrovsk and
Zaporizhzhia regions is ongoing through direct implementation or partnership with local
authorities.
UNHCR delivered 400,000 square metres of enforced plastic tarpaulin to be used for fast
repairs in the eastern parts of Ukraine affected by the conflict. UNHCR also started a first
batch of 8,580 asbestos-free roofing sheets to cover immediate repairs of destroyed
houses.

22
UN Development Program to support Ukrainian IDPs
United Nations Development Program together with Luhansk and Donetsk employment
centers implemented a training program "Development of entrepreneurship skills among
IDPs and local population of Donetsk and Luhansk regions". The aim of the program is
to facilitate the entrepreneurs, who lost their business in Donbas, to restore their activity in
other regions of Ukraine. It is expected to involve about 1200 IDPs.
48 trainings are planned to be conducted in 8 regions of Ukraine with the highest level of
IDPs: Kyiv, Odesa, Kharkiv, Zaporizhya (and Berdiansk city), Dnipropetrovsk (and Kryvyi
Rih), Poltava (and Kremenchuh) and controlled by the government of Ukraine in
Kramatorsk, Mariupol (Donetsk region) and Severodonetsk (Luhansk region).
The initiative is a part of the “Rapid response to the social and economic issues of IDPs in
Ukraine” program, which is funded by the Government of Japan. Ministry of Social Policy
of Ukraine, the State Employment Service and local authorities also joined this project.
Early Recovery of Social Services and Peacebuilding in Donetsk and Lugansk
Oblasts
Project dates: November 2014 - December 2015
Total budget: $5 104 211
Geographic coverage: Donetsk and Lugansk oblasts
Focus Area: Social Development
Project Summary
Armed conflict in Donetsk and Lugansk oblasts has adverse impact on social and economic
spheres of the country. Due to lack of access to social care services in the region, the
vulnerable groups such as lonely elderly people, children, people with disabilities, sick
people, homeless, etc. suffer the most.
The overall objective of the Project is to support restoration of critical social infrastructure
and services for the most vulnerable groups in Donetsk and Lugansk Oblasts.
Rapid Response to the Social and Economic Issues of Internally Displaced
Persons in Ukraine
Project dates: August 2014 - February 2016
Geographic area: 8 oblasts: Kharkiv, Dnipropetrovsk, Kyiv, Zaporizhia, Odesa, Poltava, the
territories of Donetsk and Luhansk oblast without armed conflict.
Scope of work: Sustainable development pathway
Objective of the Project
The overall objective of the Project is to strengthen the coping mechanisms for improving
livelihoods of IDPs in their new locations and, where appropriate, to support reintegration
into their home locations.
Specifically, the objectives of the Project are: (i) enhancing capacity of the government on
planning, management and coordination of the responses to IDP issues at national and
sub-national levels; (ii) improving livelihoods of IDPs in relocated and home places by
providing them employment and social services; (ііі) promoting social cohesion,
reconciliation, and integration/reintegration of IDPs in relocation and home places.

23
International Organization for Migration
Employment, microenterprise and self-employment
As of December 2015, internally displaced people and host community members living in
Odesa, Lviv, Kyiv, Vinnytsya, Khmelnytsky, Zhytomyr, Cherkasy, Kharkiv, Slovyansk,
Kramatorsk, Severodonetsk, Sumy, Mykolaiv, Kirovohrad, Zaporizhzhya, and
Dnipropetrovsk regions are taking part in the trainings on employment and self-
employment organized in these cities by IOM partner NGOs.
The trainings‟ participants are officially registered displaced persons and host community
members of employable age who wished to improve or obtain new professional skills or
start own business and to become involved in realization of the projects on communities‟
stabilization.
Under the guidance of qualified trainers the participants are able to develop business plans
for grants to purchase equipment or participate in the training activities. The grants to
start their own business or enroll to vocational training will receive those participants who
manage to pass all the trainings‟ and projects‟ selection stages.
From December 2014 until April 2015 with the financial support of the European
Union, the International Organization for Migration had provided one-time unconditional
cash assistance to 23,264 internally displaced people in Kharkiv city and Kharkiv region.
The project identified the most vulnerable groups, including disabled, elderly, single
parents and families with many children who were provided opportunity to cover the most
urgent needs in terms of resettlement and winter, such as purchase of medicines, warm
clothes, paying for housing and food.
More than 27 000 vulnerable IDPs in 16 regions of Ukraine received clothes, shoes,
bedding, medical supplies and other assistance with the financial support of the
United States, Norway, Switzerland, Germany, Canada and the United
Nations.
FREE INFORMATION HOTLINE FOR INTERNALLY DISPLACED PERSONS
SUPPORTED BY IOM AND FUNDED BY THE EUROPEAN UNION
The National Toll-Free Hotline to support IDPs was established on 6 March 2015. It is run
by the non-government organization Donbas SOS. The hotline operates within the
framework of the EU funded project „Comprehensive Stabilization Support to IDPs and the
Affected Population in Ukraine‟ implemented by the International Organization for
Migration (IOM), Mission in Ukraine. Since March 2015 the hotline has served about
22,000 calls.
The operators of the Hotline provide information, legal, psychosocial support to IDPs,
conduct referrals of especially sensitive inquiries, including on trafficking or SGBV, and
liaise with the main state and non-governmental actors providing counseling,
rehabilitation and integration services for IDPs.