mina lake site description - gfp.sd.gov · mina lake is an impoundment owned by the state of south...
TRANSCRIPT

Mina Lake
Site Description
Location Water designation number (WDN) 26-0003-00 Legal description T123N-R66W-Sec.12-14, 23-26 County (ies) Brown; Edmunds Location from nearest town 14.0 miles east of Ipswich, SD Survey Dates and Sampling Information Survey dates August 4-6, 2015 (FN, GN)
September 28, 2015 (EF-WAE) Frame net sets (n) 18 Gill net sets (n) 6 Electrofishing-WAE (min) 60
Morphometry (Figure 1) Watershed area (acres) 195,000 Surface area (acres) 806 Maximum depth (ft) 27 Mean depth (ft) 9 Ownership and Public Access
Mina Lake is an impoundment owned by the State of South Dakota and the fishery is managed by the SDGFP. Two public access sites are located on Mina Lake, one within the state park and the other along the southeastern shore near the outlet structure (Figure 1). The shoreline has mixed ownership including the State of South Dakota and private individuals.
Watershed and Land Use
Land use within the Mina Lake watershed is primarily agricultural and includes a mix of cropland (cultivated and non-cultivated) and range/pastureland. Housing and small shelterbelts/farmsteads comprise the remaining portions.
Water Level Observations
Water levels on Mina Lake are not monitored by SDDENR. Fish Management Information Primary species black crappie, bluegill, channel catfish, walleye, Other species black bullhead, common carp, emerald shiner, freshwater drum,
golden shiner, green sunfish, largemouth bass, northern pike, orangespotted sunfish, rock bass, rudd, shortnose gar, white bass, white sucker, yellow perch
Lake-specific regulations none Management classification warm-water permanent Fish consumption advisories none

Figure 1. Map depicting depth contours of Mina Lake, Edmunds County, South Dakota.

Upper
Lower
Figure 2. Map depicting geographic location of Mina Lake from Ipswich, Edmunds County, South Dakota (top). Also noted are upper and lower section designations (bottom).

Upper
Lower
Figure 3. Map depicting access points and standardized net locations for upper and lower sections of Mina Lake, Edmunds County, South Dakota. MFN= frame nets, MGN= gill nets
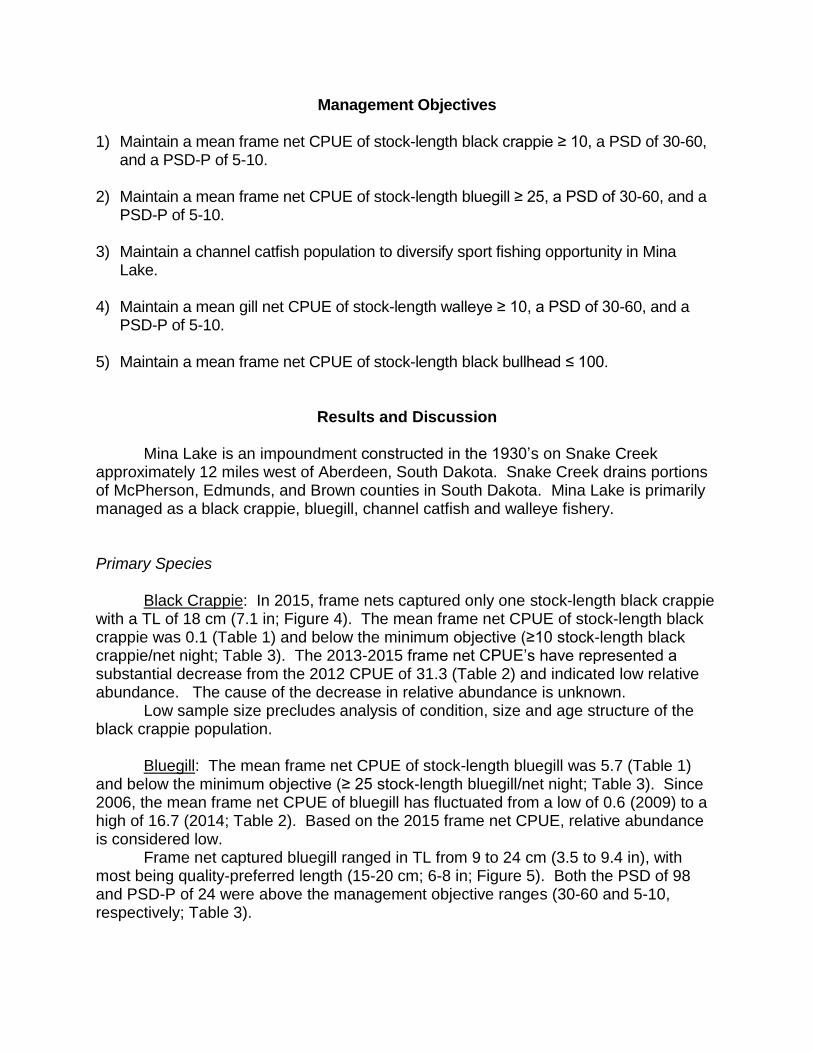
Management Objectives 1) Maintain a mean frame net CPUE of stock-length black crappie ≥ 10, a PSD of 30-60,
and a PSD-P of 5-10. 2) Maintain a mean frame net CPUE of stock-length bluegill ≥ 25, a PSD of 30-60, and a
PSD-P of 5-10. 3) Maintain a channel catfish population to diversify sport fishing opportunity in Mina
Lake. 4) Maintain a mean gill net CPUE of stock-length walleye ≥ 10, a PSD of 30-60, and a
PSD-P of 5-10. 5) Maintain a mean frame net CPUE of stock-length black bullhead ≤ 100.
Results and Discussion Mina Lake is an impoundment constructed in the 1930’s on Snake Creek approximately 12 miles west of Aberdeen, South Dakota. Snake Creek drains portions of McPherson, Edmunds, and Brown counties in South Dakota. Mina Lake is primarily managed as a black crappie, bluegill, channel catfish and walleye fishery. Primary Species
Black Crappie: In 2015, frame nets captured only one stock-length black crappie
with a TL of 18 cm (7.1 in; Figure 4). The mean frame net CPUE of stock-length black crappie was 0.1 (Table 1) and below the minimum objective (≥10 stock-length black crappie/net night; Table 3). The 2013-2015 frame net CPUE’s have represented a substantial decrease from the 2012 CPUE of 31.3 (Table 2) and indicated low relative abundance. The cause of the decrease in relative abundance is unknown.
Low sample size precludes analysis of condition, size and age structure of the black crappie population.
Bluegill: The mean frame net CPUE of stock-length bluegill was 5.7 (Table 1)
and below the minimum objective (≥ 25 stock-length bluegill/net night; Table 3). Since 2006, the mean frame net CPUE of bluegill has fluctuated from a low of 0.6 (2009) to a high of 16.7 (2014; Table 2). Based on the 2015 frame net CPUE, relative abundance is considered low.
Frame net captured bluegill ranged in TL from 9 to 24 cm (3.5 to 9.4 in), with most being quality-preferred length (15-20 cm; 6-8 in; Figure 5). Both the PSD of 98 and PSD-P of 24 were above the management objective ranges (30-60 and 5-10, respectively; Table 3).

Otoliths were collected from a sub-sample of frame net captured bluegill in 2015. Five year classes (2008, 2011-2014) were represented with the 2012 and 2013 year classes being the most abundant comprising 26% and 55%, respectively, of bluegill captured (Table 4).
Growth of bluegill was good with weighted mean length at capture at age-2 and age-3 of 175mm and 201 mm, respectively (6.9 and 7.9 in, respectively; Table 5). Sampled bluegill had mean Wr values > 118 for all 10-mm length groups represented and the mean Wr was 119 (Table 1).
Channel Catfish: Since 2006, the relative abundance of channel catfish has
remained low; mean frame net CPUE’s have ranged from a low of 0.4 to a high of 5.7 (Table 2). In 2015, frame nets captured 19 individuals ranging in TL from 21 to 64 cm (8.3 to 25.2 in; Figure 6). The mean frame net CPUE of stock-length channel catfish was 0.7 (Table 1).
No growth information was available. Although sample size was low, frame net captured channel catfish appeared to be in good condition with mean Wr of stock-length channel catfish of 86.
Walleye: Recruitment of both naturally-produced and stocked walleye has been
extremely poor in Mina Lake. In recent years, walleye of various sizes have been stocked annually with limited success (Table 4; Table 6). As a result mean gill net CPUE values for stock-length walleye have remained low (Table 2). In 2010, 43 walleye from the 2009 cohort, most of which were sub-stock, were captured in the gill net catch (Table 5; Figure 7). Recruitment of walleye from the 2009 year class, which coincided with a small fingerling stocking (Table 6; Table 8) represented the first substantial walleye recruitment in Mina Lake since 1998.
In 2015, gill nets captured 10 stock-length walleye that ranged in TL from 27 to 59 cm (10.6 to 23.2 in) representing five cohorts (2008-2009, 2011 and 2013-2014; Table 6; Figure 7). The mean gill net CPUE of stock-length walleye was 1.7 (Table 1). Few inferences can be made concerning size structure, growth, or condition due to the low sample size.
In 2015, fall night electrofishing indicated that a relatively strong age-0 year class, which coincided with a small fingerling stocking, was produced (mean CPUE = 69.0; Table 1, Table 8). The 2015 age-0 walleye fall electrofishing CPUE is the highest observed since 2006 and is higher than the 2009 CPUE of 54.9 (Table 2), which was the only recent year class to exhibit fair recruitment into the population. Recruitment of the 2015 cohort is currently unknown and will be assessed in future surveys. Other Species
Black Bullhead: The mean frame net CPUE of stock-length black bullhead was
41.8 (Table 1) and within the objective range (≤100 stock-length black bullhead/net night; Table 3). Since 2006, mean frame net CPUE values have varied from a low 0.9 (2009) to a high of 85.5 (2012; Table 2). The 2015 mean frame net CPUE represented
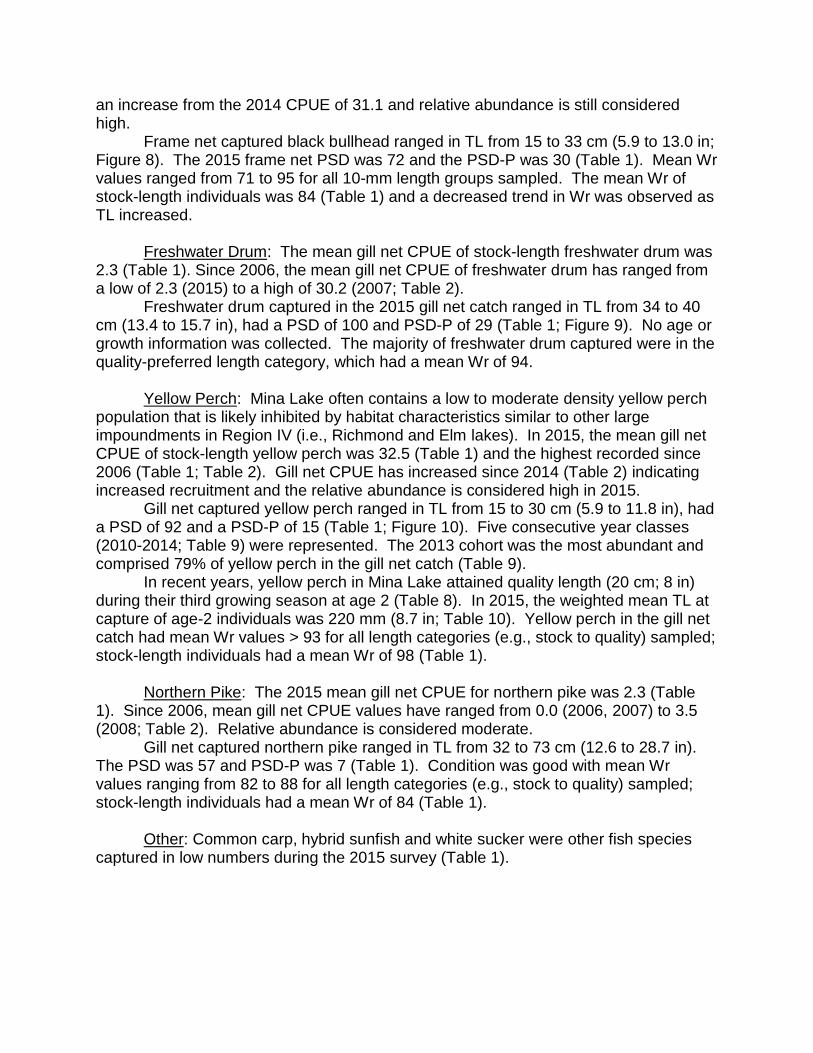
an increase from the 2014 CPUE of 31.1 and relative abundance is still considered high.
Frame net captured black bullhead ranged in TL from 15 to 33 cm (5.9 to 13.0 in; Figure 8). The 2015 frame net PSD was 72 and the PSD-P was 30 (Table 1). Mean Wr values ranged from 71 to 95 for all 10-mm length groups sampled. The mean Wr of stock-length individuals was 84 (Table 1) and a decreased trend in Wr was observed as TL increased.
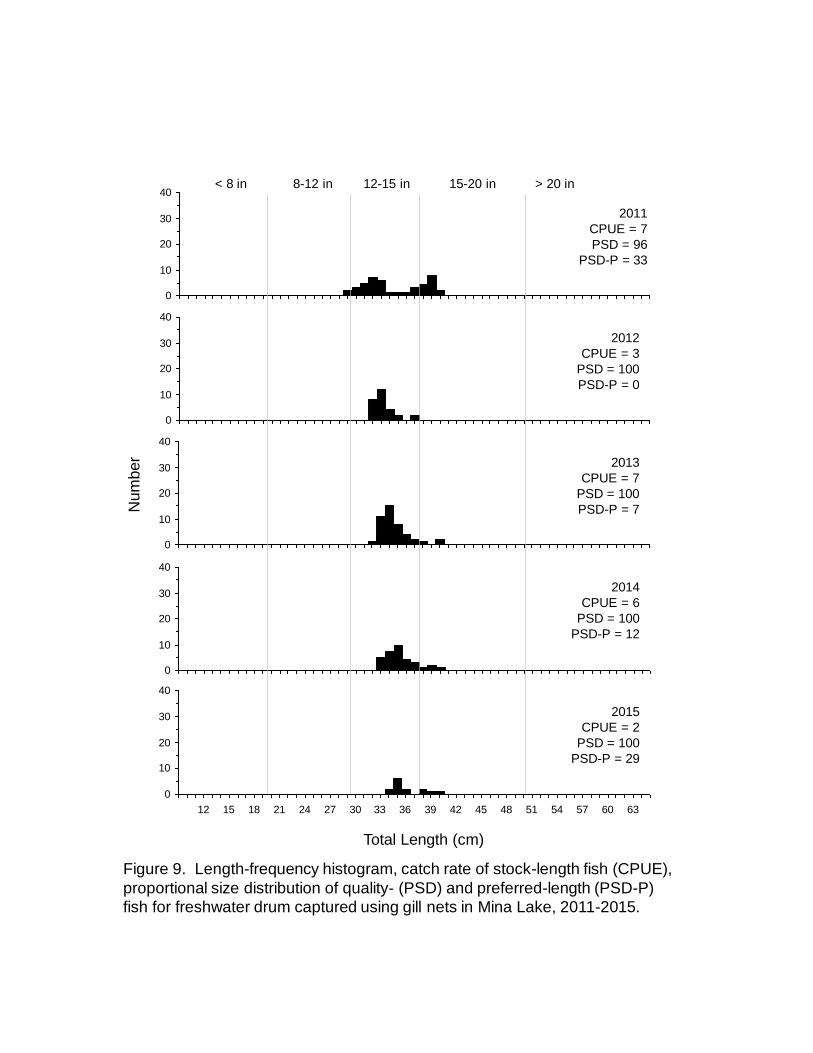
Freshwater Drum: The mean gill net CPUE of stock-length freshwater drum was
2.3 (Table 1). Since 2006, the mean gill net CPUE of freshwater drum has ranged from a low of 2.3 (2015) to a high of 30.2 (2007; Table 2).
Freshwater drum captured in the 2015 gill net catch ranged in TL from 34 to 40 cm (13.4 to 15.7 in), had a PSD of 100 and PSD-P of 29 (Table 1; Figure 9). No age or growth information was collected. The majority of freshwater drum captured were in the quality-preferred length category, which had a mean Wr of 94.
Yellow Perch: Mina Lake often contains a low to moderate density yellow perch
population that is likely inhibited by habitat characteristics similar to other large impoundments in Region IV (i.e., Richmond and Elm lakes). In 2015, the mean gill net CPUE of stock-length yellow perch was 32.5 (Table 1) and the highest recorded since 2006 (Table 1; Table 2). Gill net CPUE has increased since 2014 (Table 2) indicating increased recruitment and the relative abundance is considered high in 2015.
Gill net captured yellow perch ranged in TL from 15 to 30 cm (5.9 to 11.8 in), had a PSD of 92 and a PSD-P of 15 (Table 1; Figure 10). Five consecutive year classes (2010-2014; Table 9) were represented. The 2013 cohort was the most abundant and comprised 79% of yellow perch in the gill net catch (Table 9).
In recent years, yellow perch in Mina Lake attained quality length (20 cm; 8 in) during their third growing season at age 2 (Table 8). In 2015, the weighted mean TL at capture of age-2 individuals was 220 mm (8.7 in; Table 10). Yellow perch in the gill net catch had mean Wr values > 93 for all length categories (e.g., stock to quality) sampled; stock-length individuals had a mean Wr of 98 (Table 1).
Northern Pike: The 2015 mean gill net CPUE for northern pike was 2.3 (Table
1). Since 2006, mean gill net CPUE values have ranged from 0.0 (2006, 2007) to 3.5 (2008; Table 2). Relative abundance is considered moderate.
Gill net captured northern pike ranged in TL from 32 to 73 cm (12.6 to 28.7 in). The PSD was 57 and PSD-P was 7 (Table 1). Condition was good with mean Wr values ranging from 82 to 88 for all length categories (e.g., stock to quality) sampled; stock-length individuals had a mean Wr of 84 (Table 1).
Other: Common carp, hybrid sunfish and white sucker were other fish species
captured in low numbers during the 2015 survey (Table 1).

Management Recommendations 1) Conduct fish community assessment surveys on an annual basis (next survey
scheduled in summer 2016) to monitor fish relative abundance, fish population size structure, fish growth and stocking success.
2) Collect otoliths from black crappie, bluegill, and walleye to assess the age structure
and growth rates of each population. 3) Stock channel catfish fingerlings (≈50 fingerlings/acre) every third year (when
available) to bolster the channel catfish fishery in Mina Lake.
4) Consider re-introduction of saugeye into the population, as walleye recruitment has been poor. Stock saugeye (≈100 small fingerlings/acre) to establish additional year-classes if gill netting and/or fall night electrofishing CPUE of age-0 saugeye/walleye results warrant [i.e., low gill net CPUE of sub-stock (< 25 cm; 10 in) saugeye/walleye and/or fall night electrofishing CPUE of < 75 age-0 fish/hour].
5) Conduct fall night electrofishing on an annual basis to monitor age-0 saugeye/walleye relative abundance.

Table 1. Mean catch rate (CPUE; gill/frame nets= catch/net night, electrofishing= catch/hour) of stock-length fish, proportional size distribution of quality- (PSD) and preferred-length (PSD-P) fish, and mean relative weight (Wr) of stock-length fish for various fish species captured in gill nets, frame nets, and electrofishing in Mina Lake, 2015. Confidence intervals include 80 percent (± CI-80) or 90 percent (± CI-90). BLB= black bullhead; BLC= black crappie; BLG= bluegill; CCF= channel catfish; COC= common carp; FRD= freshwater drum; HYB= hybrid sunfish; NOP= northern pike; WAE= walleye; WHS= white sucker; YEP= yellow perch
Abundance Stock Density Indices Condition
Species CPUE CI-80 PSD CI-90 PSD-P CI-90 Wr CI-90
Frame nets BLB 41.8 22.3 72 3 30 3 84 1 BLC 0.1 0.1 0 --- 0 --- 117 --- BLG 5.7 2.6 98 2 24 7 119 0 CCF 0.7 0.3 69 24 8 14 86 7 COC 0.6 0.3 82 22 0 --- 95 2 FRD 0.9 0.3 100 0 24 19 83 2 HYB
1 0.1 0.1 100 --- 0 --- --- ---
NOP 0.4 0.2 75 31 50 36 70 14 WAE 0.1 0.1 0 --- 0 --- --- --- WHS 0.3 0.3 100 0 83 34 89 6 YEP 1.6 0.6 97 6 0 --- 92 1 Gill nets BLB 23.5 14.4 56 7 8 4 93 0 CCF 2.7 0.8 100 0 56 22 93 4 COC 1.2 0.9 14 28 0 --- 99 4 FRD 2.3 1.3 100 0 29 22 91 3 NOP 2.3 1.0 57 24 7 13 84 3 WAE 1.7 1.0 60 30 20 24 96 3 WHS 0.2 0.2 100 --- 100 --- 97 --- YEP 32.5 15.5 92 3 15 4 98 0 Electrofishing WAE
2 69.0 --- --- --- --- --- --- ---
1 All fish sizes
2Fall night electrofishing-WAE; catch rate (CPUE) represents age-0 walleye/hour

Table 2. Historic mean catch rate (CPUE; gill/frame nets= catch/net night, electrofishing= catch/hour) of stock-length fish for various fish species captured in frame nets, experimental gill nets, and by electrofishing from Mina Lake, 2006-2015. BLB= black bullhead; BLC= black crappie; BLG= bluegill; CCF= channel catfish; COC= common carp; FRD= freshwater drum; GSF= green sunfish; HYB= hybrid sunfish; LMB= largemouth bass; NOP= northern pike; OSF= orangespotted sunfish; ROB= rock bass; SHG= shortnose gar; WAE= walleye; WHB= white bass; WHS= white sucker; YEP= yellow perch
1 All fish sizes
2 Fall electrofishing-WAE; catch rate (CPUE) represents age-0 walleye/hour
3 Monofilament gill net mesh size (0.75”, 1.00”, 1.25”, 1.50”, 2.00” and 2.50”)
CPUE
Species 20063
20073
2008
2009 2010 2011 2012 2013 2014 2015
Frame nets BLB 6.0 16.2 5.8 0.9 8.9 8.1 85.5 35.2 31.1 41.8 BLC 25.9 9.0 2.5 3.2 1.1 16.7 31.3 0.2 0.1 0.1 BLG 5.9 10.8 1.8 0.6 1.8 3.9 5.6 6.7 16.5 5.7 CCF 0.6 4.8 2.4 3.6 4.2 5.7 1.2 0.6 1.4 0.7 COC 1.7 6.0 1.9 2.1 1.0 1.1 0.5 0.2 0.6 0.6 FRD 2.3 3.7 2.3 2.1 1.1 1.0 0.0 0.4 0.3 0.9 GSF 0.2 0.1 0.0 0.0 0.0 0.0 0.0 0.0 0.0 0.0
HYB1 2.0 0.3 0.0 0.2 0.0 0.0 0.0 0.0 0.0 0.1
NOP 0.3 0.2 3.2 2.2 2.4 1.1 2.0 0.9 0.8 0.4 OSF
1 0.4 11.9 0.0 0.0 0.1 0.0 0.0 0.0 0.0 0.0
ROB 0.0 0.0 0.1 0.0 0.0 0.0 0.0 0.0 0.0 0.0 SHG
1 0.0 0.0 0.1 0.0 0.0 0.0 0.0 0.0 0.0 0.0
WAE 0.5 0.2 0.3 0.3 0.3 0.5 0.7 0.1 0.3 0.1 WHB 0.1 0.1 0.1 0.0 0.0 0.0 0.0 0.0 0.0 0.0 WHS 0.7 1.2 0.3 0.3 0.3 0.1 0.1 0.5 0.3 0.3 YEP 2.3 1.1 1.7 1.9 1.0 1.4 2.1 1.2 9.6 1.6
Gill nets BLB 6.0 10.3 8.2 12.2 10.7 7.5 44.7 17.0 24.5 23.5 BLC 0.7 0.0 0.0 0.0 0.5 1.5 1.0 0.0 0.0 0.0 BLG 0.0 0.0 0.0 0.0 0.0 0.0 0.0 0.3 0.2 0.0 CCF 0.7 1.0 1.7 1.8 0.8 1.7 1.0 3.2 1.0 2.7 COC 5.2 15.5 8.7 1.2 0.2 0.2 1.2 0.2 0.5 1.2 FRD 17.0 30.2 19.0 12.8 6.0 7.2 3.3 7.3 5.5 2.3 LMB 0.0 0.0 0.0 0.0 0.0 0.0 0.2 0.0 0.0 0.0 NOP 0.0 0.0 3.5 1.5 3.3 0.3 1.3 0.7 0.5 2.3 OSF
1 0.0 0.0 0.5 0.5 0.0 0.0 0.0 0.0 0.0 0.0
WAE 0.5 0.3 1.0 0.2 0.7 1.8 1.2 3.5 0.7 1.7 WHS 0.0 0.0 0.0 0.0 0.0 0.2 0.2 0.0 0.2 0.2 YEP 9.2 4.2 1.7 4.3 6.0 8.3 14.8 8.7 27.2 32.5
Electrofishing WAE
2 0.0 0.0 0.0 54.9
10.8 31.0 --- 0.0 7.0 69.0

Table 3. Mean catch rate (CPUE; gill/frame nets= catch/net night), proportional size distribution of quality- (PSD) and preferred-length (PSD-P) fish, and mean relative weight (Wr) of stock-length fish for selected species captured by frame nets and gill nets in Mina Lake, 2006-2015. BLB= black bullhead; BLC= black crappie; BLG= bluegill; WAE= walleye Species 2006
1 2007
1 2008 2009 2010 2011 2012 2013 2014 2015 Objective
Frame nets BLB CPUE 6 16 6 1 9 8 86 35 31 42 ≤ 100 PSD 90 23 45 56 74 69 93 96 75 72 --- PSD-P 47 6 1 0 0 1 6 25 41 30 --- Wr 87 87 89 88 87 83 94 90 86 84 --- BLC CPUE 26 9 3 3 1 17 31 <1 <1 <1 ≥ 10 PSD 6 100 58 100 20 58 90 100 100 0 30-60 PSD-P 5 21 44 26 15 4 15 100 100 0 5-10 Wr 122 113 118 117 118 113 112 --- 116 117 --- BLG CPUE 6 11 2 1 2 4 6 7 17 6 ≥ 25 PSD 72 41 94 40 66 94 55 31 92 98 30-60 PSD-P 7 9 3 30 19 13 21 13 2 24 5-10 Wr 124 122 124 124 122 116 123 112 126 119 --- Gill nets WAE CPUE 1 <1 1 <1 1 2 1 4 1 2 ≥ 10 PSD 67 100 83 100 0 0 29 62 100 60 30-60 PSD-P 67 50 33 0 0 0 0 5 25 20 5-10 Wr 105 100 107 115 82 89 84 91 104 96 --- 1 Monofilament gill net mesh size (0.75”, 1.00”, 1.25”, 1.50”, 2.00” and 2.50”)
Table 4. Year class distribution based on the expanded age/length summary for bluegill sampled in frame nets from Mina Lake, 2015. Year Class
Survey Year 2015 2014 2013 2012 2011 2010 2009 2008 2007
2015
6 56 27 12 1
Table 5. Weighted mean TL (mm) at capture for bluegill age-1 through age-10 sampled in frame nets (expanded sample size) from Mina Lake 2015. Age
Year 1 2 3 4 5 6 7 8
2015
137(6) 175(56) 201(27) 209(12) --- --- 240(1) ---
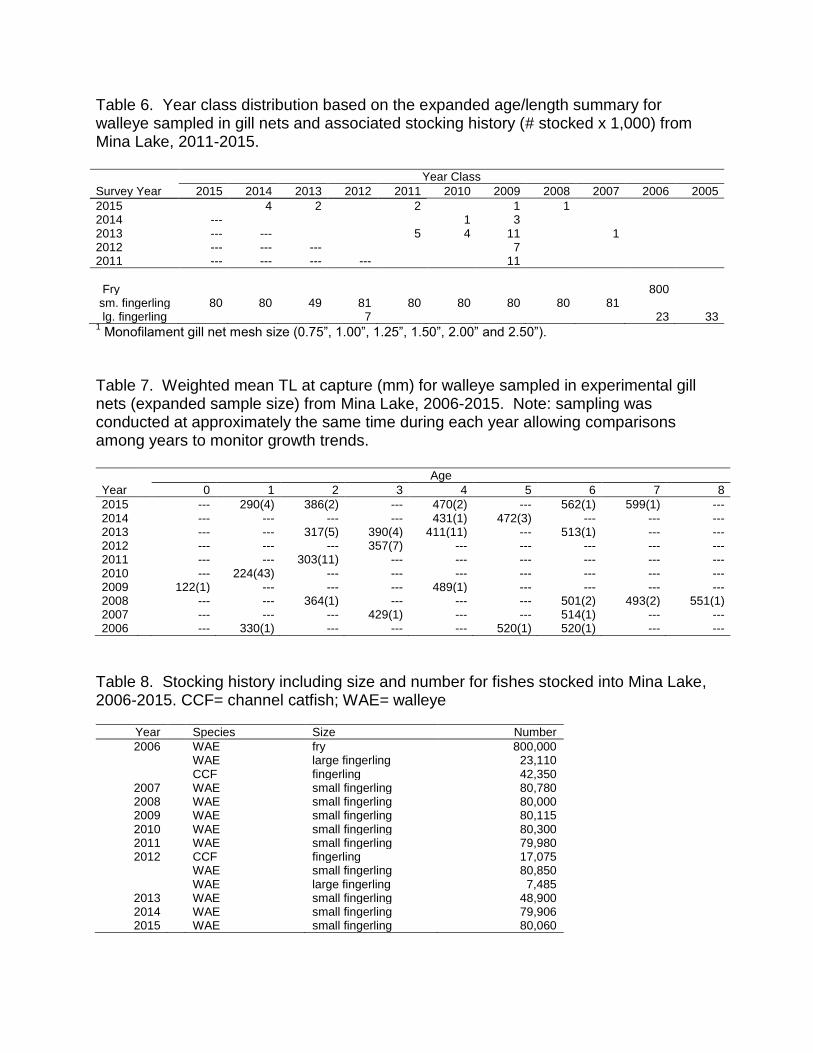
Table 6. Year class distribution based on the expanded age/length summary for walleye sampled in gill nets and associated stocking history (# stocked x 1,000) from Mina Lake, 2011-2015. Year Class
Survey Year 2015 2014 2013 2012 2011 2010 2009 2008 2007 2006 2005
2015 4 2 2 1 1 2014 --- 1 3 2013 --- --- 5 4 11 1 2012 --- --- --- 7 2011 --- --- --- --- 11
Fry 800 sm. fingerling 80 80 49 81 80 80 80 80 81 lg. fingerling 7 23 33 1 Monofilament gill net mesh size (0.75”, 1.00”, 1.25”, 1.50”, 2.00” and 2.50”).
Table 7. Weighted mean TL at capture (mm) for walleye sampled in experimental gill nets (expanded sample size) from Mina Lake, 2006-2015. Note: sampling was conducted at approximately the same time during each year allowing comparisons among years to monitor growth trends. Age
Year 0 1 2 3 4 5 6 7 8
2015 --- 290(4) 386(2) --- 470(2) --- 562(1) 599(1) --- 2014 --- --- --- --- 431(1) 472(3) --- --- --- 2013 --- --- 317(5) 390(4) 411(11) --- 513(1) --- --- 2012 --- --- --- 357(7) --- --- --- --- --- 2011 --- --- 303(11) --- --- --- --- --- --- 2010 --- 224(43) --- --- --- --- --- --- --- 2009
122(1) --- --- --- 489(1) --- --- --- ---
2008
--- --- 364(1) --- --- --- 501(2) 493(2) 551(1) 2007
--- --- --- 429(1) --- --- 514(1) --- ---
2006
--- 330(1) --- --- --- 520(1) 520(1) --- ---
Table 8. Stocking history including size and number for fishes stocked into Mina Lake, 2006-2015. CCF= channel catfish; WAE= walleye
Year Species Size Number
2006 WAE fry 800,000 WAE large fingerling 23,110 CCF fingerling 42,350
2007 WAE small fingerling 80,780 2008 WAE small fingerling 80,000 2009 WAE small fingerling 80,115 2010 WAE small fingerling 80,300 2011 WAE small fingerling 79,980 2012 CCF fingerling 17,075
WAE small fingerling 80,850 WAE large fingerling 7,485
2013 WAE small fingerling 48,900 2014 WAE small fingerling 79,906 2015 WAE small fingerling 80,060

Table 9. Year class distribution based on the expanded age/length summary for yellow perch sampled in gill nets from Mina Lake, 2012-2015. Year Class
Survey Year 2015 2014 2013 2012 2011 2010 2009 2008 2007
2015 2 154 19 19 1 2014 --- 91 19 37 5 12 2013 --- --- 5 30 7 10 2012 --- --- --- 8 17 55 2 7
Table 10. Weighted mean TL (mm) at capture by gender for yellow perch captured in experimental gill nets (expanded sample size) from Mina Lake, 2012-2015. Age
Year 1 2 3 4 5
2015 159(2) 220(154) 250(19) 271(19) 302(1) 2014 164(91) 225(19) 247(37) 259(5) 267(12) 2013 159 (5) 213 (30) 219 (7) 248 (10) --- 2012 152 (8) 203 (17) 227 (55) 264 (2) 244 (7)

0
50
100
150
200
250
8 11 14 17 20 23 26 29 32 35 38
2015
CPUE = <1
PSD = 0
PSD-P = 0
0
50
100
150
200
250
10 15 20 25 30 35 40
0
50
100
150
200
250
7 9 11 13 15 17 19 21 23 25 27 29 31 33 35 37 39
0
50
100
150
200
250
7 9 11 13 15 17 19 21 23 25 27 29 31 33 35 37 39
2013
CPUE = <1
PSD = 100
PSD-P = 100Num
ber
0
50
100
150
200
250
10 15 20 25 30 35 40
2014
CPUE = <1
PSD = 100
PSD-P = 100
2012
CPUE = 31
PSD = 90
PSD-P = 15
Total Length (cm)
5-8 in 8-10 in 10-12 in< 5 in > 12 in
2011
CPUE = 17
PSD = 58
PSD-P = 4
Figure 4. Length-frequency histogram, catch rate of stock-length fish (CPUE),
proportional size distribution of quality- (PSD) and preferred-length (PSD-P)
fish for black crappie captured using frame nets in Mina Lake, 2011-2015.

0
20
40
60
80
3 6 9 12 15 18 21 24 27 30 33
2015
CPUE = 6
PSD = 98
PSD-P = 24
0
20
40
60
80
5 10 15 20 25 30 35
0
20
40
60
80
2 4 6 8 10 12 14 16 18 20 22 24 26 28 30 32 34
0
20
40
60
80
2 4 6 8 10 12 14 16 18 20 22 24 26 28 30 32 34
2013
CPUE = 7
PSD = 31
PSD-P = 13Num
ber
0
20
40
60
80
5 10 15 20 25 30 35
2014
CPUE = 17
PSD = 92
PSD-P = 2
2012
CPUE = 6
PSD = 55
PSD-P = 21
Total Length (cm)
3-6 in 6-8 in 8-10 in< 3 in > 10 in
2011
CPUE = 4
PSD = 94
PSD-P = 13
Figure 5. Length-frequency histogram, catch rate of stock-length fish (CPUE),
proportional size distribution of quality- (PSD) and preferred-length (PSD-P)
fish for bluegill captured using frame nets in Mina Lake, 2011-2015.

0
5
10
15
20
16 19 22 25 28 31 34 37 40 43 46 49 52 55 58 61 64 67 70 73 76 79 82 85 88
2015
CPUE = 1
PSD = 69
PSD-P = 8
0
5
10
15
20
18 23 28 33 38 43 48 53 58 63 68 73 78 83 88
0
5
10
15
20
16 19 22 25 28 31 34 37 40 43 46 49 52 55 58 61 64 67 70 73 76 79 82 85 88
0
5
10
15
20
16 19 22 25 28 31 34 37 40 43 46 49 52 55 58 61 64 67 70 73 76 79 82 85 88
2013
CPUE = 1
PSD = 91
PSD-P = 0Num
ber
0
5
10
15
20
18 23 28 33 38 43 48 53 58 63 68 73 78 83 88
2014
CPUE = 1
PSD = 48
PSD-P = 9
2012
CPUE = 1
PSD = 100
PSD-P = 0
Total Length (cm)
11-16 in 16-24 in 24-28 in< 11 in > 28 in
2011
CPUE = 6
PSD = 75
PSD-P = 0
Figure 6. Length-frequency histogram, catch rate of stock-length fish (CPUE),
proportional size distribution of quality- (PSD) and preferred-length (PSD-P)
fish for channel catfish captured using frame nets in Mina Lake, 2011-2015.

0
5
10
15
14 17 20 23 26 29 32 35 38 41 44 47 50 53 56 59 62 65 68 71 74 77 80
2015
CPUE = 2
PSD = 60
PSD-P = 20
0
5
10
15
16 21 26 31 36 41 46 51 56 61 66 71 76
0
5
10
15
14 17 20 23 26 29 32 35 38 41 44 47 50 53 56 59 62 65 68 71 74 77 80
0
5
10
15
14 17 20 23 26 29 32 35 38 41 44 47 50 53 56 59 62 65 68 71 74 77 80
2013
CPUE = 4
PSD = 62
PSD-P = 5Num
ber
0
5
10
15
16 21 26 31 36 41 46 51 56 61 66 71 76
2014
CPUE = 1
PSD = 100
PSD-P = 25
2012
CPUE = 1
PSD = 29
PSD-P = 0
Total Length (cm)
10-15 in 15-20 in 20-25 in< 10 in > 25 in
2011
CPUE = 2
PSD = 0
PSD-P = 0
Figure 7. Length-frequency histogram, catch rate of stock-length fish (CPUE),
proportional size distribution of quality- (PSD) and preferred-length (PSD-P)
fish for walleye captured using gill nets in Mina Lake, 2011-2015.

0
50
100
150
200
250
300
350
8 11 14 17 20 23 26 29 32 35 38 41 44 47 50
2015
CPUE = 42
PSD = 72
PSD-P = 30
0
50
100
150
200
250
300
350
10 15 20 25 30 35 40 45 50
0
50
100
150
200
250
300
350
7 9 11 13 15 17 19 21 23 25 27 29 31 33 35 37 39 41 43 45 47 49
0
50
100
150
200
250
300
350
7 9 11 13 15 17 19 21 23 25 27 29 31 33 35 37 39 41 43 45 47 49
2013
CPUE = 35
PSD = 96
PSD-P = 25Num
ber
0
50
100
150
200
250
300
350
10 15 20 25 30 35 40 45 50
2014
CPUE = 31
PSD = 75
PSD-P = 41
2012
CPUE = 86
PSD = 93
PSD-P = 6
Total Length (cm)
6-9 in 9-12 in 12-15 in< 6 in > 15 in
2011
CPUE = 8
PSD = 69
PSD-P = 1
Figure 8. Length-frequency histogram, catch rate of stock-length fish (CPUE),
proportional size distribution of quality- (PSD) and preferred-length (PSD-P)
fish for black bullhead captured using frame nets in Mina Lake, 2011-2015.
0
10
20
30
40
12 15 18 21 24 27 30 33 36 39 42 45 48 51 54 57 60 63
2015
CPUE = 2
PSD = 100
PSD-P = 29
0
10
20
30
40
14 19 24 29 34 39 44 49 54 59 64
0
10
20
30
40
11 13 15 17 19 21 23 25 27 29 31 33 35 37 39 41 43 45 47 49 51 53 55 57 59 61 63 65
0
10
20
30
40
11 13 15 17 19 21 23 25 27 29 31 33 35 37 39 41 43 45 47 49 51 53 55 57 59 61 63 65
2013
CPUE = 7
PSD = 100
PSD-P = 7Num
ber
0
10
20
30
40
14 19 24 29 34 39 44 49 54 59 64
2014
CPUE = 6
PSD = 100
PSD-P = 12
2012
CPUE = 3
PSD = 100
PSD-P = 0
Total Length (cm)
8-12 in 12-15 in 15-20 in< 8 in > 20 in
2011
CPUE = 7
PSD = 96
PSD-P = 33
Figure 9. Length-frequency histogram, catch rate of stock-length fish (CPUE),
proportional size distribution of quality- (PSD) and preferred-length (PSD-P)
fish for freshwater drum captured using gill nets in Mina Lake, 2011-2015.

0
10
20
30
40
50
7 10 13 16 19 22 25 28 31 34 37 40
2015
CPUE = 33
PSD = 92
PSD-P = 15
0
10
20
30
40
50
9 14 19 24 29 34 39
0
10
20
30
40
50
6 8 10 12 14 16 18 20 22 24 26 28 30 32 34 36 38 40
0
10
20
30
40
50
6 8 10 12 14 16 18 20 22 24 26 28 30 32 34 36 38 40
2013
CPUE = 9
PSD = 81
PSD-P = 12Num
ber
0
10
20
30
40
50
9 14 19 24 29 34 39
2014
CPUE = 27
PSD = 43
PSD-P = 20
2012
CPUE = 15
PSD = 81
PSD-P = 10
Total Length (cm)
5-8 in 8-10 in 10-12 in< 5 in > 12 in
2011
CPUE = 8
PSD = 40
PSD-P = 14
Figure 10. Length-frequency histogram, catch rate of stock-length fish
(CPUE), proportional size distribution of quality- (PSD) and preferred-length
(PSD-P) fish for yellow perch captured using experimental gill nets in Mina
Lake, 2011-2015.