minireview - journal of bacteriologyjb.asm.org/content/188/5/1667.full.pdf · ... structure, and...
TRANSCRIPT

JOURNAL OF BACTERIOLOGY, Mar. 2006, p. 1667–1679 Vol. 188, No. 50021-9193/06/$08.00�0 doi:10.1128/JB.188.5.1667–1679.2006Copyright © 2006, American Society for Microbiology. All Rights Reserved.
MINIREVIEW
Use of Thymine Limitation and Thymine Starvation To StudyBacterial Physiology and Cytology†
Arieh Zaritsky,1* Conrad L. Woldringh,2 Monica Einav,1 and Svetlana Alexeeva2
Department of Life Sciences, Ben-Gurion University of the Negev, POB 653, Be’er-Sheva 84105, Israel,1 and Section Molecular Cytology,Swammerdam Institute for Life Sciences, University of Amsterdam, Kruislaan 316, POB 94062, 1090 GB Amsterdam, The Netherlands2
A variety of very basic questions asked 30 to 40 years agoremain unanswered today. How do bacteria select and main-tain a defined size, length, and width? How do they control thetiming of chromosome replication? What is the mechanism bywhich they segregate their replicated (or replicating) chromo-somes? How do they know where and when to divide? Fromthe literature it is apparent that there is resurgence in studiesaimed at answering these important questions. While muchprogress has been made, we still have a ways to go. Thisminireview revisits an old technique (thymine limitation) in anew light and illustrates how one can use this technique tomanipulate some of the parameters of the cell cycle underbalanced growth conditions, which should be helpful in ad-dressing some of the above questions. Hopefully this reviewwill spawn new interest and ideas about the old questions thatcan be tested by this technique.
Ever since the first thymine-requiring (so-called thymine-less) strain of Escherichia coli was isolated in 1947 (describedin reference 94), thyA mutants have been employed to followDNA synthesis in vivo (60). Since thymine is a precursor ofDNA only, radioactive isotope-labeled thymine and scintilla-tion counters are used to track synthesis in bacteria and theirviruses. Before the semiconservative nature of replication pre-dicted by the double-helix model was demonstrated, runningdensity gradients of DNA labeled with the heavy thymine an-alogue 5�-bromodeoxyuridine had been considered (43). How-ever, saving on radiolabeled thymine isotope by using exceed-ingly low concentrations during the labeling period (forexample, see reference 61) led to some flawed conclusions anddiscrepancies (for example, see reference 55). These were re-solved by systematic investigations of pool sizes of thyminemetabolites and of the rate of chromosome replication in re-lation to the external concentrations of thymine (for example,see reference 85). Those studies and their usefulness in gettingto understand the composition, structure, and function of thebacterial cell are summarized here. This issue is of particularcurrent importance, because the distinction between the twocompletely different physiological states of “thymine starva-tion” and “thymine limitation” has become somewhat vague
(for example, see references 24 and 134). It is crucial to realizethat the former is a pathological state of the cell, whereas thelatter is not (Table 1). Thymine limitation is used as a means todissociate the rate of DNA replication from the culture growthrate, i.e., to change the relative schedule of the replication anddivision cycles. This technique to dissociate the two rates dif-fers from the classical method of nutritional shifts, because itdoes not affect the major metabolic pathways prevailing in thecell. To understand this method, one must know the uniquemodes by which thymine is metabolized. The earlier review byAhmad et al. (2) presents an excellent account of the metabolicpathways involving thymine for both prokaryotes and eu-karyotes (see the summary in Fig. 1).
Bacillus subtilis has not evolved an active transport mecha-nism to pump thymine from the environment (92), and indirectresults demonstrate that this is the case for Escherichia coli aswell (88). The passive, sheer diffusion-driven uptake of thy-mine causes its pool size, as well as the levels of its metabolites,to depend on the extracellular concentration (6). Changing thethymine concentration supplied in the growth medium thuschanges the step-time in DNA synthesis (63) and the corre-sponding rate of chromosome replication (88), 1/C (44). Thisminireview describes (i) why the so-called “thymine limitation”state is totally different physiologically from that of “thyminestarvation,” the latter being caused by the complete removal ofthymine from the medium, which blocks DNA synthesis en-tirely in thyA mutants, and (ii) how both methods can beexploited as powerful tools to study bacterial DNA and itsinteractions with other essential metabolic and structural as-pects of cell physiology. These points are described below inthe context of unanswered questions that relate DNA metab-olism to the bacterial cell cycle, physiology, and cytology.
THYMINE STARVATION, THYMINE-LESS DEATH(TLD), AND THEIR USE IN BACTERIOLOGY
When a typical thymine auxotroph is deprived of thymine inan otherwise complete medium, its mass continues to increasein an “unbalanced” fashion (see the definition in reference 36)by synthesizing RNA and protein but not DNA for awhile (theduration of this period is strain dependent [23]). The cells stopdividing, thus forming prominent filaments of various lengths (5)that exponentially lose colony-forming ability on agar plates (19)but recover if thymine is added back before plating (known as the“liquid holding recovery” phenomenon [32]). The extent of kill-
* Corresponding author. Mailing address: Department of Life Sci-ences, Ben-Gurion University of the Negev, POB 653, Be’er-Sheva84105, Israel. Phone: 972-8-6461-712. Fax: 972-8-6278-951. E-mail:[email protected].
† Dedicated to Bob Pritchard on his 76th birthday.
1667
on July 16, 2018 by guesthttp://jb.asm
.org/D
ownloaded from

ing is retarded by concomitant inhibition of protein synthesis(60), supporting the idea that plating efficiency is low becausethe cells are filamentous (see below). This so-called thymine-less death (TLD) phenomenon seems to be widespread in thebacterial world beyond E. coli: by 1998, it had been observed inat least 8 gram-negative and 10 gram-positive species in addi-tion to Bacillus subtilis, as well as in Saccharomyces cerevisiae,mammalian cells, and even in thyA E. coli infected with phageT4 (which encodes its own thymidylate synthetase) (Table 1 inreference 2).
A multitude of reactions to thymine starvation associatedwith TLD can be classified as molecular or cellular (see refer-ence 2). Among the molecular reactions are mutagenesis, in-duction of harbored prophages, and curing of plasmids, as wellas breakdown, structural changes, and undermethylation ofDNA. Genetic recombination is enhanced, and nonconserva-tive, repair replication takes place. On the cellular level, theSOS response is triggered (119), and SOS-independent celldivision genes are repressed (58). TLD is energy dependentand was attributed to irreversible lesions induced under “un-balanced growth” (19). It has recently been reported (103) thata temperature sensitive mutant affected in the cydA gene, con-trolling cytochrome bd oxidase, protects a �thy strain fromTLD under restrictive conditions without suppressing filamen-tation, but it does so only on rich Luria-Bertani (LB) medium.This observation links the respiratory pathways with cell sur-vival and cytology, an association that should be further inves-tigated and clarified. The apparent dissociations between TLDand UV sensitivity (22) or filamentation (38) do not ease thetask of finding a common mechanism presumed for all of thephenomena associated with TLD. However, this is not the aimof this minireview.
In genetic studies, TLD has been exploited to enrich fordouble mutants (117), to increase the frequency of plasmidcuring (111), and to study the physiological consequences of itsrelationships with polA (absence of lag period [7]) and tem-perature sensitive dna mutants (higher survival of initiation butnot elongation mutants at the restrictive temperatures [12]). Ina search for E. coli mutants resistant to TLD, recQ was discov-ered and characterized as more sensitive to UV and deficientin recombination (72). Helicases homologous to RecQ werelater identified in eukaryotes and implicated in human hered-itary diseases (54). The method devised to synchronize cell
TABLE 1. Major differences in cell physiological parameters reacting to thymine starvation and to thymine limitation
Phenomenon or parameter Thymine limitation Thymine starvation
Chromosome replication C time varies between 40 and 120 min Stops completely and indefinitelyRate of culture mass growth Identical indefinitely Identical for �2�, then drops graduallyRate of cell division Identical after “rate maintenance” delay Stops completely after a delay of D minutesColony-forming ability Identical to the number of visible cells Drops exponentially after a delayCell size, mass, volume, protein, RNA
contentLarger; a function of 2(C � D)/� Larger; a function of starvation period and
growth rateCell dimentions (length and diameter) Both increase, with significant branching Filementation without diameter increaseNucleoid position Distributed around all cell surfaces Extended along mid-cellNucleoid structure and complexity Multiforked; function of n � C/� Extended with lobulesAmount of DNA per cell Increases as (ln2/n)[2(C � D)/� � 2D/�] Remains constant after division inhibitionDNA concentration (DNA/mass) Decreases as (ln2/n)(1 � 2�n) Decreases with time (as inverse of cell size)Amt of DNA per nucleoid Increases as [2(n � 1)](ln2/n) Remains constantTime D from termination to division Rises in proportion to n and cell
diameterNot applicable (no divisions)
FIG. 1. The wild-type (top) and salvage (bottom) pathways forthymidylate synthesis. (Adapted from references 2, 75, and 85.) Wild-type species of bacteria are unable to pump thymine into the cells (92)and to incorporate it into DNA. Thy� auxotrophs lack thymidylatesynthetase activity and, hence, cannot produce thymidine nucleotidesby the natural route (top panel), while they gained the ability toincorporate thymine into DNA by condensing it with deoxyribose-1-phosphate (dRib-1-P) to thymidine, a reaction catalyzed by thymidinephosphorylase (bottom). The negligible pool of dRib-1-P in thy� cellsthat limits this condensation increases substantially in size in thyAmutants, since they accumulate U-dRib-P, which is degraded intodRib-1-P through U-dRib. Addition of a nucleoside such as 2�-deoxy-guanosine (dG) similarly results in a wild-type pool size of dRib-1-P(6). Blocking further catabolism of the latter by deoB or deoC mutationresults in a still higher pool size and, hence, lower thymine concentra-tions (2 rather than 20 �g ml�1) are sufficient to support growth ofthyA strains carrying at least one of these mutations; such double ortriple mutants are “thymine-low-requirers.” At least two additionalmutations affect the regulation of thymidine phosphorylase to convertthe cell to a “super-low requirer” (can grow on concentrations as lowas 0.2 �g ml�1). Mutants lacking thymidine phosphorylase cannotutilize thymine, and those lacking thymidine kinase fail to incorporatethymidine as well.
1668 MINIREVIEW J. BACTERIOL.
on July 16, 2018 by guesthttp://jb.asm
.org/D
ownloaded from

divisions by thymine starvation (4), on the other hand, waslater shown to be a false synchrony (20), because cells continueto grow and hence to accumulate capacity for replication ini-tiation during starvation (86, 120).
More recently, it was claimed that the regulatable chromo-somal suicide module of E. coli, mazEF, which is triggered byvarious stress conditions, is also activated by thymine starva-tion and mediates TLD as well (99). Whether bacterial TLDindeed “has implications for both mammalian TLD and cancerresearch,” as these authors propose, remains a moot questionand is still under investigation (39). Thymine starvation haseven been exploited to study experimental evolution duringlong-term adaptation to metabolic constraints (24). Dissocia-tion between plasmid clustering and DNA synthesis or super-helicity has recently been achieved by disruption of localizationbut not clustering of plasmid RK2 in thymine-starved or gy-rase-inhibited cells (46). All the above show that studies withthymine starvation and TLD are still not exhausted and howthey can be exploited to better understand various aspects ofbacterial cell physiology.
The complex and varied phenomena that the cell displaysunder complete removal of thymine from the medium, culmi-nating in loss of colony-forming ability, are avoided by supply-ing it with limiting concentrations, as described below.
THYMINE LIMITATION AND ASSOCIATEDPHYSIOLOGICAL CHANGES
In contrast to filamentation and loss of colony-forming abil-ity when starved of thymine, it is crucial to realize that thystrains continue to grow indefinitely in a balanced mode, pro-vided the external thymine concentration is above the minimalrequired according to its genetic background (Fig. 1) and en-vironmental conditions. The rate at which a replication forktraverses the chromosome to complete a round from initiationto termination is slower at lower concentrations due to lowerpool sizes of thymine metabolites that are DNA precursors.External concentrations of thymine that enters the cell by dif-fusion alone thus result in modified levels of nucleotides andrates of chromosome replication, with implications for thephysiology of the bacterium (Table 1). Cellular changes occur-ring under thymine limitation resemble those taking placewhen growth rate is modified by the medium richness but avoidthe marked difference in metabolic pathways in the latter case(see below).
Historical perspective. The extensive series of experimentsof the so-called Copenhagen school that opened up the bac-terial physiology field as a separate discipline (47, 100) showedhow cell size and macromolecular composition of Salmonellaenterica serovar Typhimurium (closely related to E. coli) varysystematically with the doubling time �, manipulated by mod-ifying the medium composition. Soon after the E. coli chromo-some was demonstrated to be a closed circle (15, 130), “di-chotomous replication” of the B. subtilis chromosome (i.e.,containing multiple replication forks) was shown by measuringthe frequencies of genetic markers in germinating spores (79)and in fast-growing cells in rich media (133). Initiation ofreplication before termination of the preceding cycle (unjusti-fiably named “pre-mature”) was simultaneously exhibited in
thymine-starved E. coli cells (86). This apparent peculiarity waslater also demonstrated in fast-growing E. coli (44) (Fig. 2 and 3).It clearly distinguishes the replication pattern of fast-growingprokaryotes from that in eukaryotes.
Some peculiarities of DNA synthesis in cells grown on verylow thymine concentrations, dissimilar to those observed whencells were completely deprived of thymine, were recorded inthe 1960s (61, 62) but could not be understood until the Coo-per-Helmstetter model for the cell cycle was conceived (44).The essence of the model (Fig. 2 and 3) is dissociation betweenthe replication rate (1/C) and cell growth rate � (1/�): thechromosome replication time C was found to be invariant(�40 min at 37°C) with growth rates � greater than 0.85 h�1
(� 70 min). Thymine limitation was designed, investigated,and implemented soon afterwards (85, 88, 139) to resolve in-consistencies in previous studies. The dissociation between Cand � enabled one further step, envisaging that these discrep-ancies could be settled by assuming that C can also vary ac-cording to the concentration of the external thymine suppliedin the medium of thyA mutants. This hypothesis was corrobo-rated in the following five independent ways, each based on adifferent set of assumptions: (i) percent residual DNA synthe-sized (�G) during inhibition of protein synthesis (so-called“run out,” originally quantified in reference 104); (ii) averagecell DNA concentrations (G/M; i.e., DNA/mass ratio) prevailingin the cultures growing in balanced states (both in reference 88,139); (iii) degree of stimulation in the rate of DNA synthesisfollowing inhibition lasting one � (136); (iv) values of the cellcycle parameters measured directly in synchronous thymine-limited cultures (66); and (v) flow cytometry analyses (69).
The systematic changes in cell size and macromolecularcomposition with �, manipulated by modifying the mediumcomposition (62), is associated with substantial differences inthe metabolic pattern between the various steady states ofexponentially growing cultures (106). The changes occurringunder thymine limitation, on the other hand, are independentof major metabolic variations, because the medium remainsidentical, except for the concentration of supplemented thy-mine. The changes in cell features are therefore a consequenceof varied replication rate (88) and nucleotide pool sizes (6, 75,78) and cannot be attributed to another primary cause. Theonly thymine metabolites other than those leading to DNA aredTDP sugars involved with synthesis of cell envelope antigens(77, 78); these may link cell shape to DNA replication (dis-cussed in reference 138), but further studies are needed toclarify the possible connection (see below).
One crucial importance of the Cooper-Helmstetter model ofthe cell cycle (44) is that it can explain the size and DNAcontent of cells growing at different rates, as observed a decadeearlier (100) (Fig. 3), with the additional corollary that cellmass (or volume) at the time of replication initiation is prac-tically constant per chromosome origin (31, 87; but also seereferences 10, 120, and 148). Both modes of dissociation be-tween rates of growth (�) and of chromosome replication(1/C), by modifying one and not the other (reference 44 for theformer; reference 88 for the latter), are complementary andreach the same conclusions. They form a sound quantitativeframework for predicting cell sizes in steady states of exponen-tial growth with various cycle parameters (�, C, time between
VOL. 188, 2006 MINIREVIEW 1669
on July 16, 2018 by guesthttp://jb.asm
.org/D
ownloaded from

termination of a round of replication and cell division [D], andmass per number of oriC copies at the time of initiation Mi])and during transitions between them (Fig. 2 and 3).
Thymine limitation was later extended both theoretically
(13) and experimentally (17, 68, 89) and exploited to study thefollowing aspects of cell physiology (in rough chronologicalorder): (i) bidirectionality of chromosome replication (11); (ii)dependence of D (Fig. 2) on C (66, 140, 146); (iii) changes incell shape with rate of chromosome replication (67, 137, 140,141); (iv) kinetics of mutagenicity (29); (v) dependence ofconstitutive gene output at different DNA concentrations andrelative gene dosages (16, 18); (vi) control of plasmid replica-tion (81, 131); (vii) the minimum delay time (so-called “eclipse”period) before a round of replication can start following thestart of the previous round (69, 136); (viii) changes in cell massat initiation of replication (14); (ix) nucleoid segregation andocclusion in localization of the division plane (129, 143, 145);(x) changes in multiplication parameters of the virulent phageT4 (42); (xi) localization of replication forks by SeqA focidistribution (69). Our current investigation of how thyminelimitation affects the kinetics of TLD may shed additional lighton the difference between the two states and, furthermore, onthe elusive mechanism of TLD (to be published elsewhere).
Thymine limitation, which subtly manipulates cell changesby varying the concentration of a small molecule, can thus beused as a tool to study many aspects of cell physiology andcytology. Relationships between the replication state of thechromosome and nucleoid position on the one hand and theplane of cell division as well as cell dimensions on the otherhand are given particular attention below.
FIG. 2. Bacterial cell cycle, based on the Cooper-Helmstettermodel (44), with additional data obtained in various laboratories, asfollows. A cell initiates chromosome replication at oriC when it reachesa constant mass/oriC (Mi), terminates replication at terC after C min(red bar), and divides D min later (blue bar). The time spans todivision from birth (�) and from appearance of constriction (T [124])and FtsZ ring (Z [26]) are depicted as black, green, and orange bars,respectively. The times of cell birth and division, and of initiation andtermination of its chromosome replication in the current cycle, arelabeled b, d, i1, and t1, respectively. The examples displayed are eachof a newborn cell growing steadily with the following specific series ofcell cycle parameters (�, C, D, T, and Z, respectively): 60, 40, 20, 16,and 22 in A; 40, 40, 20, 16, and 22 in B; 25, 40, 20, 16, and 22 in C; and40, 90, 35, 30, and 38 in D. In practice, A to C are obtained bynutritional changes, and D is obtained by thymine limitation. In con-ditions when cell cycles overlap, that is � N(C � D), and N is apositive, non-zero integer, initiation or termination occurs at the -Nthcycle and the following events are labeled successively in and tn. Undersuch circumstances, cell mass at initiation is a 2(N � 1) multiple of Mi(shown at the bottom right of each panel). Schematic chromosomestructures at different cell cycle stages are shown, with relative posi-tions of oriC (red dot), terC (blue dot), and replicating forks (black orgray dot, depending on its 3-dimensional position on the circle, viewedat an angle of 72.5o [perspective of 0.3]). Given are the structures atcell birth b (equivalent to one of two at division d [shown in panel Aonly]), during replication or at termination (in panels A and B), as wellas between t1 and i3 or i4 and between i3/i4 and d (in panels C and D,respectively).
FIG. 3. Relative mass of a newborn cell during its cycle and tran-sitions (at time zero; all in minutes) from growth conditions of � � 40,C � 40, and D � 20 to growth with � � 25, C � 40, and D � 20(shift-up; top panel) and to growth with the same rate (� � 40) and D� 20 but C � 90 (step-down; bottom panel). Colors of bars conform tothose in Fig. 2. Gray areas indicate the transition periods. Horizontallines indicate 2(N � 1) multiples of initiation mass Mi (see the legendto Fig. 2). (Adapted from the schematic online simulation of NorbertVischer, which is freely available at http://simon.bio.uva.nl.)
1670 MINIREVIEW J. BACTERIOL.
on July 16, 2018 by guesthttp://jb.asm
.org/D
ownloaded from

CELL DIMENSIONS AND NUCLEOID COMPLEXITY
The first clue that bacterial cell width changes with growthrate, observed in 1958 (100), was substantiated in a systematicway using appropriate equipment some 20 years later (121,124). During the cell cycle, however, diameter changes veryslightly (113). Differences in growth rates between mass andlength (40, 85) or surface (95, 96) have been used to explain thelarge changes in cell diameter during transitions betweengrowth rates (nutritional shifts [62]). The ratio of surface tomass (or surface to volume, because cell density remains con-stant [3]) is smaller when cells are wider, as during growth inricher media. The so-called linear-log series of models (forexample, see references 85 and 144) are based on the fact thatsurface extension is linear and mass is synthesized exponen-tially. In these models, which have since been modified con-siderably (see below), emphasis was devoted to discrete eventsthat happen during the cell cycle. Thus, peptidoglycan synthe-sis was assumed to proceed at a constant rate and to doubleonce per cycle. The time of this doubling was linked to adiscrete event or singularity in the cell: initiation of chromo-some replication (33, 34) termination (141), or the replicationfork (83). The differences between the presumed event orstructure depends also on whether the rate of peptidoglycansynthesis per site varies according to the bacterial growth rateand whether the presumed growth zone is finite in existence (as
is the replication fork) or goes on indefinitely (as with oriCor terC).
During thymine starvation, rod-shaped Thy� strains fila-ment (5), largely maintaining cell diameter. It was thereforeinstructive to discover that at lower thymine concentrations,their increased volume is accommodated by increased width aswell as length (140), as observed for faster growing cells. Thisdiscovery reinforced the ideas that couple cell dimensions tothe chromosome replication cycle. Another encouraging ob-servation was that cell length overshoots during the transitionbetween slow-to-fast growth rates (“nutritional shift-up” [47])and slowly approaches the new steady-state value at the sametime as does cell diameter (125, 144) (Fig. 4, filled circles). Asimilar approach to the new steady-state cell dimensions wasobserved when thymine-limited cells are transferred from highto low thymine concentration (“stepped-down” [88]), both con-centrations above the minimum required for normal growth(142) (Fig. 4, empty circles). The slower approach during stepdown than during shift up is due to the longer C � D valueunder this transition and conforms to the Cooper-Helmstettermodel (compare the top and bottom portions of Fig. 3). Allthese observations together led to a common explanation (127,137) that couples cell diameter to the chromosome “complex-ity” (Fig. 4, inset): the common denominators for both casesare larger numbers of replication “positions” (originally de-
FIG. 4. Changes of relative average cell length (A) and diameter (B) during nutritional shift-up (filled circles) and thymine step-down (opencircles) of cultures of E. coli B/r strain H266 (125) and K-12 strain CR34 (thr-1 leuB6 thi thyA drm [141–143]), respectively. Shift-up was performedfrom alanine-proline to glucose-Casa minimal medium (�1 � 72 min; �2 � 24 min). Step-down in glucose minimal medium (� of ca. 53 min) from10 �g thymine ml�1 and 100 �g ml�1 dG (yielding a C1 of �50 min) to 2.5 �g ml�1 thymine and no dG (by washing off thymine and dG usingfiltration and resuspending the cells in the same medium but a low [thymine] yielding C2 of about 90 min). Culture densities were kept below A450of 0.5 by successive four- to sixfold dilutions with prewarmed medium. (C and D) Cells were photographed at 180 min of the shift-up and step-downtransitions of E. coli CR34, respectively. Bars, 2 �m. (Inset) Average cell diameter in various E. coli strains as a function of the nucleoid complexity(C/�; filled circles) or size (DNA in genome equivalent units per terC; empty circles).
VOL. 188, 2006 MINIREVIEW 1671
on July 16, 2018 by guesthttp://jb.asm
.org/D
ownloaded from

fined in reference 101), n � C/� (filled circles), and largeramounts of the related DNA per nucleoid (127); G/terminus �(�/C · ln2) · {2[(C/�) � 1]} � 2(n � 1) · (ln2/n) (empty circles).Both cell types, fast growing (with short � and identical C [44])and slow replicating (with long C and identical � [88]), containmultiple-forked chromosomes. Under these circumstances, thenumber of simultaneously segregating origins in each chromo-some (2n) cannot exceed 4 in fastest growing Thy� cells (C �40 min; � � 20 min) but can exceed 8 in thymine-limited thymutants (e.g., C � 90 min, � 30 min). The real difference iseven larger in practice, because in Thy� cells n does not exceed3.14 (21.65 [10]). A simple, dynamic demonstration of the dif-ferent situations in steady state of exponential growth andduring transitions between such states can be seen and explic-itly performed online at the interactive website of NorbertVischer (http://simon.bio.uva.nl) (Fig. 2 and 3).
The “rate maintenance” phenomenon (where the rate of celldivision does not change for a period of C � D [44]), which hadbeen disclosed by the “nutritional shift-up” regimen (47), wasconfirmed by the “thymine step-down” regimen (140). Simi-larly, the overshoot in cell length and slow approach to newsteady-state dimensions (124) displayed during the formertransition was confirmed during the latter transition as well(142) (Fig. 4A). The increase in cell diameter during both ofthese transitions (Fig. 4B) is not homogeneous along the cyl-inder: it starts at the site of constriction, where no nucleoidmaterial is present, thus inducing tapered cells (125 and Fig.4C and D, respectively). This seems to couple peptidoglycansynthesis and cell dimensions to nucleoid position and shapes.
The idea that cell diameter is correlated with nucleoid com-plexity, whereas length is passively determined by it and by therate of volume growth, results in the interesting corollary thatthe aspect ratio (length/diameter) observed when wild-type cellsare grown on different media is almost constant (124, 137).
A mechanism to account for the influence of nucleoid com-plexity on cell diameter was envisaged by the “nucleoid occlusionmodel” (123, 127, 128). It presumes that intense cytoplasmicactivities (transcription and translation) around the nucleoid re-sult in slower local rates of peptidoglycan synthesis (70, 71),thereby inhibiting constriction and hence influencing cell di-mensions. Changes in cell shape associated with changes inappearance of the nucleoid that occur during thymine limita-tion are considered below and may be helpful in decipheringthis phenomenon.
PLACEMENT OF DIVISION ARC/RING/PLANEBY TRANSERTION
Structure and segregation of the nucleoid has attracted theinterest of bacteriologists ever since it was given serious atten-tion as an “organelle” (reviewed in reference 93). The nucleoidcan be visualized by light (56, 82) or electron microscopy (98)in fixed cells and by phase-contrast (65), confocal (114), orfluorescence microscopy (108) in vivo. Nucleoid structure andinteractions with surrounding molecules and organelles (ribo-somes, membrane, etc.) have recently been reviewed (123).The implications for placing the constriction (in gram-negativespecies) or septum (in gram positives) between newly segre-gated nucleoids are addressed below with the aid of the thy-mine-limitation method (for example, see reference 145).
The first sign of the division process observed by phasecontrast microscopy is a constriction or septum (in gram-neg-ative or -positive species, respectively). The time T betweenthis operational event and separation of the daughters is con-stant, �12 min (in fast-growing E. coli cells at 37°C [124]). Tseems to be determined by the cell circumference (2R, whereR is cell radius) and growth rate �; the longer time it wouldtake to synthesize a division ring of a wider cell is compensatedby the faster rate at which the ring is synthesized. Since R isproportional to � (40, 137), T turns out to be proportional to2R/� (or 2R�; Fig. 5). This correlation is consistent with thefinding that, in fast-growing thymine-limited thyA mutants thatare even wider (Fig. 6A and C), the D and T periods are alsolonger (146; see also Fig. 2 to 5). At a certain point, when celldiameter becomes almost as great as cell length under normalconditions, this balance seems to break down, and the cellbranches by splitting the pole (138, 141) (Fig. 6B and F).Moreover, if both poles split simultaneously, the two branchesseem to be tilted (see also Fig. 4 in reference 145, Fig. 3 inreference 80, and Fig. 2 in reference 143), as anticipated fromthe arrangement of the four nucleoids in the left-hand cell inFig. 6C, predicted by the nucleoid occlusion model and dis-cussed in reference 145). It is also consistent with lack ofoverlap between FtsZ rings or arcs and segregating nucleoidsin spheroidal cells (Fig. 6D) using simultaneously the fluoro-chromatic molecules FtsZ-GFP and 4�,6�-diamidino-2-phe-nylindole (DAPI) (Fig. 1 in reference 143).
Genetic fusion of fluorescent proteins to FtsZ (59) and other
FIG. 5. Time before cell separation when constriction is visible (Tmin) as a function of cell diameter (2R) and doubling time (�) in E. coliB/r strains A (filled circles) and K (empty circles) (124), in E. coli K12strain CR34 (filled triangles) and its repA derivative (empty triangles)(141), and in E. coli K-12 strain LMC 500 (crosses) (1). Values of Twere calculated from the percent of constricted cells visible in either atransmission electron microscope or a light microscope (as in refer-ence 124 or 1, respectively) of steady-state growing cultures. Regres-sion line and function was calculated with the lower 20 data points.S.D., standard deviation.
1672 MINIREVIEW J. BACTERIOL.
on July 16, 2018 by guesthttp://jb.asm
.org/D
ownloaded from
proteins used to visualize the division ring in situ has beencombined with the classical methods to investigate the timingof FtsZ ring assembly, thus tracing the division process back toits inception. This process starts shortly before termination ofchromosome replication (26). It may be exploited togetherwith thymine limitation to dissect more accurately the assemblyof the “divisome” proteins (73). Manipulating the rate of rep-lication rather than of growth rate is more informative becauseit changes C only without changing the general metabolism (asmedia do). The two-step model (1), in which mid-cell recruit-ment of proteins downstream of FtsK is substantially delayedover FtsZ ring formation, might well be better resolved by asuitable thymine limitation schedule to test the hypothesis thatthe delay in assembly depends on the length of the C period (orthe ratio C/�) or D (or D/�), which are related (146). Such
experiments are currently being performed (T. den Blaauwen,unpublished data).
The high accuracy of constriction/septum placement in themid-cell of rod-shaped bacteria is intriguing (101, 112). Theobserved precision, with coefficients of variation as low as 4 to10%, is surprising, because those of other cell cycle parametersthat lead to the eventual division are larger, while such asequence predicts the last event to be the least precise. More-over, it is striking that positional information is more accu-rately fixed than the temporal information: cell sizes at initia-tion of DNA replication and at cell division, for example, varyless than cell ages at these events (48, 51). The variations in thetiming and mid-cell localization of FtsZ are very small as well,in the same range as that of the constriction itself (T. denBlaauwen, personal communication).
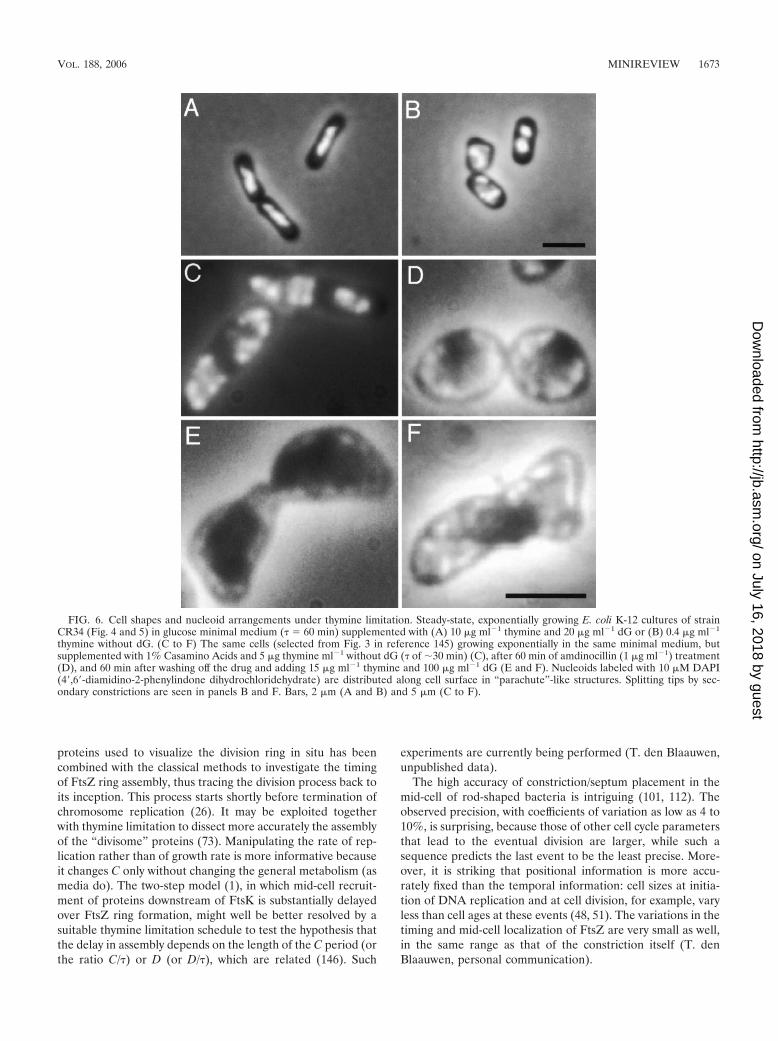
FIG. 6. Cell shapes and nucleoid arrangements under thymine limitation. Steady-state, exponentially growing E. coli K-12 cultures of strainCR34 (Fig. 4 and 5) in glucose minimal medium (� � 60 min) supplemented with (A) 10 �g ml�1 thymine and 20 �g ml�1 dG or (B) 0.4 �g ml�1
thymine without dG. (C to F) The same cells (selected from Fig. 3 in reference 145) growing exponentially in the same minimal medium, butsupplemented with 1% Casamino Acids and 5 �g thymine ml�1 without dG (� of �30 min) (C), after 60 min of amdinocillin (1 �g ml�1) treatment(D), and 60 min after washing off the drug and adding 15 �g ml�1 thymine and 100 �g ml�1 dG (E and F). Nucleoids labeled with 10 �M DAPI(4�,6�-diamidino-2-phenylindone dihydrochloridehydrate) are distributed along cell surface in “parachute”-like structures. Splitting tips by sec-ondary constrictions are seen in panels B and F. Bars, 2 �m (A and B) and 5 �m (C to F).
VOL. 188, 2006 MINIREVIEW 1673
on July 16, 2018 by guesthttp://jb.asm
.org/D
ownloaded from

The so-called “Tug of War” mechanism, which has beenproposed for a cell to find its middle (50), relies on a differencebetween growth rates of the peptidoglycan and the cytoplasmicmembrane. This difference is presumed to stress the mem-brane mainly at mid-cell, to be sensed by mechano-receptorsand translated into a biochemical signal that activates FtsZring formation. Stress evolution has recently been related tointeractions between the nucleoid and the membrane (90). Theconnection is attributed to the coupling between transcriptionand translation in bacteria, together with insertion (or trans-location) of membrane proteins into (or through) the mem-brane, as described in the “transertion” model (123). Thiswould exert a force on the membrane. Integration over the cellsurface of the longitudinal component of this force producedby the transertion “strings” (composed of membrane proteingenes, their mRNAs, the translating polyribosomes, and re-spective signal recognition particles [25]) yields a minimumstress at the mid-cell (90). As soon as the nucleoid separates,this minimum stress rises quickly to zero, and mechano-recep-tors are proposed to sense the rate of stress change, as de-scribed in reference 50.
Validity of this “Transertion-Dependent model for DivisionPlane Positioning” (TDP) does not exclude additional, super-imposed mechanisms for placing the division ring/plane; theMinCDE system (e.g., see reference 91) is such a complemen-tary mechanism (74, 135). Lack of oscillating MinCD in B.subtilis (64) may indicate the different balance between the twosystems in positioning the division site in different bacterialspecies. The observed paths of MinD oscillations in sphericalrodA cells (21) should be related to surface localizations oftheir existing nucleoids or of those in thymine-limited cells(143, 145). The advantage of the latter experimental conditionis that it does not require mutants or long-term treatments withdrugs that directly affect division or peptidoglycan synthesis. Abrief pulse of amdinocillin (mecillinam) would convert thealready-fat thymine-limited cells with multiple nucleoids (Fig.6C) into spheroids (Fig. 6D) (see below).
The TDP model provides a means by which the nucleoid isstabilized symmetrically around the cell center by the forcethat the transertion strings exert on it, thus explaining theaccuracy in placing the division plane right in the middle of thecell length (90). However, in wide cells that grow quickly andreplicate their chromosome slowly (using thymine-limited cellsin rich media), this symmetry breaks down so that each of theexisting nucleoids is detached from one side of cell peripheryand attaches to the other in a “parachute”-like form (143, 145)(Fig. 6B and C). The FtsZ ring position and division planes insuch cells are consequently tilted as well, in agreement with thenucleoid occlusion model. The off-center position of a repli-cating and segregating nucleoid due to this detachment wouldalleviate the stress at the opposite side of the membrane toallow a constriction ring to initiate there as an arc. However,completion of this ring would be occluded by the nucleoidbound through the transertion strings at the other side. Con-sequently, an arc is formed leading to a branch (129, 138, 141).Primary constrictions are indeed clearly seen in such opposite-nucleoid positions (144), and secondary FtsZ arcs perpendic-ularly cross the primary in spheroidal cells (Fig. 2 in reference80 and Fig. 1 in reference 143). The perpendicular crossingarcs in spherical cells induced by brief (60-min) amdinocillin
treatment are likely to reflect the (tetrahedron-like) symmet-rically positioned nucleoids. When the spheroids are allowedto recover and elongate, “butterfy-like” cells are observed thatevolve into branched cells (Fig. 6E and F) (discussed in refer-ence 145; see also Fig. 3 in reference 80). These observationsare thus consistent with the idea that placement of the con-striction plane for division is determined by the nucleoid spa-tial position in the cell.
IS BRANCHING RELATED TO NUCLEOID POSITION?
Cell branching has been reported in E. coli (105, 108) andAgrobacterium tumefaciens (37) and more recently in Myco-plasma capricolum (102) and Rhizobium meliloti (57) whenDNA replication was inhibited, but the nucleoid positions wereeither not recorded or were unclear. The explanation for thisphenomenon given here does not exclude other causes forbranching, such as multiple sites of inert peptidoglycan (27) andabnormalities in cell wall elongation (41). The complex pathwayof peptidoglycan synthesis (116 and references therein) must ob-viously be involved in any change in cell shape such as branch-ing. However, branching observed during thymine limitationseems to originate at a higher level, either the nucleoid com-plexity and position as proposed above or a coupling betweenmetabolism of DNA and of envelope components, which is stillpoorly understood. The observation should be taken into con-sideration that branching obtained by a slowed replication rate(during thymine limitation; e.g., Fig. 6B, E, and F) is muchmore frequent in the population than the occasional branchesobserved upon inhibition of DNA synthesis (during, e.g., thy-mine starvation; Fig. 7 and data not shown). Rhamnose-thy-mine metabolites (77, 78, 107) may be one such link, and thecyclic AMP connection (53) seems to be another. It is obvious,however, that existing cell poles are not as inert as they arethought to be (28, 29, 49) under certain circumstances: a polarcap can split when cell diameter approaches normal cell length(for example, see Fig. 6B, E, and F).
The recent observation of branched swarmer cells and theirstalks in rodA and mreB mutants of Caulobacter crescentus(118) may resolve the branching mechanism of the peptidogly-can sacculus. The stalk cylinder is fivefold thinner than the cellbody and does not contain DNA (84). It is thus conceivablethat its diameter (of �0.25 �m) is the default structure ofMreB in vivo in cylinders devoid of the nucleoid (anticipated tobe �0.35 �m; extrapolation to zero complexity is shown in theinset of Fig. 4; see also Fig. 2A in reference 124). It would beuseful to find conditions under which MreB is self assembled invitro to measure its dimensions and to manipulate cells to forcea nucleoid into the stalk and observe its morphogenesis. Anatural tube resembling the stalk of Caulobacter swarmer cells,through which replicating nucleoids move to the daughter cell,is the prosthecum of Hyphomonas spp. Its diameter was esti-mated at 200 nm (149; more like 400 nm in hydrated material).Does the elongating prosthecum “pull” the DNA because itssurface/volume ratio is larger and thus connects more transer-tion strings? Relating the biochemical and cytological obser-vations to the complexity and position of the nucleoid may helpto uncover the link between the metabolic pathways of DNAand peptidoglycan. The thymine limitation regimen can beused to achieve this aim.
1674 MINIREVIEW J. BACTERIOL.
on July 16, 2018 by guesthttp://jb.asm
.org/D
ownloaded from

Thymine limitation was instrumental in developing the TDPmodel, because it enabled manipulating cells growing undernormal conditions to replicate their chromosomes with highercomplexity (more multiple forks) than can be achieved byraising the growth rate alone, resulting in a more complexpositioning of the FtsZ ring and division plane without mortal(or even observed deleterious) effect on cell multiplicationand, hence, survival. This method is thus advantageous overthe use of shape mutants (which are usually pleiotropic) ordrugs (which are not specific) to obtain cells with more com-plicated shapes.
EVOLVING MODELS: “TRANSERTION” AND“NUCLEOID OCCLUSION”
Proposed mechanisms to regulate the necessary link be-tween chromosome replication, nucleoid segregation, and cell
division in bacteria have been debated for 40 years now. Link-ing structures like “Mesosomes” (membrane invaginations)and “periseptal annuli” (preformed mid-cell division sites) aswell as “nucleoid jumps” turned out to be artifacts (35, 97, 115,122). Existence of contractile proteins that pull the completeddaughter nucleoids apart (e.g., see reference 110) is attractivebut requires many assumptions to explain all of the observa-tions, particularly under conditions of multifork replicationand segregation (123). Even if the proposed temporary mem-brane connection of hemimethylated, just-initiated oriC (45,76) can explain the presumed initial “pushing apart” of thedaughter oriC (such as “Ribosomal Assembly Centers” [126,147]), it certainly cannot explain the continued partition duringthe rest of the cell cycle.
The distinction between the transertion idea for nucleoidsegregation and all models that involve motor proteins de-pends on the dissociation of DNA replication and cell growth
FIG. 7. Changes in nucleoid structure during thymine starvation. E. coli K-12 strain CR34 thyA was grown in glucose minimal medium supplementedwith Casein hydrolysate (1%), thymine, and deoxyguanosine (dG) (20 �g ml�1 each) for more than 10 generations to achieve a steady state of growth.At A450 � 0.4, the culture was filtered, washed, and resuspended in fresh, prewarmed medium without thymine and dG. Cells were stained with DAPI(10 �M), fixed with 0.1% OsO4, and concentrated by centrifugation. Cells were immobilized on a thin agar layer and observed under an Olympus BX60microscope as described previously (115). Samples are shown from control, before starvation (A), 60 and 180 min afterwards (B and C, respectively), and120 min after chloramphenicol treatment following 120 min of starvation (D). Bar, 2 �m.
VOL. 188, 2006 MINIREVIEW 1675
on July 16, 2018 by guesthttp://jb.asm
.org/D
ownloaded from

(in mass and surface). Differential inhibition of each separatelywould tell which is crucial, growth or replication: the formermodel predicts that the nucleoid will continue to expand dur-ing growth without replication and contract during replicationwithout growth, while all other models predict the opposite.The fundamental assumption of the transertion model, thatnucleoid segregates during replication by its link to cell mem-brane through genes coding for membrane-associated (or ex-creted) proteins (123), is supported by the observation that apartially replicated nucleoid is contracted to mid-cell whenprotein synthesis is specifically inhibited (by, e.g., adding chlor-amphenicol or by amino acid deprivation [9, 93, 129]). Theonly cells that complete the division process are those that hadterminated replication before the block was imposed. Indeed,the proportion of cells that perform this so-called residualdivision has been used to determine the D period (30, 52, 109).
To complement this established observation, DNA synthesiswas specifically inhibited by thymine starvation (Fig. 7). Thecells grew in an unbalanced but exponential mode for aboutthree mass doublings before slowing down (data not shown),and the nucleoid(s) that remained after residual divisions con-tinued to extend over the cell length with no net replication(Fig. 7B and C), as predicted by the transertion model. Whilestretching, the original nucleoids, consisting of over one chro-mosome equivalent (replicating upon start of starvation), werepulled apart into small lobules (Fig. 7B and C). Such pullingapart of nucleoids upon inhibition of DNA synthesis has pre-viously been described for a temperature sensitive dnaX mu-tant of E. coli (129). This behavior of nucleoid stretching maybe connected to the biochemical and biophysical properties ofDNA and its membrane interactions and should be investi-gated further. It is intriguing that the pulling apart of DNAstops around the time of slowed mass and length growth rateand is reversed when growth is blocked completely with chlor-amphenicol (Fig. 7D), concordant with the transertion modelfor segregation. Clusters of plasmid RK2 were also confined toa single or two nucleoid bodies in thymine-starved filaments(46). There, too, the nucleoid(s) was (were) not evenly distrib-uted along the filament but remained near its center.
Inhibition of cell division as proposed by the nucleoid oc-clusion model has recently been supported by the discovery ofnonspecific DNA binding proteins Noc (for “nucleoid occlu-sion”) and Slm (for “synthetically lethal with a defective Minsystem”) that prevent the division machinery of B. subtilis andE. coli (8, 132), respectively, from assembling in the vicinity ofthe nucleoid. Cell division was blocked in the absence ofboth the Min system and the Noc/Slm protein, presumablydue to the accumulation of nonproductive division proteincomplexes. The puzzling mechanism of action of these acces-sory proteins, which seem to exert the nucleoid occlusion ef-fect, is still not clear. In particular, the fact that Slm is notrequired for “growth on M9 minimal medium” even in thecomplete absence of the Min system but is necessary in LB (8)may reflect the difference in nucleoid complexity of cells be-tween the two media (Fig. 2 to 5). This possibility can be testedby thymine limitation that simulates nucleoid complexity in fastgrowing cells without modifying the cell’s metabolic situation(see above). If the TDP model is involved, the slm127 (orslm267) �minCDE double mutant will only grow in minimalmedium when supplied with high thymine concentrations (and
2�-deoxyguanosine) but not with low, limiting concentrationswhen nucleoid is more complex.
CONCLUDING REMARKS
Bacterial thymine-less mutants lose colony-forming abilitywhen deprived of the required building block. A multitude ofmolecular and cellular processes are involved, but the majorcause for “death” is still unknown. The possibility that it is amatter of plating efficiency of filaments with long, DNA-lessends (Fig. 7C) cannot be ruled out by existing data and shouldbe tested.
Entering the cell by passive diffusion only, thymine concentra-tions supplementing thyA cultures determine intracellular levelsof its metabolites and hence chromosome replication rate. Ma-nipulating the concentration is a complementary means to dis-sociate between rates of cell growth � and of chromosome rep-lication 1/C and has been exploited to correlate various majorcellular events and structures to DNA replication, nucleoid seg-regation, and chromosome complexity. The two physiologicalstates, thymine limitation and thymine starvation, differ markedly,as discussed here and demonstrated morphologically in Fig. 6 and7, respectively, and summarized in Table 1. The unfortunateclaim that “thymine starvation of a thy� strain produce cellularmonsters” (134) may mislead scientists to ignore this tool. Thepotential of both states to understand the bacterium is far frombeing exhausted.
Nucleoid complexity is defined as the number of replicationpositions per chromosome (n � C/�; the ratio between chro-mosome replication and cell doubling times) and manifested inmultiforked replicating chromosomes. Thymine limitation wasused to raise complexity beyond the limit possible in fast-growing Thy� cells. Cell diameter could thus be increased to astage where the cell starts to split its pole. In the first instance,the segregating, multiforked nucleoids are displaced, hence thespatial position of the FtsZ ring assembling between them istilted accordingly, resulting in a division plane that is not per-pendicular to the cell axis. When complexity increases furtherand cell diameter becomes almost as large as its length, thepole splits to breed a branched cell. The results conform to thenucleoid occlusion model for division placement by the tran-sertion mechanism. The model was tested, and substantiated,using thymine starvation, during which nucleoids extended, butonly to a certain limit. This stretchability limit may provideclues to the delicate nucleoid structure.
The signals transduced between nucleoid structure and po-sition and cell envelope, culminating in the phenomena de-scribed here in the framework of so-called nucleoid occlusion,might have evolved through this small molecule, thymine, andits metabolic intermediates that are only used in the processesof DNA and envelope syntheses. However, while these mole-cules are consumed during DNA synthesis, the sugar deriva-tives are used as mediators in envelope synthesis. Could it leadto filamentation and TLD? Deciphering this connection inbiochemical and biophysical terms is a challenge for futurestudies in bacteriology.
ACKNOWLEDGMENTS
Several EMBO Fellowships during the early years have been con-structive in establishing the knowledge base and cooperation of this
1676 MINIREVIEW J. BACTERIOL.
on July 16, 2018 by guesthttp://jb.asm
.org/D
ownloaded from

research team, to A.Z. (1969, 1972 and 1977) and to C.L.W. (1975).Parts of the work reported in this minireview were funded by grant91-00190 (1992 to 1995) from the U.S.-Israel Binational Science Foun-dation (BSF), Jerusalem (to A.Z.), and “from Molecule to Cell” grant805.47.200 (to S.A.).
The late Wijnand Takkenberg is gratefully acknowledged for helpwith microscopic preparations. Norbert Vischer and Tanneke denBlaauwen are thanked for help with the figures and Charles Helmstet-ter for long-standing encouragement. Charles Helmstetter, Tannekeden Blaauwen, and Nanne Nanninga have been helpful with instructiveremarks, and Tanneke den Blaauwen has been helpful with unpub-lished observations.
REFERENCES
1. Aarsman, M. E. G., A. Piette, C. Fraipont, T. M. F. Vinkelvleugel, M.Nguyen-Disteche, M., and T. den Blaauwen. 2005. Maturation of the Esch-erichia coli divisome occurs in two steps. Mol. Microbiol. 55:1631–1645.
2. Ahmad, S. I., S. H. Kirk, and A. Eisenstark. 1998. Thymine metabolism andthymineless death in prokaryotes and eukaryotes. Annu. Rev. Microbiol.52:591–625.
3. Baldwin, W. W., M. J.-T. Sheu, P. W. Bankston, and C. L. Woldringh. 1988.Changes in Buoyant density and cell size of Escherichia coli in response toosmotic shocks. J. Bacteriol. 170:452–455.
4. Barner, H. D., and S. S. Cohen. 1956. Synchronization of division of athymineless mutant of Escherichia coli. J. Bacteriol. 72:115–123.
5. Bazill, G. W. 1967. Lethal unbalanced growth in bacteria. Nature 216:346–349.
6. Beacham, I. R., K. Beacham, A. Zaritsky, and R. H. Pritchard. 1971.Intracellular thymidine triphosphate concentrations in wild type and inthymine requiring mutants of Escherichia coli 15 and K12. J. Mol. Biol.60:75–86.
7. Berg, C. M., and J. M. O’Neill. 1973. Thymineless death in polA� andpolA� strains of Escherichia coli. J. Bacteriol. 115:707–708.
8. Bernhardt, T. G., and P. A. J. de Boer. 2005. SlmA, a nucleoid-associated,FtsZ binding protein required for blocking septal ring assembly over chro-mosomes in E. coli. Mol. Cell 18:555–564.
9. Binenbaum, Z., A. H. Parola, A. Zaritsky, and I. Fishov. 1999. Transcrip-tion- and translation-dependent changes in membrane dynamics in bacte-ria: testing the transertion model of domain formation. Mol. Microbiol.32:1173–1185.
10. Bipatnath, M., P. P. Dennis, and H. Bremer. 1998. Initiation and velocity ofchromosome replication in Escherichia coli B/r and K-12. J. Bacteriol.180:265–273.
11. Bird, R. E., J. Louarn, J. Martuscelli, and L. Caro. 1972. Origin andsequence of chromosome replication in Escherichia coli. J. Mol. Biol. 70:549–566.
12. Bouvier, F., and N. Sicard. 1975. Interference of dna ts mutations of Esch-erichia coli with thymineless death. J. Bacteriol. 124:1198–1204.
13. Bremer, H., R. Young, and G. Churchward. 1977. Initiation and termina-tion of deoxyribonucleic acid replication in bacteria after a stepwise in-crease in the velocity of replication. J. Bacteriol. 130:92–99.
14. Bremer, H., G. Churchward, and R. Young. 1979. Relation between growthand replication in bacteria. J. Theor. Biol. 81:533–545.
15. Cairns, J. 1963. The bacterial chromosome and its manner of replication asseen by autoradiography. J. Mol. Biol. 6:208–213.
16. Chandler, M. G., and R. H. Pritchard. 1975. The effect of gene concentra-tion and relative gene dosage on gene output in Escherichia coli. Mol. Gen.Genet. 138:127–141.
17. Churchward, G., and H. Bremer. 1977. Determination of the DNA repli-cation time in exponentially growing Escherichia coli B/r. J. Bacteriol. 130:1206–1213.
18. Churchward, G., H. Bremer, and R. Young. 1982. Transcription in bacteriaat different DNA concentrations. J. Bacteriol. 150:572–581.
19. Cohen, S. S., and H. D. Barner. 1954. Studies on unbalanced growth inEscherichia coli. Proc. Natl. Acad. Sci. USA 40:885–893.
20. Cooper, S. 1991. Bacterial growth and division: biochemistry and regulationof prokaryotic and eukaryotic division cycles. Academic Press, Inc., SanDiego, Calif.
21. Corbin, B. D., X.-C. Yu, and W. Margolin. 2002. Exploring intracellularspace: function of the Min system in round-shaped Escherichia coli. EMBOJ. 21:1998–2008.
22. Cummings, D. J., and A. L. Taylor. 1966. Thymineless death and its relationto UV sensitivity in Escherichia coli. Proc. Natl. Acad. Sci. USA 56:171–176.
23. Cummings, D. J., and L. Mondale. 1967. Thymineless death in Escherichiacoli: strain specificity. J. Bacteriol. 93:1917–1924.
24. de Crecy-Lagard, V. A., J. Bellalou, R. Mutzel, and P. Marliere. 2001. Longterm adaptation of a microbial population to a permanent metabolic con-straint: overcomiing thymineless death by experimental evolution of Esch-
erichia coli. BMC Biotechnol. 1:10 [Online.] http://www.biomedcentral.com/1472–6750/1/10.
25. de Gier, J.-W., and J. Luirink. 2001. Biogenesis of inner mebrane proteinsin Escherichia coli. Mol. Microbiol. 40:314–322.
26. den Blaauwen, T., N. Buddelmeijer, M. E. G. Aarsman, C. M. Hameete, andN. Nanninga. 1999. Timing of FtsZ assembly in Escherichia coli. J. Bacte-riol. 181:5167–5175.
27. de Pedro, M. A., K. D. Young, J.-V. Holtje, and H. Schwarz. 2003. Branch-ing of Escherichia coli cells arises from multiple sites of inert peptidoglycan.J. Bacteriol. 185:1147–1152.
28. de Pedro, M. A., C. G. Grunfelder, and H. Schwarz. 2004. Restrictedmobility of cell surface proteins in the polar regions of Escherichia coli. J.Bacteriol. 186:2594–2602.
29. Deutch, C. E., and C. Pauling. 1974. Thymineless mutagenesis in Esche-richia coli. J. Bacteriol. 119:861–867.
30. Dix, D. E., and C. E. Helmstetter. 1973. Coupling between chromosomecompletion and cell division in Escherichia coli. J. Bacteriol. 115:786–795.
31. Donachie, W. 1968. Relationships between cell size and time of initiation ofDNA replication. Nature (London) 219:1077–1079.
32. Donachie, W. D., and D. G. Hobbs. 1967. Recovery from ‘thymineless death’in Escherichia coli 15T�. Biochem. Biophys. Res. Commun. 29:172–177.
33. Donachie, W. D., and K. J. Begg. 1970. Growth of the bacterial cell. Nature(London) 227:1220–1224.
34. Donachie, W. D., K. J. Begg, and M. Vicente. 1976. Cell length, cell growthand cell division. Nature (London) 264:328–333.
35. Elmore, S., M. Muller, N. Vischer, T. Odijk, and C. L. Woldringh. 2005.Single-particle tracking of oriC-GFP fluorescent spots during chromosomesegregation in Escherichia coli. J. Struct. Biol., 151:275–287.
36. Fishov, I., N. B. Grover, and A. Zaritsky. 1995. On bacterial states ofgrowth. Mol. Microbiol. 15:789–794.
37. Fujiwara, T., and S. Fukui. 1974. Unidirectional growth and branch for-mation of a morphological mutant, Agrobacterium tumefaciens. J. Bacteriol.120:583–589.
38. Gherardi, M., and N. Sicard. 1970. Induction of filament formation andthymineless death in Escherichia coli K-12. J. Bacteriol. 102:293–295.
39. Grem, J. L. 2000. 5-Fluorouracil: forty-plus and still ticking. A review of itspreclinical and clinical development. Investig. New Drugs 18:299–313.
40. Grover, N. B., C. L. Woldringh, A. Zaritsky, and R. F. Rosenberger. 1977.Elongation of rod-shaped bacteria. J. Theor. Biol. 67:181–193.
41. Gullbrand, B., T. Åkerlund, and K. Nordstrom. 1999. On the origin ofbranches in Escherichia coli. J. Bacteriol. 181:6607–6614.
42. Hadas, H., M. Einav, I. Fishov, and A. Zaritsky. 1997. Bacteriophage T4development depends on the physiology of its host Escherichia coli. Micro-biology 143:179–185.
43. Hanawalt, P. C. 2004. Density matters: the semiconservative replication ofDNA. Proc. Natl. Acad. Sci. USA 101:17889–17894.
44. Helmstetter, C. E., S. Cooper, O. Pierucci, and E. Revelas. 1968. On thebacterial life sequences. Cold Spring Harbor Symp. Quant. Biol. 33:809–822.
45. Hiraga, S., C. Ichinose, T. Onogi, H. Niki, and M. Yamazoe. 2000. Bidirec-tional migration of SeqA-bound hemimethylated DNA clusters and pairingof oriC copies in Escherichia coli. Genes Cells 5:327–341.
46. Johnson, E. P., S. Yao, and D. R. Helinski. 2005. Gyrase inhibitors andthymine starvation disrupt the normal pattern of plasmid RK2 localizationin Escherichia coli. J. Bacteriol. 187:3538–3547.
47. Kjeldgaard, N. O., O. Maaløe, and M. Schaechter. 1958. The transitionbetween different physiological states during balanced growth of Salmonellatyphimurium. J. Gen. Microbiol. 19:607–616.
48. Koch, A. L., and M. Schaechter. 1962. A model for statistics of the celldivision process. J. Gen. Microbiol. 29:435–454.
49. Koch, A. L., and C. L. Woldringh. 1994. The inertness of poles of agram-negative rod. J. Theor. Biol. 171:415–425.
50. Koch, A. L., and J.-V. Holtje. 1995. A physical basis for the precise locationof the division site of rod-shaped bacteria: the central stress model. Micro-biology 141:3171–3180.
51. Koppes, L. J. H., and N. Nanninga. 1980. Positive correlation between sizeat initiation of chromosome replication in Escherichia coli and size atinitiation of cell constriction. J. Bacteriol. 143:89–99.
52. Kubitschek, H. E. 1974. Estimation of the D period from residual divisionafter exposure of exponential phase bacteria to chloramphenicol. Mol. Gen.Genet. 135:123–130.
53. Kumar, S., N. Prakash, and K. N. Agarwal. 1976. Cyclic AMP control of theenvelope growth in Escherichia coli: envelope morphology of the mutants incya and crp genes. Ind. J. Exp. Biol. 17:325–327.
54. Kusano, K., M. E. Berres, and W. R. Engels. 1999. Evolution of the RECQfamily of helicases: a Drosophila homolog, Dmblm, is similar to the humanBloom syndrome gene. Genetics 151:1027–1039.
55. Lark, K. G., and C. Lark. 1965. Regulation of chromosome replication inEscherichia coli: alternate replication of two chromosomes at slow growthrates. J. Mol. Biol. 13:105–126.
56. Lark, K. G., O. Maaløe, and O. Rostock. 1955. Cytological studies ofnuclear division in Salmonella typhimurium. J. Gen. Microbiol. 13:318–326.
VOL. 188, 2006 MINIREVIEW 1677
on July 16, 2018 by guesthttp://jb.asm
.org/D
ownloaded from

57. Latch, J. N., and W. Margolin. 1997. Generation of buds, swellings, andbranches instead of filaments after blocking the cell cycle of Rhizobiummeliloti. J. Bacteriol. 179:2373–2381.
58. Liu, G., K. Begg, A. Geddes, and W. D. Donachie. 2001. Transcription ofessential cell division genes is linked to chromosome replication in Esche-richia coli. Mol. Microbiol. 40:909–916.
59. Ma, X., D. W. Ehrhardt, and W. Margolin. 1996. Colocalization of celldivision proteins FtsZ and FtsA to cytoskeletal structures in living Esche-richia coli cells by using green fluorescent protein. Proc. Natl. Acad. Sci.USA 93:12998–13003.
60. Maaløe, O., and P. C. Hanawalt. 1961. Thymine deficiency and the normalDNA replication cycle. I. J. Mol. Biol. 3:144–155.
61. Maaløe, O., and K. V. Rasmussen. 1963. On the in vivo replication ofbacterial DNA. Colloq. Int. Cent. Natl. Rech. Sci. 124:165–168.
62. Maaløe, O., and N. O. Kjeldgaard. 1966. Control of Macromolecular Syn-thesis. W.A. Benjamin, Inc., New York, N.Y.
63. Manor, H., M. P. Deutscher, and U. Z. Littauer. 1971. Rates of DNA chaingrowth in Escherichia coli. J. Mol. Biol. 61:503–524.
64. Marston, A. L., and J. Errington. 1999. Selection of the midcell division sitein Bacillus subtilis through MinD-dependent polar localization and activa-tion of MinC. Mol. Microbiol. 33:84–96.
65. Mason, D. J., and D. M. Powelson. 1956. Nuclear division as observed inlive bacteria by a new technique. J. Gen. Microbiol. 71:474–479.
66. Meacock, P. A., and R. H. Pritchard. 1975. Relationship between chromo-some replication and cell division in a thymineless mutant of Escherichiacoli B/r. J. Bacteriol. 122:931–942.
67. Meacock, P. A., R. H. Pritchard, and E. M. Roberts. 1978. Effect of thymineconcentration on cell shape in Escherichia coli Thy� Escherichia coli B/r. J.Bacteriol. 133:320–328.
68. Molina, F., A. Jimenez-Sanchez, and E. C. Guzman. 1998. Determining theoptimal thymidine concentration for growing Thy� Escherichia coli strains.J. Bacteriol. 180:2992–2994.
69. Molina, F., and K. Skarstad. 2004. Replication fork and seqA focus distri-butions in Escherichia coli suggest a replication hyperstructure dependenton nucleotide metabolism. Mol. Microbiol. 52:1597–1612.
70. Mulder, E., and C. L. Woldringh. 1989. Actively replicating nucleoidsinfluence positioning of division sites in Escherichia coli filaments formingcells lacking DNA. J. Bacteriol. 171:4303–4314.
71. Mulder, E., and C. L. Woldringh. 1991. Autoradiographic analysis of dia-minopimelic acid incorporation in filamentous cells of Escherichia coli:repression of peptidoglycan synthesis around the nucleoid. J. Bacteriol.173:4751–5756.
72. Nakayama, K., N. Irino, and H. Nakayama. 1985. The recQ gene of Esch-erichia coli K12: molecular cloning and isolation of insertion mutants. Mol.Gen. Genet. 200:266–271.
73. Nanninga, N. 2001. Cytokinesis in prokaryotes and eukaryotes: commonprinciples and different solutions. Microbiol. Mol. Biol. Rev. 65:319–333.
74. Norris, V., C. L. Woldringh, and E. Mileykovskaya. 2004. A hypothesis toexplain division site selection in Escherichia coli by combining nucleoidocclusion and Min. FEBS Lett. 561:3–10.
75. O’Donovan, G. A. 1978. Thymidine metabolism in bacteria (and how, orhow not, to label DNA), p. 219–253. In I. Molineux and M. Kohiyama (ed.),DNA synthesis: present and future. Plenum Publishing Corp., New York,N.Y.
76. Ogden, G. B., M. J. Pratt, and M. Schaechter. 1988. The replicative originof the E. coli chromosome binds to cell membranes only when hemimethy-lated. Cell 54:127–135.
77. Ohkawa, T. 1976. Studies of intracellular thymidine nucleotides. Relation-ship between the synthesis of deoxyribonucleic acid and the thymidinetriphosphate pool in Escherichia coli K12. Eur. J. Biochem. 61:81–91.
78. Ohkawa, T. 1979. Abnormal metabolism of thymidine nucleotides andphosphorylation of deoxycytidine in Escherichia coli C thy� ura� mutant.Eur. J. Biochem. 100:165–173.
79. Oishi, M., H. Yoshikawa, and N. Sueoka. 1964. Synchronous and dichoto-mous replications of the Bacillus subtilis chromosome during spore germi-nation. Nature (London) 204:1069–1073.
80. Pas, E., M. Einav, C. L. Woldringh, and A. Zaritsky. 2001. Perpendicularplanes of FtsZ arcs in spheroidal Escherichia coli cells. Biochimie 83:121–123.
81. Perlman, D., and R. H. Rownd. 1975. Accumulation of replicating bacterialplasmid DNA during thymine limitation or hydroxyurea treatment. Mol.Gen. Genet. 138:281–291.
82. Piechaud, M. 1954. La coloration sans hydrolyse du noyau des bacteries.Ann. Inst. Pasteur (Paris) 86:787–793.
83. Pierucci, O. 1978. Dimensions of Escherichia coli at various growth rates:model for envelope growth. J. Bacteriol. 135:559–574.
84. Poindexter, J. L. S., and G. C. Bazire. 1964. The fine structure of stalkedbacteria belonging to the family Caulobacteriaceae. J. Cell Biol. 23:587–607.
85. Pritchard, R. H. 1974. On the growth and form of a bacterial cell. Philos.Trans. R. Soc. Lond. B 267:303–336.
86. Pritchard, R. H., and K. G. Lark. 1964. Induction of replication by thymine
starvation at the chromosome origin in Escherichia coli. J. Mol. Biol. 9:288–307.
87. Pritchard, R. H., P. T. Barth, and J. Collins. 1969. Control of DNAsynthesis in bacteria. Microbial growth. Symp. Soc. Gen. Microbiol. 19:263–297.
88. Pritchard, R. H., and A. Zaritsky. 1970. Effect of thymine concentration onthe replication velocity of DNA in a thymineless mutant of Escherichia coli.Nature (London) 226:126–131.
89. Puyet, A., and J. L. Canovas. 1989. Changes of Escherichia coli cell cycleparameters during fast growth and throughout growth with limiting amounts ofthymine. Arch. Microbiol. 152:578–583.
90. Rabinovitch, A., A. Zaritsky, and M. Feingold. 2003. DNA-membrane in-teractions can localize bacterial cell center. J. Theor. Biol. 225:493–496.
91. Raskin, D. M., and P. A. de Boer. 1999. Rapid pole-to-pole oscillation of aprotein required for directing division to the middle of Escherichia coli.Proc. Natl. Acad. Sci. USA 96:4971–4976.
92. Reinhart, K. V., and J. C. Copeland. 1973. Evidence that thymine is not anormal metabolite in wild-type Bacillus subtilis. Biochim. Biophys. Acta294:1–7.
93. Robinow, C., and E. Kellenberger. 1994. The bacterial nucleoid revisited.Microbiol. Rev. 58:211–232.
94. Roepke, R. R. 1967. Relation between different thymineless mutants de-rived from Escherichia coli. J. Bacteriol. 93:1188–1189.
95. Rosenberger, R. F., N. B. Grover, A. Zaritsky, and C. L. Woldringh. 1978.Control of microbial surfce growth by density. Nature (London) 271:244–245.
96. Rosenberger, R. F., N. B. Grover, Zaritsky, and C. L. Woldringh. 1978.Surface growth of rod-shaped bacteria. J. Theor. Biol. 73:711–721.
97. Ryter, A. 1994. French contribution of electron microscopy to bacteriology.Biol. Cell 80:139–141.
98. Ryter, A., E. Kellenberger, A. Birch-Andersen, and O. Maaløe. 1958. Etudeau microscope electronique de plasmas contenant de l’acide desoxyribo-nucleique. I. Les nucleoides des bacteries en croissance active. Z. Naturfor-sch. 13B:597–705.
99. Sat, B., M. Reches, and H. Engelberg-Kulka. 2003. The Escherichia colimazEF suicide module mediates thymineless death. J. Bacteriol. 185:1803–1807.
100. Schaechter, M., O. Maaløe, and N. Kjeldgaard. 1958. Dependency onmedium and temperature of cell size and chemical composition duringbalanced growth of Salmonella typhimurium. J. Gen. Microbiol. 19:592–606.
101. Schaechter, M., J. P. Williamson, J. R. Hood, and A. L. Koch. 1962.Growth, cell and nuclear divisions in some bacteria. J. Gen. Microbiol.29:421–434.
102. Seto, S., and M. Miyata. 1998. Cell reproduction and morphologicalchanges in Mycoplasma capricolum. J. Bacteriol. 180:256–264.
103. Strauss, B., K. Kelly, and D. Ekiert. 2005. Cytochrome oxidase deficiencyprotects Escherichia coli from cell death but not from filamentation due tothymine deficiency or DNA polymerase inactivation. J. Bacteriol. 187:2827–2835.
104. Sueoka, N., and H. Yoshikawa. 1965. The chromosome of Bacillus subtilis.I. The theory of marker frequency analysis. Genetics 52:747–757.
105. Suit, J. C., T. Barbee, and S. Jetton. 1967. Morphological changes inEscherichia coli strain C produced by treatments affecting deoxyribonucleicacid synthesis. J. Gen. Microbiol. 49:165–173.
106. Tao, H., C. Bausch, C. Richmond, F. R. Blattner, and T. Conway. 1999.Functional genomics: expression analysis of Escherichia coli growing onminimal and rich media. J. Bacteriol. 181:6425–6440.
107. Taschner, P. E. M. 1988. Genetic and morphological analysis of cell divisionin Escherichia coli, p. 109–120. Ph.D. thesis, University of Amsterdam, TheNetherlands.
108. Taschner, P. E. M., J. G. J. Verest, and C. L. Woldringh. 1987. Genetic andmorphological characterization of ftsB and nrdB mutants of Escherichia coli.J. Bacteriol. 169:19–25.
109. Taschner, P. E. M., P. G. Huls, E. Pas, and C. L. Woldringh. 1988. Divisionbehavior and shape changes in isogenic ftsZ, ftsQ, ftsA, pbpB, and ftsE celldivision mutants of Escherichia coli during temperature shift experiments. J.Bacteriol. 170:1533–1540.
110. Thanbichler, M., P. H. Viollier, and L. Shapiro. 2005. The structure andfunction of the bacterial chromosome. Curr. Opin. Genet. Dev. 15:153–162.
111. Tribe, M. J. 1977. Cyclic thymineless death significantly increases frequencyof R-plasmid elimination. Antimicrob. Agents Chemother. 12:555–556.
112. Trueba, F. J. 1981. A morphometric analysis of Escherichia coli and otherrod-shaped bacteria. Ph.D. thesis, University of Amsterdam, The Netherlands.
113. Trueba, F. J., and C. L. Woldringh. 1980. Changes in cell diameter duringthe division cycle of Escherichia coli. J. Bacteriol. 142:869–878.
114. Valkenburg, J. A. C., C. L. Woldringh, G. J. Brakenhoff, H. T. M. van derVoort, and N. Nanninga. 1985. Confocal scanning light microscopy of theEscherichia coli nucleoid: comparison with phase contrast and electronmicroscope images. J. Bacteriol. 161:478–483.
115. van Helvoort, J. M. L. M., and C. L. Woldringh. 1994. Nucleoid partitioningin Escherichia coli during steady state growth and upon recovery fromchloramphenicol treatment. Mol. Microbiol. 13:577–583.
1678 MINIREVIEW J. BACTERIOL.
on July 16, 2018 by guesthttp://jb.asm
.org/D
ownloaded from

116. Vollmer, W., and J.-V. Holtje. 2004. The architecture of the murein (pep-tidoglycan) in gram-negative bacteria: vertical scaffold or horizontal lay-er(s)? J. Bacteriol. 186:5978–5987.
117. Wachsman, J. T., and L. Hogg. 1964. Use of thymineless death to enrich fordoubly auxotrophic mutants of Bacillus megaterium. J. Bacteriol. 87:1118–1122.
118. Wagner, J. K., C. D. Galvani, and Y. V. Brun. 2005. Caulobacter crescentusrequires RodA and MreB for stalk synthesis and prevention of ectopic poleformation. J. Bacteriol. 187:544–553.
119. Walker, G. C. 1984. Mutagenesis and inducible responses to deoxyribonu-cleic acid damage in Escherichia coli. Microbiol. Rev. 48:60–93.
120. Wold, S., K. Skarstad, H. B. Steen, T. Stocke, and E. Boye. 1994. Theinitiation mass for DNA replication in Escherichia coli K-12 is dependenton growth rate. EMBO J. 13:2097–2102.
121. Woldringh, C. L. 1976. Morphological analysis of nuclear separation andcell division during the life cycle of Escherichia coli. J. Bacteriol. 125:248–257.
122. Woldringh, C. L. 1994. Significance of plasmolysis spaces as markers forperiseptal annuli and adhesion sites. Mol. Microbiol. 14:597–607.
123. Woldringh, C. L. 2002. The role of co-transcriptional translation and pro-tein translocation (transertion) in bacterial chromosome segregation. Mol.Microbiol. 45:17–29.
124. Woldringh, C. L., M. A. de Jong, W. van den Berg, and L. Koppes. 1977.Morphological analysis of the division cycle of two Escherichia coli sub-strains during slow growth. J. Bacteriol. 131:270–279.
125. Woldringh, C. L., N. B. Grover, R. F. Rosenberger, and A. Zaritsky. 1980.Dimensional rearrangement of rod-shaped bacteria following nutritionalshift-up. II. Experiments with Escherichia coli B/r. J. Theor. Biol. 86:441–454.
126. Woldringh, C., and N. Nanninga. 1985. Structure of nucleoid and cytoplasmin the intact cell, p. 171–187. In N. Nannigna (ed.), Molecular cytology ofEscherichia coli. Academic Press, London, United Kingdom.
127. Woldringh, C. L., E. Mulder, J. A. C. Valkenburg, F. B. Wientjes, A.Zaritsky, and N. Nanninga. 1990. Role of the nucleoid in the toporegula-tion of division. Res. Microbiol. 141:39–50.
128. Woldringh, C. L., E. Mulder, P. G. Huls, and N. Vischer. 1991. Toporegu-lation of bacterial division according to the nucleoid occlusion model. Res.Microbiol. 142:309–320.
129. Woldringh, C. L., A. Zaritsky, and N. B. Grover. 1994. Nucleoid partition-ing and the division plane in Escherichia coli. J. Bacteriol. 176:7030–7038.
130. Wollman, E. L., and F. Jacob. 1955. Sur le mecanisme du transfer demateriel genetique au cours de la recombination chez E. coli K12. C. R.Acad. Sci. 240:2449–2451.
131. Womble, D. D., R. L. Warren, and R. H. Rownd. 1978. Replication ofplasmid DNA in Proteus mirabilis in limiting concentrations of thymine. J.Bacteriol. 133:1263–1272.
132. Wu, L. J., and J. Errington. 2004. Coordination of cell division and chro-
mosome segregation by a nucleoid occlusion protein in Bacillus subtilis. Cell117:915–925.
133. Yoshikawa, H., A. O’Sullivan, and N. Sueoka. 1964. Sequential replicationof the Bacillus subtilis chromosome, III. Regulation of initiation. Proc. Natl.Acad. Sci. USA 52:973–980.
134. Young, K. D. 2003. Bacterial shape. Mol. Microbiol. 49:571–580.135. Yu, X. C., and W. Margolin. 1999. FtsZ ring clusters in min and partition
mutants: role of both the Min system and the nucleoid in regulating FtsZring localization. Mol. Microbiol. 32:315–326.
136. Zaritsky, A. 1975. Rate stimulation of deoxyribonucleic acid synthesis afterinhibition. J. Bacteriol. 122:841–846.
137. Zaritsky, A. 1975. On dimensional determination of rod-shaped bacteria. J.Theor. Biol. 54:243–248.
138. Zaritsky, A. 1977. Branching of fast-growing Escherichia coli 15T� in lowthymine concentrations. FEMS Microbiol. Lett. 2:65–69.
139. Zaritsky, A., and R. H. Pritchard. 1971. Replication time of the chromo-some in thymineless mutants of Escherichia coli. J. Bacteriol. 60:65–74.
140. Zaritsky, A., and R. H. Pritchard. 1973. Changes in cell size and shapeassociated with changes in the replication time of the chromosome ofEscherichia coli. J. Bacteriol. 114:824–837.
141. Zaritsky, A., and C. L. Woldringh. 1978. Chromosome replication rate andcell shape in Escherichia coli: lack of coupling. J. Bacteriol. 135:581–587.
142. Zaritsky, A., and C. L. Woldringh. 1987. Similarity of dimensional rear-rangements in Escherichia coli cells responding to thymine limitation (step-down) and to nutritional shift-up, p. 78–80. In M. Vicente et al. (ed.),Molecular basis of bacterial growth and division. EMBO Workshop, Sego-via, Spain.
143. Zaritsky, A., and C. L. Woldringh. 2003. Localizing cell division in sphericalEscherichia coli by nucleoid occlusion. FEMS Microbiol. Lett. 226:209–214.
144. Zaritsky, A., C. L. Woldringh, N. B. Grover, J. Naaman, and R. F. Rosen-berger. 1982. Growth and form in bacteria. Comments Mol. Cell Biophys.1:237–260.
145. Zaritsky, A., C. L. Woldringh, I. Fishov, N. O. E. Vischer, and M. Einav.1999. Varying division planes in spheroidal Escherichia coli cells. Microbi-ology 145:1015–1022.
146. Zaritsky, A., A. van Geel, I. Fishov, E. Pas, M. Einav, and C. L. Woldringh.1999. Visualizing multiple constrictions in spheroidal Escherichia coli cells.Biochimie 81:897–900.
147. Zaritsky, A., C. L. Woldringh, R. H. Pritchard, and I. Fishov. 2000. Sur-viving bacteria in good shape. The many faces of bacillary bacteria, p.347–364. In J. Seckbach (ed.), Journey to diverse microbial worlds. KluwerAcademic Publishers, Dordrecht, The Netherlands.
148. Zaritsky, A., and S. Zabrovitch. 1981. DNA synthesis in Escherichia coliduring a nutritional shift-up. Mol. Gen. Genet. 181:564–566.
149. Zerfas, P. M., M. Kessel, E. J. Quintero, and R. M. Weiner. 1997. Fine-structure evidence for cell membrane partitioning of the nucleoid andcytoplasm during bud formation in Hyphomonas species. J. Bacteriol. 179:148–156.
VOL. 188, 2006 MINIREVIEW 1679
on July 16, 2018 by guesthttp://jb.asm
.org/D
ownloaded from