mirna ivonne gaya scandiffio - amazon web...
TRANSCRIPT

19
INTRODUCTION
Brazil holds a competitive advantage when the issue is cost of ethanol production, due to favor-able climate conditions and technological advances as result of over thirty years experience since the National Program for Ethanol, the Proálcool.
This competitiveness, however, faces a grow-ing threat as far as cost of logistics for trans-portation is concerned, mainly due to lack of investments in infrastructure, harming the trans-portation of ethanol in the country, aggravated when it comes to exporting the renewable fuel.
Recently, the production of ethanol from sug-arcane is receiving considerable attention from national and international investors, for two main reasons: the competitive price of ethanol when confronted with the increasing, and uncertainties, of oil prices, and secondly to the growing percep-tion with its environmental benefits. Still, the growing demand for hydrated ethanol since the introduction of flex fuel vehicles in Brazil in 2003, which already represents a similar volume of com-mercialization to those of gasoline, together with advances in research on second generation ethanol, are relevant factors to bring back investments for expanding the production of sugarcane ethanol.
And the decision for investing to expand supply of ethanol needs to be thought consider-ing other important aspects, not only based on supply and demand analysis. For example, new production units should certainly consider the proximity or access to the consumer markets, that is, the existing infrastructure allowing better use
LOGISTICS FOR ETHANOL TRANSPORT
Mirna Ivonne Gaya Scandiffio
of different modes of transport for delivering the ethanol, such as pipelines, waterways, railways and roads. Also, the proximity of electrical power substations is an important variable to be consid-ered as the mills present a growing potential for commercialization of bioelectricity surplus from manufacturing process, besides sugar and ethanol, which demands a better use of bagasse and trash.
One of the scenarios recently evaluated in a study carried out by Nipe1 considered the possibil-ity of substituting 10% of world demand of gasoline by sugarcane ethanol produced in Brazil, showing the potential that the country has to produce, annually, of 205 million of cubic meters (mln m3) of ethanol by 2025. This expansion would take place in areas more distant to the consumer mar-ket increasing the need for better infrastructure and logistics in order to guarantee the delivery of ethanol to distribution hubs and exporting ports.
To define better alternatives and more efficient use of modes of transportation for ethanol, giving priority to pipelines, waterways and railways, stud-ies must be conducted with aid of computerized tools in order to bring out quantitative data to the process of decision taking. Mathematical model-ings should be developed to analyze the behavior of the diverse variables present in the logistics for ethanol transportation. The socio-economic impacts, as well as the environmental ones, should be contemplated in the developed models.
1 Nipe: Interdisciplinary Center for Energy Planning. Study sponsored by the Center for Management and Strategic Stud-ies (CGEE).
Mirna Ivonne Gaya Scandiffio. "LOGISTICS FOR ETHANOL TRANSPORT", p.785-800. In Luis Augusto Barbosa Cortez (Coord.). Sugarcane bioethanol — R&D for Productivity and Sustainability, São Paulo: Editora Edgard Blücher, 2014.http://dx.doi.org/10.5151/BlucherOA-Sugarcane-SUGARCANEBIOETHANOL_66
786 A New Model for Industrial Production and Final Uses of Ethanol
ETHANOL PRODUCTION AND STORAGE
Brazilian sugarcane sector is characterized by the existence of two types of distilleries, the autono-mous (dedicated only to ethanol production), and the annexed or mixed units, producing both sugar and ethanol. There are also some few mills dedi-cated exclusively to sugar production. Currently, sixty two percent of the existing mills are mixed and only 38% produce only ethanol (MAPA, 2008).
It was with the launch of the Proálcool, in 1975, that distilleries emerged to produce fuel ethanol from sugarcane juice. Before the Proalcool, ethanol was produced from molasses, a byproduct derived from the sugar production process. To these existing mills, distilleries were annexed to produce ethanol. This was particularly the case in São Paulo, where Copersucar, a leading coop-erative of mills, defended that ethanol production should be thought in terms of energy security, while the then Institute of Sugar and Alcohol (IAA) was concerned that use of the same sugarcane for producing ethanol might harm the exports of sugar and the profits, mainly in the Northeast region of the country (SCANDIFFIO, 2005).
To have an idea of the Proálcool impact, in its first phase, the production of ethanol increased from 664,000 m3 in the 1976/1977 harvest to 3.7
mln m3 in the harvest of 1980/1981. This raise made possible to offer enough anhydrous ethanol to be mixed to gasoline, in the proportion of 15 to 20% (FURTADO and SCANDIFFIO, 2006).
The success of the Proálcool’s first phase and the rising of the second oil crisis forced the Federal Government to adopt a set of measures such as the configuration of an institutional arrangement, sub-sidized financing for new units to produce ethanol, creation of an storage system, transportation and distribution of hydrated ethanol to fuel dedicated ethanol vehicles, and giving to Petrobras – the Brazilian Oil Company – a leading roll.
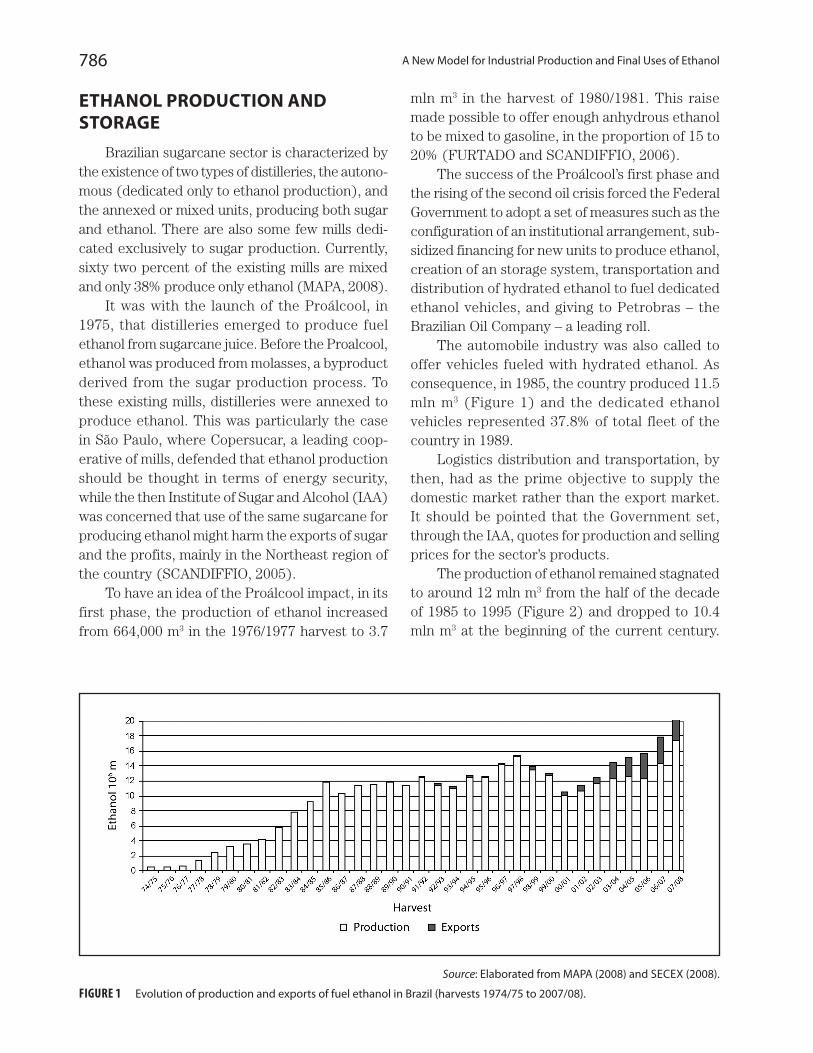
The automobile industry was also called to offer vehicles fueled with hydrated ethanol. As consequence, in 1985, the country produced 11.5 mln m3 (Figure 1) and the dedicated ethanol vehicles represented 37.8% of total fleet of the country in 1989.
Logistics distribution and transportation, by then, had as the prime objective to supply the domestic market rather than the export market. It should be pointed that the Government set, through the IAA, quotes for production and selling prices for the sector’s products.
The production of ethanol remained stagnated to around 12 mln m3 from the half of the decade of 1985 to 1995 (Figure 2) and dropped to 10.4 mln m3 at the beginning of the current century.
Source: Elaborated from MAPA (2008) and SECEX (2008).
FIGURE 1 Evolution of production and exports of fuel ethanol in Brazil (harvests 1974/75 to 2007/08).
787Logistics for Ethanol Transport
Early in 1990’s, the 1000 cylinders vehicles fueled with gasoline were introduced in Brazil and most of the ethanol production would be anhydrous to be mixed to gasoline (FURTADO and SCANDIF-FIO, 2006).
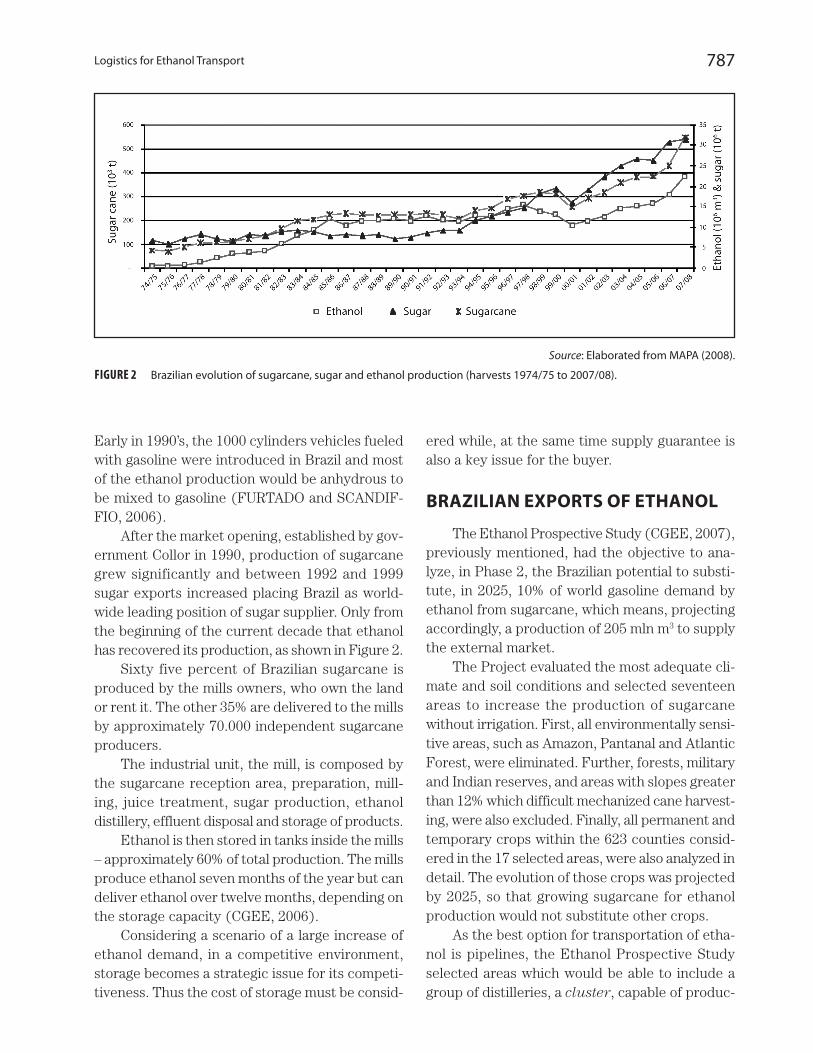
After the market opening, established by gov-ernment Collor in 1990, production of sugarcane grew significantly and between 1992 and 1999 sugar exports increased placing Brazil as world-wide leading position of sugar supplier. Only from the beginning of the current decade that ethanol has recovered its production, as shown in Figure 2.
Sixty five percent of Brazilian sugarcane is produced by the mills owners, who own the land or rent it. The other 35% are delivered to the mills by approximately 70.000 independent sugarcane producers.
The industrial unit, the mill, is composed by the sugarcane reception area, preparation, mill-ing, juice treatment, sugar production, ethanol distillery, effluent disposal and storage of products.
Ethanol is then stored in tanks inside the mills – approximately 60% of total production. The mills produce ethanol seven months of the year but can deliver ethanol over twelve months, depending on the storage capacity (CGEE, 2006).
Considering a scenario of a large increase of ethanol demand, in a competitive environment, storage becomes a strategic issue for its competi-tiveness. Thus the cost of storage must be consid-
ered while, at the same time supply guarantee is also a key issue for the buyer.
BRAZILIAN EXPORTS OF ETHANOL
The Ethanol Prospective Study (CGEE, 2007), previously mentioned, had the objective to ana-lyze, in Phase 2, the Brazilian potential to substi-tute, in 2025, 10% of world gasoline demand by ethanol from sugarcane, which means, projecting accordingly, a production of 205 mln m3 to supply the external market.
The Project evaluated the most adequate cli-mate and soil conditions and selected seventeen areas to increase the production of sugarcane without irrigation. First, all environmentally sensi-tive areas, such as Amazon, Pantanal and Atlantic Forest, were eliminated. Further, forests, military and Indian reserves, and areas with slopes greater than 12% which difficult mechanized cane harvest-ing, were also excluded. Finally, all permanent and temporary crops within the 623 counties consid-ered in the 17 selected areas, were also analyzed in detail. The evolution of those crops was projected by 2025, so that growing sugarcane for ethanol production would not substitute other crops.
As the best option for transportation of etha-nol is pipelines, the Ethanol Prospective Study selected areas which would be able to include a group of distilleries, a cluster, capable of produc-
Source: Elaborated from MAPA (2008).
FIGURE 2 Brazilian evolution of sugarcane, sugar and ethanol production (harvests 1974/75 to 2007/08).
788 A New Model for Industrial Production and Final Uses of Ethanol
ing a significant volume of ethanol to justify the construction of pipelines based in economics.
These clusters would aggregate about 210,000 people, who will need housing, education, health etc., and other amenities such as bakeries, drug-stores etc.
One of the main concerns of the Ethanol Pro-spective Study was the minimization of regional dif-ferences for producing ethanol. In the first stage, the Northeast would increase its producing share of less than 10% in the harvest 2006/2007 to 34% in 2015, and then reach around 50% of the country’s ethanol production by 2025. This means that the North-Northeast region has an ethanol export capacity of 92 mln m3 and the Center-South region, 113 mln m3.
To bring all this volume to the ports for export-ing the renewable fuel, Brazil needs to implement a new logistics structure.
DISTRIBUTION OF ETHANOL
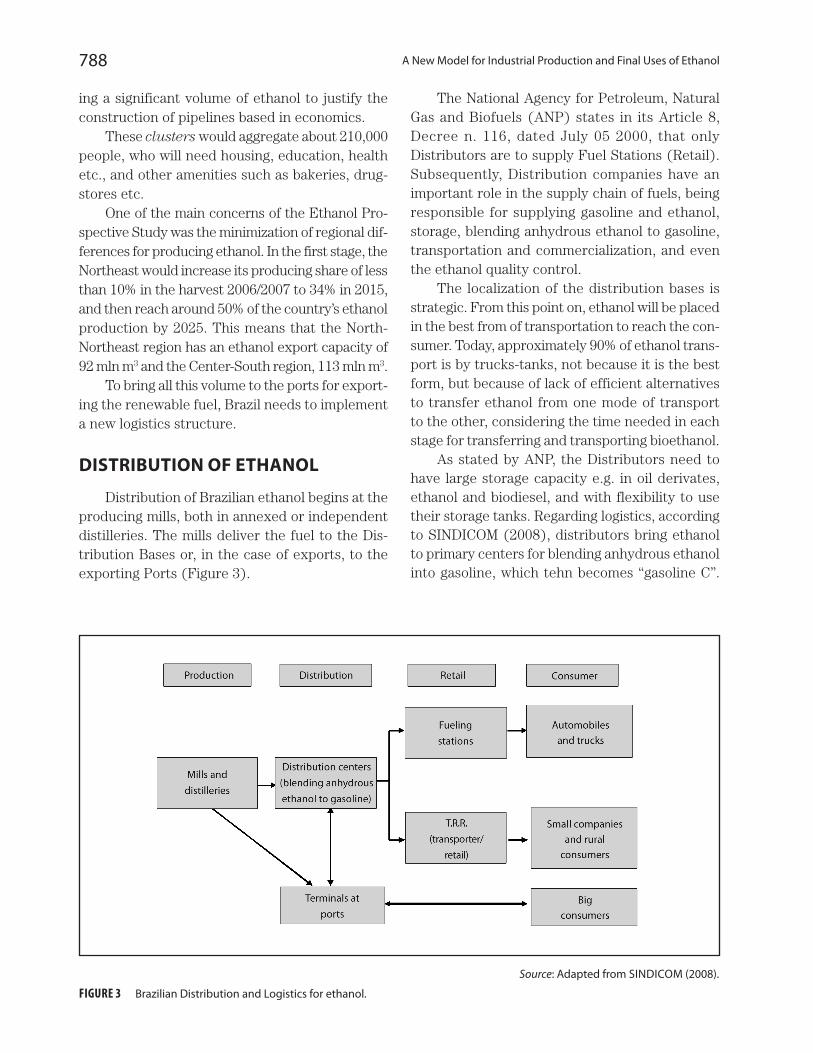
Distribution of Brazilian ethanol begins at the producing mills, both in annexed or independent distilleries. The mills deliver the fuel to the Dis-tribution Bases or, in the case of exports, to the exporting Ports (Figure 3).
The National Agency for Petroleum, Natural Gas and Biofuels (ANP) states in its Article 8, Decree n. 116, dated July 05 2000, that only Distributors are to supply Fuel Stations (Retail). Subsequently, Distribution companies have an important role in the supply chain of fuels, being responsible for supplying gasoline and ethanol, storage, blending anhydrous ethanol to gasoline, transportation and commercialization, and even the ethanol quality control.
The localization of the distribution bases is strategic. From this point on, ethanol will be placed in the best from of transportation to reach the con-sumer. Today, approximately 90% of ethanol trans-port is by trucks-tanks, not because it is the best form, but because of lack of efficient alternatives to transfer ethanol from one mode of transport to the other, considering the time needed in each stage for transferring and transporting bioethanol.
As stated by ANP, the Distributors need to have large storage capacity e.g. in oil derivates, ethanol and biodiesel, and with flexibility to use their storage tanks. Regarding logistics, according to SINDICOM (2008), distributors bring ethanol to primary centers for blending anhydrous ethanol into gasoline, which tehn becomes “gasoline C”.
Source: Adapted from SINDICOM (2008).
FIGURE 3 Brazilian Distribution and Logistics for ethanol.
789Logistics for Ethanol Transport
Blending can also be done in the tanker trucks, the so called splash blending. Gasoline C and hydrated ethanol are then transferred to secondary distribu-tion facilities or delivered directly to Fuel Stations (retail) and final consumers (Figure 3). Ethanol can also be delivered directly from the mills and distilleries to the terminals at ports when final destination is the external market or cabotage2.
It is important to keep in mind that ethanol production in Brazil is widespread, distributed in 285 counties. There are over 400 producing units, from which 155 are independent distilleries pro-ducing only ethanol (MAPA, 2008). As a compari-son, the country has 14 oil refineries producing oil derivates, mainly gasoline and diesel.
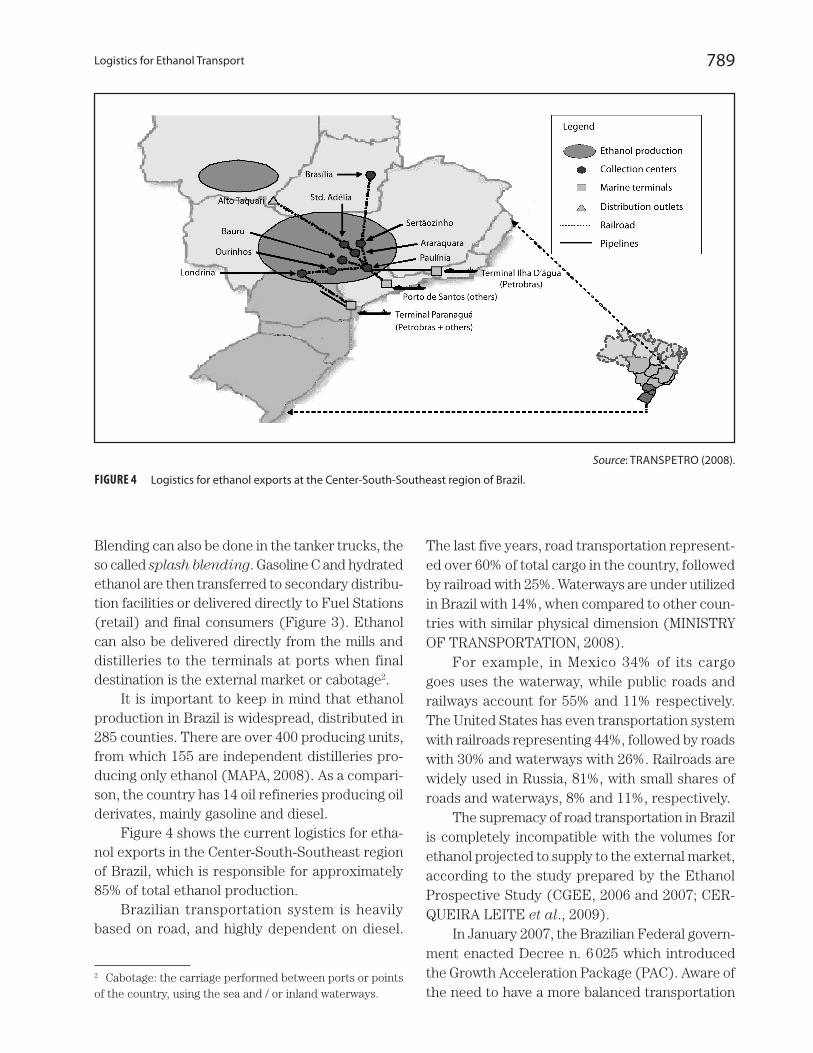
Figure 4 shows the current logistics for etha-nol exports in the Center-South-Southeast region of Brazil, which is responsible for approximately 85% of total ethanol production.
Brazilian transportation system is heavily based on road, and highly dependent on diesel.
2 Cabotage: the carriage performed between ports or points of the country, using the sea and / or inland waterways.
The last five years, road transportation represent-ed over 60% of total cargo in the country, followed by railroad with 25%. Waterways are under utilized in Brazil with 14%, when compared to other coun-tries with similar physical dimension (MINISTRY OF TRANSPORTATION, 2008).
For example, in Mexico 34% of its cargo goes uses the waterway, while public roads and railways account for 55% and 11% respectively. The United States has even transportation system with railroads representing 44%, followed by roads with 30% and waterways with 26%. Railroads are widely used in Russia, 81%, with small shares of roads and waterways, 8% and 11%, respectively.
The supremacy of road transportation in Brazil is completely incompatible with the volumes for ethanol projected to supply to the external market, according to the study prepared by the Ethanol Prospective Study (CGEE, 2006 and 2007; CER-QUEIRA LEITE et al., 2009).
In January 2007, the Brazilian Federal govern-ment enacted Decree n. 6 025 which introduced the Growth Acceleration Package (PAC). Aware of the need to have a more balanced transportation
Source: TRANSPETRO (2008).
FIGURE 4 Logistics for ethanol exports at the Center-South-Southeast region of Brazil.
790 A New Model for Industrial Production and Final Uses of Ethanol
system given its huge impact on economic develop-ment, particularly in the most remote areas of the country, the PAC included Logistics in its national infrastructure projects.
Initially, estimated funds to carry out the Program were R$ 503 billion and lately a further R$ 143 billion were added, totalizing R$ 646 bil-lion. This amount, to accomplish the infrastructure projects between 2007 and 2010, will be provided by the Government, states and private companies (Federal Government, 2009). From this total, only 10% is designated to projects on transportation, and from this 57% is to be used in the road trans-portation mode.
The Plan (PAC) consists of 69 sites for con-struction and maintenance of 45,337 km of road and 2,518 km of railroads. It includes the mod-ernization of 12 maritime ports, 20 airports, and construction of 13,826 km of electric power trans-mission to the grid. It also includes the installation of four new petrochemical refineries, construction of 4,526 km of natural gas pipelines, 67 waterway ports and two sluices (floodgates) in Tucuruí/Pará, in the river Tocantins.
During the PAC’s second year evaluation, at the beginning of 2008, it was confirmed a further expenditure of R$ 502 billion over the previous amount, totaling R$ 1,148 trillion. Nevertheless, the Federal Government had invested, in 2006, only 0.64% of GDP in infrastructure, 0.73% in 2007 and 1% in 2008. The WORLD BANK Report (2007) states that Brazil needs to invest 3.2% of its GDP in infrastructure to follow the economic growth of the country. The Government recognizes its limita-tion, though 41% of total investment needed for PAC will come from private companies.
INFRASTRUCTURE
Brazil has 7,400 km of maritime coast and 80% of its population live up to 200 km from the coat. The country has 32 seaports although only 2% of containerized cargo is transported by its sea coast, or cabotage.
Brazilian transportation system comprises 1.6 million km of public roads, 42,000 km of wa-terways and 29,283 kilometers of railroads. There
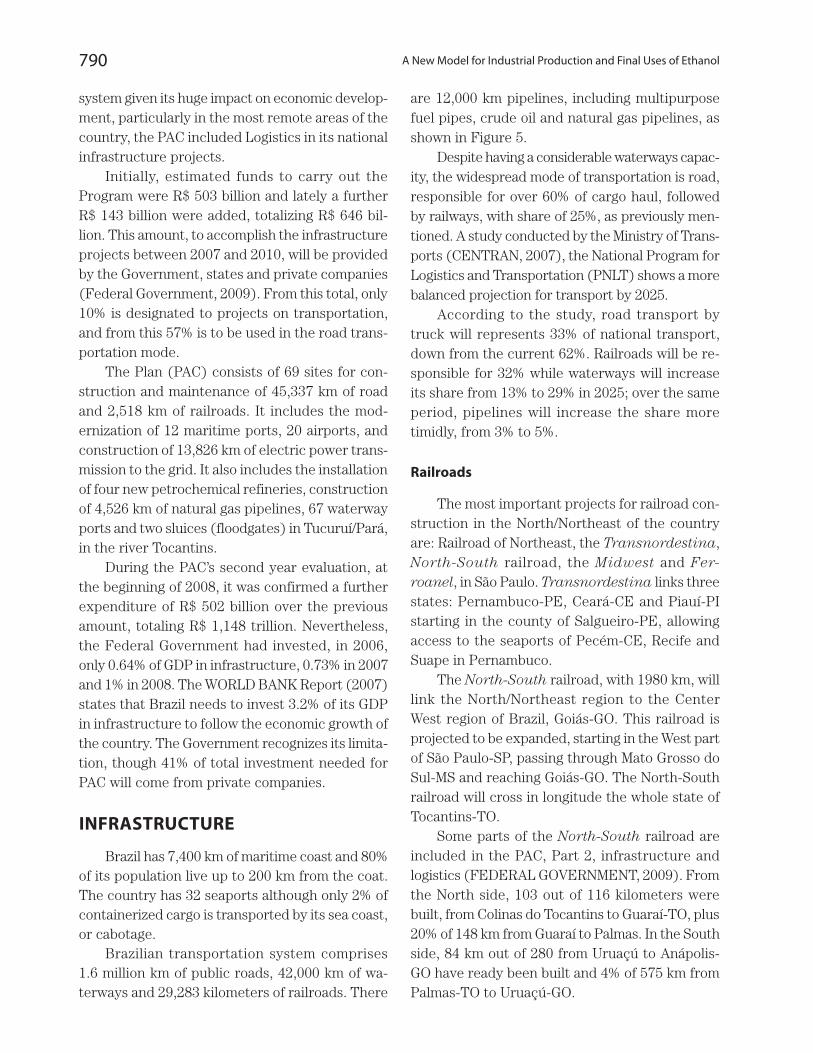
are 12,000 km pipelines, including multipurpose fuel pipes, crude oil and natural gas pipelines, as shown in Figure 5.
Despite having a considerable waterways capac-ity, the widespread mode of transportation is road, responsible for over 60% of cargo haul, followed by railways, with share of 25%, as previously men-tioned. A study conducted by the Ministry of Trans-ports (CENTRAN, 2007), the National Program for Logistics and Transportation (PNLT) shows a more balanced projection for transport by 2025.
According to the study, road transport by truck will represents 33% of national transport, down from the current 62%. Railroads will be re-sponsible for 32% while waterways will increase its share from 13% to 29% in 2025; over the same period, pipelines will increase the share more timidly, from 3% to 5%.
Railroads
The most important projects for railroad con-struction in the North/Northeast of the country are: Railroad of Northeast, the Transnordestina, North-South railroad, the Midwest and Fer-roanel, in São Paulo. Transnordestina links three states: Pernambuco-PE, Ceará-CE and Piauí-PI starting in the county of Salgueiro-PE, allowing access to the seaports of Pecém-CE, Recife and Suape in Pernambuco.
The North-South railroad, with 1980 km, will link the North/Northeast region to the Center West region of Brazil, Goiás-GO. This railroad is projected to be expanded, starting in the West part of São Paulo-SP, passing through Mato Grosso do Sul-MS and reaching Goiás-GO. The North-South railroad will cross in longitude the whole state of Tocantins-TO.
Some parts of the North-South railroad are included in the PAC, Part 2, infrastructure and logistics (FEDERAL GOVERNMENT, 2009). From the North side, 103 out of 116 kilometers were built, from Colinas do Tocantins to Guaraí-TO, plus 20% of 148 km from Guaraí to Palmas. In the South side, 84 km out of 280 from Uruaçú to Anápolis-GO have ready been built and 4% of 575 km from Palmas-TO to Uruaçú-GO.
791Logistics for Ethanol Transport
As for the Transnordestina railroad, 89% of 96 km are concluded, linking Missão Velha-CE to the West of Pernambuco, in Salgueiro, and also 368 km out of 550 from Cabo, East of PE, to Porto Real, Alagoas-AL.
The project in the Center-West of Brazil, the Ferronorte railroad, links São Paulo-SP to Cuiabá-MT. In São Paulo, the Ferroanel North railroad project will connect the North of São Paulo city to Sepetiba, Rio de Janeiro-RJ. The state of São Paulo is responsible for about 60% of total etha-nol production in the country. It is also leader in ethanol consumption and in volume exported from the port of Santos. Still, ethanol reaches the port
by road, which leads to long traffic lines of tanker trucks with diesel burning and release of green-house gases (GHG).
Although most railroads were privatized, the sector suffered a stagnation period and it was only after the Government injected new investment that the modernization of projects and exten-sion of some railroads came to reality e.g. 2,000 kilometers, totalizing a network of 31,000 km. In spite of this stagnation, the railroads transporta-tion increased its haul capacity, growing from 1.5 ton to 4.0 ton pushed by modern trains, which also increased the average speed up to 35 km per hour (VILAÇA, 2008).
Source: Elaborated from geographic spatial information from IBGE.
FIGURE 5 Brazilian Infrastructure (except Roadways).

792 A New Model for Industrial Production and Final Uses of Ethanol
Pipelines
Brazilian ethanol transportation via pipelines is insignificant at present, close to 2%. Road trucks are responsible for approximately 90% of ethanol delivery. In 1981, in the Proálcool peak, road mode of transportation participated only with 37% of ethanol’s transportation and pipelines, with 13%. Railroads and waterways accounted for 31% and 20%, respectively (CGEE, 2006).
There are several projects currently under study to increase pipelines transportation of etha-nol, mainly because of economic and environmen-tal benefits. Major players of those projects are the Government, through Petrobras/Transpetro, the ethanol producers sectors from Goiás-GO, Mato Grosso-MT, Mato Grosso do Sul-MS, Paraná-PR and São Paulo-SP. Figure 6 shows the main proj-
ects: 1a, 1b, 1c, 2 and 3, for the Center-South region of Brazil.
In the short and medium term, when these projects become operational, the Center-South region could transport 12 mln m3 a year of ethanol, with an estimated investment of approximately US$ 2.0 billion, in partnership with the private sector. Fuel ethanol export capacity of Brazil is, at present, close to 5 mln m3, which was the volume exported in 2008 (MAPA, 2009).
It is important to point out that there are still some Institutional regulation disagreements from the ANP concerning the construction and operation of pipelines and also with respect to the Open Access to transport ethanol (Art. 58, Decree n. 9 478/97). A Review of the present Legislation is needed to guarantee the supply to the final
FIGURE 6 Existing pipelines and pipelines projects for the Center-South of Brazil.
793Logistics for Ethanol Transport
consumer and the operational safety for ethanol transportation (ANP, 2007).
Project 1a consists of the construction of dedi-cated ethanol pipelines from the refinery Replan, located in São Paulo, to the Maritime Terminal Ilha d’Água, in Rio de Janeiro, with total capacity of four mln m3 a year. The same project includes a pipeline from Ribeirão Preto-SP to Uberaba – MG and another, with 90 km extension from Guarare-ma to the port of São Sebastião, both in São Paulo Sate. It also considers the construction of a 525 km ethanol-only pipeline parallel to the existing one, a multipurpose pipeline, from Guararema to Terminal Ilha d’Água-RJ.
Project 1c, also with annual transporting ca-pacity of four mln m3, has as the objective to ship ethanol produced in the West region of São Paulo using the Tietê-Paraná waterway to Conchas. From Conchas to Replan/Paulínia-SP, the project includes a 90 km pipeline and the construction of three storage terminals along the waterway. From Replan/Paulínia, ethanol would be shipped by pipeline to the port of São Sebastião or Terminal Ilha d’Água-RJ, following the previous project, 1a.
Project 3, with major contribution from the sugarcane ethanol sector, refers to the transpor-tation of ethanol from the Araçatuba Terminal, West of São Paulo, to Mairinque, Southeast of São Paulo, by railway. A dedicated pipeline would be constructed to transport ethanol from Mairinque to the port of Santos-SP.
Project 1b is an ethanol-only pipeline from Pa-ranagua port, in Paraná, to the terminal in Cuiabá, Mato Grosso, passing through ethanol production re-gions in the North of Paraná and Mato Grosso do Sul.
Project 2, in Paraná, South region of Brazil, consists of 528 km of a dedicated ethanol pipeline with estimated cost of R$ 630 mln. The pipeline would pass through Copel’s safety area of electric-ity transmission, about 250 km between Maringá and Jaguariaíva. Another 83 km pipeline would go in parallel to the road PR-092 reaching the city of Doutor Ulysses. For the following 100 km the pipeline will follow Gasbol route (a natural gas-dedicated pipe) to Araucária and finally, the last 95 km to the port of Paranaguá, will go alongside an existing oil pipe operated by Petrobras.
Maritime terminals for ethanol exports
The present infrastructure of Brazil to trans-port ethanol does not differ significantly from the initial proposal presented when Proálcool was launched, though the Program main objective was to supply the domestic market.
For an exporting scenario, the country has few ports with adequate infrastructure for the grow-ing needs of a international fuel ethanol, although some investment initiatives in terminals had been done, as example of TEAS, Stolthaven and others in the port of Santos-SP, Pasa in the port of Paraná, and enlargement of terminal’s capacity for liquid fuel in other ports in Brazil.
TEAS (Terminal para Exportação de Álcool Santos) is the result of a partnership between Cosan, Crystalsev, Nova America group and Cargill. This was an important initiative which a 40,000 m3 capacity, currently being expanded to 80,000 m3.
The Port of Paranaguá (PR), has recently completed its first public terminal dedicated to ethanol. There are seven tanks with storage ca-pacity of 35,000 m3 each, able to unload within 48 hours the ethanol to the ship and at the same time to load ethanol to the tanks; it has a monthly capacity for 15 ships. The cost was covered by the Administration of Paranagua and Antonina Ports (APPA).
Other storage initiatives for ethanol are in progress in the Northeast region of the country, mostly by Petrobras, in the ports of Cabedelo-PB, Recife-PE and Maceió-AL.
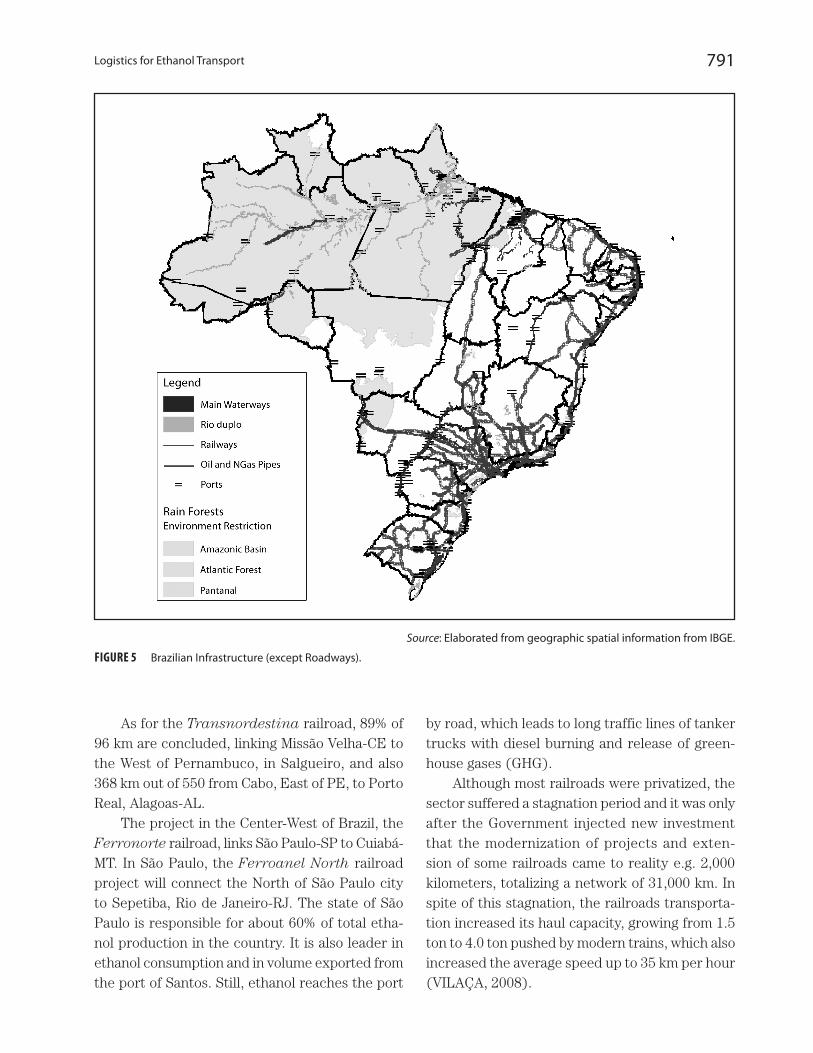
In 2007, eighty five percent of ethanol exports in the country were through the ports of Santos-SP, Paranaguá-PR and Rio de Janeiro-RJ, located in the South/Southeast region of Brazil, while the Northeast ports represented 14.2% of total ex-ports, as shown in Table 1.
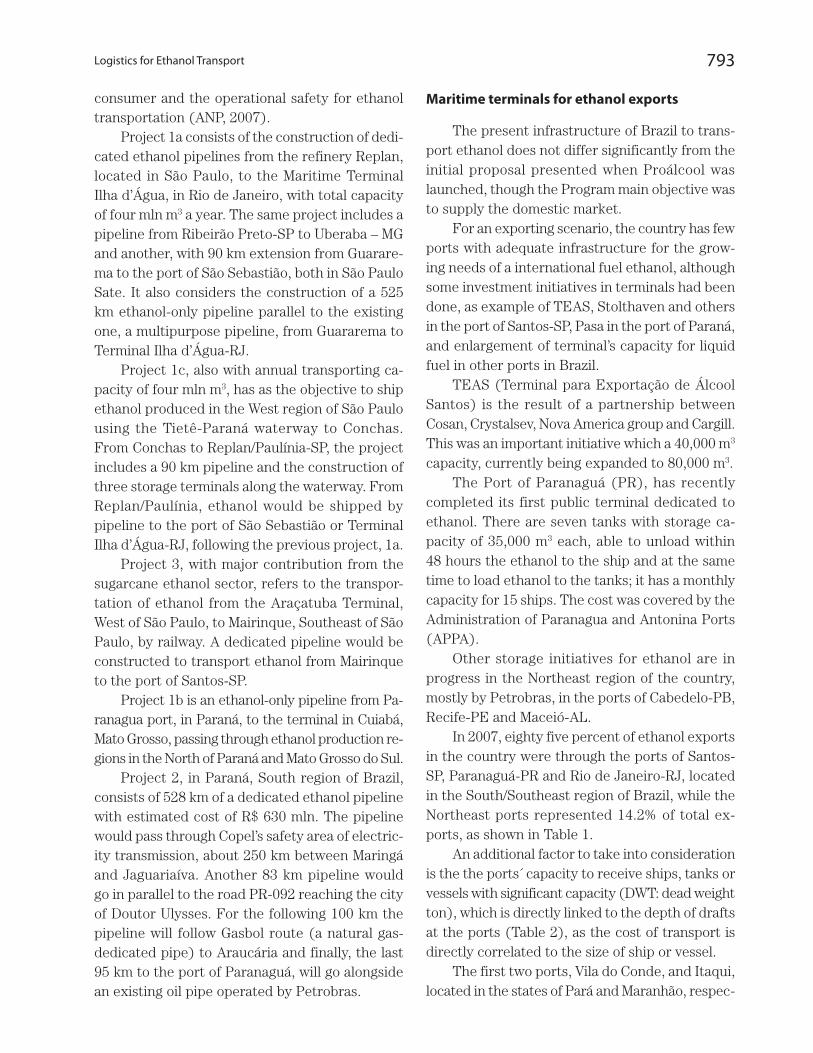
An additional factor to take into consideration is the the ports´ capacity to receive ships, tanks or vessels with significant capacity (DWT: dead weight ton), which is directly linked to the depth of drafts at the ports (Table 2), as the cost of transport is directly correlated to the size of ship or vessel.
The first two ports, Vila do Conde, and Itaqui, located in the states of Pará and Maranhão, respec-
794 A New Model for Industrial Production and Final Uses of Ethanol
tively, are included in the planned investment in the PAC (2008) and thus it is expected that both ports will be prepared to receive large vessels, with capacity from 150,000 m3 to 280,000 m3 of fuel.
Brazilian waterways
Since 1799 many ideas and project had been proposed to integrate the Brazilian territory via waterways. The first registered idea came from Alexander von Humbolt, a German scientist, who visited South America and foresaw that the con-
tinent could be linked from North to South with a “Great Waterway”, linking the basins of Prata, Amazonas and Orinoco, this last one located in Venezuela, through the Cassiquiare channel, a natural waterway between the rivers Negro and Orinoco (CGEE, 2007).
In 1869, the military engineer Eduardo José de Moraes, presented to the emperor Dom Pedro II, a plan showing how a net of fluvial navigation could be built using only the existing waterway and some low cost structure, integrating all the regions of Brazil.
The linkage between the Prata and Amazonas basins would be done by a 12 kilometers waterway at the Pantanal border, called Serra do Aguapeí, the source of the rivers Aguapeí and Alegre. Those two basins already connect themselves in periods of heavy rain. Integration among the three basins, Prata, Amazonas and Orinoco, with a total exten-sion of 9,818 kilometers, would shape the “Great Waterway” which also would integrate all countries of South America, except for Chile. The strategic meaning of this waterway in terms of regional economic development is compared to the Reno-Danube Waterway, initiated by Carlos Magno and concluded few years ago, in terms of development for the European continent.
Major waterways
Brazil has 7,400 kilometers of navigable At-lantic coastline and thousands of kilometers of rivers. The main navigable rivers are located in the Amazon region, reaching the most remote and less developed areas in the North/Northeast of the country. However, this waterway does not consti-tute any significant cost-effective solution because of the low population density in those regions.
The more important navigable rivers, from the economic point of view, are located in the South-east and South of Brazil. The full benefit of other waterways depends on the construction of sluices and floodgates, dredging works and suitable ports to allow intermodal transport integration. A briefly description of main Brazilian waterways follows.
• Waterway of Araguaia-Tocantins: Tocan-tins has the major basin entirely located
TABLE 2 Principal ports with ethanol export capacity in Brazil.
Most importants ports
Deepth
Maximum Minimum
Santos – SP 13.5 5
Paranaguá – PR 7.2 5.9
Cabadelo – PB 9.5 5
Maceió – AL 10 7
Vitória – ES 10.6 2.4
Vila do Conde – PA 15 13
Itaqui – MA 19 13
Salvador – BA 18 12
São Sebastião – SP 18 12
Ilhéus – BA 10 10
Angra dos Reis – RJ 12 6
La Plata – Argentina 8.5 8.5
Source: COPPEAD (2008).
TABLE 1 Participation of brazilian ports for ethanol exports (2007).
Ethanol exports by port (%) 2007
Santos 69.6%
Paranaguá 14.3%
Maceió 8.0%
Recife 4.5%
Rio de Janeiro 1.7%
Cabedelo 1.7%
Others 0.2%
Source: SECEX/SDP (2008).
795Logistics for Ethanol Transport
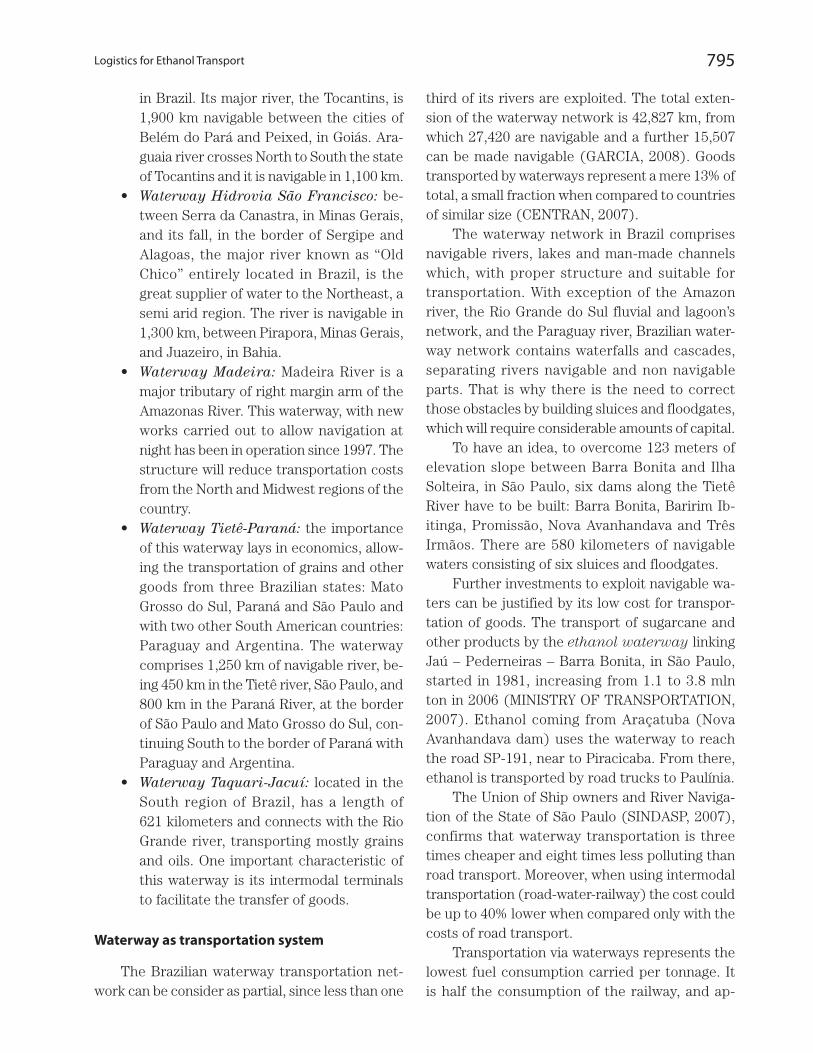
in Brazil. Its major river, the Tocantins, is 1,900 km navigable between the cities of Belém do Pará and Peixed, in Goiás. Ara-guaia river crosses North to South the state of Tocantins and it is navigable in 1,100 km.
• Waterway Hidrovia São Francisco: be-tween Serra da Canastra, in Minas Gerais, and its fall, in the border of Sergipe and Alagoas, the major river known as “Old Chico” entirely located in Brazil, is the great supplier of water to the Northeast, a semi arid region. The river is navigable in 1,300 km, between Pirapora, Minas Gerais, and Juazeiro, in Bahia.
• Waterway Madeira: Madeira River is a major tributary of right margin arm of the Amazonas River. This waterway, with new works carried out to allow navigation at night has been in operation since 1997. The structure will reduce transportation costs from the North and Midwest regions of the country.
• Waterway Tietê-Paraná: the importance of this waterway lays in economics, allow-ing the transportation of grains and other goods from three Brazilian states: Mato Grosso do Sul, Paraná and São Paulo and with two other South American countries: Paraguay and Argentina. The waterway comprises 1,250 km of navigable river, be-ing 450 km in the Tietê river, São Paulo, and 800 km in the Paraná River, at the border of São Paulo and Mato Grosso do Sul, con-tinuing South to the border of Paraná with Paraguay and Argentina.
• Waterway Taquari-Jacuí: located in the South region of Brazil, has a length of 621 kilometers and connects with the Rio Grande river, transporting mostly grains and oils. One important characteristic of this waterway is its intermodal terminals to facilitate the transfer of goods.
Waterway as transportation system
The Brazilian waterway transportation net-work can be consider as partial, since less than one
third of its rivers are exploited. The total exten-sion of the waterway network is 42,827 km, from which 27,420 are navigable and a further 15,507 can be made navigable (GARCIA, 2008). Goods transported by waterways represent a mere 13% of total, a small fraction when compared to countries of similar size (CENTRAN, 2007).
The waterway network in Brazil comprises navigable rivers, lakes and man-made channels which, with proper structure and suitable for transportation. With exception of the Amazon river, the Rio Grande do Sul fluvial and lagoon’s network, and the Paraguay river, Brazilian water-way network contains waterfalls and cascades, separating rivers navigable and non navigable parts. That is why there is the need to correct those obstacles by building sluices and floodgates, which will require considerable amounts of capital.
To have an idea, to overcome 123 meters of elevation slope between Barra Bonita and Ilha Solteira, in São Paulo, six dams along the Tietê River have to be built: Barra Bonita, Baririm Ib-itinga, Promissão, Nova Avanhandava and Três Irmãos. There are 580 kilometers of navigable waters consisting of six sluices and floodgates.
Further investments to exploit navigable wa-ters can be justified by its low cost for transpor-tation of goods. The transport of sugarcane and other products by the ethanol waterway linking Jaú – Pederneiras – Barra Bonita, in São Paulo, started in 1981, increasing from 1.1 to 3.8 mln ton in 2006 (MINISTRY OF TRANSPORTATION, 2007). Ethanol coming from Araçatuba (Nova Avanhandava dam) uses the waterway to reach the road SP-191, near to Piracicaba. From there, ethanol is transported by road trucks to Paulínia.
The Union of Ship owners and River Naviga-tion of the State of São Paulo (SINDASP, 2007), confirms that waterway transportation is three times cheaper and eight times less polluting than road transport. Moreover, when using intermodal transportation (road-water-railway) the cost could be up to 40% lower when compared only with the costs of road transport.
Transportation via waterways represents the lowest fuel consumption carried per tonnage. It is half the consumption of the railway, and ap-
796 A New Model for Industrial Production and Final Uses of Ethanol
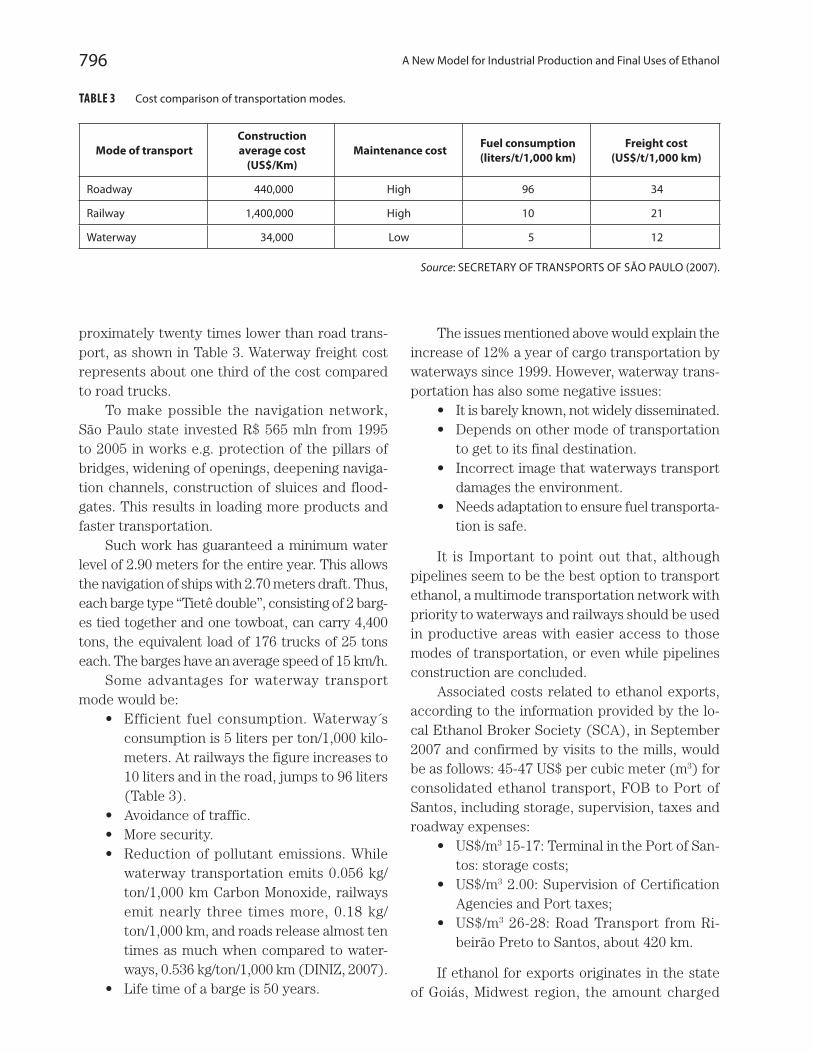
proximately twenty times lower than road trans-port, as shown in Table 3. Waterway freight cost represents about one third of the cost compared to road trucks.
To make possible the navigation network, São Paulo state invested R$ 565 mln from 1995 to 2005 in works e.g. protection of the pillars of bridges, widening of openings, deepening naviga-tion channels, construction of sluices and flood-gates. This results in loading more products and faster transportation.
Such work has guaranteed a minimum water level of 2.90 meters for the entire year. This allows the navigation of ships with 2.70 meters draft. Thus, each barge type “Tietê double”, consisting of 2 barg-es tied together and one towboat, can carry 4,400 tons, the equivalent load of 176 trucks of 25 tons each. The barges have an average speed of 15 km/h.
Some advantages for waterway transport mode would be:
• Efficient fuelconsumption.Waterway´sconsumption is 5 liters per ton/1,000 kilo-meters. At railways the figure increases to 10 liters and in the road, jumps to 96 liters (Table 3).
• Avoidanceoftraffic.• Moresecurity.• Reductionofpollutantemissions.While
waterway transportation emits 0.056 kg/ton/1,000 km Carbon Monoxide, railways emit nearly three times more, 0.18 kg/ton/1,000 km, and roads release almost ten times as much when compared to water-ways, 0.536 kg/ton/1,000 km (DINIZ, 2007).
• Lifetimeofabargeis50years.
The issues mentioned above would explain the increase of 12% a year of cargo transportation by waterways since 1999. However, waterway trans-portation has also some negative issues:
• Itisbarelyknown,notwidelydisseminated.• Dependsonothermodeoftransportation
to get to its final destination.• Incorrectimagethatwaterwaystransport
damages the environment.• Needsadaptationtoensurefueltransporta-
tion is safe.
It is Important to point out that, although pipelines seem to be the best option to transport ethanol, a multimode transportation network with priority to waterways and railways should be used in productive areas with easier access to those modes of transportation, or even while pipelines construction are concluded.
Associated costs related to ethanol exports, according to the information provided by the lo-cal Ethanol Broker Society (SCA), in September 2007 and confirmed by visits to the mills, would be as follows: 45-47 US$ per cubic meter (m3) for consolidated ethanol transport, FOB to Port of Santos, including storage, supervision, taxes and roadway expenses:
• US$/m3 15-17: Terminal in the Port of San-tos: storage costs;
• US$/m3 2.00: Supervision of Certification Agencies and Port taxes;
• US$/m3 26-28: Road Transport from Ri-beirão Preto to Santos, about 420 km.
If ethanol for exports originates in the state of Goiás, Midwest region, the amount charged
TABLE 3 Cost comparison of transportation modes.
Mode of transportConstruction average cost
(US$/Km)Maintenance cost Fuel consumption
(liters/t/1,000 km)Freight cost
(US$/t/1,000 km)
Roadway 440,000 High 96 34
Railway 1,400,000 High 10 21
Waterway 34,000 Low 5 12
Source: SECRETARY OF TRANSPORTS OF SÃO PAULO (2007).

797Logistics for Ethanol Transport
for the consolidated transportation to the port of Santos increases to 70-75 US$/m3. Costs would be approximately 55 US$/m3 if the origin is Araçatuba, Northwest of São Paulo, and 38 US$/m3 if ethanol comes from Piracicaba, about 220 km from the Port of Santos.
Costs related to international transportation for the Mexican Gulf, United States, is about 50-55 US$/m3. If destination is the American East or West Coast, the amount goes to 60-65 US$/m3. Those quotations can change depending on the season and the availability of larger ships.
One can conclude that with a new logistics design for ethanol transportation, new terminals to enlarge storage capacity and modernization of domestic ports to receive bigger vessels, Brazil is able to export large volumes of ethanol, at a competitive price and based on strategic planning.
According to the Ethanol Prospective Study (CGEE, 2007), if pipelines were used, cost of domes-tic transportation of ethanol could be reduced from current 45-70 US$/m3 to 29.60 US$/m3, from São Paulo and Goiás, respectively, to the port of Santos.
Electricity power stations and substations
Investments to increase ethanol production should consider trading electricity, either as sur-plus electricity generated from ethanol produc-tion process or specifically produced to this end. Therefore, the logistic study should include the best location of the units for ethanol production, considering, among other things, the distances from the distillery to the power station or substa-tion to deliver and trade electricity.
THE NEED FOR MATHEMATICAL MODELING STUDIES
To increase production in such a large volume, there is the need for deeper studies with quanti-tative data. Mathematical modeling seems to be a useful tool for decision taking when the problem involves diverse variables.
The proposal for this study would be to iden-tify the ideal trajectory (design) and the ideal mode of transportation, considering that ethanol fuel depends on:
• seasonalnatureofrawmaterialproduction,with different harvest seasons between North-Northeast of Brazil, from September to March, and the Center-South region, from April to November;
• differenceonfuelpricingamongBrazilianstates due to different taxation and trans-portation costs from distributor to final consumer;
• useofamultimodetransportationsystem.
With respect to the transport of ethanol, it is important to develop models considering:
• lifecyclestudiesincludingethanolmari-time transport to the importing countries;
• timingfortransferofethanoltakingintoaccount the alternatives among modes of transport (roadways/railways/waterways) that ethanol could travel to get to the port, for example:i) trucks to barges(waterway);ii) trucks to railways;iii) trucks to pipeline;iv) barges to railway; v) barges to pipeline;vi) barges to trucks;vii) railway to pipeline;viii) railway to barges;ix) railway to trucks;x) pipeline to railway;xi) pipeline to trucks;xii) pipeline to barges.
Also, for modeling, studies could consider the production of ethanol transport from regions such as Mato Grosso do Sul, South of Mato Grosso and West of São Paulo, using barges through the Tietê-Paraná hydroway, leaving from Três Lagoas to Conchas, as stated in example (i).
After the waterway, the renewable fuel could get to Paulínia by pipeline (v) and by railway or truck to the ports of Santos or Ilha d´Água-RJ (x) or (xi). Another option could use the railway from Conchas to Mairinque (iv) and then to Santos by pipeline (vii) or Conchas – Mairinque by trucks (vi) and then reach the Port of Santos by pipeline (iii).
Studies should consider the availability trans-portation modes or the projects in progress to
798 A New Model for Industrial Production and Final Uses of Ethanol
build the needed infrastructure. It is understood that the waterway Tiete-Paraná will be more used in the scenario for larger production of ethanol. On that waterway six sluices were already built in the Tiete River plus four in the Paraná River.
Therefore, the model to be constructed should include, among others: the type of barges – barges power; towboat power; utilization of tank-barges and structure to receive ethanol; transfer secu-rity between modes; security into the barges and towboats; transport mode speed (travel timing); time needed at sluices and bridges; depth of river or canal.
To transport the projected volume of etha-nol, new equipment for transportation would be needed mainly barges and containers for the rail-way mode. Mathematical modeling should consider the analysis of the environmental impacts for not using trucks, as well as social and economic ones: increase of employment because of new maritime construction (barges, towboats) and professional training for specialized personnel.
FINAL CONSIDERATIONS
Brazilian expansion of ethanol production should be well planned to minimize costs of trans-port as well as social and environmental impacts. The present moment is extremely favorable to the imple-mentation of a solid, bold and sustainable Project.
The best mode to transport fuel ethanol, considering environmental and economic aspects, seems to be pipelines. However, to make feasible the construction of dedicated ethanol pipelines, it is important to guarantee a minimum volume of ethanol flow, whether for the domestic market or for exports.
Projections for expanding sugarcane produc-tion and ethanol supply indicate that this will take place outside traditional and/or more distant areas e.g. the Midwest region of Brazil or Norwest of São Paulo state. Therefore, multimode transport, such as waterways and railways stand out to transport ethanol to the ports of Santos or São Sebastião, both located in São Paulo. Ethanol transport, whether for domestic market or exports, should be compatible with environmental benefits and should aim to identify and minimize undesirable impacts. Therefore, specific studies, such as life cycle analysis for fuel ethanol and optimization mathematical modeling, among others, need to be carried out.
Studies on mathematical modeling for etha-nol logistics and distribution searching for the best mode of transport to be used from mills to the ports and the multimode use for ethanol transportation are critical for decision taking. Some examples of studies that used mathematical modeling in compatible research can be found in OJIMA (2005) and XAVIER (2007).
REFERENCES
BRAZILIAN FEDERAL GOVERNMENT (2009). Balanço do Programa de Aceleração do Crescimento 2 anos,
February, 2009. Available at: <www.brasil.gov.br/pac/
balancos/balanco2anos/>.
CENTER FOR MANAGEMENT AND STRATEGIC STUDIES
(CGEE) (2006). (Ethanol Prospective Study) Estudo so-bre as possibilidades e impactos da produção de grandes quantidades de etanol visando à substituição parcial de gasolina no mundo – Fase 1, Capítulos 2, 5 e 6, January.
CENTER FOR MANAGEMENT AND STRATEGIC STUD-
IES (CGEE) (2007). (Ethanol Prospective Study)
Estudo sobre as possibilidades e impactos da pro-dução de grandes quantidades de etanol visando à substituição parcial de gasolina no mundo – Fase 2, Capítulo 2. Março.
CENTER OF EXCELENCE IN TRANSPORT ENGINEER-
ING – CENTRAN (2007). Plano Nacional de Logística e Transportes – PNLT. Relatório Executivo. Rev. 00.
Ministério dos Transportes. Abril.
CERQUEIRA LEITE, R.C. et al. (2009) Can Brazil replace 5% of the 2025 gasoline world demand with ethanol? Energy 34 (2009) 655–661 661, Elsevier. See also: www.
sciencedirect.com
COPPEAD-UFRJ (2007). Indicadores de Transporte Aquaviário – Brasil. Centro de Estudos em Logística.
Universidade Federal do Rio de Janeiro.
DINIZ, M.A.A. (2007). Sistema de Gestão Ambiental para Obras Fluviais. Dissertação de Mestrado. Instituto
Militar de Engenharia, Engenharia de Transportes. Rio
de Janeiro.
799Logistics for Ethanol Transport
FURTADO, A.T.; SCANDIFFIO, M.I.G. (2006). A Promessa do Etanol no Brasil. Scientific American, Edição Es-
pecial Brasil. Ano 5, n. 53, Outubro.
GARCIA, L.E. (2008). Hidrovias do Brasil: Alternativas para o Brasil Central. Painel 1: Intermodalidade. Fórum
Excelência Brasil Central. Uberlândia.
MINISTRY OF AGRICULTURE – MAPA (2007). Balanço Nacional da Cana-de-açúcar e Agroenergia. Secretaria
de Produção e Agroenergia – Brasília. MAPA/SPAE.
MINISTRY OF AGRICULTURE – MAPA (2008). O Eta-nol como um novo Combustível Universal. Análise Estatística e Projeção do Consumo Doméstico e Ex-portação do Etanol Brasileiro no Período 2006 a 2011. Companhia Nacional de Abastecimento – CONAB.
Responsável: Ângelo Bressan. Agosto.
MINISTRY OF AGRICULTURE – MAPA (2009). Secretaria
de Produção e Energia. Departamento da Cana-de-
açúcar e Agroenergia. Exportações Brasileiras de Álcool Dez-08.
MINISTRY OF TRANSPORTS (2007). Departamento
Nacional de Infra-estrutura de Transportes – DNIT.
Available online: <http://transportes.gov.br>.
NATIONAL ENERGY POWER AGENGY – ANEEL (2007).
Thermopower, Substations and Transmission – geo-graphic and spatial data.
NATIONAL PETROLEUM, NATURAL GAS AND BIO-
FUELS AGENGY – ANP (2007). Panorama atual da indústria brasileira de álcool combustível: avaliação do arcabouço regulatório da ANP referente à movimenta-ção do produto. Superintendência de Comercialização
e Movimentação de Petróleo, seus Derivados e Gás
Natural. Junho.
OJIMA, A.L.R.O. (2005). Subsidies for Decision-taking in Brazilian Regions Soybean Transportation. V Interna-
tional PENSA Conference of Agri-food Chains/Networks
Economics Management. July 27-29th, Ribeirão Preto.
PETROBRAS TRANSPORTE S.A. – TRANSPETRO (2008).
Tarifas de referência para serviços de movimentação
de álcool – revisão 18/jan/2007. Disponível em: <http://
www.transpetro.com.br/portugues/negocios/dutosTer-
minais/files/TarifasAlcool01.pdf>.
SCANDIFFIO, M.I.G. (2005). Análise Prospectiva do Álcool Combustível no Brasil – Cenários 2004-2024. Tese de doutorado. Faculdade de Engenharia Mecânica,
Universidade Estadual de Campinas. Fevereiro.
SCANDIFFIO, M.I.G.; FURTADO, AT. (2007) Etanol: riqueza nacional adormecida. ComCiência-SBPC/Lab-
jor. Revista Eletrônica de Jornalismo Científico. Ed. 23,
Id. 261. Maio.
SECRETARY OF TRANSPORTS (2008). Governo do Es-
tado de São Paulo. Available online: <www.transportes.
sp.gov.br/v20/hidrovia.asp>.
SECRETARY OF FOREING AFFAIRS – SECEX (2008).
Ministério de Desenvolvimento, Indústria e Comércio.
See also: <http://www.desenvolvimento.gov.br>.
SINDASP – SINDICATO DOS ARMADORES DE NAVEGA-
ÇÃO FLUVIAL DO ESTADO DE SÃO PAULO (2007).
Gargalo nas Águas. Available online: <http://www.abin.
gov.br/modules/articles/article.php?id=958>.
SINDICOM – SINDICATO NACIONAL DAS EMPRESAS
DISTRIBUIDORAS DE COMBUSTÍVEIS E DE LU-
BRIFICANTES (2008). Available online: <http://www.
sindicom.com.br/logistica>.
VILAÇA, R. (2008). Infra-estrutura e Logística no Brasil: Transporte Ferroviário de Carga. I Simpósio Infra-es-
trutura e Logística no Brasil: Desafios para um País
Emergente. Brasília.
WORLD BANK (2007). Como Revitalizar os Investimentos em Infra-Estrutura no Brasil: Políticas Públicas para uma Melhor Participação do Setor Privado. Volume I:
Relatório Principal. Novembro.
XAVIER, C.E.O. (2008). Localização de tanques de arma-zenagem de álcool combustível no Brasil: aplicação de um modelo matemático de otimização. Dissertação
de Mestrado. Escola Superior de Agricultura Luiz de
Queiroz, Universidade de São Paulo. Piracicaba.
