monitoring programme for the maasvlakte … · the underwater sound related to all the different...
TRANSCRIPT

ABSTRACT
The Port of Rotterdam is expanding to meet
the growing demand to accommodate large
cargo vessels. The construction of Maasvlakte 2
(MV2) started in September 2008. One of the
licensing conditions is the monitoring of the
underwater sound produced during its
construction, with an emphasis on the
establishment of acoustic source levels of the
trailing suction hopper dredgers (TSHDs)
during their various activities: dredging,
transport and discharge of sediment.
TNO (Netherlands Organisation for Applied
Scientific Research) Sonar and Acoustics
carried out measurement and analysis
activities for this monitoring. During an initial
measurement campaign in September 2008,
background measurements were performed
in the absence of dredging. Source level and
background sound measurements were made
in the dredging area while MV2 dredging
activities were underway in September 2009.
In a final phase of the study, possible effects
of underwater sound on marine fauna were
considered for scenarios with and without
dredgers. In this article, the principal results of
the research are described and discussed in
the context of the effects predicted in the
Environmental Impact Assessment.
INTRODUCTION
Maasvlakte 2 is the Port of Rotterdam
Authority’s port extension project west of the
existing Maasvlakte. The project area comprises
approximately 2,000 hectares gross of which
1,000 hectares is the net infrastructure. The first
phase of the project was finished April 2013.
To determine the effects of underwater sound
generated by dredgers on fish and marine
mammals, model calculations were made for
the Environmental Impact Assessment (EIA) on
the basis of the best knowledge available at
the time. From these calculations it emerged
that the sound level below the water in the
vicinity of dredgers can exceed the hearing
threshold of fish and marine mammals.
However, at a distance of more than a few
hundred metres away from the vessel, it was
thought that the threshold for avoidancewould not be exceeded (Vertegaal et al., 2007;
Vellinga, 2007). On that basis, it was
concluded in the EIA in 2007 that the area
affected is negligible in size by comparison
with the total space that is used by the
animals as feeding grounds and migration
areas.
This article focusses on the provision included
in the Soil Removal Permit for the construction
of Maasvlakte 2 on the monitoring of
underwater sound related to the construction
activities. The research conducted in the
context of the aforementioned provision
focussed on finding answers to the following
questions:
– What is the source level of the underwater
sound of the deployed dredgers during the
various phases of the dredging cycle?
– How does the dredger sound relate to the
background sound?
– To what extent are the effect contours
(determined on the basis of the predicted
received levels, weighted on the basis of
the hearing sensitivity of the relevant
species) related to the contours for a
possible impact on marine organisms
predicted in the EIA for a possible impact
on marine organisms?
The Port of Rotterdam Authority does not
have any extensive expertise in the field of the
MONITORING PROGRAMME FOR THE MAASVLAKTE 2, PART III –THE EFFECTS OF UNDERWATER SOUND
FLOOR HEINIS, CHRIST DE JONG, MICHAEL AINSLIE, WIL BORST AND TIEDO VELLINGA
Above: Following the Environmental Impact Assessment,
the underwater sound related to all the different phases
of the dredging cycle was monitored and compared
with background sound and other sources of sound
from shipping vessels and their potential effects on the
marine fauna.
Monitoring Programme for the Maasvlakte 2, Part III - The Effects of Underwater Sound 21

recording of underwater sound levels or
processing measurement data and has
therefore asked TNO (Netherlands
Organisation for Applied Scientific Research)
to elaborate a measuring strategy for the
monitoring requirements stated in the permit.
The strategy has been included in full in the
MV2 Construction Monitoring Plan. In this
article, the principal results of the research will
be described and discussed in the context of
the effects predicted in the Environmental
Impact Assessment.
MEASURING UNDERWATER SOUNDTo comply with the permit conditions, the
following measurements were executed:
– Registration of background sound at a fixed
location in the Maasvlakte 2 area during
one week in the year before the
construction work;
– Registration of the background sound (at a
fixed location) including the underwater
sound as a result of the construction work
over a period of one week in 2009;
– Recording of the sounds of various types of
trailing suction hopper dredgers (TSHDs)
during the various phases of the dredging
cycle in the same week in 2009.
During the measuring week in 2009, the
underwater sound related to all the different
phases of the dredging cycle could be
sufficiently monitored. It was therefore
concluded, in consultation with the Dutch
competent authority, that compliance with
the Maasvlakte 2 Construction Monitoring
Plan had been achieved (see Intermezzo
“Representativeness of measurements”).
Another important component of the strategy
established by TNO was the decision made in
consultation with the Port of Rotterdam
Authority and the Dutch competent authority
to combine field measurements with acoustic
propagation modelling. This made it possible
to estimate underwater sound levels in an
area that extends beyond the measurement
location itself. The modelling works in two
ways:
– Inverse modelling: calculating backwards to
determine the acoustic source level of the
dredgers during different parts of the
dredging cycle from the recorded
underwater sound of individual TSHDs;
22 Terra et Aqua | Number 132 | September 2013
INTERMEZZO: Representativeness of measurements in 2009
During the measurements conducted over a period of one week in October 2009, seven TSHDs were at work.
Recordings were made of the underwater sounds produced by all seven vessels in various phases of the
dredging cycle: dredging, transiting with a load, bottom discharging, rainbowing, pumping ashore and transiting
without a load.
To provide an indication of the representativeness of the measurements, all 21 TSHDs deployed on the
construction of Maasvlakte 2, including the 7 monitored vessels (marked with a red dot), are shown in the
figure below. Two of them are virtually identical sister ships. The figure plots the total installed power (kW) and
the load capacity of the ships (m3). The figure shows that the seven vessels monitored are a representative
selection of those working on Maasvlakte 2.
The Table below contains an overview of the phases of the dredging cycle that could be monitored. It can be
seen that all phases of the cycle were recorded, so that an adequately representative picture has been
established of the underwater sound during the entire range of work done. Because the sound levels for bottom
discharging and pumping ashore, the phases in the dredging cycle for which relatively few data have been
collected, appeared to be lower than these for the other activities, it was decided that sufficient data were
gathered.
Weeks 39 and 40 in 2009
Action number of events:
Transit: fully loaded 16
Transit: empty 16
Dredging port side 15
Dredging starboard side 10
Rainbowing 13
Pumping ashore 2
Bottom discharge 2

FLOOR HEINIS
received a PhD in Natural Sciences in 1993
from the University of Amsterdam. She is a
consultant specialised in freshwater, estuarine
and marine ecology. From 1988-1999 she
was at AquaSense Consultants. She was
responsible for the marine ecological issues in
the EIA for Maasvlakte 2 and now advises the
Port of Rotterdam Authority on these issues.
CHRIST DE JONG
received a MSc (1986) and PhD (1994) in
Technical Physics from the University of
Eindhoven, the Netherlands. In 1986 he joined
TNO (Netherlands Organisation for Applied
Science), where he works in the field of under-
water and ship acoustics. He is ship acoustic
advisor for the Royal Netherlands Navy. Since
2007 he has studied the environmental impact
of anthropogenic underwater sound.
MICHAEL AINSLIE
received a BSc in Physics from Imperial College,
London, UK in 1981, MSc in Mathematics from
the University of Cambridge, UK in 2011, and
PhD in Ocean Acoustics from the Institute of
Sound and Vibration Research (ISVR), University
of Southampton, UK in 1992. He is Visiting
Professor at ISVR’s Centre for Ultrasonics and
Underwater Acoustics and was awarded the
1998 A. B. Wood medal by the UK Institute of
Acoustics.
WIL BORST
received a MSc, Civil Eng, at Delft University of
Technology in 1974 and joined De Weger
International, followed by Svasek BV. In 1987
he took over Netherlands Dredging Consultants.
From 1991-2002 he lectured part-time at the
Groningen State Polytechnic. He is a founding
member of Blue Pelican Associates. In 2005 he
joined the Maasvlakte 2 organisation to draft
the EIA and is now responsible for monitoring
the possible effects on the marine environment.
TIEDO VELLINGA
received a degree in Civil Engineering from
Delft University of Technology in 1979. He then
joined the Port of Rotterdam Authority working
on infrastructure and water management.
He is currently Professor, Ports and Waterways
at Delft University of Technology, Director
Environmental Monitoring at Maasvlakte 2,
and project leader for the development of the
Environmental Ship Index.
Figure 1. Map showing the future Maasvlakte 2 (C, lime green) and the approved sand dredging areas/borrow areas
(green). The red oval shows where sand was actually dredged for the construction of Maasvlakte 2. The large letters
show the sites where recordings of underwater sounds were made. Z: background sounds; A: sand dredging;
B: transport of sand (transit); C: construction area (bottom discharge, rainbowing and pumping ashore).
this is the part of the research that focusses
specifically on compliance with the
requirements of the permit (determining
source levels for TSHDs);
– Forward modelling: here, on the basis of
one or more sources, sound levels are
calculated for the entire three-dimensional
space below the surface of the water; on
the basis of these calculations, the predicted
sound as received by marine animals,
weighted according to the animal’s hearing
characteristics, can be drawn up in a map.
UNDERWATER AMBIENT SOUNDMEASUREMENTSThere are no specific national or international
standards for measuring underwater ambient
sound. Therefore, TNO proposed a measurement
plan, which was fixed in consultation with the
Port of Rotterdam Authority and the Dutch
competent authority.
HydrophonesMeasurements of the background sounds
prior to the construction of Maasvlakte 2
(the baseline measurements) were conducted
in the week of 8 -15 September 2008 at a
fixed location (designated as Z in Figure 1)
which was less than 5 km from the borrow
area (the area where the sand was dredged)
and the future Maasvlakte 2. The monitoring
set-up used in 2008 is shown schematically in
Figure 2.
Hydrophones were deployed from a small
boat on which the recording system was
operated. During this week, recordings were
made over a period of 5.5 consecutive days
2 m above the seabed and over a period of
more than 3 days in the same period at a
height of about 7 m above the seabed (total
water depth was approximately 20 m). A six-
second sample was recorded every minute.
Monitoring Programme for the Maasvlakte 2, Part III - The Effects of Underwater Sound 23

Figure 3. The SESAME
stand-alone recording
system (left: drawing,
right: picture on board
of measurement vessel
‘Mon Desir’ prior to
deployment). The buoy
providing the upward
force for the
hydrophone cable
remained underwater.
Figure 2. Schematic
representation of the fixed
monitoring set-up at location
Z during the baseline
measurements in 2008.
SESAMETo eliminate the practical problems associated
with underwater sound recording from a boat
during an extended time period, TNO
developed the Shallow water Extendible Stand
Alone Acoustic Measuring System SESAME(see Figure 3). SESAME was deployed during
the Maasvlakte 2 construction in the period
25 September to 2 October 2009 at a position
about 2 km east from the measurement
location of the 2008 campaign. This position
avoided the risk of damage by fishing vessels
to the system, which was underwater and
thus not visible at the water surface. The basic
principles and further details for the ambient
sound measurements in 2008 and 2009 can
be found in Dreschler et al. (2009) and de
Jong et al. (2010).
In both measurement campaigns, information
on all shipping, including the active dredgers
in the vicinity of the Maasvlakte 2 area, was
logged by using an Automatic Identification
System (AIS) receiver to investigate the
correlation between shipping activity and
ambient sound levels. The trajectories of all
ships sailing in the Maasvlakte area during the
2009 measurement campaign are displayed in
Figure 4. Weather conditions, such as wind
speed and direction, were monitored by two
meteo systems: One positioned at a fixed
location in the Maasvlakte area and the other
on board of the measurement ship for the
mobile measurements.
The acoustic data collected using the
hydrophones were converted into soundpressure levels (SPL) per one-third-octave band,
with a frequency range of 20 Hz to 80 kHz
(2008) and 12.5 Hz to 160 kHz (2009). The
different calculation steps required to do this
are described in section 4.2 of the first TNO
report (Dreschler et al., 2009).
The statistics of the one-third-octave band SPL
(see Intermezzo “metrics for underwater
sound”) measured at the location Z (Figure 1)
prior to 2008 and during the construction of
Maasvlakte 2 (2009) are shown in Figure 5.
The sound levels measured in 2009 were
generally higher than those found in 2008.
There was a strong correlation with the
distance to dredgers and it is likely that the
dredgers in transit contributed most to the
underwater sound found at the location. The
dredgers sometimes sailed very close to the
fixed SESAME monitoring station and the
variations in the background sounds measured
in 2009 were much higher than the variations
measured in 2008.
24 Terra et Aqua | Number 132 | September 2013
Monitoring Programme for the Maasvlakte 2, Part III - The Effects of Underwater Sound 25
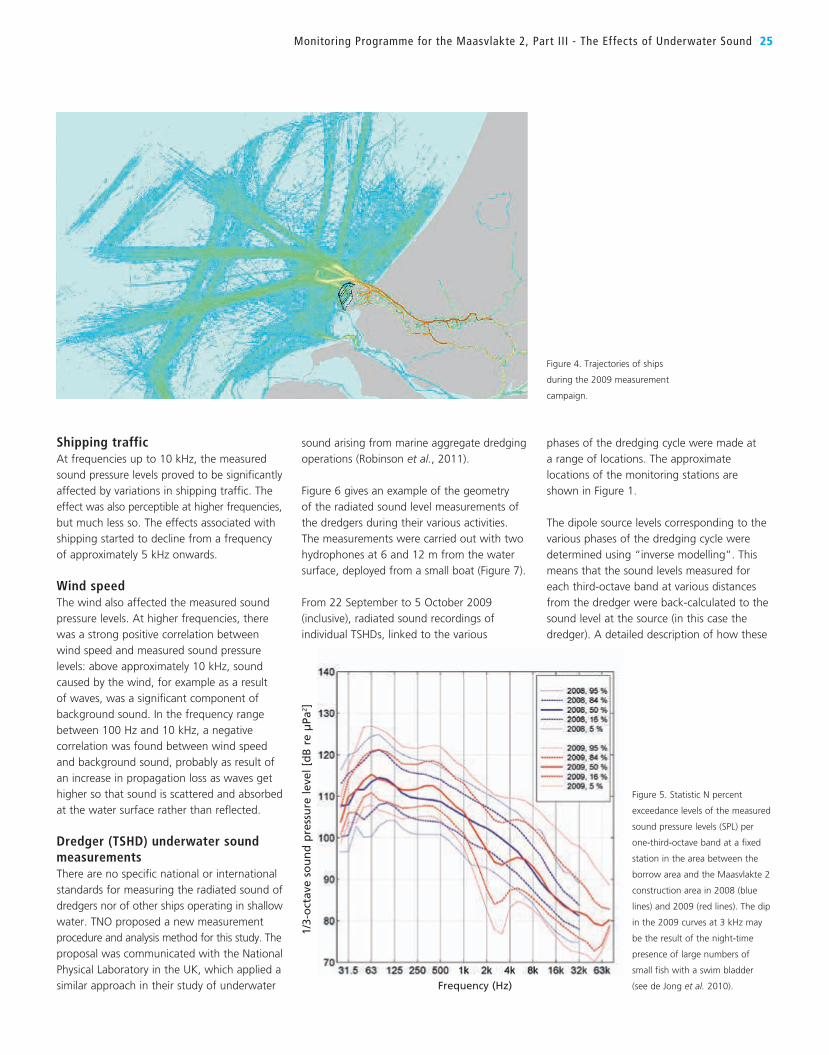
Figure 4. Trajectories of ships
during the 2009 measurement
campaign.
Figure 5. Statistic N percent
exceedance levels of the measured
sound pressure levels (SPL) per
one-third-octave band at a fixed
station in the area between the
borrow area and the Maasvlakte 2
construction area in 2008 (blue
lines) and 2009 (red lines). The dip
in the 2009 curves at 3 kHz may
be the result of the night-time
presence of large numbers of
small fish with a swim bladder
(see de Jong et al. 2010).
1/3-
oct
ave
sou
nd
pre
ssu
re l
evel
[d
B r
e μ
Pa2 ]
Frequency (Hz)
Shipping trafficAt frequencies up to 10 kHz, the measured
sound pressure levels proved to be significantly
affected by variations in shipping traffic. The
effect was also perceptible at higher frequencies,
but much less so. The effects associated with
shipping started to decline from a frequency
of approximately 5 kHz onwards.
Wind speedThe wind also affected the measured sound
pressure levels. At higher frequencies, there
was a strong positive correlation between
wind speed and measured sound pressure
levels: above approximately 10 kHz, sound
caused by the wind, for example as a result
of waves, was a significant component of
background sound. In the frequency range
between 100 Hz and 10 kHz, a negative
correlation was found between wind speed
and background sound, probably as result of
an increase in propagation loss as waves get
higher so that sound is scattered and absorbed
at the water surface rather than reflected.
Dredger (TSHD) underwater soundmeasurementsThere are no specific national or international
standards for measuring the radiated sound of
dredgers nor of other ships operating in shallow
water. TNO proposed a new measurement
procedure and analysis method for this study. The
proposal was communicated with the National
Physical Laboratory in the UK, which applied a
similar approach in their study of underwater
sound arising from marine aggregate dredging
operations (Robinson et al., 2011).
Figure 6 gives an example of the geometry
of the radiated sound level measurements of
the dredgers during their various activities.
The measurements were carried out with two
hydrophones at 6 and 12 m from the water
surface, deployed from a small boat (Figure 7).
From 22 September to 5 October 2009
(inclusive), radiated sound recordings of
individual TSHDs, linked to the various
phases of the dredging cycle were made at
a range of locations. The approximate
locations of the monitoring stations are
shown in Figure 1.
The dipole source levels corresponding to the
various phases of the dredging cycle were
determined using “inverse modelling”. This
means that the sound levels measured for
each third-octave band at various distances
from the dredger were back-calculated to the
sound level at the source (in this case the
dredger). A detailed description of how these

26 Terra et Aqua | Number 132 | September 2013
calculations were made and the underlying
assumptions are set out in Chapter 4 of the
TNO report (De Jong et al., 2010).
The maximum values for these source levels
for the different activities are shown in
Figure 8. The figure shows that dredgers
produce the most sound as they move from
the borrow areas to the discharge area and
vice-versa.
During the sand dredging, comparable levels
were produced although the levels in most
third-octave bands were a few decibels lower.
During pumping ashore and rainbowing,
the maximum source level at frequencies
between 500 Hz and 10 kHz was comparable
with that of a vessel dredging sand but
substantially lower than at frequencies outside
this range.
The lowest source levels were measured
during the bottom discharging of sand at
frequencies above 1 kHz and at frequencies
INTERMEZZO: Metrics for underwater sound
The underwater sound recorded by hydrophones (‘underwater microphones’) is generally analysed and quantified
in terms of “levels” and expressed in decibels. Note that there are different “levels” to describe different aspects
of different types of sound and that underwater sound levels are not comparable to sound levels in air.
• The underwater sound measured by a hydrophone or received by a marine animal is here quantified in terms
of a Sound Pressure Level (SPL): ten times the logarithm to the base 10 of the quadratic sound pressure
averaged over a specified time interval and in a specified frequency bandwidth; unit: dB re 1 μPa2.
• For the total dose of sound received over a specified time interval a Sound Exposure Level (SEL) was used:
ten times the logarithm to the base 10 of the quadratic sound pressure integrated over a specified time
interval and in a specified frequency bandwidth; unit: dB re 1 μPa2s.
The sound radiated by individual ships and dredgers is quantified in terms of a “source level”. The Monopole
Source Level (MSL) expresses the mean square sound pressure at a distance r in a certain direction in the far field of
the source (where the sound pressure and particle velocity are in-phase and decrease inversely proportional to the
distance from the source), scaled back to a reference distance rref
= 1 m from the acoustic centre of the source.
This definition is appropriate for a monopole in free space, i.e., a point source that radiates sound continuously and
uniformly in all directions, in a homogeneous, isotropic medium, without absorption and free from boundaries.
In practice, the underwater environment in which sound is measured is complex, because of the effects of
reflections at the water surface and seabed and of variations of the speed of sound across the water depth.
Especially the reflections at the water surface often referred to as Lloyd’s Mirror effect, have a large impact on
the sound radiated by surface ships. When comparing published ship “source levels”, one must be alert for the
definition, the measurement conditions, experimental procedures and environmental parameters, as well as for
inconsistencies in reference distances, units and bandwidths, which are all given in various ways in the literature.
In this study, the MSL of the dredgers is estimated using a point-to-point propagation loss model, assuming a
source position at 4 m below the water surface. Because the actual depth of the acoustic centre will differ per
ship, this monopole source level was converted to a Dipole Source Level (DSL), which includes the contribution of
the surface image and is therefore independent of the assumed source depth. At high frequency, DSL exceeds
MSL by about 3 dB. At low frequency, MSL exceeds DSL by an amount that increases with decreasing frequency.
Source levels are here expressed in dB re 1 μPa2m2. (The levels are the same as the source levels in “dB re 1 μPa
at 1 m” which one often encounters in literature, though the levels can never be measured “at 1 m”).
The frequency content of sound is reported in standardised ‘third-octave’ bands (ISO 266: 1997). Single number
broadband levels express the energetic sum of the levels in the individual frequency bands. Where appropriate,
the reported levels are weighted for the sensitivity of marine animals to specific frequencies. The precautionary
M-weighting function (Southall et al. 2007) was used for “high-frequency cetaceans” for the harbour porpoise
Phocoena phocoena and the M-weighting function for “pinnipeds in water” for the harbour seal Phoca vitulina.
Figure 6. Above, procedures for measuring underwater
radiated sound of dredgers during various operations
(de Jong et al., 2010). For a reliable estimation of the
source level, measurements with one or more
hydrophones are carried out at several distances
(d1, d2, d3). MS = Measurement station.
Figure 7. Measurement platform
‘Mon Desir’ (Sleepvaart en
Baggerbedrijf J.J. Saarloos, Dordrecht).
Dredging and Transport
Rainbowing and Pumping ashore

Monitoring Programme for the Maasvlakte 2, Part III - The Effects of Underwater Sound 27
of 500 Hz and less during rainbowing. At a
frequency of approximately 100 Hz, the
source level for all phases of the dredging
cycle is comparable, with the exception of
rainbowing.
Dredgers pumping ashore are never anchored;
for rainbowing they sail on to the shore and
put the bow of the vessel on the underwater
slope and start pumping. The propulsion
keeps the dredger in place. When pumping
ashore they are coupled to the floating
pipeline and use dynamic positioning or their
bow thrusters and propulsion to stay on the
spot. In all probability, the production of
underwater sound by dredgers is primarily
caused by cavitation linked to the propellers
and bow thrusters.
The total amount of sound generated by the
TSHDs depended also on the way the dredge
masters operated the vessel – some used the
bow thruster all the time, some did it
incidentally.
UNDERWATER SOUND MODELLINGAND SOUND MAPSIn addition to the local information provided
by the ambient sound measurements at a field
position, acoustic modelling makes it possible
to calculate underwater ambient sound levels
in a wider area. TNO applied its in-house
AQUARIUS sound propagation model, an
advanced implementation of the theory
described in (Weston 1971, Weston 1976),
to produce sound maps.
To give an example, the maps in Figure 9
show a calculation result for the sound
generated by the activities of dredgers in the
Maasvlakte 2 area at two points in time on
29 September 2009. The main modelling
parameters are summarised in Table I. The
area measures 15 x 15 km. Background
sounds caused by, for example, wind and
waves or other shipping and harbour activities
are not included in the calculations for these
maps.
The yellow circles show the locations of the
various dredgers. The spread of the sound is
shown in circles because the vessels are
effectively considered to be point sources.
The resulting contours with the same sound
level can be seen as the worst-case scenario
Figure 9. Sound maps for two points in time on 29 September 2009 1 m above the bed (top panels) and 1 m below
the surface (bottom panels). The colours show the broadband sound pressure level (dB re 1 μPa2). The white triangle
shows the location of SESAME.
Figure 8. Maximum
dipole source level
spectra for the various
activities of dredgers
during the construction
of Maasvlakte 2.

because the calculations are based on a wind
speed of 0 m/s and a sediment sound speed
that is appropriate for coarse sand.
The sound maps in Figure 9 are snapshots
taken from movies showing the variations in
the soundscape at the two depths in question
on 29 September 2009 (0.00 to 24.00 hours).
The movies can be found on the DVD
accompanying the TNO report of Ainslie et al.(2012). The DVD also includes movies for
scenarios in which other shipping traffic is
included and in which no dredgers are active.
In combination with the information about
the shipping traffic (from an AIS), the
measured (maximum) source level of the
TSHDs during the various activities (Figure 8)
and a statistically averaged source level
spectrum (Wales and Heitmeyer, 2002) for
other ships in the area, the AQUARIUS model
was applied to calculate maps of the Sound
Exposure Level (SEL) accumulated over
24 hours.
SEL maps weighted in accordance with an
animal’s hearing sensitivity give an impression
of the total amount of sound to which an
animal is exposed when that animal is located
at a particular place in the area studied for a
period of 24 hours (in other words, if the
animal is not swimming). The impact of the
dredging and discharge activities on the
soundscape as experienced by fish, harbour
porpoises Phocoena phocoena and harbour
seals Phoca vitulina if they were to remain in
a single location for a period of 24 hours can
be read off by comparing the three left-hand
panels (regular shipping) with the three right-
hand panels (regular shipping + dredgers)
in Figure 10 and Figure 11. Figure 10 shows
the situation 1 m above the seafloor and
Figure 11 the situation at a depth of 1 m
below the surface.
28 Terra et Aqua | Number 132 | September 2013
Figure 10. Sound maps generated by regular shipping
(left) and regular shipping + dredgers (right) at a depth of
1 m above the seafloor. The figure shows the cumulative
broadband sound exposure level (dB Re 1 μPa2s) for a
period of 24 hours: non-weighted (top, representative for
fish), M-weighted for “high frequency cetaceans” (centre,
representative for harbour porpoise) and M-weighted for
“pinnipeds in water” (bottom, representative for seals).
* These parameters were selected in such a way that the sound was propagated relatively well, resulting in “worst case”
effect distances. At wind speeds exceeding approx. 4 m/s and lower sediment speeds, dissipation and absorption
prevent sound from travelling as far. The sediment sound speed of 1960 m/s is the velocity of the sound through the
seabed, which is different from through water only. The seabed consist (mainly) of sand in the North Sea near the
Maasvlakte (Ainslie, 2010).
Table I. Input data for calculations of sound maps
Parameter Value
Sediment sound speed 1960 m/s*
Wind speed 0 m/s*
Source levelselected on the basis of the best match with activity and speed
(data from Automatic Identification System)
Depth
1 m above the seabed, representative for animals located somewhere
in the water column, with the exception of the upper metres
(depending on the frequency) 1 m below the water surface,
representative for animals that swim close to the surface
Time29 September 2009 11.04
29 September 2009 12.02

Stationary marine mammals and fishBased on a comparison of the 24-hour SEL
maps (Figures 10 and 11) with the thresholds
shown in Table II at which fish, harbour
porpoises and harbour seals may suffer TTS,
an area can been calculated where these risk
thresholds are exceeded. Without the
contribution of dredgers, this area is, at 1 m
above the seafloor (worst case), 68 km2 for
small fish and 23 km2 for large fish (30% and
10% respectively of the area of 225 km2
studied). When the dredgers are present, these
areas are 97 km2 and 72 km2 respectively (43%
and 32%). The areas for seals and harbour
porpoises at 1 m above the seafloor are,
respectively, 10 km2 and 0.0 km2 (4% and 0%)
assuming regular shipping traffic only, and 72 km2
(seal) and 0.5 km2 (harbour porpoise) (32% and
0.2%) when the contribution of dredgers is
thought to result in a permanent increase in
the hearing threshold (PTS) have been taken
into account for harbour porpoises and seals.
There are no thresholds for fish relating to harm
after exposure to continuous sound generated
by, for example, shipping. The criteria proposed
by the US Fish Hydroacoustic Working Group
(FHWG) relate to pulse sounds generated by pile
driving (Oestman et al. 2009). There is a
distinction here between small fish (< 2 grams
fresh weight) and larger fish (> 2 grams fresh
weight). It is not clear to what extent these
values can be applied to continuous sound. The
threshold values for continuous sounds are often
slightly higher than for pulse sounds and so the
application of these criteria to continuous sound
would produce a “worst case” description of the
possible effects. An overview of the thresholds
used can be found in Table II.
Monitoring Programme for the Maasvlakte 2, Part III - The Effects of Underwater Sound 29
ASSESSMENT OF EFFECTS ONMARINE FAUNAUnderwater sounds can affect marine organisms
in different ways depending on the sound
pressure level and the frequency (see, for
example, Richardson et al., 1995; Kastelein et al., 2008). The literature generally distinguishes
between zones of responsiveness, ranging from
a zone in which the sound is heard but where
the animal does not respond, to a zone in which
severe physical harm or even death can occur.
In between, there are zones in which behaviour is
affected, with the animal swimming away from
the sound or being attracted to it, and a zone
where the animal’s hearing may be affected
temporarily or permanently (temporary hearing
threshold shift = TTS, and permanent hearing
threshold shift = PTS respectively).
In addition, there can be masking effects in
some animals. This is the situation in which the
frequency range, and level, of the non-natural
sound is comparable to the sounds produced
by the animals or their prey. This can be a
particular problem for animals that track their
prey using echolocation, the harbour porpoise
being one example. Since ship sounds are
relatively low-frequency sounds, there is no
overlap with the very high frequency of the
vocalisations used by harbour porpoises (in the
120 kHz range) and so this does not play a role.
Effect criteria at Maasvlakte 2In the study conducted by TNO for the Port
of Rotterdam Authority, the main criterion
adopted for affecting animals was the sound
exposure level (SEL), with the possibility of a
temporary rise in the hearing threshold (TTS).
The values derived by Southall et al. (2007) for
continuous sound, with the SEL being weighted
for the specific hearing sensitivity of the animals,
have been adopted for harbour porpoises and
seals. ‘M-weighting’ (Southall et al., 2007)
was used here. Alongside TTS, the values
Figure 11. Sound maps generated by regular shipping (left)
and regular shipping + dredgers (right) at a depth of 1 m
below the surface. The figure shows the cumulative
broadband sound exposure level (dB Re 1 μPa2s) for a
period of 24 hours: non-weighted (top, representative for
fish), M-weighted for “high frequency cetaceans” (centre,
representative for harbour porpoise) and M-weighted for
“pinnipeds in water” (bottom, representative for seals).

Table IV. Calculated SEL values for south-north transits (swimming speed = 6 km/h).
Shipping WeightingThreshold from
Table IISELTTS: dB re 1 μPa2s
Average(single transit)
SEL: dB re 1 μPa2s
24 hour exposure(several transits)
SEL + 9.8: dB re 1 μPa2s
S none n/a 172.4 182.2
S + D none n/a 176.8 186.6
S Mhf (harbour porpoise) 195 160.3 170.1
S + D Mhf (harbour porpoise) 195 170.7 180.5
S Mpw
(seal) 183 166.2 176.0
S + D Mpw
(seal) 183 172.6 182.4
S = regular shipping; S + D = regular shipping + dredgers
30 Terra et Aqua | Number 132 | September 2013
Table II. SEL thresholds in dB re 1 μPa2s for risk of PTS and TTS. Thresholds forharbour porpoise and harbour seal from Southall et al. (2007) and for fish fromOestman et al. (2009).
Species (or group)PTS risk
thresholdTTS risk
thresholdWeighting
harbour porpoise 215 195 Mhf
harbour seal 203 183 Mpw
fish > 2 g - 187 none
fish < 2 g - 183 none
Mhf = M-weighting for “high frequency cetaceans” (including harbour porpoise)
Mpw
= M-weighting for “pinnipeds in water” (seals).
Table III. Distance to dredgers at which the TTS threshold (see Table II) isexceeded for harbour porpoises, seals and fish at a depth of 16 m (worst case).
TTS threshold
Harbourporpoise195 dB
re 1 μPa2s
Seal183 dB
re 1 μPa2s
Fish > 2 g187 dB
re 1 μPa2s
Fish < 2 g183 dB
re 1 μPa2s
Distance todredging vessel
n/a 90 m 100 m 400 m
In all cases, the animal is moving at a speed of 1 m/s with respect to the dredging vessel.
Total exposure duration of 24 hours.
taken into account. These areas are much
smaller for animals located close to the surface.
Swimming fish and marine mammalsThe AQUARIUS model was also used to
calculate the levels of underwater sound to
which individual fish, harbour porpoises and
seals were exposed at various depths when
swimming at a relative speed of 1 m/s in a
straight line past a single TSHD engaged in
dredging sand. The calculations adopted the
following worst-case principles:
– A total exposure duration of 24 hours;
in reality, the hearing of an animal will
recover, at least in part, over the course of
those 24 hours but it is not known at what
level this will be the case;
– The highest source level found in the study
was used – the level generated by the
loudest dredging vessel sailing to and from
the borrow area and the discharge area
(dark blue line in Figure 8); it was assumed
that this was also the maximum source level
during sand dredging;
– Minimal propagation loss at higher
frequencies (wind speed 0 m/s an sediment
sound speed of 1960 m/s).
The results of the calculations are stated for
depths of 1 m and 16 m in Figure 12 and
Table III. For harbour porpoises, the TTS risk
thresholds are not exceeded at any distance
from the dredging vessel. TTS may occur in
seals if they swim past the vessel at a depth of
16 m and a distance of 90 m or less. In the
case of fish, the distances are 100 m or less
for larger fish (> 2 g) and 400 m or less for
small fish (< 2 g). The distances are shorter for
animals swimming closer to the sea surface
(Figure 5, top). They are 15 m for seals and
20 m for small fish. At this depth, the TTS risk
thresholds are not exceeded for harbour
porpoises and larger fish.
The 24-hour sound maps presented in
Figures 10 and 11 provide an accurate and
representative picture of the changes in the
soundscape during the construction of
Maasvlakte 2. However, on the basis of thesemaps, it is not possible to satisfactorily establish
the cumulative dose of sound to which the
animals are exposed when they are swimming
through the area. The results of the calculations
presented in Figure 12 and Table III do indeed
give an impression of the distance from a TSHD
at which animals may suffer TTS but it is not
possible to determine on that basis the
probability that this will indeed actually happen.
Actual exposure depends not only on the
position of the animal with respect to the
source and the propagation conditions but also

Figure 12. Relationship between distance to dredging vessel and sound exposure level (SEL) in dB re 1 μPa2s of a swimming animal with a relative speed with respect to
the ship of 1 m/s at a depth of 1 m and 16 m.
REFERENCES
Ainslie, M.A. (2010). Principles of Sonar PerformanceModelling. Springer – Praxis, Chichester, UK.
Ainslie, M.A., de Jong, C.A.F., Janmaat, J. andHeemskerk, H.J.M. (2012). Dredger noise duringMaasvlakte 2 construction: Noise maps and riskassessment. Commissioned by Port of Rotterdam.TNO report TNO 2012 R 10818.See www.noordzeeloket.nl
De Jong, C.A.F., Ainslie, M.A., Dreschler, J., Jansen, E.,Heemskerk, E. and Groen, W. (2010). Underwater noiseof Trailing Suction Hopper Dredgers at Maasvlakte 2:Analysis of source levels and Background noise.Commissioned by Port of Rotterdam. TNO reportTNO-DV 2010 C335. See www.noordzeeloket.nl
Dreschler, J., Ainslie, M.A. and de Groen, W.H.M.(2009). Measurements of underwater backgroundnoise Maasvlakte 2. Commissioned by Port ofRotterdam. TNO report TNO-DV 2009 C212.See www.noordzeeloket.nl
Kastelein, R.A., Verboom, W.C., Terhune, J.M.,Jennings, N. and Scholik, A. (2008). Towards a genericevaluation method for wind turbine park permitrequests: assessing the effects of construction,operation and decommissioning noise on marinemammals in the Dutch North Sea. SEAMARCOreport no. 1-2008. Commissioned by Deltares.
Lucke, K., Siebert, U., Lepper, P.A. and Blanchet,M-A. (2009). “Temporary shift in masked hearingthreshold in a harbor porpoise (Phocoena phocoena)after exposure to seismic airgun stimuli”. Journal of the Acoustical Society of America 125(6), pp 4060-4070.
Oestman, R., Buehler, D., Reyff, J.A. and Rodkin R.(2009). Technical Guidance for Assessment andMitigation of the Hydroacoustic Effects of PileDriving on Fish. Prepared for California Departmentof Transportation. http://www.dot.ca.gov/hq/env/bio/files/Guidance_Manual_2_09.pdf (last accessed25 June 2013).
Projectorganisatie Maasvlakte (2008). Monitorings-plan Aanleg Maasvlakte 2 (MV2 ConstructionMonitoring Plan, in Dutch). Official Site of MV2 (inDutch and English) http://www.maasvlakte2.com
Richardson, W.J., Greene Jr., C.R., Malme, C.I. andThomson, D.H. (1995). Marine Mammals and Noise.Academic Press. San Diego.
Robinson, S.P., Theobald, P.D., Hayman, G., Wang, L.S., Lepper, P.A., Humprey, V. and Mumford, S.(2011). UK: Marine Aggregate Levy SustainabilityFund. Report MEP F 09/P108 “Measurement ofunderwater noise arising from marine aggregatedredging operations”.
Southall, B.L., Bowles, A.E., Ellison, W.T., Finneran, J.J.,Gentry, R.L., Greene Jr., C.R., Kastak, D., Ketten, D.R., Miller, J.H., Nachtigall, P.E., Richardson, W.J.,Thomas, J.A. and Tyack, P.L. (2007). Marinemammal noise exposure criteria: initial scientificrecommendations, Aquatic Mammals 33(4),pp. 411-522.
Vellinga, T. (2007). Milieueffectrapport Aanleg enBestemming Maasvlakte 2. Nadere toelichting vragen en opmerkingen Commissie m.e.r.Havenbedrijf Rotterdam N.V.
Vertegaal, C.T.M., Heinis, F. and Goderie, C.R.J.(2007). Milieueffectrapport Aanleg Maasvlakte 2,Bijlage Natuur. Havenbedrijf Rotterdam NV.Wales, S.S. and Heitmeyer, R.M. (2002). “An ensemble source spectra model for merchant ship-radiated noise”. Journal of the Acoustical Society of America, 111, pp. 1211-1231.
Weston D.E. (1971). “Intensity-range relations inoceanographic acoustics”. Journal of Sound andVibration 18(2), pp. 271-287.
Weston D.E. (1976). “Propagation in water with uniform sound velocity but variable-depth lossy bottom”. Journal of Sound and Vibration 47(4), pp. 473-483.
on the animal’s behaviour over time. Marine
organisms are always on the move and so
calculations were also made to determine the
sound exposure level that harbour porpoises
and seals receive when swimming along a
straight north-south line through the area,
i.e., the aforementioned dynamic sound maps.
These calculations were not made for fish.
Fish generally swim more slowly than harbour
porpoises and seals. When estimating the
impact on fish, the worst-case approach can
be adopted based on the results of the
calculations for stationary animals (Figure 6
and Figure 7 and accompanying text). It is
assumed here that animals start to swim
at intervals of 15 minutes from 15 points
situated at intervals of 500 m on a line on the
southern edge of the area of 15 x 15 km
between kilometre 50 and kilometre 57,
proceeding northwards at a speed of 6 km/h.
This means that a single transit through the
area takes 2.5 hours. It was decided to adopt
straight lines because all the animals then
cover the same distance. The starting time for
the first 15 animals was midnight on 28/29
September, after which a new group of
15 animals started out every 15 min until the
end of the same day (midnight on 29/30
September 2009). The total sound exposure
level was calculated for all 1440 (24×4×15)
animal transits. The total sound exposure level
for an animal making the south-north crossing
of 15 km repeatedly without a break in a
consecutive period of 24 hours is estimated to
be 9.8 dB (=10log10 (24 h / 2.5 h) higher than
the exposure for single transits. Table IV
contains an overview of the mean results of
the exposure calculations. This shows that the
TTS risk thresholds are not exceeded for
swimming harbour porpoises and seals. In
fact, fewer than 0.1% of the individual seals
and even fewer of the harbour porpoises are
exposed to a sound level that exceeds the TTS
risk threshold.

32 Terra et Aqua | Number 132 | September 2013
CONCLUSIONS
Measurements 2008 and 2009In 2008, the measured background sound
was dominated by underwater sound from
shipping in virtually the entire frequency
range. Only in situations with little nearby
shipping and at frequencies of more than
10 kHz, the wind was the main determining
factor. Sound pressure levels for the
background sound measured in 2009 were,
in general, slightly higher than during the
measurements in 2008 and were closely
correlated with the distance from passing
dredgers to the SESAME underwater sound
monitoring station.
A new method has been developed for the
analysis of the measured radiated sound
associated with the various activities of the
individual dredgers. TSHDs produced most
sound when they were travelling to and from
the borrow and discharge areas at relatively
high speed. The next noisiest activity was sand
dredging.
During pumping ashore and rainbowing, the
source levels in the frequency range between
500 Hz and 10 kHz were comparable with the
level of vessels dredging sand, but significantly
lower at higher and lower frequencies. The
lowest sound levels were produced during the
bottom discharge of sand. It can be assumed
that the underwater sound generated by the
TSHDs in this area was mainly caused by cavitation from the propellers and bow thrusters.
Dredging sound and fish and marinemammalsThe EIA (Vertegaal et al., 2007; Vellinga,
2007) concluded – on the basis of now
outdated assumptions – that the behaviour of
fish and marine mammals can be influenced
up to a distance of a few hundred metres
from a dredging vessel. TNO adopted
different principles, criteria and calculation
methods for the final underwater sound
monitoring study. For the assessment of
effects on animals, the criteria recommended
by Southall et al. (2007) were adopted.
Because of the lack of relevant data to
develop thresholds for effects of underwater
sound on animal behaviour, it was decided to
focus on the risk that animals experience a
temporary hearing threshold shift (TTS). This
risk is associated with the total underwater
sound dose that animals are exposed to during
24 hours. TTS onset may occur when the
cumulative weighted sound exposure level
received by an animal exceeds a specified
threshold level. It is likely that this is a safe
choice, because there are indications that, at
sound levels below the TTS threshold, there
are no changes in behaviour in some marine
mammal species, including the seal (Southall
et al. 2007).
To establish a picture of the possible
maximum effect distances, calculations were
made to determine where, in the area of
15 x 15 km under study, thresholds for TTS
onset would be exceeded by sound from ships
in the area if an animal were to remain
stationary there for a period of 24 hours.
The worst case calculations for animals
spending 24 hours at 1 m above the seabed
– which is not realistic for marine mammals
because they have to breathe – produced the
following results:
• For fish, the size of the area affected
increases from 23 km2 to 72 km2 as a result
of dredging activities; the areas affected for
smaller fish are 68 km2 and 97 km2 for
regular shipping only and shipping including
dredging, respectively.
• The area in which seals can suffer TTS is
10 km2 in the scenario with regular shipping
traffic only and 72 km2 if there is also
dredging activity.
• For harbour porpoises, these areas are 0.0
and 0.5 km2 respectively.
The areas are much smaller for animals closer
to the surface. The threshold value for a
permanent hearing threshold shift (PTS) was
not exceeded in any of the cases studied or in
any of the species in question.
In order to obtain an impression of more
realistic effect contours, calculations were
made to determine the extent to which fish,
seals and harbour porpoises swimming (once)
past a vessel dredging sand at a relatively low
relative speed of 1 m/s (3.6 km/h) may suffer
TTS (or PTS). Seals swimming past a stationary
vessel dredging sand will only suffer TTS if
they are swimming 1 m above the seafloor at
a distance of 90 m or less from a dredging
TSHD; if they are swimming at 1 m below the
surface, this distance will be approximately
11 m. Harbour porpoises will not suffer TTS in
any of the scenarios studied.
The effect distances for fish are larger at 1 m
above the seabed: 100 m for fish weighing
more than 2 g and 400 m for smaller fish.
In the case of fish swimming closer to the
surface – at a depth of 1 m – the criterion is
not exceeded for fish weighing more than 2 g
and the distance will be 20 m for smaller fish.
The threshold value for a permanent threshold
shift (PTS) was not exceeded in any of the
cases studied or in any of the species in
question.
From this it can be concluded that the effect
contours around a dredger calculated in this
study are lower for harbour porpoises and
seals than the “few hundred metres”
mentioned in the EIA and that they are of the
same order of magnitude for fish.
In reality, marine mammals never stay at the
same location for a long time in natural
conditions; they are constantly swimming in
order to feed and to move from one place to
another.
Calculations were therefore made for the
situation in which seals and harbour porpoises
swam for a period of 24 hours at a realistic
speed of 6 km/h along north-south lines in
the area measuring 15 x 15 km (9.6 transits in
24 hours).
To establish a worst-case scenario (the sound
level is lower near the surface of the water)
calculations were only conducted for animals
swimming 1 m above the seafloor for a period
of 24 hours. In this rather unrealistic scenario
(marine mammals are unable to breathe
underwater), less than 0.1 % of the harbour
porpoises and seals are exposed to the risk of
experiencing a temporary hearing threshold
shift (TTS), even in the presence of dredging
activities representative for the construction of
Maasvlakte 2.