monkfish assessment summary for 2007 - nefmc
TRANSCRIPT

Northeast Fisheries Science Center Reference Document 07-13
Monkfish Assessment Summary for 2007
by Northeast Data Poor Stocks Working Group
August 2007
Recent Issues in This Series
06-21 A Laboratory Guide to the Identification of Marine Fish Eggs Collected on the Northeast Coast of the United States, 1977-1994, by PL Berrien and JD Sibunka. September 2006.
06-22 The Analytic Component to the Standardized Bycatch Reporting Methodology Omnibus Amendment: Sampling Design, and Estimation of Precision and Accuracy, by SE Wigley, PJ Rago, KA Sosebee, and DL Palka. September 2006.
06-23 Tenth Flatfish Biology Conference, November 29-30, 2006, Water’s Edge Resort, Westbrook, Connecticut, by R Mercaldo-Allen (chair), A Calabrese, DJ Danila, MS Dixon, A Jearld, TA Munroe, DJ Pacileo, C Powell, SJ Sutherland, steering committee members. October 2006.
06-24 Analysis of Virginia Fisheries Effort as a Component in the Development of a Fisheries Sampling Plan to Investigate the Causes of Sea Turtle Strandings, by CM Legault and KD Bisack. October 2006.
06-25 43rd Northeast Regional Stock Assessment Workshop (43rd SAW): 43rd SAW Assessment Report. November 2006.
06-26 Protection against Electric Shock in Laboratory Sea-Water Systems, by JM Crossen, PS Galtsoff, and JA Gibson. November 2006.
06-27 Accuracy and Precision Exercises Associated with 2005 TRAC Production Aging, by SJ Sutherland, NJ Munroe, V Silva, SE Pregracke, and JM Burnett. November 2006.
06-28 Precision Exercises Associated with SARC 42 Production Aging, by SJ Sutherland, NJ Shepherd, and SE Pregracke. December 2006.
07-01 Accuracy and Precision Exercises Associated with 2006 TRAC Production Aging, by SJ Sutherland, NL Shepherd, SE Pregracke, and JM Burnett. January 2007.
07-02 Methodologies of the NOAA National Marine Fisheries Service Aerial Survey Program for Right Whales (Eubalaena glacialis) in the Northeast U.S., 1998-2006, by TVN Cole, P Gerrior, and RL Merrick. January 2007.
07-03 44th Northeast Regional Stock Assessment Workshop (44th SAW). 44th SAW Assessment Summary Report. January 2007.
07-04 Estimated Bycatch of Loggerhead Sea Turtles (Caretta caretta) in U.S. Mid-Atlantic Scallop Trawl Gear, 2004-2005, and in Sea Scallop Dredge Gear, 2005, by KT Murray. February 2007.
07-05 Mortality and Serious Injury Determinations for Baleen Whale Stocks Along the United States Eastern Seaboard and Adjacent Canadian Maritimes, 2001-2005, by M Nelson, M Garron, RL Merrick, RM Pace III, and TVN Cole. February 2007.
07-06 The 2005 Assessment of Acadian Redfish, Sebastes fasciatus Storer, in the Gulf of Maine/Georges Bank region, by RK Mayo, JKT Brodziak, JM Burnett, ML Traver, and LA Col. April 2007.
07-07 Evaluation of a Modified Scallop Dredge’s Ability to Reduce the Likelihood of Damage to Loggerhead Sea Turtle Carcasses, by HO Milliken, L Belskis, W DuPaul, J Gearhart, H Haas, J Mitchell, R Smolowitz, and W Teas. April 2007.
07-08 Estimates of Cetacean and Pinniped Bycatch in the 2005 Northeast Sink Gillnet and Mid-Atlantic Coastal Gillnet Fisheries, by D Belden. May 2007.
07-09 The Analytic Component to the Standardized Bycatch Reporting Methodology Omnibus Amendment: Sampling Design, and Estimation of Precision and Accuracy (2nd Edition), by SE Wigley, PJ Rago, KA Sosebee, and DL Palka. May 2007
07-10 44th Northeast Regional Stock Assessment Workshop (44th SAW): 44th SAW assessment report. May 2007.
07-11 45th Northeast Regional Stock Assessment Workshop (45th SAW): 45th SAW Assessment Summary Report. July 2007.
07-12 Proposed Vessel Calibration Studies for NOAA Ship Henry B. Bigelow, by NEFSC Vessel Calibration Working Group. August 2007.

Northeast Fisheries Science Center Reference Document 07-13
U.S. DEPARTMENT OF COMMERCENational Oceanic and Atmospheric Administration
National Marine Fisheries ServiceNortheast Fisheries Science Center
Woods Hole, Massachusetts
August 2007
Monkfish Assessment Summary for 2007
by Northeast Data Poor Stocks Working Group
National Marine Fisheries Serv, Woods Hole Lab, 166 Water St, Woods Hole MA 02543-1026
Northeast Fisheries Science Center Reference Documents
This series is a secondary scientific series designed to assure the long-term documentation and to enable the timely transmission of research results by Center and/or non-Center researchers, where such results bear upon the research mission of the Center (see the outside back cover for the mission statement). These documents receive internal scientific review, and most receive copy editing. The National Marine Fisheries Service does not endorse any proprietary material, process, or product mentioned in these documents. All documents issued in this series since April 2001, and several documents issued prior to that date, have been copublished in both paper and electronic versions. To access the electronic version of a document in this series, go to http://www.nefsc.noaa.gov/nefsc/publications/. The electronic version is available in PDF format to permit printing of a paper copy directly from the Internet. If you do not have Internet access, or if a desired document is one of the pre-April 2001 documents available only in the paper version, you can obtain a paper copy by contacting the senior Center author of the desired document. Refer to the title page of the document for the senior Center author’s name and mailing address. If there is no Center author, or if there is corporate (i.e., non-individualized) authorship, then contact the Center’s Woods Hole Labora-tory Library (166 Water St., Woods Hole, MA 02543-1026).
This document’s publication history is as follows: manuscript submitted for review August 10, 2007; manuscript accepted through technical review August 14, 2007; manuscript accepted through policy review August 14, 2007; and final copy submitted for publication August 14, 2007. This document may be cited as:
Northeast Data Poor Stocks Working Group. 2007. Monkfish assessment summary for 2007. US Dept Commer, Northeast Fish Sci Cent Ref Doc. 07-13; 12 p. Avail-able from: National Marine Fisheries Service, 166 Water Street, Woods Hole MA 02543-1026.

Table of Contents
State of Stock ................................................................................................................................................ 1 Projections .................................................................................................................................................... 2 Catches.......................................................................................................................................................... 2 Stock Distribution and Identification............................................................................................................ 3 Data and Assessment .................................................................................................................................... 3 Biological Reference Points.......................................................................................................................... 4 Fishing Mortality .......................................................................................................................................... 4 Recruitment................................................................................................................................................... 5 Stock Biomass............................................................................................................................................... 5 Special Comments......................................................................................................................................... 5 Sources of Information ................................................................................................................................. 6
Tables
Table 1. Catch and status table: monkfish..............................................................................................3
Figures
Figure 1. Trends in NEFSC fall survey biomass indices of monkfish relative to existing biomass overfishing definitions, in the northern and southern management regions.............................7
Figure 2. Trends in total biomass and fishing mortality rate, from the assessment model, along with new biological reference points for monkfish from the 2007 assessment................................8
Figure 3. Recruitment indices for monkfish from winter, spring, summer, and autumn NEFSC surveys for the northern and southern management regions .................................................................9
Figure 4. Body length of monkfish over time in the NEFSC autumn bottom trawl survey ..................10 Figure 5. Projection of total biomass to 2009 based on the Statistical Catch-At-Length model in the
northern and southern management regions...........................................................................11 Figure 6. Monkfish commercial fishery landings, by management region and total, 1964-2006 .........11 Figure 7. Monkfish commercial fishery landings by major gear type, northern and southern
management regions...............................................................................................................12
Data Poor Stocks Working Group: Monkfish iii

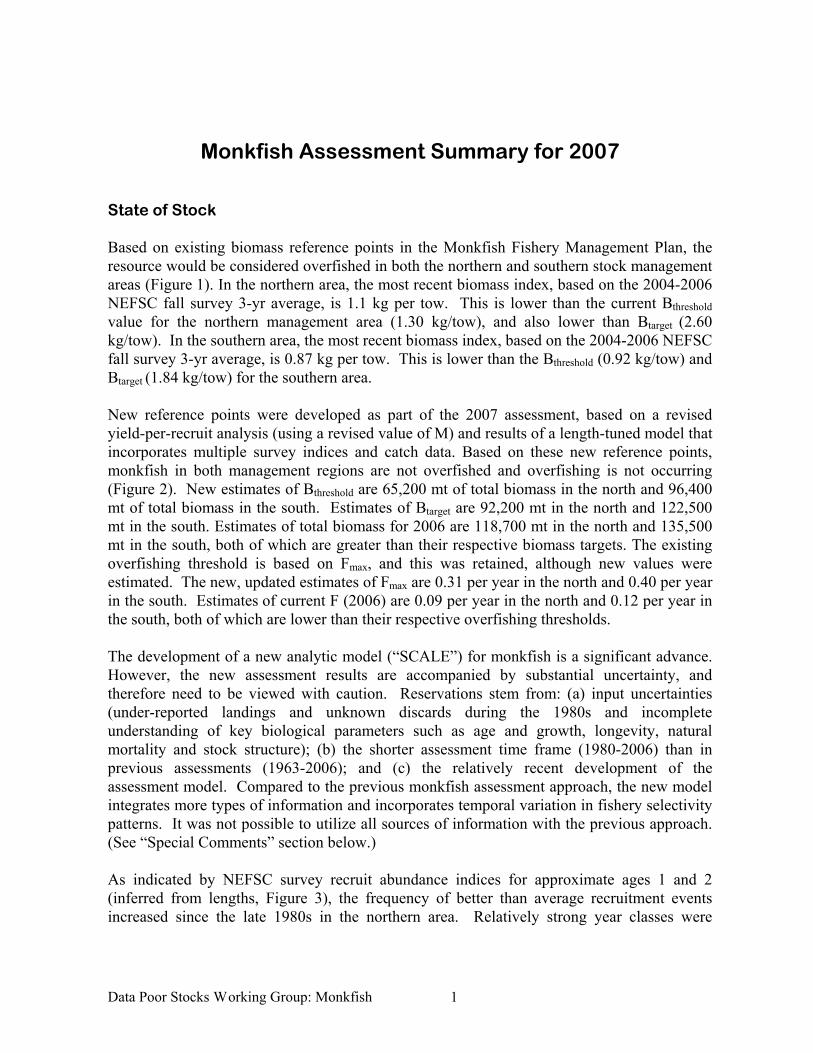
Monkfish Assessment Summary for 2007 State of Stock Based on existing biomass reference points in the Monkfish Fishery Management Plan, the resource would be considered overfished in both the northern and southern stock management areas (Figure 1). In the northern area, the most recent biomass index, based on the 2004-2006 NEFSC fall survey 3-yr average, is 1.1 kg per tow. This is lower than the current Bthreshold value for the northern management area (1.30 kg/tow), and also lower than Btarget (2.60 kg/tow). In the southern area, the most recent biomass index, based on the 2004-2006 NEFSC fall survey 3-yr average, is 0.87 kg per tow. This is lower than the Bthreshold (0.92 kg/tow) and Btarget (1.84 kg/tow) for the southern area. New reference points were developed as part of the 2007 assessment, based on a revised yield-per-recruit analysis (using a revised value of M) and results of a length-tuned model that incorporates multiple survey indices and catch data. Based on these new reference points, monkfish in both management regions are not overfished and overfishing is not occurring (Figure 2). New estimates of Bthreshold are 65,200 mt of total biomass in the north and 96,400 mt of total biomass in the south. Estimates of Btarget are 92,200 mt in the north and 122,500 mt in the south. Estimates of total biomass for 2006 are 118,700 mt in the north and 135,500 mt in the south, both of which are greater than their respective biomass targets. The existing overfishing threshold is based on Fmax, and this was retained, although new values were estimated. The new, updated estimates of Fmax are 0.31 per year in the north and 0.40 per year in the south. Estimates of current F (2006) are 0.09 per year in the north and 0.12 per year in the south, both of which are lower than their respective overfishing thresholds. The development of a new analytic model (“SCALE”) for monkfish is a significant advance. However, the new assessment results are accompanied by substantial uncertainty, and therefore need to be viewed with caution. Reservations stem from: (a) input uncertainties (under-reported landings and unknown discards during the 1980s and incomplete understanding of key biological parameters such as age and growth, longevity, natural mortality and stock structure); (b) the shorter assessment time frame (1980-2006) than in previous assessments (1963-2006); and (c) the relatively recent development of the assessment model. Compared to the previous monkfish assessment approach, the new model integrates more types of information and incorporates temporal variation in fishery selectivity patterns. It was not possible to utilize all sources of information with the previous approach. (See “Special Comments” section below.) As indicated by NEFSC survey recruit abundance indices for approximate ages 1 and 2 (inferred from lengths, Figure 3), the frequency of better than average recruitment events increased since the late 1980s in the northern area. Relatively strong year classes were
Data Poor Stocks Working Group: Monkfish 1

produced in 1993, 1999 and 2001. In the south, recruitment has varied without trend during 1963-2006; however, a relatively strong 2001 year class is apparent in the south (Figure 3). The median size of monkfish in both regions declined as landings increased in the 1980s (Figure 4). Maximum sizes have also declined, from about 110 cm during the 1960s to 90 cm since the early 1990s in the north, and from about 100 cm in the 1960s to 75 cm since the 1990s in the south. Projections The SCALE (Statistical Catch-at-Length) assessment model was used to evaluate the impacts of TACs proposed in Framework 4 (5,000 mt in the north and 5,100 mt in the south), assuming long-term average recruitment. The results indicate that total biomass in both regions would continue to increase through 2009 and remain above Btarget (Figure 5). These results did not incorporate any uncertainty associated with the stock size estimates for 2006. Further work is necessary to develop a complete forecasting approach. Catches Reported total landings (live weight) increased from an annual average of 2,500 mt in the 1970s to 8,700 mt in the 1980s, 23,000 mt in the 1990s, and 22,000 mt during 2000-2005. Total landings in 2006 declined to 14,500 mt, the lowest level since 1990, due to management regulations (Figure 6). Landings in the early part of the time series are thought to be under-reported. The accuracy of landings data has likely improved with mandatory reporting, which began in 1994. In the northern area, landings peaked in 2003 (15,000 mt), and have since declined to 6,700 mt in 2006. In the southern area, landings peaked in 1998 (19,300 mt), and declined to 7,800 mt in 2006. During 1990-1999, 53% of USA monkfish landings were taken in otter trawls, 28% in sea scallop dredges, and 18% in gillnets. During 2000-2006, 53% of USA monkfish landings were taken in otter trawls, 7% in sea scallop dredges, 35% in gillnets, and 6% other gear. While trawl gear accounts for most of the landings in the northern area (75% during 2000-2006, Figure 7), gillnets now account for the majority of the landings in the southern area (54% during 2000-2006, Figure 7). Estimated total discards of monkfish have ranged between 1,600 mt (1992) and 7,500 mt (2001) per year, with a long-term discard/kept ratio of 0.15 (1989-2006, north and south combined). Discard rates have been highest in the sea scallop dredge fisheries in the southern area, particularly since 2000, and lowest in the gillnet fisheries. Discard ratios and discard levels (mt) increased in the southern area after 2000 (overall discard/kept ratio for 2001-2006 =0.34).
Data Poor Stocks Working Group: Monkfish 2

Table 1. Catch and status table (weights in '000 mt): monkfish.
Year 1997 1998 1999 2000 2001 2002 2003 2004 2005 2006 Max1 Min1 Mean1
USA Commercial landings Northern area 9.7 7.3 9.1 10.7 13.3 14.0 15.0 13.2 10.3 6.7 15.0 3.2 8.0 Southern area 18.5 19.3 16.1 10.1 10.0 8.9 11.1 8.0 8.8 7.8 19.3 3.7 9.4 Total 28.2 26.6 25.2 20.9 23.3 22.9 26.1 21.2 19.1 14.5 28.2 7.3 17.4USA Commercial discards Northern area 1.3 0.9 0.8 1.0 2.9 1.4 1.3 0.9 0.9 0.5 2.9 0.4 1.1 Southern area 1.2 1.1 1.2 1.5 4.6 3.4 3.2 2.7 2.5 1.8 4.6 0.6 2.1 Total 2.5 2.0 2.0 2.5 7.5 4.8 4.5 3.6 3.4 2.3 7.5 1.6 3.Foreign landings2 0.2 0.2 0.2 0.2 0.1 0.3 0.3 - - - 0.3 0.1 0.5Total Catch 30.9 28.8 27.4 23.6 30.9 28.0 30.9 24.7 22.5 16.7 31.0 16.7 25.5
Northern area Biomass index3 0.67 0.97 0.83 2.50 2.07 2.32 2.72 0.63 1.62 1.04 5.6 0.6 2.1
Southern area Biomass index3 0.59 0.50 0.30 0.48 0.71 1.32 0.83 0.97 0.80 0.83 7.0 0.3 1.5
Northern area Total Biomass4 65.3 69.1 78.3 88.3 97.9 103.0 108.3 110.1 112.9 118.7 65.2 127.3 92.2 Fishing Mortality rate (F)4 0.32 0.20 0.20 0.22 0.30 0.30 0.32 0.23 0.16 0.09 0.43 0.05 0.19
Southern area Total Biomass4 100.2 98.4 96.4 99.8 107.4 112.6 120.1 124.3 130.0 135.5 96.4 152.7 122.6 Fishing Mortality rate (F)4 0.37 0.36 0.29 0.19 0.23 0.19 0.20 0.15 0.15 0.12 0.37 0.04 0.16
1 Landings data based on 1980-2006 . Commercial fishery discard estimates not available before 1989; discard means from 1989-2006.Biomass index time span is 1963-2006. Total biomass and F time span is 1980-2006.
2 Foreign landings are for NAFO Areas 5 and 6. Foreign landings not available for 2004-2006.3 NEFSC fall survey, stratified mean weight (kg) per tow.4 Annual estimates from SCALE model ('000 mt for biomass).
2
Stock Distribution and Identification The monkfish resource in US waters is distributed from the Gulf of Maine through Cape Hatteras, NC. Current management practice divides US waters into two regions north and south of Georges Bank to accommodate differences in fishery practices; however, there is no strong biological evidence (growth, maturity, and genetic information) of separate stocks. Data and Assessment Monkfish were last assessed at SAW-40 in November 2004. Data used in the current assessment include NEFSC research survey data, data from cooperative monkfish surveys conducted in 2001 and 2004, and commercial fishery data from (a) vessel trip reports, (b) dealer landings records, and (c) on-board fishery observers. The assessment assumed a natural
Data Poor Stocks Working Group: Monkfish 3

mortality rate (M) = 0.3; previous assessments used M=0.2. Fishing mortality rates were estimated from survey catch-per-tow-at-age from NEFSC research surveys, and using several length-based approaches (catch-survey analysis, statistical catch-at-length analysis (SCALE), length-based mortality, stage-based mortality). Although these methods were useful for exploratory data analysis, the only method deemed adequate for assessment was the SCALE model. The model could only be applied to the period from 1980 to the present, because the early (pre-1980) commercial catch data were too uncertain. Biological Reference Points Existing biological reference points (BRPs) for monkfish are from Framework 2 of the Fishery Management Plan for Monkfish (2003). For both management areas, the existing Btarget was established as the median of the 3-year moving average of NEFSC fall survey biomass indices during 1965-1981. Fthreshold was set equal to Fmax (F=0.2 per year). The Framework 2 overfishing definition did not include an Ftarget reference point. New biomass reference points were developed as part of the new assessment, based on an updated age-based yield-per-recruit analysis, and results of the SCALE model, both of which assumed M=0.3 (previous assessments used M=0.2). The new Btarget is the average of total biomass during the 1980 – 2006 period, estimated as 92,200 mt in the north and 122,500 mt in the south. The new Bthreshold is defined as the lowest value of total biomass in the assessment time series (1980 - 2006) from which the stock subsequently increased (termed “BLoss”), estimated as 65,200 mt in the north and 96,400 mt in the south. The existing overfishing threshold is based on Fmax, and this was retained in the new assessment, although the value was updated. The revised estimates of Fmax are 0.31 per year in the north and 0.40 per year in the south. The recommended Ftarget is F at 40% of maximum spawning potential (F40%), estimated to be 0.18 per year in the north and 0.31 per year in the south. F40% was chosen to ensure some adequacy in spawning potential and because it has been used in managing other fisheries. The differences between areas in the F40% estimates are due to different selectivity patterns of the predominant gears in the two regions (otter trawls in the north, large mesh gillnets in the south). Monkfish is a data-poor species, and there are significant uncertainties associated with the assessment results. This should be considered when developing management measures. Fishing Mortality Previous assessment reviews (SAWs -31, -34 and -40) concluded that instantaneous fishing mortality rates (F) estimated from NEFSC research survey length frequency distributions were not sufficiently reliable to allow evaluation of current F with respect to reference points.
Data Poor Stocks Working Group: Monkfish 4

In the current assessment, fishing mortality in 2006, estimated using the SCALE assessment model (assuming M=0.3 per year), was F=0.09 per year in the north, and F=0.12 per year in the south. Fishing mortality has declined in both regions since 2003 (Figure 2). Recruitment Size-based indices of abundance indicate strong recruitment in the northern area in 1993, 1999 and 2001 (Figure 3). The strong recruitment in 1999 and 2001 led to rebuilding of stock biomass in the north. Recruitment has been stable in the south, with a strong year class produced in 2001 (Figure 3). Stock Biomass Total biomass in the northern region declined steadily from the early 1980s through the early 1990s, remained at a relatively low level during the 1990s, and then increased after 1999, reflecting strong recruitment and management efforts from 2000 onwards (Figure 2). Biomass in the north was estimated to be 118,700 mt in 2006. In the south, total biomass increased until the late 1980s and then declined during the 1990s. Since 2000, biomass has increased in the south, and was estimated to be 135,500 mt in 2006 (Figure 2). Median body size of monkfish, in fall NEFSC bottom trawl surveys of the northern area, declined rapidly during the 1980s, but since 1990, has stabilized at a relatively small body size (20-40 cm recently, compared to 60-80 cm before 1982) (Figure 4). Maximum size has also declined, from approximately 100-120 cm to 80-100 cm. In the southern area, median size has been more variable, but shows a gradual decline over time (Figure 4), and maximum size has declined from around 100 cm before 1982 to 60-80 cm since 1990. Special Comments This assessment is uncertain for a number of reasons, including poor quality of some data and uncertainties in life history parameters. The assessment hinges critically on assumptions regarding growth, longevity, and natural mortality of monkfish, all of which are poorly known. In addition, commercial catches prior to 1993 are not well characterized. Model results are sensitive to the assumed value of natural mortality, revised in this assessment from 0.2 to 0.3 per year. This decision was based on the observed longevity of male and female fish in the resource; however, the actual lifespan of monkfish may be greater than that which has been thus far observed. Uncertainties in key life history parameters and historical catches are unlikely to be resolved in the short term. In developing management alternatives, it should be recognized that monkfish is a “data-poor” species and this assessment has significant uncertainty. Landings on the order of 5,000 mt in
Data Poor Stocks Working Group: Monkfish 5

Data Poor Stocks Working Group: Monkfish 6
each management area (roughly the proposed TACs in FMP Framework Adjustment 4) are unlikely to result in a change in stock status, and should allow monkfish resources in both regions to increase. The SCALE model used for assessment could only be applied to the period from 1980 to the present. Monkfish biomass indices in NEFSC surveys were approximately twice as high prior to 1980 than after this time. As such, the productivity of the resource may be higher than reflected in this assessment and thus, the possibility of attaining higher biomass levels in the future should not be discounted. Reconsideration of the newly proposed biomass reference points might thus be justified in the future. Sources of Information Chikarmane HM., Kuzirian AM, Kozlowksi R, Kuzirian M, Lee M, Lee T. 2000. Population
genetic structure of the goosefish, Lophius americanus. Biol Bull. 199:227-228. Northeast Fisheries Science Center (NEFSC). 1997. Report of the 23rd Northeast Regional
Stock Assessment Workshop (23rd SAW). NEFSC Ref Doc. 97-05; 191 p. NEFSC. 2000. Report of the 31st Northeast Regional Stock Assessment Workshop (31st
SAW). NEFSC Ref Doc. 00-15; 400 p. NEFSC. 2002. Report of the 34th Northeast Regional Stock Assessment Workshop (34th
SAW): SARC Consensus Summary of Assessments. NEFSC Ref Doc. 02-06; 346 p. NEFSC. 2005. 40th Northeast Regional Stock Assessment Workshop (40th SAW)
Assessment Report. NEFSC Ref Doc. 05-04; 146 p.

Figure 1. Trends in NEFSC fall survey biomass indices (3-year moving average) of monkfish relative to existing biomass overfishing definitions, in the northern and southern management regions.
North
0.000
1.000
2.000
3.000
4.000
5.000
6.000
1965 1969 1973 1977 1981 1985 1989 1993 1997 2001 2005
3-yr
ave
rage
kg/
tow
Fall Survey 3-yr avgBthresholdBtarget
South
0.000
1.000
2.000
3.000
4.000
5.000
6.000
7.000
1965 1969 1973 1977 1981 1985 1989 1993 1997 2001 2005
3-yr
ave
rage
kg/
tow
Fall Survey 3-yr avgBthresholdBtarget
Data Poor Stocks Working Group: Monkfish 7

Figu
re 2
. Tr
ends
in to
tal b
iom
ass
and
fishi
ng m
orta
lity
rate
(F)
, fro
m th
e as
sess
men
t mod
el (
SCA
LE),
alon
g w
ith n
ew (
prop
osed
) bi
olog
ical
re
fere
nce
poin
ts fo
r mon
kfis
h fr
om th
e 20
07 a
sses
smen
t. (A
) nor
ther
n m
anag
emen
t reg
ion,
(B) s
outh
ern
man
agem
ent r
egio
n.
A. N
orth
No
rthe
rn A
rea
0255075100
125
150
175 19
8019
8519
9019
9520
0020
05
Biomass (kmt)
Tota
l BB
targ
etB
thre
shol
d
0
0.1
0.2
0.3
0.4
0.5 19
8019
8219
8419
8619
8819
9019
9219
9419
9619
9820
0020
0220
0420
06
F
FFt
hres
hold
Ftar
get
Nor
th
B. S
outh
So
uthe
rn A
rea
0255075100
125
150
175 19
8019
8519
9019
9520
0020
05
Biomass (kmt)
Tota
l BB
targ
etB
thre
shol
d0
0.1
0.2
0.3
0.4
0.5 19
8019
8219
8419
8619
8819
9019
9219
9419
9619
9820
0020
0220
0420
06
F
FFt
hres
hold
Ftar
get
Sou
th
Data Poor Stocks Working Group: Monkfish 8

Figure 3. Recruitment indices (stratified mean number per tow) for monkfish from winter, spring, summer (shrimp, scallop), and autumn NEFSC surveys for the northern and southern management regions.
0.0
0.1
0.2
0.3
0.4
0.5
0.6
0.7
0.8
1962 1967 1972 1977 1982 1987 1992 1997 2002 2007
Yearclass
Abu
ndan
ce (#
/tow
)
0.00.20.40.60.81.01.21.41.61.82.0
Shrim
p su
rvey
#/to
w
fall spring shrimp survey
North
0.0
0.1
0.2
0.3
0.4
0.5
0.6
0.7
0.8
1962 1967 1972 1977 1982 1987 1992 1997 2002 2007
Yearclass
Abun
danc
e (#
/tow
)
0.0
0.5
1.0
1.5
2.0
2.5S
callo
p su
rvey
#/to
wfall spring winter scallop survey
South
Data Poor Stocks Working Group: Monkfish 9

Figure 4. Body length of monkfish (minimum, median, maximum) over time in the NEFSC autumn bottom trawl survey. (A) northern management region and (B) southern management region.
A.
Year
1960 1965 1970 1975 1980 1985 1990 1995 2000 2005
Len
gth
(cm
)
0
20
40
60
80
100
120
140
B.
Year1960 1965 1970 1975 1980 1985 1990 1995 2000 2005
Len
gth
(cm
)
0
20
40
60
80
100
120
Data Poor Stocks Working Group: Monkfish 10
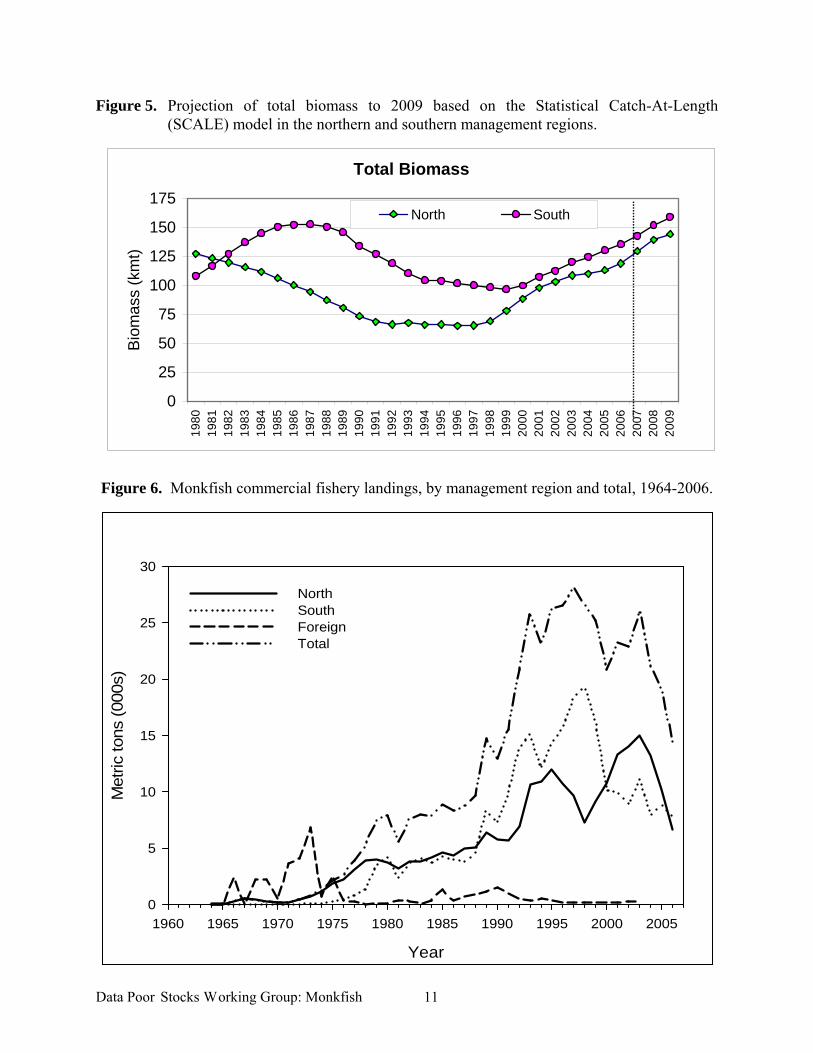
Figure 5. Projection of total biomass to 2009 based on the Statistical Catch-At-Length (SCALE) model in the northern and southern management regions.
Total Biomass
0
25
50
75
100
125
150
17519
8019
8119
8219
8319
8419
8519
8619
8719
8819
8919
9019
9119
9219
9319
9419
9519
9619
9719
9819
9920
0020
0120
0220
0320
0420
0520
0620
0720
0820
09
Bio
mas
s (k
mt)
North South
Figure 6. Monkfish commercial fishery landings, by management region and total, 1964-2006.
Year
1960 1965 1970 1975 1980 1985 1990 1995 2000 2005
Met
ric to
ns (0
00s)
0
5
10
15
20
25
30
North South ForeignTotal
Data Poor Stocks Working Group: Monkfish 11

Figure 7. Monkfish commercial fishery landings by major gear type, northern and southern management regions.
North: Commercial
0
2000
4000
6000
8000
10000
12000
1400019
64
1966
1968
1970
1972
1974
1976
1978
1980
1982
1984
1986
1988
1990
1992
1994
1996
1998
2000
2002
2004
2006
Year
Land
ings
(liv
e w
eigh
t, m
t)
Trawl Dredge Gillnet
South: Commercial
0
2000
4000
6000
8000
10000
12000
14000
1964
1966
1968
1970
1972
1974
1976
1978
1980
1982
1984
1986
1988
1990
1992
1994
1996
1998
2000
2002
2004
2006
Year
Land
ings
(liv
e w
eigh
t, m
t)
Trawl Dredge Gillnet
Data Poor Stocks Working Group: Monkfish 12

Procedures for Issuing Manuscriptsin the
Northeast Fisheries Science Center Reference Document (CRD) Series
Clearance All manuscripts submitted for issuance as CRDs must have cleared the NEFSC’s manuscript/abstract/webpage review process. If any author is not a federal employee, he/she will be required to sign an “NEFSC Release-of-Copyright Form.” If your manuscript includes material from another work which has been copyrighted, then you will need to work with the NEFSC’s Editorial Office to arrange for permission to use that material by securing release signatures on the “NEFSC Use-of-Copyrighted-Work Permission Form.” For more information, NEFSC authors should see the NEFSC’s online publication policy manual, “Manu-script/abstract/webpage preparation, review, and dis-semination: NEFSC author’s guide to policy, process, and procedure,” located in the Publications/Manuscript Review section of the NEFSC intranet page.
Organization Manuscripts must have an abstract and table of contents, and (if applicable) lists of figures and tables. As much as possible, use traditional scientific manu-script organization for sections: “Introduction,” “Study Area” and/or ”Experimental Apparatus,” “Methods,” “Results,” “Discussion,” “Conclusions,” “Acknowl-edgments,” and “Literature/References Cited.”
Style The CRD series is obligated to conform with the style contained in the current edition of the United States Government Printing Office Style Manual. That style manual is silent on many aspects of scientific manuscripts. The CRD series relies more on the CSE Style Manual. Manuscripts should be prepared to conform with these style manuals. The CRD series uses the American Fisheries Soci-ety’s guides to names of fishes, mollusks, and decapod
crustaceans, the Society for Marine Mammalogy’s guide to names of marine mammals, the Biosciences Information Service’s guide to serial title abbreviations, and the ISO’s (International Standardization Organiza-tion) guide to statistical terms. For in-text citation, use the name-date system. A special effort should be made to ensure that all neces-sary bibliographic information is included in the list of cited works. Personal communications must include date, full name, and full mailing address of the con-tact.
Preparation Once your document has cleared the review pro-cess, the Editorial Office will contact you with publica-tion needs – for example, revised text (if necessary) and separate digital figures and tables if they are embedded in the document. Materials may be submitted to the Editorial Office as files on zip disks or CDs, email attachments, or intranet downloads. Text files should be in Microsoft Word, tables may be in Word or Excel, and graphics files may be in a variety of formats (JPG, GIF, Excel, PowerPoint, etc.).
Production and Distribution The Editorial Office will perform a copy-edit of the document and may request further revisions. The Editorial Office will develop the inside and outside front covers, the inside and outside back covers, and the title and bibliographic control pages of the docu-ment. Once both the PDF (print) and Web versions of the CRD are ready, the Editorial Office will contact you to review both versions and submit corrections or changes before the document is posted online. A number of organizations and individuals in the Northeast Region will be notified by e-mail of the availability of the document online.

Research Communications BranchNortheast Fisheries Science Center
National Marine Fisheries Service, NOAA166 Water St.
Woods Hole, MA 02543-1026
Publications and Reportsof the
Northeast Fisheries Science CenterThe mission of NOAA’s National Marine Fisheries Service (NMFS) is “stewardship of living marine resources for the benefit of the nation through their science-based conservation and management and promotion of the health of their environment.” As the research arm of the NMFS’s Northeast Region, the Northeast Fisheries Science Center (NEFSC) supports the NMFS mission by “conducting ecosystem-based research and assess-ments of living marine resources, with a focus on the Northeast Shelf, to promote the recovery and long-term sustainability of these resources and to generate social and economic opportunities and benefits from their use.” Results of NEFSC research are largely reported in primary scientific media (e.g., anonymously-peer-reviewed scientific journals). However, to assist itself in providing data, information, and advice to its constituents, the NEFSC occasionally releases its results in its own media. Currently, there are three such media:
NOAA Technical Memorandum NMFS-NE -- This series is issued irregularly. The series typically includes: data reports of long-term field or lab studies of important species or habitats; synthesis reports for important species or habitats; annual reports of overall assessment or monitoring programs; manuals describing program-wide surveying or experimental techniques; literature surveys of important species or habitat topics; proceedings and collected papers of scientific meetings; and indexed and/or annotated bibliographies. All issues receive internal scientific review and most issues receive technical and copy editing.
Northeast Fisheries Science Center Reference Document -- This series is issued irregularly. The series typically includes: data reports on field and lab studies; progress reports on experiments, monitoring, and assessments; background papers for, collected abstracts of, and/or summary reports of scientific meetings; and simple bibliographies. Issues receive internal scientific review and most issues receive copy editing.
Resource Survey Report (formerly Fishermen’s Report) -- This information report is a regularly-issued, quick-turnaround report on the distribution and relative abundance of selected living marine resources as derived from each of the NEFSC’s periodic research ves-sel surveys of the Northeast’s continental shelf. This report undergoes internal review, but receives no technical or copy editing.
TO OBTAIN A COPY of a NOAA Technical Memorandum NMFS-NE or a Northeast Fisheries Science Center Reference Document, either contact the NEFSC Editorial Office (166 Water St., Woods Hole, MA 02543-1026; 508-495-2350) or consult the NEFSC webpage on “Reports and Publications” (http://www.nefsc.noaa.gov/nefsc/publications/). To access Resource Survey Report, consult the Ecosystem Surveys Branch webpage (http://www.nefsc.noaa.gov/femad/ecosurvey/mainpage/).
ANY uSe OF TRADe OR BRAND NAMeS IN ANY NeFSC PuBlICATION OR RePORT DOeS NOT IMPlY eNDORSe-MeNT.
MEDIA MAIL