monsanto company · monsanto company 800 north lindbergh blvd st. louis, missouri 63167 release...
TRANSCRIPT

Monsanto Company
800 North Lindbergh Blvd
St. Louis, Missouri 63167
Release Immediately
Contact Media: Christi Dixon (314-694-1092)
Analysts: Laura Meyer (314-694-8148)
MONSANTO COMPANY OPTIMISTIC ON CLOSURE OF MERGER WITH BAYER; FIRST HALF AS-REPORTED
EPS REMAINS AHEAD OF PRIOR YEAR WITH ANNOUNCEMENT OF SECOND QUARTER FINANCIAL
RESULTS
• Achieves as-reported second quarter EPS of $3.27 and $3.22 in ongoing quarterly EPS
• First half as-reported EPS tracks ahead of the prior year from benefits of newest soybean technologies,
lower taxes and improved glyphosate pricing
• INTACTA RR2 PROTM soybeans reach 60 million acres in FY18, as expected
• Roundup Ready Xtend® Crop System expected to reach nearly 50 million acres, with Roundup Ready 2
Xtend® soybeans trending to 40 million acres and Bollgard® II XtendFlex® cotton to 8 million acres; initial
estimates are for 60 million acres in FY19
• Expects to hold genetic share for the full year in corn despite lower volumes and pricing in the quarter
• Gross profit in Agricultural Productivity segment up by more than 30 percent from improved glyphosate
pricing
ST. LOUIS (April 5, 2018) - At the halfway point of its fiscal year, Monsanto Company (NYSE: MON) today
highlighted progress related to its FY18 business objectives, including the expected acres of INTACTA RR2 PROTM
soybeans in South America and Roundup Ready 2 Xtend® soybeans in the U.S., coupled with the benefits from
improved glyphosate pricing. The company also noted that results for its second quarter of fiscal year 2018
represented a solid performance, with as-reported earnings per share of $3.27 and $3.22 in ongoing earnings per
share.
With Bayer leading the regulatory process for the pending merger, the companies continue to cooperate with
regulators and have seen solid progress. The number of anti-trust approvals continues to increase, most notably
from the European Commission, China and Brazil, and, as a part of this process, Bayer has announced several
planned divestitures. With these actions, Monsanto continues to be confident in the companies’ collective ability to
secure the required approvals within the second calendar quarter of 2018 and in the time contemplated by the
agreement.

Second Quarter Six Months
($ in millions, except per share amounts) 2018 2017 2018 2017
Net Sales by Segment Corn seed and traits $ 2,721 $ 2,902 $ 3,508 $ 3,851
Soybean seed and traits 912 862 1,640 1,462
Cotton seed and traits 123 108 243 224
Vegetable seeds 198 193 312 324
All other crops seeds and traits 134 121 155 173
TOTAL Seeds and Genomics $ 4,088 $ 4,186 $ 5,858 $ 6,034 Agricultural productivity $ 931 $ 888 $ 1,819 $ 1,690
TOTAL Agricultural Productivity $ 931 $ 888 $ 1,819 $ 1,690 TOTAL Net Sales $ 5,019 $ 5,074 $ 7,677 $ 7,724
Gross Profit $ 2,966 $ 2,952 $ 4,278 $ 4,211 Operating Expenses $ 1,070 $ 1,088 $ 2,140 $ 2,100
Interest Expense – Net $ 81 $ 84 $ 190 $ 202
Other (Income) Expense– Net $ (24 ) $ (88 ) $ (121 ) $ (45 )
Net Income Attributable to Monsanto Company $ 1,459 $ 1,368 $ 1,628 $ 1,397
Diluted Earnings per Share $ 3.27 $ 3.09 $ 3.65 $ 3.16
Items Affecting Comparability – EPS Impact (For definitions of adjustments to EPS, see note 1.)
Restructuring Charges (0.03 ) 0.03 (0.01 ) (0.02 )
Environmental and Litigation Matters 0.02 0.02 0.04 0.02
Pending Bayer Transaction Related Costs 0.04 0.04 0.07 0.22
Argentine-Related Tax Matters (0.23 ) 0.02 (0.26 ) 0.04
Impact of Income Tax Legislation 0.15 — 0.15 —
Income from Discontinued Operations — (0.01 ) (0.01 ) (0.03 )
Diluted Earnings per Share from Ongoing Business (For the definition of ongoing EPS, see note 1.) $ 3.22
$ 3.19
$ 3.63
$ 3.39
Effective Tax Rate 21 % 27 % 21 % 29 %
Second Quarter Six Months Comparison as a Percent of Net Sales: 2018 2017 2018 2017
Gross profit 59% 58% 56% 55%
Selling, general and administrative expenses 13% 13% 17% 16%
Research and development expenses 8% 8% 10% 10%
Income from continuing operations before income taxes 37% 37% 27% 25%
Net income attributable to Monsanto Company 29% 27% 21% 18%
“The business objectives we achieved in the first half of fiscal year 2018 reflect our team's unwavering commitment
to our farmer customers,” said Hugh Grant, chairman and chief executive officer for Monsanto. “Despite tough farm
economics, we delivered a solid second quarter and are staying disciplined on near-term execution of the business.
We continue to pursue new innovations to benefit modern agriculture, as evidenced by several recent agreements,
and we look forward to reaching additional milestones for the merger with Bayer.”
“We met our acreage target for INTACTA RR2 PROTM soybeans in South America, and the Roundup Ready Xtend®
Crop System is on a path to record trait adoption,” added Brett Begemann, president and chief operating officer for
Monsanto. “In just the third year of the trait on the market, U.S. farmers are on the way to planting nearly 50 million
acres of dicamba-tolerant soy and cotton in 2018, nearly doubling last season’s acreage. Based on anticipated
market demand, we're expecting 60 million acres in 2019. Farmers clearly see the value in this weed control
technology, and we are eager to partner with them to successfully use this vital tool.”
Results of Operations
Net sales for the company's fiscal year 2018 second quarter were essentially flat compared to the prior year's
second quarter at approximately $5.0 billion. Gross profit totaled approximately $3.0 billion for the second quarter of
fiscal years 2018 and 2017.
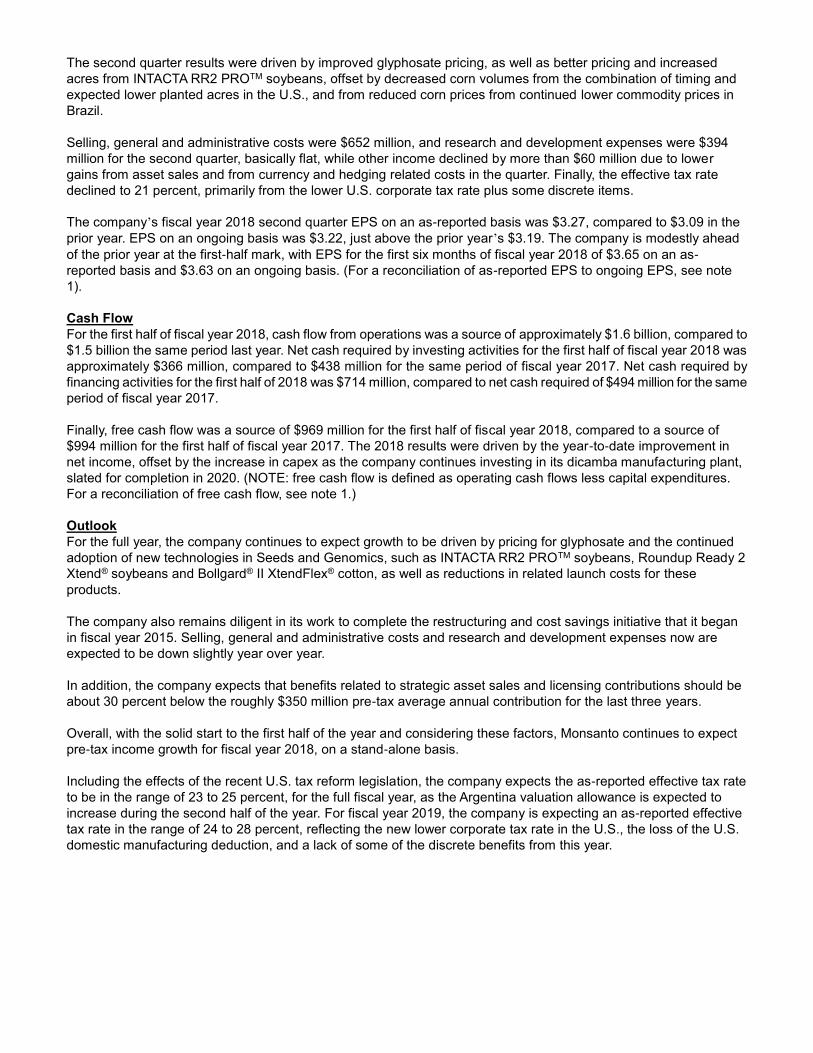
The second quarter results were driven by improved glyphosate pricing, as well as better pricing and increased
acres from INTACTA RR2 PROTM soybeans, offset by decreased corn volumes from the combination of timing and
expected lower planted acres in the U.S., and from reduced corn prices from continued lower commodity prices in
Brazil.
Selling, general and administrative costs were $652 million, and research and development expenses were $394
million for the second quarter, basically flat, while other income declined by more than $60 million due to lower
gains from asset sales and from currency and hedging related costs in the quarter. Finally, the effective tax rate
declined to 21 percent, primarily from the lower U.S. corporate tax rate plus some discrete items.
The company’s fiscal year 2018 second quarter EPS on an as-reported basis was $3.27, compared to $3.09 in the
prior year. EPS on an ongoing basis was $3.22, just above the prior year’s $3.19. The company is modestly ahead
of the prior year at the first-half mark, with EPS for the first six months of fiscal year 2018 of $3.65 on an as-
reported basis and $3.63 on an ongoing basis. (For a reconciliation of as-reported EPS to ongoing EPS, see note
1).
Cash Flow
For the first half of fiscal year 2018, cash flow from operations was a source of approximately $1.6 billion, compared to
$1.5 billion the same period last year. Net cash required by investing activities for the first half of fiscal year 2018 was
approximately $366 million, compared to $438 million for the same period of fiscal year 2017. Net cash required by
financing activities for the first half of 2018 was $714 million, compared to net cash required of $494 million for the same
period of fiscal year 2017.
Finally, free cash flow was a source of $969 million for the first half of fiscal year 2018, compared to a source of
$994 million for the first half of fiscal year 2017. The 2018 results were driven by the year-to-date improvement in
net income, offset by the increase in capex as the company continues investing in its dicamba manufacturing plant,
slated for completion in 2020. (NOTE: free cash flow is defined as operating cash flows less capital expenditures.
For a reconciliation of free cash flow, see note 1.)
Outlook
For the full year, the company continues to expect growth to be driven by pricing for glyphosate and the continued
adoption of new technologies in Seeds and Genomics, such as INTACTA RR2 PROTM soybeans, Roundup Ready 2
Xtend® soybeans and Bollgard® II XtendFlex® cotton, as well as reductions in related launch costs for these
products.
The company also remains diligent in its work to complete the restructuring and cost savings initiative that it began
in fiscal year 2015. Selling, general and administrative costs and research and development expenses now are
expected to be down slightly year over year.
In addition, the company expects that benefits related to strategic asset sales and licensing contributions should be
about 30 percent below the roughly $350 million pre-tax average annual contribution for the last three years.
Overall, with the solid start to the first half of the year and considering these factors, Monsanto continues to expect
pre-tax income growth for fiscal year 2018, on a stand-alone basis.
Including the effects of the recent U.S. tax reform legislation, the company expects the as-reported effective tax rate
to be in the range of 23 to 25 percent, for the full fiscal year, as the Argentina valuation allowance is expected to
increase during the second half of the year. For fiscal year 2019, the company is expecting an as-reported effective
tax rate in the range of 24 to 28 percent, reflecting the new lower corporate tax rate in the U.S., the loss of the U.S.
domestic manufacturing deduction, and a lack of some of the discrete benefits from this year.
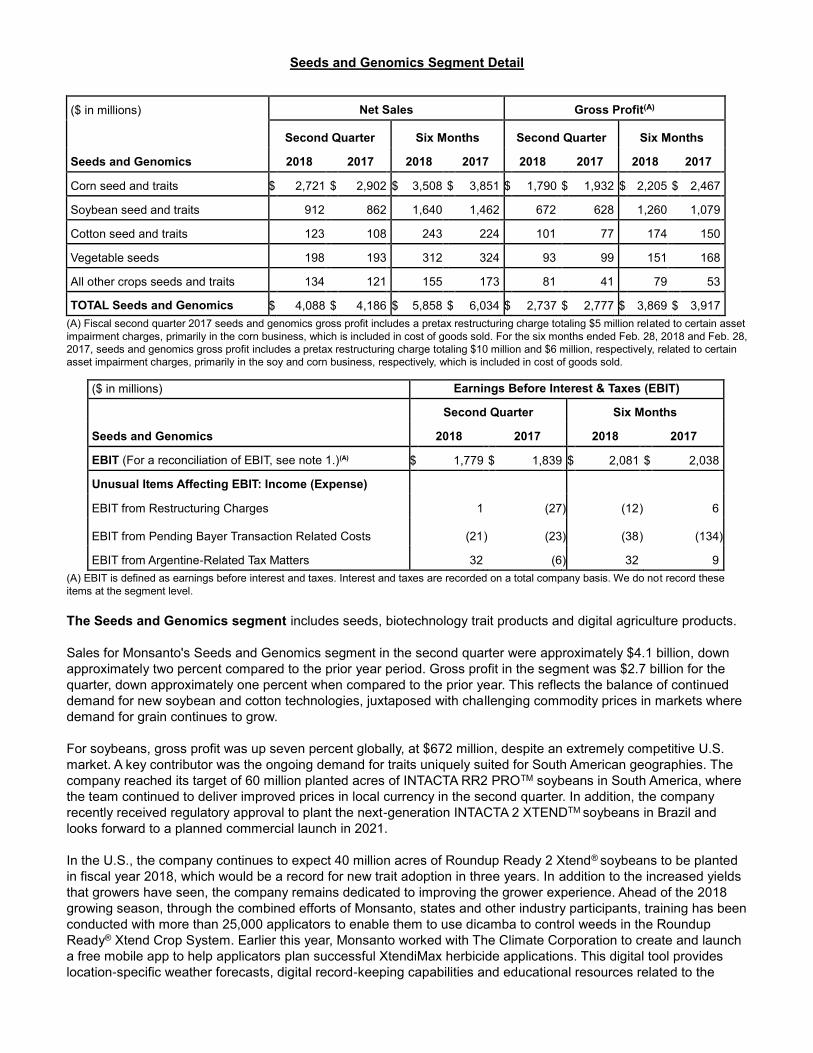
Seeds and Genomics Segment Detail
($ in millions) Net Sales Gross Profit(A)
Second Quarter Six Months Second Quarter Six Months
Seeds and Genomics 2018 2017 2018 2017 2018 2017 2018 2017
Corn seed and traits $ 2,721 $ 2,902
$ 3,508
$ 3,851
$ 1,790
$ 1,932
$ 2,205
$ 2,467
Soybean seed and traits 912
862
1,640
1,462
672
628
1,260
1,079
Cotton seed and traits 123
108
243
224
101
77
174
150
Vegetable seeds 198
193
312
324
93
99
151
168
All other crops seeds and traits 134
121
155
173
81
41
79
53
TOTAL Seeds and Genomics $ 4,088 $ 4,186
$ 5,858
$ 6,034
$ 2,737
$ 2,777
$ 3,869
$ 3,917
(A) Fiscal second quarter 2017 seeds and genomics gross profit includes a pretax restructuring charge totaling $5 million related to certain asset
impairment charges, primarily in the corn business, which is included in cost of goods sold. For the six months ended Feb. 28, 2018 and Feb. 28,
2017, seeds and genomics gross profit includes a pretax restructuring charge totaling $10 million and $6 million, respectively, related to certain
asset impairment charges, primarily in the soy and corn business, respectively, which is included in cost of goods sold.
($ in millions) Earnings Before Interest & Taxes (EBIT)
Second Quarter Six Months
Seeds and Genomics 2018 2017 2018 2017
EBIT (For a reconciliation of EBIT, see note 1.)(A) $ 1,779 $ 1,839
$ 2,081
$ 2,038
Unusual Items Affecting EBIT: Income (Expense)
EBIT from Restructuring Charges 1
(27 ) (12 ) 6
EBIT from Pending Bayer Transaction Related Costs (21 ) (23 ) (38 ) (134 )
EBIT from Argentine-Related Tax Matters 32
(6 ) 32
9
(A) EBIT is defined as earnings before interest and taxes. Interest and taxes are recorded on a total company basis. We do not record these
items at the segment level.
The Seeds and Genomics segment includes seeds, biotechnology trait products and digital agriculture products.
Sales for Monsanto's Seeds and Genomics segment in the second quarter were approximately $4.1 billion, down
approximately two percent compared to the prior year period. Gross profit in the segment was $2.7 billion for the
quarter, down approximately one percent when compared to the prior year. This reflects the balance of continued
demand for new soybean and cotton technologies, juxtaposed with challenging commodity prices in markets where
demand for grain continues to grow.
For soybeans, gross profit was up seven percent globally, at $672 million, despite an extremely competitive U.S.
market. A key contributor was the ongoing demand for traits uniquely suited for South American geographies. The
company reached its target of 60 million planted acres of INTACTA RR2 PROTM soybeans in South America, where
the team continued to deliver improved prices in local currency in the second quarter. In addition, the company
recently received regulatory approval to plant the next-generation INTACTA 2 XTENDTM soybeans in Brazil and
looks forward to a planned commercial launch in 2021.
In the U.S., the company continues to expect 40 million acres of Roundup Ready 2 Xtend® soybeans to be planted
in fiscal year 2018, which would be a record for new trait adoption in three years. In addition to the increased yields
that growers have seen, the company remains dedicated to improving the grower experience. Ahead of the 2018
growing season, through the combined efforts of Monsanto, states and other industry participants, training has been
conducted with more than 25,000 applicators to enable them to use dicamba to control weeds in the Roundup
Ready® Xtend Crop System. Earlier this year, Monsanto worked with The Climate Corporation to create and launch
a free mobile app to help applicators plan successful XtendiMax herbicide applications. This digital tool provides
location-specific weather forecasts, digital record-keeping capabilities and educational resources related to the
Roundup Ready® Xtend Crop System and has been one of the most widely downloaded apps in recent weeks, with
high early user ratings.
The gross profit for Monsanto’s corn business was down seven percent, mostly due to volumes, which were down
because of timing delays from the first half of the year to the second half, and from the expectation of lower planted
corn acres. Confirming this timing shift, the company saw a nearly 40 percent increase in its U.S. branded corn
seed shipments in March compared to the prior year. The company also saw a modest decline in corn pricing in the
quarter, primarily as a result of the 30 percent decline in the corn commodity price in Brazil year over year. For the
full year, the company now expects to hold genetic share globally, based on the performance of its portfolio, while it
anticipates global germplasm pricing to be down modestly in local currency.
In complementary crops, Bollgard® II XtendFlex® cotton is now anticipated to be planted across eight million acres
in the U.S., up from more than six million acres, as expectations for planted acres rise. This expansion helped
contribute to a 31 percent boost in cotton gross profit for the second quarter.
Following a brief commercial pause, the company is now moving forward with another season of Ground Breakers®
farm trials with NemaStrikeTM technology in the U.S. With nearly 15 percent of global agricultural production lost to
nematodes annually, there is clearly a need for the solution this product can deliver.
The Climate Corporation continued to see major advancements. In Europe, Climate is continuing its work following
recent pre-launch announcements for the Climate FieldViewTM platform for Germany, France and Ukraine. The team
also completed its first season of beta testing in Argentina, complementing existing business in Brazil, Canada and
the U.S.
Connectivity is driving new opportunities for Climate, and the company signed seven new platform partners in the
quarter, bringing the total to 25. For instance, in early February Climate and CNH Industrial announced a new
partnership to deliver two-way data sharing to benefit customers of Case IH and New Holland Agriculture brands.
Strategic discussions continue with dozens of other potential industry partners and collaborators to make it easier
for farmers to share data with their agronomic partners for enhanced decision-making. Seamless data connectivity
between Climate FieldViewTM and other agriculture software systems is a crucial step in enabling farmers to gain
customized field insights to help them get the most out of every acre.
Globally, expectations for paid acres on the Climate FieldViewTM platform for fiscal year 2018 remain at more than
50 million, more than a 40 percent increase over fiscal year 2017.
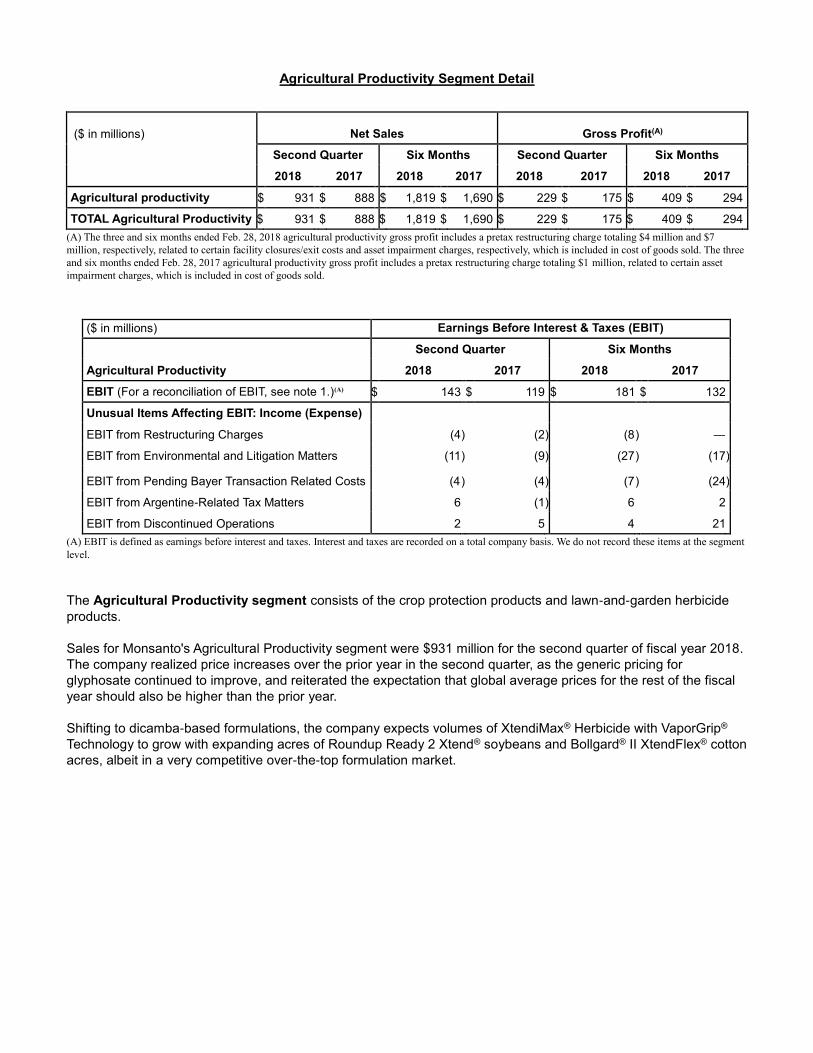
Agricultural Productivity Segment Detail
($ in millions) Net Sales Gross Profit(A)
Second Quarter Six Months Second Quarter Six Months
2018 2017 2018 2017 2018 2017 2018 2017
Agricultural productivity $ 931 $ 888 $ 1,819 $ 1,690 $ 229 $ 175 $ 409 $ 294
TOTAL Agricultural Productivity $ 931 $ 888 $ 1,819 $ 1,690 $ 229 $ 175 $ 409 $ 294
(A) The three and six months ended Feb. 28, 2018 agricultural productivity gross profit includes a pretax restructuring charge totaling $4 million and $7
million, respectively, related to certain facility closures/exit costs and asset impairment charges, respectively, which is included in cost of goods sold. The three
and six months ended Feb. 28, 2017 agricultural productivity gross profit includes a pretax restructuring charge totaling $1 million, related to certain asset
impairment charges, which is included in cost of goods sold.
($ in millions) Earnings Before Interest & Taxes (EBIT)
Second Quarter Six Months
Agricultural Productivity 2018 2017 2018 2017
EBIT (For a reconciliation of EBIT, see note 1.)(A) $ 143 $ 119 $ 181 $ 132
Unusual Items Affecting EBIT: Income (Expense)
EBIT from Restructuring Charges (4 ) (2 ) (8 ) —
EBIT from Environmental and Litigation Matters (11 ) (9 ) (27 ) (17 )
EBIT from Pending Bayer Transaction Related Costs (4 ) (4 ) (7 ) (24 )
EBIT from Argentine-Related Tax Matters 6
(1 ) 6
2
EBIT from Discontinued Operations 2
5
4
21
(A) EBIT is defined as earnings before interest and taxes. Interest and taxes are recorded on a total company basis. We do not record these items at the segment
level.
The Agricultural Productivity segment consists of the crop protection products and lawn-and-garden herbicide
products.
Sales for Monsanto's Agricultural Productivity segment were $931 million for the second quarter of fiscal year 2018.
The company realized price increases over the prior year in the second quarter, as the generic pricing for
glyphosate continued to improve, and reiterated the expectation that global average prices for the rest of the fiscal
year should also be higher than the prior year.
Shifting to dicamba-based formulations, the company expects volumes of XtendiMax® Herbicide with VaporGrip®
Technology to grow with expanding acres of Roundup Ready 2 Xtend® soybeans and Bollgard® II XtendFlex® cotton
acres, albeit in a very competitive over-the-top formulation market.
For more information on these results, please visit www.monsanto.com/investors/reports for presentation slides
related to the second quarter.
About Monsanto Company
Monsanto is committed to bringing a broad range of solutions to help nourish our growing world. We produce seeds
for fruits, vegetables and key crops - such as corn, soybeans, and cotton - that help farmers have better harvests
while using water and other important resources more efficiently. We work to find sustainable solutions for soil
health, help farmers use data to improve farming practices and conserve natural resources, and provide crop
protection products to minimize damage from pests and disease. Through programs and partnerships, we
collaborate with farmers, researchers, nonprofit organizations, universities and others to help tackle some of the
world’s biggest challenges. To learn more about Monsanto, our commitments and our more than 20,000 dedicated
employees, please visit monsanto.com. Follow our business on Twitter® at twitter.com/MonsantoCo.
Cautionary Statements Regarding Forward-Looking Information:
Certain statements contained in this release are “forward-looking statements,” such as statements concerning the
company’s anticipated financial results, current and future product performance, regulatory approvals, business and
financial plans and other non-historical facts, as well as the pending transaction with Bayer Aktiengesellschaft
(“Bayer”). These statements are based on current expectations and currently available information. However, since
these statements are based on factors that involve risks and uncertainties, the company’s actual performance and
results may differ materially from those described or implied by such forward-looking statements. Factors that could
cause or contribute to such differences include, among others: risks related to the pending transaction between the
company and Bayer, including the risk that the regulatory approvals required for the transaction may not be
obtained on the anticipated terms or time frame or at all, the risk that the other conditions to the completion of the
transaction may not be satisfied, the risk that disruptions or uncertainties related to the pending transaction could
adversely affect the company’s business, financial performance and/or relationships with third parties, and the risk
that certain contractual restrictions during the pendency of the transaction could adversely affect the company’s
ability to pursue business opportunities or strategic transactions; continued competition in seeds, traits and
agricultural chemicals; the company's exposure to various contingencies, including those related to intellectual
property protection, regulatory compliance and the speed with which approvals are received, and public
understanding and acceptance of our biotechnology and other agricultural products; the success of the company's
research and development activities; the outcomes of major lawsuits, including potential litigation related to the
pending transaction with Bayer; developments related to foreign currencies and economies; fluctuations in
commodity prices; compliance with regulations affecting our manufacturing; the accuracy of the company's
estimates related to distribution inventory levels; the levels of indebtedness, continued availability of capital and
financing and rating agency actions; the company's ability to fund its short-term financing needs and to obtain
payment for the products that it sells; the effect of weather conditions, natural disasters, accidents, and security
breaches, including cybersecurity incidents, on the agriculture business or the company's facilities; and other risks
and factors detailed in the company's most recent periodic report to the SEC. Undue reliance should not be placed
on these forward-looking statements, which are current only as of the date of this release. The company disclaims
any current intention or obligation to update any forward-looking statements or any of the factors that may affect
actual results.
Notes to editors: Monsanto and the Vine Design, INTACTA RR2 PRO, Roundup Ready Xtend, Roundup Ready 2
Xtend, Bollgard II, XtendFlex, XtendiMax, Ground Breakers, VaporGrip, and FieldView are trademarks of Monsanto
Company and its wholly-owned subsidiaries. All other trademarks are the property of their respective owners.
-oOo-
Monsanto Company
Selected Financial Information
(Dollars in millions, except per share amounts)
Unaudited
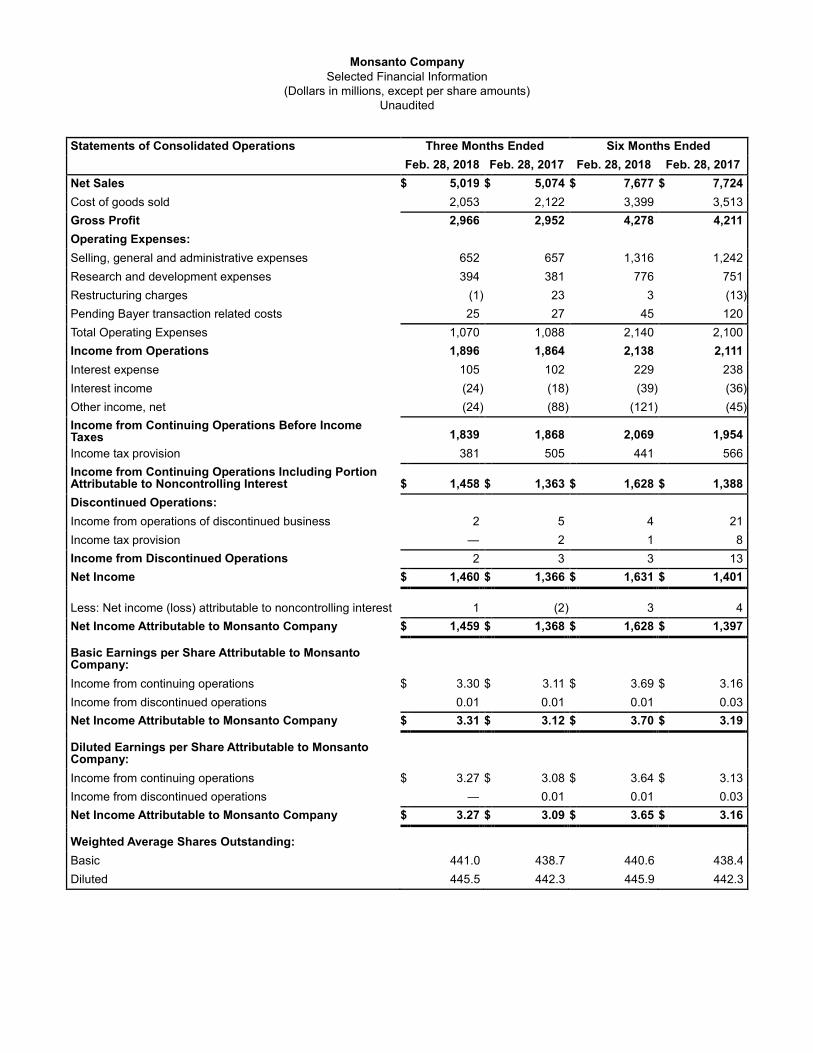
Statements of Consolidated Operations Three Months Ended Six Months Ended
Feb. 28, 2018 Feb. 28, 2017 Feb. 28, 2018 Feb. 28, 2017
Net Sales $ 5,019 $ 5,074 $ 7,677 $ 7,724
Cost of goods sold 2,053 2,122 3,399 3,513
Gross Profit 2,966 2,952 4,278 4,211
Operating Expenses:
Selling, general and administrative expenses 652 657 1,316 1,242
Research and development expenses 394 381 776 751
Restructuring charges (1 ) 23 3 (13 )
Pending Bayer transaction related costs 25 27 45 120
Total Operating Expenses 1,070 1,088 2,140 2,100
Income from Operations 1,896 1,864 2,138 2,111
Interest expense 105 102 229 238
Interest income (24 ) (18 ) (39 ) (36 )
Other income, net (24 ) (88 ) (121 ) (45 )
Income from Continuing Operations Before Income Taxes 1,839
1,868
2,069
1,954
Income tax provision 381 505 441 566
Income from Continuing Operations Including Portion Attributable to Noncontrolling Interest $ 1,458
$ 1,363
$ 1,628
$ 1,388
Discontinued Operations:
Income from operations of discontinued business 2 5 4 21
Income tax provision — 2 1 8
Income from Discontinued Operations 2 3 3 13
Net Income $ 1,460 $ 1,366 $ 1,631 $ 1,401
Less: Net income (loss) attributable to noncontrolling interest 1
(2 ) 3
4
Net Income Attributable to Monsanto Company $ 1,459 $ 1,368 $ 1,628 $ 1,397
Basic Earnings per Share Attributable to Monsanto Company:
Income from continuing operations $ 3.30 $ 3.11 $ 3.69 $ 3.16
Income from discontinued operations 0.01 0.01 0.01 0.03
Net Income Attributable to Monsanto Company $ 3.31 $ 3.12 $ 3.70 $ 3.19
Diluted Earnings per Share Attributable to Monsanto Company:
Income from continuing operations $ 3.27 $ 3.08 $ 3.64 $ 3.13
Income from discontinued operations — 0.01 0.01 0.03
Net Income Attributable to Monsanto Company $ 3.27 $ 3.09 $ 3.65 $ 3.16
Weighted Average Shares Outstanding:
Basic 441.0 438.7 440.6 438.4
Diluted 445.5 442.3 445.9 442.3
Monsanto Company
Selected Financial Information
(Dollars in millions)
Unaudited
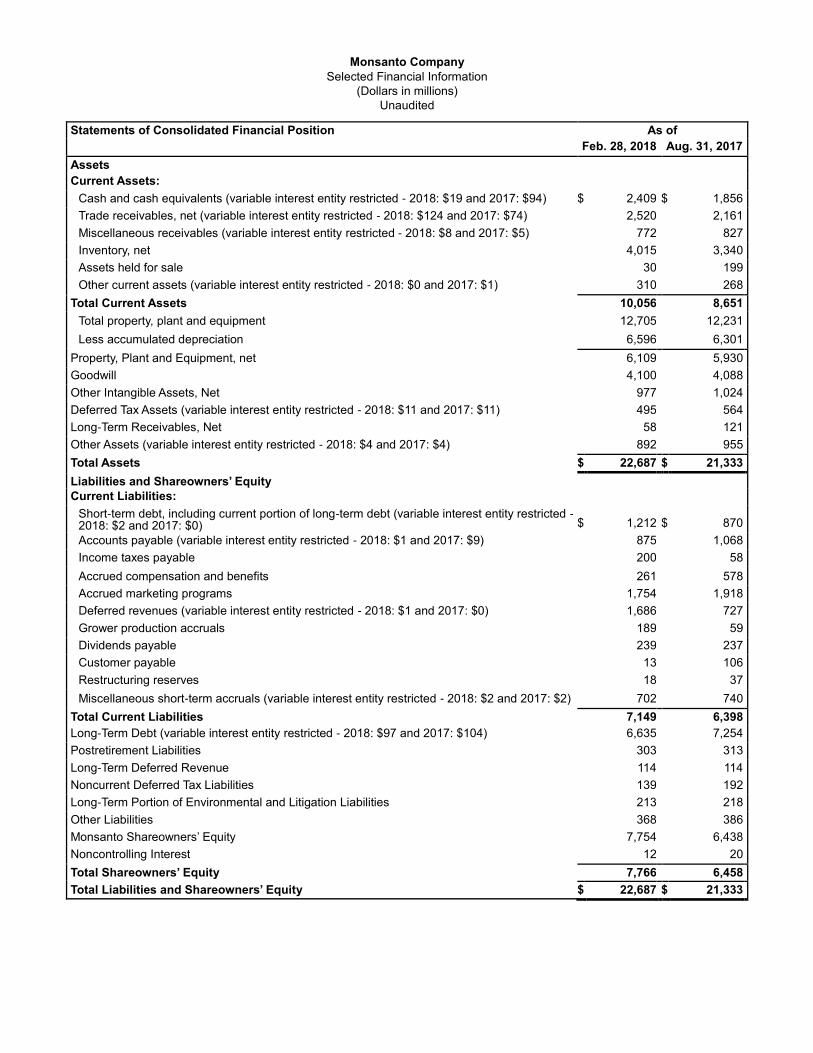
Statements of Consolidated Financial Position As of
Feb. 28, 2018 Aug. 31, 2017
Assets Current Assets:
Cash and cash equivalents (variable interest entity restricted - 2018: $19 and 2017: $94) $ 2,409 $ 1,856
Trade receivables, net (variable interest entity restricted - 2018: $124 and 2017: $74) 2,520 2,161
Miscellaneous receivables (variable interest entity restricted - 2018: $8 and 2017: $5) 772 827
Inventory, net 4,015 3,340
Assets held for sale 30 199
Other current assets (variable interest entity restricted - 2018: $0 and 2017: $1) 310 268
Total Current Assets 10,056 8,651
Total property, plant and equipment 12,705 12,231
Less accumulated depreciation 6,596 6,301
Property, Plant and Equipment, net 6,109 5,930
Goodwill 4,100 4,088
Other Intangible Assets, Net 977 1,024
Deferred Tax Assets (variable interest entity restricted - 2018: $11 and 2017: $11) 495 564
Long-Term Receivables, Net 58 121
Other Assets (variable interest entity restricted - 2018: $4 and 2017: $4) 892 955
Total Assets $ 22,687 $ 21,333
Liabilities and Shareowners’ Equity Current Liabilities:
Short-term debt, including current portion of long-term debt (variable interest entity restricted - 2018: $2 and 2017: $0) $ 1,212
$ 870
Accounts payable (variable interest entity restricted - 2018: $1 and 2017: $9) 875 1,068
Income taxes payable 200 58
Accrued compensation and benefits 261 578
Accrued marketing programs 1,754 1,918
Deferred revenues (variable interest entity restricted - 2018: $1 and 2017: $0) 1,686 727
Grower production accruals 189 59
Dividends payable 239 237
Customer payable 13 106
Restructuring reserves 18 37
Miscellaneous short-term accruals (variable interest entity restricted - 2018: $2 and 2017: $2) 702 740
Total Current Liabilities 7,149 6,398
Long-Term Debt (variable interest entity restricted - 2018: $97 and 2017: $104) 6,635 7,254
Postretirement Liabilities 303 313
Long-Term Deferred Revenue 114 114
Noncurrent Deferred Tax Liabilities 139 192
Long-Term Portion of Environmental and Litigation Liabilities 213 218
Other Liabilities 368 386
Monsanto Shareowners’ Equity 7,754 6,438
Noncontrolling Interest 12 20
Total Shareowners’ Equity 7,766 6,458
Total Liabilities and Shareowners’ Equity $ 22,687 $ 21,333
Monsanto Company
Selected Financial Information
(Dollars in millions)
Unaudited
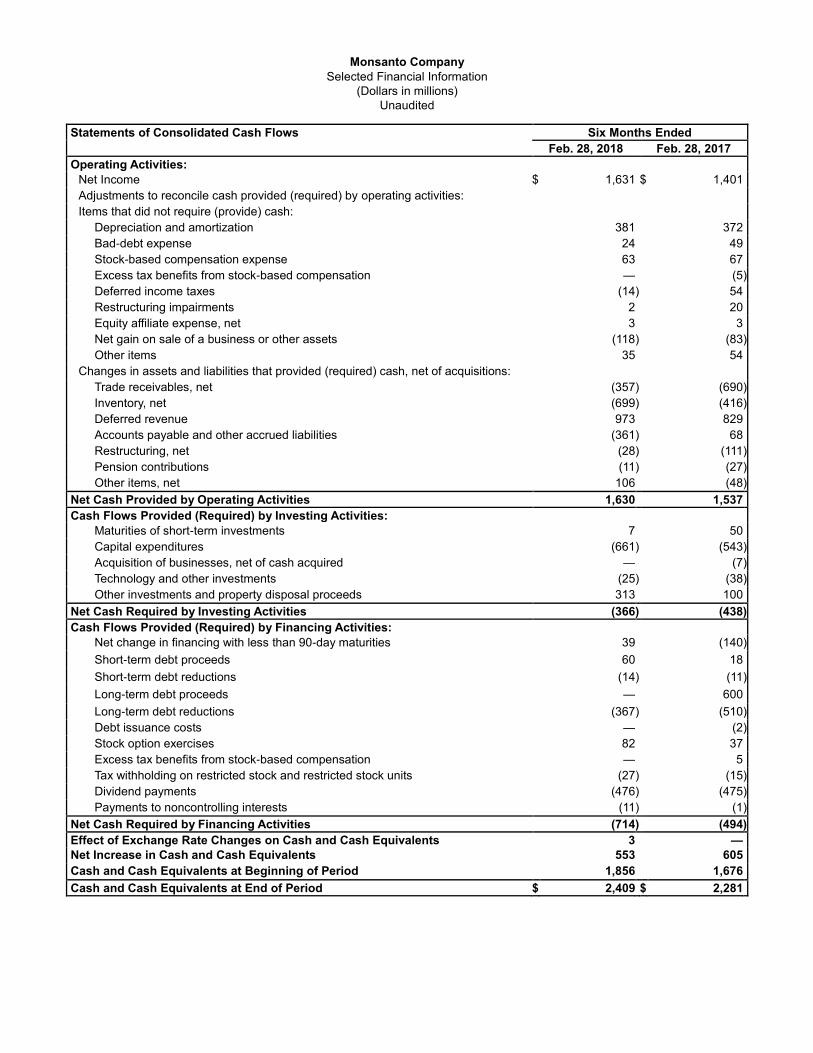
Statements of Consolidated Cash Flows Six Months Ended
Feb. 28, 2018 Feb. 28, 2017
Operating Activities: Net Income $ 1,631 $ 1,401
Adjustments to reconcile cash provided (required) by operating activities:
Items that did not require (provide) cash:
Depreciation and amortization 381 372
Bad-debt expense 24 49
Stock-based compensation expense 63 67
Excess tax benefits from stock-based compensation — (5 )
Deferred income taxes (14 ) 54
Restructuring impairments 2 20
Equity affiliate expense, net 3 3
Net gain on sale of a business or other assets (118 ) (83 )
Other items 35 54
Changes in assets and liabilities that provided (required) cash, net of acquisitions:
Trade receivables, net (357 ) (690 )
Inventory, net (699 ) (416 )
Deferred revenue 973 829
Accounts payable and other accrued liabilities (361 ) 68
Restructuring, net (28 ) (111 )
Pension contributions (11 ) (27 )
Other items, net 106 (48 )
Net Cash Provided by Operating Activities 1,630 1,537
Cash Flows Provided (Required) by Investing Activities: Maturities of short-term investments 7 50
Capital expenditures (661 ) (543 )
Acquisition of businesses, net of cash acquired — (7 )
Technology and other investments (25 ) (38 )
Other investments and property disposal proceeds 313 100
Net Cash Required by Investing Activities (366 ) (438 )
Cash Flows Provided (Required) by Financing Activities: Net change in financing with less than 90-day maturities 39 (140 )
Short-term debt proceeds 60 18
Short-term debt reductions (14 ) (11 )
Long-term debt proceeds — 600
Long-term debt reductions (367 ) (510 )
Debt issuance costs — (2 )
Stock option exercises 82 37
Excess tax benefits from stock-based compensation — 5
Tax withholding on restricted stock and restricted stock units (27 ) (15 )
Dividend payments (476 ) (475 )
Payments to noncontrolling interests (11 ) (1 )
Net Cash Required by Financing Activities (714 ) (494 )
Effect of Exchange Rate Changes on Cash and Cash Equivalents 3 —
Net Increase in Cash and Cash Equivalents 553 605
Cash and Cash Equivalents at Beginning of Period 1,856 1,676
Cash and Cash Equivalents at End of Period $ 2,409 $ 2,281

Monsanto Company
Non-GAAP Financial Information
(Dollars in millions, except per share amounts)
Unaudited
1. This press release uses the non-GAAP financial measures of gross profit, operating expenses, net income (loss)
attributable to Monsanto Company and diluted earnings per share (EPS), each on an ongoing basis (collectively, “Ongoing
Financial Measures”), and EBIT and free cash flow. The Ongoing Financial Measures and EBIT are intended to supplement
investor's understanding of our operating performance. The free cash flow measure is intended to supplement investor's
understanding of our liquidity. They are different from and not intended to replace gross profit, operating expenses, net
income (loss) attributable to Monsanto Company, diluted EPS, cash flows, financial position or comprehensive income
(loss), and they are not measures of financial performance as determined in accordance with U.S. generally accepted
accounting principles (GAAP). These non-GAAP financial measures may not be comparable to similar measures used by
other companies.
Our Ongoing Financial Measures exclude certain items that we do not consider part of ongoing operations. We believe that
our Ongoing Financial Measures presented with these adjustments are useful to investors as they best reflect our ongoing
performance and business operations during the periods presented and are also useful to investors for comparative
purposes. In addition, management uses the Ongoing Financial Measures as a guide in its budgeting and long-range
planning processes, and the ongoing EPS financial measure is used as a guide in determining incentive compensation.
EBIT is defined as earnings (loss) before interest and taxes. Earnings (loss) is intended to mean net income (loss)
attributable to Monsanto Company as presented in the Statements of Consolidated Operations under GAAP. EBIT is an
operating performance measure for our two business segments. We believe that EBIT is useful to investors and
management to demonstrate the operational profitability of our segments by excluding interest and taxes, which are
generally accounted for across the entire company on a consolidated basis. EBIT is also one of the measures used by
management to determine resource allocations within the company.
We define free cash flow as the total of net cash provided or required by operating activities less capital expenditures. Free
cash flow does not represent the residual cash flow available for discretionary expenditures. We believe that free cash flow
is an important liquidity measure for the company and that it is useful to investors and management as a measure of the
ability of our business to generate cash. Once business needs and obligations are met, this cash can be used to reinvest in
the company for future growth or to return to our shareowners through dividend payments or share repurchases. Free cash
flow is also used as one of the performance measures in determining incentive compensation.
The following tables reconcile GAAP as-reported financial measures to Non-GAAP financial measures.
Reconciliation of GAAP As-Reported to Selected Non-GAAP Financial Measures:
Three Months Ended
Feb. 28, 2018
(in millions) GAAP As Reported Adjustments(A) Ongoing Basis
Net Sales $ 5,019 $ — $ 5,019
Gross Profit 2,966 4 2,970
Operating Expenses(B) 1,070 (35 ) 1,035
Net Income Attributable to Monsanto Company 1,459 (25 ) 1,434
Diluted Earnings per Share 3.27 (0.05 ) 3.22
Six Months Ended
Feb. 28, 2018
(in millions) GAAP As Reported Adjustments(A) Ongoing Basis
Net Sales $ 7,677 $ — $ 7,677
Gross Profit 4,278 17 4,295
Operating Expenses(B) 2,140 (75 ) 2,065
Net Income Attributable to Monsanto Company 1,628 (11 ) 1,617
Diluted Earnings per Share 3.65 (0.02 ) 3.63

(A) In the three and six months ended Feb. 28, 2018, select GAAP measures have been adjusted to an ongoing basis by
eliminating the impact of restructuring charges, environmental and litigation matters, pending Bayer transaction related costs,
Argentine-related tax matters, impact of income tax legislation and income from discontinued operations. See separate
reconciliations of each measure below.
• Fiscal second quarter 2018, included a pretax net restructuring charge totaling $3 million ($0.01 a share), or after-tax a
net reversal of $12 million ($0.03 a share), of which the $3 million net expense related to various other operating
activities. For the six months ended Feb. 28, 2018, included a pretax net restructuring charge totaling $20 million ($0.05
a share), or after-tax a net reversal of $3 million ($0.01 a share), of which $2 million related to certain asset impairment
charges and a $18 million net expense related to various other operating activities. For the three months ended Feb.
28, 2018, $4 million of expense and $1 million of a net reversal of previously recognized expense were included in cost
of goods sold and restructuring charges, respectively. For the six months ended Feb. 28, 2018, expenses of $17 million
and $3 million were included in cost of goods sold and restructuring charges, respectively. The restructuring charges
relate to the 2015 Restructuring Plan. Implementation of the 2015 Restructuring Plan is expected to be completed by
the end of fiscal year 2018.
• The three and six months ended Feb. 28, 2018, included pretax charges of $11 million ($0.03 a share), or after-tax $9
million ($0.02 a share), and $27 million ($0.06 a share), or after-tax $19 million ($0.04 a share), respectively, for legacy
matters arising under indemnities from the 2000 Pharmacia Separation Agreement that are not considered a part of
ongoing operations. The pretax charges were recorded in selling, general and administrative expenses.
• The three and six months ended Feb. 28, 2018, included pretax charges of $25 million ($0.06 a share), or after-tax $19
million ($0.04 a share), and $45 million ($0.10 a share), or after-tax $32 million ($0.07 a share), respectively, for
expenses incurred associated with the merger agreement for the acquisition of Monsanto by Bayer Aktiengesellschaft
entered into on Sep. 14, 2016. The pretax charges in the three and six months ended Feb. 28, 2018, were recorded in
operating expenses.
• Due to losses generated in Argentina in recent years as well as recent uncertainties around the Argentina business, the
company evaluated the recoverability of various items on the Statement of Consolidated Financial Position related to
the Argentina business and determined an allowance against certain assets was necessary in the third quarter of fiscal
year 2016. During the three and six months ended Feb. 28, 2018, a net reversal of charges related to Argentine-related
tax matters of $105 million ($0.23 a share) and $122 million ($0.26 a share), respectively, was recorded. The net
reversal of charges includes a translation gain recorded in other income, net of $38 million and a net reversal of
previously recognized charges against tax expense of $67 million for the three months ended Feb. 28, 2018, and it
resulted in a translation gain recorded in other income, net of $38 million and a net reversal of previously recognized
charges against tax expense of $84 million for the six months ended Feb. 28, 2018.
• The three and six months ended Feb. 28, 2018, include $66 million of charges recorded within the income tax provision
line item from the impact of new income tax legislation in various countries in which Monsanto operates.
• The company reports annual earn-out payments received as a result of the 2008 divestment of the Dairy Business as
discontinued operations. The three and six months ended Feb. 28, 2018, included pretax income from discontinued
operations of $2 million (less than $0.01 a share), or after-tax $2 million (less than $0.01 a share), and $4 million ($0.01
a share), or after-tax $3 million ($0.01 a share).
(B)Operating expenses include selling, general and administrative expenses, research and development expenses, restructuring
charges and pending Bayer transaction related costs.
Three Months Ended
Feb. 28, 2017
(in millions) GAAP As Reported Adjustments(A) Ongoing Basis
Net Sales $ 5,074 $ — $ 5,074
Gross Profit 2,952 6 2,958
Operating Expenses(B) 1,088 (59 ) 1,029
Net Income Attributable to Monsanto Company 1,368 41 1,409
Diluted Earnings per Share 3.09 0.10 3.19
Six Months Ended
Feb. 28, 2017
(in millions) GAAP As Reported Adjustments(A) Ongoing Basis
Net Sales $ 7,724 $ — $ 7,724
Gross Profit 4,211 7 4,218
Operating Expenses(B) 2,100 (124 ) 1,976
Net Income Attributable to Monsanto Company 1,397 103 1,500
Diluted Earnings per Share 3.16 0.23 3.39
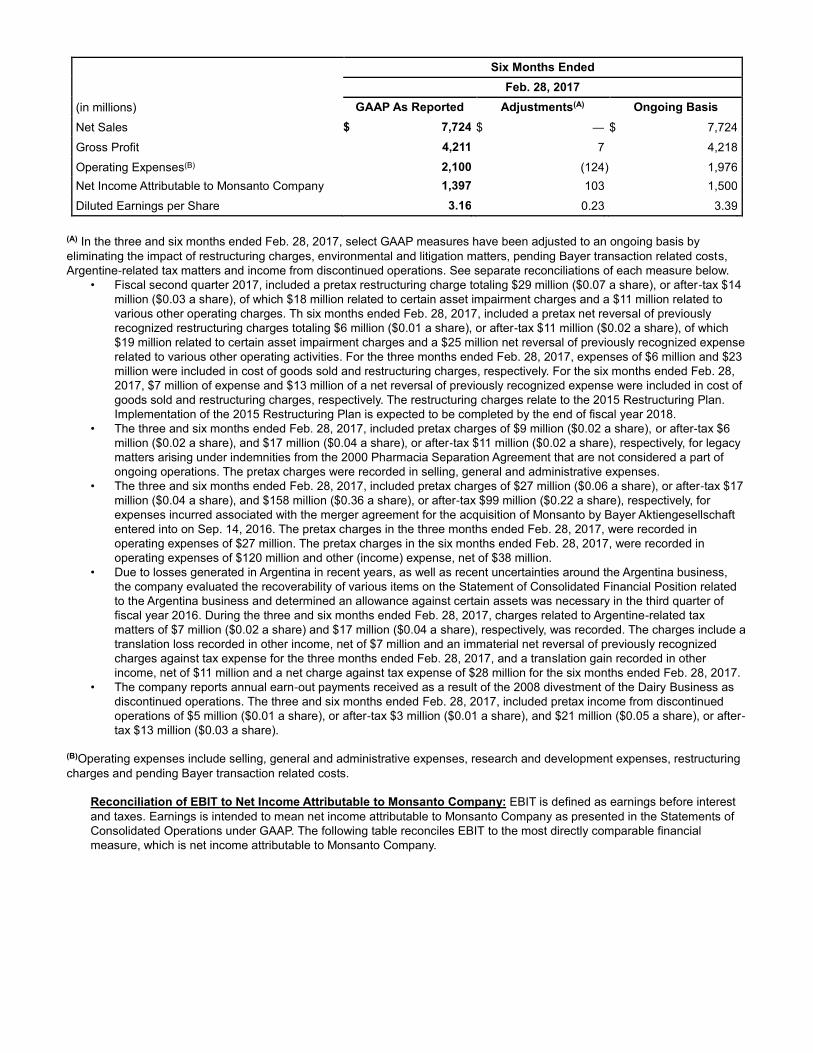
(A) In the three and six months ended Feb. 28, 2017, select GAAP measures have been adjusted to an ongoing basis by
eliminating the impact of restructuring charges, environmental and litigation matters, pending Bayer transaction related costs,
Argentine-related tax matters and income from discontinued operations. See separate reconciliations of each measure below.
• Fiscal second quarter 2017, included a pretax restructuring charge totaling $29 million ($0.07 a share), or after-tax $14
million ($0.03 a share), of which $18 million related to certain asset impairment charges and a $11 million related to
various other operating charges. Th six months ended Feb. 28, 2017, included a pretax net reversal of previously
recognized restructuring charges totaling $6 million ($0.01 a share), or after-tax $11 million ($0.02 a share), of which
$19 million related to certain asset impairment charges and a $25 million net reversal of previously recognized expense
related to various other operating activities. For the three months ended Feb. 28, 2017, expenses of $6 million and $23
million were included in cost of goods sold and restructuring charges, respectively. For the six months ended Feb. 28,
2017, $7 million of expense and $13 million of a net reversal of previously recognized expense were included in cost of
goods sold and restructuring charges, respectively. The restructuring charges relate to the 2015 Restructuring Plan.
Implementation of the 2015 Restructuring Plan is expected to be completed by the end of fiscal year 2018.
• The three and six months ended Feb. 28, 2017, included pretax charges of $9 million ($0.02 a share), or after-tax $6
million ($0.02 a share), and $17 million ($0.04 a share), or after-tax $11 million ($0.02 a share), respectively, for legacy
matters arising under indemnities from the 2000 Pharmacia Separation Agreement that are not considered a part of
ongoing operations. The pretax charges were recorded in selling, general and administrative expenses.
• The three and six months ended Feb. 28, 2017, included pretax charges of $27 million ($0.06 a share), or after-tax $17
million ($0.04 a share), and $158 million ($0.36 a share), or after-tax $99 million ($0.22 a share), respectively, for
expenses incurred associated with the merger agreement for the acquisition of Monsanto by Bayer Aktiengesellschaft
entered into on Sep. 14, 2016. The pretax charges in the three months ended Feb. 28, 2017, were recorded in
operating expenses of $27 million. The pretax charges in the six months ended Feb. 28, 2017, were recorded in
operating expenses of $120 million and other (income) expense, net of $38 million.
• Due to losses generated in Argentina in recent years, as well as recent uncertainties around the Argentina business,
the company evaluated the recoverability of various items on the Statement of Consolidated Financial Position related
to the Argentina business and determined an allowance against certain assets was necessary in the third quarter of
fiscal year 2016. During the three and six months ended Feb. 28, 2017, charges related to Argentine-related tax
matters of $7 million ($0.02 a share) and $17 million ($0.04 a share), respectively, was recorded. The charges include a
translation loss recorded in other income, net of $7 million and an immaterial net reversal of previously recognized
charges against tax expense for the three months ended Feb. 28, 2017, and a translation gain recorded in other
income, net of $11 million and a net charge against tax expense of $28 million for the six months ended Feb. 28, 2017.
• The company reports annual earn-out payments received as a result of the 2008 divestment of the Dairy Business as
discontinued operations. The three and six months ended Feb. 28, 2017, included pretax income from discontinued
operations of $5 million ($0.01 a share), or after-tax $3 million ($0.01 a share), and $21 million ($0.05 a share), or after-
tax $13 million ($0.03 a share).
(B)Operating expenses include selling, general and administrative expenses, research and development expenses, restructuring
charges and pending Bayer transaction related costs.
Reconciliation of EBIT to Net Income Attributable to Monsanto Company: EBIT is defined as earnings before interest
and taxes. Earnings is intended to mean net income attributable to Monsanto Company as presented in the Statements of
Consolidated Operations under GAAP. The following table reconciles EBIT to the most directly comparable financial
measure, which is net income attributable to Monsanto Company.
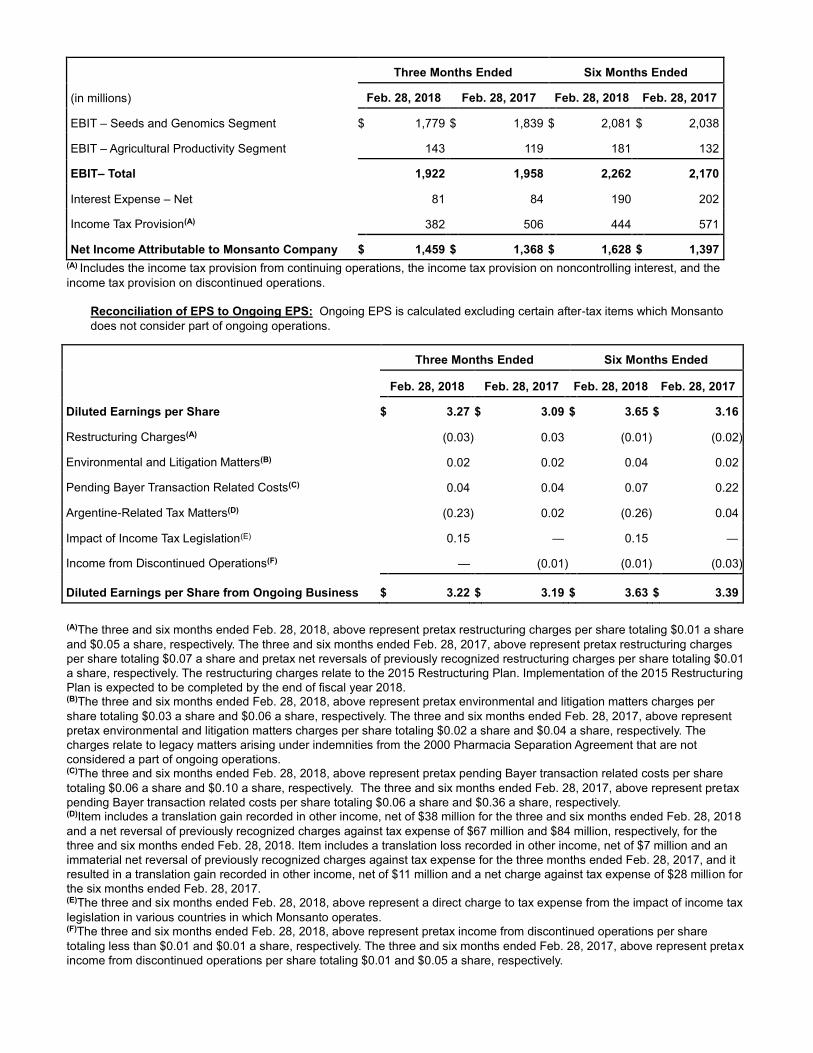
Three Months Ended Six Months Ended
(in millions) Feb. 28, 2018 Feb. 28, 2017 Feb. 28, 2018 Feb. 28, 2017
EBIT – Seeds and Genomics Segment $ 1,779 $ 1,839
$ 2,081
$ 2,038
EBIT – Agricultural Productivity Segment 143
119
181
132
EBIT– Total 1,922
1,958
2,262
2,170
Interest Expense – Net 81
84
190
202
Income Tax Provision(A) 382
506
444
571
Net Income Attributable to Monsanto Company $ 1,459 $ 1,368
$ 1,628
$ 1,397
(A) Includes the income tax provision from continuing operations, the income tax provision on noncontrolling interest, and the
income tax provision on discontinued operations.
Reconciliation of EPS to Ongoing EPS: Ongoing EPS is calculated excluding certain after-tax items which Monsanto
does not consider part of ongoing operations.
Three Months Ended Six Months Ended
Feb. 28, 2018 Feb. 28, 2017 Feb. 28, 2018 Feb. 28, 2017
Diluted Earnings per Share $ 3.27 $ 3.09
$ 3.65
$ 3.16
Restructuring Charges(A) (0.03 ) 0.03
(0.01 ) (0.02 )
Environmental and Litigation Matters(B) 0.02
0.02
0.04
0.02
Pending Bayer Transaction Related Costs(C) 0.04
0.04
0.07
0.22
Argentine-Related Tax Matters(D) (0.23 ) 0.02
(0.26 ) 0.04
Impact of Income Tax Legislation(E) 0.15
—
0.15
—
Income from Discontinued Operations(F) —
(0.01 ) (0.01 ) (0.03 )
Diluted Earnings per Share from Ongoing Business $ 3.22 $ 3.19
$ 3.63
$ 3.39
(A)The three and six months ended Feb. 28, 2018, above represent pretax restructuring charges per share totaling $0.01 a share
and $0.05 a share, respectively. The three and six months ended Feb. 28, 2017, above represent pretax restructuring charges
per share totaling $0.07 a share and pretax net reversals of previously recognized restructuring charges per share totaling $0.01
a share, respectively. The restructuring charges relate to the 2015 Restructuring Plan. Implementation of the 2015 Restructuring
Plan is expected to be completed by the end of fiscal year 2018.
(B)The three and six months ended Feb. 28, 2018, above represent pretax environmental and litigation matters charges per
share totaling $0.03 a share and $0.06 a share, respectively. The three and six months ended Feb. 28, 2017, above represent
pretax environmental and litigation matters charges per share totaling $0.02 a share and $0.04 a share, respectively. The
charges relate to legacy matters arising under indemnities from the 2000 Pharmacia Separation Agreement that are not
considered a part of ongoing operations.
(C)The three and six months ended Feb. 28, 2018, above represent pretax pending Bayer transaction related costs per share
totaling $0.06 a share and $0.10 a share, respectively. The three and six months ended Feb. 28, 2017, above represent pretax
pending Bayer transaction related costs per share totaling $0.06 a share and $0.36 a share, respectively.
(D)Item includes a translation gain recorded in other income, net of $38 million for the three and six months ended Feb. 28, 2018
and a net reversal of previously recognized charges against tax expense of $67 million and $84 million, respectively, for the
three and six months ended Feb. 28, 2018. Item includes a translation loss recorded in other income, net of $7 million and an
immaterial net reversal of previously recognized charges against tax expense for the three months ended Feb. 28, 2017, and it
resulted in a translation gain recorded in other income, net of $11 million and a net charge against tax expense of $28 million for
the six months ended Feb. 28, 2017.
(E)The three and six months ended Feb. 28, 2018, above represent a direct charge to tax expense from the impact of income tax
legislation in various countries in which Monsanto operates.
(F)The three and six months ended Feb. 28, 2018, above represent pretax income from discontinued operations per share
totaling less than $0.01 and $0.01 a share, respectively. The three and six months ended Feb. 28, 2017, above represent pretax
income from discontinued operations per share totaling $0.01 and $0.05 a share, respectively.
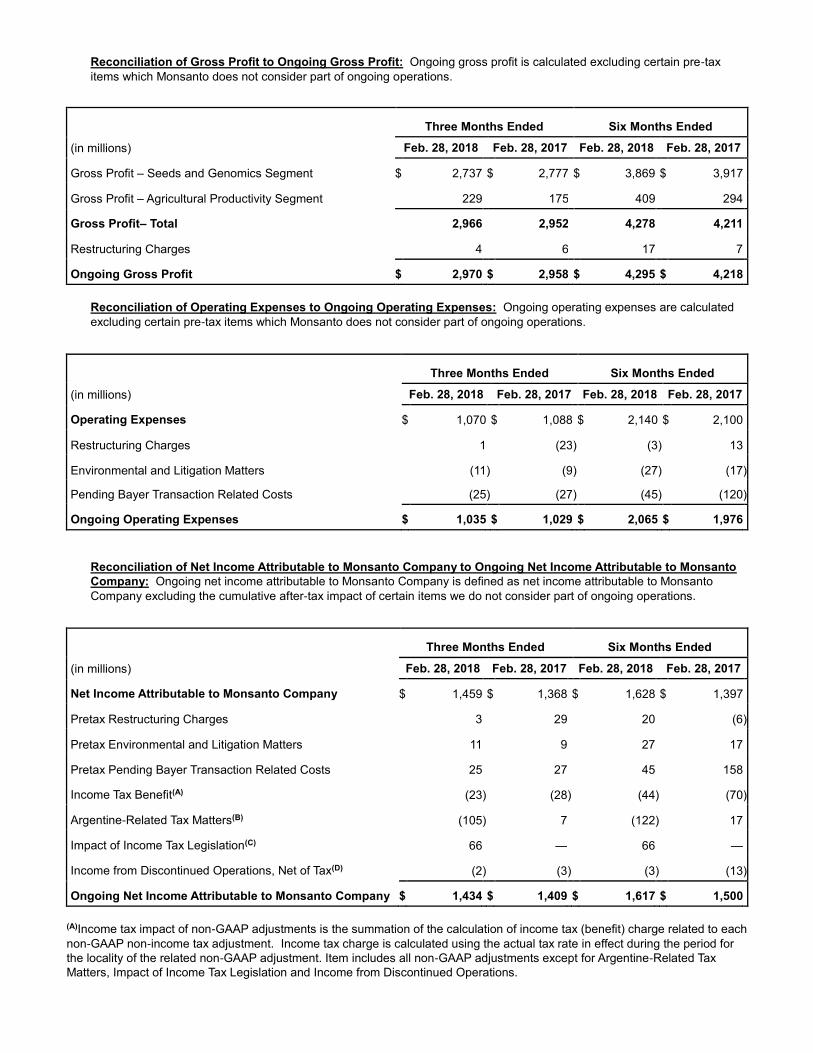
Reconciliation of Gross Profit to Ongoing Gross Profit: Ongoing gross profit is calculated excluding certain pre-tax
items which Monsanto does not consider part of ongoing operations.
Three Months Ended Six Months Ended
(in millions) Feb. 28, 2018 Feb. 28, 2017 Feb. 28, 2018 Feb. 28, 2017
Gross Profit – Seeds and Genomics Segment $ 2,737 $ 2,777
$ 3,869
$ 3,917
Gross Profit – Agricultural Productivity Segment 229
175
409
294
Gross Profit– Total 2,966
2,952
4,278
4,211
Restructuring Charges 4
6
17
7
Ongoing Gross Profit $ 2,970 $ 2,958
$ 4,295
$ 4,218
Reconciliation of Operating Expenses to Ongoing Operating Expenses: Ongoing operating expenses are calculated
excluding certain pre-tax items which Monsanto does not consider part of ongoing operations.
Three Months Ended Six Months Ended
(in millions) Feb. 28, 2018 Feb. 28, 2017 Feb. 28, 2018 Feb. 28, 2017
Operating Expenses $ 1,070 $ 1,088
$ 2,140
$ 2,100
Restructuring Charges 1
(23 ) (3 ) 13
Environmental and Litigation Matters (11 ) (9 ) (27 ) (17 )
Pending Bayer Transaction Related Costs (25 ) (27 ) (45 ) (120 )
Ongoing Operating Expenses $ 1,035 $ 1,029
$ 2,065
$ 1,976
Reconciliation of Net Income Attributable to Monsanto Company to Ongoing Net Income Attributable to Monsanto
Company: Ongoing net income attributable to Monsanto Company is defined as net income attributable to Monsanto
Company excluding the cumulative after-tax impact of certain items we do not consider part of ongoing operations.
Three Months Ended Six Months Ended
(in millions) Feb. 28, 2018 Feb. 28, 2017 Feb. 28, 2018 Feb. 28, 2017
Net Income Attributable to Monsanto Company $ 1,459 $ 1,368
$ 1,628
$ 1,397
Pretax Restructuring Charges 3
29
20
(6 )
Pretax Environmental and Litigation Matters 11
9
27
17
Pretax Pending Bayer Transaction Related Costs 25
27
45
158
Income Tax Benefit(A) (23 ) (28 ) (44 ) (70 )
Argentine-Related Tax Matters(B) (105 ) 7
(122 ) 17
Impact of Income Tax Legislation(C) 66
—
66
—
Income from Discontinued Operations, Net of Tax(D) (2 ) (3 ) (3 ) (13 )
Ongoing Net Income Attributable to Monsanto Company $ 1,434 $ 1,409
$ 1,617
$ 1,500
(A)Income tax impact of non-GAAP adjustments is the summation of the calculation of income tax (benefit) charge related to each
non-GAAP non-income tax adjustment. Income tax charge is calculated using the actual tax rate in effect during the period for
the locality of the related non-GAAP adjustment. Item includes all non-GAAP adjustments except for Argentine-Related Tax
Matters, Impact of Income Tax Legislation and Income from Discontinued Operations.
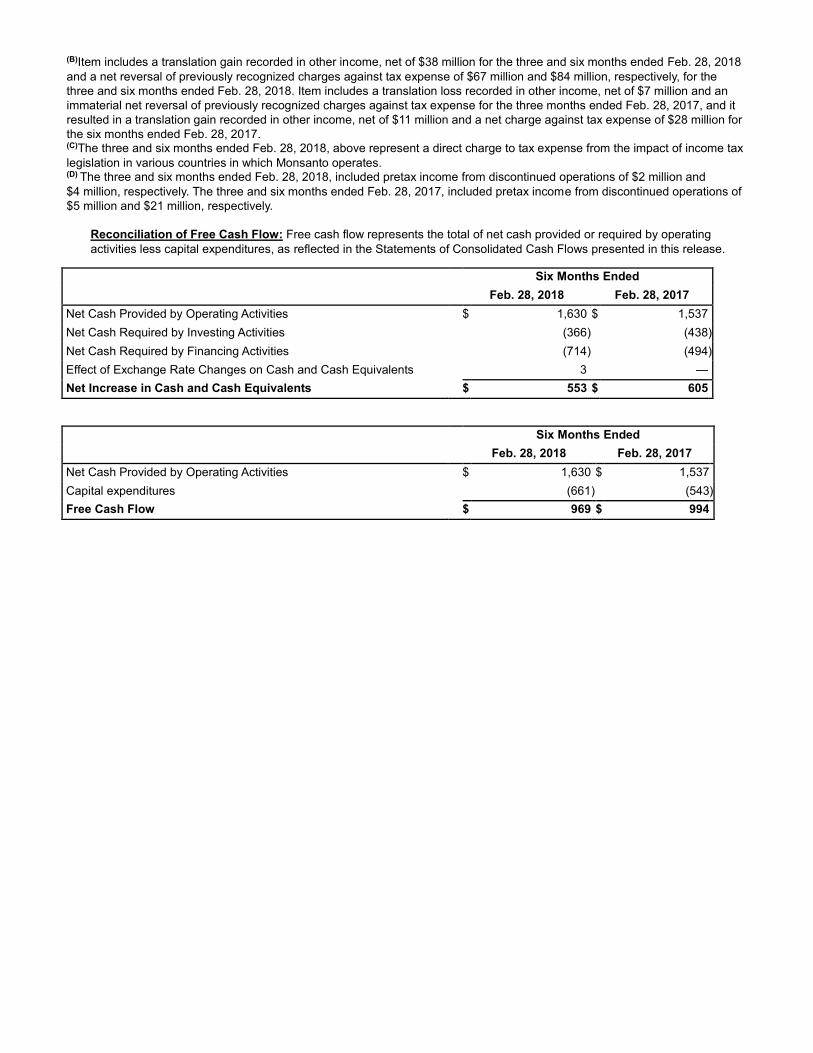
(B)Item includes a translation gain recorded in other income, net of $38 million for the three and six months ended Feb. 28, 2018
and a net reversal of previously recognized charges against tax expense of $67 million and $84 million, respectively, for the
three and six months ended Feb. 28, 2018. Item includes a translation loss recorded in other income, net of $7 million and an
immaterial net reversal of previously recognized charges against tax expense for the three months ended Feb. 28, 2017, and it
resulted in a translation gain recorded in other income, net of $11 million and a net charge against tax expense of $28 million for
the six months ended Feb. 28, 2017.
(C)The three and six months ended Feb. 28, 2018, above represent a direct charge to tax expense from the impact of income tax
legislation in various countries in which Monsanto operates.
(D) The three and six months ended Feb. 28, 2018, included pretax income from discontinued operations of $2 million and
$4 million, respectively. The three and six months ended Feb. 28, 2017, included pretax income from discontinued operations of
$5 million and $21 million, respectively.
Reconciliation of Free Cash Flow: Free cash flow represents the total of net cash provided or required by operating
activities less capital expenditures, as reflected in the Statements of Consolidated Cash Flows presented in this release.
Six Months Ended
Feb. 28, 2018 Feb. 28, 2017
Net Cash Provided by Operating Activities $ 1,630 $ 1,537
Net Cash Required by Investing Activities (366 ) (438 )
Net Cash Required by Financing Activities (714 ) (494 )
Effect of Exchange Rate Changes on Cash and Cash Equivalents 3 —
Net Increase in Cash and Cash Equivalents $ 553 $ 605
Six Months Ended
Feb. 28, 2018 Feb. 28, 2017
Net Cash Provided by Operating Activities $ 1,630 $ 1,537
Capital expenditures (661 ) (543 )
Free Cash Flow $ 969 $ 994