monthly market update - home - colombo€¦ · monthly market update alberto tocchio - cio...
TRANSCRIPT

Monthly focus on the financial markets
Monthly Market
Update
Alberto Tocchio - CIO
Contents
15th January 2019
• Commodities
• Current investment ideas
• Market Analysis
• Executive Summary
• Macro
• Geopolitics
• Forex

The longest bull market in history ended last year with a very quick 3-monthcorrection. The S&P had its worst December performance since 1931 and, the factwe couldn’t have a bounce during a statistically very benign month of December,clearly shows that we are approaching a special moment in market history, thebeginning of a bear market.
Poor volumes and the particular time of the year for the month of December wereparticularly disorientating for the investors. December last year saw the poorestperformance for US equities since the Great Depression.
2
Market Analysis
This is in stark contrast to 2017 as it has been the best year ever in terms ofnumber of asset classes closing positively with only 1% in negative territory(Philippines Bonds).
On average in the last 117 years, only 29% of asset classes had a negativeperformance at the end of the year.
After a very poor December, more than half of global equity markets were in a bearmarket (down more than 20%) and almost all were in a correction (down more than10% but less than 20%).
This is what we already called the “beginning of a bear market”, there is not enoughdemand to support sustained rallies because there has been too much profit/lossdestruction and the volatility of people’s portfolios is too high.
S&P Historical December monthly returns
Proportion of global equity indices in a correction of bear market
Proportion of indices down +10% (dark line)
Proportion of indices down +20% (light line)
We have witnessed a very difficult year with the worst US performance in a decade(US stocks lost nearly 6trn$ from the top), China down 25%, Nikkei -12% and Dax -18%. 2018 has been the worst year since 1901 if we consider how many assetclasses have generated a negative performance in $ terms. 89% of the worlddifferent asset classes have closed negatively vs 84% in 1920. Volatility has beenvery high, on the S&P we saw the most +/-2% spot moves since 2008.

We have been cautious since the beginning of the last year suggesting to buyvolatility (which actually touched historical lows in January) but it was certainlydifficult to predict such a dramatic end of the year.
During 2018, the global macro backdrop has worsened materially and risk premiaacross assets had to reprice this. Exactly one year ago, investors started with abullish tone despite the difficult valuations owing to the longest bull market inbalanced equity/bond portfolios in a century. This rally was in part due tostructurally lower macro volatility since the 1990s, but in 2017 the 'Goldilocks'backdrop specifically, drove a carry-friendly low vol regime. The elevated valuationspointed to lower returns across assets and more drawdown risk in the event ofgrowth or inflation shocks, with bonds unlikely to buffer equity drawdowns andequities likely to suffer from rate shocks.
The deleveraging has been massive and quick, no wonder about who was behindthis selling pressure as we have been flagging in recent months the vulnerabilitiesfrom Equity Long/Short hedge funds and multi asset funds such as Risk Parity andBalanced mutual funds.
Over the past six weeks we had the largest single weekly equity mutual fundoutflow on record with more than 100bn$ in December.
Importantly, the funding has dried up for the first time since the last recession withUS Junk bond issuance falling to zero in December.
Investors have withdrawn nearly 13bn$ from US leveraged loan funds during thepast 6 weeks, the CLO (Collateralized Loan market) has traded very little inDecember similarly to the beginning of the last recession.
Over the last 2 weeks of December, Money Market funds attracted a whopping81bn$. We have rarely seen such a high level of cash raised in such a short time-frame.
3
Market Analysis
At the end of the last month, the increase in bearish sentiment as measured by theInvestors Intelligence survey during the last week of 2018 was the largest pick-upon record by a wide margin.
Weekly change in bearish sentiment (blue line)
Valuations for risky assets have declined materially and are below the 1990saverage. Equity valuations have de-rated due to a combination of price declinesand still positive earnings growth. Credit spreads have widened across regions andthe quality spectrum. US HY credit spreads have risen more than 200bp in the pastthree months. Only global bond valuations remain high, in particular after the recentrally.

Valuations across assets have started to decline sharply in 2018 in particular forrisky assets.
4
Market Analysis
McClennan advances – declines US index oscillator (black line)
US Z scores (light blue line)
It is however also important to see the single standout in order to illustrate howdeep, widespread and painful the end of 2018 was for US equity investors, no stockin the index has yet reached a new 52-week high in 18 trading days, the longeststretch on record.
Equity valuation (dark blue line) vs. Credit valuation (light blue) vs. Bond (orange)
We are therefore not surprised to have seen the rally we got since the close of the24th of December as positioning and sentiment has changed too quickly andreached an extreme.
Cyclicals and the most battered stocks have outperformed (mainly for shortcovering) the Defensive names in a 4x standard deviation move.
The S&P has bounced more than 10% in 3 weeks, Eurostoxx +5%, Nikkei +6%,China +4.5% and, typical to Bear market rallies, we have gone from extremelyoversold to overbought. The McClellan Oscillator, a measure of the market breadth,hit a level not seen since the depth of the financial crisis for the US market, morethan 3 standard deviations away from its mean.
Days without a stock trading at a 52-week high (orange)

Investors have become more concerned about a possible recession in recentmonths, as financial conditions have tightened and growth has slowed.
If we use statistical models introduced by Fed researchers to translate two marketmeasure, the slope of the yield curve and credit spreads, into a market-impliedrecession probability. Both measures now indicate sharply higher recession riskthan a few months ago and combining the two suggests that the market sees aroughly 50% chance of recession over the next year.
Slope of the Yield curve now points to a sharply higher recession risk within a year.
5
Market Analysis
The performance of industrial metals over the past months suggests thatcommodity markets price in around a 56% chance of a typical US recession, in linewith US HG, UST and US equity markets.
Therefore, considering the signals given by the different asset classes wehave a 50/55% chance of a US recession within a year compared to just 5%only few months ago.
0-6 Quarter spread (blue line) vs. 10y-3m spread (red line)
Q4 Earning Season
Looking at different asset classes, a 55% chance of a US recession is reflected intoday’s level of US HG corporate credit spread. Similarly, the recent 70bps fall in 5-year US Treasury yields from their early November peak points to two thirdschance of US recession on our assessment.
This week has started the US Q4 reporting season and Europe will follow over thenext days. The biggest concentration of US numbers is on the week starting the 28th
of January.
Q418 S&P500
% Market Cap Reporting Each Week

Ahead of this earning season, negative forward signaling risks appear heightened,especially following recent cuts / negative outlook from several companies (Apple,Fedex, Micron, Medtronic, Macys..). There may be more cuts ahead, and it’spossible that beats are not so prevalent this season.
US 4Q EPS is projected to grow +13%, the lowest YoY growth rate in 4 quarters.Revenue growth is just 4%, which would be the lowest growth rate in two years ifunchanged by the end of the reporting season.
S&P YoY EPS growth is peaking.
6
Market Analysis
S&P500 YoY EPS Growth (blue line) vs. EPS Beat (yellow)
S&P500 Earning Revisions Breadth
S&P earning revisions breadth has plummeted.
What will be important is the guidance and we suspect that it might not be easy forcompanies to have a clear idea of the future business with the current geopoliticalenvironment. At the end of Q3, 33 out of 103 companies have provided positiveguidance for 4Q18 with Negative to Positive ratio being 2.12x, slightly higher (morenegative) than what was observed in earlier quarters of 2018. We might get even ahigher number this quarter.
Another interesting point to be discovered is given by cost pressures which is notjust limited to US wages. Labor cost growth is now at or above 2% in Germany,France and Italy. In addition to wages/labor costs, companies are also facing highercosts from rising input prices, transport costs and raw materials prices too, and anumber of company earning releases/trading statements in the last few weeks areincreasingly citing these as important headwinds for their future margins/earningsoutlook.

According to the NFIB survey, the percentage of small firms in the US planning toraise worker compensation is at a record high.
7
Market Analysis
NFIB survey - % of firms planning to raise worker compensation
Citigroup Earning Revision (black line) vs MSCI World
The bulls will now tell you that European shares are cheap: the forward one-yearprice-earnings ratio has plunged to near the lowest since 2013.
With the recent market correction, analysts have been steadily cutting theirestimates and you can see over this chart the entity of this move.
Eurostoxx 600 12-month forward P/E

We have been calling for some market volatility since the month of October and theUS started to unfold on Growth / Tech sectors as we were anticipating.
We entered the year with a non-consensus cautious view and worries over thepotential Yields rally and hawkish Fed. Now, the market has drastically changedopinion and is forecasting a potential US recession before the end of the year.
This has been one of the most painful periods for global equity investors inmany years, not only because of the size of the correction but also becauseof the significant impact it had on a wide range of investor portfolios.
All this damage occurred when interest rates in Europe and Japan are still negativeand the Fed is only trying to reverse QE and lifting 2% Fed funds. The QuantitativeTightening has barely begun and markets have already shown how vulnerable theyare.
Central Banks are not the only problem but it is clear how the global bubble wasinflated by QE.
The combination of rate hikes and balance sheet reductions from the FederalReserve in 2018 sucked up global U.S. dollar liquidity and put emerging marketsunder immense pressure in 2018. Emerging market equities were 20-30% lowerfrom February through October, then the S&P played catch-up to the downside.This, combined with tariffs from the White House, has placed global manufacturingin a significant slowdown that has begun to circle back into the United States.
8
Executive Summary
FED balance sheet (black line) vs S&P500 (orange)
The driver to market movement is not valuations but rather the degree of thesystem’s liquidity condition.
Valuations generally don’t matter much when liquidity is injected and expandingprice- earning ratios don’t end bull markets but when markets perceive a drying upin liquidity or central bankers pivot, as in late 2018, markets suffer.
In Q4 2017 the combined asset purchases of the Fed, European Central Bank(ECB) and Bank of Japan (BOJ) were $100 billion per month. The total dropped tozero in late 2018 and this quarter will turn negative, to withdrawals of roughly $20billion per month.
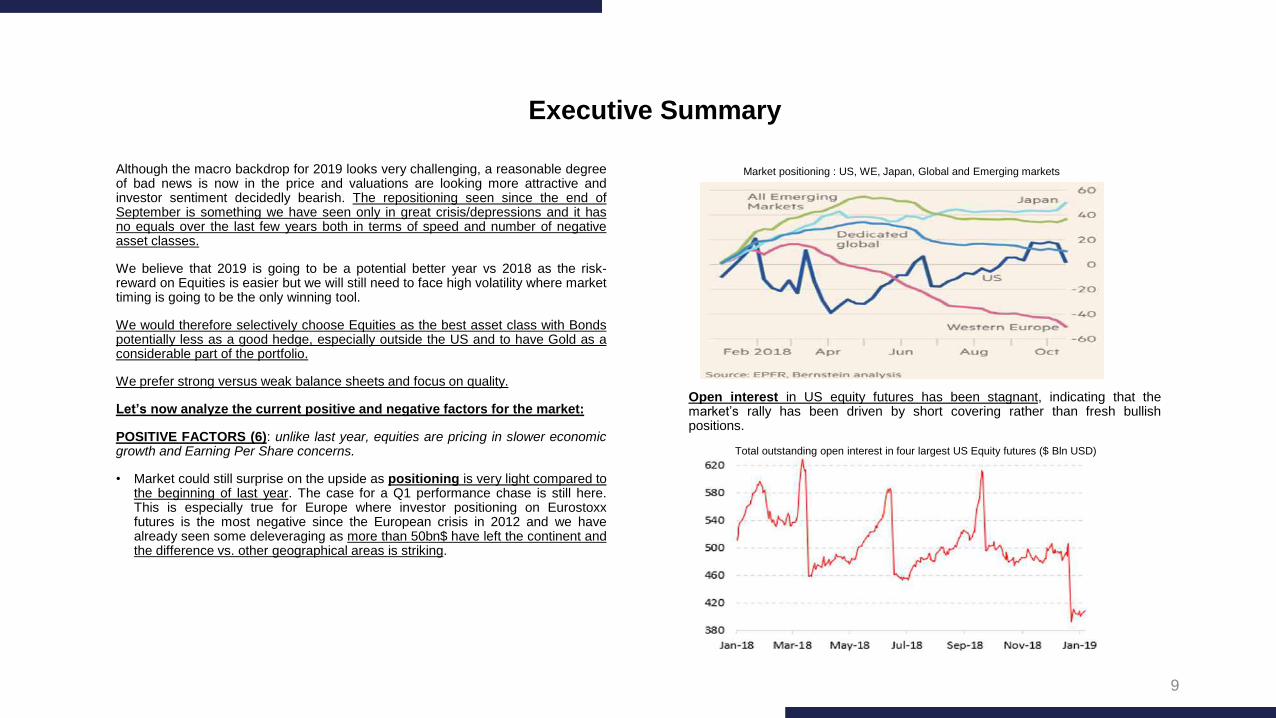
Although the macro backdrop for 2019 looks very challenging, a reasonable degreeof bad news is now in the price and valuations are looking more attractive andinvestor sentiment decidedly bearish. The repositioning seen since the end ofSeptember is something we have seen only in great crisis/depressions and it hasno equals over the last few years both in terms of speed and number of negativeasset classes.
We believe that 2019 is going to be a potential better year vs 2018 as the risk-reward on Equities is easier but we will still need to face high volatility where markettiming is going to be the only winning tool.
We would therefore selectively choose Equities as the best asset class with Bondspotentially less as a good hedge, especially outside the US and to have Gold as aconsiderable part of the portfolio.
We prefer strong versus weak balance sheets and focus on quality.
Let’s now analyze the current positive and negative factors for the market:
POSITIVE FACTORS (6): unlike last year, equities are pricing in slower economicgrowth and Earning Per Share concerns.
• Market could still surprise on the upside as positioning is very light compared tothe beginning of last year. The case for a Q1 performance chase is still here.This is especially true for Europe where investor positioning on Eurostoxxfutures is the most negative since the European crisis in 2012 and we havealready seen some deleveraging as more than 50bn$ have left the continent andthe difference vs. other geographical areas is striking.
9
Executive Summary
Market positioning : US, WE, Japan, Global and Emerging markets
Open interest in US equity futures has been stagnant, indicating that themarket’s rally has been driven by short covering rather than fresh bullishpositions.
Total outstanding open interest in four largest US Equity futures ($ Bln USD)

• Seasonality: January tended to be strong both in US and Europe.
10
Executive Summary
As a result of the market turbulence we’ve seen throughout Q4 2018,fundamental valuations of European equities have reduced further and Europecontinues to look cheap relative to global regions. For example:
• The 12-month price to earning ratio has reached 11.9X (last lower in mid-2013).
• The 12-month forward dividend yield on MSCI Europe of 4.4% represents a6-year high.
• The Shiller Price/Earnings for MSCI Europe is below the long run median forthe first time in 2 years.
• Central Banks (positive view): still accommodative, with US real policy ratesnear zero.
Core inflation shows little signs of accelerating in recent months. Just over amonth ago the market was pointing to a quarter-point hike in 2019, but it’s nowfactoring in a more than 50% chance of a reduction this year. That’s in starkcontrast to the median projection of two increases projected by Fed officials lastmonth. On top of that, traders are now fully pricing in a cut by April 2020.
US Consumer price Index ex food and energy
Median MSCI World performance vs. Median MSCI Europe performance
• Q1 earning season could eventually surprise on the upside in terms of numbersgiven the sudden repositioning of the consensus. We would however pay moreattention at the future guidance.
• Equity valuations start to look compelling now and the gap between Europe’sdividend yield and Government bond yields is at 4.1%, the highest on record.
Stoxx Europe 600’s dividend yield minus 10-year German bund yield (black line)

In his latest statement Powell reinforced likelihood of pausing interest rate hikeafter assessing signals about potential downside risks from financial marketsand China Macro data. In terms of monetary policy, Powell emphasized thatpolicy is not on a “preset path” and the Fed is prepared to adjust policy flexibly.
The yield curve has flattened, but crucially, stocks have never peaked before theyield curve inverted. One typically doesn’t see a slowdown without HY creditspreads widening materially.
Encouragingly, the US Yield curve might have stopped flattening and as Fedseems to have paused, the chance of “policy mistake” reduces.
11
Executive Summary
NEGATIVE FACTORS (13): unfortunately, still largely outpacing the positivefactors.
• We see limited risk that global economic momentum will re-accelerate here, asthe year-on-year comparisons get tougher in the coming months and increaseduncertainty around trade and tariffs will continue to weigh on activitygoing forward.
Rising US trade policy uncertainty has already weighed on global equity fundflows this year as shown on chart.
US cycle is 10 years old, Current expansion has reached 112 months.
Cumulative 3M Equity Fund Flows Globally ($Bn) (dark blue)
US Trade Policy Uncertainty Index Inverted (light blue)
• Buyback activity is expected to increase significantly going forward after theblackout period given by the Q4 reporting season. Just a note on Apple as it is astriking example of what has happened. Apple has reduced the existing numberof shares by 25% from 2012. In 2018, thanks to the Tax Reform, they have spent100bn$ for the buyback with a current mark to market loss of 8bn$. Given themagnitude of cash generated, they could continue to spend 20bn$ on buybackper quarter… not bad considering that it was the biggest company in the Worldby market cap until 3 month ago (now it’s the 4th).
US 10-2 year Yield Curve in bps (black line)
• Central Banks (negative view): Global monetary policy is set to (gradually)tighten further as the Fed continues to lift rates (at a reduced pace) and the ECBis at the end of its bond purchase program. Tighter financial conditions ingeneral increase the pressure on the 'weaker links in the chain' and the chancethat we see higher volatility. Credit spreads should slowly widen, unhelpful forequity valuations.
12
Executive Summary
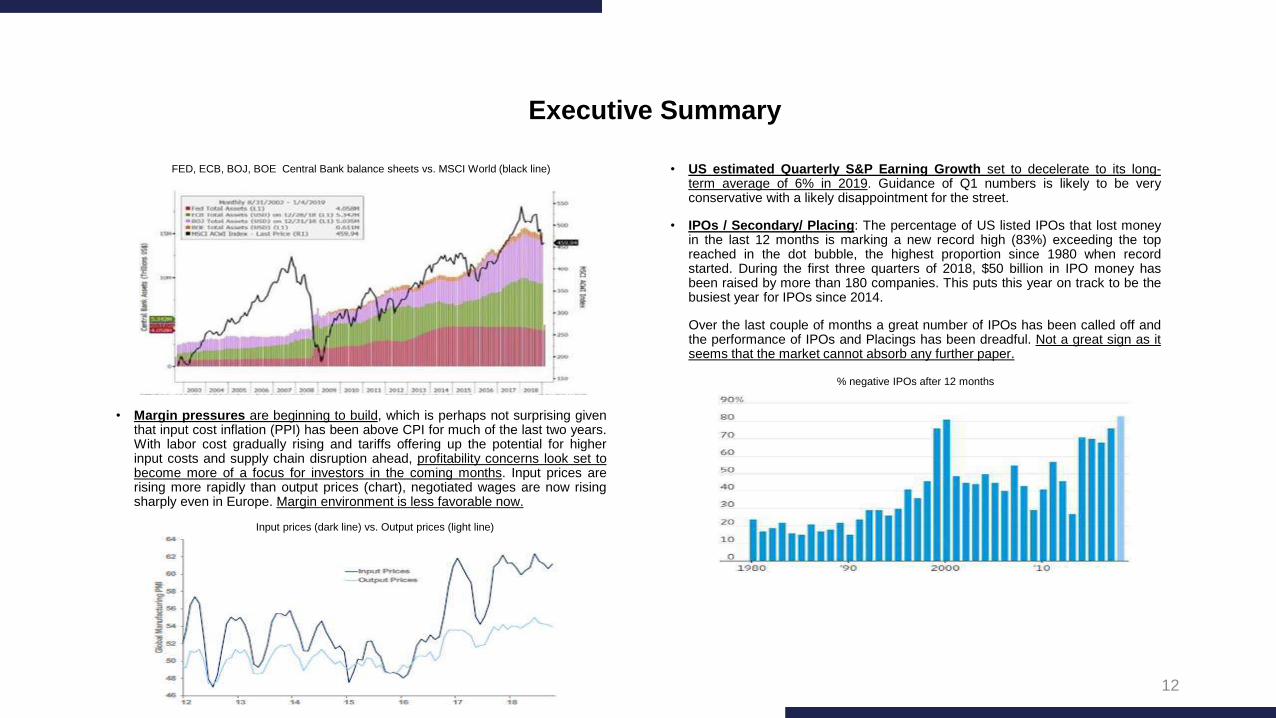
• US estimated Quarterly S&P Earning Growth set to decelerate to its long-term average of 6% in 2019. Guidance of Q1 numbers is likely to be veryconservative with a likely disappointment for the street.
• IPOs / Secondary/ Placing: The percentage of US listed IPOs that lost moneyin the last 12 months is marking a new record high (83%) exceeding the topreached in the dot bubble, the highest proportion since 1980 when recordstarted. During the first three quarters of 2018, $50 billion in IPO money hasbeen raised by more than 180 companies. This puts this year on track to be thebusiest year for IPOs since 2014.
Over the last couple of months a great number of IPOs has been called off andthe performance of IPOs and Placings has been dreadful. Not a great sign as itseems that the market cannot absorb any further paper.
% negative IPOs after 12 months
• Margin pressures are beginning to build, which is perhaps not surprising giventhat input cost inflation (PPI) has been above CPI for much of the last two years.With labor cost gradually rising and tariffs offering up the potential for higherinput costs and supply chain disruption ahead, profitability concerns look set tobecome more of a focus for investors in the coming months. Input prices arerising more rapidly than output prices (chart), negotiated wages are now risingsharply even in Europe. Margin environment is less favorable now.
FED, ECB, BOJ, BOE Central Bank balance sheets vs. MSCI World (black line)
Input prices (dark line) vs. Output prices (light line)
13
Executive Summary
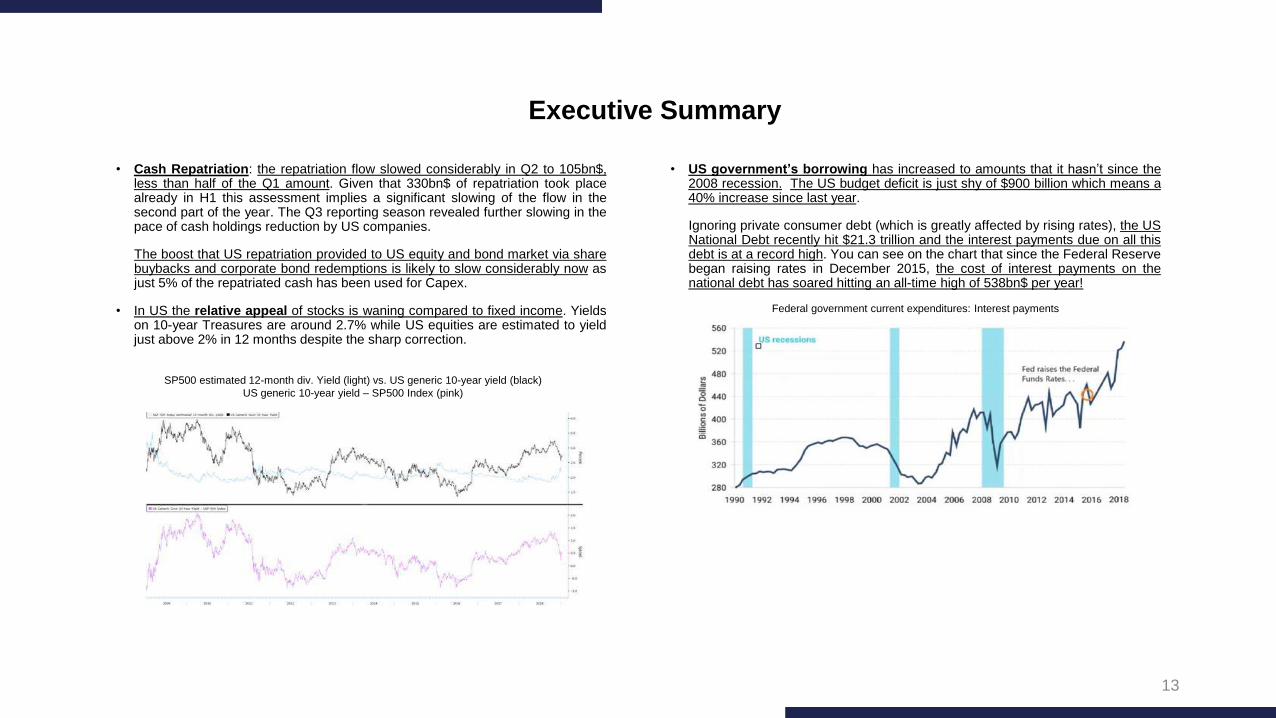
• US government’s borrowing has increased to amounts that it hasn’t since the2008 recession. The US budget deficit is just shy of $900 billion which means a40% increase since last year.
Ignoring private consumer debt (which is greatly affected by rising rates), the USNational Debt recently hit $21.3 trillion and the interest payments due on all thisdebt is at a record high. You can see on the chart that since the Federal Reservebegan raising rates in December 2015, the cost of interest payments on thenational debt has soared hitting an all-time high of 538bn$ per year!
SP500 estimated 12-month div. Yield (light) vs. US generic 10-year yield (black)
US generic 10-year yield – SP500 Index (pink)
• Cash Repatriation: the repatriation flow slowed considerably in Q2 to 105bn$,less than half of the Q1 amount. Given that 330bn$ of repatriation took placealready in H1 this assessment implies a significant slowing of the flow in thesecond part of the year. The Q3 reporting season revealed further slowing in thepace of cash holdings reduction by US companies.
The boost that US repatriation provided to US equity and bond market via sharebuybacks and corporate bond redemptions is likely to slow considerably now asjust 5% of the repatriated cash has been used for Capex.
• In US the relative appeal of stocks is waning compared to fixed income. Yieldson 10-year Treasures are around 2.7% while US equities are estimated to yieldjust above 2% in 12 months despite the sharp correction.
Federal government current expenditures: Interest payments

14
Executive Summary
All of this debt has fueled a short-term bubble of relative “prosperity” butmeanwhile all of our long-term problems just continue to get worse.
Deutsche Bank has calculated that since US QE began, 14trn$ in monetary andfiscal spending has created about 13mln jobs, that’s a cost of 1mln$ per jobcreated!
• Abnormal Libor-Euribor spread: London Interbank Offered Rate known asLibor is spiking to new highs. Libor reflects what banks charge to borrow dollarsfrom each other and is used as a benchmark for trillions of dollars’ worth ofloans. The increase is seen as a further indicator of tightening financialconditions showing that corporate costs are experiencing a much furtherincrease in interest rates than Fed funds.
Quantitative Tightening
Effective marketable supply (purple) vs. Budget deficit (grey)
The ratio between the US budget deficit (grey on chart) and the Treasuryissuance (purple) poses substantial risks as they are going to issue 1.3trn$ thisyear and the unbalance has never been that great!
Remember that US is taking in less tax revenue because of Trump’s tax cutsand the Treasury will have to borrow new debt just to pay off maturing old debtand interest. Short term interest costs will continue to rise over the near-termbecause of 3 reasons: higher inflation, Fed tightening, and the increased amountof debt needed by the Treasury.
• Junk Bonds: They crashed really hard just before the financial crisis of 2008,and they started to fall again in October. A full-blown junk bond panic woulddefinitely be a very clear sign that a major market crash is imminent. We are inthe terminal phase of the biggest debt bubble in human history. In fact,total indebtedness in the United States has increased by more than 2trillion dollars over the past 12 months…
3m Libor – 3m Euribor (black line)

15
Executive Summary
The only homebuilder sentiment 2-month rate of change dropped faster than thelast two months reaching the level only seen after the 11th of September 2001!
• Declining US House Prices: US Housing data are continuing to surprise on thenegative side.
The University of Michigan Home-buying conditions are currently the worst sinceLehman… and supply is soaring.
US Homebuilder sentiment Index
New Home months supply Index
UMich Home-buying conditions Index
• Market liquidity continues to drop and we have seen in December how can thisaffect markets when there is the need to sell.
Looking at some statistics helps to understand the entity of this factor. Currentaverage of US S&P futures is 66% below the 2018 average and 85% below theaverage since December 2015. US 10Y futures are trading 31% below 2018average. WTI crude futures are trading 25% below the 2018 average and 48%below the average since March 2016.
• According to the recent data in the US, stocks now make up an increasingportion of household wealth and has overtaken real estate for the firsttime. Furthermore, not surprising, growth in household wealth has been highlyuneven for the last 10 years. Bottom income earnings have recovered a lot lessrelative to the top 10% of earners.

16
Executive Summary
The most worrying points to monitor short-term are possibly the CreditSpreads and US corporate debt.
Even before we see any further widening in credit spreads, corporates arealready facing a very hefty increase in their cost of capital. The chart shows thatthe increase in US corporate bond yields relative to their trailing 5-year averageis at its highest level since the early 1980s (if we exclude late 2008, when defaultrates were spiking).
Face value by bonds by rating
US recession (light area) % change in US BBB yields vs. 5Y avg. In bps (blue line)
The Q4 pace of downgrades from A into BBB territory is the largest since thelate 2015 wave of commodity related fallen angels.
Morgan Stanley has recently calculated that 31% of all US BBB bonds have adebit that the is 4-times higher than their equity level and if we would only look atthe financial leverage, 55% of these corporates would have been alreadydowngraded to junk.
Markets could therefore soon face a “tsunami of junk rated debt” as about half of5trln$ market for investment-grade bonds now resides in the lowest tier ofratings prone to a downgrade to junk.
As we have seen above, the cost of debt (Libor) relative to corporate earnings ison the rise and is at the highest level since 2008.
US nonfinancial corporate debt is at its all-time high and average credit ratingsof IG debt have fallen sharply. Corporates have shown little inclination to reducedebt despite strong earnings (+25% yoy in Q3), whilst an estimated USD5.6trndebt matures by 2023.
Over the last few years, yields on bonds with triple-B credit ratings (the lowestscore, still considered investment-grade), have risen faster than those on saferdebt.

17
Executive Summary
The ratio of US corporate debt to GDP is on new all-time highs as shown on thechart.
Corporate Debt/GDP ratio (blue line) US previous recession (grey area)
Last week Fitch has warned of a possible cut to US AAA rating. The effect of apotential downgrade would generate a tremendous selling pressure.
The credit bear market in the US, which began in early 2018 due to weaker flowsand tighter liquidity conditions, will continue in 2019 given decelerating US growth,restrictive Fed policy and weaker corporate EPS growth.
Even European credit markets are likely to see further spread widening in 2019 asgrowth moderates and ECB QE ends. BBB ratings represents more than 50% of IGvolumes in Europe and the largest 25 BBB names account for 26% of IG Index.
The European market has nearly locked up over the last month with many loan-deals scrapped. The junk bond market, whether in loans or bonds, has traded verylittle with fund managers refusing to fund buyouts and investors shunning high-yieldbond sales as rising interest rates and market volatility weigh on sentiment.
In US we had in December the first month since November 2008 where not a singlehigh-yield bond priced on the market.
Investors have withdrawn nearly 13bn$ from US leveraged loan funds during thepast 6 weeks, the CLO (Collateralized Loan market) has traded very little inDecember.
Oil price has been an additional unwelcome negative factor as it is clearly acomponent of the High Yield widening.
We would therefore recommend to have a close look at Credit markets alsoas a proxy for Equites risk-premia (Credit didn’t have a single uptick despite theequity bounce we had at the end of November) and we would start 2019 with aswitch into better-rated credits.
US personal interest payments have soared to a new all-time high exposingeven more the consumers to a recession.
Personal Interest Payments (Non-Mortgage) $Bln SAAR

18
Macro
United States
• Growth is gradually slowing. Q4 GDP is currently tracking 2.2/2.6% range downfrom 3.5/4% range seen in the summer and Q3.
• December CPI in line with forecast, -0.1% MoM. Core PCE inflation at 1.9% YoYand unlikely to rise significantly for at least the next several months. This impliesa pause in the rate hike process until conditions have settled down.
• The December ISM manufacturing index showed its largest one-month decline, -5%, since 2008. Whilst business surveys are not direct inputs into GDP, thisdeterioration has contributed to the view that recession risk has increased.However, we have to considerations: a) the ISM index fell from an elevated leveland its current level is still consistent with above trend growth b) manufacturingsurveys are more sensitive to moves in equities, oil prices and foreign growth.
• The ISM factory index decline has been exceeded just twice this century, bothtimes during recessions: in the financial crisis a decade ago and following theSept. 11, 2001, terror attack.
ISM Index monthly change
ISM Index monthly change
• PMI China (importation component) in green and US ISM Manufacturing (black),the correlation is striking, the trade war has a high cost on the US Manufacturing
PMI China (green) vs. US ISM manufacturing (black)

19
Macro
• The December job growth beat was the largest of the cycle, up 312k exceedingexpectation by 128k. Since job growth tends to lag output by 2-3 months, wethen expect a slowdown this quarter following the deceleration in businesssurveys.
• Major types of U.S. economic data, “hard” nationwide reports and “soft” smaller-scale surveys, are simultaneously missing expectations for the first time duringTrump’s presidency, suggesting momentum that once spurred economic growthis transforming into pessimism.
Europe
• Growth is gradually slowing. Further weakness with flash EU PMI droppinganother 1.4% to 51.3, the lowest level in five years. Germany GDP growth isexpected to decelerate from 1.9% in 2019 to trend rates of around 1.2% by2022. German industrial production down by 1.9% MoM in November againstexpectations of a slight increase, extending a run of disappointing data.
Economic Surprise Index (excl. survey data) on 12/28/18 (black line)
Economic Surprise Index (incl. survey data) on 12/31/18 (blue line)
S&P500 Index (purple line)
German Industrial production index
• The Italian Economy decreased 0.1% in 3Q, on the verge of recession ascompanies see demand plunging, manufacturing contracting and export demandfalling. In December, Industrial production decreased by 1.6% againstexpectations of -0.3%. So far, all data are pointing to another quarter of negativegrowth.
20
Macro
• On the flash estimate, Euro area annual core HICP inflation was +0.97% inDecember, averaging +1% in 2018, unchanged from 2017. Euro area annualheadline HICP inflation fell to +1.58% in December after +1.95% in November.Country-level flash estimates showed German, French, Spanish inflation fallingin December.
China
• Growth is gradually slowing; 2019 Real GDP growth is currently tracking 6.0%-6.3% range. Some soft Macro in December such as NBS and Caixinmanufacturing PMI down to 49.4 and 49.7, respectively, the lowest sinceFebruary 2016 and May 2017. In addition weak China December trade data withExports -4.4% (vs. exp +2%) and Imports -7.6% (vs exp. +4.5%) due to tradewar and global slowdown. China is not focusing on growth anymore but ratheron unemployment as social stability is the main concern. There are largepockets of unemployment in the coastal eastern regions. Current measure inplace: lower VAT for consumer goods, lower tax for SME companies, increasinginfrastructure expenditures, and lowered the RRR (Required Rates Ratio) forbanks in order to force them to lend more.
Trade war: US officials expect China’s top trade negotiator may visit Washingtonthis month, signaling that higher-level discussions are likely to follow this week’stalks with mid-level officials in Beijing, as both sides expressed optimism thatprogress had been made. Although we still have no conclusive outcome, webelieve a trade truce would be a win-win situation considering the looming globalslowdown.
US Politics: The current government shutdown is the longest in US history. A rowwith Democrats over funding the wall on the Mexican border has left thegovernment partially shut down for 20 days, leaving some 800,000 federalemployees unpaid. Although the wall construction is critical in Trump’s campaign,we believe an agreement is likely to be found soon.
Brexit: Parliament continues to debate May’s apparently doomed Brexit deal, withspeculation mounting that exit day will be delayed beyond March 29. ForeignSecretary said on Friday he believes Parliament won’t stand for no-deal Brexit. It’smuch more likely that politicians will try to stop the U.K. leaving without anagreement. MPs will vote on PM May’s deal for the first time on the 15th of Jan. Weexpect the deal to fail in the first instance, but for a close variant of the deal toeventually pass. The risks around our central view have been shifting however. Wenow see the risks to our base case skewed towards a later, softer Brexit, or none atall.
Italy: the approved budget law for 2019 in December, allows the government topursue a smaller fiscal expansion (2.04%) in 2019 than previously planned. Someimportant reforms such as the universal guaranteed income and the pensionscheme have been cut versus earlier forecast, although their related law decreeshave not been submitted to Parliament yet. However, as already discussed, webelieve that a) government’s growth forecasts are too optimistic b) the approvedbudget law for 2019 is unlikely to provide a strong boost in demand growth, reboundin consumer and business confidence c) the government deficit/GDP ratio is likelyto be higher for the next years due to Macro environment, Central banks tightening,higher interest rate expenses, lower real GDP growth rate and government inabilityto sell asset (privatize) worth 1% GDP as planned d) strong political instability beingthe economic and social agenda of the two parties wide.
Geopolitics

21
It seems the USD has lost some of its safe currency appeal due to an unexpectedFed’s dovishness, slightly positive improvements on Trade-War and some concernsabout the US debt. The CNY has continued to appreciate since the beginning ofDecember and the EUR has attempted to break 1.15 for the first time in 3 months.
The DXY Dollar Index is down 1.7% since last update, net speculative positioninghas started to decrease while the DXY index has gone back to the trading range wehad since June last year.
Main factors for a weaker USD:
• US growth peaked in Q2 an annualized rate of 4.2% and is likely slowing downfrom here (sectors sensitive to funding costs, such as housing and autos, haveall slowed). Weakening liquidity conditions, tightening, rates, weakening US dataetc. Warning signals of a potential significant decline in the USD are flashing,with foreign investors no longer steering funds into long-term USD-denominatedassets. It seems the trust of investing in US assets for the long-term strategy hasdeclined.
• Short-term fiscal stimulus running out of steam.
• US corporate leverage.
• Relative inflation may soon start to support a higher EUR/USD exchange rate.
Forex
Bloomberg Dollar Spot (black line) vs. US dollar net long-short positions (dotted)
The optimism on USD is therefore slowly changing but as you can spot from thechart it is still a consensus long.
As said over the last two newsletters, we are calling for a very limited USD upsidefrom here if not a proper downside.
EUR/USD currency (blue line) vs. Core Inflation difference ( blue light line)

22
• The Eurozone current account surplus has increased materially over the last fewyears, driven by Germany. This, coupled with the upcoming unwinding of QE bythe ECB, will likely support a rising euro over time.
The Blomberg commodity Index is 4.5% above our last update and still 13% belowthe highs made at the end of May.
Oil prices have dropped a further 2% since last update and more than 32% from thehighs made on the 3rd of October (WTI was down 43% from peak to the 24th ofDecember). We have called the profit taking at the beginning of October and thelast time we suggested to start getting back into the sector.
OPEC production fell by the most in almost two years in December impacted bydrops in Iran (sanctions) and Libya (protests). Importantly they have decided on the7th of December to cut oil production by a further 1.2mln bpd.
Oil was a consensual long position in October and after losing for 3 months in arow, Managed Money’s net long position (as a % of open interest) across thehydrocarbon futures complex is now just 5% of total open interest!
Since the beginning of the year flows have been mixed as showed on chart.
Forex
US and German 10-Year yield differential
• Global tensions caused by economic sanctions and trade conflicts triggered byWashington have forced targeted countries to take a fresh look at alternativepayment systems currently dominated by the US dollar.
This is especially true for China (trying to internationalize its own currency, theyuan, which was included in the IMF basket), India (6th largest economy,switching to ruble for payment to Russia and other currencies for main tradingpartners), Iran (finding alternative USD payments for oil exports) and Russia.
WTI price Index (black line) vs. Managed Money’s positioning (blue histogram)
Commodities

23
Gold has bounced 4% since last update (+9.5% from the lows at end ofSeptember) and after breaking 1250$ is approaching the 1300$ level. This wasfunction of the risk-off mode on markets.
Over last update we suggested that a short squeeze was very likely and the Fedlatest stance has also helped the bounce.
Positioning is still mainly short with Central Bank, Governments and consumerdemand on the buyside.
We estimate that $10 billion of new longs (equal to 8.5% of total open interest) hasbeen established in Gold futures over the last 30 trading days. This 30-day build innet longs in Gold futures is the largest we’ve seen since February 2018.
Most of the rebound has come from short-covering, not adding longs.
Gold is also positive correlated to the US deficit, the chart shows the Gold movealong with the US deficit ratio to GDP.
Gold is the only real money that has survived throughout history. Current economic,financial and geopolitical risk is unprecedented. Physical gold is the ultimateinsurance against these risks and should form the solid foundation ofinvestors’ wealth pyramid.
We would therefore strongly suggest to keep and gradually increase theportfolios with some precious metals assets.
US Budget as % of GDP on 11/30/18 (white line) vs. Gold price (yellow line)
Commodities

24
Long Dax in relative terms: Germany’s stock market was one of the worstperformers in 2018 being down 18.3% Ytd, underperforming the Eurostoxx 600 bymore than 5%.
• German companies have been hit by a combination of the following factors:
• Trade tensions: DAX is the European index with the highest beta to world tradegrowth and ranks just after MSCI EM and the Topix.
• EM slowdown: German companies generate about 30% of their sales from EMand Asia-Pacific.
• Regulation: The European Auto sector has taken a big, but probably temporary,hit from changes in environmental rules. Since July, car registrations in the Euroarea have fallen 25%, and the auto dependent German manufacturing PMI hasdropped by nearly 5 points, underperforming its peers significantly.
While these factors are not going to change in the short-term, we believe that themarket is discounting some degree of the above uncertainties as has fallen morethan periphery did and could recover something in the short-term.
We had a negative November Industrial Production data last week but the broaderdataflow remains consistent with a moderate growth in Germany. This year we willget a growth’ boost from the fiscal policy and strong wage gains should continue tosupport household income.
DAX has lagged, and it is getting attractive, especially as € lost 4.5% in 2018, DAXvaluations are near the lows of the range…
Interesting to see how 12-month Forward EPS is correlated to growing Germanexports.
Current Investment Ideas
DAX 12M Forward P/E relative to MSCI Eurozone
DAX 12m Forward EPS (black line) vs. German exports (light line)

25
The Auto sector is the most oversold in recent years in relative to Europe(EV/EBITDA).
The majority of this sell-off can be attributed to:
• trade tensions between the US and China.
• a weakening of the growth narrative, which has seen global growth decline.
• disappointing data from China, as policymakers have resisted a broad stimulus.
Recent commentary on trade tensions/Chinese growth / stimulus has been morepositive.
Miners are likely to have EPS upgrades of 10% for ‘19 and 20% for ‘20, ifunderlying metal prices stay at current levels. Encouragingly, metal prices such asiron ore have been moving up recently, and the inventories of a number of metalsare near multiyear lows.
Iron Ore pushing higher.
Current Investment Ideas
Autos EV/EBITDA vs. relative to Europe (black line)
Long Miners (SXPP Index): The European SXPP Miner Sector has sold off overthe last 6 months, on trade concerns, global growth slowdown and disappointingChina data.
Having risen 8% over the first six months of 2018, the SXPP has fallen materiallyand has closed 2018 down 16.3% dropping nearly 23% from the highs made in Maywhen the street was consensually positive.
Iron Ore price ($)

26
The sector is attractively valued as is trading outright cheap relative to the overallmarket on EV/EBITDA metric.
Current Investment Ideas
5-year range (light area) vs. 5-year average (blue line) vs. 2018 Base metals
inventory (black line)
Miners are also a good hedge on rising inflation, with the second highest positivecorrelation to inflation forwards, at the sector level.
Miners are a play on China improving, easing trade concerns, USD peaking, are aninflation hedge and offer much stronger cash flow generation and balance sheetsthan before.
Chinese activity stabilization, lower inventories and potential for a rebound incommodity prices make the sector an attractive investment.
Metal & Mining EV/EBITDA relative to Europe (black line)
Inventories of key metals are at multi-year lows.

Keep in
touch
HERON Asset Management SA
Via Clemente Maraini 39, P.O. Box
CH - 6902 Lugano (Svizzera)
T +41 91 910 17 90
F +41 91 910 17 91
www.heron.ch
Disclaimer
For information purpose only by Heron Asset Management. The information herein is not intended
as a solicitation or an offer to buy or sell any securities or related financial instruments. Past
performance is not a reliable indicator of future results. Commissions and costs have a negative
impact on the prices quoted. If the currency of a product or a financial service is different from your
reference currency, the return can increase or decrease as a result of currency fluctuations. This
information pays no regard to the specific or future investment objectives or financial situation or tax
nor to the particular needs of any specific final user. The information and opinions contained in this
document are provided by Heron Asset Management with no warranty and are for personal use and
information purposes only.