monthly oil price statistics
TRANSCRIPT
Oct/Sep Nov/Oct Dec/Nov 2017 19 Janu19 January 2018 13 Febru13 February 2018Oct/Sep Nov/Oct Dec/Nov 2017
DecembDecember
Next release:
December
13 February 2018
Date of publication: 19 January 2018 Monthly oil price statistics
TABLE OF CONTENTS
Page
Charts 1 Latest IEA monthly crude oil and oil product price changes 32 IEA crude oil import costs 43 IEA end‐use prices for selected oil products 44 Regional weights for IEA average end‐use prices 45 IEA end‐use prices for selected oil products ‐ by geographical groupings 56 US dollar exchange rate indices (2014=100) 5
Tables 1 IEA crude oil import costs 62 IEA end‐use total and ex‐tax prices for selected oil products ‐ latest month 73 IEA end‐use prices for selected oil products 84 IEA end‐use taxes for selected oil products 9
NOTES
Abbreviationscif cost of insurance and freight included
Sources1 Crude oil import costs are derived from the IEA's monthly survey of its member
countries.
2 Monthly oil products prices and taxes have been developed by the IEA Secretariat
using data extracted from the following sources, supplemented by tax information
supplied by national agencies:Canada ‐ Natural Resources Canada
France, Germany, Italy, Spain and United Kingdom ‐ European Commission's
Directorate‐General for Energy and the German Federal Ministry for Economic Affairs
and Energy
Japan ‐ Ministry for Economy, Trade and Industry's Agency for Natural Resources and United States ‐ US Energy Information Administration, US Bureau of Labour Statistics
The IEA Secretariat thanks all agencies concerned.
Please note that all IEA data are subject to the following Terms and Conditions found on the IEA’s website: http://www.iea.org/t&c/termsandconditions/
© OECD/IEA, 2018 2 International Energy Agency
Monthly oil price statisticsDate of publication: 19 January 2018
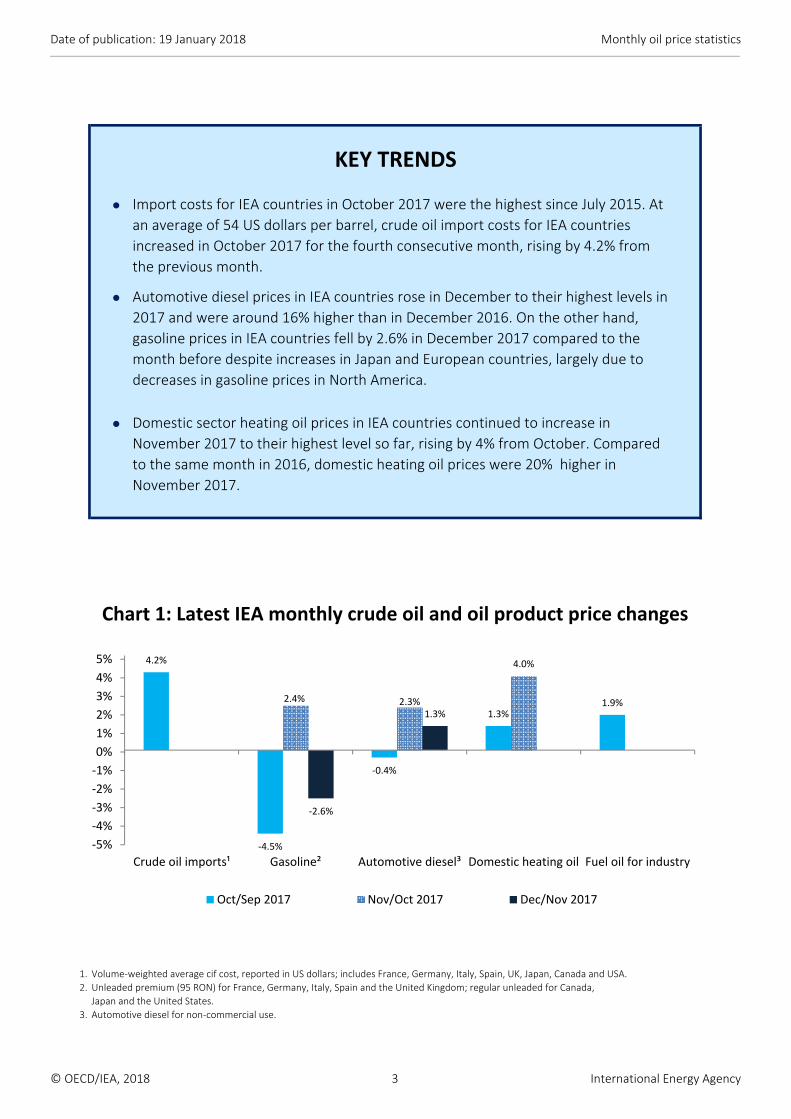
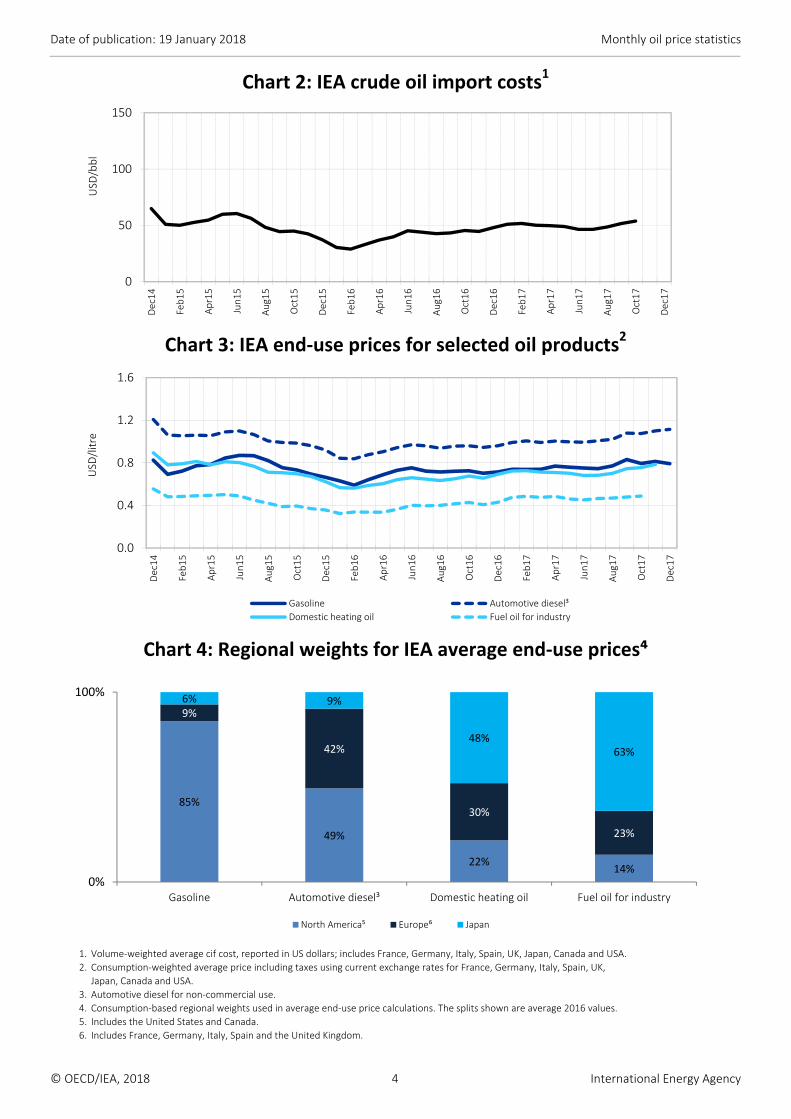
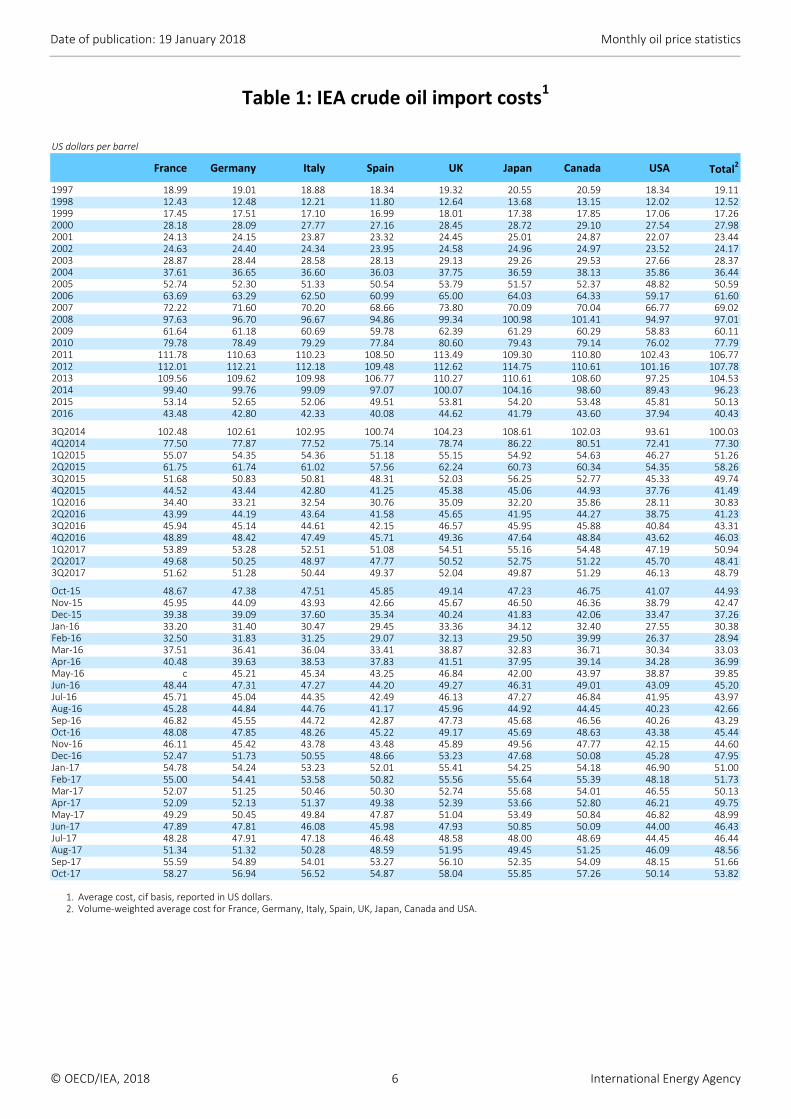
1. Volume‐weighted average cif cost, reported in US dollars; includes France, Germany, Italy, Spain, UK, Japan, Canada and USA.
2. Unleaded premium (95 RON) for France, Germany, Italy, Spain and the United Kingdom; regular unleaded for Canada,
Japan and the United States.
3. Automotive diesel for non‐commercial use.
KEY TRENDS
Import costs for IEA countries in October 2017 were the highest since July 2015. At
an average of 54 US dollars per barrel, crude oil import costs for IEA countries
increased in October 2017 for the fourth consecutive month, rising by 4.2% from
the previous month.
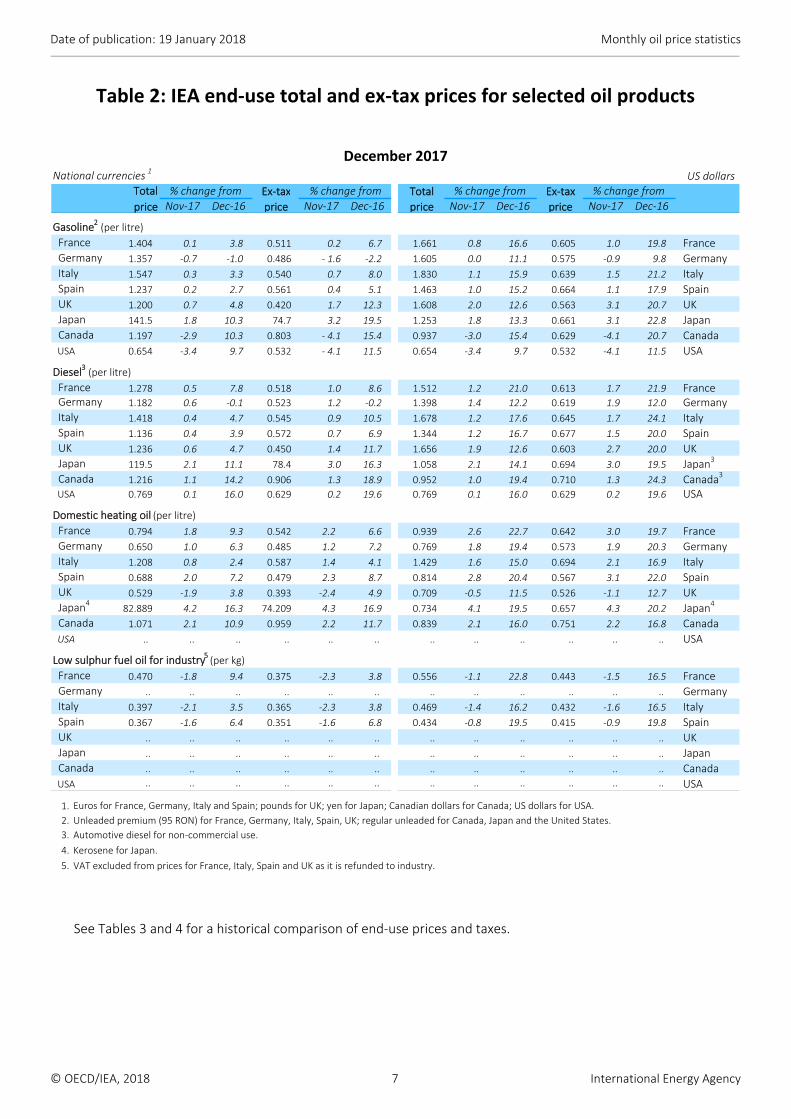
Automotive diesel prices in IEA countries rose in December to their highest levels in
2017 and were around 16% higher than in December 2016. On the other hand,
gasoline prices in IEA countries fell by 2.6% in December 2017 compared to the
month before despite increases in Japan and European countries, largely due to
decreases in gasoline prices in North America.
Domestic sector heating oil prices in IEA countries continued to increase in
November 2017 to their highest level so far, rising by 4% from October. Compared
to the same month in 2016, domestic heating oil prices were 20% higher in
November 2017.
Chart 1: Latest IEA monthly crude oil and oil product price changes
4.2%
‐4.5%
‐0.4%
1.3%1.9%2.4% 2.3%
4.0%
‐2.6%
1.3%
‐5%
‐4%
‐3%
‐2%
‐1%
0%
1%
2%
3%
4%
5%
Crude oil imports¹ Gasoline² Automotive diesel³ Domestic heating oil Fuel oil for industry
Oct/Sep 2017 Nov/Oct 2017 Dec/Nov 2017
© OECD/IEA, 2018 3 International Energy Agency
Monthly oil price statisticsDate of publication: 19 January 2018
1. Volume‐weighted average cif cost, reported in US dollars; includes France, Germany, Italy, Spain, UK, Japan, Canada and USA.
2. Consumption‐weighted average price including taxes using current exchange rates for France, Germany, Italy, Spain, UK,
Japan, Canada and USA.
3. Automotive diesel for non‐commercial use.
4. Consumption‐based regional weights used in average end‐use price calculations. The splits shown are average 2016 values.
5. Includes the United States and Canada.
6. Includes France, Germany, Italy, Spain and the United Kingdom.
Chart 2: IEA crude oil import costs1
Chart 3: IEA end‐use prices for selected oil products2
Chart 4: Regional weights for IEA average end‐use prices⁴
0.0
0.4
0.8
1.2
1.6
Dec14
Feb15
Apr15
Jun15
Aug15
Oct15
Dec15
Feb16
Apr16
Jun16
Aug16
Oct16
Dec16
Feb17
Apr17
Jun17
Aug17
Oct17
Dec17
USD
/litre
Gasoline Automotive diesel³
Domestic heating oil Fuel oil for industry
0
50
100
150
Dec14
Feb15
Apr15
Jun15
Aug15
Oct15
Dec15
Feb16
Apr16
Jun16
Aug16
Oct16
Dec16
Feb17
Apr17
Jun17
Aug17
Oct17
Dec17
USD
/bbl
85%
49%
22%14%
9%
42%
30%
23%
6% 9%
48%63%
0%
100%
Gasoline Automotive diesel³ Domestic heating oil Fuel oil for industry
North America⁵ Europe⁶ Japan
© OECD/IEA, 2018 4 International Energy Agency

Monthly oil price statisticsDate of publication: 19 January 2018
Automotive diesel 2 (Tax per Litre)
1. Consumption‐weighted average price including taxes. For the two most recent months, consumption is estimated using
growth rates for the same period of the previous year.
2. Unleaded premium (95 RON) for France, Germany, Italy, Spain and the United Kingdom; regular unleaded for Canada,
Japan and the United States.
3. Automotive diesel for non‐commercial use.
4. Includes France, Germany, Italy, Spain and the United Kingdom.
5. Includes the United States and Canada.
6. US dollar exchange rate indices are based on exchange rates from the OECD's National Accounts database.
An increase in the index indicates a strengthening of the currency compared to US dollars. Such fluctuations create differences
in price trends in US dollars compared to those in national currencies.
Chart 5: IEA end‐use prices1 for selected oil products
Chart 6: US dollar exchange rate indices (2014=100)⁶
0.0
0.5
1.0
1.5
2.0
2.5
Dec14
Mar15
Jun15
Sep15
Dec15
Mar16
Jun16
Sep16
Dec16
Mar17
Jun17
Sep17
Dec17
USD
/litre
Gasoline2
0.0
0.5
1.0
1.5
Dec14
Mar15
Jun15
Sep15
Dec15
Mar16
Jun16
Sep16
Dec16
Mar17
Jun17
Sep17
Dec17
USD
/litre
Domestic heating oil
Japan Europe⁴ North America⁵
0.0
0.5
1.0
1.5
2.0
2.5
Dec14
Mar15
Jun15
Sep15
Dec15
Mar16
Jun16
Sep16
Dec16
Mar17
Jun17
Sep17
Dec17
USD
/litre
Diesel3
0.0
0.5
1.0
1.5
Dec14
Mar15
Jun15
Sep15
Dec15
Mar16
Jun16
Sep16
Dec16
Mar17
Jun17
Sep17
Dec17
USD
/litre
Fuel oil for industry
60
70
80
90
100
110
120
Dec14
Feb15
Apr15
Jun15
Aug15
Oct15
Dec15
Feb16
Apr16
Jun16
Aug16
Oct16
Dec16
Feb17
Apr17
Jun17
Aug17
Oct17
Dec17
USD
exchange rate (2014=100)
Canadian dollar Euro UK pound Japanese yen
© OECD/IEA, 2018 5 International Energy Agency
Monthly oil price statisticsDate of publication: 19 January 2018
US dollars per barrel
France Germany Italy Spain UK Japan Canada USA Total2
18.99 19.01 18.88 18.34 19.32 20.55 20.59 18.34 19.1112.43 12.48 12.21 11.80 12.64 13.68 13.15 12.02 12.5217.45 17.51 17.10 16.99 18.01 17.38 17.85 17.06 17.2628.18 28.09 27.77 27.16 28.45 28.72 29.10 27.54 27.9824.13 24.15 23.87 23.32 24.45 25.01 24.87 22.07 23.4424.63 24.40 24.34 23.95 24.58 24.96 24.97 23.52 24.1728.87 28.44 28.58 28.13 29.13 29.26 29.53 27.66 28.3737.61 36.65 36.60 36.03 37.75 36.59 38.13 35.86 36.4452.74 52.30 51.33 50.54 53.79 51.57 52.37 48.82 50.5963.69 63.29 62.50 60.99 65.00 64.03 64.33 59.17 61.6072.22 71.60 70.20 68.66 73.80 70.09 70.04 66.77 69.0297.63 96.70 96.67 94.86 99.34 100.98 101.41 94.97 97.0161.64 61.18 60.69 59.78 62.39 61.29 60.29 58.83 60.1179.78 78.49 79.29 77.84 80.60 79.43 79.14 76.02 77.79111.78 110.63 110.23 108.50 113.49 109.30 110.80 102.43 106.77112.01 112.21 112.18 109.48 112.62 114.75 110.61 101.16 107.78109.56 109.62 109.98 106.77 110.27 110.61 108.60 97.25 104.5399.40 99.76 99.09 97.07 100.07 104.16 98.60 89.43 96.2353.14 52.65 52.06 49.51 53.81 54.20 53.48 45.81 50.1343.48 42.80 42.33 40.08 44.62 41.79 43.60 37.94 40.43
102.48 102.61 102.95 100.74 104.23 108.61 102.03 93.61 100.0377.50 77.87 77.52 75.14 78.74 86.22 80.51 72.41 77.3055.07 54.35 54.36 51.18 55.15 54.92 54.63 46.27 51.2661.75 61.74 61.02 57.56 62.24 60.73 60.34 54.35 58.2651.68 50.83 50.81 48.31 52.03 56.25 52.77 45.33 49.7444.52 43.44 42.80 41.25 45.38 45.06 44.93 37.76 41.4934.40 33.21 32.54 30.76 35.09 32.20 35.86 28.11 30.8343.99 44.19 43.64 41.58 45.65 41.95 44.27 38.75 41.2345.94 45.14 44.61 42.15 46.57 45.95 45.88 40.84 43.3148.89 48.42 47.49 45.71 49.36 47.64 48.84 43.62 46.0353.89 53.28 52.51 51.08 54.51 55.16 54.48 47.19 50.9449.68 50.25 48.97 47.77 50.52 52.75 51.22 45.70 48.4151.62 51.28 50.44 49.37 52.04 49.87 51.29 46.13 48.79
48.67 47.38 47.51 45.85 49.14 47.23 46.75 41.07 44.9345.95 44.09 43.93 42.66 45.67 46.50 46.36 38.79 42.4739.38 39.09 37.60 35.34 40.24 41.83 42.06 33.47 37.2633.20 31.40 30.47 29.45 33.36 34.12 32.40 27.55 30.3832.50 31.83 31.25 29.07 32.13 29.50 39.99 26.37 28.9437.51 36.41 36.04 33.41 38.87 32.83 36.71 30.34 33.0340.48 39.63 38.53 37.83 41.51 37.95 39.14 34.28 36.99
c 45.21 45.34 43.25 46.84 42.00 43.97 38.87 39.8548.44 47.31 47.27 44.20 49.27 46.31 49.01 43.09 45.2045.71 45.04 44.35 42.49 46.13 47.27 46.84 41.95 43.9745.28 44.84 44.76 41.17 45.96 44.92 44.45 40.23 42.6646.82 45.55 44.72 42.87 47.73 45.68 46.56 40.26 43.2948.08 47.85 48.26 45.22 49.17 45.69 48.63 43.38 45.4446.11 45.42 43.78 43.48 45.89 49.56 47.77 42.15 44.6052.47 51.73 50.55 48.66 53.23 47.68 50.08 45.28 47.9554.78 54.24 53.23 52.01 55.41 54.25 54.18 46.90 51.0055.00 54.41 53.58 50.82 55.56 55.64 55.39 48.18 51.7352.07 51.25 50.46 50.30 52.74 55.68 54.01 46.55 50.1352.09 52.13 51.37 49.38 52.39 53.66 52.80 46.21 49.7549.29 50.45 49.84 47.87 51.04 53.49 50.84 46.82 48.9947.89 47.81 46.08 45.98 47.93 50.85 50.09 44.00 46.4348.28 47.91 47.18 46.48 48.58 48.00 48.69 44.45 46.4451.34 51.32 50.28 48.59 51.95 49.45 51.25 46.09 48.5655.59 54.89 54.01 53.27 56.10 52.35 54.09 48.15 51.6658.27 56.94 56.52 54.87 58.04 55.85 57.26 50.14 53.82
1.2. Volume‐weighted average cost for France, Germany, Italy, Spain, UK, Japan, Canada and USA.
Jun‐17Jul‐17Aug‐17Sep‐17Oct‐17
Average cost, cif basis, reported in US dollars.
Dec‐16Jan‐17Feb‐17Mar‐17Apr‐17May‐17
Jun‐16Jul‐16Aug‐16Sep‐16Oct‐16Nov‐16
Dec‐15Jan‐16Feb‐16Mar‐16Apr‐16May‐16
4Q2016 1Q2017 2Q2017 3Q2017
Oct‐15Nov‐15
2Q2015 3Q2015 4Q2015 1Q2016 2Q2016 3Q2016
201420152016
3Q2014 4Q2014 1Q2015
200820092010201120122013
200220032004200520062007
Table 1: IEA crude oil import costs1
19971998199920002001
© OECD/IEA, 2018 6 International Energy Agency
Monthly oil price statisticsDate of publication: 19 January 2018
National currencies 1
Ex‐tax Total Ex‐taxNov‐17 Dec‐16 price Nov‐17 Dec‐16 price Nov‐17 Dec‐16 price Nov‐17 Dec‐16
1.404 0.1 3.8 0.511 0.2 6.7 1.661 0.8 16.6 0.605 1.0 19.8 France
1.357 ‐0.7 ‐1.0 0.486 ‐ 1.6 ‐2.2 1.605 0.0 11.1 0.575 ‐0.9 9.8 Germany
1.547 0.3 3.3 0.540 0.7 8.0 1.830 1.1 15.9 0.639 1.5 21.2 Italy
1.237 0.2 2.7 0.561 0.4 5.1 1.463 1.0 15.2 0.664 1.1 17.9 Spain
1.200 0.7 4.8 0.420 1.7 12.3 1.608 2.0 12.6 0.563 3.1 20.7 UK
141.5 1.8 10.3 74.7 3.2 19.5 1.253 1.8 13.3 0.661 3.1 22.8 Japan
1.197 ‐2.9 10.3 0.803 ‐ 4.1 15.4 0.937 ‐3.0 15.4 0.629 ‐4.1 20.7 Canada
0.654 ‐3.4 9.7 0.532 ‐ 4.1 11.5 0.654 ‐3.4 9.7 0.532 ‐4.1 11.5 USA
1.278 0.5 7.8 0.518 1.0 8.6 1.512 1.2 21.0 0.613 1.7 21.9 France1.182 0.6 ‐0.1 0.523 1.2 ‐0.2 1.398 1.4 12.2 0.619 1.9 12.0 Germany
1.418 0.4 4.7 0.545 0.9 10.5 1.678 1.2 17.6 0.645 1.7 24.1 Italy
1.136 0.4 3.9 0.572 0.7 6.9 1.344 1.2 16.7 0.677 1.5 20.0 Spain
1.236 0.6 4.7 0.450 1.4 11.7 1.656 1.9 12.6 0.603 2.7 20.0 UK
119.5 2.1 11.1 78.4 3.0 16.3 1.058 2.1 14.1 0.694 3.0 19.5 Japan3
1.216 1.1 14.2 0.906 1.3 18.9 0.952 1.0 19.4 0.710 1.3 24.3 Canada3
0.769 0.1 16.0 0.629 0.2 19.6 0.769 0.1 16.0 0.629 0.2 19.6 USA
0.794 1.8 9.3 0.542 2.2 6.6 0.939 2.6 22.7 0.642 3.0 19.7 France
0.650 1.0 6.3 0.485 1.2 7.2 0.769 1.8 19.4 0.573 1.9 20.3 Germany
1.208 0.8 2.4 0.587 1.4 4.1 1.429 1.6 15.0 0.694 2.1 16.9 Italy
0.688 2.0 7.2 0.479 2.3 8.7 0.814 2.8 20.4 0.567 3.1 22.0 Spain
0.529 ‐1.9 3.8 0.393 ‐2.4 4.9 0.709 ‐0.5 11.5 0.526 ‐1.1 12.7 UK
82.889 4.2 16.3 74.209 4.3 16.9 0.734 4.1 19.5 0.657 4.3 20.2 Japan4
1.071 2.1 10.9 0.959 2.2 11.7 0.839 2.1 16.0 0.751 2.2 16.8 Canada
.. .. .. .. .. .. .. .. .. .. .. .. USA
0.470 ‐1.8 9.4 0.375 ‐2.3 3.8 0.556 ‐1.1 22.8 0.443 ‐1.5 16.5 France
.. .. .. .. .. .. .. .. .. .. .. .. Germany
0.397 ‐2.1 3.5 0.365 ‐2.3 3.8 0.469 ‐1.4 16.2 0.432 ‐1.6 16.5 Italy
0.367 ‐1.6 6.4 0.351 ‐1.6 6.8 0.434 ‐0.8 19.5 0.415 ‐0.9 19.8 Spain
.. .. .. .. .. .. .. .. .. .. .. .. UK
.. .. .. .. .. .. .. .. .. .. .. .. Japan
.. .. .. .. .. .. .. .. .. .. .. .. Canada
.. .. .. .. .. .. .. .. .. .. .. .. USA
1. Euros for France, Germany, Italy and Spain; pounds for UK; yen for Japan; Canadian dollars for Canada; US dollars for USA.
2. Unleaded premium (95 RON) for France, Germany, Italy, Spain, UK; regular unleaded for Canada, Japan and the United States.
3. Automotive diesel for non‐commercial use.
4. Kerosene for Japan.
5. VAT excluded from prices for France, Italy, Spain and UK as it is refunded to industry.
See Tables 3 and 4 for a historical comparison of end‐use prices and taxes.
Spain
UK
Japan
Canada
USA
USA
Low sulphur fuel oil for industry5 (per kg)
France
Germany
Italy
Germany
Italy
Spain
UK
Japan4
Canada
Japan
Canada USA
Domestic heating oil (per litre)
France
France Germany
Italy
Spain
UK
Spain
UK
Japan
Canada
USA
Diesel3 (per litre)
price
Gasoline2 (per litre)
France
Germany
Italy
Table 2: IEA end‐use total and ex‐tax prices for selected oil products
December 2017US dollars
Total % change from % change from % change from % change from
© OECD/IEA, 2018 7 International Energy Agency

Monthly oil price statisticsDate of publication: 19 January 2018
National currencies 1
Jan17 Feb17 Mar17 Apr17 May17 Jun17 Jul17 Aug17 Sep17 Oct17 Nov17 Dec17
Gasoline2 (per litre)
France 1.408 1.415 1.392 1.396 1.375 1.349 1.321 1.338 1.364 1.358 1.403 1.404
Germany 1.398 1.407 1.373 1.398 1.378 1.360 1.347 1.357 1.386 1.370 1.367 1.357
Italy 1.543 1.551 1.543 1.543 1.535 1.505 1.490 1.498 1.519 1.524 1.542 1.547
Spain 1.241 1.250 1.229 1.239 1.218 1.188 1.174 1.189 1.210 1.205 1.234 1.237
UK 1.187 1.202 1.193 1.175 1.165 1.153 1.139 1.158 1.183 1.172 1.192 1.200
Japan 130.9 130.8 133.3 133.9 132.6 131.2 130.7 131.3 131.7 135.1 139.0 141.5
Canada 1.135 1.087 1.094 1.178 1.139 1.092 1.095 1.128 1.184 1.157 1.233 1.197
USA 0.621 0.609 0.614 0.639 0.632 0.620 0.608 0.629 0.699 0.662 0.677 0.654
Diesel3 (per litre)
France 1.259 1.266 1.248 1.240 1.216 1.186 1.172 1.198 1.214 1.243 1.272 1.278
Germany 1.201 1.197 1.176 1.179 1.155 1.127 1.126 1.138 1.164 1.183 1.175 1.182
Italy 1.397 1.401 1.396 1.397 1.385 1.357 1.337 1.353 1.369 1.386 1.412 1.418
Spain 1.128 1.129 1.114 1.111 1.090 1.058 1.050 1.071 1.085 1.107 1.131 1.136
UK 1.218 1.232 1.222 1.204 1.188 1.174 1.157 1.176 1.201 1.206 1.229 1.236
Japan 110.2 110.2 111.9 112.3 111.4 110.4 109.9 110.2 110.5 113.4 117.0 119.5
Canada 1.107 1.094 1.088 1.090 1.072 1.050 1.028 1.051 1.091 1.120 1.203 1.216
USA 0.682 0.679 0.675 0.682 0.676 0.663 0.659 0.686 0.736 0.738 0.768 0.769
Domestic heating oil (per litre)
France 0.784 0.784 0.757 0.745 0.721 0.686 0.680 0.693 0.720 0.747 0.779 0.794
Germany 0.630 0.632 0.614 0.617 0.587 0.560 0.562 0.570 0.592 0.617 0.643 0.650
Italy 1.205 1.211 1.186 1.180 1.152 1.115 1.122 1.126 1.153 1.164 1.198 1.208
Spain 0.716 0.701 0.674 0.665 0.652 0.606 0.595 0.615 0.628 0.641 0.674 0.688
UK 0.521 0.521 0.498 0.500 0.479 0.455 0.472 0.488 0.510 0.518 0.539 0.529
Japan4 76.333 76.611 76.222 75.833 75.444 74.889 74.444 74.389 74.444 76.111 79.556 82.889
Canada 0.939 0.984 0.966 0.953 0.952 0.930 0.899 0.926 0.962 0.972 1.049 1.071
USA 0.656 0.654 0.647 0.644 0.628 0.603 0.585 0.606 0.655 0.666 0.696 ..
Low sulphur fuel oil for industry5 (per kg)
France 0.483 0.476 0.453 0.457 0.444 0.431 0.424 0.427 0.437 0.451 0.479 0.470
Germany .. .. .. .. .. .. .. .. .. .. .. ..
Italy 0.411 0.404 0.381 0.391 0.378 0.358 0.352 0.352 0.363 0.379 0.405 0.397
Spain 0.396 0.390 0.375 0.367 0.361 0.354 0.340 0.344 0.338 0.355 0.373 0.367
UK .. .. .. .. .. .. .. .. .. .. .. ..
Japan 62.424 63.180 64.152 63.828 63.180 62.100 61.884 62.100 62.964 65.880 69.660 ..
Canada .. .. .. .. .. .. .. .. .. .. .. ..
USA6 0.411 0.406 0.390 0.378 0.381 0.376 0.381 0.378 0.413 0.410 .. ..
1.
2.
3.
4.
5.
6.
VAT excluded from prices for France, Italy, Spain and UK as it is refunded to industry.
Data for May 2015 onwards have been estimated by IEA based on residual fuel oil prices.
Table 3: IEA end‐use prices for selected oil products
Euros for France, Germany, Italy and Spain; pounds for UK; yen for Japan; Canadian dollars for Canada; US dollars for USA. Unleaded premium (95 RON) for France, Germany, Italy, Spain, UK; regular unleaded for Canada, Japan and the United States.
Automotive diesel for non‐commercial use.
Kerosene for Japan.
© OECD/IEA, 2018 8 International Energy Agency
Monthly oil price statisticsDate of publication: 19 January 2018
National currencies 1
Jan17 Feb17 Mar17 Apr17 May17 Jun17 Jul17 Aug17 Sep17 Oct17 Nov17 Dec17
Gasoline2 (per litre)
France 0.892 0.895 0.891 0.892 0.888 0.884 0.879 0.882 0.886 0.885 0.893 0.893
Germany 0.877 0.880 0.874 0.878 0.875 0.872 0.870 0.872 0.876 0.874 0.873 0.871
Italy 1.006 1.008 1.006 1.006 1.005 0.999 0.997 0.998 1.002 1.003 1.006 1.007
Spain 0.676 0.678 0.674 0.676 0.672 0.667 0.665 0.667 0.671 0.670 0.675 0.676
UK 0.778 0.780 0.779 0.776 0.774 0.772 0.770 0.773 0.777 0.774 0.779 0.780
Japan 66.0 66.0 66.2 66.2 66.1 66.0 66.0 66.0 66.1 66.3 66.6 66.8
Canada 0.391 0.389 0.389 0.393 0.391 0.389 0.389 0.391 0.393 0.392 0.396 0.394
USA30.121 0.121 0.121 0.121 0.121 0.121 0.122 0.122 0.122 0.122 0.122 0.122
Diesel4 (per litre)France 0.750 0.758 0.755 0.754 0.750 0.745 0.742 0.747 0.749 0.754 0.759 0.760
Germany 0.662 0.661 0.658 0.658 0.654 0.650 0.650 0.652 0.656 0.659 0.658 0.659
Italy 0.869 0.870 0.869 0.869 0.867 0.862 0.858 0.861 0.864 0.867 0.872 0.873
Spain 0.563 0.563 0.560 0.560 0.556 0.551 0.549 0.553 0.555 0.559 0.563 0.564
UK 0.782 0.785 0.784 0.781 0.778 0.776 0.773 0.776 0.780 0.781 0.785 0.786
Japan 40.4 40.4 40.5 40.5 40.5 40.4 40.4 40.4 40.4 40.6 40.9 41.1
Canada 0.305 0.304 0.304 0.304 0.303 0.302 0.301 0.302 0.304 0.305 0.309 0.310
USA30.138 0.138 0.138 0.138 0.138 0.138 0.140 0.140 0.140 0.140 0.140 0.140
Domestic heating oil (per litre)France 0.245 0.250 0.245 0.243 0.239 0.233 0.232 0.234 0.239 0.243 0.249 0.251
Germany 0.162 0.162 0.159 0.160 0.155 0.151 0.151 0.152 0.156 0.160 0.164 0.165
Italy 0.620 0.622 0.617 0.616 0.611 0.604 0.606 0.606 0.611 0.613 0.619 0.621
Spain 0.213 0.211 0.206 0.205 0.203 0.195 0.192 0.196 0.198 0.201 0.206 0.208
UK 0.136 0.136 0.135 0.135 0.134 0.133 0.134 0.135 0.136 0.136 0.137 0.137
Japan5 8.194 8.215 8.186 8.157 8.128 8.087 8.054 8.050 8.054 8.178 8.433 8.680
Canada 0.106 0.108 0.107 0.106 0.106 0.105 0.104 0.105 0.107 0.107 0.111 0.112
USA .. .. .. .. .. .. .. .. .. .. .. ..
Low sulphur fuel oil for industry6 (per kg)France 0.090 0.095 0.095 0.095 0.095 0.095 0.095 0.095 0.095 0.095 0.095 0.095
Germany .. .. .. .. .. .. .. .. .. .. .. ..
Italy 0.031 0.031 0.031 0.031 0.031 0.031 0.031 0.031 0.031 0.031 0.031 0.031
Spain 0.017 0.017 0.017 0.017 0.017 0.017 0.016 0.017 0.017 0.016 0.017 0.017
UK .. .. .. .. .. .. .. .. .. .. .. ..
Japan 4.624 4.680 4.752 4.728 4.680 4.600 4.584 4.600 4.664 4.880 5.160 ..
Canada .. .. .. .. .. .. .. .. .. .. .. ..
USA .. .. .. .. .. .. .. .. .. .. .. ..
1.
2.
3.4.
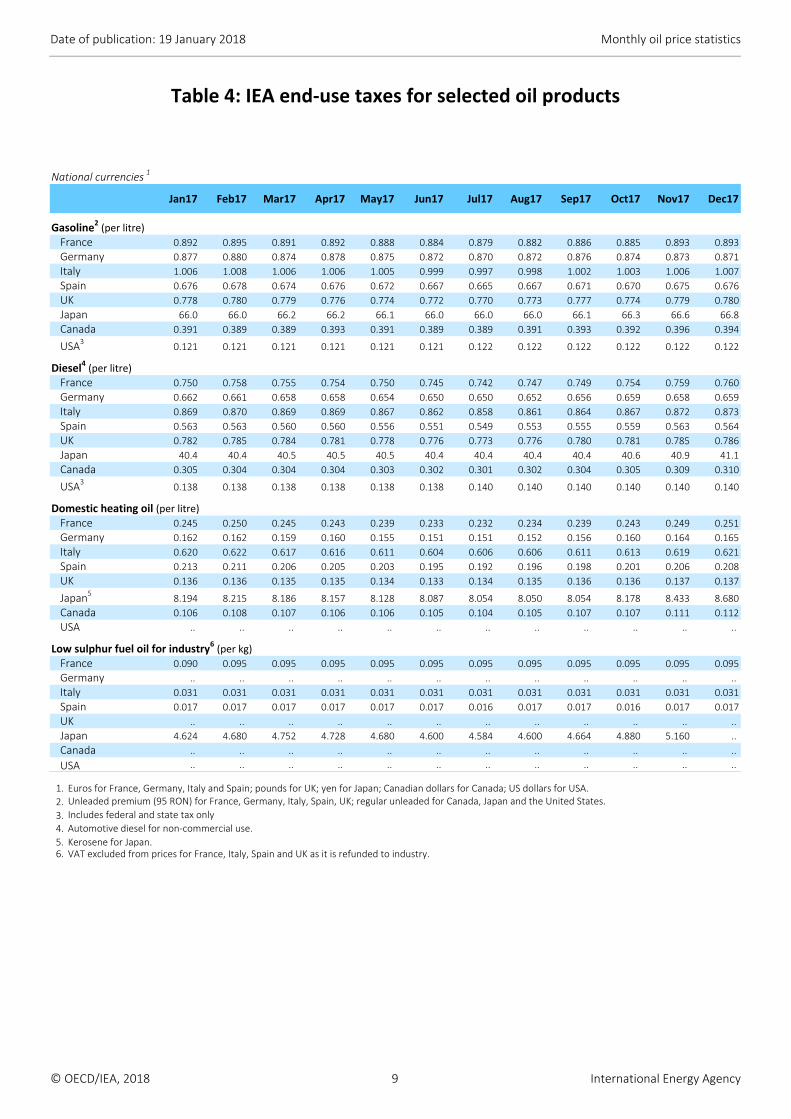
5. Kerosene for Japan. 6. VAT excluded from prices for France, Italy, Spain and UK as it is refunded to industry.
Table 4: IEA end‐use taxes for selected oil products
Euros for France, Germany, Italy and Spain; pounds for UK; yen for Japan; Canadian dollars for Canada; US dollars for USA. Unleaded premium (95 RON) for France, Germany, Italy, Spain, UK; regular unleaded for Canada, Japan and the United States.
Includes federal and state tax only
Automotive diesel for non‐commercial use.
© OECD/IEA, 2018 9 International Energy Agency

Page
Contacts:Energy Data Centre Prices and Taxes Statistics9, rue de la Fédération75739 PARIS Cedex 15France +33 (0)1 40 57 66 26 [email protected]
Media Enquiries:IEA Press Office +33 (0)1 40 57 65 54 [email protected]
This document can be downloaded free of charge at:http://www.iea.org/statistics/topics/pricesandtaxes/(also available in Excel format)The publication schedule can be downloaded at:http://www.iea.org/media/statistics/Schedule_monthly.pdf
Overall responsibilityRoberta Quadrelli
StatisticsMariano BerkenwaldElvira Sumalinog